what we eat in america, nhanes 2013-2014
TRANSCRIPT

DATA SOURCE: What We Eat in America, NHANES 2013-2014, individuals 2 years and over (excluding breast-fed children), day 1. Available: www.ars.usda.gov/nea/bhnrc/fsrg.Page 1 of 9
What We Eat in America, NHANES 2013-2014
Table 1. Nutrient Intakes from Food and Beverages: Mean Amounts Consumed per Individual,by Gender and Age, in the United States, 2013-2014
Genderand age
Samplesize Energy Protein
Carbo-hydrate
Totalsugars
Dietaryfiber
Totalfat
Saturatedfat
Mono-unsaturated
fat
Poly-unsaturated
fat
(years) kcal (SE) g (SE) g (SE) g (SE) g (SE) g (SE) g (SE) g (SE) g (SE)
Males:2 - 5.............. 337 1571 (35.2) 55.8 (2.36) 217 (5.2) 104 (3.1) 12.4 (0.48) 55.7 (1.27) 20.1 (0.57) 18.3 (0.40) 12.0 (0.38)6 - 11.............. 537 2036 (46.2) 72.9 (2.13) 270 (4.7) 126 (2.8) 15.0 (0.70) 76.2 (2.54) 28.5 (1.29) 25.1 (0.83) 15.4 (0.59)
12 - 19.............. 646 2376 (38.2) 95.5 (3.51) 298 (7.9) 139 (4.8) 16.4 (0.43) 90.5 (1.59) 30.5 (0.82) 30.9 (0.83) 20.1 (0.79)
20 - 29.............. 424 2704 (62.5) 110.8 (3.32) 310 (10.3) 141 (7.5) 17.7 (0.80) 103.9 (2.86) 34.3 (1.16) 35.8 (1.01) 23.8 (0.90)30 - 39.............. 429 2622 (68.0) 102.0 (2.03) 310 (9.8) 138 (6.6) 19.1 (0.53) 97.7 (2.18) 31.3 (0.91) 34.2 (0.70) 22.4 (0.73)40 - 49.............. 410 2520 (45.3) 101.9 (2.65) 294 (9.1) 129 (6.7) 19.0 (0.70) 94.1 (2.60) 30.8 (1.19) 32.5 (0.92) 21.5 (0.74)
50 - 59.............. 398 2493 (77.7) 96.7 (1.98) 286 (8.1) 119 (4.5) 19.5 (0.91) 96.3 (3.67) 31.1 (1.06) 34.6 (1.46) 21.6 (1.07)60 - 69.............. 395 2253 (51.7) 86.9 (2.11) 258 (8.0) 106 (4.3) 18.9 (0.91) 89.4 (2.83) 28.7 (1.15) 31.3 (0.97) 21.5 (1.07)70 and over...... 358 2022 (63.3) 80.8 (2.00) 237 (9.3) 102 (5.3) 18.9 (1.09) 80.9 (2.95) 26.6 (1.10) 28.2 (1.05) 18.8 (0.94)
2 - 19............ 1520 2101 (26.4) 79.9 (1.96) 273 (3.8) 128 (2.7) 15.1 (0.28) 78.8 (1.54) 27.8 (0.65) 26.4 (0.64) 16.9 (0.54)20 and over... 2414 2477 (26.1) 98.3 (1.25) 287 (3.2) 125 (2.5) 18.8 (0.40) 95.0 (1.31) 30.9 (0.47) 33.2 (0.43) 21.9 (0.45)
2 and over... 3934 2382 (21.0) 93.6 (1.18) 283 (2.8) 126 (2.3) 17.9 (0.26) 90.9 (1.02) 30.1 (0.36) 31.5 (0.39) 20.6 (0.35)
Females:2 - 5.............. 339 1395 (36.9) 50.3 (1.67) 186 (4.7) 90 (3.2) 10.8 (0.42) 51.9 (1.87) 18.8 (0.78) 16.9 (0.64) 11.3 (0.46)6 - 11.............. 510 1786 (30.4) 61.2 (1.14) 239 (5.9) 107 (3.1) 13.9 (0.51) 67.7 (1.22) 23.6 (0.52) 22.4 (0.42) 15.4 (0.32)
12 - 19.............. 650 1689 (48.0) 61.9 (2.16) 220 (5.1) 99 (2.5) 12.5 (0.61) 64.2 (2.68) 21.3 (0.92) 21.3 (0.98) 15.5 (0.83)
20 - 29.............. 430 1933 (61.9) 70.2 (1.95) 237 (7.8) 111 (4.3) 14.3 (0.40) 73.7 (2.85) 24.3 (1.07) 24.9 (1.07) 17.4 (0.66)30 - 39.............. 463 1986 (33.0) 76.5 (2.25) 243 (4.9) 111 (3.0) 16.5 (0.48) 76.5 (1.89) 24.6 (0.68) 26.4 (0.71) 18.2 (0.68)40 - 49.............. 487 1873 (36.3) 72.3 (1.25) 224 (5.3) 99 (3.8) 15.9 (0.36) 73.7 (1.66) 23.6 (0.66) 25.6 (0.70) 17.6 (0.40)
50 - 59.............. 439 1779 (38.2) 69.7 (0.88) 210 (6.9) 93 (4.2) 15.3 (0.74) 70.6 (1.91) 22.1 (0.64) 24.3 (0.78) 17.4 (0.66)60 - 69.............. 433 1712 (55.5) 67.6 (2.26) 201 (6.7) 85 (3.7) 15.2 (0.56) 69.1 (2.73) 21.7 (0.76) 24.3 (1.20) 16.9 (0.76)70 and over...... 381 1604 (37.9) 60.0 (1.50) 201 (5.8) 92 (3.0) 15.2 (0.45) 62.9 (1.64) 20.3 (0.75) 21.6 (0.59) 15.3 (0.35)
2 - 19............ 1499 1657 (22.7) 59.2 (1.13) 219 (2.9) 100 (1.8) 12.6 (0.28) 62.7 (1.25) 21.5 (0.43) 20.7 (0.50) 14.6 (0.41)20 and over... 2633 1825 (18.1) 69.8 (0.79) 220 (3.0) 99 (1.7) 15.4 (0.28) 71.5 (0.70) 22.9 (0.24) 24.7 (0.30) 17.2 (0.23)
2 and over... 4132 1786 (16.4) 67.4 (0.74) 220 (2.6) 99 (1.5) 14.8 (0.25) 69.4 (0.66) 22.6 (0.23) 23.7 (0.27) 16.6 (0.18)
Males and females:2 - 19............ 3019 1885 (21.1) 69.8 (1.16) 246 (2.8) 114 (1.7) 13.9 (0.19) 70.9 (1.19) 24.7 (0.43) 23.6 (0.48) 15.8 (0.41)20 and over... 5047 2141 (18.7) 83.6 (0.73) 253 (2.1) 111 (1.4) 17.1 (0.27) 82.9 (0.89) 26.7 (0.27) 28.8 (0.31) 19.5 (0.31)
2 and over... 8066 2079 (17.2) 80.3 (0.74) 251 (2.1) 112 (1.3) 16.3 (0.21) 80.0 (0.79) 26.3 (0.24) 27.6 (0.30) 18.6 (0.26)

DATA SOURCE: What We Eat in America, NHANES 2013-2014, individuals 2 years and over (excluding breast-fed children), day 1. Available: www.ars.usda.gov/nea/bhnrc/fsrg.Page 2 of 9
What We Eat in America, NHANES 2013-2014
Table 1. Nutrient Intakes from Food and Beverages: Mean Amounts Consumed per Individual,by Gender and Age, in the United States, 2013-2014 (continued)
Genderand age
Choles-terol Retinol
Vitamin A(RAE)
Alpha-carotene
Beta-carotene
Beta-crypto-xanthin Lycopene
Lutein +zeaxanthin Thiamin
(years) mg (SE) µg (SE) µg (SE) µg (SE) µg (SE) µg (SE) µg (SE) µg (SE) mg (SE)
Males:2 - 5.............. 180 (10.1) 443 (18.6) 566 (32.5) 332*(108.2) 1279 (236.4) 71 (8.0) 3370 (528.2) 592 (42.9) 1.33 (0.040)6 - 11.............. 234 (10.6) 576 (27.1) 711 (33.8) 302 (48.8) 1443 (172.2) 76 (7.7) 4197 (369.4) 872 (154.7) 1.68 (0.051)
12 - 19.............. 315 (14.7) 529 (23.7) 648 (25.1) 293 (58.1) 1253 (132.7) 73 (7.6) 5392 (408.2) 937 (72.7) 1.99 (0.085)
20 - 29.............. 377 (15.4) 551 (41.1) 739 (50.2) 300 (39.0) 2082 (337.2) 68 (7.6) 5551 (367.7) 1616 (304.8) 2.00 (0.068)30 - 39.............. 353 (13.5) 460 (31.6) 678 (33.2) 461 (48.2) 2355 (188.9) 70 (5.0) 5888 (624.7) 1506 (228.1) 1.92 (0.054)40 - 49.............. 362 (16.0) 452 (18.4) 655 (26.6) 451 (86.8) 2188 (259.7) 64 (5.8) 5705 (595.7) 1500 (168.8) 1.86 (0.058)
50 - 59.............. 352 (16.1) 475 (21.9) 672 (27.2) 376 (53.7) 2148 (219.3) 88 (12.0) 5407 (602.1) 1706 (195.3) 1.85 (0.031)60 - 69.............. 304 (13.6) 453 (16.9) 660 (35.8) 375 (56.0) 2257 (290.2) 92 (12.7) 6931 (869.7) 1492 (226.2) 1.78 (0.065)70 and over...... 313 (18.7) 544 (53.1) 759 (49.6) 426 (48.2) 2344 (239.9) 79 (8.1) 5606 (281.2) 1614 (189.5) 1.72 (0.066)
2 - 19............ 260 (7.6) 529 (14.2) 654 (18.9) 304 (40.2) 1325 (105.7) 73 (5.5) 4581 (254.6) 848 (77.5) 1.75 (0.040)20 and over... 348 (7.7) 488 (11.9) 691 (15.3) 394 (26.5) 2216 (90.0) 76 (3.2) 5817 (304.6) 1575 (108.0) 1.87 (0.025)
2 and over... 325 (6.5) 498 (9.5) 682 (12.6) 371 (20.3) 1991 (70.3) 76 (2.9) 5505 (236.4) 1391 (80.0) 1.84 (0.021)
Females:2 - 5.............. 167 (11.3) 438 (22.2) 532 (25.2) 213 (35.6) 1008 (80.4) 56 (9.5) 2627 (298.8) 589 (51.7) 1.17 (0.032)6 - 11.............. 195 (7.5) 478 (22.1) 586 (26.9) 240 (32.4) 1143 (122.8) 74 (9.0) 3965 (543.5) 957 (163.4) 1.51 (0.052)
12 - 19.............. 188 (8.1) 367 (17.3) 507 (36.1) 306* (94.3) 1501 (288.1) 62 (9.1) 3894 (257.2) 981 (168.5) 1.35 (0.037)
20 - 29.............. 251 (10.6) 377 (19.4) 536 (33.5) 310 (65.1) 1735 (246.1) 66 (8.7) 3913 (296.2) 1329 (143.3) 1.40 (0.043)30 - 39.............. 260 (12.4) 346 (13.1) 570 (42.5) 303 (64.4) 2514 (473.6) 74 (8.4) 4674 (456.8) 2097 (497.0) 1.50 (0.047)40 - 49.............. 242 (9.0) 342 (9.8) 570 (31.5) 506 (89.1) 2441 (290.5) 102 (18.6) 4685 (373.0) 1760 (134.3) 1.38 (0.036)
50 - 59.............. 246 (10.2) 377 (20.3) 597 (20.7) 465 (53.1) 2388 (225.2) 78 (11.8) 4079 (334.8) 2133 (365.3) 1.39 (0.074)60 - 69.............. 233 (10.0) 372 (17.2) 607 (25.6) 401 (62.8) 2573 (278.4) 120 (32.1) 4241 (584.8) 1681 (163.2) 1.34 (0.035)70 and over...... 210 (9.4) 437 (33.2) 654 (42.3) 420 (62.5) 2355 (295.1) 100 (11.8) 4010 (433.7) 1485 (112.9) 1.31 (0.035)
2 - 19............ 186 (5.3) 418 (12.9) 538 (19.7) 265 (46.3) 1280 (139.0) 64 (4.3) 3645 (265.0) 889 (92.1) 1.36 (0.021)20 and over... 242 (3.1) 372 (8.2) 586 (17.6) 402 (34.7) 2324 (155.8) 89 (5.7) 4271 (171.3) 1762 (110.8) 1.39 (0.021)
2 and over... 229 (2.6) 383 (7.5) 575 (16.0) 370 (31.1) 2083 (139.3) 83 (4.5) 4126 (160.9) 1561 (96.9) 1.38 (0.019)
Males and females:2 - 19............ 224 (5.3) 475 (10.3) 598 (14.6) 285 (37.1) 1303 (97.0) 69 (4.1) 4126 (210.2) 868 (50.8) 1.56 (0.027)20 and over... 293 (4.2) 428 (8.1) 637 (12.2) 398 (25.9) 2271 (89.2) 83 (3.1) 5021 (136.4) 1671 (74.3) 1.62 (0.018)
2 and over... 276 (3.7) 440 (6.8) 627 (11.5) 371 (22.8) 2037 (80.3) 79 (2.8) 4805 (121.3) 1477 (57.3) 1.61 (0.018)

DATA SOURCE: What We Eat in America, NHANES 2013-2014, individuals 2 years and over (excluding breast-fed children), day 1. Available: www.ars.usda.gov/nea/bhnrc/fsrg.Page 3 of 9
What We Eat in America, NHANES 2013-2014
Table 1. Nutrient Intakes from Food and Beverages: Mean Amounts Consumed per Individual,by Gender and Age, in the United States, 2013-2014 (continued)
Genderand age
Ribo-flavin Niacin Vitamin B6
Folicacid
Foodfolate
Folate(DFE) Choline Vitamin B12
AddedVitamin B12
(years) mg (SE) mg (SE) mg (SE) µg (SE) µg (SE) µg (SE) mg (SE) µg (SE) µg (SE)
Males:2 - 5.............. 1.74 (0.062) 16.4 (0.56) 1.43 (0.056) 175 (9.7) 139 (8.2) 436 (20.1) 217 (9.5) 3.93 (0.230) 0.90 (0.078)6 - 11.............. 2.14 (0.057) 22.0 (0.71) 1.84 (0.052) 222 (12.0) 162 (6.1) 538 (23.1) 267 (6.5) 5.11 (0.160) 1.17 (0.061)
12 - 19.............. 2.53 (0.101) 31.5 (1.22) 2.53 (0.116) 250 (19.5) 195 (4.4) 620 (34.8) 347 (10.2) 6.50 (0.308) 2.00 (0.289)
20 - 29.............. 2.81 (0.153) 35.8 (1.43) 2.91 (0.172) 232 (17.3) 262 (11.2) 656 (31.7) 426 (11.9) 7.28 (0.520) 1.92 (0.352)30 - 39.............. 2.58 (0.103) 36.0 (1.58) 3.24 (0.257) 215 (9.8) 255 (10.0) 620 (19.6) 402 (9.3) 6.77 (0.484) 2.14 (0.401)40 - 49.............. 2.53 (0.056) 32.0 (0.90) 2.61 (0.090) 182 (12.9) 254 (7.2) 563 (20.9) 423 (15.3) 5.69 (0.227) 0.99 (0.192)
50 - 59.............. 2.54 (0.070) 30.1 (0.56) 2.49 (0.064) 212 (11.2) 254 (11.9) 615 (19.4) 416 (15.4) 5.58 (0.292) 1.18 (0.203)60 - 69.............. 2.32 (0.067) 27.9 (0.53) 2.21 (0.068) 185 (11.3) 230 (7.2) 545 (21.7) 359 (8.8) 4.70 (0.257) 0.94 (0.105)70 and over...... 2.29 (0.088) 25.4 (0.56) 2.27 (0.083) 205 (17.3) 227 (14.8) 576 (36.4) 358 (14.5) 5.40 (0.333) 1.35 (0.217)
2 - 19............ 2.24 (0.053) 25.2 (0.66) 2.07 (0.056) 225 (10.1) 173 (3.5) 555 (18.2) 294 (5.7) 5.51 (0.185) 1.50 (0.159)20 and over... 2.54 (0.041) 31.8 (0.42) 2.66 (0.047) 207 (5.4) 249 (4.0) 601 (10.6) 402 (6.1) 6.01 (0.142) 1.45 (0.089)
2 and over... 2.47 (0.040) 30.2 (0.41) 2.51 (0.044) 211 (4.9) 230 (3.2) 589 (8.9) 375 (5.6) 5.88 (0.128) 1.46 (0.097)
Females:2 - 5.............. 1.68 (0.067) 14.8 (0.45) 1.32 (0.063) 170 (11.1) 119 (4.3) 409 (17.1) 201 (8.7) 3.82 (0.177) 0.93 (0.099)6 - 11.............. 1.83 (0.045) 20.0 (0.46) 1.59 (0.047) 203 (12.8) 148 (4.5) 493 (24.0) 224 (5.6) 4.29 (0.157) 1.25 (0.099)
12 - 19.............. 1.70 (0.088) 20.5 (0.78) 1.60 (0.071) 187 (12.8) 149 (6.5) 467 (22.7) 216 (6.4) 3.90 (0.139) 1.06 (0.124)
20 - 29.............. 1.73 (0.058) 22.3 (0.54) 1.91 (0.078) 170 (14.0) 181 (4.2) 471 (24.5) 275 (10.2) 4.23 (0.150) 1.07 (0.086)30 - 39.............. 1.92 (0.073) 23.2 (0.76) 1.84 (0.064) 154 (4.3) 223 (9.6) 485 (10.5) 296 (11.6) 4.02 (0.210) 0.62 (0.083)40 - 49.............. 1.85 (0.052) 21.6 (0.56) 1.71 (0.062) 141 (7.7) 210 (4.7) 449 (15.7) 281 (9.0) 3.83 (0.241) 0.56 (0.077)
50 - 59.............. 1.89 (0.063) 21.6 (0.59) 1.80 (0.059) 152 (13.6) 198 (9.5) 456 (25.5) 281 (7.2) 3.73 (0.183) 0.82 (0.128)60 - 69.............. 1.80 (0.059) 20.4 (0.80) 1.61 (0.049) 144 (6.9) 195 (8.2) 440 (15.3) 277 (10.1) 4.12 (0.286) 0.63 (0.084)70 and over...... 1.79 (0.058) 18.4 (0.53) 1.66 (0.043) 156 (8.0) 186 (6.2) 451 (16.4) 256 (7.3) 3.81 (0.203) 0.93 (0.111)
2 - 19............ 1.74 (0.051) 19.1 (0.38) 1.54 (0.044) 188 (8.4) 142 (3.2) 463 (14.0) 216 (4.2) 4.01 (0.108) 1.09 (0.063)20 and over... 1.83 (0.024) 21.4 (0.24) 1.76 (0.016) 153 (4.1) 199 (4.2) 459 (8.3) 278 (3.4) 3.96 (0.089) 0.77 (0.036)
2 and over... 1.81 (0.023) 20.9 (0.20) 1.71 (0.015) 161 (3.7) 186 (3.8) 460 (7.1) 264 (2.9) 3.97 (0.076) 0.84 (0.031)
Males and females:2 - 19............ 2.00 (0.040) 22.2 (0.45) 1.81 (0.039) 207 (7.2) 158 (2.1) 510 (12.7) 256 (3.8) 4.78 (0.104) 1.30 (0.097)20 and over... 2.18 (0.028) 26.5 (0.24) 2.20 (0.030) 179 (4.3) 224 (3.1) 528 (8.7) 339 (3.9) 4.95 (0.075) 1.10 (0.050)
2 and over... 2.13 (0.029) 25.4 (0.24) 2.11 (0.028) 186 (4.1) 208 (2.8) 524 (8.0) 319 (3.5) 4.91 (0.067) 1.15 (0.056)

DATA SOURCE: What We Eat in America, NHANES 2013-2014, individuals 2 years and over (excluding breast-fed children), day 1. Available: www.ars.usda.gov/nea/bhnrc/fsrg.Page 4 of 9
What We Eat in America, NHANES 2013-2014
Table 1. Nutrient Intakes from Food and Beverages: Mean Amounts Consumed per Individual,by Gender and Age, in the United States, 2013-2014 (continued)
Genderand age Vitamin C Vitamin D
Vitamin E(alpha-
tocopherol) Added
Vitamin E Vitamin K Calcium Phosphorus Magnesium
(years) mg (SE) µg (SE) mg (SE) mg (SE) µg (SE) mg (SE) mg (SE) mg (SE)
Males:2 - 5.............. 81.4 (3.56) 6.1 (0.52) 5.9 (0.30) 0.6 (0.17) 48.9 (3.69) 940 (33.6) 1097 (37.1) 207 (8.4)6 - 11.............. 77.4 (4.01) 6.1 (0.25) 7.2 (0.30) 0.5 (0.11) 71.8 (7.71) 1175 (41.5) 1388 (35.9) 246 (7.7)
12 - 19.............. 75.9 (5.39) 6.0 (0.30) 9.3 (1.01) 1.1* (0.53) 80.5 (4.12) 1186 (35.4) 1604 (29.4) 296 (6.4)
20 - 29.............. 87.3 (8.19) 6.1 (0.68) 11.6 (0.93) 1.6 (0.45) 124.3 (13.98) 1284 (65.0) 1825 (53.0) 350 (13.5)30 - 39.............. 82.4 (4.73) 4.6 (0.21) 10.7 (0.49) 0.9 (0.23) 118.4 (10.54) 1094 (30.1) 1681 (32.4) 350 (6.5)40 - 49.............. 75.1 (3.97) 6.3 (0.82) 10.0 (0.36) 0.6* (0.20) 114.5 (8.79) 1092 (40.8) 1675 (44.5) 351 (9.2)
50 - 59.............. 83.4 (6.01) 5.2 (0.47) 10.4 (0.53) 0.9 (0.15) 130.5 (12.61) 1013 (36.7) 1589 (37.5) 360 (13.1)60 - 69.............. 78.3 (5.12) 5.1 (0.50) 9.9 (0.66) 0.7* (0.25) 118.4 (9.76) 997 (41.1) 1450 (26.4) 329 (14.6)70 and over...... 97.5 (5.49) 5.7 (0.36) 9.4 (0.50) 1.3* (0.48) 116.0 (9.23) 940 (40.5) 1377 (44.0) 313 (12.3)
2 - 19............ 77.5 (3.40) 6.1 (0.19) 7.9 (0.50) 0.8* (0.26) 71.4 (4.36) 1135 (25.8) 1430 (24.6) 261 (5.0)20 and over... 83.3 (2.39) 5.5 (0.29) 10.4 (0.26) 1.0 (0.08) 120.9 (5.32) 1086 (18.2) 1625 (17.9) 345 (4.6)
2 and over... 81.9 (1.51) 5.7 (0.22) 9.8 (0.22) 0.9 (0.07) 108.4 (4.08) 1098 (13.8) 1576 (14.3) 324 (3.8)
Females:2 - 5.............. 74.2 (5.87) 5.6 (0.35) 5.3 (0.17) 0.5 (0.10) 50.1 (2.97) 926 (45.1) 1016 (34.9) 184 (5.3)6 - 11.............. 71.6 (4.03) 4.7 (0.10) 7.1 (0.23) 0.8 (0.20) 75.0 (7.72) 960 (28.1) 1180 (19.4) 218 (3.7)
12 - 19.............. 62.7 (3.92) 3.7 (0.15) 6.7 (0.31) 0.4 (0.09) 82.5 (11.19) 842 (33.3) 1095 (37.4) 210 (6.3)
20 - 29.............. 71.6 (2.34) 4.0 (0.28) 8.0 (0.33) 0.8 (0.17) 100.9 (7.33) 872 (32.8) 1191 (31.6) 248 (7.1)30 - 39.............. 76.3 (4.58) 3.8 (0.26) 9.3 (0.37) 1.0 (0.28) 139.0 (20.12) 912 (27.9) 1286 (29.9) 285 (8.1)40 - 49.............. 72.8 (5.60) 3.6 (0.23) 8.5 (0.34) 0.6 (0.11) 130.9 (7.77) 865 (23.6) 1217 (22.8) 277 (4.9)
50 - 59.............. 74.1 (4.27) 4.1 (0.15) 8.6 (0.55) 0.9 (0.23) 141.6 (16.74) 828 (30.0) 1177 (23.1) 278 (9.8)60 - 69.............. 71.2 (4.79) 4.2 (0.37) 8.3 (0.50) 0.9 (0.21) 122.3 (8.21) 814 (30.4) 1154 (36.4) 267 (10.5)70 and over...... 87.4 (4.46) 4.4 (0.19) 7.7 (0.22) 1.0 (0.21) 110.7 (4.50) 809 (28.6) 1069 (25.1) 249 (5.5)
2 - 19............ 68.0 (2.11) 4.4 (0.13) 6.5 (0.17) 0.6 (0.09) 73.2 (5.73) 898 (22.8) 1105 (19.3) 207 (3.3)20 and over... 75.1 (2.15) 4.0 (0.11) 8.4 (0.17) 0.9 (0.09) 125.0 (5.02) 852 (10.9) 1187 (12.2) 268 (3.7)
2 and over... 73.4 (1.84) 4.1 (0.08) 8.0 (0.15) 0.8 (0.08) 113.0 (4.88) 863 (10.3) 1168 (11.9) 254 (3.3)
Males and females:2 - 19............ 72.9 (1.78) 5.3 (0.10) 7.2 (0.29) 0.7 (0.15) 72.2 (3.02) 1020 (19.2) 1272 (15.9) 235 (3.1)20 and over... 79.1 (1.67) 4.7 (0.16) 9.4 (0.18) 0.9 (0.05) 123.0 (3.16) 965 (11.8) 1399 (11.9) 305 (3.4)
2 and over... 77.6 (1.25) 4.9 (0.12) 8.9 (0.16) 0.9 (0.05) 110.7 (2.76) 978 (11.2) 1369 (11.0) 288 (3.1)
DATA SOURCE: What We Eat in America, NHANES 2013-2014, individuals 2 years and over (excluding breast-fed children), day 1. Available: www.ars.usda.gov/nea/bhnrc/fsrg.Page 5 of 9
What We Eat in America, NHANES 2013-2014
Table 1. Nutrient Intakes from Food and Beverages: Mean Amounts Consumed per Individual,by Gender and Age, in the United States, 2013-2014 (continued)
DATA SOURCE: What We Eat in America, NHANES 2013-2014, individuals 2 years and over (excluding breast-fed children), day 1. Available: www.ars.usda.gov/nea/bhnrc/fsrg.Page 5 of 9
What We Eat in America, NHANES 2013-2014
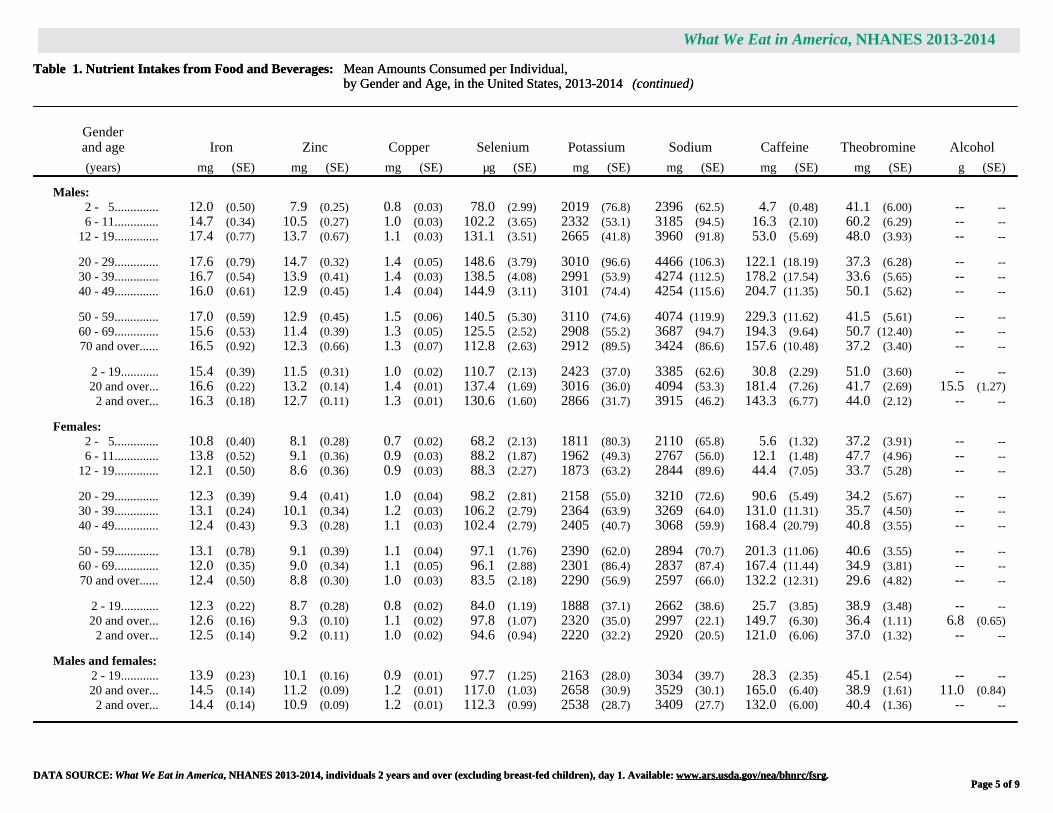
Table 1. Nutrient Intakes from Food and Beverages: Mean Amounts Consumed per Individual,by Gender and Age, in the United States, 2013-2014 (continued)
Genderand age Iron Zinc Copper Selenium Potassium Sodium Caffeine Theobromine Alcohol
(years) mg (SE) mg (SE) mg (SE) µg (SE) mg (SE) mg (SE) mg (SE) mg (SE) g (SE)
Males:2 - 5.............. 12.0 (0.50) 7.9 (0.25) 0.8 (0.03) 78.0 (2.99) 2019 (76.8) 2396 (62.5) 4.7 (0.48) 41.1 (6.00) -- --6 - 11.............. 14.7 (0.34) 10.5 (0.27) 1.0 (0.03) 102.2 (3.65) 2332 (53.1) 3185 (94.5) 16.3 (2.10) 60.2 (6.29) -- --
12 - 19.............. 17.4 (0.77) 13.7 (0.67) 1.1 (0.03) 131.1 (3.51) 2665 (41.8) 3960 (91.8) 53.0 (5.69) 48.0 (3.93) -- --
20 - 29.............. 17.6 (0.79) 14.7 (0.32) 1.4 (0.05) 148.6 (3.79) 3010 (96.6) 4466 (106.3) 122.1 (18.19) 37.3 (6.28) -- --30 - 39.............. 16.7 (0.54) 13.9 (0.41) 1.4 (0.03) 138.5 (4.08) 2991 (53.9) 4274 (112.5) 178.2 (17.54) 33.6 (5.65) -- --40 - 49.............. 16.0 (0.61) 12.9 (0.45) 1.4 (0.04) 144.9 (3.11) 3101 (74.4) 4254 (115.6) 204.7 (11.35) 50.1 (5.62) -- --
50 - 59.............. 17.0 (0.59) 12.9 (0.45) 1.5 (0.06) 140.5 (5.30) 3110 (74.6) 4074 (119.9) 229.3 (11.62) 41.5 (5.61) -- --60 - 69.............. 15.6 (0.53) 11.4 (0.39) 1.3 (0.05) 125.5 (2.52) 2908 (55.2) 3687 (94.7) 194.3 (9.64) 50.7 (12.40) -- --70 and over...... 16.5 (0.92) 12.3 (0.66) 1.3 (0.07) 112.8 (2.63) 2912 (89.5) 3424 (86.6) 157.6 (10.48) 37.2 (3.40) -- --
2 - 19............ 15.4 (0.39) 11.5 (0.31) 1.0 (0.02) 110.7 (2.13) 2423 (37.0) 3385 (62.6) 30.8 (2.29) 51.0 (3.60) -- --20 and over... 16.6 (0.22) 13.2 (0.14) 1.4 (0.01) 137.4 (1.69) 3016 (36.0) 4094 (53.3) 181.4 (7.26) 41.7 (2.69) 15.5 (1.27)
2 and over... 16.3 (0.18) 12.7 (0.11) 1.3 (0.01) 130.6 (1.60) 2866 (31.7) 3915 (46.2) 143.3 (6.77) 44.0 (2.12) -- --
Females:2 - 5.............. 10.8 (0.40) 8.1 (0.28) 0.7 (0.02) 68.2 (2.13) 1811 (80.3) 2110 (65.8) 5.6 (1.32) 37.2 (3.91) -- --6 - 11.............. 13.8 (0.52) 9.1 (0.36) 0.9 (0.03) 88.2 (1.87) 1962 (49.3) 2767 (56.0) 12.1 (1.48) 47.7 (4.96) -- --
12 - 19.............. 12.1 (0.50) 8.6 (0.36) 0.9 (0.03) 88.3 (2.27) 1873 (63.2) 2844 (89.6) 44.4 (7.05) 33.7 (5.28) -- --
20 - 29.............. 12.3 (0.39) 9.4 (0.41) 1.0 (0.04) 98.2 (2.81) 2158 (55.0) 3210 (72.6) 90.6 (5.49) 34.2 (5.67) -- --30 - 39.............. 13.1 (0.24) 10.1 (0.34) 1.2 (0.03) 106.2 (2.79) 2364 (63.9) 3269 (64.0) 131.0 (11.31) 35.7 (4.50) -- --40 - 49.............. 12.4 (0.43) 9.3 (0.28) 1.1 (0.03) 102.4 (2.79) 2405 (40.7) 3068 (59.9) 168.4 (20.79) 40.8 (3.55) -- --
50 - 59.............. 13.1 (0.78) 9.1 (0.39) 1.1 (0.04) 97.1 (1.76) 2390 (62.0) 2894 (70.7) 201.3 (11.06) 40.6 (3.55) -- --60 - 69.............. 12.0 (0.35) 9.0 (0.34) 1.1 (0.05) 96.1 (2.88) 2301 (86.4) 2837 (87.4) 167.4 (11.44) 34.9 (3.81) -- --70 and over...... 12.4 (0.50) 8.8 (0.30) 1.0 (0.03) 83.5 (2.18) 2290 (56.9) 2597 (66.0) 132.2 (12.31) 29.6 (4.82) -- --
2 - 19............ 12.3 (0.22) 8.7 (0.28) 0.8 (0.02) 84.0 (1.19) 1888 (37.1) 2662 (38.6) 25.7 (3.85) 38.9 (3.48) -- --20 and over... 12.6 (0.16) 9.3 (0.10) 1.1 (0.02) 97.8 (1.07) 2320 (35.0) 2997 (22.1) 149.7 (6.30) 36.4 (1.11) 6.8 (0.65)
2 and over... 12.5 (0.14) 9.2 (0.11) 1.0 (0.02) 94.6 (0.94) 2220 (32.2) 2920 (20.5) 121.0 (6.06) 37.0 (1.32) -- --
Males and females:2 - 19............ 13.9 (0.23) 10.1 (0.16) 0.9 (0.01) 97.7 (1.25) 2163 (28.0) 3034 (39.7) 28.3 (2.35) 45.1 (2.54) -- --20 and over... 14.5 (0.14) 11.2 (0.09) 1.2 (0.01) 117.0 (1.03) 2658 (30.9) 3529 (30.1) 165.0 (6.40) 38.9 (1.61) 11.0 (0.84)
2 and over... 14.4 (0.14) 10.9 (0.09) 1.2 (0.01) 112.3 (0.99) 2538 (28.7) 3409 (27.7) 132.0 (6.00) 40.4 (1.36) -- --

DATA SOURCE: What We Eat in America, NHANES 2013-2014, individuals 2 years and over (excluding breast-fed children), day 1. Available: www.ars.usda.gov/nea/bhnrc/fsrg.Page 6 of 9
What We Eat in America, NHANES 2013-2014
Table 1. Nutrient Intakes from Food and Beverages: Mean Amounts Consumed per Individual,by Gender and Age, in the United States, 2013-2014 (continued)
Genderand age
SFA4:0
SFA6:0
SFA8:0
SFA10:0
SFA12:0
SFA14:0
SFA16:0
SFA18:0
(years) g (SE) g (SE) g (SE) g (SE) g (SE) g (SE) g (SE) g (SE)
Males:2 - 5.............. 0.48 (0.024) 0.32 (0.019) 0.29 (0.027) 0.48 (0.028) 0.74 (0.064) 1.89 (0.082) 10.42 (0.318) 4.60 (0.112)6 - 11.............. 0.65 (0.051) 0.41 (0.033) 0.35 (0.033) 0.64 (0.051) 1.20 (0.224) 2.68 (0.188) 14.84 (0.482) 6.69 (0.303)
12 - 19.............. 0.59 (0.038) 0.37 (0.022) 0.29 (0.014) 0.57 (0.033) 0.93 (0.083) 2.58 (0.141) 16.62 (0.379) 7.37 (0.210)
20 - 29.............. 0.63 (0.045) 0.40 (0.027) 0.32 (0.026) 0.64 (0.036) 0.96 (0.063) 2.95 (0.154) 18.68 (0.576) 8.27 (0.250)30 - 39.............. 0.55 (0.032) 0.34 (0.017) 0.29 (0.016) 0.57 (0.027) 1.00 (0.087) 2.61 (0.112) 17.01 (0.445) 7.59 (0.222)40 - 49.............. 0.60 (0.038) 0.36 (0.020) 0.30 (0.017) 0.59 (0.033) 0.93 (0.080) 2.64 (0.146) 16.68 (0.540) 7.51 (0.318)
50 - 59.............. 0.57 (0.037) 0.36 (0.026) 0.31 (0.018) 0.59 (0.044) 1.00 (0.072) 2.51 (0.127) 16.91 (0.562) 7.63 (0.227)60 - 69.............. 0.57 (0.061) 0.35 (0.030) 0.28 (0.019) 0.56 (0.043) 0.89 (0.091) 2.37 (0.189) 15.61 (0.490) 6.88 (0.228)70 and over...... 0.53 (0.038) 0.34 (0.023) 0.27 (0.018) 0.53 (0.033) 0.87 (0.077) 2.24 (0.136) 14.31 (0.577) 6.48 (0.285)
2 - 19............ 0.59 (0.029) 0.37 (0.016) 0.31 (0.012) 0.58 (0.025) 0.99 (0.073) 2.49 (0.098) 14.80 (0.285) 6.60 (0.161)20 and over... 0.58 (0.023) 0.36 (0.013) 0.30 (0.011) 0.59 (0.018) 0.95 (0.036) 2.59 (0.070) 16.77 (0.209) 7.50 (0.113)
2 and over... 0.58 (0.016) 0.36 (0.009) 0.30 (0.009) 0.59 (0.013) 0.96 (0.039) 2.57 (0.052) 16.27 (0.162) 7.27 (0.086)
Females:2 - 5.............. 0.47 (0.031) 0.30 (0.019) 0.26 (0.017) 0.46 (0.022) 0.68 (0.039) 1.80 (0.099) 9.79 (0.398) 4.32 (0.190)6 - 11.............. 0.50 (0.020) 0.33 (0.013) 0.27 (0.011) 0.51 (0.020) 0.85 (0.058) 2.12 (0.067) 12.53 (0.291) 5.53 (0.126)
12 - 19.............. 0.43 (0.030) 0.27 (0.020) 0.22 (0.013) 0.44 (0.028) 0.71 (0.044) 1.86 (0.114) 11.52 (0.478) 5.01 (0.219)
20 - 29.............. 0.50 (0.032) 0.30 (0.016) 0.25 (0.013) 0.50 (0.023) 0.80 (0.047) 2.14 (0.108) 13.13 (0.551) 5.79 (0.268)30 - 39.............. 0.47 (0.025) 0.30 (0.014) 0.27 (0.020) 0.50 (0.024) 0.96 (0.117) 2.11 (0.092) 13.14 (0.353) 5.94 (0.163)40 - 49.............. 0.46 (0.021) 0.29 (0.013) 0.23 (0.010) 0.46 (0.019) 0.71 (0.039) 1.99 (0.083) 12.84 (0.364) 5.71 (0.163)
50 - 59.............. 0.42 (0.020) 0.27 (0.012) 0.22 (0.011) 0.44 (0.020) 0.71 (0.069) 1.82 (0.073) 12.02 (0.335) 5.35 (0.167)60 - 69.............. 0.41 (0.026) 0.26 (0.014) 0.21 (0.012) 0.42 (0.024) 0.68 (0.046) 1.75 (0.097) 11.82 (0.429) 5.15 (0.177)70 and over...... 0.43 (0.026) 0.27 (0.016) 0.22 (0.015) 0.43 (0.024) 0.67 (0.053) 1.74 (0.084) 10.84 (0.356) 4.94 (0.229)
2 - 19............ 0.46 (0.019) 0.30 (0.012) 0.24 (0.006) 0.46 (0.015) 0.75 (0.024) 1.93 (0.062) 11.47 (0.217) 5.03 (0.117)20 and over... 0.45 (0.008) 0.28 (0.005) 0.24 (0.004) 0.46 (0.007) 0.76 (0.022) 1.94 (0.030) 12.37 (0.125) 5.51 (0.062)
2 and over... 0.45 (0.007) 0.29 (0.004) 0.24 (0.004) 0.46 (0.007) 0.76 (0.018) 1.93 (0.025) 12.16 (0.119) 5.40 (0.065)
Males and females:2 - 19............ 0.53 (0.019) 0.34 (0.012) 0.28 (0.007) 0.52 (0.017) 0.87 (0.042) 2.22 (0.066) 13.18 (0.197) 5.84 (0.114)20 and over... 0.51 (0.011) 0.32 (0.006) 0.27 (0.005) 0.52 (0.010) 0.85 (0.018) 2.25 (0.034) 14.50 (0.143) 6.47 (0.064)
2 and over... 0.52 (0.009) 0.32 (0.006) 0.27 (0.005) 0.52 (0.009) 0.86 (0.021) 2.24 (0.030) 14.18 (0.124) 6.32 (0.063)

DATA SOURCE: What We Eat in America, NHANES 2013-2014, individuals 2 years and over (excluding breast-fed children), day 1. Available: www.ars.usda.gov/nea/bhnrc/fsrg.Page 7 of 9
What We Eat in America, NHANES 2013-2014
Table 1. Nutrient Intakes from Food and Beverages: Mean Amounts Consumed per Individual,by Gender and Age, in the United States, 2013-2014 (continued)
Genderand age
MFA16:1
MFA18:1
MFA20:1
MFA22:1
PFA18:2
PFA18:3
PFA18:4
(years) g (SE) g (SE) g (SE) g (SE) g (SE) g (SE) g (SE)
Males:2 - 5.............. 0.64 (0.016) 16.86 (0.381) 0.21 (0.014) 0.01 (0.001) 10.67 (0.332) 1.07 (0.050) 0.01 (0.001)6 - 11.............. 0.99 (0.063) 22.57 (0.834) 0.25 (0.010) 0.02 (0.001) 13.78 (0.542) 1.36 (0.043) 0.01 (0.002)
12 - 19.............. 1.23 (0.058) 27.69 (0.845) 0.32 (0.013) 0.02 (0.003) 17.99 (0.733) 1.73 (0.059) 0.01 (0.001)
20 - 29.............. 1.47 (0.065) 31.75 (0.899) 0.42 (0.020) 0.04 (0.004) 21.16 (0.842) 2.14 (0.075) 0.01 (0.002)30 - 39.............. 1.34 (0.046) 30.54 (0.603) 0.39 (0.018) 0.04 (0.004) 19.93 (0.681) 1.98 (0.062) 0.01 (0.002)40 - 49.............. 1.29 (0.043) 29.50 (0.877) 0.39 (0.032) 0.03 (0.004) 19.02 (0.661) 1.93 (0.082) 0.02* (0.005)
50 - 59.............. 1.29 (0.031) 31.26 (1.444) 0.39 (0.015) 0.03 (0.004) 19.06 (0.958) 1.92 (0.126) 0.01 (0.002)60 - 69.............. 1.08 (0.067) 28.40 (0.987) 0.38 (0.022) 0.04 (0.005) 18.93 (0.951) 2.05 (0.129) 0.01 (0.003)70 and over...... 1.04 (0.053) 25.25 (0.937) 0.34 (0.024) 0.05* (0.018) 16.32 (0.769) 1.98 (0.199) 0.01* (0.003)
2 - 19............ 1.03 (0.037) 23.80 (0.639) 0.28 (0.009) 0.02 (0.001) 15.09 (0.495) 1.47 (0.044) 0.01 (0.001)20 and over... 1.28 (0.020) 29.85 (0.408) 0.39 (0.010) 0.04 (0.002) 19.32 (0.396) 2.00 (0.051) 0.01 (0.001)
2 and over... 1.22 (0.019) 28.32 (0.385) 0.36 (0.009) 0.03 (0.002) 18.25 (0.308) 1.87 (0.043) 0.01 (0.001)
Females:2 - 5.............. 0.63 (0.036) 15.45 (0.576) 0.17 (0.011) 0.01 (0.001) 10.08 (0.424) 1.03 (0.045) #6 - 11.............. 0.81 (0.030) 20.35 (0.376) 0.23 (0.005) 0.02 (0.001) 13.78 (0.297) 1.38 (0.028) 0.01 (0.001)
12 - 19.............. 0.76 (0.034) 19.49 (0.926) 0.24 (0.016) 0.02 (0.002) 13.85 (0.737) 1.37 (0.090) 0.01 (0.001)
20 - 29.............. 0.95 (0.040) 22.52 (0.966) 0.27 (0.013) 0.02 (0.003) 15.32 (0.601) 1.64 (0.057) 0.01 (0.001)30 - 39.............. 0.95 (0.037) 23.92 (0.630) 0.30 (0.011) 0.02 (0.002) 16.10 (0.616) 1.71 (0.069) 0.01 (0.003)40 - 49.............. 0.94 (0.069) 23.24 (0.606) 0.28 (0.012) 0.03 (0.003) 15.56 (0.368) 1.68 (0.048) 0.01 (0.001)
50 - 59.............. 0.85 (0.023) 22.24 (0.704) 0.25 (0.015) 0.02 (0.003) 15.34 (0.555) 1.68 (0.109) 0.01 (0.002)60 - 69.............. 0.78 (0.038) 22.19 (1.083) 0.31 (0.034) 0.03 (0.003) 14.85 (0.688) 1.57 (0.110) 0.01 (0.003)70 and over...... 0.71 (0.025) 19.71 (0.551) 0.22 (0.008) 0.02 (0.003) 13.46 (0.306) 1.53 (0.048) #
2 - 19............ 0.75 (0.019) 18.90 (0.458) 0.22 (0.007) 0.02 (0.001) 13.02 (0.373) 1.30 (0.042) 0.01 (0.001)20 and over... 0.87 (0.018) 22.41 (0.277) 0.27 (0.009) 0.02 (0.001) 15.18 (0.209) 1.64 (0.030) 0.01 (0.001)
2 and over... 0.84 (0.015) 21.60 (0.249) 0.26 (0.007) 0.02 (0.001) 14.68 (0.159) 1.56 (0.026) 0.01 (0.001)
Males and females:2 - 19............ 0.89 (0.024) 21.42 (0.466) 0.25 (0.008) 0.02 (0.001) 14.09 (0.374) 1.39 (0.036) 0.01 (#)20 and over... 1.07 (0.014) 26.02 (0.304) 0.33 (0.007) 0.03 (0.001) 17.19 (0.280) 1.82 (0.035) 0.01 (0.001)
2 and over... 1.03 (0.014) 24.91 (0.297) 0.31 (0.006) 0.03 (0.001) 16.44 (0.226) 1.71 (0.031) 0.01 (0.001)
DATA SOURCE: What We Eat in America, NHANES 2013-2014, individuals 2 years and over (excluding breast-fed children), day 1. Available: www.ars.usda.gov/nea/bhnrc/fsrg.Page 8 of 9
What We Eat in America, NHANES 2013-2014
Table 1. Nutrient Intakes from Food and Beverages: Mean Amounts Consumed per Individual,by Gender and Age, in the United States, 2013-2014 (continued)
DATA SOURCE: What We Eat in America, NHANES 2013-2014, individuals 2 years and over (excluding breast-fed children), day 1. Available: www.ars.usda.gov/nea/bhnrc/fsrg.Page 8 of 9
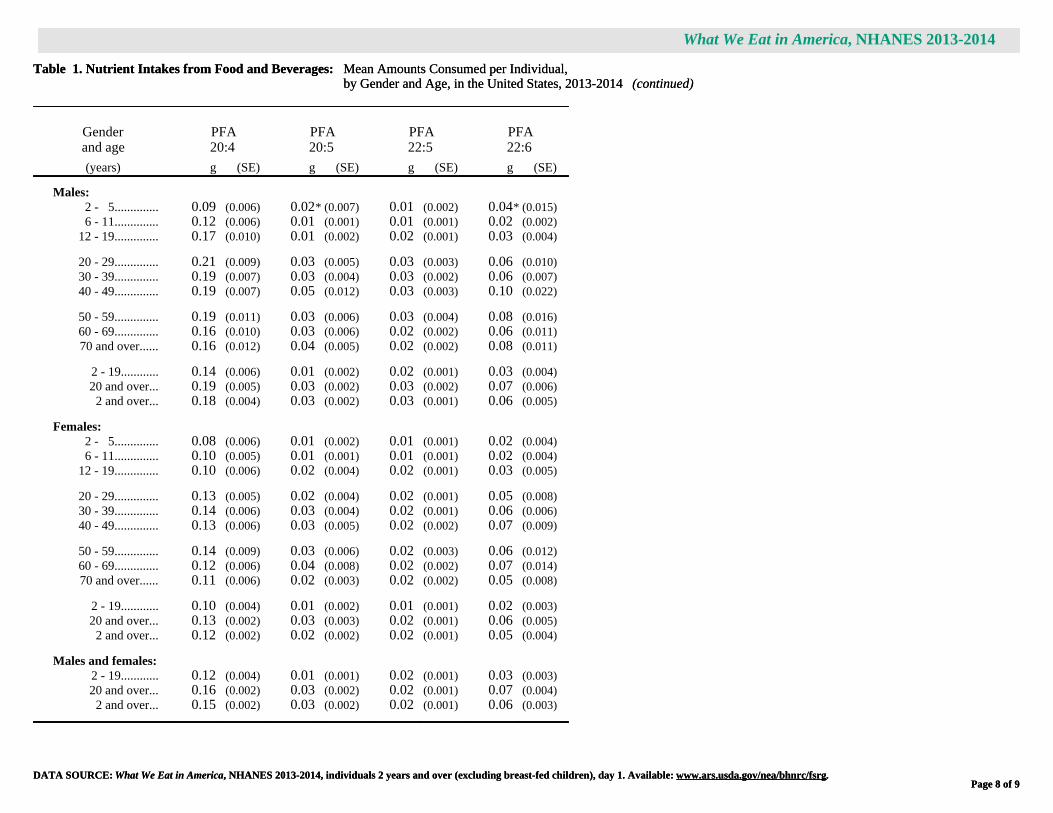
What We Eat in America, NHANES 2013-2014
Table 1. Nutrient Intakes from Food and Beverages: Mean Amounts Consumed per Individual,by Gender and Age, in the United States, 2013-2014 (continued)
Genderand age
PFA20:4
PFA20:5
PFA22:5
PFA22:6
(years) g (SE) g (SE) g (SE) g (SE)
Males:2 - 5.............. 0.09 (0.006) 0.02* (0.007) 0.01 (0.002) 0.04* (0.015)6 - 11.............. 0.12 (0.006) 0.01 (0.001) 0.01 (0.001) 0.02 (0.002)
12 - 19.............. 0.17 (0.010) 0.01 (0.002) 0.02 (0.001) 0.03 (0.004)
20 - 29.............. 0.21 (0.009) 0.03 (0.005) 0.03 (0.003) 0.06 (0.010)30 - 39.............. 0.19 (0.007) 0.03 (0.004) 0.03 (0.002) 0.06 (0.007)40 - 49.............. 0.19 (0.007) 0.05 (0.012) 0.03 (0.003) 0.10 (0.022)
50 - 59.............. 0.19 (0.011) 0.03 (0.006) 0.03 (0.004) 0.08 (0.016)60 - 69.............. 0.16 (0.010) 0.03 (0.006) 0.02 (0.002) 0.06 (0.011)70 and over...... 0.16 (0.012) 0.04 (0.005) 0.02 (0.002) 0.08 (0.011)
2 - 19............ 0.14 (0.006) 0.01 (0.002) 0.02 (0.001) 0.03 (0.004)20 and over... 0.19 (0.005) 0.03 (0.002) 0.03 (0.002) 0.07 (0.006)
2 and over... 0.18 (0.004) 0.03 (0.002) 0.03 (0.001) 0.06 (0.005)
Females:2 - 5.............. 0.08 (0.006) 0.01 (0.002) 0.01 (0.001) 0.02 (0.004)6 - 11.............. 0.10 (0.005) 0.01 (0.001) 0.01 (0.001) 0.02 (0.004)
12 - 19.............. 0.10 (0.006) 0.02 (0.004) 0.02 (0.001) 0.03 (0.005)
20 - 29.............. 0.13 (0.005) 0.02 (0.004) 0.02 (0.001) 0.05 (0.008)30 - 39.............. 0.14 (0.006) 0.03 (0.004) 0.02 (0.001) 0.06 (0.006)40 - 49.............. 0.13 (0.006) 0.03 (0.005) 0.02 (0.002) 0.07 (0.009)
50 - 59.............. 0.14 (0.009) 0.03 (0.006) 0.02 (0.003) 0.06 (0.012)60 - 69.............. 0.12 (0.006) 0.04 (0.008) 0.02 (0.002) 0.07 (0.014)70 and over...... 0.11 (0.006) 0.02 (0.003) 0.02 (0.002) 0.05 (0.008)
2 - 19............ 0.10 (0.004) 0.01 (0.002) 0.01 (0.001) 0.02 (0.003)20 and over... 0.13 (0.002) 0.03 (0.003) 0.02 (0.001) 0.06 (0.005)
2 and over... 0.12 (0.002) 0.02 (0.002) 0.02 (0.001) 0.05 (0.004)
Males and females:2 - 19............ 0.12 (0.004) 0.01 (0.001) 0.02 (0.001) 0.03 (0.003)20 and over... 0.16 (0.002) 0.03 (0.002) 0.02 (0.001) 0.07 (0.004)
2 and over... 0.15 (0.002) 0.03 (0.002) 0.02 (0.001) 0.06 (0.003)

What We Eat in America, NHANES 2013-2014
Page 9 of 9Page 9 of 9
Symbol Legend
* Indicates an estimate that may be less statistically reliable than estimates that are not flagged. The rules for flagging estimated means are as follows:
Mean: An estimated mean is flagged when based on a sample size of less than 30 times the variance inflation factor (VIF), where the VIF represents a broadly calculated average designeffect, or when the relative standard error is greater than 30 percent. The VIF used in this table is 1.98.
# Indicates a non-zero value too small to report.
Abbreviations
SE = standard error; RAE = retinol activity equivalents; DFE = dietary folate equivalents. SFA = saturated fatty acid; MFA = monounsaturated fatty acid; PFA = polyunsaturated fatty acid.
Notes Applicable to All Tables in Series: What We Eat in America, NHANES 2013-2014
Sample weights designed for dietary analysis were used to allow estimates representative of the U. S. population for the years of collection.
The statistics in this table are estimated from Day 1 dietary recall interviews conducted in the What We Eat in America, National Health and Nutrition Examination Survey (NHANES) 2013-2014.The 24-hour dietary recalls were conducted in-person, by trained interviewers, using the USDA 5-step Automated Multiple-Pass Method. Food intakes were coded and nutrient values weredetermined using the USDA Food and Nutrient Database for Dietary Studies 2013-2014 www.ars.usda.gov/nea/bhnrc/fsrg.
Intakes of nutrients and other dietary components are based on the consumption of food and beverages, including water, and do not include intake from supplements or medications.
The table includes data from individuals 2 years and over. Breast-fed children were excluded because breast milk was not quantified in dietary recall interviews.
Although alcohol data are collected for all individuals, estimates are not presented for age groups under 20 years due to extreme variability and/or inadequate sample size.
Suggested Citation
U.S. Department of Agriculture, Agricultural Research Service. 2016. Nutrient Intakes from Food and Beverages: Mean Amounts Consumed per Individual, by Gender and Age, What We Eat inAmerica, NHANES 2013-2014.

DATA SOURCE: What We Eat in America, NHANES 2013-2014, individuals 2 years and over (excluding breast-fed children), day 1. Available: www.ars.usda.gov/nea/bhnrc/fsrg.Page 1 of 9
What We Eat in America, NHANES 2013-2014
Table 2. Nutrient Intakes from Food and Beverages: Mean Amounts Consumed per Individual,by Race/Ethnicity and Age, in the United States, 2013-2014
Race/ethnicityand age
Samplesize Energy Protein
Carbo-hydrate
Totalsugars
Dietaryfiber
Totalfat
Saturatedfat
Mono-unsaturated
fat
Poly-unsaturated
fat
(years) kcal (SE) g (SE) g (SE) g (SE) g (SE) g (SE) g (SE) g (SE) g (SE)
Non-Hispanic White:2 - 5.............. 184 1420 (33.7) 50.7 (1.96) 195 (5.6) 97 (3.5) 11.4 (0.59) 50.9 (1.28) 18.7 (0.70) 16.6 (0.55) 10.9 (0.33)6 - 11.............. 290 1951 (54.3) 67.4 (2.18) 258 (7.9) 120 (4.0) 14.1 (0.67) 74.8 (2.27) 28.3 (0.90) 24.5 (0.83) 15.3 (0.58)
12 - 19.............. 337 2034 (47.9) 81.0 (3.50) 259 (8.6) 126 (4.9) 13.8 (0.51) 76.5 (1.90) 26.1 (0.95) 25.6 (0.77) 17.1 (0.87)20 and over... 2233 2129 (22.9) 82.7 (0.77) 248 (3.1) 110 (1.7) 16.6 (0.32) 83.4 (1.09) 27.2 (0.36) 28.9 (0.38) 19.4 (0.35)
2 and over... 3044 2080 (20.5) 80.3 (0.96) 248 (2.9) 112 (1.7) 16.0 (0.25) 80.9 (1.00) 26.9 (0.34) 27.8 (0.39) 18.6 (0.29)
Non-Hispanic Black:2 - 5.............. 161 1559 (72.5) 53.3 (3.38) 207 (8.1) 99 (3.9) 10.9 (0.68) 59.5 (3.76) 19.6 (1.53) 20.1 (1.13) 14.1 (0.96)6 - 11.............. 285 1837 (60.9) 63.6 (1.97) 249 (9.8) 113 (4.7) 13.5 (0.49) 67.6 (2.94) 22.6 (1.10) 22.9 (0.91) 15.8 (0.80)
12 - 19.............. 307 2056 (73.3) 72.0 (2.42) 264 (7.2) 117 (4.4) 13.5 (0.72) 80.8 (4.51) 26.0 (1.38) 27.3 (1.52) 19.7 (1.35)20 and over... 1009 2230 (54.8) 82.5 (1.91) 266 (6.5) 124 (4.0) 15.4 (0.52) 86.5 (2.52) 26.9 (0.66) 30.6 (1.05) 20.8 (0.89)
2 and over... 1762 2133 (43.8) 77.7 (1.52) 261 (5.1) 120 (3.2) 14.7 (0.37) 82.5 (2.15) 26.0 (0.55) 28.9 (0.90) 19.8 (0.71)
Non-Hispanic Asian1:2 - 5.............. 58 1528*(140.7) 59.8* (6.67) 203* (20.3) 93* (11.2) 10.4* (0.85) 54.7* (4.98) 20.9* (1.98) 17.5* (1.73) 11.0* (0.98)6 - 11.............. 70 1874 (115.4) 72.0 (6.60) 258 (11.3) 105 (6.6) 15.3 (0.82) 63.6 (5.69) 21.8 (2.04) 21.3 (2.19) 14.0 (1.16)
12 - 19.............. 136 2040 (113.2) 85.5 (6.15) 263 (15.0) 99 (7.9) 16.6 (2.04) 72.7 (4.76) 22.6 (1.51) 24.8 (1.80) 18.5 (1.32)20 and over... 525 1844 (41.7) 80.9 (2.29) 227 (5.4) 81 (3.1) 18.7 (0.74) 65.7 (2.10) 19.1 (0.74) 23.8 (0.76) 16.7 (0.62)
2 and over... 789 1853 (37.9) 79.8 (2.27) 233 (4.5) 85 (2.9) 17.8 (0.64) 65.8 (1.95) 19.8 (0.63) 23.5 (0.76) 16.4 (0.60)
Hispanic:2 - 5.............. 221 1554 (52.3) 57.3 (2.04) 207 (6.2) 99 (4.3) 12.5 (0.33) 57.4 (2.71) 21.3 (1.03) 18.2 (0.84) 12.4 (0.73)6 - 11.............. 330 1896 (69.8) 69.0 (2.38) 252 (8.6) 114 (4.5) 15.7 (0.78) 70.4 (3.45) 24.7 (1.54) 23.3 (1.14) 15.4 (0.60)
12 - 19.............. 446 2092 (92.2) 80.3 (4.39) 265 (9.9) 115 (4.4) 16.6 (0.91) 80.8 (4.27) 26.9 (1.51) 27.5 (1.48) 18.8 (1.03)20 and over... 1125 2204 (38.0) 89.2 (1.90) 267 (3.9) 114 (2.5) 19.7 (0.67) 83.2 (1.99) 26.8 (0.69) 28.6 (0.76) 19.5 (0.64)
2 and over... 2122 2104 (38.3) 83.2 (1.90) 261 (4.1) 113 (2.2) 18.2 (0.61) 79.4 (1.78) 26.1 (0.63) 27.0 (0.64) 18.4 (0.53)

DATA SOURCE: What We Eat in America, NHANES 2013-2014, individuals 2 years and over (excluding breast-fed children), day 1. Available: www.ars.usda.gov/nea/bhnrc/fsrg.Page 2 of 9
What We Eat in America, NHANES 2013-2014
Table 2. Nutrient Intakes from Food and Beverages: Mean Amounts Consumed per Individual,by Race/Ethnicity and Age, in the United States, 2013-2014 (continued)
Race/ethnicityand age
Choles-terol Retinol
Vitamin A(RAE)
Alpha-carotene
Beta-carotene
Beta-crypto-xanthin Lycopene
Lutein +zeaxanthin Thiamin
(years) mg (SE) µg (SE) µg (SE) µg (SE) µg (SE) µg (SE) µg (SE) µg (SE) mg (SE)
Non-Hispanic White:2 - 5.............. 150 (9.3) 441 (18.4) 583 (25.8) 373*(124.9) 1498 (214.5) 52 (8.7) 2647 (472.0) 574 (42.6) 1.20 (0.044)6 - 11.............. 215 (15.5) 566 (26.8) 698 (32.1) 287 (63.2) 1413 (179.4) 69 (10.0) 3918 (339.1) 1006 (225.4) 1.61 (0.057)
12 - 19.............. 249 (12.7) 481 (22.4) 620 (34.3) 337*(106.4) 1484 (287.8) 64 (9.5) 4324 (397.3) 997 (144.5) 1.70 (0.081)20 and over... 282 (4.3) 459 (7.7) 666 (12.7) 409 (35.3) 2256 (120.5) 74 (4.6) 5149 (154.6) 1670 (111.8) 1.64 (0.020)
2 and over... 269 (3.9) 468 (6.5) 661 (11.9) 392 (29.6) 2095 (109.3) 72 (4.3) 4888 (124.9) 1517 (89.0) 1.63 (0.019)
Non-Hispanic Black:2 - 5.............. 182 (23.1) 390 (20.4) 460 (19.9) 159* (47.8) 720 (140.2) 75 (11.6) 2783 (345.8) 692 (125.5) 1.26 (0.035)6 - 11.............. 208 (16.0) 441 (27.8) 549 (24.7) 202 (41.4) 1166 (141.6) 70 (13.5) 3685 (594.7) 856 (132.9) 1.53 (0.066)
12 - 19.............. 251 (14.8) 382 (24.1) 474 (28.2) 148 (35.3) 1002 (138.3) 60 (11.7) 4879 (589.6) 1012 (125.1) 1.58 (0.062)20 and over... 320 (9.0) 357 (11.8) 564 (26.7) 285 (53.9) 2307 (225.5) 75 (5.5) 4214 (443.5) 1630 (91.6) 1.52 (0.030)
2 and over... 293 (7.8) 370 (9.1) 545 (20.1) 252 (39.5) 1939 (179.5) 72 (4.9) 4173 (373.8) 1424 (83.6) 1.51 (0.020)
Non-Hispanic Asian1:2 - 5.............. 206* (21.9) 463* (40.3) 563* (47.8) 255* (91.8) 1059*(261.4) 36* (8.6) 2447*(1089.4) 664* (90.0) 1.28*(0.125)6 - 11.............. 227 (45.2) 476 (40.4) 664 (51.1) 560 (140.0) 1912 (426.6) 130 (26.3) 4145 (760.4) 1031 (221.0) 1.57 (0.069)
12 - 19.............. 261 (22.3) 415 (75.5) 662 (107.6) 662 (192.5) 2603 (511.2) 84 (19.3) 5631(1639.1) 1474 (356.0) 1.77 (0.159)20 and over... 268 (12.5) 265 (14.5) 609 (32.7) 654 (62.3) 3735 (285.6) 148 (22.3) 3742 (386.4) 2544 (293.5) 1.56 (0.033)
2 and over... 261 (13.0) 306 (16.6) 617 (27.6) 630 (46.8) 3356 (213.8) 135 (16.9) 3917 (376.2) 2230 (231.2) 1.57 (0.032)
Hispanic:2 - 5.............. 207 (12.0) 487 (24.1) 568 (23.6) 180 (33.4) 865 (68.6) 86 (12.8) 4339 (556.8) 589 (30.6) 1.33 (0.054)6 - 11.............. 216 (11.9) 514 (32.7) 611 (33.9) 211 (51.2) 1037 (141.5) 73 (9.4) 4988 (482.2) 736 (118.0) 1.61 (0.040)
12 - 19.............. 271 (14.9) 427 (20.4) 537 (28.8) 249 (45.4) 1172 (140.4) 75 (5.5) 5169 (405.9) 748 (32.3) 1.68 (0.065)20 and over... 327 (11.6) 406 (21.2) 587 (28.6) 374 (50.7) 1942 (184.0) 109 (7.6) 5492 (332.4) 1478 (133.3) 1.64 (0.035)
2 and over... 297 (8.9) 428 (16.9) 581 (24.2) 323 (35.7) 1644 (130.6) 98 (4.9) 5301 (289.9) 1219 (91.6) 1.62 (0.034)

DATA SOURCE: What We Eat in America, NHANES 2013-2014, individuals 2 years and over (excluding breast-fed children), day 1. Available: www.ars.usda.gov/nea/bhnrc/fsrg.Page 3 of 9
What We Eat in America, NHANES 2013-2014
Table 2. Nutrient Intakes from Food and Beverages: Mean Amounts Consumed per Individual,by Race/Ethnicity and Age, in the United States, 2013-2014 (continued)
Race/ethnicityand age
Ribo-flavin Niacin Vitamin B6
Folicacid
Foodfolate
Folate(DFE) Choline Vitamin B12
AddedVitamin B12
(years) mg (SE) mg (SE) mg (SE) µg (SE) µg (SE) µg (SE) mg (SE) µg (SE) µg (SE)
Non-Hispanic White:2 - 5.............. 1.71 (0.066) 14.8 (0.41) 1.31 (0.036) 166 (9.0) 125 (7.9) 407 (17.6) 197 (5.8) 3.81 (0.131) 0.86 (0.095)6 - 11.............. 2.09 (0.051) 20.9 (0.82) 1.68 (0.046) 216 (14.0) 152 (6.4) 519 (25.9) 247 (8.0) 4.56 (0.155) 1.07 (0.126)
12 - 19.............. 2.32 (0.094) 27.7 (1.11) 2.26 (0.105) 211 (17.1) 167 (5.2) 526 (30.7) 286 (9.7) 5.76 (0.209) 1.95 (0.245)20 and over... 2.28 (0.029) 26.4 (0.33) 2.20 (0.038) 185 (5.7) 219 (3.2) 533 (10.4) 334 (4.9) 5.04 (0.082) 1.17 (0.059)
2 and over... 2.25 (0.027) 25.7 (0.35) 2.14 (0.037) 189 (5.6) 206 (3.0) 526 (9.9) 318 (4.1) 5.03 (0.079) 1.23 (0.073)
Non-Hispanic Black:2 - 5.............. 1.59 (0.067) 16.6 (0.43) 1.40 (0.052) 184 (19.0) 114 (7.6) 427 (30.1) 205 (15.2) 3.47 (0.150) 0.79 (0.140)6 - 11.............. 1.77 (0.071) 21.2 (0.88) 1.68 (0.107) 205 (9.6) 149 (4.3) 498 (19.2) 227 (12.0) 4.51 (0.281) 1.35 (0.200)
12 - 19.............. 1.74 (0.066) 23.1 (0.78) 1.70 (0.044) 248 (23.8) 160 (6.9) 581 (41.5) 257 (7.6) 4.07 (0.120) 0.85 (0.120)20 and over... 1.79 (0.034) 26.0 (0.54) 2.03 (0.053) 163 (3.7) 201 (5.3) 478 (10.9) 343 (9.5) 4.73 (0.204) 0.75 (0.050)
2 and over... 1.77 (0.023) 24.6 (0.42) 1.92 (0.043) 179 (3.7) 186 (3.5) 490 (7.8) 313 (7.7) 4.55 (0.149) 0.82 (0.040)
Non-Hispanic Asian1:2 - 5.............. 1.76*(0.146) 16.4* (1.98) 1.58*(0.200) 197* (23.1) 126* (14.1) 460* (49.3) 238* (25.0) 5.11*(0.700) 1.11*(0.164)6 - 11.............. 1.93 (0.092) 20.1 (1.00) 1.67 (0.102) 201 (23.4) 174 (18.6) 516 (41.8) 291 (42.2) 5.03 (0.363) 1.07*(0.352)
12 - 19.............. 2.06 (0.214) 26.3 (2.86) 2.15 (0.231) 226 (23.6) 200 (20.8) 585 (48.9) 310 (24.0) 4.52 (0.719) 0.89*(0.392)20 and over... 1.77 (0.048) 24.5 (0.61) 2.05 (0.058) 160 (5.7) 251 (9.8) 523 (13.0) 329 (9.2) 4.02 (0.180) 0.59 (0.109)
2 and over... 1.81 (0.055) 24.0 (0.65) 2.01 (0.058) 172 (6.6) 234 (9.5) 526 (14.2) 320 (11.0) 4.20 (0.149) 0.68 (0.117)
Hispanic:2 - 5.............. 1.82 (0.064) 16.4 (0.76) 1.49 (0.082) 179 (13.0) 144 (4.0) 449 (22.8) 231 (8.9) 4.25 (0.192) 1.14 (0.113)6 - 11.............. 1.94 (0.075) 21.5 (0.63) 1.85 (0.073) 211 (10.1) 162 (7.3) 520 (21.1) 252 (9.6) 5.05 (0.257) 1.44 (0.126)
12 - 19.............. 1.93 (0.079) 24.9 (1.15) 1.94 (0.085) 215 (12.5) 194 (9.5) 559 (29.4) 295 (15.7) 4.89 (0.158) 1.11 (0.118)20 and over... 2.14 (0.090) 27.5 (0.99) 2.36 (0.150) 172 (7.6) 249 (8.4) 541 (19.0) 360 (7.6) 4.87 (0.244) 1.17 (0.232)
2 and over... 2.06 (0.074) 25.6 (0.80) 2.17 (0.111) 183 (6.9) 223 (7.2) 534 (17.9) 328 (7.5) 4.85 (0.164) 1.19 (0.146)

DATA SOURCE: What We Eat in America, NHANES 2013-2014, individuals 2 years and over (excluding breast-fed children), day 1. Available: www.ars.usda.gov/nea/bhnrc/fsrg.Page 4 of 9
What We Eat in America, NHANES 2013-2014
Table 2. Nutrient Intakes from Food and Beverages: Mean Amounts Consumed per Individual,by Race/Ethnicity and Age, in the United States, 2013-2014 (continued)
Race/ethnicityand age Vitamin C Vitamin D
Vitamin E(alpha-
tocopherol) Added
Vitamin E Vitamin K Calcium Phosphorus Magnesium
(years) mg (SE) µg (SE) mg (SE) mg (SE) µg (SE) mg (SE) mg (SE) mg (SE)
Non-Hispanic White:2 - 5.............. 70.6 (5.44) 5.8 (0.35) 5.5 (0.34) 0.7 (0.17) 49.2 (3.47) 913 (38.6) 1035 (39.0) 194 (7.4)6 - 11.............. 69.3 (2.94) 5.7 (0.15) 7.4 (0.32) 0.8 (0.19) 77.1 (11.06) 1162 (36.8) 1322 (34.4) 234 (8.5)
12 - 19.............. 63.2 (3.87) 5.0 (0.23) 8.0 (0.94) 1.0* (0.51) 83.3 (7.35) 1051 (42.4) 1378 (38.9) 256 (6.5)20 and over... 76.1 (1.66) 5.0 (0.20) 9.7 (0.19) 1.1 (0.08) 123.7 (4.51) 997 (16.1) 1410 (12.7) 307 (4.2)
2 and over... 74.2 (1.17) 5.1 (0.17) 9.2 (0.16) 1.0 (0.06) 113.7 (3.87) 1010 (14.5) 1386 (12.4) 293 (4.1)
Non-Hispanic Black:2 - 5.............. 83.3 (6.55) 4.8 (0.32) 6.3 (0.29) 0.6* (0.31) 56.0 (7.33) 788 (44.4) 984 (55.5) 187 (10.0)6 - 11.............. 77.8 (5.74) 4.5 (0.39) 6.7 (0.22) 0.3 (0.08) 70.8 (9.58) 886 (29.4) 1161 (37.0) 210 (5.4)
12 - 19.............. 77.4 (4.69) 3.7 (0.22) 8.2 (0.41) 0.3 (0.07) 79.6 (6.25) 902 (45.7) 1246 (50.5) 237 (8.6)20 and over... 82.2 (3.75) 4.0 (0.15) 9.1 (0.43) 0.7 (0.13) 124.8 (6.26) 821 (19.3) 1306 (27.9) 278 (5.5)
2 and over... 81.2 (3.07) 4.1 (0.10) 8.6 (0.34) 0.6 (0.10) 109.9 (5.64) 836 (17.8) 1267 (21.3) 261 (3.9)
Non-Hispanic Asian1:2 - 5.............. 52.3*(10.96) 8.4* (1.75) 6.0* (0.85) 0.5* (0.25) 52.5* (4.88) 934* (90.0) 1122*(101.7) 199* (19.3)6 - 11.............. 73.0 (9.94) 6.7 (0.65) 6.7 (0.34) 0.7* (0.25) 74.5 (11.88) 1015 (72.9) 1268 (87.1) 247 (17.6)
12 - 19.............. 92.7 (20.81) 5.4 (0.97) 8.9 (1.08) 0.8* (0.45) 116.0 (18.55) 972 (97.4) 1332 (101.5) 294 (24.5)20 and over... 88.1 (4.97) 4.5 (0.27) 8.3 (0.31) 0.6 (0.18) 163.8 (16.13) 729 (26.1) 1228 (30.1) 308 (8.1)
2 and over... 85.9 (4.66) 5.0 (0.27) 8.1 (0.31) 0.6 (0.16) 146.9 (12.74) 786 (27.1) 1237 (30.3) 297 (8.4)
Hispanic:2 - 5.............. 88.1 (7.33) 6.4 (0.43) 5.3 (0.21) 0.3 (0.08) 51.3 (4.28) 1074 (46.4) 1158 (40.4) 205 (5.4)6 - 11.............. 80.9 (5.73) 5.3 (0.29) 7.1 (0.37) 0.5 (0.14) 63.4 (5.44) 1016 (42.0) 1302 (47.9) 239 (9.0)
12 - 19.............. 77.6 (3.62) 5.1 (0.28) 7.9 (0.56) 0.6* (0.30) 74.4 (6.95) 1031 (37.4) 1396 (58.2) 257 (10.6)20 and over... 88.6 (5.73) 4.5 (0.20) 8.6 (0.36) 0.5 (0.12) 109.9 (8.08) 1020 (25.3) 1482 (33.5) 318 (7.5)
2 and over... 86.0 (4.46) 4.8 (0.16) 8.1 (0.27) 0.5 (0.10) 95.0 (5.98) 1025 (21.4) 1425 (31.4) 291 (7.0)

DATA SOURCE: What We Eat in America, NHANES 2013-2014, individuals 2 years and over (excluding breast-fed children), day 1. Available: www.ars.usda.gov/nea/bhnrc/fsrg.Page 5 of 9
What We Eat in America, NHANES 2013-2014
Table 2. Nutrient Intakes from Food and Beverages: Mean Amounts Consumed per Individual,by Race/Ethnicity and Age, in the United States, 2013-2014 (continued)
Race/ethnicityand age Iron Zinc Copper Selenium Potassium Sodium Caffeine Theobromine Alcohol
(years) mg (SE) mg (SE) mg (SE) µg (SE) mg (SE) mg (SE) mg (SE) mg (SE) g (SE)
Non-Hispanic White:2 - 5.............. 10.8 (0.51) 7.7 (0.17) 0.7 (0.03) 67.1 (2.51) 1876 (83.5) 2119 (56.4) 5.0 (0.66) 41.4 (7.12) -- --6 - 11.............. 14.1 (0.43) 9.8 (0.26) 0.9 (0.04) 95.9 (3.17) 2147 (58.6) 2995 (87.4) 16.5 (3.13) 59.4 (5.49) -- --
12 - 19.............. 14.8 (0.49) 11.7 (0.47) 1.0 (0.03) 109.6 (4.10) 2311 (53.0) 3408 (105.6) 65.4 (6.62) 39.3 (3.83) -- --20 and over... 14.5 (0.18) 11.3 (0.11) 1.2 (0.02) 115.3 (0.66) 2697 (33.8) 3505 (31.2) 195.1 (8.17) 43.6 (2.32) 12.1 (1.19)
2 and over... 14.4 (0.18) 11.1 (0.12) 1.2 (0.02) 111.5 (0.91) 2590 (34.3) 3407 (30.3) 163.0 (8.80) 44.1 (1.86) -- --
Non-Hispanic Black:2 - 5.............. 11.6 (0.55) 8.0 (0.48) 0.7 (0.04) 75.6 (5.52) 1842 (88.9) 2401 (131.0) 5.4 (0.75) 34.8 (8.16) -- --6 - 11.............. 14.6 (0.63) 9.2 (0.30) 0.8 (0.03) 94.1 (3.64) 1933 (71.4) 3020 (123.1) 12.5 (1.82) 47.9 (9.68) -- --
12 - 19.............. 14.1 (0.43) 10.2 (0.26) 0.9 (0.04) 104.8 (5.58) 2069 (72.1) 3332 (162.3) 24.0 (3.50) 27.6 (3.16) -- --20 and over... 14.1 (0.23) 10.5 (0.28) 1.1 (0.03) 119.1 (2.79) 2449 (43.6) 3513 (77.4) 79.3 (5.63) 34.1 (2.48) 11.6 (1.25)
2 and over... 14.0 (0.17) 10.2 (0.18) 1.1 (0.02) 112.5 (2.35) 2317 (35.1) 3381 (67.0) 61.6 (4.03) 34.6 (1.09) -- --
Non-Hispanic Asian1:2 - 5.............. 11.6* (0.74) 9.3* (1.40) 0.8* (0.06) 88.9*(10.03) 1965*(283.1) 2286*(170.1) 4.2* (1.33) 64.0*(28.23) -- --6 - 11.............. 13.6 (0.63) 11.5 (1.19) 1.2 (0.10) 106.0 (10.79) 2325 (178.2) 3075 (191.9) 6.1 (1.22) 59.9 (9.38) -- --
12 - 19.............. 14.4 (1.52) 10.6 (0.88) 1.2 (0.10) 131.1 (14.14) 2543 (183.9) 3617 (198.8) 30.4 (5.12) 38.9 (11.32) -- --20 and over... 13.4 (0.27) 10.2 (0.26) 1.4 (0.04) 117.7 (2.88) 2574 (56.4) 3645 (125.4) 107.7 (8.73) 25.6 (1.41) 6.0 (1.27)
2 and over... 13.5 (0.34) 10.3 (0.33) 1.3 (0.04) 117.0 (3.58) 2525 (53.2) 3538 (106.9) 87.1 (6.70) 31.4 (2.99) -- --
Hispanic:2 - 5.............. 12.1 (0.60) 8.5 (0.30) 0.8 (0.02) 79.5 (2.74) 2084 (69.6) 2400 (93.7) 6.5 (1.46) 39.2 (6.27) -- --6 - 11.............. 14.5 (0.54) 10.0 (0.49) 1.0 (0.03) 94.9 (2.82) 2267 (73.8) 2964 (112.3) 12.3 (1.55) 42.6 (5.63) -- --
12 - 19.............. 15.2 (0.77) 11.0 (0.66) 1.0 (0.05) 113.2 (5.57) 2357 (90.0) 3494 (141.3) 30.3 (3.96) 56.7 (13.06) -- --20 and over... 15.1 (0.32) 11.6 (0.27) 1.2 (0.03) 121.3 (2.55) 2695 (70.2) 3603 (70.3) 121.0 (5.96) 28.2 (2.08) 8.0 (1.07)
2 and over... 14.8 (0.27) 11.1 (0.25) 1.1 (0.03) 114.0 (2.49) 2551 (59.5) 3424 (59.7) 86.6 (4.31) 34.9 (1.81) -- --

DATA SOURCE: What We Eat in America, NHANES 2013-2014, individuals 2 years and over (excluding breast-fed children), day 1. Available: www.ars.usda.gov/nea/bhnrc/fsrg.Page 6 of 9
What We Eat in America, NHANES 2013-2014
Table 2. Nutrient Intakes from Food and Beverages: Mean Amounts Consumed per Individual,by Race/Ethnicity and Age, in the United States, 2013-2014 (continued)
Race/ethnicityand age
SFA4:0
SFA6:0
SFA8:0
SFA10:0
SFA12:0
SFA14:0
SFA16:0
SFA18:0
(years) g (SE) g (SE) g (SE) g (SE) g (SE) g (SE) g (SE) g (SE)
Non-Hispanic White:2 - 5.............. 0.49 (0.040) 0.31 (0.025) 0.24 (0.022) 0.46 (0.033) 0.65 (0.067) 1.83 (0.124) 9.49 (0.256) 4.31 (0.170)6 - 11.............. 0.66 (0.040) 0.43 (0.025) 0.35 (0.020) 0.66 (0.033) 1.25 (0.194) 2.72 (0.120) 14.51 (0.459) 6.60 (0.235)
12 - 19.............. 0.55 (0.051) 0.34 (0.029) 0.26 (0.017) 0.53 (0.041) 0.81 (0.066) 2.32 (0.168) 14.05 (0.466) 6.24 (0.213)20 and over... 0.56 (0.015) 0.35 (0.008) 0.28 (0.007) 0.56 (0.014) 0.88 (0.027) 2.36 (0.047) 14.61 (0.187) 6.57 (0.078)
2 and over... 0.56 (0.013) 0.35 (0.008) 0.28 (0.007) 0.56 (0.012) 0.89 (0.030) 2.36 (0.046) 14.35 (0.161) 6.45 (0.077)
Non-Hispanic Black:2 - 5.............. 0.39 (0.047) 0.26 (0.033) 0.34 (0.059) 0.46 (0.040) 0.72 (0.087) 1.64 (0.178) 10.67 (0.833) 4.47 (0.406)6 - 11.............. 0.42 (0.029) 0.26 (0.017) 0.21 (0.015) 0.42 (0.028) 0.65 (0.064) 1.87 (0.121) 12.48 (0.574) 5.40 (0.255)
12 - 19.............. 0.44 (0.041) 0.28 (0.021) 0.24 (0.011) 0.46 (0.027) 0.91 (0.075) 2.09 (0.117) 14.47 (0.834) 6.13 (0.330)20 and over... 0.41 (0.021) 0.26 (0.013) 0.24 (0.012) 0.44 (0.021) 0.90 (0.065) 2.02 (0.083) 14.96 (0.335) 6.63 (0.177)
2 and over... 0.41 (0.019) 0.26 (0.011) 0.24 (0.008) 0.44 (0.016) 0.87 (0.051) 1.99 (0.066) 14.42 (0.294) 6.33 (0.144)
Non-Hispanic Asian1:2 - 5.............. 0.54* (0.064) 0.36* (0.052) 0.34* (0.046) 0.54* (0.054) 1.22* (0.470) 2.10* (0.229) 10.70* (0.873) 4.61* (0.497)6 - 11.............. 0.46 (0.051) 0.28 (0.030) 0.24 (0.023) 0.42 (0.040) 0.67 (0.102) 1.85 (0.174) 11.83 (1.083) 5.31 (0.636)
12 - 19.............. 0.47 (0.050) 0.29 (0.033) 0.23 (0.026) 0.44 (0.049) 0.71 (0.094) 1.83 (0.173) 12.62 (0.791) 5.21 (0.339)20 and over... 0.25 (0.015) 0.17 (0.010) 0.16 (0.007) 0.30 (0.013) 0.63 (0.054) 1.32 (0.055) 10.91 (0.440) 4.66 (0.198)
2 and over... 0.30 (0.016) 0.20 (0.010) 0.18 (0.008) 0.33 (0.015) 0.66 (0.060) 1.45 (0.057) 11.16 (0.373) 4.77 (0.174)
Hispanic:2 - 5.............. 0.52 (0.025) 0.35 (0.021) 0.30 (0.033) 0.52 (0.037) 0.78 (0.073) 2.04 (0.124) 11.27 (0.545) 4.83 (0.220)6 - 11.............. 0.52 (0.042) 0.33 (0.031) 0.29 (0.032) 0.53 (0.047) 0.91 (0.132) 2.23 (0.168) 13.21 (0.819) 5.78 (0.353)
12 - 19.............. 0.49 (0.027) 0.31 (0.022) 0.26 (0.018) 0.50 (0.034) 0.80 (0.089) 2.22 (0.136) 14.75 (0.779) 6.56 (0.393)20 and over... 0.49 (0.019) 0.30 (0.015) 0.25 (0.011) 0.50 (0.020) 0.76 (0.044) 2.24 (0.079) 14.75 (0.402) 6.47 (0.158)
2 and over... 0.49 (0.016) 0.31 (0.013) 0.26 (0.009) 0.50 (0.018) 0.79 (0.043) 2.22 (0.060) 14.32 (0.363) 6.28 (0.144)

DATA SOURCE: What We Eat in America, NHANES 2013-2014, individuals 2 years and over (excluding breast-fed children), day 1. Available: www.ars.usda.gov/nea/bhnrc/fsrg.Page 7 of 9
What We Eat in America, NHANES 2013-2014
Table 2. Nutrient Intakes from Food and Beverages: Mean Amounts Consumed per Individual,by Race/Ethnicity and Age, in the United States, 2013-2014 (continued)
Race/ethnicityand age
MFA16:1
MFA18:1
MFA20:1
MFA22:1
PFA18:2
PFA18:3
PFA18:4
(years) g (SE) g (SE) g (SE) g (SE) g (SE) g (SE) g (SE)
Non-Hispanic White:2 - 5.............. 0.59 (0.026) 15.26 (0.493) 0.18 (0.011) 0.01 (0.001) 9.72 (0.320) 0.97 (0.023) #6 - 11.............. 0.91 (0.052) 22.15 (0.879) 0.25 (0.012) 0.02 (0.001) 13.66 (0.542) 1.36 (0.040) 0.01 (0.002)
12 - 19.............. 1.01 (0.051) 23.06 (0.849) 0.27 (0.021) 0.02 (0.002) 15.25 (0.784) 1.51 (0.073) 0.01 (0.001)20 and over... 1.05 (0.018) 26.03 (0.367) 0.33 (0.011) 0.03 (0.002) 17.17 (0.309) 1.81 (0.043) 0.01 (0.001)
2 and over... 1.02 (0.019) 25.06 (0.377) 0.31 (0.009) 0.03 (0.002) 16.45 (0.253) 1.72 (0.039) 0.01 (0.001)
Non-Hispanic Black:2 - 5.............. 0.72 (0.059) 18.47 (1.021) 0.22 (0.015) 0.02 (0.003) 12.60 (0.858) 1.18 (0.083) 0.01 (0.002)6 - 11.............. 0.90 (0.039) 20.66 (0.937) 0.26 (0.016) 0.02 (0.002) 14.16 (0.708) 1.30 (0.079) 0.01 (0.002)
12 - 19.............. 1.05 (0.063) 24.78 (1.380) 0.32 (0.021) 0.02 (0.002) 17.78 (1.229) 1.58 (0.117) 0.01 (0.001)20 and over... 1.21 (0.037) 27.83 (0.998) 0.37 (0.011) 0.04 (0.003) 18.39 (0.795) 1.85 (0.086) 0.01 (0.001)
2 and over... 1.13 (0.032) 26.23 (0.841) 0.35 (0.010) 0.03 (0.002) 17.59 (0.635) 1.73 (0.071) 0.01 (0.001)
Non-Hispanic Asian1:2 - 5.............. 0.55* (0.041) 16.42* (1.693) 0.17* (0.042) 0.01* (0.004) 9.58* (0.874) 1.08* (0.094) 0.01* (0.005)6 - 11.............. 0.84 (0.139) 19.73 (2.014) 0.22 (0.023) 0.01* (0.004) 12.19 (0.977) 1.42 (0.151) 0.01* (0.006)
12 - 19.............. 0.82 (0.054) 23.06 (1.749) 0.27 (0.019) 0.02 (0.003) 16.41 (1.205) 1.70 (0.119) 0.01* (0.003)20 and over... 0.85 (0.049) 22.15 (0.739) 0.29 (0.013) 0.03 (0.007) 14.53 (0.550) 1.65 (0.075) 0.01 (0.003)
2 and over... 0.83 (0.045) 21.81 (0.741) 0.28 (0.010) 0.03 (0.005) 14.33 (0.529) 1.61 (0.070) 0.01 (0.002)
Hispanic:2 - 5.............. 0.69 (0.033) 16.69 (0.769) 0.20 (0.026) 0.01 (0.002) 10.98 (0.631) 1.20 (0.108) #6 - 11.............. 0.91 (0.070) 20.93 (0.970) 0.23 (0.012) 0.01 (0.001) 13.76 (0.535) 1.39 (0.060) 0.01 (0.001)
12 - 19.............. 1.00 (0.053) 24.94 (1.368) 0.30 (0.019) 0.02 (0.002) 16.73 (0.912) 1.67 (0.115) 0.01 (0.001)20 and over... 1.14 (0.041) 25.68 (0.680) 0.31 (0.012) 0.02 (0.001) 17.19 (0.564) 1.87 (0.070) 0.01 (0.001)
2 and over... 1.06 (0.031) 24.35 (0.590) 0.29 (0.009) 0.02 (0.001) 16.26 (0.466) 1.73 (0.062) 0.01 (0.001)

DATA SOURCE: What We Eat in America, NHANES 2013-2014, individuals 2 years and over (excluding breast-fed children), day 1. Available: www.ars.usda.gov/nea/bhnrc/fsrg.Page 8 of 9
What We Eat in America, NHANES 2013-2014
Table 2. Nutrient Intakes from Food and Beverages: Mean Amounts Consumed per Individual,by Race/Ethnicity and Age, in the United States, 2013-2014 (continued)
Race/ethnicityand age
PFA20:4
PFA20:5
PFA22:5
PFA22:6
(years) g (SE) g (SE) g (SE) g (SE)
Non-Hispanic White:2 - 5.............. 0.07 (0.004) 0.02* (0.006) 0.01 (0.002) 0.03* (0.013)6 - 11.............. 0.10 (0.008) 0.01 (0.001) 0.01 (0.001) 0.02 (0.002)
12 - 19.............. 0.13 (0.011) 0.01 (0.001) 0.02 (0.001) 0.02 (0.002)20 and over... 0.15 (0.003) 0.03 (0.003) 0.02 (0.001) 0.06 (0.005)
2 and over... 0.14 (0.003) 0.03 (0.002) 0.02 (0.001) 0.05 (0.005)
Non-Hispanic Black:2 - 5.............. 0.10 (0.012) 0.01 (0.001) 0.01 (0.001) 0.02 (0.003)6 - 11.............. 0.12 (0.011) 0.01 (0.003) 0.02 (0.002) 0.03 (0.005)
12 - 19.............. 0.15 (0.010) 0.02 (0.005) 0.02 (0.001) 0.03 (0.005)20 and over... 0.19 (0.006) 0.04 (0.004) 0.03 (0.002) 0.08 (0.007)
2 and over... 0.17 (0.006) 0.03 (0.003) 0.03 (0.001) 0.07 (0.006)
Non-Hispanic Asian1:2 - 5.............. 0.09* (0.012) 0.04* (0.015) 0.02* (0.007) 0.09* (0.034)6 - 11.............. 0.10 (0.021) 0.02* (0.008) 0.02 (0.004) 0.05* (0.021)
12 - 19.............. 0.14 (0.012) 0.02 (0.005) 0.02 (0.002) 0.05* (0.020)20 and over... 0.15 (0.009) 0.06 (0.008) 0.03 (0.001) 0.11 (0.012)
2 and over... 0.14 (0.008) 0.05 (0.007) 0.03 (0.001) 0.10 (0.010)
Hispanic:2 - 5.............. 0.10 (0.005) 0.01 (0.001) 0.01 (0.001) 0.02 (0.003)6 - 11.............. 0.11 (0.006) 0.01 (0.002) 0.02 (0.001) 0.03 (0.004)
12 - 19.............. 0.15 (0.009) 0.02* (0.007) 0.02 (0.003) 0.05 (0.010)20 and over... 0.18 (0.006) 0.02 (0.003) 0.03 (0.001) 0.06 (0.005)
2 and over... 0.16 (0.005) 0.02 (0.003) 0.02 (0.001) 0.05 (0.005)

What We Eat in America, NHANES 2013-2014
Page 9 of 9Page 9 of 9
Symbol Legend
* Indicates an estimate that may be less statistically reliable than estimates that are not flagged. The rules for flagging estimated means are as follows:
Mean: An estimated mean is flagged when based on a sample size of less than 30 times the variance inflation factor (VIF), where the VIF represents a broadly calculated average designeffect, or when the relative standard error is greater than 30 percent. The VIF used in this table is 1.98.
# Indicates a non-zero value too small to report.
Footnotes
1 A new sampling methodology was implemented for NHANES 2011-2012 to oversample non-Hispanic non-black Asians in addition to the ongoing oversample of Hispanics, non-Hispanicblacks, low-income whites/others, and whites/others 80+ years.
Abbreviations
SE = standard error; RAE = retinol activity equivalents; DFE = dietary folate equivalents. SFA = saturated fatty acid; MFA = monounsaturated fatty acid; PFA = polyunsaturated fatty acid.
Notes Applicable to All Tables in Series: What We Eat in America, NHANES 2013-2014
Sample weights designed for dietary analysis were used to allow estimates representative of the U. S. population for the years of collection.
The statistics in this table are estimated from Day 1 dietary recall interviews conducted in the What We Eat in America, National Health and Nutrition Examination Survey (NHANES) 2013-2014.The 24-hour dietary recalls were conducted in-person, by trained interviewers, using the USDA 5-step Automated Multiple-Pass Method. Food intakes were coded and nutrient values weredetermined using the USDA Food and Nutrient Database for Dietary Studies 2013-2014 www.ars.usda.gov/nea/bhnrc/fsrg.
Intakes of nutrients and other dietary components are based on the consumption of food and beverages, including water, and do not include intake from supplements or medications.
The table includes data from individuals 2 years and over. Breast-fed children were excluded because breast milk was not quantified in dietary recall interviews.
Although alcohol data are collected for all individuals, estimates are not presented for age groups under 20 years due to extreme variability and/or inadequate sample size.
Suggested Citation
U.S. Department of Agriculture, Agricultural Research Service. 2016. Nutrient Intakes from Food and Beverages: Mean Amounts Consumed per Individual, by Race/Ethnicity and Age, What WeEat in America, NHANES 2013-2014.

DATA SOURCE: What We Eat in America, NHANES 2013-2014, individuals 2 years and over (excluding breast-fed children), day 1. Available: www.ars.usda.gov/nea/bhnrc/fsrg.Page 1 of 9
What We Eat in America, NHANES 2013-2014
Table 3. Nutrient Intakes from Food and Beverages: Mean Amounts Consumed per Individual,by Family Income (in Dollars) and Age, in the United States, 2013-2014
Family incomein dollarsand age
Samplesize Energy Protein
Carbo-hydrate
Totalsugars
Dietaryfiber
Totalfat
Saturatedfat
Mono-unsaturated
fat
Poly-unsaturated
fat
(years) kcal (SE) g (SE) g (SE) g (SE) g (SE) g (SE) g (SE) g (SE) g (SE)
$0 - $24,999:2 - 5.............. 241 1500 (46.6) 53.3 (2.32) 200 (4.1) 96 (2.5) 11.3 (0.38) 56.2 (2.64) 20.0 (1.16) 18.5 (0.84) 12.3 (0.68)6 - 11.............. 330 1819 (36.1) 66.4 (2.43) 245 (5.2) 112 (4.3) 14.6 (0.58) 66.3 (1.81) 23.4 (0.88) 22.3 (0.56) 14.3 (0.45)
12 - 19.............. 398 2074 (78.9) 79.1 (6.22) 266 (9.9) 122 (6.8) 14.9 (1.13) 79.1 (4.18) 25.7 (1.27) 27.1 (1.61) 18.4 (1.10)20 and over... 1550 2129 (33.6) 79.2 (1.26) 261 (4.7) 123 (3.1) 15.8 (0.53) 80.5 (1.19) 26.0 (0.40) 28.0 (0.43) 18.9 (0.48)
2 and over... 2519 2061 (26.1) 76.6 (0.96) 257 (4.0) 121 (2.6) 15.3 (0.48) 77.8 (0.94) 25.4 (0.34) 26.9 (0.32) 18.1 (0.41)
$25,000 - $74,999:2 - 5.............. 255 1435 (58.6) 52.1 (3.40) 197 (9.0) 91 (5.9) 11.6 (0.52) 51.1 (1.87) 18.4 (0.61) 16.8 (0.59) 11.0 (0.68)6 - 11.............. 400 1920 (59.1) 66.6 (1.74) 253 (8.4) 115 (4.5) 13.9 (0.79) 73.8 (2.97) 26.7 (1.62) 24.1 (0.89) 16.1 (0.66)
12 - 19.............. 478 1973 (51.7) 77.0 (2.18) 250 (9.0) 116 (6.6) 14.2 (0.62) 75.5 (2.28) 25.2 (1.01) 25.6 (1.07) 17.4 (0.51)20 and over... 1882 2151 (29.7) 83.4 (1.00) 254 (3.7) 114 (2.9) 16.5 (0.29) 83.3 (1.37) 27.1 (0.46) 28.8 (0.53) 19.4 (0.44)
2 and over... 3015 2081 (29.6) 79.9 (1.08) 251 (3.5) 113 (2.5) 15.9 (0.23) 80.2 (1.37) 26.5 (0.48) 27.5 (0.55) 18.5 (0.36)
$75,000 and higher:2 - 5.............. 153 1515 (33.8) 54.0 (1.90) 207 (5.9) 100 (4.4) 12.2 (0.63) 54.9 (1.58) 20.1 (0.76) 17.7 (0.58) 11.9 (0.59)6 - 11.............. 270 2017 (68.7) 69.3 (2.44) 272 (10.5) 128 (6.0) 15.2 (0.51) 75.5 (3.18) 28.1 (0.97) 24.6 (1.14) 15.8 (1.13)
12 - 19.............. 334 2075 (80.0) 79.9 (4.53) 267 (11.2) 124 (4.6) 14.6 (0.62) 78.1 (3.43) 26.5 (0.93) 26.0 (1.37) 17.9 (1.43)20 and over... 1303 2144 (33.8) 86.8 (1.27) 246 (4.1) 100 (2.0) 18.6 (0.38) 84.2 (1.83) 26.8 (0.63) 29.4 (0.65) 20.0 (0.52)
2 and over... 2060 2096 (25.7) 83.0 (1.08) 249 (3.0) 106 (1.6) 17.5 (0.30) 81.4 (1.56) 26.6 (0.55) 28.1 (0.57) 19.1 (0.41)
All Individuals1:2 - 5.............. 676 1481 (30.6) 53.0 (1.73) 201 (4.2) 97 (2.6) 11.6 (0.40) 53.8 (1.23) 19.4 (0.55) 17.6 (0.41) 11.7 (0.32)6 - 11.............. 1047 1921 (35.4) 67.5 (1.30) 256 (4.8) 117 (2.4) 14.5 (0.51) 72.3 (1.72) 26.3 (0.84) 23.8 (0.56) 15.4 (0.38)
12 - 19.............. 1296 2038 (31.1) 79.0 (2.14) 260 (4.8) 120 (2.6) 14.5 (0.38) 77.6 (1.61) 26.0 (0.49) 26.2 (0.66) 17.9 (0.68)20 and over... 5047 2141 (18.7) 83.6 (0.73) 253 (2.1) 111 (1.4) 17.1 (0.27) 82.9 (0.89) 26.7 (0.27) 28.8 (0.31) 19.5 (0.31)
2 and over... 8066 2079 (17.2) 80.3 (0.74) 251 (2.1) 112 (1.3) 16.3 (0.21) 80.0 (0.79) 26.3 (0.24) 27.6 (0.30) 18.6 (0.26)

DATA SOURCE: What We Eat in America, NHANES 2013-2014, individuals 2 years and over (excluding breast-fed children), day 1. Available: www.ars.usda.gov/nea/bhnrc/fsrg.Page 2 of 9
What We Eat in America, NHANES 2013-2014
Table 3. Nutrient Intakes from Food and Beverages: Mean Amounts Consumed per Individual,by Family Income (in Dollars) and Age, in the United States, 2013-2014 (continued)
Family incomein dollarsand age
Choles-terol Retinol
Vitamin A(RAE)
Alpha-carotene
Beta-carotene
Beta-crypto-xanthin Lycopene
Lutein +zeaxanthin Thiamin
(years) mg (SE) µg (SE) µg (SE) µg (SE) µg (SE) µg (SE) µg (SE) µg (SE) mg (SE)
$0 - $24,999:2 - 5.............. 195 (14.8) 418 (23.3) 506 (23.9) 216 (54.7) 932 (129.8) 65 (9.0) 3243 (495.1) 616 (66.7) 1.23 (0.039)6 - 11.............. 196 (6.6) 494 (30.8) 611 (36.0) 244 (46.2) 1247 (173.2) 68 (12.9) 4192 (427.6) 925 (149.6) 1.57 (0.064)
12 - 19.............. 270 (27.1) 374 (14.4) 485 (18.1) 240 (43.4) 1186 (135.6) 70 (6.2) 4737 (577.2) 932 (102.6) 1.53 (0.072)20 and over... 282 (6.0) 436 (18.9) 614 (23.8) 324 (28.2) 1949 (86.4) 68 (4.5) 4355 (306.9) 1448 (152.1) 1.58 (0.039)
2 and over... 269 (4.8) 433 (13.9) 593 (18.6) 301 (25.0) 1748 (81.6) 68 (3.7) 4318 (266.2) 1299 (115.3) 1.55 (0.026)
$25,000 - $74,999:2 - 5.............. 168 (11.8) 416 (23.3) 540 (30.2) 319* (97.7) 1299 (178.9) 62 (9.1) 2277 (234.5) 606 (45.9) 1.19 (0.067)6 - 11.............. 220 (14.1) 533 (42.7) 632 (41.1) 220 (30.7) 1053 (123.0) 72 (8.2) 4058 (299.9) 677 (59.4) 1.56 (0.047)
12 - 19.............. 248 (9.0) 465 (25.9) 579 (41.2) 264*(139.4) 1221*(398.6) 63 (9.8) 4535 (408.6) 898 (176.6) 1.69 (0.083)20 and over... 302 (8.1) 424 (19.5) 612 (19.7) 347 (19.7) 2047 (85.6) 89 (6.9) 5016 (220.3) 1569 (118.2) 1.64 (0.029)
2 and over... 283 (7.0) 437 (16.2) 607 (17.6) 327 (25.8) 1847 (93.0) 84 (5.7) 4762 (191.3) 1383 (95.4) 1.62 (0.027)
$75,000 and higher:2 - 5.............. 161 (14.2) 479 (19.4) 595 (34.8) 283* (92.3) 1231 (232.7) 66 (15.5) 3695 (722.2) 577 (50.9) 1.33 (0.048)6 - 11.............. 223 (15.5) 545 (13.3) 687 (18.1) 327 (76.9) 1513 (216.0) 86 (10.4) 4138 (516.0) 1117 (249.2) 1.64 (0.071)
12 - 19.............. 239 (12.2) 485 (30.6) 644 (38.5) 397 (86.4) 1684 (208.0) 70 (11.9) 4701 (541.2) 1030 (178.6) 1.76 (0.111)20 and over... 291 (7.9) 429 (10.2) 676 (20.1) 491 (57.7) 2688 (186.6) 86 (4.7) 5663 (277.5) 1937 (111.0) 1.65 (0.027)
2 and over... 273 (5.4) 448 (9.0) 670 (16.5) 457 (46.8) 2403 (155.1) 83 (5.4) 5329 (209.0) 1698 (87.6) 1.64 (0.022)
All Individuals1:2 - 5.............. 173 (9.1) 440 (11.7) 548 (14.5) 271 (65.2) 1140 (117.8) 63 (6.4) 2989 (313.9) 590 (29.7) 1.25 (0.031)6 - 11.............. 216 (8.1) 531 (21.4) 653 (25.9) 274 (35.9) 1304 (113.1) 75 (5.5) 4090 (267.1) 911 (118.9) 1.60 (0.037)
12 - 19.............. 253 (8.7) 450 (12.0) 579 (18.8) 299 (63.2) 1375 (171.9) 67 (5.8) 4656 (256.4) 959 (80.5) 1.67 (0.043)20 and over... 293 (4.2) 428 (8.1) 637 (12.2) 398 (25.9) 2271 (89.2) 83 (3.1) 5021 (136.4) 1671 (74.3) 1.62 (0.018)
2 and over... 276 (3.7) 440 (6.8) 627 (11.5) 371 (22.8) 2037 (80.3) 79 (2.8) 4805 (121.3) 1477 (57.3) 1.61 (0.018)

DATA SOURCE: What We Eat in America, NHANES 2013-2014, individuals 2 years and over (excluding breast-fed children), day 1. Available: www.ars.usda.gov/nea/bhnrc/fsrg.Page 3 of 9
What We Eat in America, NHANES 2013-2014
Table 3. Nutrient Intakes from Food and Beverages: Mean Amounts Consumed per Individual,by Family Income (in Dollars) and Age, in the United States, 2013-2014 (continued)
Family incomein dollarsand age
Ribo-flavin Niacin Vitamin B6
Folicacid
Foodfolate
Folate(DFE) Choline Vitamin B12
AddedVitamin B12
(years) mg (SE) mg (SE) mg (SE) µg (SE) µg (SE) µg (SE) mg (SE) µg (SE) µg (SE)
$0 - $24,999:2 - 5.............. 1.66 (0.070) 15.9 (0.45) 1.38 (0.036) 165 (8.5) 124 (8.3) 405 (19.5) 220 (8.9) 3.82 (0.186) 0.91 (0.102)6 - 11.............. 1.93 (0.085) 20.9 (0.86) 1.79 (0.104) 210 (9.9) 153 (7.1) 510 (19.3) 235 (8.3) 5.04 (0.343) 1.56 (0.202)
12 - 19.............. 1.83 (0.088) 25.2 (2.03) 1.95 (0.184) 205 (18.1) 177 (11.2) 526 (38.3) 284 (20.0) 4.31 (0.210) 1.00 (0.195)20 and over... 2.07 (0.066) 25.2 (0.76) 2.08 (0.082) 180 (8.7) 209 (4.8) 515 (18.8) 326 (6.0) 4.74 (0.125) 1.07 (0.099)
2 and over... 2.01 (0.047) 24.3 (0.56) 2.00 (0.065) 185 (7.3) 196 (4.2) 510 (15.7) 308 (4.6) 4.66 (0.096) 1.09 (0.081)
$25,000 - $74,999:2 - 5.............. 1.63 (0.076) 15.0 (0.84) 1.35 (0.090) 161 (16.3) 132 (9.1) 405 (32.0) 204 (12.0) 3.77 (0.279) 0.88 (0.094)6 - 11.............. 1.98 (0.064) 21.0 (0.56) 1.71 (0.052) 202 (11.6) 152 (6.3) 495 (23.8) 251 (8.9) 4.67 (0.203) 1.08 (0.161)
12 - 19.............. 2.22 (0.175) 25.9 (1.49) 2.05 (0.158) 224 (23.4) 170 (6.0) 550 (41.4) 279 (8.1) 5.45 (0.421) 1.68 (0.428)20 and over... 2.17 (0.038) 27.0 (0.47) 2.24 (0.062) 180 (7.8) 220 (4.3) 525 (14.5) 340 (6.8) 5.01 (0.159) 1.18 (0.119)
2 and over... 2.13 (0.045) 25.9 (0.50) 2.14 (0.062) 185 (7.6) 205 (3.9) 520 (13.9) 320 (6.5) 4.97 (0.145) 1.21 (0.119)
$75,000 and higher:2 - 5.............. 1.81 (0.073) 15.9 (0.62) 1.40 (0.046) 188 (18.1) 132 (8.4) 450 (31.5) 203 (5.7) 3.93 (0.207) 0.96 (0.159)6 - 11.............. 2.04 (0.039) 21.0 (1.14) 1.67 (0.066) 210 (12.8) 163 (5.0) 520 (23.5) 254 (9.8) 4.50 (0.136) 1.04 (0.150)
12 - 19.............. 2.25 (0.104) 26.6 (1.88) 2.18 (0.139) 217 (27.9) 171 (4.4) 541 (47.6) 286 (13.7) 5.64 (0.358) 1.78 (0.295)20 and over... 2.27 (0.050) 26.7 (0.28) 2.24 (0.034) 178 (4.7) 239 (5.9) 541 (10.2) 346 (8.2) 5.04 (0.144) 1.05 (0.058)
2 and over... 2.23 (0.037) 25.7 (0.37) 2.14 (0.029) 186 (4.2) 219 (4.6) 535 (7.0) 325 (5.3) 5.01 (0.094) 1.13 (0.072)
All Individuals1:2 - 5.............. 1.71 (0.045) 15.5 (0.37) 1.37 (0.042) 172 (6.6) 129 (5.6) 422 (11.9) 209 (6.6) 3.87 (0.114) 0.92 (0.058)6 - 11.............. 2.00 (0.037) 21.1 (0.45) 1.72 (0.037) 213 (8.7) 155 (4.1) 517 (16.6) 248 (4.9) 4.73 (0.113) 1.21 (0.060)
12 - 19.............. 2.12 (0.071) 26.1 (0.76) 2.07 (0.069) 219 (11.8) 173 (4.1) 545 (20.8) 283 (6.8) 5.22 (0.156) 1.54 (0.160)20 and over... 2.18 (0.028) 26.5 (0.24) 2.20 (0.030) 179 (4.3) 224 (3.1) 528 (8.7) 339 (3.9) 4.95 (0.075) 1.10 (0.050)
2 and over... 2.13 (0.029) 25.4 (0.24) 2.11 (0.028) 186 (4.1) 208 (2.8) 524 (8.0) 319 (3.5) 4.91 (0.067) 1.15 (0.056)

DATA SOURCE: What We Eat in America, NHANES 2013-2014, individuals 2 years and over (excluding breast-fed children), day 1. Available: www.ars.usda.gov/nea/bhnrc/fsrg.Page 4 of 9
What We Eat in America, NHANES 2013-2014
Table 3. Nutrient Intakes from Food and Beverages: Mean Amounts Consumed per Individual,by Family Income (in Dollars) and Age, in the United States, 2013-2014 (continued)
Family incomein dollarsand age Vitamin C Vitamin D
Vitamin E(alpha-
tocopherol) Added
Vitamin E Vitamin K Calcium Phosphorus Magnesium
(years) mg (SE) µg (SE) mg (SE) mg (SE) µg (SE) mg (SE) mg (SE) mg (SE)
$0 - $24,999:2 - 5.............. 81.5 (6.97) 5.7 (0.35) 5.4 (0.21) 0.2 (0.06) 51.3 (5.59) 908 (67.0) 1031 (50.6) 188 (4.4)6 - 11.............. 74.7 (5.19) 5.5 (0.42) 6.8 (0.25) 0.5 (0.13) 73.8 (8.13) 1026 (51.1) 1258 (49.1) 233 (8.0)
12 - 19.............. 72.7 (5.21) 4.2 (0.21) 8.1 (0.62) 0.4* (0.16) 79.0 (5.30) 940 (27.5) 1313 (61.6) 253 (13.9)20 and over... 76.4 (3.30) 4.5 (0.11) 8.7 (0.29) 1.0 (0.18) 109.8 (4.99) 939 (22.3) 1335 (20.9) 286 (6.5)
2 and over... 76.1 (2.47) 4.6 (0.10) 8.3 (0.24) 0.8 (0.13) 100.0 (3.84) 944 (16.8) 1308 (14.9) 272 (5.7)
$25,000 - $74,999:2 - 5.............. 79.9 (6.61) 5.8 (0.53) 5.6 (0.32) 0.7 (0.18) 48.0 (3.93) 885 (39.9) 1011 (50.2) 196 (11.5)6 - 11.............. 67.1 (3.24) 5.4 (0.33) 7.0 (0.35) 0.6 (0.14) 63.2 (3.55) 1022 (42.0) 1264 (23.5) 220 (7.3)
12 - 19.............. 66.3 (5.17) 5.2 (0.30) 8.7 (1.44) 1.4* (0.77) 81.7 (12.52) 1008 (43.9) 1336 (42.0) 247 (10.4)20 and over... 79.1 (2.36) 4.5 (0.15) 9.2 (0.27) 1.0 (0.11) 116.9 (5.40) 962 (12.0) 1395 (17.6) 298 (5.0)
2 and over... 76.9 (1.87) 4.7 (0.12) 8.8 (0.28) 1.0 (0.14) 105.7 (4.49) 968 (10.6) 1360 (15.1) 282 (4.8)
$75,000 and higher:2 - 5.............. 70.2 (8.41) 5.6 (0.31) 5.9 (0.42) 0.7 (0.19) 51.0 (2.91) 991 (55.3) 1124 (46.4) 202 (7.7)6 - 11.............. 81.4 (2.86) 5.5 (0.23) 7.7 (0.45) 0.6 (0.14) 82.7 (11.57) 1172 (46.6) 1357 (34.9) 246 (6.0)
12 - 19.............. 69.8 (5.44) 5.2 (0.39) 7.5 (0.44) 0.4 (0.13) 82.2 (7.30) 1079 (36.2) 1397 (52.1) 263 (10.8)20 and over... 80.7 (3.45) 5.2 (0.35) 10.2 (0.21) 0.9 (0.09) 139.6 (4.70) 987 (25.3) 1455 (22.1) 327 (6.2)
2 and over... 79.0 (2.93) 5.2 (0.25) 9.4 (0.14) 0.8 (0.08) 123.9 (4.27) 1014 (19.8) 1424 (15.6) 307 (4.6)
All Individuals1:2 - 5.............. 77.7 (4.46) 5.8 (0.30) 5.6 (0.18) 0.5 (0.10) 49.5 (2.10) 933 (33.6) 1055 (31.7) 196 (5.4)6 - 11.............. 74.7 (1.95) 5.5 (0.16) 7.2 (0.20) 0.6 (0.12) 73.3 (5.51) 1076 (29.3) 1292 (21.2) 233 (5.3)
12 - 19.............. 69.4 (3.12) 4.9 (0.17) 8.0 (0.56) 0.8* (0.30) 81.5 (5.55) 1017 (23.9) 1354 (24.9) 254 (4.7)20 and over... 79.1 (1.67) 4.7 (0.16) 9.4 (0.18) 0.9 (0.05) 123.0 (3.16) 965 (11.8) 1399 (11.9) 305 (3.4)
2 and over... 77.6 (1.25) 4.9 (0.12) 8.9 (0.16) 0.9 (0.05) 110.7 (2.76) 978 (11.2) 1369 (11.0) 288 (3.1)

DATA SOURCE: What We Eat in America, NHANES 2013-2014, individuals 2 years and over (excluding breast-fed children), day 1. Available: www.ars.usda.gov/nea/bhnrc/fsrg.Page 5 of 9
What We Eat in America, NHANES 2013-2014
Table 3. Nutrient Intakes from Food and Beverages: Mean Amounts Consumed per Individual,by Family Income (in Dollars) and Age, in the United States, 2013-2014 (continued)
Family incomein dollarsand age Iron Zinc Copper Selenium Potassium Sodium Caffeine Theobromine Alcohol
(years) mg (SE) mg (SE) mg (SE) µg (SE) mg (SE) mg (SE) mg (SE) mg (SE) g (SE)
$0 - $24,999:2 - 5.............. 11.1 (0.42) 8.0 (0.39) 0.7 (0.02) 74.6 (3.25) 1881 (66.4) 2321 (112.3) 6.4 (1.13) 37.1 (5.87) -- --6 - 11.............. 14.3 (0.61) 10.1 (0.43) 0.9 (0.03) 92.2 (2.52) 2143 (90.3) 2870 (80.4) 13.4 (2.63) 49.1 (5.55) -- --
12 - 19.............. 14.1 (0.74) 10.2 (0.54) 1.0 (0.06) 112.7 (6.65) 2263 (112.7) 3450 (168.5) 48.1 (7.23) 51.6 (13.42) -- --20 and over... 14.0 (0.36) 10.7 (0.24) 1.2 (0.03) 110.9 (1.74) 2488 (45.3) 3345 (36.4) 157.6 (19.06) 39.5 (5.54) 9.8 (1.30)
2 and over... 13.9 (0.32) 10.4 (0.19) 1.1 (0.03) 107.5 (1.19) 2399 (37.4) 3258 (29.2) 125.0 (16.01) 41.5 (4.29) -- --
$25,000 - $74,999:2 - 5.............. 11.3 (0.67) 7.6 (0.31) 0.8 (0.04) 71.5 (4.17) 1879 (116.2) 2157 (93.0) 4.7 (0.68) 39.4 (8.55) -- --6 - 11.............. 13.8 (0.43) 9.6 (0.30) 0.9 (0.05) 96.0 (3.13) 2122 (52.9) 3009 (56.3) 15.3 (4.32) 52.0 (5.17) -- --
12 - 19.............. 14.8 (1.12) 11.7 (1.00) 0.9 (0.03) 108.6 (2.52) 2198 (57.7) 3295 (62.6) 47.6 (7.32) 30.8 (3.86) -- --20 and over... 14.7 (0.30) 11.2 (0.16) 1.2 (0.02) 115.9 (1.92) 2629 (29.4) 3579 (47.4) 163.6 (8.29) 35.0 (2.39) 11.1 (1.24)
2 and over... 14.5 (0.30) 11.0 (0.20) 1.1 (0.02) 111.5 (1.89) 2509 (31.1) 3438 (39.4) 132.2 (7.79) 36.1 (2.17) -- --
$75,000 and higher:2 - 5.............. 12.0 (0.74) 8.3 (0.43) 0.8 (0.03) 74.7 (2.78) 1950 (65.7) 2331 (69.2) 4.1 (0.86) 41.5 (4.92) -- --6 - 11.............. 14.5 (0.59) 9.8 (0.29) 1.0 (0.02) 97.6 (2.88) 2259 (66.6) 3096 (110.5) 15.6 (2.72) 63.5 (7.96) -- --
12 - 19.............. 14.9 (0.96) 11.3 (0.55) 1.1 (0.05) 109.1 (5.22) 2372 (95.6) 3479 (136.3) 48.4 (7.39) 43.8 (5.21) -- --20 and over... 14.6 (0.17) 11.5 (0.20) 1.3 (0.03) 122.2 (2.01) 2806 (54.6) 3624 (55.2) 172.1 (5.23) 41.0 (3.01) 12.1 (0.90)
2 and over... 14.5 (0.13) 11.2 (0.14) 1.3 (0.02) 116.4 (1.46) 2669 (46.0) 3503 (51.7) 136.5 (6.29) 43.3 (2.12) -- --
All Individuals1:2 - 5.............. 11.4 (0.33) 8.0 (0.14) 0.8 (0.02) 73.0 (2.21) 1912 (68.1) 2250 (56.1) 5.1 (0.55) 39.1 (3.61) -- --6 - 11.............. 14.3 (0.29) 9.9 (0.23) 0.9 (0.03) 95.7 (1.84) 2161 (39.3) 2992 (53.2) 14.4 (1.58) 54.4 (4.02) -- --
12 - 19.............. 14.8 (0.29) 11.2 (0.30) 1.0 (0.02) 110.1 (2.21) 2276 (45.2) 3411 (68.8) 48.8 (4.39) 41.0 (3.53) -- --20 and over... 14.5 (0.14) 11.2 (0.09) 1.2 (0.01) 117.0 (1.03) 2658 (30.9) 3529 (30.1) 165.0 (6.40) 38.9 (1.61) 11.0 (0.84)
2 and over... 14.4 (0.14) 10.9 (0.09) 1.2 (0.01) 112.3 (0.99) 2538 (28.7) 3409 (27.7) 132.0 (6.00) 40.4 (1.36) -- --

DATA SOURCE: What We Eat in America, NHANES 2013-2014, individuals 2 years and over (excluding breast-fed children), day 1. Available: www.ars.usda.gov/nea/bhnrc/fsrg.Page 6 of 9
What We Eat in America, NHANES 2013-2014
Table 3. Nutrient Intakes from Food and Beverages: Mean Amounts Consumed per Individual,by Family Income (in Dollars) and Age, in the United States, 2013-2014 (continued)
Family incomein dollarsand age
SFA4:0
SFA6:0
SFA8:0
SFA10:0
SFA12:0
SFA14:0
SFA16:0
SFA18:0
(years) g (SE) g (SE) g (SE) g (SE) g (SE) g (SE) g (SE) g (SE)
$0 - $24,999:2 - 5.............. 0.46 (0.044) 0.30 (0.028) 0.27 (0.032) 0.46 (0.045) 0.71 (0.068) 1.83 (0.167) 10.72 (0.582) 4.58 (0.233)6 - 11.............. 0.51 (0.037) 0.31 (0.018) 0.27 (0.021) 0.50 (0.029) 0.85 (0.105) 2.17 (0.136) 12.33 (0.406) 5.51 (0.201)
12 - 19.............. 0.44 (0.032) 0.29 (0.019) 0.26 (0.013) 0.48 (0.028) 0.90 (0.052) 2.11 (0.124) 14.13 (0.740) 6.15 (0.309)20 and over... 0.49 (0.018) 0.31 (0.011) 0.26 (0.008) 0.50 (0.016) 0.81 (0.032) 2.16 (0.055) 14.16 (0.198) 6.36 (0.107)
2 and over... 0.48 (0.016) 0.31 (0.009) 0.26 (0.007) 0.49 (0.013) 0.82 (0.026) 2.13 (0.049) 13.81 (0.177) 6.16 (0.084)
$25,000 - $74,999:2 - 5.............. 0.44 (0.026) 0.29 (0.019) 0.27 (0.021) 0.45 (0.014) 0.64 (0.047) 1.72 (0.074) 9.50 (0.378) 4.22 (0.163)6 - 11.............. 0.57 (0.076) 0.38 (0.048) 0.30 (0.037) 0.58 (0.072) 0.95 (0.143) 2.40 (0.248) 14.36 (0.700) 6.22 (0.346)
12 - 19.............. 0.49 (0.028) 0.31 (0.014) 0.24 (0.010) 0.48 (0.021) 0.77 (0.062) 2.11 (0.090) 13.93 (0.555) 5.99 (0.255)20 and over... 0.51 (0.016) 0.32 (0.010) 0.27 (0.006) 0.52 (0.013) 0.86 (0.026) 2.27 (0.054) 14.67 (0.265) 6.61 (0.121)
2 and over... 0.51 (0.013) 0.32 (0.008) 0.27 (0.006) 0.51 (0.011) 0.85 (0.026) 2.24 (0.046) 14.32 (0.269) 6.40 (0.122)
$75,000 and higher:2 - 5.............. 0.51 (0.034) 0.34 (0.024) 0.28 (0.025) 0.51 (0.031) 0.78 (0.100) 1.99 (0.115) 10.23 (0.248) 4.60 (0.216)6 - 11.............. 0.64 (0.029) 0.41 (0.019) 0.35 (0.027) 0.64 (0.029) 1.29 (0.299) 2.66 (0.096) 14.36 (0.425) 6.58 (0.318)
12 - 19.............. 0.58 (0.069) 0.36 (0.036) 0.27 (0.019) 0.54 (0.051) 0.82 (0.075) 2.37 (0.197) 14.12 (0.514) 6.36 (0.218)20 and over... 0.53 (0.022) 0.33 (0.015) 0.27 (0.014) 0.55 (0.023) 0.85 (0.050) 2.29 (0.076) 14.51 (0.314) 6.40 (0.138)
2 and over... 0.55 (0.019) 0.34 (0.013) 0.28 (0.012) 0.55 (0.019) 0.88 (0.059) 2.32 (0.067) 14.26 (0.264) 6.33 (0.122)
All Individuals1:2 - 5.............. 0.47 (0.024) 0.31 (0.017) 0.27 (0.017) 0.47 (0.020) 0.71 (0.041) 1.85 (0.082) 10.10 (0.294) 4.46 (0.120)6 - 11.............. 0.58 (0.032) 0.37 (0.021) 0.31 (0.019) 0.58 (0.032) 1.04 (0.122) 2.43 (0.120) 13.77 (0.347) 6.16 (0.203)
12 - 19.............. 0.51 (0.025) 0.32 (0.015) 0.26 (0.008) 0.51 (0.020) 0.82 (0.041) 2.23 (0.080) 14.11 (0.255) 6.21 (0.134)20 and over... 0.51 (0.011) 0.32 (0.006) 0.27 (0.005) 0.52 (0.010) 0.85 (0.018) 2.25 (0.034) 14.50 (0.143) 6.47 (0.064)
2 and over... 0.52 (0.009) 0.32 (0.006) 0.27 (0.005) 0.52 (0.009) 0.86 (0.021) 2.24 (0.030) 14.18 (0.124) 6.32 (0.063)

DATA SOURCE: What We Eat in America, NHANES 2013-2014, individuals 2 years and over (excluding breast-fed children), day 1. Available: www.ars.usda.gov/nea/bhnrc/fsrg.Page 7 of 9
What We Eat in America, NHANES 2013-2014
Table 3. Nutrient Intakes from Food and Beverages: Mean Amounts Consumed per Individual,by Family Income (in Dollars) and Age, in the United States, 2013-2014 (continued)
Family incomein dollarsand age
MFA16:1
MFA18:1
MFA20:1
MFA22:1
PFA18:2
PFA18:3
PFA18:4
(years) g (SE) g (SE) g (SE) g (SE) g (SE) g (SE) g (SE)
$0 - $24,999:2 - 5.............. 0.70 (0.052) 16.94 (0.738) 0.22 (0.025) 0.02 (0.002) 10.94 (0.620) 1.08 (0.065) 0.01 (0.002)6 - 11.............. 0.89 (0.055) 19.84 (0.528) 0.23 (0.008) 0.01 (0.001) 12.72 (0.394) 1.28 (0.067) 0.01 (0.002)
12 - 19.............. 1.04 (0.104) 24.60 (1.522) 0.28 (0.018) 0.02 (0.003) 16.45 (1.001) 1.60 (0.097) 0.01 (0.001)20 and over... 1.04 (0.024) 25.33 (0.413) 0.31 (0.007) 0.03 (0.001) 16.61 (0.432) 1.79 (0.064) 0.01 (0.002)
2 and over... 1.01 (0.021) 24.32 (0.330) 0.29 (0.006) 0.02 (0.001) 15.95 (0.368) 1.68 (0.052) 0.01 (0.001)
$25,000 - $74,999:2 - 5.............. 0.60 (0.021) 15.52 (0.565) 0.17 (0.011) 0.01 (0.001) 9.83 (0.614) 0.95 (0.077) 0.01 (0.002)6 - 11.............. 0.89 (0.062) 21.83 (0.954) 0.25 (0.013) 0.02 (0.001) 14.32 (0.610) 1.45 (0.051) 0.01 (0.002)
12 - 19.............. 0.95 (0.036) 23.11 (1.029) 0.27 (0.012) 0.02 (0.003) 15.59 (0.479) 1.50 (0.059) 0.01 (0.001)20 and over... 1.09 (0.016) 25.97 (0.516) 0.32 (0.011) 0.03 (0.003) 17.15 (0.396) 1.80 (0.040) 0.01 (0.001)
2 and over... 1.04 (0.017) 24.86 (0.527) 0.31 (0.010) 0.03 (0.002) 16.42 (0.328) 1.70 (0.031) 0.01 (0.001)
$75,000 and higher:2 - 5.............. 0.62 (0.025) 16.22 (0.530) 0.19 (0.008) 0.01 (0.001) 10.56 (0.527) 1.14 (0.084) #6 - 11.............. 0.93 (0.059) 22.52 (1.122) 0.25 (0.013) 0.01 (0.002) 14.16 (1.040) 1.35 (0.084) 0.01 (0.001)
12 - 19.............. 0.99 (0.043) 23.62 (1.467) 0.29 (0.033) 0.02 (0.002) 16.03 (1.283) 1.55 (0.116) 0.01 (0.002)20 and over... 1.05 (0.030) 26.63 (0.619) 0.35 (0.014) 0.03 (0.003) 17.67 (0.443) 1.86 (0.073) 0.01 (0.002)
2 and over... 1.01 (0.031) 25.45 (0.525) 0.33 (0.011) 0.03 (0.002) 16.85 (0.348) 1.75 (0.065) 0.01 (0.001)
All Individuals1:2 - 5.............. 0.63 (0.020) 16.14 (0.366) 0.19 (0.009) 0.01 (0.001) 10.37 (0.291) 1.05 (0.037) #6 - 11.............. 0.91 (0.043) 21.55 (0.557) 0.24 (0.006) 0.02 (0.001) 13.78 (0.350) 1.37 (0.028) 0.01 (0.001)
12 - 19.............. 1.00 (0.030) 23.66 (0.688) 0.28 (0.013) 0.02 (0.002) 15.95 (0.618) 1.55 (0.063) 0.01 (0.001)20 and over... 1.07 (0.014) 26.02 (0.304) 0.33 (0.007) 0.03 (0.001) 17.19 (0.280) 1.82 (0.035) 0.01 (0.001)
2 and over... 1.03 (0.014) 24.91 (0.297) 0.31 (0.006) 0.03 (0.001) 16.44 (0.226) 1.71 (0.031) 0.01 (0.001)

DATA SOURCE: What We Eat in America, NHANES 2013-2014, individuals 2 years and over (excluding breast-fed children), day 1. Available: www.ars.usda.gov/nea/bhnrc/fsrg.Page 8 of 9
What We Eat in America, NHANES 2013-2014
Table 3. Nutrient Intakes from Food and Beverages: Mean Amounts Consumed per Individual,by Family Income (in Dollars) and Age, in the United States, 2013-2014 (continued)
Family incomein dollarsand age
PFA20:4
PFA20:5
PFA22:5
PFA22:6
(years) g (SE) g (SE) g (SE) g (SE)
$0 - $24,999:2 - 5.............. 0.10 (0.007) 0.01* (0.004) 0.01 (0.001) 0.03 (0.008)6 - 11.............. 0.10 (0.004) 0.01 (0.002) 0.01 (0.001) 0.02 (0.002)
12 - 19.............. 0.15 (0.018) 0.02* (0.006) 0.02 (0.003) 0.04 (0.008)20 and over... 0.15 (0.004) 0.02 (0.003) 0.02 (0.001) 0.05 (0.004)
2 and over... 0.15 (0.003) 0.02 (0.002) 0.02 (0.001) 0.05 (0.004)
$25,000 - $74,999:2 - 5.............. 0.08 (0.006) 0.02* (0.009) 0.01 (0.003) 0.04* (0.019)6 - 11.............. 0.11 (0.008) 0.01 (0.001) 0.02 (0.001) 0.02 (0.003)
12 - 19.............. 0.14 (0.006) 0.01 (0.002) 0.02 (0.001) 0.03 (0.004)20 and over... 0.16 (0.004) 0.03 (0.002) 0.02 (0.001) 0.06 (0.005)
2 and over... 0.15 (0.004) 0.02 (0.002) 0.02 (0.001) 0.05 (0.004)
$75,000 and higher:2 - 5.............. 0.07 (0.007) 0.01* (0.003) 0.01 (0.001) 0.02* (0.006)6 - 11.............. 0.11 (0.009) 0.01 (0.002) 0.01 (0.001) 0.02 (0.003)
12 - 19.............. 0.13 (0.013) 0.01 (0.002) 0.02 (0.002) 0.03 (0.005)20 and over... 0.15 (0.003) 0.04 (0.004) 0.03 (0.001) 0.08 (0.008)
2 and over... 0.14 (0.003) 0.03 (0.003) 0.02 (0.001) 0.07 (0.006)
All Individuals1:2 - 5.............. 0.08 (0.004) 0.01* (0.004) 0.01 (0.001) 0.03 (0.008)6 - 11.............. 0.11 (0.004) 0.01 (0.001) 0.01 (0.001) 0.02 (0.002)
12 - 19.............. 0.14 (0.007) 0.02 (0.002) 0.02 (0.001) 0.03 (0.004)20 and over... 0.16 (0.002) 0.03 (0.002) 0.02 (0.001) 0.07 (0.004)
2 and over... 0.15 (0.002) 0.03 (0.002) 0.02 (0.001) 0.06 (0.003)

What We Eat in America, NHANES 2013-2014
Page 9 of 9Page 9 of 9
Symbol Legend
* Indicates an estimate that may be less statistically reliable than estimates that are not flagged. The rules for flagging estimated means are as follows:
Mean: An estimated mean is flagged when based on a sample size of less than 30 times the variance inflation factor (VIF), where the VIF represents a broadly calculated average designeffect, or when the relative standard error is greater than 30 percent. The VIF used in this table is 1.98.
# Indicates a non-zero value too small to report.
Footnotes
1 Includes persons of all income levels or with unknown family income.
Abbreviations
SE = standard error; RAE = retinol activity equivalents; DFE = dietary folate equivalents. SFA = saturated fatty acid; MFA = monounsaturated fatty acid; PFA = polyunsaturated fatty acid.
Notes Applicable to All Tables in Series: What We Eat in America, NHANES 2013-2014
Sample weights designed for dietary analysis were used to allow estimates representative of the U. S. population for the years of collection.
The statistics in this table are estimated from Day 1 dietary recall interviews conducted in the What We Eat in America, National Health and Nutrition Examination Survey (NHANES) 2013-2014.The 24-hour dietary recalls were conducted in-person, by trained interviewers, using the USDA 5-step Automated Multiple-Pass Method. Food intakes were coded and nutrient values weredetermined using the USDA Food and Nutrient Database for Dietary Studies 2013-2014 www.ars.usda.gov/nea/bhnrc/fsrg.
Intakes of nutrients and other dietary components are based on the consumption of food and beverages, including water, and do not include intake from supplements or medications.
The table includes data from individuals 2 years and over. Breast-fed children were excluded because breast milk was not quantified in dietary recall interviews.
Although alcohol data are collected for all individuals, estimates are not presented for age groups under 20 years due to extreme variability and/or inadequate sample size.
Suggested Citation
U.S. Department of Agriculture, Agricultural Research Service. 2016. Nutrient Intakes from Food and Beverages: Mean Amounts Consumed per Individual, by Family Income (in Dollars) andAge, What We Eat in America, NHANES 2013-2014.

DATA SOURCE: What We Eat in America, NHANES 2013-2014, individuals 2 years and over (excluding breast-fed children), day 1. Available: www.ars.usda.gov/nea/bhnrc/fsrg.Page 1 of 9
What We Eat in America, NHANES 2013-2014
Table 4. Nutrient Intakes from Food and Beverages: Mean Amounts Consumed per Individual,by Family Income (as % of Poverty Level1) and Age, in the United States, 2013-2014
Family income as% of poverty level
and ageSample
size Energy Protein Carbo-hydrate
Totalsugars
Dietaryfiber
Totalfat
Saturatedfat
Mono-unsaturated
fat
Poly-unsaturated
fat
(years) kcal (SE) g (SE) g (SE) g (SE) g (SE) g (SE) g (SE) g (SE) g (SE)
Under 131% poverty:2 - 5.............. 329 1486 (41.3) 52.7 (2.19) 199 (4.6) 93 (2.6) 11.4 (0.30) 55.3 (2.11) 19.6 (0.98) 18.2 (0.66) 12.2 (0.52)6 - 11.............. 494 1845 (43.6) 66.4 (1.90) 244 (5.1) 110 (2.6) 14.6 (0.63) 69.4 (2.17) 24.8 (1.29) 23.1 (0.61) 14.9 (0.38)
12 - 19.............. 555 2016 (69.0) 76.6 (4.85) 259 (7.2) 118 (4.5) 14.6 (0.88) 76.6 (3.70) 24.9 (1.09) 26.0 (1.32) 18.1 (1.08)20 and over... 1596 2157 (21.0) 80.5 (1.50) 267 (3.5) 126 (2.7) 15.6 (0.42) 80.6 (1.01) 26.3 (0.49) 27.9 (0.34) 18.7 (0.46)
2 and over... 2974 2053 (17.1) 76.4 (1.19) 258 (2.9) 121 (2.5) 15.0 (0.37) 76.9 (0.84) 25.4 (0.43) 26.3 (0.28) 17.7 (0.36)
131-350% poverty:2 - 5.............. 200 1465 (57.2) 54.0 (3.76) 198 (9.3) 93 (6.3) 11.8 (0.66) 52.9 (1.87) 19.0 (0.63) 17.3 (0.62) 11.5 (0.70)6 - 11.............. 302 1983 (58.8) 67.0 (2.28) 267 (8.7) 124 (5.2) 14.1 (0.72) 74.5 (2.56) 26.9 (1.12) 24.5 (0.81) 16.4 (0.62)
12 - 19.............. 402 2085 (70.5) 82.2 (3.11) 263 (10.9) 122 (7.3) 14.5 (0.47) 79.6 (2.49) 26.7 (1.44) 27.1 (0.99) 18.2 (0.67)20 and over... 1622 2146 (33.9) 84.3 (1.40) 253 (3.9) 114 (3.0) 16.8 (0.39) 84.2 (1.54) 27.2 (0.46) 29.2 (0.64) 19.7 (0.49)
2 and over... 2526 2094 (32.7) 81.3 (1.47) 253 (3.4) 115 (2.3) 16.0 (0.29) 81.4 (1.50) 26.7 (0.46) 28.0 (0.62) 18.9 (0.39)
Over 350% poverty:2 - 5.............. 109 1491 (30.2) 52.6 (2.59) 207 (5.9) 102 (3.8) 12.0 (0.75) 52.9 (1.19) 19.6 (0.78) 17.1 (0.54) 11.1 (0.54)6 - 11.............. 194 1976 (35.0) 69.7 (2.66) 263 (4.7) 122 (3.7) 15.1 (0.58) 74.3 (2.44) 27.8 (1.32) 24.2 (0.95) 15.4 (0.99)
12 - 19.............. 239 2015 (111.6) 77.1 (4.13) 261 (14.9) 123 (6.0) 14.7 (0.70) 75.9 (4.87) 25.9 (1.17) 25.3 (1.90) 17.2 (1.58)20 and over... 1468 2136 (26.6) 84.9 (1.28) 245 (3.1) 101 (1.7) 18.2 (0.37) 83.4 (1.62) 26.7 (0.55) 29.1 (0.59) 19.8 (0.48)
2 and over... 2010 2095 (20.8) 82.2 (1.10) 246 (2.6) 104 (1.6) 17.5 (0.30) 81.2 (1.50) 26.4 (0.50) 28.1 (0.55) 19.0 (0.44)
All Individuals2:2 - 5.............. 676 1481 (30.6) 53.0 (1.73) 201 (4.2) 97 (2.6) 11.6 (0.40) 53.8 (1.23) 19.4 (0.55) 17.6 (0.41) 11.7 (0.32)6 - 11.............. 1047 1921 (35.4) 67.5 (1.30) 256 (4.8) 117 (2.4) 14.5 (0.51) 72.3 (1.72) 26.3 (0.84) 23.8 (0.56) 15.4 (0.38)
12 - 19.............. 1296 2038 (31.1) 79.0 (2.14) 260 (4.8) 120 (2.6) 14.5 (0.38) 77.6 (1.61) 26.0 (0.49) 26.2 (0.66) 17.9 (0.68)20 and over... 5047 2141 (18.7) 83.6 (0.73) 253 (2.1) 111 (1.4) 17.1 (0.27) 82.9 (0.89) 26.7 (0.27) 28.8 (0.31) 19.5 (0.31)
2 and over... 8066 2079 (17.2) 80.3 (0.74) 251 (2.1) 112 (1.3) 16.3 (0.21) 80.0 (0.79) 26.3 (0.24) 27.6 (0.30) 18.6 (0.26)

DATA SOURCE: What We Eat in America, NHANES 2013-2014, individuals 2 years and over (excluding breast-fed children), day 1. Available: www.ars.usda.gov/nea/bhnrc/fsrg.Page 2 of 9
What We Eat in America, NHANES 2013-2014
Table 4. Nutrient Intakes from Food and Beverages: Mean Amounts Consumed per Individual,by Family Income (as % of Poverty Level1) and Age, in the United States, 2013-2014 (continued)
Family income as% of poverty level
and age Choles-
terol Retinol Vitamin A
(RAE) Alpha-carotene
Beta-carotene
Beta-crypto-xanthin Lycopene
Lutein +zeaxanthin Thiamin
(years) mg (SE) µg (SE) µg (SE) µg (SE) µg (SE) µg (SE) µg (SE) µg (SE) mg (SE)
Under 131% poverty:2 - 5.............. 185 (14.4) 422 (20.4) 520 (20.7) 269 (72.9) 1024 (159.5) 69 (10.0) 2947 (393.5) 584 (51.5) 1.25 (0.043)6 - 11.............. 202 (9.3) 504 (36.5) 611 (41.4) 230 (34.5) 1142 (119.4) 66 (9.2) 4069 (344.2) 818 (104.2) 1.56 (0.054)
12 - 19.............. 261 (21.0) 390 (12.0) 488 (15.7) 195 (29.1) 1042 (108.9) 69 (8.2) 4506 (439.7) 856 (94.5) 1.53 (0.055)20 and over... 292 (6.7) 416 (18.2) 573 (23.7) 281 (23.5) 1727 (100.9) 70 (4.2) 4533 (289.5) 1347 (135.4) 1.59 (0.028)
2 and over... 270 (4.7) 422 (13.8) 561 (19.0) 262 (21.3) 1515 (84.7) 70 (3.2) 4360 (244.0) 1164 (94.1) 1.55 (0.022)
131-350% poverty:2 - 5.............. 179 (12.3) 412 (22.1) 535 (31.5) 266* (98.1) 1320 (156.1) 57 (8.7) 2889 (423.1) 622 (70.9) 1.19 (0.057)6 - 11.............. 220 (15.8) 545 (31.1) 653 (23.8) 240 (30.2) 1140 (145.7) 85 (9.3) 5081 (695.6) 718 (64.5) 1.63 (0.050)
12 - 19.............. 262 (10.6) 500 (29.8) 640 (43.8) 373*(165.3) 1483 (439.2) 59 (8.1) 4457 (417.6) 1009 (145.7) 1.79 (0.079)20 and over... 303 (8.0) 437 (19.0) 648 (26.2) 380 (28.4) 2316 (158.2) 83 (6.0) 4893 (255.7) 1620 (166.1) 1.63 (0.033)
2 and over... 285 (7.6) 452 (14.4) 642 (22.7) 362 (33.9) 2074 (140.1) 79 (4.9) 4764 (232.7) 1428 (130.7) 1.63 (0.031)
Over 350% poverty:2 - 5.............. 152 (13.9) 493 (27.0) 610 (46.7) 303*(107.6) 1220 (316.9) 66 (16.9) 3348 (796.3) 606 (58.3) 1.34 (0.056)6 - 11.............. 227 (22.6) 530 (27.0) 684 (35.4) 354*(108.6) 1640 (299.8) 79 (12.2) 3022 (351.9) 1249 (348.1) 1.59 (0.082)
12 - 19.............. 224 (10.2) 459 (31.6) 620 (26.9) 371 (78.7) 1716 (254.2) 79 (16.5) 4744 (695.7) 1024 (264.1) 1.71 (0.130)20 and over... 285 (8.1) 430 (10.5) 661 (17.1) 470 (49.5) 2507 (145.7) 90 (5.7) 5598 (209.4) 1887 (104.7) 1.65 (0.018)
2 and over... 272 (6.8) 440 (10.8) 657 (13.3) 449 (43.1) 2347 (122.2) 88 (5.7) 5296 (194.1) 1735 (89.4) 1.64 (0.019)
All Individuals2:2 - 5.............. 173 (9.1) 440 (11.7) 548 (14.5) 271 (65.2) 1140 (117.8) 63 (6.4) 2989 (313.9) 590 (29.7) 1.25 (0.031)6 - 11.............. 216 (8.1) 531 (21.4) 653 (25.9) 274 (35.9) 1304 (113.1) 75 (5.5) 4090 (267.1) 911 (118.9) 1.60 (0.037)
12 - 19.............. 253 (8.7) 450 (12.0) 579 (18.8) 299 (63.2) 1375 (171.9) 67 (5.8) 4656 (256.4) 959 (80.5) 1.67 (0.043)20 and over... 293 (4.2) 428 (8.1) 637 (12.2) 398 (25.9) 2271 (89.2) 83 (3.1) 5021 (136.4) 1671 (74.3) 1.62 (0.018)
2 and over... 276 (3.7) 440 (6.8) 627 (11.5) 371 (22.8) 2037 (80.3) 79 (2.8) 4805 (121.3) 1477 (57.3) 1.61 (0.018)

DATA SOURCE: What We Eat in America, NHANES 2013-2014, individuals 2 years and over (excluding breast-fed children), day 1. Available: www.ars.usda.gov/nea/bhnrc/fsrg.Page 3 of 9
What We Eat in America, NHANES 2013-2014
Table 4. Nutrient Intakes from Food and Beverages: Mean Amounts Consumed per Individual,by Family Income (as % of Poverty Level1) and Age, in the United States, 2013-2014 (continued)
Family income as% of poverty level
and age Ribo-flavin Niacin Vitamin B6
Folicacid
Foodfolate
Folate(DFE) Choline Vitamin B12
AddedVitamin B12
(years) mg (SE) mg (SE) mg (SE) µg (SE) µg (SE) µg (SE) mg (SE) µg (SE) µg (SE)
Under 131% poverty:2 - 5.............. 1.65 (0.065) 16.0 (0.61) 1.38 (0.045) 173 (9.3) 125 (6.0) 419 (18.0) 212 (8.4) 3.84 (0.154) 0.98 (0.087)6 - 11.............. 1.90 (0.077) 20.7 (0.53) 1.70 (0.067) 213 (14.5) 154 (6.2) 516 (27.1) 237 (8.8) 4.81 (0.303) 1.30 (0.136)
12 - 19.............. 1.86 (0.073) 25.0 (1.62) 1.95 (0.146) 206 (13.2) 172 (8.9) 521 (28.5) 276 (15.9) 4.56 (0.178) 1.24 (0.163)20 and over... 2.06 (0.055) 25.9 (0.54) 2.13 (0.080) 188 (9.8) 207 (4.3) 526 (19.4) 327 (6.4) 4.82 (0.141) 1.16 (0.123)
2 and over... 1.99 (0.040) 24.5 (0.43) 2.00 (0.062) 192 (8.5) 190 (3.6) 517 (16.5) 301 (4.9) 4.71 (0.105) 1.17 (0.086)
131-350% poverty:2 - 5.............. 1.66 (0.077) 15.3 (0.69) 1.37 (0.100) 154 (14.0) 132 (11.5) 393 (29.0) 214 (14.3) 3.58 (0.335) 0.73 (0.083)6 - 11.............. 2.08 (0.040) 21.7 (0.64) 1.79 (0.066) 210 (10.0) 151 (5.9) 508 (19.4) 255 (12.5) 4.86 (0.223) 1.32 (0.143)
12 - 19.............. 2.33 (0.140) 27.4 (1.24) 2.15 (0.136) 236 (28.5) 176 (7.6) 578 (50.6) 300 (8.6) 5.62 (0.421) 1.61 (0.387)20 and over... 2.18 (0.047) 27.0 (0.71) 2.25 (0.079) 176 (8.2) 223 (5.8) 522 (16.9) 343 (7.1) 5.11 (0.221) 1.14 (0.113)
2 and over... 2.17 (0.049) 26.1 (0.70) 2.16 (0.074) 185 (8.5) 207 (4.8) 522 (16.8) 325 (6.9) 5.08 (0.217) 1.19 (0.130)
Over 350% poverty:2 - 5.............. 1.82 (0.097) 15.2 (0.77) 1.38 (0.061) 189 (23.2) 134 (10.0) 454 (39.4) 199 (6.0) 4.13 (0.280) 1.04 (0.212)6 - 11.............. 1.99 (0.058) 20.5 (1.08) 1.64 (0.057) 195 (17.7) 165 (6.1) 496 (31.1) 254 (13.8) 4.30 (0.272) 0.86 (0.166)
12 - 19.............. 2.22 (0.126) 25.7 (1.97) 2.15 (0.177) 204 (26.8) 169 (6.7) 516 (44.0) 271 (15.3) 5.63 (0.586) 1.88 (0.474)20 and over... 2.25 (0.043) 26.3 (0.28) 2.20 (0.032) 177 (3.6) 235 (5.0) 536 (8.2) 343 (6.5) 4.88 (0.117) 1.04 (0.065)
2 and over... 2.22 (0.035) 25.5 (0.33) 2.13 (0.029) 181 (3.6) 222 (4.6) 529 (6.6) 327 (4.9) 4.88 (0.107) 1.10 (0.085)
All Individuals2:2 - 5.............. 1.71 (0.045) 15.5 (0.37) 1.37 (0.042) 172 (6.6) 129 (5.6) 422 (11.9) 209 (6.6) 3.87 (0.114) 0.92 (0.058)6 - 11.............. 2.00 (0.037) 21.1 (0.45) 1.72 (0.037) 213 (8.7) 155 (4.1) 517 (16.6) 248 (4.9) 4.73 (0.113) 1.21 (0.060)
12 - 19.............. 2.12 (0.071) 26.1 (0.76) 2.07 (0.069) 219 (11.8) 173 (4.1) 545 (20.8) 283 (6.8) 5.22 (0.156) 1.54 (0.160)20 and over... 2.18 (0.028) 26.5 (0.24) 2.20 (0.030) 179 (4.3) 224 (3.1) 528 (8.7) 339 (3.9) 4.95 (0.075) 1.10 (0.050)
2 and over... 2.13 (0.029) 25.4 (0.24) 2.11 (0.028) 186 (4.1) 208 (2.8) 524 (8.0) 319 (3.5) 4.91 (0.067) 1.15 (0.056)

DATA SOURCE: What We Eat in America, NHANES 2013-2014, individuals 2 years and over (excluding breast-fed children), day 1. Available: www.ars.usda.gov/nea/bhnrc/fsrg.Page 4 of 9
What We Eat in America, NHANES 2013-2014
Table 4. Nutrient Intakes from Food and Beverages: Mean Amounts Consumed per Individual,by Family Income (as % of Poverty Level1) and Age, in the United States, 2013-2014 (continued)
Family income as% of poverty level
and age Vitamin C Vitamin D
Vitamin E(alpha-
tocopherol) Added
Vitamin E Vitamin K Calcium Phosphorus Magnesium
(years) mg (SE) µg (SE) mg (SE) mg (SE) µg (SE) mg (SE) mg (SE) mg (SE)
Under 131% poverty:2 - 5.............. 79.8 (5.93) 5.6 (0.31) 5.4 (0.17) 0.3 (0.07) 48.1 (4.12) 910 (52.2) 1029 (43.6) 188 (4.5)6 - 11.............. 69.6 (3.74) 5.4 (0.33) 6.9 (0.24) 0.6 (0.13) 68.1 (5.31) 1000 (55.3) 1250 (43.3) 228 (7.7)
12 - 19.............. 71.9 (5.21) 4.4 (0.18) 7.8 (0.63) 0.6* (0.24) 74.6 (5.27) 941 (32.3) 1288 (52.4) 244 (11.6)20 and over... 75.5 (3.81) 4.4 (0.13) 8.4 (0.28) 0.8 (0.18) 102.3 (5.53) 937 (21.0) 1339 (20.1) 281 (4.8)
2 and over... 74.7 (2.60) 4.6 (0.10) 7.9 (0.21) 0.7 (0.13) 90.7 (3.97) 942 (18.6) 1299 (16.3) 263 (4.3)
131-350% poverty:2 - 5.............. 76.8 (8.94) 5.8 (0.69) 5.7 (0.34) 0.6 (0.17) 52.8 (5.00) 881 (44.2) 1031 (54.7) 199 (12.8)6 - 11.............. 74.1 (5.50) 5.4 (0.31) 7.2 (0.35) 0.5* (0.15) 62.6 (3.18) 1070 (32.1) 1287 (34.2) 226 (9.1)
12 - 19.............. 64.1 (4.54) 5.5 (0.39) 8.7 (1.27) 1.1* (0.72) 86.8 (11.54) 1057 (58.8) 1419 (45.6) 264 (7.0)20 and over... 80.8 (2.31) 4.7 (0.30) 9.6 (0.37) 1.1 (0.11) 120.0 (7.04) 968 (16.4) 1413 (25.2) 303 (6.0)
2 and over... 78.0 (2.13) 4.9 (0.24) 9.1 (0.32) 1.1 (0.14) 108.3 (5.47) 983 (15.4) 1386 (21.7) 288 (5.6)
Over 350% poverty:2 - 5.............. 72.9 (8.69) 5.7 (0.42) 5.9 (0.53) 0.9 (0.24) 49.9 (3.87) 1006 (69.2) 1121 (64.9) 202 (10.1)6 - 11.............. 79.2 (5.65) 5.7 (0.36) 7.6 (0.37) 0.7 (0.17) 91.6 (15.68) 1194 (74.9) 1371 (55.1) 247 (6.0)
12 - 19.............. 74.2 (5.97) 4.8 (0.49) 7.6 (0.54) 0.6 (0.14) 82.5 (11.76) 1066 (50.9) 1355 (73.3) 258 (12.1)20 and over... 79.3 (2.40) 5.0 (0.23) 9.9 (0.16) 0.9 (0.09) 136.4 (4.26) 983 (23.6) 1432 (20.6) 323 (5.1)
2 and over... 78.7 (2.49) 5.1 (0.19) 9.5 (0.13) 0.9 (0.08) 126.4 (4.15) 1003 (23.3) 1411 (18.5) 309 (3.8)
All Individuals2:2 - 5.............. 77.7 (4.46) 5.8 (0.30) 5.6 (0.18) 0.5 (0.10) 49.5 (2.10) 933 (33.6) 1055 (31.7) 196 (5.4)6 - 11.............. 74.7 (1.95) 5.5 (0.16) 7.2 (0.20) 0.6 (0.12) 73.3 (5.51) 1076 (29.3) 1292 (21.2) 233 (5.3)
12 - 19.............. 69.4 (3.12) 4.9 (0.17) 8.0 (0.56) 0.8* (0.30) 81.5 (5.55) 1017 (23.9) 1354 (24.9) 254 (4.7)20 and over... 79.1 (1.67) 4.7 (0.16) 9.4 (0.18) 0.9 (0.05) 123.0 (3.16) 965 (11.8) 1399 (11.9) 305 (3.4)
2 and over... 77.6 (1.25) 4.9 (0.12) 8.9 (0.16) 0.9 (0.05) 110.7 (2.76) 978 (11.2) 1369 (11.0) 288 (3.1)

DATA SOURCE: What We Eat in America, NHANES 2013-2014, individuals 2 years and over (excluding breast-fed children), day 1. Available: www.ars.usda.gov/nea/bhnrc/fsrg.Page 5 of 9
What We Eat in America, NHANES 2013-2014
Table 4. Nutrient Intakes from Food and Beverages: Mean Amounts Consumed per Individual,by Family Income (as % of Poverty Level1) and Age, in the United States, 2013-2014 (continued)
Family income as% of poverty level
and age Iron Zinc Copper Selenium Potassium Sodium Caffeine Theobromine Alcohol
(years) mg (SE) mg (SE) mg (SE) µg (SE) mg (SE) mg (SE) mg (SE) mg (SE) g (SE)
Under 131% poverty:2 - 5.............. 11.4 (0.38) 7.9 (0.33) 0.7 (0.02) 73.9 (3.02) 1849 (60.3) 2292 (100.8) 5.8 (1.12) 32.5 (4.63) -- --6 - 11.............. 14.2 (0.46) 10.1 (0.44) 0.9 (0.03) 93.5 (2.63) 2102 (70.4) 2903 (63.1) 14.8 (3.02) 51.5 (4.91) -- --
12 - 19.............. 14.2 (0.61) 10.3 (0.46) 1.0 (0.05) 109.0 (5.10) 2197 (96.5) 3389 (136.5) 44.9 (6.77) 45.8 (10.28) -- --20 and over... 14.4 (0.33) 10.8 (0.28) 1.1 (0.02) 113.3 (1.63) 2456 (40.0) 3465 (45.3) 158.5 (19.83) 33.9 (2.91) 9.4 (1.18)
2 and over... 14.1 (0.30) 10.4 (0.23) 1.0 (0.02) 107.6 (1.08) 2336 (34.2) 3306 (34.4) 115.6 (15.50) 37.4 (2.44) -- --
131-350% poverty:2 - 5.............. 11.2 (0.57) 7.7 (0.34) 0.8 (0.05) 73.8 (4.01) 1907 (142.9) 2195 (82.5) 5.2 (0.70) 47.9 (7.75) -- --6 - 11.............. 14.4 (0.49) 9.6 (0.33) 0.9 (0.06) 97.4 (3.34) 2221 (70.8) 3108 (88.8) 14.2 (2.25) 54.1 (6.40) -- --
12 - 19.............. 15.3 (1.04) 12.0 (0.86) 1.0 (0.03) 115.5 (3.85) 2319 (60.9) 3484 (101.9) 50.6 (6.51) 35.2 (5.53) -- --20 and over... 14.8 (0.37) 11.4 (0.19) 1.2 (0.03) 116.8 (2.49) 2654 (36.1) 3534 (54.4) 155.6 (8.99) 40.9 (4.35) 9.5 (1.12)
2 and over... 14.6 (0.37) 11.2 (0.23) 1.2 (0.03) 113.1 (2.39) 2544 (36.2) 3433 (48.6) 124.6 (8.26) 41.6 (3.42) -- --
Over 350% poverty:2 - 5.............. 11.9 (0.85) 8.5 (0.54) 0.8 (0.04) 72.7 (3.13) 1980 (66.3) 2301 (73.9) 3.7 (0.55) 40.2 (7.04) -- --6 - 11.............. 13.8 (0.58) 9.7 (0.38) 1.0 (0.02) 96.7 (3.71) 2220 (66.7) 3034 (133.4) 16.3 (3.12) 62.9 (6.99) -- --
12 - 19.............. 14.5 (1.07) 11.2 (0.64) 1.1 (0.05) 103.3 (5.04) 2349 (121.0) 3337 (194.9) 48.8 (9.97) 43.9 (6.33) -- --20 and over... 14.4 (0.15) 11.3 (0.18) 1.3 (0.03) 119.6 (1.61) 2784 (45.4) 3593 (49.0) 177.4 (6.31) 39.1 (2.61) 13.7 (1.19)
2 and over... 14.3 (0.12) 11.1 (0.13) 1.3 (0.02) 115.3 (1.44) 2687 (39.5) 3494 (50.6) 151.3 (7.15) 40.9 (1.95) -- --
All Individuals2:2 - 5.............. 11.4 (0.33) 8.0 (0.14) 0.8 (0.02) 73.0 (2.21) 1912 (68.1) 2250 (56.1) 5.1 (0.55) 39.1 (3.61) -- --6 - 11.............. 14.3 (0.29) 9.9 (0.23) 0.9 (0.03) 95.7 (1.84) 2161 (39.3) 2992 (53.2) 14.4 (1.58) 54.4 (4.02) -- --
12 - 19.............. 14.8 (0.29) 11.2 (0.30) 1.0 (0.02) 110.1 (2.21) 2276 (45.2) 3411 (68.8) 48.8 (4.39) 41.0 (3.53) -- --20 and over... 14.5 (0.14) 11.2 (0.09) 1.2 (0.01) 117.0 (1.03) 2658 (30.9) 3529 (30.1) 165.0 (6.40) 38.9 (1.61) 11.0 (0.84)
2 and over... 14.4 (0.14) 10.9 (0.09) 1.2 (0.01) 112.3 (0.99) 2538 (28.7) 3409 (27.7) 132.0 (6.00) 40.4 (1.36) -- --

DATA SOURCE: What We Eat in America, NHANES 2013-2014, individuals 2 years and over (excluding breast-fed children), day 1. Available: www.ars.usda.gov/nea/bhnrc/fsrg.Page 6 of 9
What We Eat in America, NHANES 2013-2014
Table 4. Nutrient Intakes from Food and Beverages: Mean Amounts Consumed per Individual,by Family Income (as % of Poverty Level1) and Age, in the United States, 2013-2014 (continued)
Family income as% of poverty level
and age SFA4:0
SFA6:0
SFA8:0
SFA10:0
SFA12:0
SFA14:0
SFA16:0
SFA18:0
(years) g (SE) g (SE) g (SE) g (SE) g (SE) g (SE) g (SE) g (SE)
Under 131% poverty:2 - 5.............. 0.45 (0.035) 0.30 (0.024) 0.27 (0.028) 0.45 (0.038) 0.71 (0.061) 1.80 (0.136) 10.47 (0.484) 4.46 (0.200)6 - 11.............. 0.54 (0.061) 0.34 (0.039) 0.29 (0.033) 0.54 (0.061) 0.92 (0.119) 2.30 (0.214) 13.16 (0.545) 5.75 (0.230)
12 - 19.............. 0.43 (0.027) 0.28 (0.017) 0.25 (0.009) 0.46 (0.024) 0.82 (0.039) 2.04 (0.103) 13.77 (0.641) 5.98 (0.247)20 and over... 0.48 (0.022) 0.30 (0.014) 0.25 (0.009) 0.49 (0.019) 0.82 (0.042) 2.19 (0.076) 14.32 (0.236) 6.44 (0.114)
2 and over... 0.48 (0.022) 0.30 (0.013) 0.26 (0.008) 0.49 (0.018) 0.82 (0.033) 2.15 (0.070) 13.83 (0.203) 6.15 (0.090)
131-350% poverty:2 - 5.............. 0.45 (0.031) 0.31 (0.022) 0.28 (0.023) 0.46 (0.020) 0.65 (0.059) 1.78 (0.095) 9.74 (0.395) 4.48 (0.149)6 - 11.............. 0.59 (0.037) 0.38 (0.024) 0.30 (0.020) 0.58 (0.034) 0.93 (0.089) 2.41 (0.137) 14.29 (0.613) 6.35 (0.285)
12 - 19.............. 0.55 (0.056) 0.34 (0.031) 0.25 (0.020) 0.52 (0.044) 0.80 (0.074) 2.29 (0.184) 14.56 (0.710) 6.38 (0.342)20 and over... 0.51 (0.018) 0.32 (0.011) 0.27 (0.006) 0.52 (0.014) 0.85 (0.019) 2.27 (0.057) 14.74 (0.259) 6.62 (0.132)
2 and over... 0.52 (0.012) 0.33 (0.009) 0.27 (0.005) 0.52 (0.012) 0.84 (0.016) 2.26 (0.047) 14.45 (0.264) 6.47 (0.126)
Over 350% poverty:2 - 5.............. 0.51 (0.040) 0.34 (0.026) 0.27 (0.022) 0.50 (0.034) 0.76 (0.100) 1.98 (0.126) 9.98 (0.264) 4.43 (0.220)6 - 11.............. 0.62 (0.052) 0.40 (0.033) 0.35 (0.043) 0.64 (0.053) 1.38* (0.423) 2.65 (0.190) 14.19 (0.326) 6.51 (0.396)
12 - 19.............. 0.56 (0.044) 0.35 (0.023) 0.27 (0.013) 0.53 (0.034) 0.83 (0.081) 2.31 (0.112) 13.83 (0.686) 6.18 (0.366)20 and over... 0.53 (0.019) 0.33 (0.012) 0.27 (0.012) 0.54 (0.021) 0.85 (0.052) 2.27 (0.068) 14.41 (0.259) 6.39 (0.120)
2 and over... 0.54 (0.016) 0.34 (0.011) 0.28 (0.012) 0.55 (0.018) 0.88 (0.060) 2.29 (0.059) 14.20 (0.228) 6.31 (0.116)
All Individuals2:2 - 5.............. 0.47 (0.024) 0.31 (0.017) 0.27 (0.017) 0.47 (0.020) 0.71 (0.041) 1.85 (0.082) 10.10 (0.294) 4.46 (0.120)6 - 11.............. 0.58 (0.032) 0.37 (0.021) 0.31 (0.019) 0.58 (0.032) 1.04 (0.122) 2.43 (0.120) 13.77 (0.347) 6.16 (0.203)
12 - 19.............. 0.51 (0.025) 0.32 (0.015) 0.26 (0.008) 0.51 (0.020) 0.82 (0.041) 2.23 (0.080) 14.11 (0.255) 6.21 (0.134)20 and over... 0.51 (0.011) 0.32 (0.006) 0.27 (0.005) 0.52 (0.010) 0.85 (0.018) 2.25 (0.034) 14.50 (0.143) 6.47 (0.064)
2 and over... 0.52 (0.009) 0.32 (0.006) 0.27 (0.005) 0.52 (0.009) 0.86 (0.021) 2.24 (0.030) 14.18 (0.124) 6.32 (0.063)

DATA SOURCE: What We Eat in America, NHANES 2013-2014, individuals 2 years and over (excluding breast-fed children), day 1. Available: www.ars.usda.gov/nea/bhnrc/fsrg.Page 7 of 9
What We Eat in America, NHANES 2013-2014
Table 4. Nutrient Intakes from Food and Beverages: Mean Amounts Consumed per Individual,by Family Income (as % of Poverty Level1) and Age, in the United States, 2013-2014 (continued)
Family income as% of poverty level
and age MFA16:1
MFA18:1
MFA20:1
MFA22:1
PFA18:2
PFA18:3
PFA18:4
(years) g (SE) g (SE) g (SE) g (SE) g (SE) g (SE) g (SE)
Under 131% poverty:2 - 5.............. 0.68 (0.039) 16.70 (0.565) 0.21 (0.019) 0.02 (0.001) 10.89 (0.476) 1.05 (0.046) 0.01 (0.001)6 - 11.............. 0.89 (0.044) 20.60 (0.561) 0.24 (0.008) 0.02 (0.001) 13.29 (0.331) 1.33 (0.055) 0.01 (0.001)
12 - 19.............. 1.00 (0.075) 23.40 (1.252) 0.29 (0.017) 0.02 (0.002) 16.21 (0.983) 1.55 (0.093) 0.01 (0.001)20 and over... 1.08 (0.030) 25.09 (0.322) 0.31 (0.009) 0.02 (0.001) 16.47 (0.416) 1.74 (0.048) 0.01 (0.001)
2 and over... 1.02 (0.023) 23.74 (0.264) 0.29 (0.006) 0.02 (0.001) 15.67 (0.324) 1.61 (0.035) 0.01 (0.001)
131-350% poverty:2 - 5.............. 0.60 (0.019) 15.94 (0.579) 0.18 (0.012) 0.01 (0.001) 10.20 (0.623) 1.07 (0.089) #6 - 11.............. 0.91 (0.066) 22.17 (0.806) 0.25 (0.012) 0.02 (0.002) 14.62 (0.584) 1.44 (0.051) 0.01 (0.002)
12 - 19.............. 1.02 (0.050) 24.42 (0.933) 0.28 (0.015) 0.02 (0.003) 16.30 (0.618) 1.58 (0.072) 0.01 (0.001)20 and over... 1.10 (0.017) 26.39 (0.601) 0.33 (0.012) 0.03 (0.002) 17.42 (0.456) 1.85 (0.037) 0.01 (0.002)
2 and over... 1.05 (0.017) 25.33 (0.590) 0.31 (0.010) 0.03 (0.002) 16.73 (0.365) 1.75 (0.030) 0.01 (0.002)
Over 350% poverty:2 - 5.............. 0.62 (0.030) 15.63 (0.472) 0.17 (0.009) 0.01 (0.001) 9.88 (0.509) 1.04 (0.058) #6 - 11.............. 0.91 (0.067) 22.20 (0.957) 0.25 (0.015) 0.01 (0.002) 13.74 (0.913) 1.34 (0.073) 0.01 (0.001)
12 - 19.............. 0.94 (0.055) 23.18 (1.835) 0.28 (0.038) 0.02 (0.002) 15.35 (1.425) 1.49 (0.135) 0.01 (0.002)20 and over... 1.03 (0.025) 26.40 (0.563) 0.34 (0.009) 0.03 (0.003) 17.48 (0.426) 1.84 (0.060) 0.01 (0.001)
2 and over... 1.00 (0.026) 25.52 (0.520) 0.32 (0.009) 0.03 (0.003) 16.83 (0.388) 1.75 (0.060) 0.01 (0.001)
All Individuals2:2 - 5.............. 0.63 (0.020) 16.14 (0.366) 0.19 (0.009) 0.01 (0.001) 10.37 (0.291) 1.05 (0.037) #6 - 11.............. 0.91 (0.043) 21.55 (0.557) 0.24 (0.006) 0.02 (0.001) 13.78 (0.350) 1.37 (0.028) 0.01 (0.001)
12 - 19.............. 1.00 (0.030) 23.66 (0.688) 0.28 (0.013) 0.02 (0.002) 15.95 (0.618) 1.55 (0.063) 0.01 (0.001)20 and over... 1.07 (0.014) 26.02 (0.304) 0.33 (0.007) 0.03 (0.001) 17.19 (0.280) 1.82 (0.035) 0.01 (0.001)
2 and over... 1.03 (0.014) 24.91 (0.297) 0.31 (0.006) 0.03 (0.001) 16.44 (0.226) 1.71 (0.031) 0.01 (0.001)

DATA SOURCE: What We Eat in America, NHANES 2013-2014, individuals 2 years and over (excluding breast-fed children), day 1. Available: www.ars.usda.gov/nea/bhnrc/fsrg.Page 8 of 9
What We Eat in America, NHANES 2013-2014
Table 4. Nutrient Intakes from Food and Beverages: Mean Amounts Consumed per Individual,by Family Income (as % of Poverty Level1) and Age, in the United States, 2013-2014 (continued)
Family income as% of poverty level
and age PFA20:4
PFA20:5
PFA22:5
PFA22:6
(years) g (SE) g (SE) g (SE) g (SE)
Under 131% poverty:2 - 5.............. 0.09 (0.007) 0.01 (0.003) 0.01 (0.001) 0.03 (0.006)6 - 11.............. 0.10 (0.004) 0.01 (0.002) 0.01 (0.001) 0.02 (0.004)
12 - 19.............. 0.15 (0.014) 0.02 (0.005) 0.02 (0.002) 0.04 (0.007)20 and over... 0.16 (0.005) 0.02 (0.003) 0.02 (0.001) 0.05 (0.005)
2 and over... 0.15 (0.004) 0.02 (0.002) 0.02 (0.001) 0.05 (0.004)
131-350% poverty:2 - 5.............. 0.09 (0.006) 0.02* (0.011) 0.01 (0.004) 0.04* (0.023)6 - 11.............. 0.11 (0.008) 0.01 (0.001) 0.01 (0.001) 0.02 (0.003)
12 - 19.............. 0.14 (0.009) 0.01 (0.002) 0.02 (0.001) 0.03 (0.004)20 and over... 0.16 (0.005) 0.03 (0.004) 0.02 (0.001) 0.06 (0.007)
2 and over... 0.15 (0.005) 0.02 (0.003) 0.02 (0.001) 0.05 (0.006)
Over 350% poverty:2 - 5.............. 0.07 (0.007) 0.01* (0.004) 0.01 (0.001) 0.02* (0.007)6 - 11.............. 0.11 (0.011) 0.01 (0.002) 0.01 (0.001) 0.03 (0.004)
12 - 19.............. 0.12 (0.010) 0.01 (0.002) 0.02 (0.001) 0.02 (0.005)20 and over... 0.15 (0.004) 0.04 (0.004) 0.03 (0.001) 0.08 (0.008)
2 and over... 0.14 (0.003) 0.03 (0.004) 0.02 (0.001) 0.07 (0.007)
All Individuals2:2 - 5.............. 0.08 (0.004) 0.01* (0.004) 0.01 (0.001) 0.03 (0.008)6 - 11.............. 0.11 (0.004) 0.01 (0.001) 0.01 (0.001) 0.02 (0.002)
12 - 19.............. 0.14 (0.007) 0.02 (0.002) 0.02 (0.001) 0.03 (0.004)20 and over... 0.16 (0.002) 0.03 (0.002) 0.02 (0.001) 0.07 (0.004)
2 and over... 0.15 (0.002) 0.03 (0.002) 0.02 (0.001) 0.06 (0.003)

What We Eat in America, NHANES 2013-2014
Page 9 of 9Page 9 of 9
Symbol Legend
* Indicates an estimate that may be less statistically reliable than estimates that are not flagged. The rules for flagging estimated means are as follows:
Mean: An estimated mean is flagged when based on a sample size of less than 30 times the variance inflation factor (VIF), where the VIF represents a broadly calculated average designeffect, or when the relative standard error is greater than 30 percent. The VIF used in this table is 1.98.
# Indicates a non-zero value too small to report.
Footnotes
1 The ratio of family income to poverty expressed as a percentage. The Department of Health and Human Services’ poverty guidelines were used as the poverty measure to calculate the ratio, http://aspe.hhs.gov/poverty/.
2 Includes persons of all income levels or with unknown family income.
Abbreviations
SE = standard error; RAE = retinol activity equivalents; DFE = dietary folate equivalents. SFA = saturated fatty acid; MFA = monounsaturated fatty acid; PFA = polyunsaturated fatty acid.
Notes Applicable to All Tables in Series: What We Eat in America, NHANES 2013-2014
Sample weights designed for dietary analysis were used to allow estimates representative of the U. S. population for the years of collection.
The statistics in this table are estimated from Day 1 dietary recall interviews conducted in the What We Eat in America, National Health and Nutrition Examination Survey (NHANES) 2013-2014.The 24-hour dietary recalls were conducted in-person, by trained interviewers, using the USDA 5-step Automated Multiple-Pass Method. Food intakes were coded and nutrient values weredetermined using the USDA Food and Nutrient Database for Dietary Studies 2013-2014 www.ars.usda.gov/nea/bhnrc/fsrg.
Intakes of nutrients and other dietary components are based on the consumption of food and beverages, including water, and do not include intake from supplements or medications.
The table includes data from individuals 2 years and over. Breast-fed children were excluded because breast milk was not quantified in dietary recall interviews.
Although alcohol data are collected for all individuals, estimates are not presented for age groups under 20 years due to extreme variability and/or inadequate sample size.
Suggested Citation
U.S. Department of Agriculture, Agricultural Research Service. 2016. Nutrient Intakes from Food and Beverages: Mean Amounts Consumed per Individual, by Family Income (as % of PovertyLevel) and Age, What We Eat in America, NHANES 2013-2014.

DATA SOURCE: What We Eat in America, NHANES 2013-2014, individuals 2 years and over (excluding breast-fed children), day 1. Available: www.ars.usda.gov/nea/bhnrc/fsrg.Page 1 of 2
What We Eat in America, NHANES 2013-2014
Table 5. Energy Intakes: Percentages1 of Energy from Protein, Carbohydrate, Fat, and Alcohol,by Gender and Age, in the United States, 2013-2014
Genderand age
Samplesize Energy Protein Carbohydrate Total fat Saturated fat
Mono-unsaturated
fat
Poly-unsaturated
fat Alcohol
(years) kcal (SE) % kcal (SE) % kcal (SE) % kcal (SE) % kcal (SE) % kcal (SE) % kcal (SE) % kcal (SE)
Males:2 - 5.............. 337 1571 (35.2) 14 (0.4) 55 (0.4) 32 (0.4) 11 (0.2) 10 (0.1) 7 (0.1) -- --6 - 11.............. 537 2036 (46.2) 14 (0.2) 54 (0.3) 33 (0.4) 12 (0.3) 11 (0.2) 7 (0.2) -- --
12 - 19.............. 646 2376 (38.2) 16 (0.4) 51 (0.8) 34 (0.5) 11 (0.3) 11 (0.2) 8 (0.2) -- --
20 - 29.............. 424 2704 (62.5) 17 (0.5) 46 (0.8) 34 (0.5) 11 (0.3) 12 (0.2) 8 (0.2) -- --30 - 39.............. 429 2622 (68.0) 16 (0.5) 47 (0.5) 33 (0.4) 11 (0.2) 12 (0.1) 8 (0.2) -- --40 - 49.............. 410 2520 (45.3) 16 (0.3) 47 (1.0) 33 (0.5) 11 (0.3) 12 (0.2) 8 (0.2) -- --
50 - 59.............. 398 2493 (77.7) 16 (0.5) 47 (0.8) 34 (0.8) 11 (0.2) 12 (0.3) 8 (0.2) -- --60 - 69.............. 395 2253 (51.7) 16 (0.5) 46 (1.1) 35 (0.4) 11 (0.3) 12 (0.3) 8 (0.2) -- --70 and over...... 358 2022 (63.3) 16 (0.3) 47 (0.9) 35 (0.7) 12 (0.3) 12 (0.3) 8 (0.3) -- --
2 - 19............ 1520 2101 (26.4) 15 (0.2) 53 (0.4) 33 (0.4) 12 (0.2) 11 (0.2) 7 (0.2) -- --20 and over... 2414 2477 (26.1) 16 (0.3) 47 (0.4) 34 (0.2) 11 (0.1) 12 (0.1) 8 (0.1) 4 (0.3)
2 and over... 3934 2382 (21.0) 16 (0.2) 48 (0.3) 34 (0.2) 11 (0.1) 12 (0.1) 8 (0.1) -- --
Females:2 - 5.............. 339 1395 (36.9) 15 (0.3) 54 (0.6) 33 (0.6) 12 (0.2) 11 (0.2) 7 (0.2) -- --6 - 11.............. 510 1786 (30.4) 14 (0.3) 54 (0.6) 33 (0.4) 12 (0.2) 11 (0.1) 8 (0.2) -- --
12 - 19.............. 650 1689 (48.0) 15 (0.4) 53 (0.7) 33 (0.6) 11 (0.3) 11 (0.3) 8 (0.3) -- --
20 - 29.............. 430 1933 (61.9) 15 (0.5) 49 (0.6) 34 (0.6) 11 (0.3) 11 (0.2) 8 (0.2) -- --30 - 39.............. 463 1986 (33.0) 16 (0.4) 50 (0.6) 34 (0.5) 11 (0.3) 12 (0.2) 8 (0.2) -- --40 - 49.............. 487 1873 (36.3) 16 (0.3) 49 (0.5) 34 (0.4) 11 (0.2) 12 (0.2) 8 (0.2) -- --
50 - 59.............. 439 1779 (38.2) 16 (0.4) 48 (0.9) 35 (0.6) 11 (0.2) 12 (0.3) 9 (0.3) -- --60 - 69.............. 433 1712 (55.5) 16 (0.4) 48 (0.5) 35 (0.4) 11 (0.2) 12 (0.2) 9 (0.2) -- --70 and over...... 381 1604 (37.9) 16 (0.3) 50 (0.5) 34 (0.5) 11 (0.3) 12 (0.2) 8 (0.1) -- --
2 - 19............ 1499 1657 (22.7) 15 (0.3) 53 (0.4) 33 (0.3) 11 (0.2) 11 (0.2) 8 (0.2) -- --20 and over... 2633 1825 (18.1) 16 (0.2) 49 (0.4) 34 (0.3) 11 (0.1) 12 (0.1) 8 (0.1) 2 (0.2)
2 and over... 4132 1786 (16.4) 16 (0.2) 50 (0.3) 34 (0.2) 11 (0.1) 12 (0.1) 8 (0.1) -- --
Males and females:2 - 19............ 3019 1885 (21.1) 15 (0.2) 53 (0.3) 33 (0.3) 12 (0.1) 11 (0.1) 7 (0.1) -- --20 and over... 5047 2141 (18.7) 16 (0.2) 48 (0.2) 34 (0.2) 11 (0.1) 12 (0.1) 8 (0.1) 3 (0.2)
2 and over... 8066 2079 (17.2) 16 (0.2) 49 (0.2) 34 (0.2) 11 (0.1) 12 (0.1) 8 (0.1) -- --

What We Eat in America, NHANES 2013-2014
Page 2 of 2Page 2 of 2
Footnotes
1 Percentages estimated as a ratio of each individual’s energy intake of protein, carbohydrate, fat and alcohol divided by the individual’s total food energy intake.
Abbreviations
SE = standard error.
Notes Applicable to All Tables in Series: What We Eat in America, NHANES 2013-2014
Sample weights designed for dietary analysis were used to allow estimates representative of the U. S. population for the years of collection.
The statistics in this table are estimated from Day 1 dietary recall interviews conducted in the What We Eat in America, National Health and Nutrition Examination Survey (NHANES) 2013-2014.The 24-hour dietary recalls were conducted in-person, by trained interviewers, using the USDA 5-step Automated Multiple-Pass Method. Food intakes were coded and nutrient values weredetermined using the USDA Food and Nutrient Database for Dietary Studies 2013-2014 www.ars.usda.gov/nea/bhnrc/fsrg.
Intakes of nutrients and other dietary components are based on the consumption of food and beverages, including water, and do not include intake from supplements or medications.
The table includes data from individuals 2 years and over. Breast-fed children were excluded because breast milk was not quantified in dietary recall interviews.
Although alcohol data are collected for all individuals, estimates are not presented for age groups under 20 years due to extreme variability and/or inadequate sample size.
Suggested Citation
U.S. Department of Agriculture, Agricultural Research Service. 2016. Energy Intakes: Percentages of Energy from Protein, Carbohydrate, Fat, and Alcohol, by Gender and Age, What We Eat inAmerica, NHANES 2013-2014.

DATA SOURCE: What We Eat in America, NHANES 2013-2014, individuals 2 years and over (excluding breast-fed children), day 1. Available: www.ars.usda.gov/nea/bhnrc/fsrg.Page 1 of 2
What We Eat in America, NHANES 2013-2014
Table 6. Energy Intakes: Percentages1 of Energy from Protein, Carbohydrate, Fat, and Alcohol,by Race/Ethnicity and Age, in the United States, 2013-2014
Race/ethnicityand age
Samplesize Energy Protein Carbohydrate Total fat Saturated fat
Mono-unsaturated
fat
Poly-unsaturated
fat Alcohol
(years) kcal (SE) % kcal (SE) % kcal (SE) % kcal (SE) % kcal (SE) % kcal (SE) % kcal (SE) % kcal (SE)
Non-Hispanic White:2 - 5.............. 184 1420 (33.7) 14 (0.4) 55 (0.5) 32 (0.4) 12 (0.3) 11 (0.2) 7* (0.2) -- --6 - 11.............. 290 1951 (54.3) 14 (0.3) 53 (0.5) 34 (0.3) 13 (0.2) 11 (0.2) 7 (0.1) -- --
12 - 19.............. 337 2034 (47.9) 16 (0.5) 52 (0.9) 33 (0.6) 11 (0.3) 11 (0.3) 8 (0.3) -- --20 and over... 2233 2129 (22.9) 16 (0.3) 47 (0.4) 35 (0.3) 11 (0.1) 12 (0.1) 8 (0.1) 4 (0.3)
2 and over... 3044 2080 (20.5) 16 (0.2) 48 (0.4) 34 (0.3) 11 (0.1) 12 (0.1) 8 (0.1) -- --
Non-Hispanic Black:2 - 5.............. 161 1559 (72.5) 14 (0.4) 55 (1.0) 33 (0.8) 11 (0.5) 11 (0.3) 8* (0.3) -- --6 - 11.............. 285 1837 (60.9) 14 (0.2) 55 (1.0) 32 (1.0) 11 (0.5) 11 (0.3) 8 (0.2) -- --
12 - 19.............. 307 2056 (73.3) 14 (0.2) 52 (1.0) 34 (1.0) 11 (0.3) 12 (0.3) 8 (0.3) -- --20 and over... 1009 2230 (54.8) 15 (0.2) 49 (0.5) 34 (0.5) 11 (0.2) 12 (0.2) 8 (0.2) 3 (0.3)
2 and over... 1762 2133 (43.8) 15 (0.2) 50 (0.4) 34 (0.5) 11 (0.2) 12 (0.2) 8 (0.2) -- --
Non-Hispanic Asian2:2 - 5.............. 58 1528* (140.7) 16* (1.1) 53* (1.1) 32* (1.2) 12* (0.7) 10* (0.3) 6* (0.5) -- --6 - 11.............. 70 1874 (115.4) 15* (0.7) 56 (1.2) 30 (1.0) 10* (0.5) 10* (0.5) 7* (0.3) -- --
12 - 19.............. 136 2040 (113.2) 17 (0.6) 52 (1.4) 31 (1.1) 10* (0.6) 11* (0.4) 8* (0.4) -- --20 and over... 525 1844 (41.7) 18 (0.3) 50 (0.9) 32 (0.5) 9 (0.2) 11 (0.3) 8 (0.2) 2* (0.3)
2 and over... 789 1853 (37.9) 17 (0.3) 51 (0.8) 31 (0.4) 9 (0.2) 11 (0.3) 8 (0.2) -- --
Hispanic:2 - 5.............. 221 1554 (52.3) 15 (0.2) 54 (0.7) 32 (0.6) 12 (0.3) 10 (0.2) 7* (0.3) -- --6 - 11.............. 330 1896 (69.8) 15 (0.2) 54 (0.5) 33 (0.4) 11 (0.3) 11 (0.2) 7 (0.2) -- --
12 - 19.............. 446 2092 (92.2) 15 (0.2) 52 (0.6) 34 (0.5) 11 (0.2) 11 (0.2) 8 (0.2) -- --20 and over... 1125 2204 (38.0) 17 (0.2) 49 (0.4) 33 (0.3) 11 (0.2) 11 (0.1) 8 (0.2) 2 (0.2)
2 and over... 2122 2104 (38.3) 16 (0.1) 50 (0.3) 33 (0.2) 11 (0.1) 11 (0.1) 8 (0.1) -- --

What We Eat in America, NHANES 2013-2014
Page 2 of 2Page 2 of 2
Symbol Legend
* Indicates an estimate that may be less statistically reliable than estimates that are not flagged. The rules for flagging estimated means and percentages are as follows:
Mean: An estimated mean is flagged when based on a sample size of less than 30 times the variance inflation factor (VIF), where the VIF represents a broadly calculated average designeffect, or when the relative standard error is greater than 30 percent. The VIF used in this table is 1.98.
Percent: An estimated percentage between 25 and 75 percent is flagged when based on a sample size of less than 30 times the variance inflation factor (VIF), where the VIF represents abroadly calculated average design effect, or when the relative standard error is greater than 30 percent. An estimated percentage less than or equal to 25 percent or greater than or equal to75 percent is flagged when the smaller of np and n(1-p) is less than 8 times the VIF, where n is the sample size and p is the percentage expressed as a fraction. The VIF used in this table is1.98.
Footnotes
1 Percentages estimated as a ratio of each individual’s energy intake of protein, carbohydrate, fat and alcohol divided by the individual’s total food energy intake.
2 A new sampling methodology was implemented for NHANES 2011-2012 to oversample non-Hispanic non-black Asians in addition to the ongoing oversample of Hispanics, non-Hispanicblacks, low-income whites/others, and whites/others 80+ years.
Abbreviations
SE = standard error.
Notes Applicable to All Tables in Series: What We Eat in America, NHANES 2013-2014
Sample weights designed for dietary analysis were used to allow estimates representative of the U. S. population for the years of collection.
The statistics in this table are estimated from Day 1 dietary recall interviews conducted in the What We Eat in America, National Health and Nutrition Examination Survey (NHANES) 2013-2014.The 24-hour dietary recalls were conducted in-person, by trained interviewers, using the USDA 5-step Automated Multiple-Pass Method. Food intakes were coded and nutrient values weredetermined using the USDA Food and Nutrient Database for Dietary Studies 2013-2014 www.ars.usda.gov/nea/bhnrc/fsrg.
Intakes of nutrients and other dietary components are based on the consumption of food and beverages, including water, and do not include intake from supplements or medications.
The table includes data from individuals 2 years and over. Breast-fed children were excluded because breast milk was not quantified in dietary recall interviews.
Although alcohol data are collected for all individuals, estimates are not presented for age groups under 20 years due to extreme variability and/or inadequate sample size.
Suggested Citation
U.S. Department of Agriculture, Agricultural Research Service. 2016. Energy Intakes: Percentages of Energy from Protein, Carbohydrate, Fat, and Alcohol, by Race/Ethnicity and Age, What WeEat in America, NHANES 2013-2014.

DATA SOURCE: What We Eat in America, NHANES 2013-2014, individuals 2 years and over (excluding breast-fed children), day 1. Available: www.ars.usda.gov/nea/bhnrc/fsrg.Page 1 of 2
What We Eat in America, NHANES 2013-2014
Table 7. Energy Intakes: Percentages1 of Energy from Protein, Carbohydrate, Fat, and Alcohol,by Family Income (in Dollars) and Age, in the United States, 2013-2014
Family incomein dollarsand age
Samplesize Energy Protein Carbohydrate Total fat Saturated fat
Mono-unsaturated
fat
Poly-unsaturated
fat Alcohol
(years) kcal (SE) % kcal (SE) % kcal (SE) % kcal (SE) % kcal (SE) % kcal (SE) % kcal (SE) % kcal (SE)
$0 - $24,999:2 - 5.............. 241 1500 (46.6) 14 (0.3) 54 (0.7) 33 (0.5) 12 (0.3) 11 (0.2) 7 (0.2) -- --6 - 11.............. 330 1819 (36.1) 15 (0.4) 54 (0.8) 32 (0.6) 11 (0.3) 11 (0.2) 7 (0.2) -- --
12 - 19.............. 398 2074 (78.9) 15 (0.5) 53 (1.3) 33 (1.0) 11 (0.4) 11 (0.4) 8 (0.2) -- --20 and over... 1550 2129 (33.6) 15 (0.3) 50 (0.3) 34 (0.3) 11 (0.1) 12 (0.1) 8 (0.2) 3 (0.2)
2 and over... 2519 2061 (26.1) 15 (0.2) 51 (0.3) 33 (0.3) 11 (0.2) 12 (0.1) 8 (0.1) -- --
$25,000 - $74,999:2 - 5.............. 255 1435 (58.6) 15 (0.5) 55 (0.6) 32 (0.8) 12 (0.3) 10 (0.3) 7 (0.3) -- --6 - 11.............. 400 1920 (59.1) 14 (0.4) 53 (0.5) 34 (0.5) 12 (0.4) 11 (0.1) 7 (0.2) -- --
12 - 19.............. 478 1973 (51.7) 16 (0.3) 52 (0.8) 34 (0.6) 11 (0.2) 11 (0.3) 8 (0.3) -- --20 and over... 1882 2151 (29.7) 16 (0.2) 48 (0.2) 34 (0.2) 11 (0.1) 12 (0.1) 8 (0.1) 3 (0.3)
2 and over... 3015 2081 (29.6) 16 (0.2) 49 (0.3) 34 (0.2) 11 (0.1) 12 (0.1) 8 (0.1) -- --
$75,000 and higher:2 - 5.............. 153 1515 (33.8) 14 (0.6) 55 (0.7) 32 (0.6) 12 (0.3) 10 (0.3) 7* (0.3) -- --6 - 11.............. 270 2017 (68.7) 14 (0.5) 54 (0.6) 33 (0.4) 12 (0.3) 11 (0.2) 7 (0.3) -- --
12 - 19.............. 334 2075 (80.0) 16 (0.5) 52 (0.7) 33 (0.7) 11 (0.4) 11 (0.3) 8 (0.4) -- --20 and over... 1303 2144 (33.8) 17 (0.3) 46 (0.4) 35 (0.3) 11 (0.1) 12 (0.1) 8 (0.1) 4 (0.2)
2 and over... 2060 2096 (25.7) 16 (0.2) 48 (0.4) 34 (0.3) 11 (0.1) 12 (0.1) 8 (0.1) -- --
All Individuals2:2 - 5.............. 676 1481 (30.6) 14 (0.3) 55 (0.3) 32 (0.3) 12 (0.2) 11 (0.1) 7 (0.2) -- --6 - 11.............. 1047 1921 (35.4) 14 (0.2) 54 (0.3) 33 (0.3) 12 (0.2) 11 (0.1) 7 (0.1) -- --
12 - 19.............. 1296 2038 (31.1) 15 (0.3) 52 (0.6) 33 (0.4) 11 (0.2) 11 (0.2) 8 (0.2) -- --20 and over... 5047 2141 (18.7) 16 (0.2) 48 (0.2) 34 (0.2) 11 (0.1) 12 (0.1) 8 (0.1) 3 (0.2)
2 and over... 8066 2079 (17.2) 16 (0.2) 49 (0.2) 34 (0.2) 11 (0.1) 12 (0.1) 8 (0.1) -- --

What We Eat in America, NHANES 2013-2014
Page 2 of 2Page 2 of 2
Symbol Legend
* Indicates an estimate that may be less statistically reliable than estimates that are not flagged. The rules for flagging estimated means and percentages are as follows:
Mean: An estimated mean is flagged when based on a sample size of less than 30 times the variance inflation factor (VIF), where the VIF represents a broadly calculated average designeffect, or when the relative standard error is greater than 30 percent. The VIF used in this table is 1.98.
Percent: An estimated percentage between 25 and 75 percent is flagged when based on a sample size of less than 30 times the variance inflation factor (VIF), where the VIF represents abroadly calculated average design effect, or when the relative standard error is greater than 30 percent. An estimated percentage less than or equal to 25 percent or greater than or equal to75 percent is flagged when the smaller of np and n(1-p) is less than 8 times the VIF, where n is the sample size and p is the percentage expressed as a fraction. The VIF used in this table is1.98.
Footnotes
1 Percentages estimated as a ratio of each individual’s energy intake of protein, carbohydrate, fat and alcohol divided by the individual’s total food energy intake.
2 Includes persons of all income levels or with unknown family income.
Abbreviations
SE = standard error.
Notes Applicable to All Tables in Series: What We Eat in America, NHANES 2013-2014
Sample weights designed for dietary analysis were used to allow estimates representative of the U. S. population for the years of collection.
The statistics in this table are estimated from Day 1 dietary recall interviews conducted in the What We Eat in America, National Health and Nutrition Examination Survey (NHANES) 2013-2014.The 24-hour dietary recalls were conducted in-person, by trained interviewers, using the USDA 5-step Automated Multiple-Pass Method. Food intakes were coded and nutrient values weredetermined using the USDA Food and Nutrient Database for Dietary Studies 2013-2014 www.ars.usda.gov/nea/bhnrc/fsrg.
Intakes of nutrients and other dietary components are based on the consumption of food and beverages, including water, and do not include intake from supplements or medications.
The table includes data from individuals 2 years and over. Breast-fed children were excluded because breast milk was not quantified in dietary recall interviews.
Although alcohol data are collected for all individuals, estimates are not presented for age groups under 20 years due to extreme variability and/or inadequate sample size.
Suggested Citation
U.S. Department of Agriculture, Agricultural Research Service. 2016. Energy Intakes: Percentages of Energy from Protein, Carbohydrate, Fat, and Alcohol, by Family Income (in Dollars) andAge, What We Eat in America, NHANES 2013-2014.

DATA SOURCE: What We Eat in America, NHANES 2013-2014, individuals 2 years and over (excluding breast-fed children), day 1. Available: www.ars.usda.gov/nea/bhnrc/fsrg.Page 1 of 2
What We Eat in America, NHANES 2013-2014
Table 8. Energy Intakes: Percentages1 of Energy from Protein, Carbohydrate, Fat, and Alcohol,by Family Income (as % of Poverty Level2) and Age, in the United States, 2013-2014
Family income as% of poverty level
and ageSample
size Energy Protein Carbohydrate Total fat Saturated fat
Mono-unsaturated
fat
Poly-unsaturated
fat Alcohol
(years) kcal (SE) % kcal (SE) % kcal (SE) % kcal (SE) % kcal (SE) % kcal (SE) % kcal (SE) % kcal (SE)
Under 131% poverty:2 - 5.............. 329 1486 (41.3) 14 (0.3) 54 (0.7) 33 (0.4) 12 (0.3) 11 (0.2) 7 (0.2) -- --6 - 11.............. 494 1845 (43.6) 15 (0.3) 54 (0.5) 33 (0.4) 12 (0.3) 11 (0.2) 7 (0.2) -- --
12 - 19.............. 555 2016 (69.0) 15 (0.4) 53 (1.0) 33 (0.7) 11 (0.3) 11 (0.3) 8 (0.2) -- --20 and over... 1596 2157 (21.0) 16 (0.3) 50 (0.4) 33 (0.3) 11 (0.2) 11 (0.1) 8 (0.2) 3 (0.2)
2 and over... 2974 2053 (17.1) 15 (0.2) 51 (0.3) 33 (0.3) 11 (0.2) 11 (0.1) 8 (0.1) -- --
131-350% poverty:2 - 5.............. 200 1465 (57.2) 15 (0.5) 55 (0.9) 32 (1.1) 12 (0.4) 10 (0.4) 7* (0.4) -- --6 - 11.............. 302 1983 (58.8) 14 (0.3) 54 (0.6) 33 (0.6) 12 (0.3) 11 (0.2) 7 (0.2) -- --
12 - 19.............. 402 2085 (70.5) 16 (0.4) 51 (0.7) 34 (0.4) 11 (0.2) 11 (0.3) 8 (0.4) -- --20 and over... 1622 2146 (33.9) 16 (0.1) 48 (0.3) 35 (0.3) 11 (0.1) 12 (0.1) 8 (0.1) 3 (0.3)
2 and over... 2526 2094 (32.7) 16 (0.1) 49 (0.2) 34 (0.3) 11 (0.1) 12 (0.1) 8 (0.1) -- --
Over 350% poverty:2 - 5.............. 109 1491 (30.2) 14* (0.7) 56 (0.8) 32 (0.4) 12* (0.3) 10* (0.2) 7* (0.3) -- --6 - 11.............. 194 1976 (35.0) 14 (0.5) 54 (0.7) 33 (0.5) 12 (0.5) 11 (0.2) 7* (0.3) -- --
12 - 19.............. 239 2015 (111.6) 16 (0.5) 52 (0.8) 33 (0.9) 11 (0.3) 11 (0.4) 8 (0.4) -- --20 and over... 1468 2136 (26.6) 16 (0.3) 47 (0.4) 34 (0.3) 11 (0.1) 12 (0.1) 8 (0.1) 4 (0.3)
2 and over... 2010 2095 (20.8) 16 (0.3) 48 (0.4) 34 (0.3) 11 (0.1) 12 (0.1) 8 (0.1) -- --
All Individuals3:2 - 5.............. 676 1481 (30.6) 14 (0.3) 55 (0.3) 32 (0.3) 12 (0.2) 11 (0.1) 7 (0.2) -- --6 - 11.............. 1047 1921 (35.4) 14 (0.2) 54 (0.3) 33 (0.3) 12 (0.2) 11 (0.1) 7 (0.1) -- --
12 - 19.............. 1296 2038 (31.1) 15 (0.3) 52 (0.6) 33 (0.4) 11 (0.2) 11 (0.2) 8 (0.2) -- --20 and over... 5047 2141 (18.7) 16 (0.2) 48 (0.2) 34 (0.2) 11 (0.1) 12 (0.1) 8 (0.1) 3 (0.2)
2 and over... 8066 2079 (17.2) 16 (0.2) 49 (0.2) 34 (0.2) 11 (0.1) 12 (0.1) 8 (0.1) -- --

What We Eat in America, NHANES 2013-2014
Page 2 of 2Page 2 of 2
Symbol Legend
* Indicates an estimate that may be less statistically reliable than estimates that are not flagged. The rules for flagging estimated means and percentages are as follows:
Mean: An estimated mean is flagged when based on a sample size of less than 30 times the variance inflation factor (VIF), where the VIF represents a broadly calculated average designeffect, or when the relative standard error is greater than 30 percent. The VIF used in this table is 1.98.
Percent: An estimated percentage between 25 and 75 percent is flagged when based on a sample size of less than 30 times the variance inflation factor (VIF), where the VIF represents abroadly calculated average design effect, or when the relative standard error is greater than 30 percent. An estimated percentage less than or equal to 25 percent or greater than or equal to75 percent is flagged when the smaller of np and n(1-p) is less than 8 times the VIF, where n is the sample size and p is the percentage expressed as a fraction. The VIF used in this table is1.98.
Footnotes
1 Percentages estimated as a ratio of each individual’s energy intake of protein, carbohydrate, fat and alcohol divided by the individual’s total food energy intake.
2 The ratio of family income to poverty expressed as a percentage. The Department of Health and Human Services’ poverty guidelines were used as the poverty measure to calculate the ratio, http://aspe.hhs.gov/poverty/.
3 Includes persons of all income levels or with unknown family income.
Abbreviations
SE = standard error.
Notes Applicable to All Tables in Series: What We Eat in America, NHANES 2013-2014
Sample weights designed for dietary analysis were used to allow estimates representative of the U. S. population for the years of collection.
The statistics in this table are estimated from Day 1 dietary recall interviews conducted in the What We Eat in America, National Health and Nutrition Examination Survey (NHANES) 2013-2014.The 24-hour dietary recalls were conducted in-person, by trained interviewers, using the USDA 5-step Automated Multiple-Pass Method. Food intakes were coded and nutrient values weredetermined using the USDA Food and Nutrient Database for Dietary Studies 2013-2014 www.ars.usda.gov/nea/bhnrc/fsrg.
Intakes of nutrients and other dietary components are based on the consumption of food and beverages, including water, and do not include intake from supplements or medications.
The table includes data from individuals 2 years and over. Breast-fed children were excluded because breast milk was not quantified in dietary recall interviews.
Although alcohol data are collected for all individuals, estimates are not presented for age groups under 20 years due to extreme variability and/or inadequate sample size.
Suggested Citation
U.S. Department of Agriculture, Agricultural Research Service. 2016. Energy Intakes: Percentages of Energy from Protein, Carbohydrate, Fat, and Alcohol, by Family Income (as % of PovertyLevel) and Age, What We Eat in America, NHANES 2013-2014.

DATA SOURCE: What We Eat in America, NHANES 2013-2014, individuals 2 years and over (excluding breast-fed children), day 1. Available: www.ars.usda.gov/nea/bhnrc/fsrg.Page 1 of 5
What We Eat in America, NHANES 2013-2014
Table 9. Away from Home1: Percentages2 of Selected Nutrients Contributed by Food and Beverages Consumed Away from Home,by Gender and Age, in the United States, 2013-2014
Genderand age
Percentreporting3 Energy Protein
Carbo-hydrate
Totalsugars
Dietaryfiber
Totalfat
Saturatedfat
Mono-unsaturated
fat
Poly-unsaturated
fat(years) % (SE) % (SE) % (SE) % (SE) % (SE) % (SE) % (SE) % (SE) % (SE) % (SE)
Males:2 - 5.............. 61 (3.0) 28 (1.9) 28 (3.1) 28 (2.0) 26 (2.0) 27 (1.9) 27 (1.8) 25 (1.9) 28 (1.7) 30 (2.4)6 - 11.............. 82 (2.3) 37 (2.3) 36 (2.1) 39 (2.4) 41 (2.8) 38 (2.9) 36 (2.3) 35 (3.1) 36 (2.1) 38 (2.4)
12 - 19.............. 67 (2.2) 33 (1.4) 31 (1.7) 33 (1.6) 33 (1.9) 31 (1.7) 34 (1.8) 33 (1.7) 34 (1.9) 37 (2.2)
20 - 29.............. 74 (2.1) 39 (2.1) 36 (2.0) 40 (2.0) 42 (2.1) 38 (2.7) 38 (2.8) 36 (3.1) 38 (2.9) 39 (2.5)30 - 39.............. 82 (1.9) 42 (1.8) 42 (2.1) 41 (1.6) 43 (2.2) 39 (2.1) 43 (2.0) 42 (1.7) 43 (2.1) 45 (2.7)40 - 49.............. 76 (4.1) 40 (2.7) 40 (2.4) 40 (2.9) 41 (3.3) 36 (2.7) 41 (2.9) 40 (3.0) 41 (2.9) 43 (3.0)
50 - 59.............. 64 (3.9) 31 (1.8) 31 (1.9) 30 (1.9) 26 (2.5) 30 (1.8) 33 (1.8) 30 (1.8) 34 (2.2) 35 (1.8)60 - 69.............. 65 (3.0) 30 (2.2) 29 (2.4) 29 (2.2) 29 (2.1) 24 (2.0) 32 (2.3) 30 (2.5) 32 (2.1) 33 (2.9)70 and over...... 45 (3.9) 19 (2.3) 20 (2.6) 17 (1.9) 15 (1.6) 15 (2.1) 21 (2.9) 20 (2.9) 21 (2.7) 23 (3.2)
2 - 19............ 71 (1.4) 34 (1.2) 32 (1.5) 34 (1.1) 35 (1.2) 33 (1.6) 34 (1.4) 33 (1.7) 34 (1.5) 36 (1.6)20 and over... 69 (1.4) 35 (1.1) 34 (1.1) 35 (1.1) 35 (1.4) 32 (1.1) 36 (1.2) 34 (1.2) 36 (1.2) 37 (1.3)
2 and over... 70 (1.3) 35 (0.9) 34 (0.9) 35 (0.9) 35 (1.2) 32 (1.1) 36 (1.1) 34 (1.1) 36 (1.1) 37 (1.1)
Females:2 - 5.............. 63 (4.7) 28 (1.8) 26 (1.3) 29 (2.2) 27 (1.4) 27 (1.5) 28 (1.7) 27 (1.7) 28 (1.8) 29 (2.2)6 - 11.............. 79 (2.9) 39 (1.7) 38 (2.1) 40 (1.6) 43 (2.0) 37 (2.1) 39 (1.7) 38 (1.8) 39 (1.9) 40 (2.1)
12 - 19.............. 70 (3.1) 35 (1.2) 34 (1.5) 33 (1.4) 35 (1.9) 31 (1.7) 37 (1.7) 36 (1.9) 36 (2.0) 39 (1.6)
20 - 29.............. 76 (2.4) 41 (2.5) 40 (2.2) 40 (2.6) 40 (3.2) 38 (2.6) 41 (2.3) 39 (2.2) 41 (2.0) 43 (2.8)30 - 39.............. 68 (2.7) 38 (2.4) 39 (2.7) 36 (2.4) 36 (2.8) 34 (2.5) 40 (2.6) 38 (3.0) 39 (2.8) 42 (2.4)40 - 49.............. 65 (3.1) 31 (1.7) 31 (1.5) 31 (2.1) 31 (2.8) 29 (2.0) 32 (2.0) 31 (2.1) 31 (2.1) 33 (2.3)
50 - 59.............. 63 (3.8) 30 (2.0) 28 (2.0) 29 (2.1) 27 (2.7) 28 (1.5) 32 (2.2) 32 (2.8) 31 (2.1) 31 (2.0)60 - 69.............. 55 (2.9) 26 (1.5) 25 (1.7) 24 (1.3) 22 (1.3) 23 (1.8) 27 (1.9) 25 (1.6) 27 (2.1) 30 (2.5)70 and over...... 42 (2.8) 19 (1.4) 19 (1.8) 17 (1.1) 16 (1.2) 15 (1.6) 21 (1.8) 19 (2.3) 20 (1.7) 24 (1.5)
2 - 19............ 71 (2.2) 35 (1.0) 34 (1.2) 35 (1.1) 36 (1.2) 32 (1.3) 36 (1.3) 35 (1.4) 36 (1.5) 38 (1.3)20 and over... 63 (1.3) 32 (0.7) 31 (0.6) 31 (0.8) 30 (0.9) 29 (0.7) 33 (0.8) 32 (1.0) 32 (0.7) 34 (0.8)
2 and over... 65 (1.3) 33 (0.6) 32 (0.5) 32 (0.7) 32 (0.8) 29 (0.7) 33 (0.7) 33 (0.9) 33 (0.7) 35 (0.6)
Males and females:2 - 19............ 71 (1.2) 34 (0.9) 33 (1.0) 35 (0.9) 35 (0.9) 32 (1.2) 35 (1.1) 34 (1.4) 35 (1.1) 37 (1.0)20 and over... 66 (1.2) 34 (0.7) 33 (0.6) 33 (0.8) 33 (1.0) 30 (0.8) 35 (0.8) 33 (0.8) 35 (0.8) 36 (0.8)
2 and over... 67 (1.1) 34 (0.6) 33 (0.5) 33 (0.7) 33 (0.9) 31 (0.7) 35 (0.7) 33 (0.8) 35 (0.7) 36 (0.7)

DATA SOURCE: What We Eat in America, NHANES 2013-2014, individuals 2 years and over (excluding breast-fed children), day 1. Available: www.ars.usda.gov/nea/bhnrc/fsrg.Page 2 of 5
What We Eat in America, NHANES 2013-2014
Table 9. Away from Home1: Percentages2 of Selected Nutrients Contributed by Food and Beverages Consumed Away from Home,by Gender and Age, in the United States, 2013-2014 (continued)
Genderand age
Choles-terol
Vitamin A(RAE)
Beta-carotene Lycopene Thiamin
Ribo-flavin Niacin Vitamin B6
Folate(DFE)
(years) % (SE) % (SE) % (SE) % (SE) % (SE) % (SE) % (SE) % (SE) % (SE)
Males:2 - 5.............. 26 (3.9) 27 (2.1) 38 (11.1) 33 (7.7) 28 (2.9) 26 (2.7) 27 (2.4) 24 (1.6) 25 (3.1)6 - 11.............. 32 (3.0) 33 (2.5) 37 (6.6) 36 (4.8) 34 (2.2) 35 (2.3) 34 (2.1) 32 (3.2) 28 (2.3)
12 - 19.............. 28 (2.2) 25 (1.8) 37 (6.7) 29 (3.8) 31 (1.9) 29 (2.4) 35 (2.3) 32 (3.1) 25 (1.8)
20 - 29.............. 34 (2.2) 32 (3.8) 47 (8.3) 34 (3.1) 34 (2.2) 37 (2.4) 41 (2.2) 42 (2.4) 31 (2.5)30 - 39.............. 40 (2.4) 38 (3.3) 46 (8.3) 39 (4.2) 39 (1.6) 40 (2.0) 44 (2.5) 42 (3.3) 35 (1.9)40 - 49.............. 39 (3.0) 33 (2.9) 36 (3.9) 31 (4.4) 37 (2.9) 37 (2.5) 40 (2.4) 38 (2.0) 35 (2.5)
50 - 59.............. 29 (2.1) 23 (2.4) 23 (2.8) 25 (4.6) 29 (2.1) 29 (2.2) 32 (2.3) 30 (2.2) 26 (1.8)60 - 69.............. 33 (3.5) 23 (2.6) 25 (4.8) 26 (6.4) 26 (2.7) 25 (2.4) 29 (2.5) 26 (2.7) 24 (2.7)70 and over...... 22 (2.9) 18 (2.9) 23 (5.3) 12* (4.3) 17 (2.4) 16 (2.0) 18 (2.3) 15 (2.2) 14 (2.2)
2 - 19............ 29 (1.9) 29 (1.4) 37 (3.7) 32 (2.2) 32 (1.1) 31 (1.6) 34 (1.4) 31 (1.9) 26 (1.3)20 and over... 34 (1.1) 29 (1.3) 34 (2.3) 29 (2.1) 32 (1.1) 32 (1.0) 36 (1.1) 35 (1.3) 29 (1.0)
2 and over... 33 (1.1) 29 (1.2) 35 (2.0) 30 (1.6) 32 (1.0) 32 (0.9) 36 (0.9) 34 (1.1) 28 (1.0)
Females:2 - 5.............. 23 (2.2) 24 (1.6) 31 (4.2) 26 (5.3) 26 (2.0) 25 (1.8) 26 (1.9) 22 (1.4) 23 (2.5)6 - 11.............. 37 (2.3) 36 (2.0) 35 (4.2) 28 (3.3) 34 (1.9) 37 (2.0) 35 (2.0) 34 (2.0) 30 (2.0)
12 - 19.............. 33 (2.2) 29 (2.0) 24 (5.8) 33 (4.7) 31 (1.2) 33 (1.6) 34 (1.5) 31 (1.8) 26 (1.7)
20 - 29.............. 37 (2.4) 33 (2.1) 43 (5.1) 41 (3.9) 36 (2.2) 36 (2.5) 43 (2.6) 42 (3.3) 35 (2.8)30 - 39.............. 36 (2.8) 34 (3.6) 35 (5.5) 37 (4.3) 35 (2.4) 36 (3.4) 39 (2.1) 39 (2.3) 33 (2.3)40 - 49.............. 32 (2.6) 28 (2.7) 31 (4.0) 28 (5.2) 29 (1.7) 27 (2.0) 32 (1.8) 30 (2.1) 28 (1.9)
50 - 59.............. 30 (2.7) 22 (1.3) 20 (2.7) 34 (6.1) 25 (1.8) 24 (1.6) 26 (2.0) 25 (1.6) 24 (1.7)60 - 69.............. 27 (2.0) 19 (2.1) 20 (3.1) 23 (4.6) 24 (1.6) 22 (1.5) 25 (1.9) 24 (1.7) 22 (1.9)70 and over...... 22 (2.4) 17 (2.3) 18 (4.3) 14 (2.5) 17 (1.4) 14 (1.1) 18 (1.4) 16 (1.5) 15 (1.6)
2 - 19............ 33 (1.7) 30 (1.0) 29 (3.3) 30 (3.1) 31 (1.0) 33 (0.7) 33 (1.1) 31 (1.2) 27 (1.4)20 and over... 31 (1.1) 26 (1.0) 28 (2.1) 30 (2.8) 28 (0.6) 27 (0.8) 32 (0.7) 30 (0.8) 27 (0.6)
2 and over... 32 (0.9) 27 (0.8) 28 (1.8) 30 (2.4) 29 (0.7) 29 (0.7) 32 (0.6) 30 (0.7) 27 (0.6)
Males and females:2 - 19............ 31 (1.3) 29 (1.0) 33 (2.4) 31 (1.7) 31 (0.8) 32 (1.0) 33 (0.9) 31 (1.1) 26 (1.0)20 and over... 33 (0.8) 27 (0.7) 31 (1.6) 30 (2.1) 30 (0.6) 30 (0.6) 34 (0.7) 33 (0.9) 28 (0.6)
2 and over... 32 (0.8) 28 (0.7) 31 (1.3) 30 (1.7) 30 (0.6) 31 (0.6) 34 (0.6) 32 (0.8) 28 (0.6)

DATA SOURCE: What We Eat in America, NHANES 2013-2014, individuals 2 years and over (excluding breast-fed children), day 1. Available: www.ars.usda.gov/nea/bhnrc/fsrg.Page 3 of 5
What We Eat in America, NHANES 2013-2014
Table 9. Away from Home1: Percentages2 of Selected Nutrients Contributed by Food and Beverages Consumed Away from Home,by Gender and Age, in the United States, 2013-2014 (continued)
Genderand age Choline Vitamin B12 Vitamin C Vitamin D
Vitamin E(alpha-
tocopherol) Vitamin K Calcium Phosphorus Magnesium(years) % (SE) % (SE) % (SE) % (SE) % (SE) % (SE) % (SE) % (SE) % (SE)
Males:2 - 5.............. 27 (3.0) 28 (3.8) 23 (2.4) 26 (3.8) 30 (2.5) 32 (5.1) 25 (2.6) 27 (2.4) 27 (2.2)6 - 11.............. 35 (2.7) 33 (2.8) 38 (4.1) 35 (3.1) 36 (3.0) 33 (4.1) 37 (2.3) 37 (2.2) 37 (2.4)
12 - 19.............. 28 (1.9) 30 (2.8) 27 (2.8) 20 (1.9) 29 (3.7) 29 (2.6) 29 (1.3) 31 (1.5) 29 (1.6)
20 - 29.............. 35 (2.0) 39 (3.0) 36 (4.2) 23 (3.2) 40 (4.0) 39 (5.5) 32 (3.2) 35 (2.4) 36 (2.2)30 - 39.............. 41 (2.2) 41 (3.5) 36 (3.1) 29 (2.9) 43 (3.5) 50 (3.5) 38 (1.6) 41 (1.8) 40 (1.8)40 - 49.............. 37 (2.4) 36 (2.9) 35 (3.4) 29 (5.0) 41 (3.7) 41 (3.2) 37 (3.0) 38 (2.4) 36 (2.4)
50 - 59.............. 31 (2.1) 28 (2.5) 25 (1.7) 21 (3.0) 33 (3.0) 29 (2.5) 27 (2.0) 30 (1.6) 30 (2.1)60 - 69.............. 29 (2.5) 24 (2.6) 24 (3.6) 19 (3.7) 30 (2.7) 26 (2.9) 25 (2.6) 28 (2.3) 25 (2.0)70 and over...... 20 (2.4) 19 (3.3) 12 (2.3) 13 (2.6) 16 (2.4) 18 (3.2) 14 (2.2) 17 (2.2) 15 (2.2)
2 - 19............ 30 (1.7) 31 (1.6) 30 (1.7) 27 (1.9) 32 (2.6) 31 (2.3) 31 (1.3) 33 (1.3) 32 (1.4)20 and over... 34 (0.8) 33 (1.4) 29 (1.4) 23 (1.8) 35 (1.7) 35 (2.1) 30 (1.2) 33 (1.0) 32 (0.9)
2 and over... 33 (0.8) 33 (1.4) 29 (1.3) 24 (1.6) 35 (1.5) 34 (1.7) 31 (1.1) 33 (0.9) 32 (0.8)
Females:2 - 5.............. 24 (1.3) 23 (1.5) 23 (2.4) 22 (1.6) 28 (1.5) 25 (2.0) 24 (1.4) 26 (1.1) 26 (1.3)6 - 11.............. 38 (2.3) 35 (2.3) 39 (2.6) 38 (2.9) 35 (2.9) 32 (3.5) 39 (1.9) 39 (1.8) 37 (2.1)
12 - 19.............. 33 (1.5) 34 (2.3) 30 (2.1) 29 (2.8) 33 (2.0) 34 (2.0) 34 (2.0) 35 (1.6) 32 (1.4)
20 - 29.............. 38 (2.6) 34 (3.1) 38 (3.5) 26 (4.2) 36 (2.9) 45 (3.7) 35 (2.2) 38 (2.4) 39 (2.4)30 - 39.............. 36 (2.7) 40 (3.9) 35 (2.7) 35 (4.0) 38 (3.6) 45 (6.5) 34 (2.8) 37 (2.7) 36 (2.5)40 - 49.............. 30 (2.3) 33 (3.2) 30 (2.5) 28 (3.4) 30 (2.2) 27 (4.2) 29 (2.1) 30 (1.8) 29 (1.7)
50 - 59.............. 28 (1.9) 23 (1.9) 27 (2.8) 19 (2.3) 30 (1.3) 25 (3.6) 27 (2.2) 28 (1.7) 26 (1.7)60 - 69.............. 23 (2.0) 23 (3.0) 19 (2.1) 13 (2.5) 24 (2.1) 23 (2.7) 21 (1.6) 25 (1.7) 22 (1.8)70 and over...... 19 (1.7) 17 (1.7) 13 (2.3) 9 (1.6) 17 (1.7) 21 (2.6) 13 (1.4) 17 (1.5) 15 (1.3)
2 - 19............ 33 (1.1) 32 (1.2) 31 (1.1) 30 (1.5) 33 (1.5) 32 (1.4) 34 (1.1) 34 (1.0) 33 (1.2)20 and over... 30 (0.8) 29 (1.3) 28 (1.0) 22 (1.3) 30 (0.9) 31 (1.6) 28 (0.7) 30 (0.7) 28 (0.5)
2 and over... 30 (0.6) 30 (1.1) 28 (0.7) 24 (1.2) 31 (0.8) 31 (1.4) 29 (0.6) 31 (0.6) 29 (0.5)
Males and females:2 - 19............ 31 (1.1) 31 (1.1) 31 (1.1) 28 (1.2) 32 (1.6) 31 (1.4) 33 (1.0) 33 (0.9) 32 (0.9)20 and over... 32 (0.6) 32 (1.0) 28 (0.8) 23 (1.1) 33 (1.1) 33 (1.6) 29 (0.7) 32 (0.6) 31 (0.6)
2 and over... 32 (0.5) 31 (0.9) 29 (0.7) 24 (0.9) 33 (0.9) 33 (1.3) 30 (0.7) 32 (0.6) 31 (0.5)

DATA SOURCE: What We Eat in America, NHANES 2013-2014, individuals 2 years and over (excluding breast-fed children), day 1. Available: www.ars.usda.gov/nea/bhnrc/fsrg.Page 4 of 5
What We Eat in America, NHANES 2013-2014
Table 9. Away from Home1: Percentages2 of Selected Nutrients Contributed by Food and Beverages Consumed Away from Home,by Gender and Age, in the United States, 2013-2014 (continued)
Genderand age Iron Zinc Copper Selenium Potassium Sodium Caffeine Alcohol(years) % (SE) % (SE) % (SE) % (SE) % (SE) % (SE) % (SE) % (SE)
Males:2 - 5.............. 27 (3.1) 26 (2.7) 27 (2.6) 27 (2.5) 27 (2.2) 30 (2.3) 33 (5.5) -- -- 6 - 11.............. 32 (2.0) 33 (2.4) 38 (2.6) 34 (2.2) 38 (2.4) 37 (1.9) 40 (3.9) -- --
12 - 19.............. 27 (1.6) 27 (1.9) 30 (1.7) 31 (1.5) 31 (1.6) 34 (1.2) 37 (3.5) -- --
20 - 29.............. 33 (2.2) 34 (2.4) 37 (2.8) 35 (2.2) 36 (2.2) 38 (2.4) 46 (7.9) -- -- 30 - 39.............. 38 (1.6) 42 (2.1) 41 (2.0) 42 (1.9) 41 (1.9) 43 (1.8) 43 (3.1) -- -- 40 - 49.............. 35 (2.8) 37 (2.5) 38 (3.0) 39 (2.7) 38 (2.3) 40 (2.7) 44 (4.6) -- --
50 - 59.............. 27 (1.9) 30 (2.1) 31 (2.1) 30 (2.2) 30 (1.6) 33 (2.1) 26 (3.3) -- -- 60 - 69.............. 25 (2.3) 25 (1.9) 25 (1.9) 30 (3.0) 27 (2.0) 30 (2.3) 33 (3.4) -- -- 70 and over...... 15 (2.1) 17 (2.7) 18 (2.3) 20 (2.8) 17 (2.1) 20 (2.7) 19 (4.2) -- --
2 - 19............ 29 (1.4) 29 (1.6) 32 (1.4) 32 (1.3) 33 (1.5) 34 (1.2) 37 (2.7) -- -- 20 and over... 30 (1.0) 32 (1.1) 33 (0.9) 34 (1.1) 33 (0.8) 36 (1.1) 36 (1.1) 40 (3.4)
2 and over... 30 (1.0) 32 (1.1) 33 (0.9) 34 (1.0) 33 (0.8) 35 (1.0) 36 (1.1) -- --
Females:2 - 5.............. 25 (2.0) 25 (1.8) 29 (1.7) 26 (1.8) 26 (1.5) 28 (1.9) 28 (6.1) -- -- 6 - 11.............. 31 (1.9) 35 (2.4) 36 (1.9) 35 (1.8) 40 (2.0) 39 (1.8) 43 (3.5) -- --
12 - 19.............. 30 (1.6) 31 (1.7) 32 (1.7) 33 (1.4) 32 (1.3) 34 (1.3) 41 (5.7) -- --
20 - 29.............. 34 (2.1) 36 (2.3) 38 (2.6) 40 (1.9) 39 (2.5) 41 (2.4) 49 (7.4) -- -- 30 - 39.............. 33 (2.5) 37 (3.0) 36 (2.8) 39 (2.4) 37 (2.5) 37 (2.2) 36 (3.9) -- -- 40 - 49.............. 29 (2.1) 30 (2.3) 29 (2.2) 31 (1.6) 30 (2.2) 31 (1.9) 23 (4.3) -- --
50 - 59.............. 23 (1.3) 27 (1.8) 26 (1.8) 30 (2.2) 27 (1.6) 31 (2.2) 24 (3.6) -- -- 60 - 69.............. 23 (1.7) 23 (1.4) 24 (2.4) 25 (1.9) 24 (1.8) 27 (1.8) 23 (2.7) -- -- 70 and over...... 15 (1.1) 15 (1.6) 16 (1.3) 19 (1.7) 16 (1.4) 20 (1.6) 15 (1.6) -- --
2 - 19............ 29 (1.2) 31 (1.3) 33 (1.1) 32 (1.2) 34 (0.9) 35 (1.1) 41 (4.5) -- -- 20 and over... 27 (0.8) 29 (0.9) 29 (0.7) 32 (0.8) 29 (0.6) 32 (0.8) 27 (0.9) 42 (3.9)
2 and over... 27 (0.7) 29 (0.8) 30 (0.6) 32 (0.7) 30 (0.5) 33 (0.7) 28 (0.9) -- --
Males and females:2 - 19............ 29 (0.9) 30 (0.9) 32 (1.0) 32 (1.0) 33 (0.9) 35 (0.8) 39 (2.5) -- -- 20 and over... 29 (0.7) 31 (0.8) 31 (0.6) 33 (0.7) 31 (0.6) 34 (0.7) 32 (0.8) 41 (3.3)
2 and over... 29 (0.7) 31 (0.7) 31 (0.6) 33 (0.6) 32 (0.5) 34 (0.7) 32 (0.8) -- --
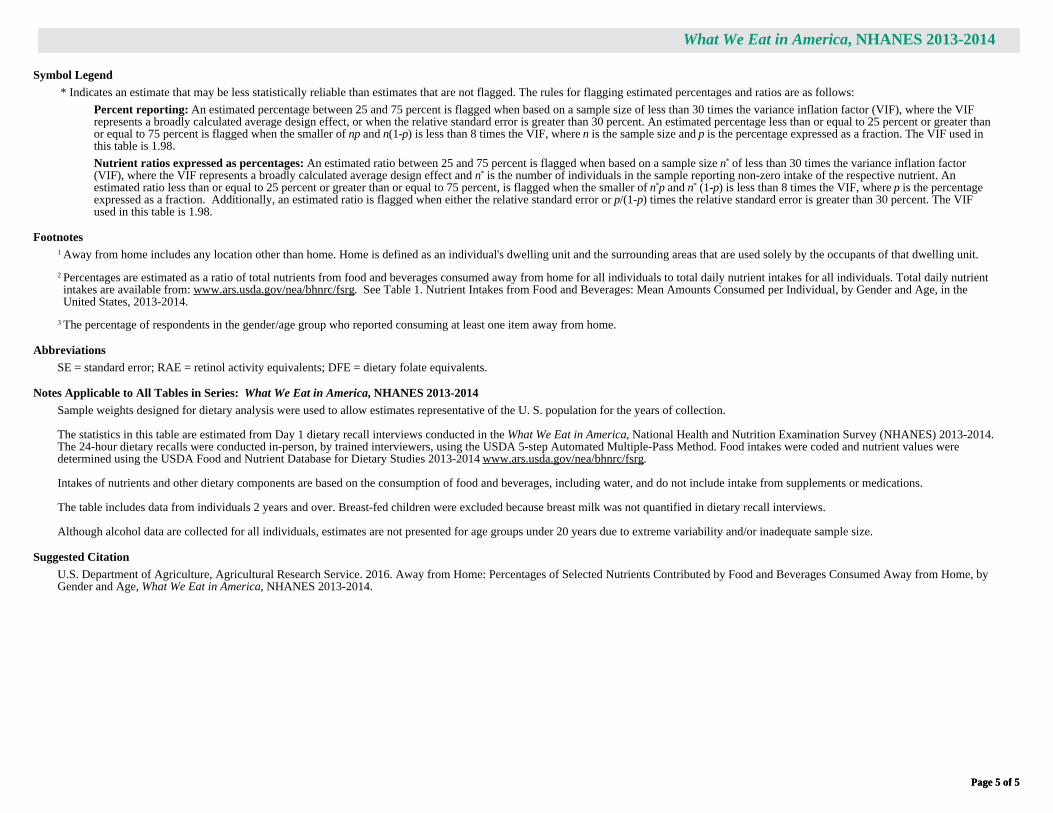
What We Eat in America, NHANES 2013-2014
Page 5 of 5Page 5 of 5
Symbol Legend
* Indicates an estimate that may be less statistically reliable than estimates that are not flagged. The rules for flagging estimated percentages and ratios are as follows:
Percent reporting: An estimated percentage between 25 and 75 percent is flagged when based on a sample size of less than 30 times the variance inflation factor (VIF), where the VIFrepresents a broadly calculated average design effect, or when the relative standard error is greater than 30 percent. An estimated percentage less than or equal to 25 percent or greater thanor equal to 75 percent is flagged when the smaller of np and n(1-p) is less than 8 times the VIF, where n is the sample size and p is the percentage expressed as a fraction. The VIF used inthis table is 1.98.
Nutrient ratios expressed as percentages: An estimated ratio between 25 and 75 percent is flagged when based on a sample size n* of less than 30 times the variance inflation factor(VIF), where the VIF represents a broadly calculated average design effect and n* is the number of individuals in the sample reporting non-zero intake of the respective nutrient. Anestimated ratio less than or equal to 25 percent or greater than or equal to 75 percent, is flagged when the smaller of n*p and n* (1-p) is less than 8 times the VIF, where p is the percentageexpressed as a fraction. Additionally, an estimated ratio is flagged when either the relative standard error or p/(1-p) times the relative standard error is greater than 30 percent. The VIFused in this table is 1.98.
Footnotes
1 Away from home includes any location other than home. Home is defined as an individual's dwelling unit and the surrounding areas that are used solely by the occupants of that dwelling unit.
2 Percentages are estimated as a ratio of total nutrients from food and beverages consumed away from home for all individuals to total daily nutrient intakes for all individuals. Total daily nutrientintakes are available from: www.ars.usda.gov/nea/bhnrc/fsrg. See Table 1. Nutrient Intakes from Food and Beverages: Mean Amounts Consumed per Individual, by Gender and Age, in theUnited States, 2013-2014.
3 The percentage of respondents in the gender/age group who reported consuming at least one item away from home.
Abbreviations
SE = standard error; RAE = retinol activity equivalents; DFE = dietary folate equivalents.
Notes Applicable to All Tables in Series: What We Eat in America, NHANES 2013-2014
Sample weights designed for dietary analysis were used to allow estimates representative of the U. S. population for the years of collection.
The statistics in this table are estimated from Day 1 dietary recall interviews conducted in the What We Eat in America, National Health and Nutrition Examination Survey (NHANES) 2013-2014.The 24-hour dietary recalls were conducted in-person, by trained interviewers, using the USDA 5-step Automated Multiple-Pass Method. Food intakes were coded and nutrient values weredetermined using the USDA Food and Nutrient Database for Dietary Studies 2013-2014 www.ars.usda.gov/nea/bhnrc/fsrg.
Intakes of nutrients and other dietary components are based on the consumption of food and beverages, including water, and do not include intake from supplements or medications.
The table includes data from individuals 2 years and over. Breast-fed children were excluded because breast milk was not quantified in dietary recall interviews.
Although alcohol data are collected for all individuals, estimates are not presented for age groups under 20 years due to extreme variability and/or inadequate sample size.
Suggested Citation
U.S. Department of Agriculture, Agricultural Research Service. 2016. Away from Home: Percentages of Selected Nutrients Contributed by Food and Beverages Consumed Away from Home, byGender and Age, What We Eat in America, NHANES 2013-2014.

DATA SOURCE: What We Eat in America, NHANES 2013-2014, individuals 2 years and over (excluding breast-fed children), day 1. Available: www.ars.usda.gov/nea/bhnrc/fsrg.Page 1 of 5
What We Eat in America, NHANES 2013-2014
Table 10. Away from Home1: Percentages2 of Selected Nutrients Contributed by Food and Beverages Consumed Away from Home,by Race/Ethnicity and Age, in the United States, 2013-2014
Race/ethnicityand age
Percentreporting3 Energy Protein
Carbo-hydrate
Totalsugars
Dietaryfiber
Totalfat
Saturatedfat
Mono-unsaturated
fat
Poly-unsaturated
fat(years) % (SE) % (SE) % (SE) % (SE) % (SE) % (SE) % (SE) % (SE) % (SE) % (SE)
Non-Hispanic White:2 - 5.............. 67 (3.9) 31 (1.9) 32 (3.3) 31 (1.9) 31 (1.8) 30 (1.7) 32 (1.9) 30 (2.4) 32 (1.9) 34 (2.4)6 - 11.............. 82 (3.6) 40 (2.3) 38 (2.3) 41 (2.4) 44 (2.8) 39 (3.3) 39 (2.6) 39 (3.6) 39 (2.2) 41 (2.9)
12 - 19.............. 70 (2.7) 35 (1.7) 34 (2.0) 33 (1.9) 33 (2.2) 31 (2.6) 37 (2.1) 35 (2.2) 37 (2.2) 40 (2.6)20 and over... 66 (1.7) 34 (0.8) 33 (0.8) 33 (0.9) 32 (1.3) 30 (1.0) 35 (1.0) 33 (1.0) 35 (1.1) 36 (1.0)
2 and over... 68 (1.5) 34 (0.7) 33 (0.7) 33 (0.8) 33 (1.2) 31 (1.0) 35 (0.8) 34 (0.9) 35 (0.9) 37 (0.8)
Non-Hispanic Black:2 - 5.............. 61 (4.7) 29 (2.4) 27 (2.0) 29 (2.9) 30 (3.6) 28 (2.7) 29 (2.2) 29 (2.2) 29 (2.2) 29 (2.9)6 - 11.............. 75 (3.2) 36 (2.3) 37 (2.9) 37 (2.3) 39 (3.2) 39 (2.9) 35 (2.6) 35 (2.9) 35 (2.7) 36 (2.7)
12 - 19.............. 63 (3.4) 31 (2.7) 30 (2.4) 30 (2.6) 30 (3.0) 29 (2.4) 32 (3.1) 31 (3.3) 31 (3.2) 34 (3.4)20 and over... 61 (1.6) 31 (1.0) 31 (1.3) 31 (0.8) 32 (0.6) 30 (1.5) 33 (1.0) 32 (0.9) 33 (1.1) 34 (1.4)
2 and over... 63 (1.3) 32 (0.7) 31 (0.9) 31 (0.7) 32 (0.7) 30 (1.1) 33 (0.6) 32 (0.7) 33 (0.7) 34 (0.9)
Non-Hispanic Asian4:2 - 5.............. 46* (8.8) 20* (4.2) 18* (4.3) 20* (3.9) 18* (3.7) 17* (4.4) 21* (4.8) 18* (4.1) 22* (5.5) 24* (6.4)6 - 11.............. 77 (5.7) 31 (5.6) 28 (6.1) 35 (6.2) 36 (7.3) 33 (6.6) 26 (4.5) 23 (5.3) 25 (4.1) 32 (5.4)
12 - 19.............. 68 (9.3) 34 (7.4) 33 (8.6) 33 (7.0) 37 (8.0) 29 (6.1) 35 (7.3) 34 (7.4) 33 (6.8) 38 (8.0)20 and over... 64 (1.6) 33 (2.0) 34 (2.0) 32 (2.1) 34 (2.5) 30 (2.3) 35 (2.0) 33 (1.8) 35 (2.0) 36 (2.5)
2 and over... 64 (1.7) 33 (2.0) 33 (2.2) 32 (2.1) 34 (2.6) 29 (2.1) 34 (1.9) 32 (1.9) 33 (1.8) 35 (2.4)
Hispanic:2 - 5.............. 59 (3.1) 24 (2.0) 22 (2.1) 25 (2.2) 23 (2.3) 25 (2.5) 24 (1.8) 22 (1.9) 24 (1.8) 26 (1.9)6 - 11.............. 80 (2.7) 35 (2.1) 33 (1.6) 36 (2.2) 38 (2.8) 34 (2.3) 34 (2.4) 32 (2.6) 34 (2.4) 38 (2.5)
12 - 19.............. 71 (2.8) 36 (2.4) 32 (2.1) 36 (2.6) 39 (3.1) 33 (2.4) 36 (2.6) 35 (2.6) 35 (2.4) 38 (2.9)20 and over... 69 (2.0) 35 (1.3) 35 (1.5) 35 (1.3) 37 (1.5) 31 (1.3) 35 (1.4) 34 (1.3) 35 (1.4) 36 (1.9)
2 and over... 70 (1.5) 35 (1.3) 33 (1.2) 34 (1.3) 36 (1.4) 31 (1.3) 34 (1.4) 33 (1.3) 34 (1.3) 36 (1.8)

DATA SOURCE: What We Eat in America, NHANES 2013-2014, individuals 2 years and over (excluding breast-fed children), day 1. Available: www.ars.usda.gov/nea/bhnrc/fsrg.Page 2 of 5
What We Eat in America, NHANES 2013-2014
Table 10. Away from Home1: Percentages2 of Selected Nutrients Contributed by Food and Beverages Consumed Away from Home,by Race/Ethnicity and Age, in the United States, 2013-2014 (continued)
Race/ethnicityand age
Choles-terol
Vitamin A(RAE)
Beta-carotene Lycopene Thiamin
Ribo-flavin Niacin Vitamin B6
Folate(DFE)
(years) % (SE) % (SE) % (SE) % (SE) % (SE) % (SE) % (SE) % (SE) % (SE)
Non-Hispanic White:2 - 5.............. 33 (4.3) 30 (2.3) 42 (7.0) 32* (9.9) 30 (2.8) 29 (2.8) 29 (2.2) 27 (1.9) 27 (3.5)6 - 11.............. 35 (3.8) 34 (2.7) 37 (6.7) 36 (6.2) 35 (2.4) 37 (2.4) 35 (2.4) 33 (3.0) 29 (2.7)
12 - 19.............. 32 (2.5) 27 (2.2) 29 (6.9) 24 (3.7) 33 (2.2) 32 (2.4) 36 (2.1) 34 (3.0) 26 (1.9)20 and over... 33 (1.2) 27 (1.0) 29 (1.6) 29 (2.5) 30 (0.8) 30 (0.6) 34 (0.7) 32 (1.1) 28 (0.9)
2 and over... 33 (1.2) 28 (0.9) 30 (1.4) 29 (2.3) 31 (0.8) 30 (0.6) 34 (0.6) 32 (0.8) 28 (0.9)
Non-Hispanic Black:2 - 5.............. 24 (2.9) 27 (2.8) 20 (4.8) 32 (8.5) 27 (3.0) 27 (2.8) 26 (3.4) 26 (3.8) 23 (3.8)6 - 11.............. 34 (3.0) 42 (4.4) 42 (8.8) 28 (3.6) 35 (2.5) 41 (3.3) 35 (3.0) 39 (5.0) 33 (1.8)
12 - 19.............. 27 (3.0) 25 (2.9) 24 (3.9) 25 (6.9) 27 (2.4) 28 (3.0) 30 (3.0) 27 (3.0) 21 (2.8)20 and over... 31 (1.1) 28 (1.6) 29 (3.9) 33 (4.2) 29 (1.3) 28 (1.0) 30 (1.1) 29 (1.0) 28 (1.5)
2 and over... 30 (0.8) 29 (1.3) 30 (3.1) 32 (3.7) 29 (1.1) 29 (0.9) 30 (0.9) 30 (0.8) 27 (1.3)
Non-Hispanic Asian4:2 - 5.............. 16* (4.8) 13* (4.7) 8* (3.2) 27*(11.6) 17* (4.1) 17* (4.9) 18* (4.7) 15* (4.4) 15* (4.0)6 - 11.............. 25* (7.8) 23* (4.5) 13* (2.4) 45*(10.1) 27 (5.0) 28 (6.4) 29 (5.1) 27 (4.9) 21* (4.2)
12 - 19.............. 38 (9.8) 27 (7.1) 34*(11.1) 37*(19.4) 27 (6.2) 26 (6.3) 33 (8.8) 32 (7.5) 25 (7.0)20 and over... 34 (2.0) 34 (2.9) 39 (5.4) 24 (5.6) 30 (1.9) 31 (1.6) 34 (2.3) 32 (1.9) 29 (2.2)
2 and over... 33 (2.2) 31 (2.4) 37 (4.5) 28 (5.6) 29 (1.7) 29 (1.7) 33 (2.3) 31 (2.0) 27 (1.9)
Hispanic:2 - 5.............. 19 (2.5) 20 (2.7) 27 (6.5) 27 (6.1) 23 (2.7) 21 (2.6) 24 (2.7) 21 (2.7) 23 (3.4)6 - 11.............. 29 (2.6) 31 (2.3) 34 (6.9) 24 (3.4) 31 (1.4) 33 (2.1) 33 (1.4) 30 (1.5) 26 (1.4)
12 - 19.............. 29 (2.5) 29 (2.0) 35 (4.2) 48 (8.4) 31 (2.0) 31 (1.7) 33 (2.0) 28 (2.0) 29 (2.2)20 and over... 31 (1.6) 28 (1.7) 36 (4.3) 34 (2.4) 32 (1.4) 33 (2.1) 38 (2.0) 38 (2.5) 29 (1.1)
2 and over... 30 (1.3) 28 (1.1) 35 (3.2) 34 (2.4) 31 (1.3) 32 (1.7) 36 (1.8) 35 (2.2) 29 (1.0)

DATA SOURCE: What We Eat in America, NHANES 2013-2014, individuals 2 years and over (excluding breast-fed children), day 1. Available: www.ars.usda.gov/nea/bhnrc/fsrg.Page 3 of 5
What We Eat in America, NHANES 2013-2014
Table 10. Away from Home1: Percentages2 of Selected Nutrients Contributed by Food and Beverages Consumed Away from Home,by Race/Ethnicity and Age, in the United States, 2013-2014 (continued)
Race/ethnicityand age Choline Vitamin B12 Vitamin C Vitamin D
Vitamin E(alpha-
tocopherol) Vitamin K Calcium Phosphorus Magnesium(years) % (SE) % (SE) % (SE) % (SE) % (SE) % (SE) % (SE) % (SE) % (SE)
Non-Hispanic White:2 - 5.............. 32 (3.3) 30 (3.5) 28 (2.7) 30 (4.0) 33 (2.7) 32 (4.7) 28 (2.8) 31 (2.5) 30 (2.4)6 - 11.............. 38 (3.3) 34 (3.2) 40 (4.9) 36 (3.9) 36 (3.2) 30 (5.5) 38 (2.5) 39 (2.3) 39 (2.7)
12 - 19.............. 30 (1.9) 33 (2.9) 26 (3.0) 24 (2.4) 30 (4.4) 31 (2.6) 32 (2.0) 33 (1.8) 31 (2.1)20 and over... 32 (0.7) 31 (1.3) 28 (0.9) 21 (1.4) 33 (1.5) 34 (2.1) 29 (1.0) 32 (0.8) 30 (0.7)
2 and over... 32 (0.7) 31 (1.2) 28 (0.8) 23 (1.2) 33 (1.3) 33 (1.9) 30 (0.9) 32 (0.7) 31 (0.7)
Non-Hispanic Black:2 - 5.............. 26 (2.1) 30 (3.1) 29 (3.8) 30 (3.4) 29 (2.8) 26 (5.0) 29 (2.4) 29 (1.9) 28 (2.4)6 - 11.............. 38 (3.1) 43 (3.9) 39 (4.6) 48 (4.6) 36 (2.6) 32 (5.8) 43 (3.1) 40 (2.7) 38 (2.7)
12 - 19.............. 28 (2.3) 29 (3.2) 28 (4.1) 26 (4.5) 31 (2.9) 27 (3.0) 30 (3.3) 31 (2.7) 28 (2.8)20 and over... 30 (1.2) 30 (2.4) 31 (2.0) 25 (2.7) 32 (1.5) 29 (3.0) 30 (1.4) 31 (1.2) 30 (1.3)
2 and over... 30 (0.9) 31 (1.8) 31 (2.0) 28 (2.1) 32 (1.1) 29 (2.4) 31 (1.1) 32 (0.8) 30 (1.1)
Non-Hispanic Asian4:2 - 5.............. 17* (5.0) 18* (8.1) 10* (3.6) 14* (5.1) 20* (4.9) 20* (6.2) 17* (4.6) 18* (4.7) 19* (4.9)6 - 11.............. 27 (7.0) 25 (6.1) 24* (7.5) 24* (8.0) 29 (3.7) 26 (5.0) 28 (7.5) 30 (6.6) 30 (5.6)
12 - 19.............. 33 (8.6) 25 (6.5) 35*(11.9) 17 (3.6) 33 (8.1) 34*(10.6) 27 (5.0) 31 (7.2) 30 (6.1)20 and over... 32 (2.0) 31 (2.7) 31 (3.0) 28 (3.6) 33 (2.2) 30 (3.4) 30 (1.4) 32 (1.6) 30 (1.9)
2 and over... 32 (2.1) 29 (2.2) 31 (2.6) 25 (2.8) 32 (2.0) 30 (2.9) 28 (1.6) 31 (1.8) 30 (1.9)
Hispanic:2 - 5.............. 20 (1.8) 19 (3.2) 20 (4.1) 16 (2.6) 26 (2.1) 26 (3.6) 20 (2.2) 22 (2.1) 22 (2.3)6 - 11.............. 33 (2.0) 29 (2.1) 33 (2.9) 31 (2.8) 34 (3.3) 39 (4.4) 35 (2.8) 35 (2.1) 33 (2.1)
12 - 19.............. 30 (2.3) 29 (2.1) 32 (1.6) 24 (2.2) 33 (3.1) 38 (3.9) 33 (1.3) 33 (1.8) 32 (1.7)20 and over... 32 (1.5) 36 (2.3) 29 (3.0) 27 (1.3) 34 (1.8) 36 (3.2) 30 (1.3) 33 (1.4) 32 (1.2)
2 and over... 31 (1.3) 33 (1.8) 29 (2.0) 26 (1.1) 34 (1.6) 36 (2.5) 31 (1.0) 32 (1.2) 32 (1.1)

DATA SOURCE: What We Eat in America, NHANES 2013-2014, individuals 2 years and over (excluding breast-fed children), day 1. Available: www.ars.usda.gov/nea/bhnrc/fsrg.Page 4 of 5
What We Eat in America, NHANES 2013-2014
Table 10. Away from Home1: Percentages2 of Selected Nutrients Contributed by Food and Beverages Consumed Away from Home,by Race/Ethnicity and Age, in the United States, 2013-2014 (continued)
Race/ethnicityand age Iron Zinc Copper Selenium Potassium Sodium Caffeine Alcohol(years) % (SE) % (SE) % (SE) % (SE) % (SE) % (SE) % (SE) % (SE)
Non-Hispanic White:2 - 5.............. 28 (3.1) 28 (2.7) 33 (2.5) 31 (2.8) 30 (2.4) 33 (2.4) 37 (4.8) -- -- 6 - 11.............. 33 (2.5) 36 (2.7) 40 (2.4) 37 (2.5) 41 (2.6) 40 (2.0) 44 (3.3) -- --
12 - 19.............. 28 (1.8) 29 (1.9) 32 (2.5) 33 (1.8) 31 (1.8) 36 (1.7) 38 (4.4) -- -- 20 and over... 28 (0.9) 31 (1.1) 31 (0.7) 33 (0.9) 31 (0.6) 35 (1.0) 30 (1.0) 43 (3.7)
2 and over... 29 (0.9) 31 (1.0) 32 (0.7) 33 (0.9) 31 (0.6) 35 (0.9) 30 (1.0) -- --
Non-Hispanic Black:2 - 5.............. 26 (3.4) 26 (3.1) 26 (2.9) 26 (2.0) 30 (2.7) 27 (1.9) 26*(11.8) -- -- 6 - 11.............. 34 (3.0) 39 (3.4) 37 (2.7) 34 (2.3) 41 (3.0) 34 (2.6) 39 (7.9) -- --
12 - 19.............. 27 (2.9) 25 (2.8) 28 (1.9) 29 (2.0) 31 (2.6) 30 (2.2) 44 (8.9) -- -- 20 and over... 27 (1.4) 29 (1.5) 30 (1.7) 30 (1.5) 30 (1.0) 32 (1.0) 33 (2.8) 26 (5.4)
2 and over... 28 (1.2) 30 (1.2) 31 (1.4) 30 (1.1) 31 (0.9) 31 (0.7) 34 (2.7) -- --
Non-Hispanic Asian4:2 - 5.............. 17* (4.1) 30*(13.2) 26* (8.2) 19* (4.4) 18* (5.0) 21* (4.9) 22* (5.7) -- -- 6 - 11.............. 26 (5.0) 31 (6.3) 31 (5.4) 29 (5.7) 31 (6.8) 30 (5.7) 37*(11.9) -- --
12 - 19.............. 27 (6.5) 30 (7.2) 30 (6.3) 29* (9.0) 33 (7.2) 32 (7.6) 53*(17.7) -- -- 20 and over... 29 (2.1) 31 (2.0) 29 (2.5) 34 (2.5) 31 (1.9) 32 (2.3) 44 (4.4) 41 (10.7)
2 and over... 28 (1.8) 31 (1.8) 29 (2.2) 33 (2.6) 31 (2.1) 31 (2.4) 45 (4.3) -- --
Hispanic:2 - 5.............. 23 (2.9) 22 (2.5) 22 (2.4) 23 (2.2) 22 (2.6) 25 (2.3) 23* (7.3) -- -- 6 - 11.............. 28 (1.4) 29 (2.0) 31 (1.9) 32 (1.8) 35 (2.0) 35 (1.9) 35 (4.2) -- --
12 - 19.............. 31 (2.3) 30 (2.7) 33 (2.4) 33 (2.1) 32 (2.1) 34 (2.0) 41 (5.5) -- -- 20 and over... 31 (1.2) 33 (1.5) 32 (1.3) 35 (1.3) 33 (1.1) 35 (1.6) 40 (1.9) 43 (6.2)
2 and over... 30 (1.2) 32 (1.3) 32 (1.3) 34 (1.1) 32 (1.1) 35 (1.4) 40 (1.9) -- --
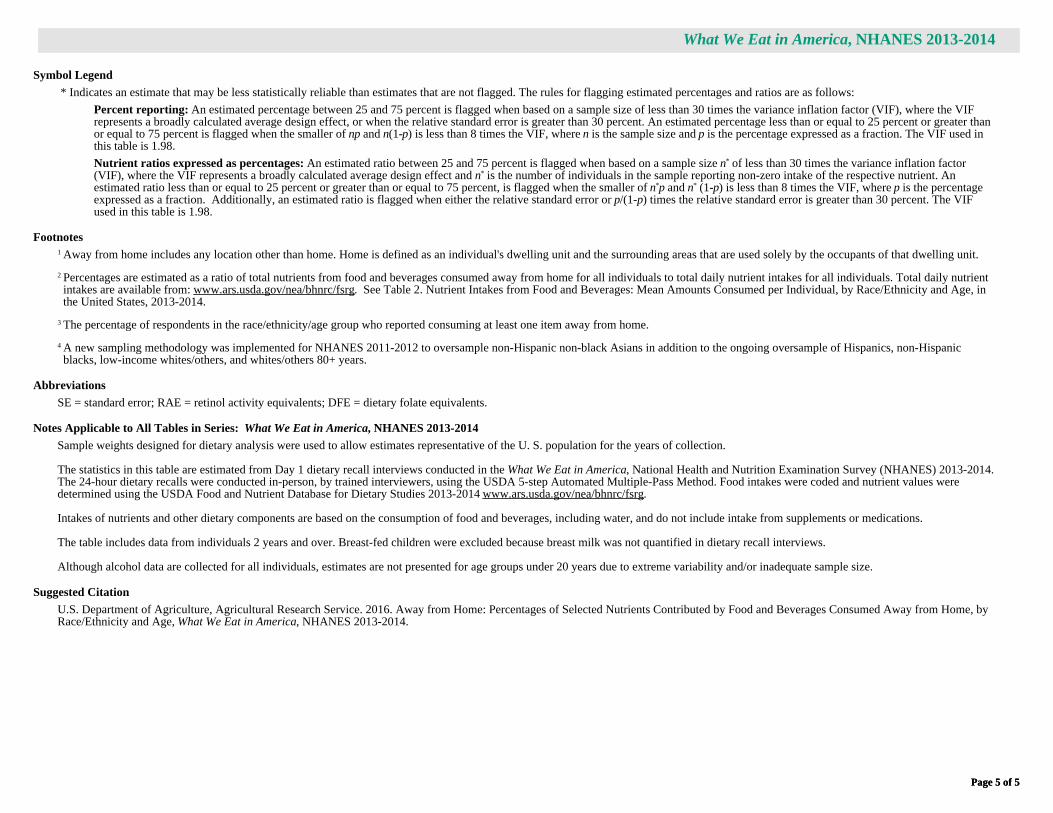
What We Eat in America, NHANES 2013-2014
Page 5 of 5Page 5 of 5
Symbol Legend
* Indicates an estimate that may be less statistically reliable than estimates that are not flagged. The rules for flagging estimated percentages and ratios are as follows:
Percent reporting: An estimated percentage between 25 and 75 percent is flagged when based on a sample size of less than 30 times the variance inflation factor (VIF), where the VIFrepresents a broadly calculated average design effect, or when the relative standard error is greater than 30 percent. An estimated percentage less than or equal to 25 percent or greater thanor equal to 75 percent is flagged when the smaller of np and n(1-p) is less than 8 times the VIF, where n is the sample size and p is the percentage expressed as a fraction. The VIF used inthis table is 1.98.
Nutrient ratios expressed as percentages: An estimated ratio between 25 and 75 percent is flagged when based on a sample size n* of less than 30 times the variance inflation factor(VIF), where the VIF represents a broadly calculated average design effect and n* is the number of individuals in the sample reporting non-zero intake of the respective nutrient. Anestimated ratio less than or equal to 25 percent or greater than or equal to 75 percent, is flagged when the smaller of n*p and n* (1-p) is less than 8 times the VIF, where p is the percentageexpressed as a fraction. Additionally, an estimated ratio is flagged when either the relative standard error or p/(1-p) times the relative standard error is greater than 30 percent. The VIFused in this table is 1.98.
Footnotes
1 Away from home includes any location other than home. Home is defined as an individual's dwelling unit and the surrounding areas that are used solely by the occupants of that dwelling unit.
2 Percentages are estimated as a ratio of total nutrients from food and beverages consumed away from home for all individuals to total daily nutrient intakes for all individuals. Total daily nutrientintakes are available from: www.ars.usda.gov/nea/bhnrc/fsrg. See Table 2. Nutrient Intakes from Food and Beverages: Mean Amounts Consumed per Individual, by Race/Ethnicity and Age, inthe United States, 2013-2014.
3 The percentage of respondents in the race/ethnicity/age group who reported consuming at least one item away from home.
4 A new sampling methodology was implemented for NHANES 2011-2012 to oversample non-Hispanic non-black Asians in addition to the ongoing oversample of Hispanics, non-Hispanicblacks, low-income whites/others, and whites/others 80+ years.
Abbreviations
SE = standard error; RAE = retinol activity equivalents; DFE = dietary folate equivalents.
Notes Applicable to All Tables in Series: What We Eat in America, NHANES 2013-2014
Sample weights designed for dietary analysis were used to allow estimates representative of the U. S. population for the years of collection.
The statistics in this table are estimated from Day 1 dietary recall interviews conducted in the What We Eat in America, National Health and Nutrition Examination Survey (NHANES) 2013-2014.The 24-hour dietary recalls were conducted in-person, by trained interviewers, using the USDA 5-step Automated Multiple-Pass Method. Food intakes were coded and nutrient values weredetermined using the USDA Food and Nutrient Database for Dietary Studies 2013-2014 www.ars.usda.gov/nea/bhnrc/fsrg.
Intakes of nutrients and other dietary components are based on the consumption of food and beverages, including water, and do not include intake from supplements or medications.
The table includes data from individuals 2 years and over. Breast-fed children were excluded because breast milk was not quantified in dietary recall interviews.
Although alcohol data are collected for all individuals, estimates are not presented for age groups under 20 years due to extreme variability and/or inadequate sample size.
Suggested Citation
U.S. Department of Agriculture, Agricultural Research Service. 2016. Away from Home: Percentages of Selected Nutrients Contributed by Food and Beverages Consumed Away from Home, byRace/Ethnicity and Age, What We Eat in America, NHANES 2013-2014.

DATA SOURCE: What We Eat in America, NHANES 2013-2014, individuals 2 years and over (excluding breast-fed children), day 1. Available: www.ars.usda.gov/nea/bhnrc/fsrg.Page 1 of 5
What We Eat in America, NHANES 2013-2014
Table 11. Away from Home1: Percentages2 of Selected Nutrients Contributed by Food and Beverages Consumed Away from Home,by Family Income (in Dollars) and Age, in the United States, 2013-2014
Family incomein dollarsand age
Percentreporting3 Energy Protein
Carbo-hydrate
Totalsugars
Dietaryfiber
Totalfat
Saturatedfat
Mono-unsaturated
fat
Poly-unsaturated
fat(years) % (SE) % (SE) % (SE) % (SE) % (SE) % (SE) % (SE) % (SE) % (SE) % (SE)
$0 - $24,999:2 - 5.............. 55 (3.2) 24 (1.8) 24 (2.2) 24 (1.9) 23 (1.8) 24 (2.4) 23 (2.1) 22 (2.0) 22 (2.0) 23 (2.8)6 - 11.............. 78 (4.4) 38 (2.4) 38 (2.5) 38 (2.4) 41 (3.0) 37 (2.8) 37 (2.7) 37 (2.9) 38 (2.8) 37 (2.8)
12 - 19.............. 62 (4.0) 33 (1.8) 36 (3.0) 32 (1.9) 33 (2.7) 30 (2.3) 34 (2.1) 35 (2.4) 33 (2.2) 34 (2.4)20 and over... 55 (1.6) 27 (0.6) 26 (0.9) 26 (0.6) 26 (0.8) 25 (1.0) 28 (0.7) 27 (0.7) 29 (0.9) 30 (1.0)
2 and over... 58 (1.4) 28 (0.6) 28 (0.8) 28 (0.7) 28 (0.9) 26 (1.0) 29 (0.6) 29 (0.7) 29 (0.7) 31 (0.9)
$25,000 - $74,999:2 - 5.............. 63 (6.0) 27 (3.5) 27 (3.5) 28 (4.8) 25 (3.0) 27 (2.7) 27 (2.1) 25 (2.1) 27 (2.0) 30 (3.0)6 - 11.............. 81 (2.8) 37 (2.6) 36 (2.4) 38 (2.6) 41 (2.6) 38 (3.2) 36 (3.0) 34 (4.3) 36 (2.6) 40 (1.7)
12 - 19.............. 66 (3.5) 34 (2.4) 30 (2.0) 35 (2.6) 36 (2.6) 29 (2.5) 34 (2.6) 34 (2.4) 34 (3.1) 36 (2.8)20 and over... 67 (1.5) 35 (1.1) 34 (0.9) 35 (1.3) 35 (1.9) 31 (1.0) 35 (1.2) 34 (1.2) 36 (1.2) 37 (1.5)
2 and over... 68 (1.1) 35 (0.9) 34 (0.8) 35 (0.9) 35 (1.4) 31 (0.9) 35 (1.0) 33 (1.0) 35 (1.0) 37 (1.2)
$75,000 and higher:2 - 5.............. 70 (3.6) 35 (2.0) 31 (2.1) 35 (1.9) 35 (1.6) 31 (2.5) 36 (2.6) 34 (3.0) 36 (3.2) 38 (2.5)6 - 11.............. 84 (3.7) 41 (2.6) 38 (3.0) 42 (2.5) 45 (2.9) 38 (2.9) 41 (2.8) 40 (3.4) 40 (2.5) 43 (3.6)
12 - 19.............. 77 (2.3) 34 (2.6) 33 (2.9) 33 (2.6) 33 (2.7) 33 (3.1) 38 (3.0) 35 (3.1) 38 (2.8) 41 (3.6)20 and over... 73 (1.3) 38 (0.8) 37 (0.9) 37 (0.9) 36 (1.0) 34 (1.0) 39 (0.9) 38 (0.9) 38 (0.9) 40 (1.4)
2 and over... 75 (1.0) 38 (0.7) 36 (0.7) 37 (0.8) 37 (1.0) 34 (1.0) 39 (0.7) 37 (0.8) 38 (0.6) 40 (1.1)
All Individuals4:2 - 5.............. 62 (2.8) 28 (1.4) 27 (1.7) 28 (1.8) 27 (1.2) 27 (1.2) 28 (1.1) 26 (1.3) 28 (1.1) 30 (1.4)6 - 11.............. 81 (2.0) 38 (1.5) 36 (1.5) 39 (1.5) 42 (1.9) 37 (1.8) 37 (1.6) 36 (2.3) 37 (1.4) 39 (1.4)
12 - 19.............. 69 (2.1) 34 (1.2) 32 (1.2) 33 (1.3) 34 (1.5) 31 (1.4) 35 (1.4) 34 (1.5) 35 (1.5) 38 (1.5)20 and over... 66 (1.2) 34 (0.7) 33 (0.6) 33 (0.8) 33 (1.0) 30 (0.8) 35 (0.8) 33 (0.8) 35 (0.8) 36 (0.8)
2 and over... 67 (1.1) 34 (0.6) 33 (0.5) 33 (0.7) 33 (0.9) 31 (0.7) 35 (0.7) 33 (0.8) 35 (0.7) 36 (0.7)

DATA SOURCE: What We Eat in America, NHANES 2013-2014, individuals 2 years and over (excluding breast-fed children), day 1. Available: www.ars.usda.gov/nea/bhnrc/fsrg.Page 2 of 5
What We Eat in America, NHANES 2013-2014
Table 11. Away from Home1: Percentages2 of Selected Nutrients Contributed by Food and Beverages Consumed Away from Home,by Family Income (in Dollars) and Age, in the United States, 2013-2014 (continued)
Family incomein dollarsand age
Choles-terol
Vitamin A(RAE)
Beta-carotene Lycopene Thiamin
Ribo-flavin Niacin Vitamin B6
Folate(DFE)
(years) % (SE) % (SE) % (SE) % (SE) % (SE) % (SE) % (SE) % (SE) % (SE)
$0 - $24,999:2 - 5.............. 20 (2.9) 24 (3.3) 39 (9.8) 31 (6.4) 23 (2.4) 23 (2.1) 24 (2.5) 22 (2.5) 22 (2.8)6 - 11.............. 37 (2.7) 37 (2.8) 29 (6.2) 31 (4.2) 36 (1.9) 40 (2.1) 35 (2.6) 35 (3.2) 31 (1.8)
12 - 19.............. 33 (3.1) 31 (2.4) 34 (5.4) 34 (5.7) 31 (1.6) 35 (1.8) 37 (3.0) 35 (3.4) 26 (1.6)20 and over... 26 (1.3) 22 (2.1) 28 (4.1) 19 (2.1) 24 (0.7) 24 (0.7) 27 (0.8) 26 (1.1) 22 (0.9)
2 and over... 27 (1.2) 24 (1.7) 29 (3.7) 23 (2.1) 26 (0.5) 26 (0.7) 29 (0.7) 27 (1.1) 23 (0.7)
$25,000 - $74,999:2 - 5.............. 24 (4.5) 26 (2.3) 49 (4.0) 28 (4.4) 27 (4.2) 23 (2.5) 27 (3.7) 21 (2.2) 23 (2.6)6 - 11.............. 32 (4.1) 38 (3.8) 47 (7.6) 34 (4.4) 34 (2.5) 38 (3.0) 35 (2.3) 34 (2.6) 31 (3.0)
12 - 19.............. 27 (2.4) 25 (2.4) 20 (5.4) 32 (7.3) 28 (3.2) 29 (3.5) 32 (3.3) 30 (3.9) 25 (3.2)20 and over... 34 (1.5) 28 (1.4) 33 (2.4) 31 (2.9) 32 (0.8) 32 (1.0) 36 (1.1) 35 (1.6) 29 (0.8)
2 and over... 33 (1.4) 29 (1.1) 33 (1.9) 31 (2.7) 31 (0.7) 32 (0.9) 35 (0.9) 34 (1.3) 28 (0.9)
$75,000 and higher:2 - 5.............. 32 (2.7) 27 (2.5) 17 (4.7) 31*(12.2) 33 (2.5) 33 (3.1) 30 (2.9) 28 (2.6) 30 (4.4)6 - 11.............. 37 (4.2) 32 (3.3) 36 (8.3) 31 (6.8) 35 (2.8) 35 (2.3) 37 (3.2) 33 (2.6) 29 (2.9)
12 - 19.............. 31 (3.1) 27 (3.0) 35 (7.0) 25 (4.3) 34 (3.5) 30 (2.6) 36 (2.8) 33 (3.5) 26 (3.2)20 and over... 36 (1.3) 31 (1.2) 32 (2.7) 35 (2.9) 33 (1.0) 33 (1.1) 38 (0.9) 36 (1.3) 31 (1.1)
2 and over... 36 (1.2) 30 (1.1) 32 (2.0) 34 (2.6) 34 (0.9) 33 (1.1) 37 (0.8) 35 (1.2) 30 (1.0)
All Individuals4:2 - 5.............. 25 (2.1) 25 (1.3) 35 (5.5) 30 (5.1) 27 (2.2) 26 (1.6) 27 (1.9) 23 (1.2) 24 (2.1)6 - 11.............. 34 (2.4) 34 (1.8) 36 (4.5) 32 (3.3) 34 (1.3) 36 (1.5) 34 (1.3) 33 (1.7) 29 (1.6)
12 - 19.............. 30 (1.6) 27 (1.1) 30 (3.8) 31 (3.7) 31 (1.2) 31 (1.4) 34 (1.4) 32 (1.9) 25 (1.2)20 and over... 33 (0.8) 27 (0.7) 31 (1.6) 30 (2.1) 30 (0.6) 30 (0.6) 34 (0.7) 33 (0.9) 28 (0.6)
2 and over... 32 (0.8) 28 (0.7) 31 (1.3) 30 (1.7) 30 (0.6) 31 (0.6) 34 (0.6) 32 (0.8) 28 (0.6)

DATA SOURCE: What We Eat in America, NHANES 2013-2014, individuals 2 years and over (excluding breast-fed children), day 1. Available: www.ars.usda.gov/nea/bhnrc/fsrg.Page 3 of 5
What We Eat in America, NHANES 2013-2014
Table 11. Away from Home1: Percentages2 of Selected Nutrients Contributed by Food and Beverages Consumed Away from Home,by Family Income (in Dollars) and Age, in the United States, 2013-2014 (continued)
Family incomein dollarsand age Choline Vitamin B12 Vitamin C Vitamin D
Vitamin E(alpha-
tocopherol) Vitamin K Calcium Phosphorus Magnesium(years) % (SE) % (SE) % (SE) % (SE) % (SE) % (SE) % (SE) % (SE) % (SE)
$0 - $24,999:2 - 5.............. 22 (2.4) 25 (3.5) 18 (2.3) 25 (4.7) 25 (2.6) 21 (3.0) 23 (2.1) 24 (2.1) 23 (2.0)6 - 11.............. 40 (2.3) 39 (2.7) 39 (3.4) 43 (2.2) 35 (2.2) 34 (5.5) 42 (2.3) 40 (2.2) 38 (2.0)
12 - 19.............. 33 (2.1) 34 (2.5) 34 (3.9) 29 (2.1) 29 (3.0) 31 (2.8) 35 (1.9) 35 (2.1) 31 (2.1)20 and over... 25 (1.2) 26 (1.4) 22 (1.8) 18 (1.6) 26 (1.4) 27 (2.4) 23 (0.6) 25 (0.8) 25 (0.8)
2 and over... 27 (1.1) 28 (1.2) 25 (1.6) 22 (1.5) 27 (1.2) 28 (2.1) 26 (0.5) 28 (0.7) 26 (0.7)
$25,000 - $74,999:2 - 5.............. 25 (3.0) 22 (3.4) 26 (3.5) 22 (3.6) 29 (2.9) 35 (5.8) 21 (1.8) 25 (2.3) 26 (2.4)6 - 11.............. 37 (2.9) 34 (2.5) 36 (3.6) 42 (3.5) 38 (2.4) 38 (2.3) 41 (3.3) 39 (2.6) 38 (2.6)
12 - 19.............. 28 (2.1) 30 (4.3) 27 (3.0) 24 (3.4) 26 (5.0) 29 (1.8) 31 (2.0) 31 (2.2) 29 (2.1)20 and over... 33 (1.1) 33 (1.8) 30 (1.6) 24 (2.0) 34 (1.4) 36 (2.2) 30 (0.9) 33 (0.9) 32 (0.8)
2 and over... 33 (1.0) 33 (1.6) 30 (1.2) 26 (1.6) 33 (1.2) 35 (1.9) 30 (0.8) 33 (0.8) 31 (0.7)
$75,000 and higher:2 - 5.............. 32 (1.9) 31 (3.1) 27 (2.3) 28 (4.0) 34 (3.9) 30 (3.0) 31 (2.3) 32 (1.8) 31 (2.0)6 - 11.............. 36 (3.7) 32 (3.1) 41 (4.4) 29 (2.8) 37 (3.4) 30 (5.1) 35 (2.4) 38 (2.5) 38 (2.6)
12 - 19.............. 30 (2.6) 33 (2.9) 26 (4.0) 20 (2.4) 37 (2.0) 32 (3.9) 30 (3.0) 32 (2.6) 33 (2.3)20 and over... 36 (0.9) 34 (1.9) 31 (1.0) 23 (2.8) 37 (1.4) 36 (2.4) 33 (1.0) 35 (0.9) 34 (0.8)
2 and over... 35 (0.9) 33 (1.6) 31 (0.8) 24 (2.2) 37 (1.0) 35 (2.2) 33 (1.0) 35 (0.8) 34 (0.6)
All Individuals4:2 - 5.............. 26 (1.6) 25 (2.0) 23 (1.5) 24 (1.9) 29 (1.5) 28 (2.5) 25 (1.3) 27 (1.3) 26 (1.4)6 - 11.............. 36 (2.1) 34 (1.8) 38 (2.7) 36 (2.4) 35 (1.8) 32 (3.1) 38 (1.7) 38 (1.5) 37 (1.5)
12 - 19.............. 30 (1.2) 31 (1.8) 29 (1.7) 23 (1.4) 31 (2.6) 32 (1.5) 31 (1.1) 32 (1.1) 31 (1.2)20 and over... 32 (0.6) 32 (1.0) 28 (0.8) 23 (1.1) 33 (1.1) 33 (1.6) 29 (0.7) 32 (0.6) 31 (0.6)
2 and over... 32 (0.5) 31 (0.9) 29 (0.7) 24 (0.9) 33 (0.9) 33 (1.3) 30 (0.7) 32 (0.6) 31 (0.5)

DATA SOURCE: What We Eat in America, NHANES 2013-2014, individuals 2 years and over (excluding breast-fed children), day 1. Available: www.ars.usda.gov/nea/bhnrc/fsrg.Page 4 of 5
What We Eat in America, NHANES 2013-2014
Table 11. Away from Home1: Percentages2 of Selected Nutrients Contributed by Food and Beverages Consumed Away from Home,by Family Income (in Dollars) and Age, in the United States, 2013-2014 (continued)
Family incomein dollarsand age Iron Zinc Copper Selenium Potassium Sodium Caffeine Alcohol(years) % (SE) % (SE) % (SE) % (SE) % (SE) % (SE) % (SE) % (SE)
$0 - $24,999:2 - 5.............. 22 (2.8) 22 (2.0) 21 (1.8) 25 (2.1) 24 (1.9) 24 (1.8) 23* (8.2) -- -- 6 - 11.............. 34 (1.8) 36 (2.6) 36 (2.2) 37 (2.4) 41 (2.1) 37 (2.3) 34 (7.6) -- --
12 - 19.............. 29 (1.9) 31 (1.6) 29 (2.3) 34 (2.7) 33 (2.2) 34 (2.1) 38 (7.4) -- -- 20 and over... 23 (0.8) 24 (0.9) 25 (1.1) 26 (0.9) 25 (0.8) 27 (0.7) 24 (2.4) 34 (4.4)
2 and over... 25 (0.7) 25 (0.8) 26 (0.9) 28 (0.6) 27 (0.8) 28 (0.6) 24 (2.5) -- --
$25,000 - $74,999:2 - 5.............. 26 (4.3) 24 (2.4) 28 (3.0) 25 (3.2) 25 (2.3) 29 (3.4) 36 (7.0) -- -- 6 - 11.............. 33 (2.4) 36 (2.6) 37 (3.1) 33 (2.8) 41 (2.5) 38 (2.5) 37 (5.0) -- --
12 - 19.............. 29 (3.1) 25 (2.9) 29 (2.3) 30 (2.3) 31 (2.0) 34 (2.4) 39 (5.1) -- -- 20 and over... 29 (0.8) 32 (0.9) 33 (0.9) 34 (0.9) 32 (0.8) 36 (0.9) 32 (1.4) 41 (4.7)
2 and over... 29 (0.8) 31 (0.9) 32 (0.7) 34 (0.9) 32 (0.7) 35 (0.8) 32 (1.3) -- --
$75,000 and higher:2 - 5.............. 30 (3.6) 32 (3.4) 34 (2.4) 32 (2.5) 32 (2.2) 35 (2.1) 40 (7.6) -- -- 6 - 11.............. 31 (2.5) 34 (2.8) 39 (2.2) 38 (3.1) 38 (2.6) 40 (2.8) 51 (6.4) -- --
12 - 19.............. 28 (2.8) 30 (3.4) 34 (2.8) 32 (2.8) 30 (2.8) 35 (2.8) 41 (6.1) -- -- 20 and over... 32 (0.9) 35 (1.1) 34 (0.9) 37 (1.1) 35 (0.8) 38 (1.0) 38 (2.6) 47 (5.7)
2 and over... 32 (0.7) 34 (1.0) 34 (0.8) 36 (1.0) 34 (0.8) 38 (0.9) 38 (2.4) -- --
All Individuals4:2 - 5.............. 26 (2.3) 26 (1.7) 28 (1.8) 27 (1.5) 26 (1.3) 29 (1.5) 30 (5.4) -- -- 6 - 11.............. 32 (1.2) 34 (1.5) 37 (1.6) 35 (1.6) 39 (1.6) 38 (1.3) 41 (2.2) -- --
12 - 19.............. 28 (1.2) 28 (1.2) 31 (1.5) 32 (1.3) 31 (1.1) 34 (1.0) 39 (3.4) -- -- 20 and over... 29 (0.7) 31 (0.8) 31 (0.6) 33 (0.7) 31 (0.6) 34 (0.7) 32 (0.8) 41 (3.3)
2 and over... 29 (0.7) 31 (0.7) 31 (0.6) 33 (0.6) 32 (0.5) 34 (0.7) 32 (0.8) -- --

What We Eat in America, NHANES 2013-2014
Page 5 of 5Page 5 of 5
Symbol Legend
* Indicates an estimate that may be less statistically reliable than estimates that are not flagged. The rules for flagging estimated percentages and ratios are as follows:
Percent reporting: An estimated percentage between 25 and 75 percent is flagged when based on a sample size of less than 30 times the variance inflation factor (VIF), where the VIFrepresents a broadly calculated average design effect, or when the relative standard error is greater than 30 percent. An estimated percentage less than or equal to 25 percent or greater thanor equal to 75 percent is flagged when the smaller of np and n(1-p) is less than 8 times the VIF, where n is the sample size and p is the percentage expressed as a fraction. The VIF used inthis table is 1.98.
Nutrient ratios expressed as percentages: An estimated ratio between 25 and 75 percent is flagged when based on a sample size n* of less than 30 times the variance inflation factor(VIF), where the VIF represents a broadly calculated average design effect and n* is the number of individuals in the sample reporting non-zero intake of the respective nutrient. Anestimated ratio less than or equal to 25 percent or greater than or equal to 75 percent, is flagged when the smaller of n*p and n* (1-p) is less than 8 times the VIF, where p is the percentageexpressed as a fraction. Additionally, an estimated ratio is flagged when either the relative standard error or p/(1-p) times the relative standard error is greater than 30 percent. The VIFused in this table is 1.98.
Footnotes
1 Away from home includes any location other than home. Home is defined as an individual's dwelling unit and the surrounding areas that are used solely by the occupants of that dwelling unit.
2 Percentages are estimated as a ratio of total nutrients from food and beverages consumed away from home for all individuals to total daily nutrient intakes for all individuals. Total daily nutrientintakes are available from: www.ars.usda.gov/nea/bhnrc/fsrg. See Table 3. Nutrient Intakes from Food and Beverages: Mean Amounts Consumed per Individual, by Family Income (in Dollars)and Age, in the United States, 2013-2014.
3 The percentage of respondents in the income/age group who reported consuming at least one item away from home.
4 Includes persons of all income levels or with unknown family income.
Abbreviations
SE = standard error; RAE = retinol activity equivalents; DFE = dietary folate equivalents.
Notes Applicable to All Tables in Series: What We Eat in America, NHANES 2013-2014
Sample weights designed for dietary analysis were used to allow estimates representative of the U. S. population for the years of collection.
The statistics in this table are estimated from Day 1 dietary recall interviews conducted in the What We Eat in America, National Health and Nutrition Examination Survey (NHANES) 2013-2014.The 24-hour dietary recalls were conducted in-person, by trained interviewers, using the USDA 5-step Automated Multiple-Pass Method. Food intakes were coded and nutrient values weredetermined using the USDA Food and Nutrient Database for Dietary Studies 2013-2014 www.ars.usda.gov/nea/bhnrc/fsrg.
Intakes of nutrients and other dietary components are based on the consumption of food and beverages, including water, and do not include intake from supplements or medications.
The table includes data from individuals 2 years and over. Breast-fed children were excluded because breast milk was not quantified in dietary recall interviews.
Although alcohol data are collected for all individuals, estimates are not presented for age groups under 20 years due to extreme variability and/or inadequate sample size.
Suggested Citation
U.S. Department of Agriculture, Agricultural Research Service. 2016. Away from Home: Percentages of Selected Nutrients Contributed by Food and Beverages Consumed Away from Home, byFamily Income (in Dollars) and Age, What We Eat in America, NHANES 2013-2014.

DATA SOURCE: What We Eat in America, NHANES 2013-2014, individuals 2 years and over (excluding breast-fed children), day 1. Available: www.ars.usda.gov/nea/bhnrc/fsrg.Page 1 of 5
What We Eat in America, NHANES 2013-2014
Table 12. Away from Home1: Percentages2 of Selected Nutrients Contributed by Food and Beverages Consumed Away from Home,by Family Income (as % of Poverty Level3) and Age, in the United States, 2013-2014
Family income as% of poverty level
and age Percent
reporting4 Energy Protein Carbo-hydrate
Totalsugars
Dietaryfiber
Totalfat
Saturatedfat
Mono-unsaturated
fat
Poly-unsaturated
fat(years) % (SE) % (SE) % (SE) % (SE) % (SE) % (SE) % (SE) % (SE) % (SE) % (SE)
Under 131% poverty:2 - 5.............. 56 (2.8) 23 (1.4) 23 (1.8) 24 (1.5) 23 (1.9) 24 (1.9) 22 (1.6) 21 (1.6) 23 (1.6) 23 (2.0)6 - 11.............. 77 (3.1) 35 (2.0) 34 (2.0) 36 (2.1) 39 (2.3) 35 (2.7) 34 (2.1) 33 (2.4) 34 (2.1) 36 (2.2)
12 - 19.............. 61 (3.6) 31 (1.8) 32 (2.7) 30 (1.8) 30 (2.2) 27 (2.6) 32 (2.1) 31 (2.1) 31 (2.2) 33 (2.4)20 and over... 56 (1.7) 28 (1.2) 27 (1.3) 27 (1.3) 27 (1.6) 25 (1.6) 28 (1.2) 27 (1.1) 28 (1.1) 30 (1.6)
2 and over... 59 (1.7) 29 (1.1) 28 (1.2) 28 (1.2) 29 (1.5) 26 (1.4) 29 (1.0) 28 (0.9) 29 (0.9) 31 (1.4)
131-350% poverty:2 - 5.............. 63 (6.6) 28 (3.5) 28 (4.3) 28 (4.8) 26 (2.7) 26 (2.8) 28 (2.4) 25 (2.6) 28 (1.9) 31 (3.4)6 - 11.............. 82 (2.5) 38 (2.7) 38 (2.8) 38 (2.6) 40 (2.9) 38 (3.3) 37 (3.2) 36 (4.4) 38 (2.8) 40 (2.3)
12 - 19.............. 70 (4.3) 35 (2.5) 32 (1.9) 36 (3.1) 36 (3.2) 32 (2.6) 35 (2.3) 34 (2.4) 35 (2.6) 37 (3.0)20 and over... 67 (1.2) 35 (0.9) 35 (1.3) 34 (0.9) 35 (1.5) 31 (1.4) 36 (1.3) 34 (1.2) 36 (1.3) 38 (1.6)
2 and over... 69 (0.7) 35 (0.8) 34 (1.2) 35 (0.7) 35 (1.1) 32 (1.2) 36 (1.0) 34 (1.0) 36 (1.0) 38 (1.4)
Over 350% poverty:2 - 5.............. 74 (4.0) 38 (2.3) 35 (2.9) 38 (2.2) 37 (1.9) 34 (3.3) 39 (2.9) 38 (3.2) 39 (3.6) 42 (2.3)6 - 11.............. 86 (4.7) 44 (2.7) 39 (3.1) 46 (2.6) 49 (2.9) 42 (3.4) 43 (2.9) 43 (2.9) 42 (3.0) 47 (4.4)
12 - 19.............. 78 (2.1) 37 (3.6) 34 (3.3) 35 (4.0) 35 (4.2) 34 (3.7) 40 (3.3) 37 (4.2) 41 (3.0) 43 (2.7)20 and over... 72 (1.7) 37 (1.1) 36 (1.1) 36 (1.2) 35 (1.3) 33 (1.3) 38 (1.3) 37 (1.3) 38 (1.3) 39 (1.5)
2 and over... 73 (1.3) 38 (1.0) 36 (0.9) 37 (1.1) 36 (1.1) 33 (1.3) 38 (1.1) 37 (1.2) 38 (1.1) 40 (1.3)
All Individuals5:2 - 5.............. 62 (2.8) 28 (1.4) 27 (1.7) 28 (1.8) 27 (1.2) 27 (1.2) 28 (1.1) 26 (1.3) 28 (1.1) 30 (1.4)6 - 11.............. 81 (2.0) 38 (1.5) 36 (1.5) 39 (1.5) 42 (1.9) 37 (1.8) 37 (1.6) 36 (2.3) 37 (1.4) 39 (1.4)
12 - 19.............. 69 (2.1) 34 (1.2) 32 (1.2) 33 (1.3) 34 (1.5) 31 (1.4) 35 (1.4) 34 (1.5) 35 (1.5) 38 (1.5)20 and over... 66 (1.2) 34 (0.7) 33 (0.6) 33 (0.8) 33 (1.0) 30 (0.8) 35 (0.8) 33 (0.8) 35 (0.8) 36 (0.8)
2 and over... 67 (1.1) 34 (0.6) 33 (0.5) 33 (0.7) 33 (0.9) 31 (0.7) 35 (0.7) 33 (0.8) 35 (0.7) 36 (0.7)

DATA SOURCE: What We Eat in America, NHANES 2013-2014, individuals 2 years and over (excluding breast-fed children), day 1. Available: www.ars.usda.gov/nea/bhnrc/fsrg.Page 2 of 5
What We Eat in America, NHANES 2013-2014
Table 12. Away from Home1: Percentages2 of Selected Nutrients Contributed by Food and Beverages Consumed Away from Home,by Family Income (as % of Poverty Level3) and Age, in the United States, 2013-2014 (continued)
Family income as% of poverty level
and age Choles-
terol Vitamin A
(RAE) Beta-
carotene Lycopene Thiamin Ribo-flavin Niacin Vitamin B6
Folate(DFE)
(years) % (SE) % (SE) % (SE) % (SE) % (SE) % (SE) % (SE) % (SE) % (SE)
Under 131% poverty:2 - 5.............. 20 (2.5) 25 (3.1) 44 (9.3) 30 (6.3) 23 (1.8) 22 (1.8) 24 (1.9) 22 (1.9) 22 (2.1)6 - 11.............. 33 (1.7) 36 (2.7) 36 (5.1) 28 (3.5) 33 (1.8) 38 (2.1) 31 (1.8) 32 (2.1) 29 (2.4)
12 - 19.............. 29 (2.8) 27 (2.3) 29 (4.0) 35 (4.2) 28 (1.8) 32 (2.1) 34 (2.7) 32 (2.9) 23 (1.9)20 and over... 25 (1.6) 22 (1.5) 25 (2.9) 20 (2.0) 25 (1.2) 25 (1.4) 28 (1.7) 28 (2.0) 22 (1.2)
2 and over... 26 (1.4) 24 (1.4) 28 (2.8) 24 (1.8) 26 (1.0) 27 (1.2) 29 (1.4) 28 (1.7) 23 (1.0)
131-350% poverty:2 - 5.............. 24 (5.2) 24 (1.9) 40 (5.1) 23 (5.3) 27 (4.5) 24 (2.7) 27 (4.1) 20 (2.0) 21 (2.8)6 - 11.............. 34 (4.5) 35 (4.0) 39 (8.7) 33 (6.0) 34 (2.4) 38 (3.6) 36 (2.2) 35 (3.5) 30 (2.8)
12 - 19.............. 28 (2.1) 28 (2.8) 33*(10.6) 28 (5.8) 31 (3.5) 29 (3.6) 33 (3.6) 30 (4.4) 25 (3.4)20 and over... 35 (1.7) 29 (1.9) 34 (3.3) 32 (3.6) 32 (1.4) 31 (1.4) 36 (1.4) 34 (1.5) 29 (1.3)
2 and over... 34 (1.6) 29 (1.6) 34 (2.9) 31 (2.9) 32 (1.3) 31 (1.3) 35 (1.3) 33 (1.5) 28 (1.3)
Over 350% poverty:2 - 5.............. 36 (4.1) 29 (3.2) 18 (4.2) 39*(13.6) 36 (3.1) 35 (4.0) 34 (3.7) 31 (3.4) 33 (5.5)6 - 11.............. 38 (4.5) 34 (3.7) 38 (9.3) 37 (8.0) 37 (3.5) 35 (2.7) 39 (3.6) 35 (3.0) 32 (4.1)
12 - 19.............. 33 (3.5) 26 (4.0) 26 (5.5) 29 (4.1) 36 (5.3) 32 (4.5) 38 (3.8) 35 (5.6) 30 (4.4)20 and over... 36 (1.5) 30 (1.3) 33 (2.5) 33 (3.1) 32 (1.2) 32 (1.1) 37 (1.1) 35 (1.3) 30 (1.3)
2 and over... 36 (1.4) 30 (1.3) 32 (2.3) 33 (2.9) 33 (1.2) 33 (1.1) 37 (0.9) 35 (1.1) 30 (1.2)
All Individuals5:2 - 5.............. 25 (2.1) 25 (1.3) 35 (5.5) 30 (5.1) 27 (2.2) 26 (1.6) 27 (1.9) 23 (1.2) 24 (2.1)6 - 11.............. 34 (2.4) 34 (1.8) 36 (4.5) 32 (3.3) 34 (1.3) 36 (1.5) 34 (1.3) 33 (1.7) 29 (1.6)
12 - 19.............. 30 (1.6) 27 (1.1) 30 (3.8) 31 (3.7) 31 (1.2) 31 (1.4) 34 (1.4) 32 (1.9) 25 (1.2)20 and over... 33 (0.8) 27 (0.7) 31 (1.6) 30 (2.1) 30 (0.6) 30 (0.6) 34 (0.7) 33 (0.9) 28 (0.6)
2 and over... 32 (0.8) 28 (0.7) 31 (1.3) 30 (1.7) 30 (0.6) 31 (0.6) 34 (0.6) 32 (0.8) 28 (0.6)

DATA SOURCE: What We Eat in America, NHANES 2013-2014, individuals 2 years and over (excluding breast-fed children), day 1. Available: www.ars.usda.gov/nea/bhnrc/fsrg.Page 3 of 5
What We Eat in America, NHANES 2013-2014
Table 12. Away from Home1: Percentages2 of Selected Nutrients Contributed by Food and Beverages Consumed Away from Home,by Family Income (as % of Poverty Level3) and Age, in the United States, 2013-2014 (continued)
Family income as% of poverty level
and age Choline Vitamin B12 Vitamin C Vitamin D
Vitamin E(alpha-
tocopherol) Vitamin K Calcium Phosphorus Magnesium(years) % (SE) % (SE) % (SE) % (SE) % (SE) % (SE) % (SE) % (SE) % (SE)
Under 131% poverty:2 - 5.............. 21 (1.9) 22 (3.1) 19 (2.8) 23 (3.9) 25 (2.2) 23 (2.5) 22 (1.9) 23 (1.8) 23 (1.6)6 - 11.............. 36 (1.7) 35 (2.6) 37 (2.3) 41 (2.3) 33 (1.7) 36 (4.7) 40 (2.4) 38 (2.1) 35 (2.1)
12 - 19.............. 30 (2.2) 32 (2.5) 30 (3.5) 26 (2.1) 28 (3.1) 30 (2.4) 31 (1.9) 32 (2.0) 28 (2.2)20 and over... 25 (1.4) 28 (1.9) 23 (1.8) 21 (1.9) 27 (1.5) 28 (2.0) 24 (0.9) 26 (1.2) 25 (1.1)
2 and over... 26 (1.3) 29 (1.5) 25 (1.7) 24 (1.6) 27 (1.4) 29 (1.7) 27 (0.7) 28 (1.0) 26 (1.0)
131-350% poverty:2 - 5.............. 25 (3.7) 23 (4.8) 25 (3.7) 22 (5.0) 29 (3.0) 33 (6.4) 22 (2.1) 26 (2.7) 26 (2.8)6 - 11.............. 37 (3.7) 34 (3.4) 38 (4.3) 39 (4.0) 38 (2.9) 35 (3.1) 41 (3.4) 40 (2.9) 39 (2.8)
12 - 19.............. 29 (2.2) 30 (4.2) 27 (3.9) 24 (3.4) 27 (5.3) 29 (1.9) 31 (2.7) 32 (2.3) 30 (2.2)20 and over... 33 (1.5) 33 (1.9) 30 (2.1) 22 (1.8) 35 (1.7) 35 (2.3) 30 (1.2) 33 (1.1) 32 (1.1)
2 and over... 33 (1.4) 32 (1.8) 30 (1.9) 24 (1.7) 34 (1.7) 34 (2.0) 30 (1.0) 33 (1.0) 32 (1.0)
Over 350% poverty:2 - 5.............. 35 (2.8) 34 (3.5) 29 (2.9) 30 (4.2) 36 (4.1) 32 (2.9) 34 (2.8) 35 (2.4) 34 (2.6)6 - 11.............. 38 (4.2) 34 (3.1) 43 (5.5) 29 (3.7) 40 (4.3) 30 (6.3) 36 (2.8) 39 (2.7) 41 (2.7)
12 - 19.............. 31 (3.0) 35 (4.2) 27 (5.8) 20 (3.2) 39 (2.8) 34 (3.3) 32 (4.9) 33 (3.8) 34 (3.2)20 and over... 35 (0.9) 32 (1.5) 30 (1.5) 24 (1.9) 35 (1.6) 36 (2.2) 32 (1.4) 35 (1.1) 33 (1.0)
2 and over... 35 (0.8) 33 (1.3) 31 (1.2) 24 (1.6) 36 (1.4) 36 (2.0) 32 (1.3) 35 (1.0) 33 (0.9)
All Individuals5:2 - 5.............. 26 (1.6) 25 (2.0) 23 (1.5) 24 (1.9) 29 (1.5) 28 (2.5) 25 (1.3) 27 (1.3) 26 (1.4)6 - 11.............. 36 (2.1) 34 (1.8) 38 (2.7) 36 (2.4) 35 (1.8) 32 (3.1) 38 (1.7) 38 (1.5) 37 (1.5)
12 - 19.............. 30 (1.2) 31 (1.8) 29 (1.7) 23 (1.4) 31 (2.6) 32 (1.5) 31 (1.1) 32 (1.1) 31 (1.2)20 and over... 32 (0.6) 32 (1.0) 28 (0.8) 23 (1.1) 33 (1.1) 33 (1.6) 29 (0.7) 32 (0.6) 31 (0.6)
2 and over... 32 (0.5) 31 (0.9) 29 (0.7) 24 (0.9) 33 (0.9) 33 (1.3) 30 (0.7) 32 (0.6) 31 (0.5)

DATA SOURCE: What We Eat in America, NHANES 2013-2014, individuals 2 years and over (excluding breast-fed children), day 1. Available: www.ars.usda.gov/nea/bhnrc/fsrg.Page 4 of 5
What We Eat in America, NHANES 2013-2014
Table 12. Away from Home1: Percentages2 of Selected Nutrients Contributed by Food and Beverages Consumed Away from Home,by Family Income (as % of Poverty Level3) and Age, in the United States, 2013-2014 (continued)
Family income as% of poverty level
and age Iron Zinc Copper Selenium Potassium Sodium Caffeine Alcohol(years) % (SE) % (SE) % (SE) % (SE) % (SE) % (SE) % (SE) % (SE)
Under 131% poverty:2 - 5.............. 22 (2.1) 22 (1.7) 22 (1.6) 23 (2.0) 23 (1.7) 24 (1.4) 24 (7.0) -- -- 6 - 11.............. 33 (2.1) 33 (2.3) 33 (2.2) 32 (1.8) 38 (1.9) 34 (2.0) 36 (5.1) -- --
12 - 19.............. 27 (2.2) 27 (1.8) 27 (2.5) 31 (2.6) 30 (2.3) 31 (2.0) 34 (5.9) -- -- 20 and over... 23 (1.2) 25 (1.2) 25 (1.2) 26 (1.3) 25 (1.2) 27 (1.3) 25 (3.2) 32 (4.0)
2 and over... 25 (1.1) 26 (1.1) 26 (1.2) 27 (1.1) 27 (1.2) 28 (1.2) 26 (3.2) -- --
131-350% poverty:2 - 5.............. 27 (4.5) 25 (2.8) 28 (3.4) 25 (3.8) 26 (2.5) 29 (3.8) 39 (8.1) -- -- 6 - 11.............. 32 (2.3) 37 (2.9) 39 (3.1) 35 (2.7) 41 (3.0) 39 (2.5) 37 (6.7) -- --
12 - 19.............. 29 (3.3) 28 (2.6) 31 (2.7) 31 (2.2) 32 (2.4) 36 (2.6) 39 (4.9) -- -- 20 and over... 30 (1.1) 32 (1.0) 33 (1.2) 35 (1.3) 32 (1.1) 36 (1.2) 32 (2.5) 34 (4.1)
2 and over... 30 (1.1) 32 (1.0) 33 (1.1) 34 (1.2) 33 (1.0) 36 (1.1) 33 (2.4) -- --
Over 350% poverty:2 - 5.............. 33 (4.3) 35 (3.9) 38 (3.0) 36 (3.3) 34 (2.9) 38 (2.3) 42 (6.6) -- -- 6 - 11.............. 34 (3.0) 37 (2.9) 41 (2.1) 40 (3.1) 40 (3.0) 43 (3.2) 54 (8.2) -- --
12 - 19.............. 30 (3.5) 30 (3.7) 35 (3.4) 33 (3.3) 31 (3.7) 37 (3.5) 47 (8.8) -- -- 20 and over... 31 (1.2) 34 (1.4) 33 (1.1) 36 (1.2) 34 (1.0) 38 (1.4) 36 (2.1) 49 (5.0)
2 and over... 31 (1.0) 34 (1.3) 34 (1.0) 36 (1.1) 34 (0.9) 38 (1.3) 36 (2.0) -- --
All Individuals5:2 - 5.............. 26 (2.3) 26 (1.7) 28 (1.8) 27 (1.5) 26 (1.3) 29 (1.5) 30 (5.4) -- -- 6 - 11.............. 32 (1.2) 34 (1.5) 37 (1.6) 35 (1.6) 39 (1.6) 38 (1.3) 41 (2.2) -- --
12 - 19.............. 28 (1.2) 28 (1.2) 31 (1.5) 32 (1.3) 31 (1.1) 34 (1.0) 39 (3.4) -- -- 20 and over... 29 (0.7) 31 (0.8) 31 (0.6) 33 (0.7) 31 (0.6) 34 (0.7) 32 (0.8) 41 (3.3)
2 and over... 29 (0.7) 31 (0.7) 31 (0.6) 33 (0.6) 32 (0.5) 34 (0.7) 32 (0.8) -- --

What We Eat in America, NHANES 2013-2014
Page 5 of 5Page 5 of 5
Symbol Legend
* Indicates an estimate that may be less statistically reliable than estimates that are not flagged. The rules for flagging estimated percentages and ratios are as follows:
Percent reporting: An estimated percentage between 25 and 75 percent is flagged when based on a sample size of less than 30 times the variance inflation factor (VIF), where the VIFrepresents a broadly calculated average design effect, or when the relative standard error is greater than 30 percent. An estimated percentage less than or equal to 25 percent or greater thanor equal to 75 percent is flagged when the smaller of np and n(1-p) is less than 8 times the VIF, where n is the sample size and p is the percentage expressed as a fraction. The VIF used inthis table is 1.98.
Nutrient ratios expressed as percentages: An estimated ratio between 25 and 75 percent is flagged when based on a sample size n* of less than 30 times the variance inflation factor(VIF), where the VIF represents a broadly calculated average design effect and n* is the number of individuals in the sample reporting non-zero intake of the respective nutrient. Anestimated ratio less than or equal to 25 percent or greater than or equal to 75 percent, is flagged when the smaller of n*p and n* (1-p) is less than 8 times the VIF, where p is the percentageexpressed as a fraction. Additionally, an estimated ratio is flagged when either the relative standard error or p/(1-p) times the relative standard error is greater than 30 percent. The VIFused in this table is 1.98.
Footnotes
1 Away from home includes any location other than home. Home is defined as an individual's dwelling unit and the surrounding areas that are used solely by the occupants of that dwelling unit.
2 Percentages are estimated as a ratio of total nutrients from food and beverages consumed away from home for all individuals to total daily nutrient intakes for all individuals. Total daily nutrientintakes are available from: www.ars.usda.gov/nea/bhnrc/fsrg. See Table 4. Nutrient Intakes from Food and Beverages: Mean Amounts Consumed per Individual, by Family Income (as % ofPoverty Level) and Age, in the United States, 2013-2014.
3 The ratio of family income to poverty expressed as a percentage. The Department of Health and Human Services’ poverty guidelines were used as the poverty measure to calculate the ratio, http://aspe.hhs.gov/poverty/.
4 The percentage of respondents in the income/age group who reported consuming at least one item away from home.
5 Includes persons of all income levels or with unknown family income.
Abbreviations
SE = standard error; RAE = retinol activity equivalents; DFE = dietary folate equivalents.
Notes Applicable to All Tables in Series: What We Eat in America, NHANES 2013-2014
Sample weights designed for dietary analysis were used to allow estimates representative of the U. S. population for the years of collection.
The statistics in this table are estimated from Day 1 dietary recall interviews conducted in the What We Eat in America, National Health and Nutrition Examination Survey (NHANES) 2013-2014.The 24-hour dietary recalls were conducted in-person, by trained interviewers, using the USDA 5-step Automated Multiple-Pass Method. Food intakes were coded and nutrient values weredetermined using the USDA Food and Nutrient Database for Dietary Studies 2013-2014 www.ars.usda.gov/nea/bhnrc/fsrg.
Intakes of nutrients and other dietary components are based on the consumption of food and beverages, including water, and do not include intake from supplements or medications.
The table includes data from individuals 2 years and over. Breast-fed children were excluded because breast milk was not quantified in dietary recall interviews.
Although alcohol data are collected for all individuals, estimates are not presented for age groups under 20 years due to extreme variability and/or inadequate sample size.
Suggested Citation
U.S. Department of Agriculture, Agricultural Research Service. 2016. Away from Home: Percentages of Selected Nutrients Contributed by Food and Beverages Consumed Away from Home, byFamily Income (as % of Poverty Level) and Age, What We Eat in America, NHANES 2013-2014.

DATA SOURCE: What We Eat in America, NHANES 2013-2014, individuals 2 years and over (excluding breast-fed children), day 1. Available: www.ars.usda.gov/nea/bhnrc/fsrg.Page 1 of 5
What We Eat in America, NHANES 2013-2014
Table 13. Breakfast1: Percentages2 of Selected Nutrients Contributed by Food and Beverages Consumed at Breakfast,by Gender and Age, in the United States, 2013-2014
Genderand age
Percentreporting3 Energy Protein
Carbo-hydrate
Totalsugars
Dietaryfiber
Totalfat
Saturatedfat
Mono-unsaturated
fat
Poly-unsaturated
fat(years) % (SE) % (SE) % (SE) % (SE) % (SE) % (SE) % (SE) % (SE) % (SE) % (SE)
Males:2 - 5.............. 97* (0.9) 19 (0.8) 20 (0.7) 21 (1.0) 23 (1.1) 21 (1.6) 18 (1.2) 20 (1.2) 17 (1.4) 15 (1.3)6 - 11.............. 90 (1.6) 18 (1.1) 17 (1.0) 20 (1.0) 21 (1.3) 18 (1.2) 17 (1.4) 18 (1.9) 17 (1.4) 15 (1.1)
12 - 19.............. 77 (2.4) 17 (0.9) 16 (1.3) 19 (1.1) 21 (1.3) 18 (1.3) 15 (0.9) 17 (1.1) 16 (1.1) 13 (0.7)
20 - 29.............. 72 (3.0) 15 (0.7) 14 (0.8) 17 (0.8) 19 (1.0) 16 (1.1) 14 (0.9) 15 (0.9) 14 (1.1) 12 (1.1)30 - 39.............. 83 (2.1) 15 (1.0) 15 (1.1) 17 (1.0) 19 (1.3) 17 (1.4) 15 (1.3) 15 (1.2) 15 (1.4) 14 (1.6)40 - 49.............. 85 (2.1) 17 (0.8) 16 (0.9) 18 (0.9) 20 (1.4) 17 (1.1) 17 (1.0) 18 (1.0) 17 (1.0) 15 (1.3)
50 - 59.............. 89 (1.9) 18 (1.0) 16 (1.0) 20 (1.3) 21 (1.6) 19 (1.0) 17 (1.1) 18 (1.3) 17 (1.3) 18 (1.1)60 - 69.............. 89 (2.0) 17 (0.6) 17 (0.7) 19 (0.7) 20 (1.1) 19 (0.9) 17 (1.0) 18 (0.9) 17 (1.1) 14 (1.2)70 and over...... 95 (1.3) 22 (0.9) 20 (1.0) 26 (1.1) 27 (1.5) 28 (1.4) 19 (1.2) 18 (1.3) 19 (1.1) 21 (1.7)
2 - 19............ 85 (1.5) 18 (0.6) 17 (0.9) 20 (0.6) 21 (0.7) 19 (0.8) 16 (0.6) 18 (0.8) 16 (0.8) 14 (0.5)20 and over... 84 (1.0) 17 (0.3) 16 (0.3) 19 (0.5) 20 (0.6) 19 (0.5) 16 (0.4) 17 (0.5) 16 (0.4) 15 (0.6)
2 and over... 84 (0.8) 17 (0.3) 16 (0.3) 19 (0.4) 21 (0.5) 19 (0.4) 16 (0.3) 17 (0.4) 16 (0.4) 15 (0.5)
Females:2 - 5.............. 95 (1.7) 19 (0.9) 20 (1.3) 19 (0.8) 22 (0.7) 17 (1.0) 17 (1.3) 19 (1.5) 17 (1.4) 14 (1.0)6 - 11.............. 90 (1.8) 19 (0.7) 19 (0.7) 20 (0.8) 22 (0.9) 18 (1.0) 18 (0.8) 20 (0.9) 18 (1.0) 16 (1.1)
12 - 19.............. 74 (3.2) 15 (0.9) 14 (1.0) 17 (0.9) 18 (1.2) 15 (0.8) 14 (1.1) 15 (1.2) 14 (1.3) 12 (0.9)
20 - 29.............. 78 (2.2) 16 (1.0) 16 (1.0) 18 (1.2) 19 (1.3) 16 (1.4) 15 (0.9) 16 (1.0) 15 (0.9) 13 (1.0)30 - 39.............. 85 (2.6) 18 (0.9) 18 (1.0) 19 (1.0) 20 (1.4) 20 (1.4) 17 (1.3) 18 (1.6) 17 (1.2) 17 (1.6)40 - 49.............. 87 (1.5) 16 (0.7) 15 (0.8) 18 (0.7) 20 (0.9) 17 (1.0) 15 (0.7) 16 (0.9) 15 (0.7) 14 (1.0)
50 - 59.............. 89 (1.7) 17 (0.7) 16 (1.0) 20 (0.7) 23 (1.3) 20 (0.8) 16 (0.9) 17 (1.3) 17 (1.2) 15 (0.9)60 - 69.............. 92 (1.4) 18 (0.9) 17 (0.9) 20 (0.9) 21 (1.2) 20 (1.7) 16 (1.2) 17 (1.0) 16 (1.6) 16 (1.9)70 and over...... 95 (0.9) 19 (0.7) 17 (0.9) 23 (1.0) 23 (1.0) 23 (2.1) 16 (0.7) 17 (0.9) 16 (0.7) 13 (1.0)
2 - 19............ 84 (1.9) 17 (0.5) 17 (0.6) 19 (0.5) 20 (0.7) 16 (0.5) 16 (0.7) 17 (0.8) 16 (0.8) 14 (0.6)20 and over... 87 (0.8) 17 (0.4) 17 (0.3) 20 (0.4) 21 (0.6) 19 (0.5) 16 (0.5) 17 (0.5) 16 (0.6) 15 (0.6)
2 and over... 87 (0.8) 17 (0.3) 17 (0.3) 19 (0.4) 21 (0.5) 19 (0.4) 16 (0.5) 17 (0.5) 16 (0.5) 15 (0.5)
Males and females:2 - 19............ 84 (1.5) 18 (0.4) 17 (0.5) 19 (0.5) 21 (0.5) 18 (0.5) 16 (0.4) 17 (0.5) 16 (0.4) 14 (0.3)20 and over... 86 (0.7) 17 (0.3) 16 (0.2) 19 (0.4) 21 (0.5) 19 (0.4) 16 (0.3) 17 (0.3) 16 (0.4) 15 (0.5)
2 and over... 86 (0.6) 17 (0.2) 16 (0.2) 19 (0.3) 21 (0.4) 19 (0.3) 16 (0.3) 17 (0.2) 16 (0.3) 15 (0.4)

DATA SOURCE: What We Eat in America, NHANES 2013-2014, individuals 2 years and over (excluding breast-fed children), day 1. Available: www.ars.usda.gov/nea/bhnrc/fsrg.Page 2 of 5
What We Eat in America, NHANES 2013-2014
Table 13. Breakfast1: Percentages2 of Selected Nutrients Contributed by Food and Beverages Consumed at Breakfast,by Gender and Age, in the United States, 2013-2014 (continued)
Genderand age
Choles-terol
Vitamin A(RAE)
Beta-carotene Lycopene Thiamin
Ribo-flavin Niacin Vitamin B6
Folate(DFE)
(years) % (SE) % (SE) % (SE) % (SE) % (SE) % (SE) % (SE) % (SE) % (SE)
Males:2 - 5.............. 30 (2.4) 34 (1.4) 4* (1.2) 4* (1.7) 28 (1.1) 33 (0.7) 25 (1.0) 32 (1.5) 36 (2.0)6 - 11.............. 28 (3.0) 34 (1.9) 14* (7.4) 6 (1.4) 27 (1.1) 31 (1.2) 23 (1.1) 30 (1.7) 36 (1.8)
12 - 19.............. 27 (2.4) 33 (2.3) 5 (1.2) 4 (0.6) 27 (2.4) 30 (2.1) 20 (2.4) 25 (3.2) 32 (3.4)
20 - 29.............. 27 (3.9) 26 (2.1) 8* (2.6) 10* (3.2) 20 (1.1) 25 (1.3) 16 (1.6) 21 (2.2) 24 (2.5)30 - 39.............. 26 (1.7) 28 (2.8) 4 (0.8) 5* (1.7) 21 (1.3) 26 (1.4) 19 (1.7) 24 (2.9) 25 (2.5)40 - 49.............. 27 (2.0) 27 (2.0) 5 (1.3) 6* (2.0) 22 (1.2) 27 (0.9) 16 (1.0) 17 (1.4) 24 (1.6)
50 - 59.............. 29 (2.8) 28 (2.1) 4 (1.1) 4* (1.8) 24 (1.3) 29 (1.5) 19 (1.2) 24 (2.2) 32 (2.9)60 - 69.............. 30 (2.9) 29 (2.5) 8* (3.2) 8* (3.8) 25 (1.2) 30 (1.3) 19 (0.8) 22 (1.3) 29 (1.8)70 and over...... 29 (3.2) 36 (2.8) 10 (2.3) 17 (4.1) 34 (2.0) 37 (2.0) 27 (1.9) 34 (2.2) 44 (2.8)
2 - 19............ 28 (2.0) 34 (1.4) 8* (3.2) 5 (0.5) 27 (1.3) 31 (0.9) 21 (1.4) 27 (1.8) 34 (1.9)20 and over... 28 (0.9) 29 (0.8) 6 (0.7) 8 (1.2) 24 (0.6) 28 (0.5) 18 (0.5) 23 (0.9) 28 (0.8)
2 and over... 28 (0.7) 30 (0.6) 7 (0.6) 7 (0.9) 24 (0.5) 29 (0.4) 19 (0.5) 24 (0.7) 30 (0.8)
Females:2 - 5.............. 32 (3.0) 34 (1.3) 6* (1.9) 4* (2.3) 28 (1.3) 32 (1.6) 24 (1.6) 31 (1.6) 39 (2.9)6 - 11.............. 30 (2.0) 35 (1.8) 4 (0.7) 6* (1.9) 28 (1.2) 31 (1.3) 24 (1.2) 30 (1.8) 32 (2.1)
12 - 19.............. 21 (2.3) 28 (1.9) 5 (1.4) 5* (2.6) 23 (1.3) 26 (1.7) 18 (1.3) 23 (1.5) 30 (2.7)
20 - 29.............. 26 (2.5) 28 (1.9) 7 (1.6) 5 (1.3) 23 (1.6) 29 (1.5) 20 (1.5) 24 (2.2) 29 (2.5)30 - 39.............. 28 (2.6) 29 (2.7) 21* (6.3) 9 (2.8) 24 (1.7) 29 (1.5) 18 (1.0) 20 (1.3) 27 (2.0)40 - 49.............. 25 (2.3) 23 (1.3) 9 (2.6) 5 (1.5) 21 (0.9) 28 (1.1) 17 (0.8) 19 (0.9) 22 (1.0)
50 - 59.............. 25 (2.9) 28 (2.0) 8* (2.5) 2* (0.6) 24 (1.4) 32 (1.4) 19 (1.1) 23 (1.5) 27 (2.0)60 - 69.............. 26 (1.7) 26 (1.8) 6 (1.6) 9* (5.4) 25 (1.3) 31 (1.0) 19 (1.1) 23 (1.6) 27 (1.9)70 and over...... 24 (3.0) 25 (1.3) 5 (1.1) 7* (2.3) 28 (1.4) 33 (1.2) 23 (1.3) 27 (1.6) 33 (1.7)
2 - 19............ 26 (1.3) 32 (1.2) 5 (0.9) 5 (1.4) 26 (0.9) 29 (1.1) 21 (0.9) 27 (1.2) 32 (1.7)20 and over... 26 (1.2) 26 (0.7) 10 (1.7) 6 (1.1) 24 (0.7) 30 (0.5) 19 (0.4) 23 (0.5) 27 (0.6)
2 and over... 26 (1.0) 28 (0.6) 9 (1.5) 6 (1.1) 24 (0.6) 30 (0.4) 19 (0.4) 24 (0.5) 29 (0.6)
Males and females:2 - 19............ 27 (1.3) 33 (0.9) 7 (1.7) 5 (0.7) 26 (0.8) 30 (0.7) 21 (1.0) 27 (1.0) 33 (1.0)20 and over... 27 (0.8) 28 (0.6) 8 (1.0) 7 (0.9) 24 (0.5) 29 (0.4) 19 (0.4) 23 (0.6) 28 (0.5)
2 and over... 27 (0.6) 29 (0.5) 8 (0.8) 7 (0.8) 24 (0.4) 29 (0.3) 19 (0.4) 24 (0.5) 29 (0.5)

DATA SOURCE: What We Eat in America, NHANES 2013-2014, individuals 2 years and over (excluding breast-fed children), day 1. Available: www.ars.usda.gov/nea/bhnrc/fsrg.Page 3 of 5
What We Eat in America, NHANES 2013-2014
Table 13. Breakfast1: Percentages2 of Selected Nutrients Contributed by Food and Beverages Consumed at Breakfast,by Gender and Age, in the United States, 2013-2014 (continued)
Genderand age Choline Vitamin B12 Vitamin C Vitamin D
Vitamin E(alpha-
tocopherol) Vitamin K Calcium Phosphorus Magnesium(years) % (SE) % (SE) % (SE) % (SE) % (SE) % (SE) % (SE) % (SE) % (SE)
Males:2 - 5.............. 28 (1.5) 38 (1.6) 22 (2.2) 38 (2.3) 16 (1.7) 10 (1.1) 28 (1.2) 24 (0.7) 23 (0.8)6 - 11.............. 26 (2.0) 35 (1.6) 27 (3.2) 40 (1.9) 18 (1.9) 22* (9.7) 26 (1.4) 22 (1.1) 20 (1.0)
12 - 19.............. 25 (1.5) 30 (3.5) 31 (3.1) 40 (2.4) 19 (3.6) 9 (0.8) 23 (1.2) 21 (1.0) 19 (0.8)
20 - 29.............. 23 (2.3) 24 (2.4) 23 (2.8) 32 (2.9) 16 (2.1) 10* (3.2) 19 (0.9) 17 (1.0) 16 (0.9)30 - 39.............. 21 (1.3) 27 (2.5) 20 (3.0) 35 (2.0) 16 (1.3) 8 (1.1) 21 (1.1) 18 (1.2) 18 (1.1)40 - 49.............. 21 (1.6) 23 (2.1) 18 (3.4) 30 (4.9) 17 (1.5) 10 (1.6) 22 (0.9) 19 (0.9) 18 (1.0)
50 - 59.............. 24 (1.7) 30 (2.7) 23 (2.4) 39 (3.0) 20 (1.3) 8 (0.9) 24 (2.0) 20 (1.3) 19 (1.1)60 - 69.............. 25 (1.7) 27 (2.4) 27 (2.5) 33 (4.1) 19 (2.2) 7 (1.0) 24 (1.4) 21 (0.8) 21 (0.8)70 and over...... 28 (1.8) 37 (3.1) 39 (2.0) 41 (2.7) 31 (3.6) 15 (4.0) 30 (1.2) 26 (1.1) 29 (1.4)
2 - 19............ 25 (1.3) 33 (1.8) 28 (2.2) 39 (1.4) 18 (1.9) 14 (3.6) 25 (0.9) 22 (0.7) 20 (0.6)20 and over... 23 (0.4) 27 (1.1) 24 (0.8) 34 (2.0) 19 (0.7) 9 (0.8) 22 (0.6) 19 (0.4) 19 (0.4)
2 and over... 24 (0.4) 28 (0.9) 25 (0.9) 36 (1.6) 18 (0.7) 10 (0.8) 23 (0.6) 20 (0.3) 19 (0.3)
Females:2 - 5.............. 29 (1.7) 37 (2.0) 18 (2.0) 40 (2.0) 16 (1.7) 11 (1.6) 27 (1.6) 24 (1.3) 21 (1.1)6 - 11.............. 27 (1.4) 37 (2.9) 22 (2.0) 42 (2.5) 16 (1.3) 9 (0.9) 26 (1.2) 23 (0.8) 20 (0.9)
12 - 19.............. 21 (1.6) 28 (1.4) 22 (2.6) 39 (1.3) 14 (1.6) 7 (0.9) 21 (1.2) 18 (1.2) 17 (0.9)
20 - 29.............. 23 (1.6) 28 (2.0) 22 (2.2) 36 (2.4) 18 (1.5) 9 (0.9) 23 (1.5) 19 (1.0) 19 (1.1)30 - 39.............. 25 (1.6) 23 (2.2) 27 (2.8) 39 (2.6) 20 (1.4) 21* (7.2) 24 (1.6) 21 (1.1) 22 (1.2)40 - 49.............. 23 (1.3) 23 (1.0) 19 (2.2) 32 (1.5) 17 (0.6) 12 (2.5) 21 (0.9) 18 (0.8) 18 (1.0)
50 - 59.............. 24 (1.9) 29 (2.9) 22 (3.1) 39 (3.1) 19 (1.3) 11 (3.1) 25 (1.6) 21 (1.1) 22 (0.9)60 - 69.............. 24 (1.4) 25 (1.6) 24 (3.4) 33 (3.2) 19 (2.1) 8 (1.0) 26 (1.0) 22 (1.0) 22 (1.6)70 and over...... 24 (1.8) 30 (1.9) 28 (1.9) 36 (2.7) 21 (2.1) 6 (0.6) 27 (1.4) 23 (1.0) 24 (1.2)
2 - 19............ 24 (0.9) 33 (1.6) 21 (1.5) 40 (1.2) 15 (0.7) 8 (0.7) 24 (0.8) 21 (0.7) 19 (0.5)20 and over... 24 (0.8) 26 (0.9) 23 (1.0) 36 (1.3) 19 (0.6) 12 (1.7) 24 (0.4) 21 (0.3) 21 (0.3)
2 and over... 24 (0.6) 28 (0.9) 23 (0.9) 37 (1.0) 18 (0.5) 11 (1.4) 24 (0.4) 21 (0.3) 21 (0.3)
Males and females:2 - 19............ 25 (0.9) 33 (1.1) 25 (1.5) 40 (1.0) 17 (1.3) 11 (2.0) 25 (0.6) 21 (0.4) 19 (0.3)20 and over... 24 (0.4) 27 (0.9) 24 (0.7) 35 (1.2) 19 (0.5) 11 (1.0) 23 (0.4) 20 (0.3) 20 (0.3)
2 and over... 24 (0.3) 28 (0.7) 24 (0.7) 36 (1.0) 18 (0.5) 11 (0.8) 24 (0.4) 20 (0.2) 20 (0.2)

DATA SOURCE: What We Eat in America, NHANES 2013-2014, individuals 2 years and over (excluding breast-fed children), day 1. Available: www.ars.usda.gov/nea/bhnrc/fsrg.Page 4 of 5
What We Eat in America, NHANES 2013-2014
Table 13. Breakfast1: Percentages2 of Selected Nutrients Contributed by Food and Beverages Consumed at Breakfast,by Gender and Age, in the United States, 2013-2014 (continued)
Genderand age Iron Zinc Copper Selenium Potassium Sodium Caffeine Alcohol(years) % (SE) % (SE) % (SE) % (SE) % (SE) % (SE) % (SE) % (SE)
Males:2 - 5.............. 35 (1.7) 29 (1.2) 20 (0.9) 20 (0.8) 22 (0.8) 17 (0.9) 11 (2.8) -- -- 6 - 11.............. 32 (1.3) 25 (1.2) 17 (0.7) 18 (1.1) 20 (1.2) 16 (0.9) 9* (2.8) -- --
12 - 19.............. 31 (3.1) 24 (3.4) 17 (0.9) 18 (1.3) 20 (1.0) 15 (0.8) 17 (5.1) -- --
20 - 29.............. 23 (1.8) 18 (1.3) 16 (1.7) 15 (1.0) 17 (1.0) 13 (0.8) 30 (4.3) -- -- 30 - 39.............. 23 (1.4) 17 (1.1) 15 (0.9) 16 (1.1) 18 (1.0) 15 (1.2) 44 (4.4) -- -- 40 - 49.............. 25 (2.0) 20 (1.4) 17 (0.9) 18 (1.1) 18 (0.9) 15 (1.1) 38 (4.1) -- --
50 - 59.............. 30 (2.3) 21 (1.2) 19 (1.1) 18 (1.1) 21 (0.9) 16 (1.0) 40 (4.5) -- -- 60 - 69.............. 30 (2.1) 23 (1.2) 17 (1.0) 18 (0.7) 21 (0.7) 15 (0.7) 43 (4.2) -- -- 70 and over...... 42 (2.4) 33 (2.9) 25 (1.2) 22 (1.2) 27 (1.0) 17 (1.0) 51 (3.8) -- --
2 - 19............ 32 (1.7) 25 (1.8) 17 (0.6) 18 (0.9) 20 (0.7) 16 (0.5) 15 (4.0) -- -- 20 and over... 27 (0.8) 21 (0.5) 18 (0.4) 17 (0.3) 19 (0.3) 15 (0.5) 40 (1.9) #
2 and over... 28 (0.7) 22 (0.6) 18 (0.3) 18 (0.3) 20 (0.2) 15 (0.3) 39 (1.8) -- --
Females:2 - 5.............. 34 (1.7) 30 (1.8) 18 (1.3) 20 (1.4) 21 (0.9) 17 (1.1) 11* (3.5) -- -- 6 - 11.............. 32 (1.6) 25 (1.7) 18 (0.9) 21 (1.1) 20 (0.8) 18 (1.0) 16 (4.5) -- --
12 - 19.............. 28 (1.7) 21 (1.3) 15 (0.9) 14 (1.0) 17 (1.0) 13 (0.8) 23* (8.2) -- --
20 - 29.............. 27 (2.1) 21 (1.4) 17 (1.5) 18 (1.0) 18 (0.9) 14 (0.7) 38 (5.5) -- -- 30 - 39.............. 26 (1.8) 19 (1.3) 18 (1.2) 19 (1.2) 22 (1.0) 16 (1.0) 45 (2.7) -- -- 40 - 49.............. 22 (1.2) 17 (0.7) 16 (0.9) 17 (1.0) 19 (1.1) 14 (0.9) 47 (2.5) -- --
50 - 59.............. 28 (1.7) 21 (1.5) 18 (0.9) 17 (1.0) 22 (0.8) 14 (0.9) 44 (6.1) -- -- 60 - 69.............. 29 (1.4) 23 (1.6) 18 (1.3) 19 (0.7) 21 (1.3) 15 (0.8) 46 (3.4) -- -- 70 and over...... 33 (2.1) 25 (1.8) 20 (1.0) 19 (1.2) 24 (0.9) 14 (0.7) 55 (2.3) -- --
2 - 19............ 30 (1.0) 24 (1.1) 16 (0.6) 18 (0.5) 19 (0.6) 15 (0.6) 22* (6.8) -- -- 20 and over... 27 (0.7) 21 (0.4) 18 (0.5) 18 (0.4) 21 (0.3) 14 (0.4) 46 (1.9) #
2 and over... 28 (0.6) 22 (0.5) 18 (0.4) 18 (0.3) 21 (0.3) 15 (0.3) 45 (1.8) -- --
Males and females:2 - 19............ 31 (1.0) 25 (1.0) 17 (0.3) 18 (0.6) 20 (0.5) 15 (0.4) 18 (4.5) -- -- 20 and over... 27 (0.6) 21 (0.4) 18 (0.3) 18 (0.2) 20 (0.3) 15 (0.3) 43 (1.6) #
2 and over... 28 (0.5) 22 (0.4) 18 (0.2) 18 (0.2) 20 (0.2) 15 (0.2) 42 (1.5) -- --

What We Eat in America, NHANES 2013-2014
Page 5 of 5Page 5 of 5
Symbol Legend
* Indicates an estimate that may be less statistically reliable than estimates that are not flagged. The rules for flagging estimated percentages and ratios are as follows:
Percent reporting: An estimated percentage between 25 and 75 percent is flagged when based on a sample size of less than 30 times the variance inflation factor (VIF), where the VIFrepresents a broadly calculated average design effect, or when the relative standard error is greater than 30 percent. An estimated percentage less than or equal to 25 percent or greater thanor equal to 75 percent is flagged when the smaller of np and n(1-p) is less than 8 times the VIF, where n is the sample size and p is the percentage expressed as a fraction. The VIF used inthis table is 1.98.
Nutrient ratios expressed as percentages: An estimated ratio between 25 and 75 percent is flagged when based on a sample size n* of less than 30 times the variance inflation factor(VIF), where the VIF represents a broadly calculated average design effect and n* is the number of individuals in the sample reporting non-zero intake of the respective nutrient. Anestimated ratio less than or equal to 25 percent or greater than or equal to 75 percent, is flagged when the smaller of n*p and n* (1-p) is less than 8 times the VIF, where p is the percentageexpressed as a fraction. Additionally, an estimated ratio is flagged when either the relative standard error or p/(1-p) times the relative standard error is greater than 30 percent. The VIFused in this table is 1.98.
# Indicates a non-zero value too small to report.
Footnotes
1 Breakfast includes eating occasions designated by the respondent as "breakfast", or the Spanish equivalents "desayuno", and "almuerzo." Please note these eating occasions include consumptionof beverages including water.
2 Percentages are estimated as a ratio of total nutrients from breakfast for all individuals to total daily nutrient intakes for all individuals. Total daily nutrient intakes are available from:www.ars.usda.gov/nea/bhnrc/fsrg. See Table 1. Nutrient Intakes from Food and Beverages: Mean Amounts Consumed per Individual, by Gender and Age, in the United States, 2013-2014.
3 The percentage of respondents in the gender/age group who reported consuming at least one item at an eating occasion designated as breakfast.
Abbreviations
SE = standard error; RAE = retinol activity equivalents; DFE = dietary folate equivalents.
Notes Applicable to All Tables in Series: What We Eat in America, NHANES 2013-2014
Sample weights designed for dietary analysis were used to allow estimates representative of the U. S. population for the years of collection.
The statistics in this table are estimated from Day 1 dietary recall interviews conducted in the What We Eat in America, National Health and Nutrition Examination Survey (NHANES) 2013-2014.The 24-hour dietary recalls were conducted in-person, by trained interviewers, using the USDA 5-step Automated Multiple-Pass Method. Food intakes were coded and nutrient values weredetermined using the USDA Food and Nutrient Database for Dietary Studies 2013-2014 www.ars.usda.gov/nea/bhnrc/fsrg.
Intakes of nutrients and other dietary components are based on the consumption of food and beverages, including water, and do not include intake from supplements or medications.
The table includes data from individuals 2 years and over. Breast-fed children were excluded because breast milk was not quantified in dietary recall interviews.
Although alcohol data are collected for all individuals, estimates are not presented for age groups under 20 years due to extreme variability and/or inadequate sample size.
Suggested Citation
U.S. Department of Agriculture, Agricultural Research Service. 2016. Breakfast: Percentages of Selected Nutrients Contributed by Food and Beverages Consumed at Breakfast, by Gender andAge, What We Eat in America, NHANES 2013-2014.

DATA SOURCE: What We Eat in America, NHANES 2013-2014, individuals 2 years and over (excluding breast-fed children), day 1. Available: www.ars.usda.gov/nea/bhnrc/fsrg.Page 1 of 5
What We Eat in America, NHANES 2013-2014
Table 14. Breakfast1: Percentages2 of Selected Nutrients Contributed by Food and Beverages Consumed at Breakfast,by Race/Ethnicity and Age, in the United States, 2013-2014
Race/ethnicityand age
Percentreporting3 Energy Protein
Carbo-hydrate
Totalsugars
Dietaryfiber
Totalfat
Saturatedfat
Mono-unsaturated
fat
Poly-unsaturated
fat(years) % (SE) % (SE) % (SE) % (SE) % (SE) % (SE) % (SE) % (SE) % (SE) % (SE)
Non-Hispanic White:2 - 5.............. 98* (0.9) 19 (0.7) 18 (1.1) 21 (0.8) 23 (0.7) 20 (1.6) 16 (1.0) 18 (1.2) 15 (1.2) 13 (0.9)6 - 11.............. 92 (1.6) 17 (0.9) 17 (0.8) 19 (0.9) 20 (1.4) 17 (0.9) 16 (1.4) 17 (1.8) 16 (1.3) 15 (1.3)
12 - 19.............. 76 (3.8) 16 (1.1) 14 (1.2) 19 (1.5) 20 (1.8) 17 (1.7) 14 (0.8) 15 (1.1) 14 (0.9) 12 (0.7)20 and over... 88 (0.6) 16 (0.3) 15 (0.2) 19 (0.5) 21 (0.6) 18 (0.4) 15 (0.4) 16 (0.4) 15 (0.4) 14 (0.5)
2 and over... 88 (0.6) 16 (0.3) 15 (0.2) 19 (0.4) 21 (0.6) 18 (0.3) 15 (0.3) 16 (0.3) 15 (0.3) 14 (0.4)
Non-Hispanic Black:2 - 5.............. 89 (3.5) 18 (1.2) 20 (1.6) 19 (1.4) 21 (1.9) 16 (1.3) 16 (1.4) 20 (1.7) 16 (1.5) 12 (1.0)6 - 11.............. 83 (3.2) 18 (1.3) 17 (1.3) 19 (1.3) 21 (1.2) 16 (1.1) 17 (1.5) 18 (1.6) 18 (1.6) 15 (1.6)
12 - 19.............. 61 (3.3) 13 (1.0) 13 (1.8) 14 (0.9) 16 (1.2) 13 (1.2) 12 (1.3) 13 (1.4) 12 (1.4) 10 (1.1)20 and over... 75 (1.0) 16 (0.6) 15 (0.6) 17 (0.6) 18 (0.7) 16 (0.7) 16 (0.8) 18 (0.9) 16 (0.9) 13 (0.6)
2 and over... 75 (0.8) 16 (0.6) 15 (0.7) 17 (0.5) 18 (0.6) 16 (0.6) 15 (0.8) 17 (0.8) 16 (0.8) 13 (0.6)
Non-Hispanic Asian4:2 - 5.............. 95* (1.5) 19* (1.7) 21* (1.7) 18* (2.0) 20* (3.2) 20* (3.3) 20* (2.4) 22* (4.0) 20* (1.6) 18* (1.6)6 - 11.............. 95* (3.0) 16* (0.7) 17* (1.3) 16* (1.0) 19* (1.8) 15* (2.2) 17* (1.4) 19* (1.4) 16* (2.4) 15* (2.4)
12 - 19.............. 75 (7.6) 15 (2.0) 14 (2.0) 17 (2.1) 20 (3.7) 17 (2.7) 13 (2.1) 16 (2.4) 14 (2.3) 11* (2.2)20 and over... 83 (2.7) 17 (0.8) 16 (0.8) 19 (0.8) 21 (1.4) 18 (0.9) 17 (1.0) 19 (1.2) 16 (1.0) 16 (1.4)
2 and over... 84 (2.3) 17 (0.7) 16 (0.8) 18 (0.7) 21 (1.0) 18 (0.9) 16 (0.9) 19 (1.0) 16 (0.9) 15 (1.3)
Hispanic:2 - 5.............. 94* (1.4) 21 (1.6) 23 (1.8) 21 (1.5) 23 (1.4) 20 (1.4) 21 (1.9) 21 (2.0) 21 (1.9) 19 (1.8)6 - 11.............. 87 (3.3) 22 (2.1) 21 (2.5) 24 (2.3) 25 (2.2) 21 (2.5) 20 (1.7) 22 (2.0) 20 (1.6) 18 (1.6)
12 - 19.............. 80 (2.6) 20 (1.4) 21 (2.7) 19 (1.1) 20 (1.3) 18 (1.2) 19 (1.5) 20 (1.7) 20 (1.8) 17 (1.1)20 and over... 87 (2.0) 22 (0.7) 23 (0.7) 24 (0.9) 24 (1.1) 24 (0.9) 22 (0.8) 23 (0.8) 22 (0.9) 21 (1.0)
2 and over... 86 (1.6) 22 (0.6) 22 (0.8) 23 (0.6) 23 (0.8) 23 (0.8) 21 (0.7) 22 (0.6) 22 (0.8) 20 (0.8)

DATA SOURCE: What We Eat in America, NHANES 2013-2014, individuals 2 years and over (excluding breast-fed children), day 1. Available: www.ars.usda.gov/nea/bhnrc/fsrg.Page 2 of 5
What We Eat in America, NHANES 2013-2014
Table 14. Breakfast1: Percentages2 of Selected Nutrients Contributed by Food and Beverages Consumed at Breakfast,by Race/Ethnicity and Age, in the United States, 2013-2014 (continued)
Race/ethnicityand age
Choles-terol
Vitamin A(RAE)
Beta-carotene Lycopene Thiamin
Ribo-flavin Niacin Vitamin B6
Folate(DFE)
(years) % (SE) % (SE) % (SE) % (SE) % (SE) % (SE) % (SE) % (SE) % (SE)
Non-Hispanic White:2 - 5.............. 24 (2.6) 31 (1.3) 2* (0.5) 1* (0.3) 29 (1.2) 32 (1.5) 25 (1.2) 32 (1.6) 39 (2.6)6 - 11.............. 28 (3.9) 32 (1.9) 12* (7.2) 3* (0.9) 25 (1.0) 29 (0.8) 22 (1.2) 28 (1.6) 34 (2.0)
12 - 19.............. 21 (2.8) 29 (2.5) 3* (1.3) 2* (1.1) 26 (2.7) 28 (2.8) 18 (2.6) 24 (3.1) 33 (3.2)20 and over... 25 (1.2) 27 (0.9) 7 (1.4) 6 (0.9) 23 (0.6) 29 (0.5) 19 (0.5) 23 (0.7) 29 (0.5)
2 and over... 24 (1.1) 28 (0.8) 7 (1.2) 5 (0.8) 24 (0.6) 29 (0.4) 19 (0.5) 24 (0.6) 30 (0.7)
Non-Hispanic Black:2 - 5.............. 32 (4.6) 40 (2.1) 7* (2.1) 3* (1.9) 28 (2.1) 35 (2.0) 23 (2.1) 31 (2.9) 38 (5.1)6 - 11.............. 27 (3.8) 35 (2.6) 4* (1.2) 6* (2.7) 28 (1.8) 32 (2.0) 24 (2.0) 30 (2.9) 30 (2.3)
12 - 19.............. 24 (2.7) 30 (2.4) 6* (2.5) 2* (0.8) 21 (1.1) 26 (2.0) 16 (1.1) 22 (1.4) 26 (2.5)20 and over... 26 (1.5) 26 (1.3) 4 (0.9) 4 (1.0) 23 (0.8) 26 (0.9) 17 (0.5) 20 (0.6) 24 (1.4)
2 and over... 26 (1.5) 28 (1.3) 4 (0.9) 4 (0.7) 23 (0.6) 27 (0.8) 17 (0.5) 21 (0.6) 25 (1.0)
Non-Hispanic Asian4:2 - 5.............. 25* (5.7) 35* (3.1) 17* (9.7) 11* (6.9) 26* (1.2) 30* (1.1) 23* (1.6) 30* (1.9) 29* (3.0)6 - 11.............. 25 (5.3) 29 (4.4) 2* (0.8) 11* (8.8) 23 (2.4) 30 (2.8) 19* (2.3) 23 (3.5) 26 (4.5)
12 - 19.............. 15 (4.1) 23 (4.0) 4* (2.3) 19*(15.6) 22 (2.3) 25 (2.8) 16 (1.9) 19 (3.1) 25 (3.5)20 and over... 25 (2.1) 21 (1.1) 8 (1.6) 5 (1.6) 20 (0.6) 27 (0.7) 15 (0.6) 16 (0.6) 20 (1.1)
2 and over... 24 (1.7) 23 (1.2) 7 (1.5) 8* (3.0) 21 (0.5) 27 (0.7) 16 (0.7) 17 (0.6) 22 (1.1)
Hispanic:2 - 5.............. 37 (4.3) 37 (1.9) 13 (2.6) 9* (4.6) 28 (1.9) 31 (1.6) 26 (1.7) 31 (1.9) 33 (2.0)6 - 11.............. 30 (2.5) 39 (2.5) 13* (4.8) 10* (3.5) 31 (2.7) 35 (2.3) 27 (2.4) 33 (2.2) 37 (2.6)
12 - 19.............. 34 (3.5) 36 (2.0) 12* (3.7) 8 (1.7) 27 (1.5) 33 (1.8) 23 (2.1) 28 (2.2) 30 (1.8)20 and over... 37 (1.6) 33 (1.6) 16 (1.8) 14 (2.3) 28 (1.4) 32 (1.6) 23 (1.1) 25 (1.7) 30 (1.9)
2 and over... 36 (1.1) 34 (0.9) 15 (1.5) 12 (1.7) 28 (1.0) 32 (1.2) 23 (1.1) 27 (1.4) 31 (1.3)

DATA SOURCE: What We Eat in America, NHANES 2013-2014, individuals 2 years and over (excluding breast-fed children), day 1. Available: www.ars.usda.gov/nea/bhnrc/fsrg.Page 3 of 5
What We Eat in America, NHANES 2013-2014
Table 14. Breakfast1: Percentages2 of Selected Nutrients Contributed by Food and Beverages Consumed at Breakfast,by Race/Ethnicity and Age, in the United States, 2013-2014 (continued)
Race/ethnicityand age Choline Vitamin B12 Vitamin C Vitamin D
Vitamin E(alpha-
tocopherol) Vitamin K Calcium Phosphorus Magnesium(years) % (SE) % (SE) % (SE) % (SE) % (SE) % (SE) % (SE) % (SE) % (SE)
Non-Hispanic White:2 - 5.............. 24 (1.2) 38 (1.7) 21 (3.2) 38 (1.8) 15 (2.3) 9 (1.2) 27 (1.2) 23 (1.0) 22 (1.1)6 - 11.............. 26 (2.6) 35 (1.3) 25 (3.1) 37 (1.5) 17 (1.9) 20* (8.4) 24 (1.2) 21 (0.7) 18 (0.7)
12 - 19.............. 20 (1.7) 28 (3.8) 30 (4.1) 39 (3.2) 19 (4.6) 6 (1.0) 22 (1.8) 19 (1.3) 18 (1.2)20 and over... 22 (0.6) 28 (1.0) 25 (1.0) 34 (1.7) 19 (0.7) 10 (1.4) 22 (0.6) 19 (0.3) 20 (0.3)
2 and over... 22 (0.6) 28 (0.8) 25 (1.0) 35 (1.5) 19 (0.7) 10 (1.2) 23 (0.6) 19 (0.3) 20 (0.3)
Non-Hispanic Black:2 - 5.............. 30 (2.8) 39 (2.9) 19 (2.8) 44 (1.9) 13 (1.0) 8* (1.4) 30 (1.9) 25 (1.6) 21 (1.3)6 - 11.............. 24 (2.6) 36 (3.3) 24 (1.9) 43 (2.7) 13 (1.6) 8 (1.5) 25 (1.9) 21 (1.3) 18 (1.1)
12 - 19.............. 22 (2.5) 27 (3.0) 23 (3.3) 38 (3.1) 11 (1.4) 9* (3.0) 20 (2.0) 17 (2.2) 15 (1.5)20 and over... 21 (1.2) 21 (0.9) 23 (1.4) 33 (1.3) 16 (0.8) 7 (1.2) 23 (1.1) 18 (0.7) 17 (0.6)
2 and over... 22 (1.2) 24 (1.2) 23 (1.2) 35 (1.1) 15 (0.6) 8 (1.1) 23 (0.9) 19 (0.8) 17 (0.6)
Non-Hispanic Asian4:2 - 5.............. 25* (3.0) 32* (2.6) 18* (5.5) 33* (3.9) 21* (3.3) 14* (3.6) 29* (4.6) 24* (2.9) 21* (1.9)6 - 11.............. 23 (2.7) 33 (4.0) 17* (3.5) 38 (4.8) 20* (3.5) 7* (0.9) 30 (2.6) 21* (1.4) 19* (1.6)
12 - 19.............. 16 (3.1) 28 (4.3) 20* (8.0) 33 (5.5) 13 (3.9) 5* (1.8) 22 (3.1) 17 (2.5) 15 (2.4)20 and over... 22 (1.3) 22 (1.3) 14 (1.3) 33 (2.6) 14 (1.1) 10 (2.2) 26 (1.1) 20 (0.9) 19 (0.9)
2 and over... 21 (1.1) 24 (1.1) 15 (0.9) 34 (2.3) 15 (1.1) 10 (2.0) 26 (1.1) 20 (0.9) 19 (0.9)
Hispanic:2 - 5.............. 33 (2.3) 37 (2.0) 21 (2.1) 39 (1.7) 20 (2.0) 14 (2.1) 27 (2.0) 25 (1.6) 23 (1.3)6 - 11.............. 29 (2.3) 40 (3.1) 24 (3.1) 46 (2.4) 19 (2.5) 14 (2.5) 30 (2.8) 26 (2.5) 24 (2.2)
12 - 19.............. 31 (2.8) 33 (2.3) 26 (3.1) 43 (2.0) 19 (1.9) 14 (2.4) 26 (1.7) 24 (1.9) 22 (1.6)20 and over... 31 (1.2) 30 (2.5) 25 (1.8) 41 (2.3) 22 (1.0) 15 (1.9) 27 (1.3) 26 (0.9) 24 (0.8)
2 and over... 31 (0.9) 32 (2.0) 24 (1.3) 41 (1.6) 21 (0.9) 15 (1.5) 27 (0.9) 25 (0.8) 24 (0.7)

DATA SOURCE: What We Eat in America, NHANES 2013-2014, individuals 2 years and over (excluding breast-fed children), day 1. Available: www.ars.usda.gov/nea/bhnrc/fsrg.Page 4 of 5
What We Eat in America, NHANES 2013-2014
Table 14. Breakfast1: Percentages2 of Selected Nutrients Contributed by Food and Beverages Consumed at Breakfast,by Race/Ethnicity and Age, in the United States, 2013-2014 (continued)
Race/ethnicityand age Iron Zinc Copper Selenium Potassium Sodium Caffeine Alcohol(years) % (SE) % (SE) % (SE) % (SE) % (SE) % (SE) % (SE) % (SE)
Non-Hispanic White:2 - 5.............. 36 (1.3) 30 (1.8) 19 (1.2) 18 (1.0) 21 (0.8) 15 (0.6) 12* (1.3) -- -- 6 - 11.............. 31 (1.3) 24 (0.9) 15 (0.6) 18 (1.0) 19 (1.0) 15 (0.8) 12* (3.9) -- --
12 - 19.............. 31 (3.3) 23 (3.5) 15 (1.2) 15 (1.3) 18 (1.3) 13 (1.0) 21* (7.4) -- -- 20 and over... 28 (0.6) 21 (0.5) 17 (0.3) 16 (0.3) 20 (0.3) 13 (0.3) 43 (1.6) #
2 and over... 29 (0.7) 21 (0.6) 17 (0.2) 16 (0.3) 20 (0.2) 13 (0.2) 41 (1.6) -- --
Non-Hispanic Black:2 - 5.............. 32 (2.4) 28 (2.3) 17 (1.7) 20 (2.1) 21 (1.4) 17 (1.6) 16* (8.3) -- -- 6 - 11.............. 31 (2.5) 24 (1.5) 15 (1.0) 18 (2.0) 20 (1.1) 17 (1.3) 8* (1.8) -- --
12 - 19.............. 23 (1.4) 20 (2.1) 13 (1.6) 14 (1.1) 15 (1.5) 12 (1.1) 11 (3.1) -- -- 20 and over... 25 (1.0) 18 (0.9) 16 (0.6) 17 (0.7) 17 (0.7) 16 (0.6) 43 (2.8) #
2 and over... 25 (0.8) 19 (0.9) 16 (0.6) 16 (0.7) 17 (0.7) 15 (0.6) 40 (2.5) -- --
Non-Hispanic Asian4:2 - 5.............. 33* (3.0) 23* (6.1) 16* (2.7) 20* (2.5) 21* (1.5) 19* (2.3) 14*(10.6) -- -- 6 - 11.............. 24 (3.0) 22* (4.3) 16* (1.2) 18* (2.2) 19* (1.5) 15* (1.2) 12* (7.4) -- --
12 - 19.............. 26 (3.2) 18 (3.4) 14 (2.7) 15 (3.2) 16 (2.8) 14 (2.0) 3* (1.5) -- -- 20 and over... 22 (0.9) 17 (0.7) 17 (0.9) 17 (0.8) 19 (0.7) 14 (1.0) 44 (2.5) #
2 and over... 23 (0.9) 18 (0.9) 16 (1.0) 17 (0.9) 19 (0.7) 14 (0.9) 42 (2.4) -- --
Hispanic:2 - 5.............. 33 (1.7) 30 (1.6) 22 (1.4) 24 (2.1) 23 (1.3) 20 (2.1) 9* (1.3) -- -- 6 - 11.............. 35 (2.9) 28 (2.4) 21 (2.1) 23 (2.8) 24 (2.0) 20 (2.3) 10 (3.0) -- --
12 - 19.............. 29 (1.1) 27 (3.3) 20 (1.4) 22 (2.7) 22 (1.5) 19 (1.3) 19 (2.6) -- -- 20 and over... 30 (1.3) 24 (1.1) 24 (1.1) 25 (0.9) 25 (0.7) 22 (1.0) 48 (2.6) 1* (0.6)
2 and over... 31 (0.9) 25 (1.0) 23 (0.9) 25 (0.9) 24 (0.7) 21 (0.7) 45 (2.6) -- --

What We Eat in America, NHANES 2013-2014
Page 5 of 5Page 5 of 5
Symbol Legend
* Indicates an estimate that may be less statistically reliable than estimates that are not flagged. The rules for flagging estimated percentages and ratios are as follows:
Percent reporting: An estimated percentage between 25 and 75 percent is flagged when based on a sample size of less than 30 times the variance inflation factor (VIF), where the VIFrepresents a broadly calculated average design effect, or when the relative standard error is greater than 30 percent. An estimated percentage less than or equal to 25 percent or greater thanor equal to 75 percent is flagged when the smaller of np and n(1-p) is less than 8 times the VIF, where n is the sample size and p is the percentage expressed as a fraction. The VIF used inthis table is 1.98.
Nutrient ratios expressed as percentages: An estimated ratio between 25 and 75 percent is flagged when based on a sample size n* of less than 30 times the variance inflation factor(VIF), where the VIF represents a broadly calculated average design effect and n* is the number of individuals in the sample reporting non-zero intake of the respective nutrient. Anestimated ratio less than or equal to 25 percent or greater than or equal to 75 percent, is flagged when the smaller of n*p and n* (1-p) is less than 8 times the VIF, where p is the percentageexpressed as a fraction. Additionally, an estimated ratio is flagged when either the relative standard error or p/(1-p) times the relative standard error is greater than 30 percent. The VIFused in this table is 1.98.
# Indicates a non-zero value too small to report.
Footnotes
1 Breakfast includes eating occasions designated by the respondent as "breakfast", or the Spanish equivalents "desayuno", and "almuerzo." Please note these eating occasions include consumptionof beverages including water.
2 Percentages are estimated as a ratio of total nutrients from breakfast for all individuals to total daily nutrient intakes for all individuals. Total daily nutrient intakes are available from:www.ars.usda.gov/nea/bhnrc/fsrg. See Table 2. Nutrient Intakes from Food and Beverages: Mean Amounts Consumed per Individual, by Race/Ethnicity and Age, in the United States,2013-2014.
3 The percentage of respondents in the race/ethnicity/age group who reported consuming at least one item at an eating occasion designated as breakfast.
4 A new sampling methodology was implemented for NHANES 2011-2012 to oversample non-Hispanic non-black Asians in addition to the ongoing oversample of Hispanics, non-Hispanicblacks, low-income whites/others, and whites/others 80+ years.
Abbreviations
SE = standard error; RAE = retinol activity equivalents; DFE = dietary folate equivalents.
Notes Applicable to All Tables in Series: What We Eat in America, NHANES 2013-2014
Sample weights designed for dietary analysis were used to allow estimates representative of the U. S. population for the years of collection.
The statistics in this table are estimated from Day 1 dietary recall interviews conducted in the What We Eat in America, National Health and Nutrition Examination Survey (NHANES) 2013-2014.The 24-hour dietary recalls were conducted in-person, by trained interviewers, using the USDA 5-step Automated Multiple-Pass Method. Food intakes were coded and nutrient values weredetermined using the USDA Food and Nutrient Database for Dietary Studies 2013-2014 www.ars.usda.gov/nea/bhnrc/fsrg.
Intakes of nutrients and other dietary components are based on the consumption of food and beverages, including water, and do not include intake from supplements or medications.
The table includes data from individuals 2 years and over. Breast-fed children were excluded because breast milk was not quantified in dietary recall interviews.
Although alcohol data are collected for all individuals, estimates are not presented for age groups under 20 years due to extreme variability and/or inadequate sample size.
Suggested Citation
U.S. Department of Agriculture, Agricultural Research Service. 2016. Breakfast: Percentages of Selected Nutrients Contributed by Food and Beverages Consumed at Breakfast, by Race/Ethnicityand Age, What We Eat in America, NHANES 2013-2014.

DATA SOURCE: What We Eat in America, NHANES 2013-2014, individuals 2 years and over (excluding breast-fed children), day 1. Available: www.ars.usda.gov/nea/bhnrc/fsrg.Page 1 of 5
What We Eat in America, NHANES 2013-2014
Table 15. Breakfast1: Percentages2 of Selected Nutrients Contributed by Food and Beverages Consumed at Breakfast,by Family Income (in Dollars) and Age, in the United States, 2013-2014
Family incomein dollarsand age
Percentreporting3 Energy Protein
Carbo-hydrate
Totalsugars
Dietaryfiber
Totalfat
Saturatedfat
Mono-unsaturated
fat
Poly-unsaturated
fat(years) % (SE) % (SE) % (SE) % (SE) % (SE) % (SE) % (SE) % (SE) % (SE) % (SE)
$0 - $24,999:2 - 5.............. 95* (1.9) 22 (1.6) 23 (1.6) 22 (1.8) 24 (1.8) 19 (1.8) 20 (1.8) 23 (1.7) 20 (1.9) 18 (2.0)6 - 11.............. 88 (2.3) 20 (1.4) 20 (1.7) 22 (1.4) 24 (1.5) 20 (1.8) 18 (1.5) 19 (1.4) 18 (1.8) 16 (1.7)
12 - 19.............. 68 (4.3) 15 (1.3) 15 (1.6) 15 (1.4) 15 (1.7) 15 (1.2) 16 (1.4) 17 (1.5) 17 (1.6) 13 (1.3)20 and over... 80 (1.5) 17 (0.5) 17 (0.5) 18 (0.6) 19 (0.6) 19 (0.9) 16 (0.8) 16 (0.6) 17 (0.9) 16 (0.9)
2 and over... 80 (1.0) 17 (0.4) 17 (0.5) 19 (0.5) 19 (0.4) 19 (0.7) 17 (0.7) 17 (0.6) 17 (0.8) 16 (0.8)
$25,000 - $74,999:2 - 5.............. 94 (1.9) 17 (0.9) 18 (0.8) 18 (1.3) 21 (1.2) 19 (2.4) 16 (1.3) 18 (1.2) 16 (1.6) 14 (1.2)6 - 11.............. 85 (3.1) 20 (1.3) 19 (1.1) 21 (1.4) 23 (1.9) 17 (1.4) 19 (1.8) 21 (2.5) 19 (1.6) 18 (1.8)
12 - 19.............. 74 (4.5) 18 (1.1) 17 (2.0) 19 (1.1) 21 (1.4) 18 (1.6) 16 (1.3) 18 (1.4) 16 (1.5) 13 (1.1)20 and over... 86 (1.0) 18 (0.5) 17 (0.4) 20 (0.5) 21 (0.6) 20 (0.6) 17 (0.7) 18 (0.6) 18 (0.9) 16 (0.8)
2 and over... 85 (0.9) 18 (0.4) 17 (0.4) 20 (0.4) 21 (0.6) 19 (0.6) 17 (0.7) 18 (0.7) 17 (0.8) 15 (0.7)
$75,000 and higher:2 - 5.............. 99* (1.0) 18 (0.7) 18 (1.3) 20 (0.8) 22 (1.1) 19 (1.0) 15 (1.1) 17 (1.5) 15 (1.3) 12 (0.9)6 - 11.............. 95* (1.2) 17 (0.7) 16 (1.0) 18 (0.7) 18 (1.0) 17 (1.4) 15 (1.0) 16 (1.3) 16 (1.3) 13 (0.8)
12 - 19.............. 81 (5.0) 17 (1.2) 15 (1.0) 20 (1.6) 22 (2.2) 18 (1.3) 13 (0.9) 14 (1.1) 14 (0.9) 13 (1.1)20 and over... 91 (0.9) 16 (0.4) 15 (0.4) 19 (0.5) 22 (0.5) 18 (0.4) 15 (0.5) 16 (0.4) 15 (0.6) 14 (0.7)
2 and over... 90 (1.0) 16 (0.4) 15 (0.4) 19 (0.5) 22 (0.5) 18 (0.4) 15 (0.4) 16 (0.4) 15 (0.5) 14 (0.6)
All Individuals4:2 - 5.............. 96 (1.0) 19 (0.7) 20 (0.8) 20 (0.7) 22 (0.7) 19 (1.1) 17 (0.9) 19 (1.0) 17 (1.0) 15 (0.7)6 - 11.............. 90 (1.6) 19 (0.7) 18 (0.7) 20 (0.7) 22 (0.8) 18 (0.8) 17 (0.8) 18 (1.1) 17 (0.9) 15 (0.7)
12 - 19.............. 75 (2.4) 16 (0.7) 15 (0.9) 18 (0.9) 20 (1.1) 17 (0.8) 15 (0.6) 16 (0.7) 15 (0.6) 13 (0.4)20 and over... 86 (0.7) 17 (0.3) 16 (0.2) 19 (0.4) 21 (0.5) 19 (0.4) 16 (0.3) 17 (0.3) 16 (0.4) 15 (0.5)
2 and over... 86 (0.6) 17 (0.2) 16 (0.2) 19 (0.3) 21 (0.4) 19 (0.3) 16 (0.3) 17 (0.2) 16 (0.3) 15 (0.4)

DATA SOURCE: What We Eat in America, NHANES 2013-2014, individuals 2 years and over (excluding breast-fed children), day 1. Available: www.ars.usda.gov/nea/bhnrc/fsrg.Page 2 of 5
What We Eat in America, NHANES 2013-2014
Table 15. Breakfast1: Percentages2 of Selected Nutrients Contributed by Food and Beverages Consumed at Breakfast,by Family Income (in Dollars) and Age, in the United States, 2013-2014 (continued)
Family incomein dollarsand age
Choles-terol
Vitamin A(RAE)
Beta-carotene Lycopene Thiamin
Ribo-flavin Niacin Vitamin B6
Folate(DFE)
(years) % (SE) % (SE) % (SE) % (SE) % (SE) % (SE) % (SE) % (SE) % (SE)
$0 - $24,999:2 - 5.............. 39 (3.3) 38 (2.1) 5* (1.4) 8* (4.6) 30 (1.6) 34 (1.4) 26 (1.5) 32 (1.9) 38 (1.7)6 - 11.............. 28 (2.7) 38 (2.2) 7 (2.0) 10* (3.1) 30 (2.2) 34 (2.0) 26 (2.2) 32 (2.7) 36 (2.7)
12 - 19.............. 26 (3.1) 29 (1.8) 10 (2.7) 6* (2.5) 22 (1.4) 26 (1.7) 16 (1.6) 20 (2.3) 27 (2.1)20 and over... 26 (1.6) 25 (1.1) 7 (1.1) 8 (1.7) 23 (0.8) 27 (0.6) 20 (0.9) 24 (1.5) 27 (1.5)
2 and over... 27 (1.5) 27 (0.9) 7 (0.9) 8 (1.3) 24 (0.6) 28 (0.5) 20 (0.7) 24 (1.1) 28 (1.0)
$25,000 - $74,999:2 - 5.............. 31 (4.0) 32 (2.2) 5* (1.9) 5* (1.9) 27 (1.6) 31 (1.2) 23 (1.6) 31 (1.7) 35 (1.9)6 - 11.............. 30 (2.9) 33 (2.2) 5 (0.7) 6* (1.9) 28 (1.4) 31 (1.3) 23 (1.9) 28 (2.2) 32 (1.9)
12 - 19.............. 27 (3.1) 32 (3.4) 5 (1.1) 6* (3.5) 27 (4.0) 30 (3.5) 22 (3.6) 27 (4.5) 34 (4.7)20 and over... 30 (1.4) 31 (1.2) 10 (2.2) 8 (1.4) 25 (0.7) 29 (0.7) 19 (0.6) 22 (1.0) 29 (0.8)
2 and over... 30 (1.1) 31 (0.9) 10 (1.8) 8 (1.3) 25 (0.6) 30 (0.5) 20 (0.5) 23 (0.8) 30 (0.8)
$75,000 and higher:2 - 5.............. 21 (2.1) 32 (2.2) 5* (2.4) 1* (0.5) 27 (1.7) 31 (2.2) 24 (1.6) 31 (2.1) 36 (4.1)6 - 11.............. 28 (3.6) 34 (2.8) 15* (9.9) 4* (1.1) 26 (1.4) 29 (0.8) 23 (1.3) 30 (1.9) 33 (1.7)
12 - 19.............. 22 (2.2) 30 (2.8) 3* (1.1) 2* (0.5) 26 (1.3) 28 (1.9) 18 (2.1) 25 (3.0) 32 (3.1)20 and over... 24 (1.1) 26 (0.8) 7 (1.3) 6 (1.4) 23 (0.6) 29 (0.6) 17 (0.6) 22 (0.9) 28 (0.8)
2 and over... 24 (0.9) 27 (0.7) 7 (1.2) 5 (1.1) 24 (0.5) 29 (0.5) 18 (0.6) 23 (0.8) 29 (1.0)
All Individuals4:2 - 5.............. 31 (2.3) 34 (1.2) 5 (1.2) 4* (1.8) 28 (0.9) 32 (1.0) 24 (0.9) 32 (1.1) 37 (1.6)6 - 11.............. 29 (2.4) 34 (1.0) 10* (4.5) 6 (1.1) 27 (0.9) 31 (0.9) 24 (0.9) 30 (1.0) 34 (1.4)
12 - 19.............. 25 (1.5) 31 (1.6) 5 (0.8) 4 (1.1) 25 (1.6) 28 (1.8) 19 (1.6) 24 (2.1) 31 (2.1)20 and over... 27 (0.8) 28 (0.6) 8 (1.0) 7 (0.9) 24 (0.5) 29 (0.4) 19 (0.4) 23 (0.6) 28 (0.5)
2 and over... 27 (0.6) 29 (0.5) 8 (0.8) 7 (0.8) 24 (0.4) 29 (0.3) 19 (0.4) 24 (0.5) 29 (0.5)

DATA SOURCE: What We Eat in America, NHANES 2013-2014, individuals 2 years and over (excluding breast-fed children), day 1. Available: www.ars.usda.gov/nea/bhnrc/fsrg.Page 3 of 5
What We Eat in America, NHANES 2013-2014
Table 15. Breakfast1: Percentages2 of Selected Nutrients Contributed by Food and Beverages Consumed at Breakfast,by Family Income (in Dollars) and Age, in the United States, 2013-2014 (continued)
Family incomein dollarsand age Choline Vitamin B12 Vitamin C Vitamin D
Vitamin E(alpha-
tocopherol) Vitamin K Calcium Phosphorus Magnesium(years) % (SE) % (SE) % (SE) % (SE) % (SE) % (SE) % (SE) % (SE) % (SE)
$0 - $24,999:2 - 5.............. 34 (2.2) 38 (1.9) 18 (2.4) 41 (2.5) 16 (1.8) 13 (2.2) 27 (1.8) 26 (1.6) 23 (1.4)6 - 11.............. 27 (2.1) 39 (2.4) 27 (2.5) 44 (3.3) 18 (2.1) 9 (2.0) 28 (1.6) 25 (1.4) 22 (1.5)
12 - 19.............. 23 (2.2) 26 (2.4) 23 (3.5) 37 (1.8) 15 (2.1) 8 (1.0) 20 (1.5) 18 (1.5) 16 (1.2)20 and over... 23 (0.9) 26 (1.4) 23 (1.2) 33 (1.3) 19 (1.3) 11 (1.1) 21 (0.6) 20 (0.5) 20 (0.7)
2 and over... 24 (0.9) 28 (1.1) 23 (1.2) 35 (1.0) 18 (1.2) 11 (0.9) 22 (0.5) 20 (0.5) 20 (0.6)
$25,000 - $74,999:2 - 5.............. 27 (1.9) 36 (2.4) 19 (2.2) 37 (2.1) 17 (2.4) 9 (1.1) 29 (1.4) 23 (0.8) 21 (1.3)6 - 11.............. 26 (1.7) 35 (2.5) 23 (2.1) 43 (1.6) 19 (2.0) 12 (1.0) 28 (1.3) 23 (1.1) 20 (1.1)
12 - 19.............. 25 (2.4) 31 (5.1) 30 (4.4) 38 (3.3) 22 (5.2) 9 (1.4) 22 (1.6) 21 (1.4) 19 (1.2)20 and over... 25 (0.9) 27 (1.3) 24 (1.2) 39 (1.7) 20 (0.8) 13 (2.5) 24 (0.7) 21 (0.4) 20 (0.6)
2 and over... 25 (0.7) 29 (1.2) 24 (1.0) 39 (1.3) 20 (0.8) 12 (2.1) 25 (0.6) 21 (0.4) 20 (0.5)
$75,000 and higher:2 - 5.............. 24 (1.4) 37 (2.0) 26 (3.8) 39 (2.4) 15 (2.6) 10* (1.7) 27 (1.8) 22 (1.5) 21 (1.3)6 - 11.............. 26 (2.5) 37 (1.5) 26 (4.2) 36 (1.4) 16 (1.6) 23*(11.9) 23 (1.1) 21 (1.0) 18 (1.1)
12 - 19.............. 21 (1.6) 28 (3.4) 28 (3.6) 41 (3.4) 13 (1.6) 7 (1.2) 24 (2.1) 20 (1.4) 18 (1.1)20 and over... 22 (0.7) 27 (1.1) 24 (1.6) 32 (2.1) 18 (0.7) 8 (0.9) 23 (0.4) 19 (0.4) 20 (0.3)
2 and over... 22 (0.6) 28 (0.9) 25 (1.7) 34 (1.7) 17 (0.6) 9 (0.9) 23 (0.4) 19 (0.3) 19 (0.2)
All Individuals4:2 - 5.............. 28 (1.3) 37 (1.3) 20 (1.8) 39 (1.6) 16 (1.2) 10 (0.9) 28 (1.1) 24 (0.7) 22 (0.7)6 - 11.............. 26 (1.7) 36 (1.3) 25 (1.9) 40 (1.5) 17 (1.3) 16* (5.4) 26 (1.0) 23 (0.7) 20 (0.7)
12 - 19.............. 23 (1.1) 29 (2.3) 27 (2.3) 39 (1.8) 17 (2.7) 8 (0.5) 22 (1.0) 20 (0.8) 18 (0.6)20 and over... 24 (0.4) 27 (0.9) 24 (0.7) 35 (1.2) 19 (0.5) 11 (1.0) 23 (0.4) 20 (0.3) 20 (0.3)
2 and over... 24 (0.3) 28 (0.7) 24 (0.7) 36 (1.0) 18 (0.5) 11 (0.8) 24 (0.4) 20 (0.2) 20 (0.2)

DATA SOURCE: What We Eat in America, NHANES 2013-2014, individuals 2 years and over (excluding breast-fed children), day 1. Available: www.ars.usda.gov/nea/bhnrc/fsrg.Page 4 of 5
What We Eat in America, NHANES 2013-2014
Table 15. Breakfast1: Percentages2 of Selected Nutrients Contributed by Food and Beverages Consumed at Breakfast,by Family Income (in Dollars) and Age, in the United States, 2013-2014 (continued)
Family incomein dollarsand age Iron Zinc Copper Selenium Potassium Sodium Caffeine Alcohol(years) % (SE) % (SE) % (SE) % (SE) % (SE) % (SE) % (SE) % (SE)
$0 - $24,999:2 - 5.............. 36 (1.8) 31 (1.3) 20 (1.8) 24 (1.7) 22 (1.5) 21 (1.7) 8* (3.1) -- -- 6 - 11.............. 33 (2.2) 29 (1.4) 20 (1.4) 21 (1.9) 23 (1.6) 19 (1.6) 15 (3.5) -- --
12 - 19.............. 24 (2.0) 20 (1.8) 15 (1.3) 16 (1.5) 17 (1.4) 15 (1.3) 14 (2.1) -- -- 20 and over... 27 (1.1) 21 (0.8) 19 (0.7) 18 (0.6) 20 (0.5) 16 (0.6) 40 (1.5) #
2 and over... 28 (0.8) 22 (0.6) 18 (0.6) 18 (0.5) 20 (0.5) 16 (0.5) 39 (1.4) -- --
$25,000 - $74,999:2 - 5.............. 34 (2.5) 28 (1.6) 17 (1.1) 18 (1.1) 21 (0.7) 15 (0.8) 11* (3.6) -- -- 6 - 11.............. 30 (2.2) 24 (1.4) 16 (1.1) 20 (1.3) 20 (1.0) 18 (1.4) 8* (2.4) -- --
12 - 19.............. 32 (4.6) 28 (5.7) 18 (1.2) 18 (2.1) 19 (1.4) 15 (1.2) 19 (5.2) -- -- 20 and over... 29 (0.8) 21 (0.5) 18 (0.4) 19 (0.4) 21 (0.4) 16 (0.6) 42 (2.6) #
2 and over... 29 (0.8) 22 (0.7) 18 (0.4) 19 (0.5) 21 (0.4) 16 (0.5) 41 (2.5) -- --
$75,000 and higher:2 - 5.............. 33 (2.2) 29 (2.7) 18 (1.2) 18 (1.2) 21 (1.2) 14 (1.1) 16* (2.8) -- -- 6 - 11.............. 32 (1.9) 24 (0.9) 16 (1.0) 17 (0.9) 19 (1.5) 15 (0.6) 13* (5.2) -- --
12 - 19.............. 32 (2.9) 21 (1.7) 16 (1.0) 15 (0.9) 19 (1.3) 13 (1.0) 20*(10.9) -- -- 20 and over... 26 (0.5) 20 (0.6) 17 (0.4) 16 (0.4) 20 (0.4) 13 (0.6) 46 (2.1) 0* (0.0)
2 and over... 27 (0.6) 21 (0.5) 17 (0.3) 16 (0.4) 20 (0.4) 13 (0.5) 45 (2.1) -- --
All Individuals4:2 - 5.............. 34 (1.0) 29 (1.1) 19 (0.9) 20 (1.0) 22 (0.5) 17 (0.8) 11 (1.3) -- -- 6 - 11.............. 32 (1.2) 25 (0.9) 17 (0.6) 19 (0.9) 20 (0.8) 17 (0.8) 11 (2.6) -- --
12 - 19.............. 30 (2.0) 23 (2.3) 16 (0.6) 16 (0.9) 19 (0.8) 14 (0.6) 20 (5.5) -- -- 20 and over... 27 (0.6) 21 (0.4) 18 (0.3) 18 (0.2) 20 (0.3) 15 (0.3) 43 (1.6) #
2 and over... 28 (0.5) 22 (0.4) 18 (0.2) 18 (0.2) 20 (0.2) 15 (0.2) 42 (1.5) -- --

What We Eat in America, NHANES 2013-2014
Page 5 of 5Page 5 of 5
Symbol Legend
* Indicates an estimate that may be less statistically reliable than estimates that are not flagged. The rules for flagging estimated percentages and ratios are as follows:
Percent reporting: An estimated percentage between 25 and 75 percent is flagged when based on a sample size of less than 30 times the variance inflation factor (VIF), where the VIFrepresents a broadly calculated average design effect, or when the relative standard error is greater than 30 percent. An estimated percentage less than or equal to 25 percent or greater thanor equal to 75 percent is flagged when the smaller of np and n(1-p) is less than 8 times the VIF, where n is the sample size and p is the percentage expressed as a fraction. The VIF used inthis table is 1.98.
Nutrient ratios expressed as percentages: An estimated ratio between 25 and 75 percent is flagged when based on a sample size n* of less than 30 times the variance inflation factor(VIF), where the VIF represents a broadly calculated average design effect and n* is the number of individuals in the sample reporting non-zero intake of the respective nutrient. Anestimated ratio less than or equal to 25 percent or greater than or equal to 75 percent, is flagged when the smaller of n*p and n* (1-p) is less than 8 times the VIF, where p is the percentageexpressed as a fraction. Additionally, an estimated ratio is flagged when either the relative standard error or p/(1-p) times the relative standard error is greater than 30 percent. The VIFused in this table is 1.98.
# Indicates a non-zero value too small to report.
Footnotes
1 Breakfast includes eating occasions designated by the respondent as "breakfast", or the Spanish equivalents "desayuno", and "almuerzo." Please note these eating occasions include consumptionof beverages including water.
2 Percentages are estimated as a ratio of total nutrients from breakfast for all individuals to total daily nutrient intakes for all individuals. Total daily nutrient intakes are available from:www.ars.usda.gov/nea/bhnrc/fsrg. See Table 3. Nutrient Intakes from Food and Beverages: Mean Amounts Consumed per Individual, by Family Income (in Dollars) and Age, in the UnitedStates, 2013-2014.
3 The percentage of respondents in the income/age group who reported consuming at least one item at an eating occasion designated as breakfast.
4 Includes persons of all income levels or with unknown family income.
Abbreviations
SE = standard error; RAE = retinol activity equivalents; DFE = dietary folate equivalents.
Notes Applicable to All Tables in Series: What We Eat in America, NHANES 2013-2014
Sample weights designed for dietary analysis were used to allow estimates representative of the U. S. population for the years of collection.
The statistics in this table are estimated from Day 1 dietary recall interviews conducted in the What We Eat in America, National Health and Nutrition Examination Survey (NHANES) 2013-2014.The 24-hour dietary recalls were conducted in-person, by trained interviewers, using the USDA 5-step Automated Multiple-Pass Method. Food intakes were coded and nutrient values weredetermined using the USDA Food and Nutrient Database for Dietary Studies 2013-2014 www.ars.usda.gov/nea/bhnrc/fsrg.
Intakes of nutrients and other dietary components are based on the consumption of food and beverages, including water, and do not include intake from supplements or medications.
The table includes data from individuals 2 years and over. Breast-fed children were excluded because breast milk was not quantified in dietary recall interviews.
Although alcohol data are collected for all individuals, estimates are not presented for age groups under 20 years due to extreme variability and/or inadequate sample size.
Suggested Citation
U.S. Department of Agriculture, Agricultural Research Service. 2016. Breakfast: Percentages of Selected Nutrients Contributed by Food and Beverages Consumed at Breakfast, by Family Income(in Dollars) and Age, What We Eat in America, NHANES 2013-2014.

DATA SOURCE: What We Eat in America, NHANES 2013-2014, individuals 2 years and over (excluding breast-fed children), day 1. Available: www.ars.usda.gov/nea/bhnrc/fsrg.Page 1 of 5
What We Eat in America, NHANES 2013-2014
Table 16. Breakfast1: Percentages2 of Selected Nutrients Contributed by Food and Beverages Consumed at Breakfast,by Family Income (as % of Poverty Level3) and Age, in the United States, 2013-2014
Family income as% of poverty level
and age Percent
reporting4 Energy Protein Carbo-hydrate
Totalsugars
Dietaryfiber
Totalfat
Saturatedfat
Mono-unsaturated
fat
Poly-unsaturated
fat(years) % (SE) % (SE) % (SE) % (SE) % (SE) % (SE) % (SE) % (SE) % (SE) % (SE)
Under 131% poverty:2 - 5.............. 95 (1.5) 20 (1.3) 22 (1.3) 21 (1.5) 23 (1.6) 19 (1.5) 19 (1.5) 21 (1.5) 19 (1.6) 17 (1.6)6 - 11.............. 86 (2.2) 19 (1.1) 19 (1.3) 21 (1.1) 23 (1.0) 18 (1.2) 17 (1.4) 18 (1.6) 17 (1.5) 15 (1.5)
12 - 19.............. 70 (4.1) 16 (1.2) 15 (1.4) 16 (1.3) 17 (1.6) 15 (1.0) 16 (1.3) 17 (1.6) 16 (1.4) 13 (1.1)20 and over... 77 (1.5) 18 (0.6) 17 (0.8) 19 (0.7) 19 (0.6) 19 (1.0) 17 (0.9) 18 (0.8) 18 (1.0) 17 (1.2)
2 and over... 79 (1.1) 18 (0.6) 17 (0.6) 19 (0.5) 19 (0.5) 19 (0.8) 17 (0.8) 18 (0.8) 17 (0.9) 16 (1.0)
131-350% poverty:2 - 5.............. 95* (2.0) 17 (1.0) 17 (0.7) 18 (1.5) 21 (1.2) 19 (2.6) 16 (1.4) 18 (1.4) 16 (1.7) 14 (1.1)6 - 11.............. 89 (2.8) 19 (1.7) 18 (1.4) 20 (1.7) 22 (1.9) 17 (1.8) 19 (2.3) 20 (2.8) 19 (2.2) 18 (2.3)
12 - 19.............. 73 (4.1) 17 (1.0) 17 (2.0) 19 (1.2) 20 (1.7) 17 (1.8) 15 (1.1) 17 (1.4) 15 (1.4) 13 (0.9)20 and over... 86 (1.1) 17 (0.5) 16 (0.6) 20 (0.6) 21 (0.7) 19 (0.8) 16 (0.7) 17 (0.7) 16 (0.9) 14 (0.9)
2 and over... 85 (0.9) 17 (0.5) 16 (0.6) 19 (0.5) 21 (0.7) 19 (0.7) 16 (0.6) 17 (0.6) 16 (0.8) 14 (0.7)
Over 350% poverty:2 - 5.............. 98* (1.3) 18 (0.8) 19 (1.4) 20 (0.8) 22 (1.3) 20 (0.9) 15 (1.3) 17 (1.7) 15 (1.5) 13* (1.3)6 - 11.............. 95* (1.0) 17 (1.0) 17 (1.1) 18 (0.9) 19 (1.4) 19 (1.6) 16 (1.4) 17 (1.8) 17 (1.6) 13 (1.3)
12 - 19.............. 84 (5.1) 17 (1.3) 15 (1.4) 21 (1.8) 23 (2.4) 19 (1.6) 14 (0.8) 15 (1.1) 13 (0.8) 13 (0.9)20 and over... 91 (1.0) 16 (0.4) 16 (0.5) 19 (0.4) 22 (0.6) 19 (0.5) 15 (0.5) 17 (0.5) 15 (0.6) 14 (0.7)
2 and over... 91 (0.9) 16 (0.4) 16 (0.4) 19 (0.4) 21 (0.5) 19 (0.4) 15 (0.5) 16 (0.5) 15 (0.5) 14 (0.6)
All Individuals5:2 - 5.............. 96 (1.0) 19 (0.7) 20 (0.8) 20 (0.7) 22 (0.7) 19 (1.1) 17 (0.9) 19 (1.0) 17 (1.0) 15 (0.7)6 - 11.............. 90 (1.6) 19 (0.7) 18 (0.7) 20 (0.7) 22 (0.8) 18 (0.8) 17 (0.8) 18 (1.1) 17 (0.9) 15 (0.7)
12 - 19.............. 75 (2.4) 16 (0.7) 15 (0.9) 18 (0.9) 20 (1.1) 17 (0.8) 15 (0.6) 16 (0.7) 15 (0.6) 13 (0.4)20 and over... 86 (0.7) 17 (0.3) 16 (0.2) 19 (0.4) 21 (0.5) 19 (0.4) 16 (0.3) 17 (0.3) 16 (0.4) 15 (0.5)
2 and over... 86 (0.6) 17 (0.2) 16 (0.2) 19 (0.3) 21 (0.4) 19 (0.3) 16 (0.3) 17 (0.2) 16 (0.3) 15 (0.4)
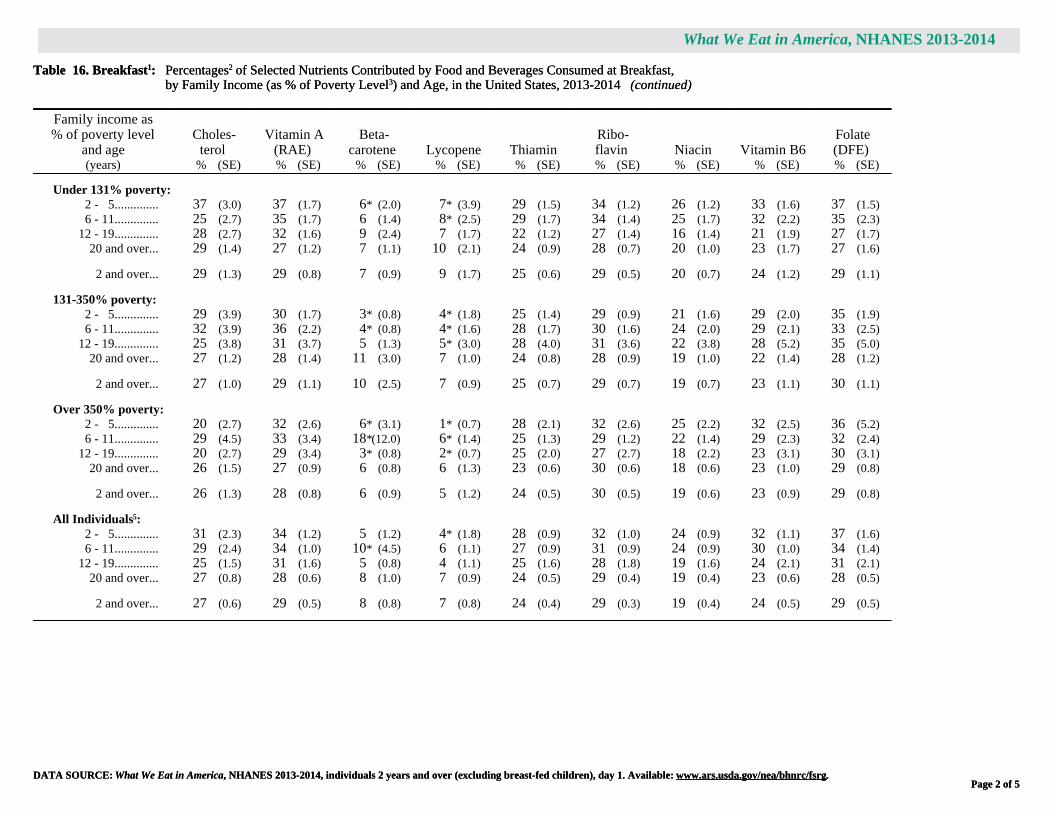
DATA SOURCE: What We Eat in America, NHANES 2013-2014, individuals 2 years and over (excluding breast-fed children), day 1. Available: www.ars.usda.gov/nea/bhnrc/fsrg.Page 2 of 5
What We Eat in America, NHANES 2013-2014
Table 16. Breakfast1: Percentages2 of Selected Nutrients Contributed by Food and Beverages Consumed at Breakfast,by Family Income (as % of Poverty Level3) and Age, in the United States, 2013-2014 (continued)
Family income as% of poverty level
and age Choles-
terol Vitamin A
(RAE) Beta-
carotene Lycopene Thiamin Ribo-flavin Niacin Vitamin B6
Folate(DFE)
(years) % (SE) % (SE) % (SE) % (SE) % (SE) % (SE) % (SE) % (SE) % (SE)
Under 131% poverty:2 - 5.............. 37 (3.0) 37 (1.7) 6* (2.0) 7* (3.9) 29 (1.5) 34 (1.2) 26 (1.2) 33 (1.6) 37 (1.5)6 - 11.............. 25 (2.7) 35 (1.7) 6 (1.4) 8* (2.5) 29 (1.7) 34 (1.4) 25 (1.7) 32 (2.2) 35 (2.3)
12 - 19.............. 28 (2.7) 32 (1.6) 9 (2.4) 7 (1.7) 22 (1.2) 27 (1.4) 16 (1.4) 21 (1.9) 27 (1.7)20 and over... 29 (1.4) 27 (1.2) 7 (1.1) 10 (2.1) 24 (0.9) 28 (0.7) 20 (1.0) 23 (1.7) 27 (1.6)
2 and over... 29 (1.3) 29 (0.8) 7 (0.9) 9 (1.7) 25 (0.6) 29 (0.5) 20 (0.7) 24 (1.2) 29 (1.1)
131-350% poverty:2 - 5.............. 29 (3.9) 30 (1.7) 3* (0.8) 4* (1.8) 25 (1.4) 29 (0.9) 21 (1.6) 29 (2.0) 35 (1.9)6 - 11.............. 32 (3.9) 36 (2.2) 4* (0.8) 4* (1.6) 28 (1.7) 30 (1.6) 24 (2.0) 29 (2.1) 33 (2.5)
12 - 19.............. 25 (3.8) 31 (3.7) 5 (1.3) 5* (3.0) 28 (4.0) 31 (3.6) 22 (3.8) 28 (5.2) 35 (5.0)20 and over... 27 (1.2) 28 (1.4) 11 (3.0) 7 (1.0) 24 (0.8) 28 (0.9) 19 (1.0) 22 (1.4) 28 (1.2)
2 and over... 27 (1.0) 29 (1.1) 10 (2.5) 7 (0.9) 25 (0.7) 29 (0.7) 19 (0.7) 23 (1.1) 30 (1.1)
Over 350% poverty:2 - 5.............. 20 (2.7) 32 (2.6) 6* (3.1) 1* (0.7) 28 (2.1) 32 (2.6) 25 (2.2) 32 (2.5) 36 (5.2)6 - 11.............. 29 (4.5) 33 (3.4) 18*(12.0) 6* (1.4) 25 (1.3) 29 (1.2) 22 (1.4) 29 (2.3) 32 (2.4)
12 - 19.............. 20 (2.7) 29 (3.4) 3* (0.8) 2* (0.7) 25 (2.0) 27 (2.7) 18 (2.2) 23 (3.1) 30 (3.1)20 and over... 26 (1.5) 27 (0.9) 6 (0.8) 6 (1.3) 23 (0.6) 30 (0.6) 18 (0.6) 23 (1.0) 29 (0.8)
2 and over... 26 (1.3) 28 (0.8) 6 (0.9) 5 (1.2) 24 (0.5) 30 (0.5) 19 (0.6) 23 (0.9) 29 (0.8)
All Individuals5:2 - 5.............. 31 (2.3) 34 (1.2) 5 (1.2) 4* (1.8) 28 (0.9) 32 (1.0) 24 (0.9) 32 (1.1) 37 (1.6)6 - 11.............. 29 (2.4) 34 (1.0) 10* (4.5) 6 (1.1) 27 (0.9) 31 (0.9) 24 (0.9) 30 (1.0) 34 (1.4)
12 - 19.............. 25 (1.5) 31 (1.6) 5 (0.8) 4 (1.1) 25 (1.6) 28 (1.8) 19 (1.6) 24 (2.1) 31 (2.1)20 and over... 27 (0.8) 28 (0.6) 8 (1.0) 7 (0.9) 24 (0.5) 29 (0.4) 19 (0.4) 23 (0.6) 28 (0.5)
2 and over... 27 (0.6) 29 (0.5) 8 (0.8) 7 (0.8) 24 (0.4) 29 (0.3) 19 (0.4) 24 (0.5) 29 (0.5)

DATA SOURCE: What We Eat in America, NHANES 2013-2014, individuals 2 years and over (excluding breast-fed children), day 1. Available: www.ars.usda.gov/nea/bhnrc/fsrg.Page 3 of 5
What We Eat in America, NHANES 2013-2014
Table 16. Breakfast1: Percentages2 of Selected Nutrients Contributed by Food and Beverages Consumed at Breakfast,by Family Income (as % of Poverty Level3) and Age, in the United States, 2013-2014 (continued)
Family income as% of poverty level
and age Choline Vitamin B12 Vitamin C Vitamin D
Vitamin E(alpha-
tocopherol) Vitamin K Calcium Phosphorus Magnesium(years) % (SE) % (SE) % (SE) % (SE) % (SE) % (SE) % (SE) % (SE) % (SE)
Under 131% poverty:2 - 5.............. 32 (1.9) 39 (1.9) 17 (2.3) 41 (1.9) 16 (1.6) 12 (1.9) 27 (1.6) 25 (1.3) 22 (1.1)6 - 11.............. 25 (1.8) 37 (2.0) 25 (2.3) 44 (2.0) 18 (1.7) 9 (1.8) 28 (1.6) 23 (1.2) 21 (1.1)
12 - 19.............. 24 (2.0) 27 (1.9) 24 (2.3) 39 (2.2) 16 (1.9) 8 (0.7) 22 (1.4) 19 (1.4) 17 (1.1)20 and over... 25 (0.9) 26 (1.5) 22 (1.6) 34 (1.5) 19 (1.1) 11 (1.2) 22 (0.8) 20 (0.7) 20 (0.8)
2 and over... 25 (0.8) 28 (1.2) 22 (1.3) 36 (0.9) 18 (0.9) 11 (1.0) 23 (0.6) 21 (0.6) 20 (0.6)
131-350% poverty:2 - 5.............. 27 (2.0) 34 (2.1) 21 (2.6) 36 (2.3) 16 (2.6) 8 (0.6) 29 (1.8) 23 (0.8) 21 (1.4)6 - 11.............. 27 (2.2) 38 (2.2) 20 (1.7) 42 (1.7) 17 (2.4) 12 (1.3) 27 (1.8) 23 (1.5) 19 (1.5)
12 - 19.............. 24 (2.7) 33 (5.1) 31 (5.8) 39 (3.8) 21 (5.1) 9 (1.1) 22 (1.7) 20 (1.4) 19 (1.1)20 and over... 23 (1.0) 26 (1.6) 25 (1.5) 37 (2.6) 19 (0.9) 13 (2.9) 23 (0.7) 20 (0.7) 20 (0.8)
2 and over... 24 (0.9) 28 (1.3) 25 (1.1) 38 (2.0) 19 (0.7) 12 (2.5) 24 (0.7) 20 (0.6) 20 (0.7)
Over 350% poverty:2 - 5.............. 23 (1.6) 37 (2.3) 26 (4.3) 39 (2.8) 16 (3.1) 10* (2.2) 27 (2.0) 23 (1.5) 22 (1.3)6 - 11.............. 27 (3.2) 36 (2.0) 29 (6.2) 34 (1.4) 17 (1.7) 27*(14.0) 25 (1.1) 22 (1.1) 19 (1.1)
12 - 19.............. 21 (2.0) 25 (3.4) 28 (4.7) 39 (3.5) 13 (2.2) 8 (1.3) 24 (2.5) 20 (1.8) 19 (1.4)20 and over... 23 (0.9) 28 (1.3) 24 (1.5) 34 (2.1) 18 (0.7) 8 (0.8) 23 (0.5) 20 (0.4) 20 (0.3)
2 and over... 23 (0.8) 28 (1.1) 24 (1.7) 35 (1.7) 18 (0.6) 9 (0.9) 24 (0.5) 20 (0.3) 20 (0.3)
All Individuals5:2 - 5.............. 28 (1.3) 37 (1.3) 20 (1.8) 39 (1.6) 16 (1.2) 10 (0.9) 28 (1.1) 24 (0.7) 22 (0.7)6 - 11.............. 26 (1.7) 36 (1.3) 25 (1.9) 40 (1.5) 17 (1.3) 16* (5.4) 26 (1.0) 23 (0.7) 20 (0.7)
12 - 19.............. 23 (1.1) 29 (2.3) 27 (2.3) 39 (1.8) 17 (2.7) 8 (0.5) 22 (1.0) 20 (0.8) 18 (0.6)20 and over... 24 (0.4) 27 (0.9) 24 (0.7) 35 (1.2) 19 (0.5) 11 (1.0) 23 (0.4) 20 (0.3) 20 (0.3)
2 and over... 24 (0.3) 28 (0.7) 24 (0.7) 36 (1.0) 18 (0.5) 11 (0.8) 24 (0.4) 20 (0.2) 20 (0.2)

DATA SOURCE: What We Eat in America, NHANES 2013-2014, individuals 2 years and over (excluding breast-fed children), day 1. Available: www.ars.usda.gov/nea/bhnrc/fsrg.Page 4 of 5
What We Eat in America, NHANES 2013-2014
Table 16. Breakfast1: Percentages2 of Selected Nutrients Contributed by Food and Beverages Consumed at Breakfast,by Family Income (as % of Poverty Level3) and Age, in the United States, 2013-2014 (continued)
Family income as% of poverty level
and age Iron Zinc Copper Selenium Potassium Sodium Caffeine Alcohol(years) % (SE) % (SE) % (SE) % (SE) % (SE) % (SE) % (SE) % (SE)
Under 131% poverty:2 - 5.............. 36 (1.5) 30 (1.2) 20 (1.4) 23 (1.5) 22 (1.3) 20 (1.5) 9* (2.6) -- -- 6 - 11.............. 32 (1.8) 28 (1.2) 18 (0.8) 19 (1.7) 22 (1.2) 17 (1.3) 12 (2.9) -- --
12 - 19.............. 25 (1.6) 21 (1.3) 16 (1.3) 17 (1.4) 18 (1.2) 15 (1.2) 14 (2.5) -- -- 20 and over... 27 (1.2) 21 (0.9) 18 (0.7) 19 (0.7) 20 (0.7) 16 (0.8) 40 (1.5) #
2 and over... 28 (0.9) 22 (0.8) 18 (0.5) 19 (0.6) 20 (0.6) 17 (0.6) 38 (1.4) -- --
131-350% poverty:2 - 5.............. 32 (2.4) 27 (1.4) 17 (1.2) 17 (1.1) 21 (1.0) 15 (0.9) 13* (5.6) -- -- 6 - 11.............. 32 (2.2) 23 (1.8) 15 (1.3) 20 (1.9) 19 (1.1) 17 (1.7) 10 (3.0) -- --
12 - 19.............. 34 (4.6) 27 (5.4) 16 (1.1) 17 (1.9) 19 (1.6) 15 (1.0) 15* (4.7) -- -- 20 and over... 27 (1.2) 20 (0.7) 18 (0.8) 18 (0.6) 20 (0.7) 15 (0.6) 41 (2.2) #
2 and over... 29 (1.0) 22 (0.9) 18 (0.7) 18 (0.6) 20 (0.6) 15 (0.5) 39 (2.0) -- --
Over 350% poverty:2 - 5.............. 33 (2.5) 29 (3.5) 18 (1.1) 18 (1.1) 22 (1.2) 15 (1.2) 14* (6.2) -- -- 6 - 11.............. 32 (1.8) 24 (1.7) 18 (1.0) 18 (1.1) 20 (1.5) 16 (0.7) 12* (6.2) -- --
12 - 19.............. 30 (2.6) 20 (2.1) 16 (1.1) 16 (1.3) 19 (1.3) 14 (1.5) 26*(14.3) -- -- 20 and over... 27 (0.7) 21 (0.6) 17 (0.5) 17 (0.7) 20 (0.4) 14 (0.5) 47 (2.2) #
2 and over... 28 (0.5) 22 (0.6) 17 (0.4) 17 (0.6) 20 (0.4) 14 (0.5) 46 (2.2) -- --
All Individuals5:2 - 5.............. 34 (1.0) 29 (1.1) 19 (0.9) 20 (1.0) 22 (0.5) 17 (0.8) 11 (1.3) -- -- 6 - 11.............. 32 (1.2) 25 (0.9) 17 (0.6) 19 (0.9) 20 (0.8) 17 (0.8) 11 (2.6) -- --
12 - 19.............. 30 (2.0) 23 (2.3) 16 (0.6) 16 (0.9) 19 (0.8) 14 (0.6) 20 (5.5) -- -- 20 and over... 27 (0.6) 21 (0.4) 18 (0.3) 18 (0.2) 20 (0.3) 15 (0.3) 43 (1.6) #
2 and over... 28 (0.5) 22 (0.4) 18 (0.2) 18 (0.2) 20 (0.2) 15 (0.2) 42 (1.5) -- --

What We Eat in America, NHANES 2013-2014
Page 5 of 5Page 5 of 5
Symbol Legend
* Indicates an estimate that may be less statistically reliable than estimates that are not flagged. The rules for flagging estimated percentages and ratios are as follows:
Percent reporting: An estimated percentage between 25 and 75 percent is flagged when based on a sample size of less than 30 times the variance inflation factor (VIF), where the VIFrepresents a broadly calculated average design effect, or when the relative standard error is greater than 30 percent. An estimated percentage less than or equal to 25 percent or greater thanor equal to 75 percent is flagged when the smaller of np and n(1-p) is less than 8 times the VIF, where n is the sample size and p is the percentage expressed as a fraction. The VIF used inthis table is 1.98.
Nutrient ratios expressed as percentages: An estimated ratio between 25 and 75 percent is flagged when based on a sample size n* of less than 30 times the variance inflation factor(VIF), where the VIF represents a broadly calculated average design effect and n* is the number of individuals in the sample reporting non-zero intake of the respective nutrient. Anestimated ratio less than or equal to 25 percent or greater than or equal to 75 percent, is flagged when the smaller of n*p and n* (1-p) is less than 8 times the VIF, where p is the percentageexpressed as a fraction. Additionally, an estimated ratio is flagged when either the relative standard error or p/(1-p) times the relative standard error is greater than 30 percent. The VIFused in this table is 1.98.
# Indicates a non-zero value too small to report.
Footnotes
1 Breakfast includes eating occasions designated by the respondent as "breakfast", or the Spanish equivalents "desayuno", and "almuerzo." Please note these eating occasions include consumptionof beverages including water.
2 Percentages are estimated as a ratio of total nutrients from breakfast for all individuals to total daily nutrient intakes for all individuals. Total daily nutrient intakes are available from:www.ars.usda.gov/nea/bhnrc/fsrg. See Table 4. Nutrient Intakes from Food and Beverages: Mean Amounts Consumed per Individual, by Family Income (as % of Poverty Level) and Age, in theUnited States, 2013-2014.
3 The ratio of family income to poverty expressed as a percentage. The Department of Health and Human Services’ poverty guidelines were used as the poverty measure to calculate the ratio, http://aspe.hhs.gov/poverty/.
4 The percentage of respondents in the income/age group who reported consuming at least one item at an eating occasion designated as breakfast.
5 Includes persons of all income levels or with unknown family income.
Abbreviations
SE = standard error; RAE = retinol activity equivalents; DFE = dietary folate equivalents.
Notes Applicable to All Tables in Series: What We Eat in America, NHANES 2013-2014
Sample weights designed for dietary analysis were used to allow estimates representative of the U. S. population for the years of collection.
The statistics in this table are estimated from Day 1 dietary recall interviews conducted in the What We Eat in America, National Health and Nutrition Examination Survey (NHANES) 2013-2014.The 24-hour dietary recalls were conducted in-person, by trained interviewers, using the USDA 5-step Automated Multiple-Pass Method. Food intakes were coded and nutrient values weredetermined using the USDA Food and Nutrient Database for Dietary Studies 2013-2014 www.ars.usda.gov/nea/bhnrc/fsrg.
Intakes of nutrients and other dietary components are based on the consumption of food and beverages, including water, and do not include intake from supplements or medications.
The table includes data from individuals 2 years and over. Breast-fed children were excluded because breast milk was not quantified in dietary recall interviews.
Although alcohol data are collected for all individuals, estimates are not presented for age groups under 20 years due to extreme variability and/or inadequate sample size.
Suggested Citation
U.S. Department of Agriculture, Agricultural Research Service. 2016. Breakfast: Percentages of Selected Nutrients Contributed by Food and Beverages Consumed at Breakfast, by Family Income(as % of Poverty Level) and Age, What We Eat in America, NHANES 2013-2014.

DATA SOURCE: What We Eat in America, NHANES 2013-2014, individuals 2 years and over (excluding breast-fed children), day 1. Available: www.ars.usda.gov/nea/bhnrc/fsrg.Page 1 of 5
What We Eat in America, NHANES 2013-2014
Table 17. Lunch1: Percentages2 of Selected Nutrients Contributed by Food and Beverages Consumed at Lunch,by Gender and Age, in the United States, 2013-2014
Genderand age
Percentreporting3 Energy Protein
Carbo-hydrate
Totalsugars
Dietaryfiber
Totalfat
Saturatedfat
Mono-unsaturated
fat
Poly-unsaturated
fat(years) % (SE) % (SE) % (SE) % (SE) % (SE) % (SE) % (SE) % (SE) % (SE) % (SE)
Males:2 - 5.............. 93 (1.7) 23 (0.8) 26 (1.2) 21 (0.8) 17 (1.0) 25 (1.1) 26 (1.2) 24 (1.4) 27 (1.2) 28 (1.8)6 - 11.............. 90 (1.2) 25 (0.8) 29 (1.0) 24 (0.9) 21 (1.0) 30 (1.4) 25 (1.0) 22 (1.1) 26 (1.3) 28 (1.3)
12 - 19.............. 86 (1.7) 28 (1.0) 30 (1.2) 26 (1.1) 23 (1.2) 28 (1.4) 29 (1.1) 28 (1.4) 30 (1.2) 29 (1.0)
20 - 29.............. 79 (2.5) 25 (1.7) 29 (1.9) 24 (1.7) 20 (1.3) 28 (2.4) 27 (2.1) 27 (2.4) 26 (2.2) 26 (1.8)30 - 39.............. 82 (2.3) 25 (1.5) 30 (1.7) 24 (1.4) 21 (1.5) 26 (1.9) 27 (1.6) 27 (1.6) 27 (1.6) 27 (1.8)40 - 49.............. 80 (2.3) 24 (0.6) 27 (1.1) 23 (0.7) 19 (1.4) 26 (1.9) 25 (1.0) 23 (1.3) 25 (1.1) 27 (1.3)
50 - 59.............. 76 (2.5) 21 (1.0) 25 (1.3) 19 (0.9) 17 (0.9) 22 (1.2) 23 (1.2) 22 (1.3) 24 (1.4) 24 (1.3)60 - 69.............. 74 (2.6) 22 (1.6) 27 (1.8) 21 (1.4) 17 (1.6) 22 (1.6) 23 (2.1) 22 (2.0) 23 (1.8) 26 (3.3)70 and over...... 76 (2.3) 21 (0.8) 24 (1.3) 19 (0.8) 16 (1.0) 19 (1.2) 23 (1.0) 23 (1.1) 23 (1.2) 24 (1.3)
2 - 19............ 88 (0.8) 26 (0.6) 29 (0.6) 25 (0.7) 21 (0.8) 28 (1.0) 27 (0.6) 26 (0.7) 28 (0.9) 29 (0.7)20 and over... 78 (1.0) 23 (0.6) 27 (0.7) 22 (0.5) 19 (0.4) 24 (0.9) 25 (0.8) 24 (0.8) 25 (0.8) 26 (1.0)
2 and over... 81 (0.9) 24 (0.5) 28 (0.5) 23 (0.4) 19 (0.4) 25 (0.7) 26 (0.6) 24 (0.7) 26 (0.6) 27 (0.8)
Females:2 - 5.............. 90 (2.2) 23 (0.8) 26 (1.3) 22 (0.8) 18 (0.9) 28 (1.1) 24 (0.9) 22 (1.2) 25 (1.0) 26 (0.9)6 - 11.............. 90 (2.1) 25 (1.0) 29 (1.1) 24 (1.0) 22 (1.3) 27 (1.1) 26 (1.1) 25 (1.0) 27 (1.2) 27 (1.2)
12 - 19.............. 82 (2.0) 26 (1.0) 29 (1.2) 24 (1.0) 22 (1.7) 27 (1.5) 27 (1.2) 26 (1.4) 27 (1.3) 29 (1.4)
20 - 29.............. 80 (2.1) 23 (0.9) 28 (1.0) 22 (1.0) 18 (1.4) 25 (0.8) 25 (1.2) 23 (1.4) 24 (1.1) 28 (1.7)30 - 39.............. 80 (1.6) 24 (1.0) 29 (0.9) 23 (1.1) 17 (0.9) 25 (1.4) 26 (1.1) 25 (1.3) 25 (1.0) 27 (1.2)40 - 49.............. 84 (2.6) 23 (1.2) 28 (1.4) 21 (1.0) 16 (0.8) 25 (1.2) 25 (1.6) 23 (1.5) 25 (2.0) 26 (1.7)
50 - 59.............. 81 (2.4) 24 (1.3) 28 (1.7) 22 (1.2) 16 (0.9) 24 (1.4) 26 (1.6) 25 (1.4) 25 (1.4) 27 (2.1)60 - 69.............. 82 (1.7) 24 (1.9) 29 (1.7) 21 (1.4) 17 (1.5) 24 (2.1) 27 (2.7) 23 (2.0) 28 (3.5) 30 (3.0)70 and over...... 80 (2.4) 24 (0.8) 28 (1.2) 23 (0.7) 20 (0.7) 25 (1.0) 25 (0.9) 24 (1.2) 25 (1.0) 27 (1.2)
2 - 19............ 86 (1.5) 25 (0.7) 28 (0.8) 24 (0.7) 21 (1.1) 27 (0.8) 26 (0.8) 25 (0.9) 26 (0.8) 28 (0.9)20 and over... 81 (0.6) 24 (0.6) 28 (0.6) 22 (0.5) 17 (0.5) 25 (0.5) 25 (0.7) 24 (0.6) 25 (0.8) 28 (0.8)
2 and over... 82 (0.6) 24 (0.4) 28 (0.4) 22 (0.4) 18 (0.5) 25 (0.5) 26 (0.5) 24 (0.5) 25 (0.6) 28 (0.7)
Males and females:2 - 19............ 87 (1.1) 26 (0.4) 29 (0.4) 24 (0.4) 21 (0.6) 28 (0.8) 27 (0.5) 25 (0.6) 27 (0.5) 28 (0.7)20 and over... 80 (0.7) 23 (0.4) 28 (0.5) 22 (0.4) 18 (0.4) 24 (0.5) 25 (0.6) 24 (0.6) 25 (0.6) 27 (0.7)
2 and over... 82 (0.7) 24 (0.4) 28 (0.4) 23 (0.3) 19 (0.3) 25 (0.5) 26 (0.5) 24 (0.5) 26 (0.5) 27 (0.6)

DATA SOURCE: What We Eat in America, NHANES 2013-2014, individuals 2 years and over (excluding breast-fed children), day 1. Available: www.ars.usda.gov/nea/bhnrc/fsrg.Page 2 of 5
What We Eat in America, NHANES 2013-2014
Table 17. Lunch1: Percentages2 of Selected Nutrients Contributed by Food and Beverages Consumed at Lunch,by Gender and Age, in the United States, 2013-2014 (continued)
Genderand age
Choles-terol
Vitamin A(RAE)
Beta-carotene Lycopene Thiamin
Ribo-flavin Niacin Vitamin B6
Folate(DFE)
(years) % (SE) % (SE) % (SE) % (SE) % (SE) % (SE) % (SE) % (SE) % (SE)
Males:2 - 5.............. 24 (2.5) 21 (1.7) 42 (7.0) 34 (6.4) 22 (1.9) 18 (1.1) 25 (1.3) 19 (0.9) 18 (1.5)6 - 11.............. 22 (1.6) 22 (2.1) 32 (6.6) 34 (6.2) 25 (1.1) 24 (1.1) 27 (1.1) 25 (1.8) 19 (0.9)
12 - 19.............. 25 (1.4) 21 (1.6) 27 (5.4) 40 (6.4) 27 (1.9) 25 (1.7) 29 (1.7) 24 (2.2) 23 (1.7)
20 - 29.............. 26 (2.5) 26 (3.6) 43 (8.8) 33 (7.0) 26 (1.8) 21 (1.7) 27 (1.2) 24 (1.6) 25 (1.1)30 - 39.............. 28 (2.0) 20 (2.4) 25 (4.7) 31 (3.6) 26 (1.7) 20 (1.2) 27 (1.9) 24 (3.0) 24 (1.9)40 - 49.............. 24 (1.7) 19 (1.8) 27 (4.6) 29 (4.0) 24 (1.1) 18 (0.9) 26 (1.6) 24 (1.1) 23 (0.9)
50 - 59.............. 23 (1.7) 17 (1.8) 18 (2.2) 21 (5.2) 21 (1.3) 18 (1.0) 23 (1.5) 19 (1.3) 18 (1.2)60 - 69.............. 23 (2.4) 20 (2.7) 25 (4.4) 22 (2.9) 24 (2.1) 18 (1.7) 24 (1.6) 22 (1.5) 20 (2.2)70 and over...... 20 (1.9) 19 (3.3) 26 (5.0) 16 (3.6) 20 (1.2) 17 (0.7) 21 (1.2) 18 (1.4) 15 (1.3)
2 - 19............ 24 (1.0) 21 (1.1) 32 (4.0) 37 (4.8) 25 (1.0) 24 (1.0) 28 (1.1) 24 (1.3) 21 (1.0)20 and over... 24 (0.6) 20 (1.6) 28 (3.1) 26 (1.8) 24 (0.7) 19 (0.6) 25 (0.6) 22 (0.8) 21 (0.7)
2 and over... 24 (0.4) 21 (1.2) 28 (2.6) 29 (1.5) 24 (0.6) 20 (0.5) 26 (0.5) 23 (0.7) 21 (0.7)
Females:2 - 5.............. 21 (2.2) 21 (1.7) 42 (7.0) 34 (8.2) 23 (0.9) 19 (0.8) 26 (1.1) 22 (1.2) 19 (1.8)6 - 11.............. 25 (1.5) 22 (1.6) 36 (6.1) 27 (3.2) 23 (1.0) 23 (1.4) 25 (0.9) 22 (1.3) 20 (1.4)
12 - 19.............. 26 (1.8) 24 (2.1) 31 (7.5) 31 (3.9) 25 (1.3) 23 (1.7) 26 (1.4) 22 (1.6) 22 (1.9)
20 - 29.............. 24 (1.7) 21 (1.5) 31 (4.0) 31 (4.6) 26 (1.4) 21 (1.0) 26 (1.1) 24 (1.2) 24 (1.3)30 - 39.............. 28 (1.5) 21 (1.5) 25 (3.2) 30 (3.7) 27 (2.1) 21 (1.0) 29 (1.3) 27 (1.3) 25 (1.7)40 - 49.............. 27 (2.4) 24 (2.5) 33 (3.7) 26 (4.6) 25 (1.4) 20 (1.4) 28 (1.4) 26 (1.3) 24 (1.0)
50 - 59.............. 25 (2.4) 24 (3.0) 34 (4.2) 35 (6.7) 24 (1.8) 19 (1.2) 26 (1.7) 23 (1.7) 23 (1.6)60 - 69.............. 27 (1.8) 21 (2.4) 26 (4.8) 21 (5.0) 24 (1.5) 21 (1.1) 29 (2.2) 27 (1.6) 22 (2.1)70 and over...... 26 (1.6) 24 (2.9) 28 (3.3) 34 (4.4) 25 (1.0) 22 (0.8) 25 (0.9) 23 (1.2) 23 (0.6)
2 - 19............ 25 (1.2) 23 (1.1) 34 (4.5) 30 (2.3) 24 (0.6) 22 (0.8) 26 (0.8) 22 (1.1) 21 (1.1)20 and over... 26 (0.8) 23 (1.1) 30 (1.7) 29 (2.2) 25 (0.6) 20 (0.5) 27 (0.6) 25 (0.7) 23 (0.6)
2 and over... 26 (0.6) 23 (0.8) 30 (1.6) 30 (1.9) 25 (0.5) 21 (0.3) 27 (0.4) 24 (0.5) 23 (0.6)
Males and females:2 - 19............ 24 (0.8) 22 (0.9) 33 (3.4) 34 (3.0) 25 (0.6) 23 (0.6) 27 (0.6) 23 (0.8) 21 (0.7)20 and over... 25 (0.6) 22 (1.0) 29 (1.9) 28 (1.3) 25 (0.5) 20 (0.4) 26 (0.5) 23 (0.6) 22 (0.6)
2 and over... 25 (0.4) 22 (0.7) 29 (1.6) 29 (1.2) 25 (0.4) 20 (0.4) 26 (0.4) 23 (0.5) 22 (0.5)
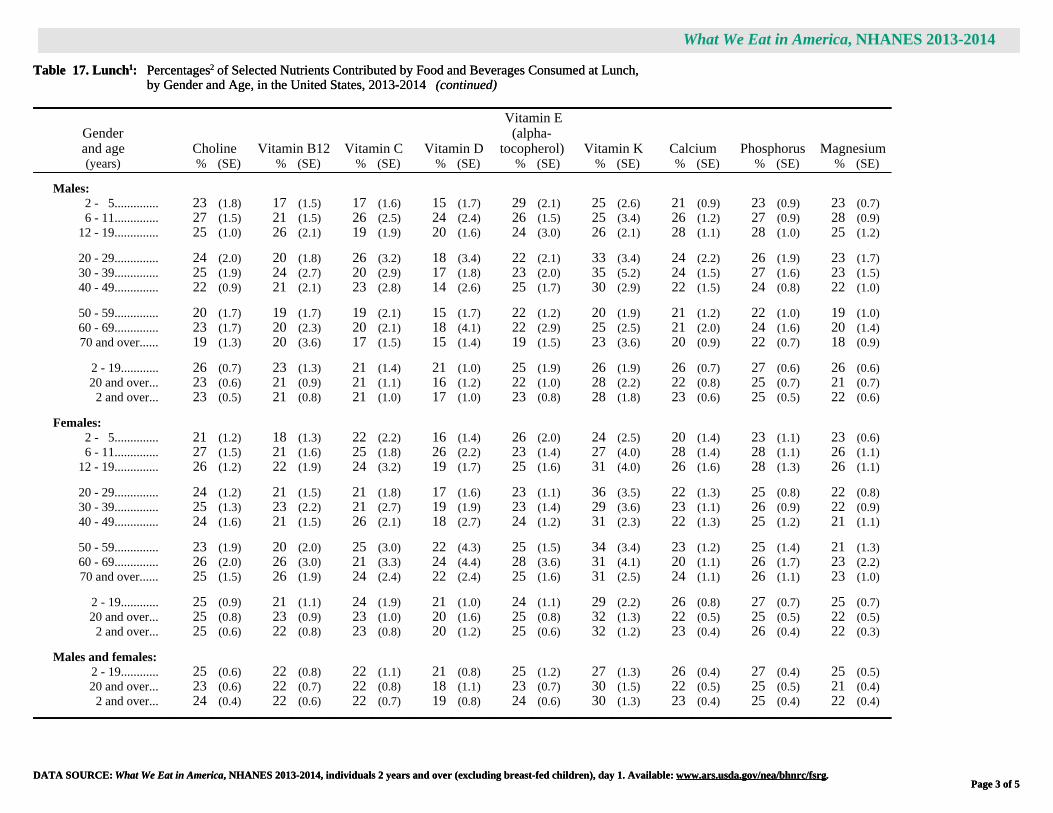
DATA SOURCE: What We Eat in America, NHANES 2013-2014, individuals 2 years and over (excluding breast-fed children), day 1. Available: www.ars.usda.gov/nea/bhnrc/fsrg.Page 3 of 5
What We Eat in America, NHANES 2013-2014
Table 17. Lunch1: Percentages2 of Selected Nutrients Contributed by Food and Beverages Consumed at Lunch,by Gender and Age, in the United States, 2013-2014 (continued)
Genderand age Choline Vitamin B12 Vitamin C Vitamin D
Vitamin E(alpha-
tocopherol) Vitamin K Calcium Phosphorus Magnesium(years) % (SE) % (SE) % (SE) % (SE) % (SE) % (SE) % (SE) % (SE) % (SE)
Males:2 - 5.............. 23 (1.8) 17 (1.5) 17 (1.6) 15 (1.7) 29 (2.1) 25 (2.6) 21 (0.9) 23 (0.9) 23 (0.7)6 - 11.............. 27 (1.5) 21 (1.5) 26 (2.5) 24 (2.4) 26 (1.5) 25 (3.4) 26 (1.2) 27 (0.9) 28 (0.9)
12 - 19.............. 25 (1.0) 26 (2.1) 19 (1.9) 20 (1.6) 24 (3.0) 26 (2.1) 28 (1.1) 28 (1.0) 25 (1.2)
20 - 29.............. 24 (2.0) 20 (1.8) 26 (3.2) 18 (3.4) 22 (2.1) 33 (3.4) 24 (2.2) 26 (1.9) 23 (1.7)30 - 39.............. 25 (1.9) 24 (2.7) 20 (2.9) 17 (1.8) 23 (2.0) 35 (5.2) 24 (1.5) 27 (1.6) 23 (1.5)40 - 49.............. 22 (0.9) 21 (2.1) 23 (2.8) 14 (2.6) 25 (1.7) 30 (2.9) 22 (1.5) 24 (0.8) 22 (1.0)
50 - 59.............. 20 (1.7) 19 (1.7) 19 (2.1) 15 (1.7) 22 (1.2) 20 (1.9) 21 (1.2) 22 (1.0) 19 (1.0)60 - 69.............. 23 (1.7) 20 (2.3) 20 (2.1) 18 (4.1) 22 (2.9) 25 (2.5) 21 (2.0) 24 (1.6) 20 (1.4)70 and over...... 19 (1.3) 20 (3.6) 17 (1.5) 15 (1.4) 19 (1.5) 23 (3.6) 20 (0.9) 22 (0.7) 18 (0.9)
2 - 19............ 26 (0.7) 23 (1.3) 21 (1.4) 21 (1.0) 25 (1.9) 26 (1.9) 26 (0.7) 27 (0.6) 26 (0.6)20 and over... 23 (0.6) 21 (0.9) 21 (1.1) 16 (1.2) 22 (1.0) 28 (2.2) 22 (0.8) 25 (0.7) 21 (0.7)
2 and over... 23 (0.5) 21 (0.8) 21 (1.0) 17 (1.0) 23 (0.8) 28 (1.8) 23 (0.6) 25 (0.5) 22 (0.6)
Females:2 - 5.............. 21 (1.2) 18 (1.3) 22 (2.2) 16 (1.4) 26 (2.0) 24 (2.5) 20 (1.4) 23 (1.1) 23 (0.6)6 - 11.............. 27 (1.5) 21 (1.6) 25 (1.8) 26 (2.2) 23 (1.4) 27 (4.0) 28 (1.4) 28 (1.1) 26 (1.1)
12 - 19.............. 26 (1.2) 22 (1.9) 24 (3.2) 19 (1.7) 25 (1.6) 31 (4.0) 26 (1.6) 28 (1.3) 26 (1.1)
20 - 29.............. 24 (1.2) 21 (1.5) 21 (1.8) 17 (1.6) 23 (1.1) 36 (3.5) 22 (1.3) 25 (0.8) 22 (0.8)30 - 39.............. 25 (1.3) 23 (2.2) 21 (2.7) 19 (1.9) 23 (1.4) 29 (3.6) 23 (1.1) 26 (0.9) 22 (0.9)40 - 49.............. 24 (1.6) 21 (1.5) 26 (2.1) 18 (2.7) 24 (1.2) 31 (2.3) 22 (1.3) 25 (1.2) 21 (1.1)
50 - 59.............. 23 (1.9) 20 (2.0) 25 (3.0) 22 (4.3) 25 (1.5) 34 (3.4) 23 (1.2) 25 (1.4) 21 (1.3)60 - 69.............. 26 (2.0) 26 (3.0) 21 (3.3) 24 (4.4) 28 (3.6) 31 (4.1) 20 (1.1) 26 (1.7) 23 (2.2)70 and over...... 25 (1.5) 26 (1.9) 24 (2.4) 22 (2.4) 25 (1.6) 31 (2.5) 24 (1.1) 26 (1.1) 23 (1.0)
2 - 19............ 25 (0.9) 21 (1.1) 24 (1.9) 21 (1.0) 24 (1.1) 29 (2.2) 26 (0.8) 27 (0.7) 25 (0.7)20 and over... 25 (0.8) 23 (0.9) 23 (1.0) 20 (1.6) 25 (0.8) 32 (1.3) 22 (0.5) 25 (0.5) 22 (0.5)
2 and over... 25 (0.6) 22 (0.8) 23 (0.8) 20 (1.2) 25 (0.6) 32 (1.2) 23 (0.4) 26 (0.4) 22 (0.3)
Males and females:2 - 19............ 25 (0.6) 22 (0.8) 22 (1.1) 21 (0.8) 25 (1.2) 27 (1.3) 26 (0.4) 27 (0.4) 25 (0.5)20 and over... 23 (0.6) 22 (0.7) 22 (0.8) 18 (1.1) 23 (0.7) 30 (1.5) 22 (0.5) 25 (0.5) 21 (0.4)
2 and over... 24 (0.4) 22 (0.6) 22 (0.7) 19 (0.8) 24 (0.6) 30 (1.3) 23 (0.4) 25 (0.4) 22 (0.4)

DATA SOURCE: What We Eat in America, NHANES 2013-2014, individuals 2 years and over (excluding breast-fed children), day 1. Available: www.ars.usda.gov/nea/bhnrc/fsrg.Page 4 of 5
What We Eat in America, NHANES 2013-2014
Table 17. Lunch1: Percentages2 of Selected Nutrients Contributed by Food and Beverages Consumed at Lunch,by Gender and Age, in the United States, 2013-2014 (continued)
Genderand age Iron Zinc Copper Selenium Potassium Sodium Caffeine Alcohol(years) % (SE) % (SE) % (SE) % (SE) % (SE) % (SE) % (SE) % (SE)
Males:2 - 5.............. 18 (1.0) 21 (1.0) 22 (0.9) 28 (1.5) 23 (1.0) 30 (1.4) 14* (5.7) -- -- 6 - 11.............. 23 (0.8) 25 (1.2) 28 (1.3) 28 (0.8) 29 (1.3) 29 (1.2) 15 (4.4) -- --
12 - 19.............. 25 (1.6) 26 (1.4) 25 (1.5) 30 (1.4) 27 (1.0) 31 (1.2) 21 (3.5) -- --
20 - 29.............. 25 (1.2) 27 (2.1) 24 (2.1) 29 (1.9) 27 (1.6) 31 (2.1) 11 (1.9) -- -- 30 - 39.............. 25 (1.9) 28 (2.8) 24 (2.2) 31 (1.8) 25 (1.7) 31 (1.5) 11 (1.6) -- -- 40 - 49.............. 23 (1.2) 24 (1.2) 22 (1.0) 26 (1.1) 24 (1.3) 29 (1.2) 12 (2.1) -- --
50 - 59.............. 19 (1.3) 23 (1.4) 20 (1.1) 26 (1.4) 21 (1.0) 25 (1.2) 7 (1.1) -- -- 60 - 69.............. 21 (1.8) 24 (1.8) 21 (1.2) 27 (2.1) 22 (1.2) 28 (2.2) 10 (1.1) -- -- 70 and over...... 17 (1.3) 20 (1.9) 22 (3.0) 24 (1.4) 19 (0.8) 27 (1.1) 10 (1.0) -- --
2 - 19............ 23 (0.8) 25 (0.9) 25 (0.8) 29 (0.8) 27 (0.7) 30 (0.7) 20 (3.3) -- -- 20 and over... 22 (0.7) 25 (0.8) 22 (0.9) 28 (0.6) 23 (0.6) 29 (0.8) 10 (0.7) 4 (1.0)
2 and over... 22 (0.6) 25 (0.6) 23 (0.7) 28 (0.5) 24 (0.5) 29 (0.6) 11 (0.6) -- --
Females:2 - 5.............. 20 (1.4) 22 (1.6) 24 (1.2) 28 (1.5) 24 (0.8) 28 (1.4) 14 (3.4) -- -- 6 - 11.............. 20 (0.9) 24 (1.3) 25 (1.1) 28 (1.1) 28 (1.2) 30 (1.3) 15 (2.6) -- --
12 - 19.............. 22 (1.3) 24 (1.4) 24 (1.4) 30 (1.1) 27 (1.2) 29 (1.2) 15 (3.8) -- --
20 - 29.............. 23 (1.1) 24 (1.3) 22 (0.9) 28 (1.0) 25 (1.0) 29 (1.2) 14 (2.0) -- -- 30 - 39.............. 24 (1.5) 26 (1.2) 22 (1.0) 30 (1.3) 24 (1.0) 30 (1.0) 11 (0.8) -- -- 40 - 49.............. 23 (1.1) 25 (1.1) 21 (1.1) 28 (1.7) 23 (1.4) 30 (1.4) 8 (1.2) -- --
50 - 59.............. 21 (1.5) 23 (1.6) 21 (1.2) 30 (1.9) 23 (1.4) 31 (1.7) 7 (1.3) -- -- 60 - 69.............. 21 (1.6) 24 (1.9) 23 (2.3) 28 (1.8) 24 (1.5) 29 (1.7) 11 (1.2) -- -- 70 and over...... 23 (1.0) 24 (1.4) 23 (1.0) 28 (1.0) 24 (1.3) 30 (1.2) 11 (1.9) -- --
2 - 19............ 21 (0.9) 24 (0.8) 24 (0.8) 29 (0.7) 27 (0.7) 29 (0.9) 15 (3.1) -- -- 20 and over... 23 (0.6) 24 (0.6) 22 (0.5) 29 (0.7) 24 (0.6) 30 (0.5) 10 (0.4) 3* (0.9)
2 and over... 22 (0.4) 24 (0.5) 22 (0.4) 29 (0.5) 24 (0.5) 30 (0.4) 10 (0.4) -- --
Males and females:2 - 19............ 22 (0.6) 24 (0.5) 25 (0.5) 29 (0.6) 27 (0.4) 30 (0.4) 18 (2.5) -- -- 20 and over... 22 (0.5) 25 (0.5) 22 (0.6) 28 (0.5) 24 (0.5) 29 (0.6) 10 (0.5) 4 (0.7)
2 and over... 22 (0.4) 25 (0.5) 23 (0.5) 28 (0.4) 24 (0.4) 29 (0.4) 10 (0.5) -- --

What We Eat in America, NHANES 2013-2014
Page 5 of 5Page 5 of 5
Symbol Legend
* Indicates an estimate that may be less statistically reliable than estimates that are not flagged. The rules for flagging estimated percentages and ratios are as follows:
Percent reporting: An estimated percentage between 25 and 75 percent is flagged when based on a sample size of less than 30 times the variance inflation factor (VIF), where the VIFrepresents a broadly calculated average design effect, or when the relative standard error is greater than 30 percent. An estimated percentage less than or equal to 25 percent or greater thanor equal to 75 percent is flagged when the smaller of np and n(1-p) is less than 8 times the VIF, where n is the sample size and p is the percentage expressed as a fraction. The VIF used inthis table is 1.98.
Nutrient ratios expressed as percentages: An estimated ratio between 25 and 75 percent is flagged when based on a sample size n* of less than 30 times the variance inflation factor(VIF), where the VIF represents a broadly calculated average design effect and n* is the number of individuals in the sample reporting non-zero intake of the respective nutrient. Anestimated ratio less than or equal to 25 percent or greater than or equal to 75 percent, is flagged when the smaller of n*p and n* (1-p) is less than 8 times the VIF, where p is the percentageexpressed as a fraction. Additionally, an estimated ratio is flagged when either the relative standard error or p/(1-p) times the relative standard error is greater than 30 percent. The VIFused in this table is 1.98.
Footnotes
1 Lunch includes eating occasions designated by the respondent as "brunch", "lunch" or the Spanish equivalent "comida." Please note these eating occasions include consumption of beveragesincluding water.
2 Percentages are estimated as a ratio of total nutrients from lunch for all individuals to total daily nutrient intakes for all individuals. Total daily nutrient intakes are available from:www.ars.usda.gov/nea/bhnrc/fsrg. See Table 1. Nutrient Intakes from Food and Beverages: Mean Amounts Consumed per Individual, by Gender and Age, in the United States, 2013-2014.
3 The percentage of respondents in the gender/age group who reported consuming at least one item at an eating occasion designated as lunch.
Abbreviations
SE = standard error; RAE = retinol activity equivalents; DFE = dietary folate equivalents.
Notes Applicable to All Tables in Series: What We Eat in America, NHANES 2013-2014
Sample weights designed for dietary analysis were used to allow estimates representative of the U. S. population for the years of collection.
The statistics in this table are estimated from Day 1 dietary recall interviews conducted in the What We Eat in America, National Health and Nutrition Examination Survey (NHANES) 2013-2014.The 24-hour dietary recalls were conducted in-person, by trained interviewers, using the USDA 5-step Automated Multiple-Pass Method. Food intakes were coded and nutrient values weredetermined using the USDA Food and Nutrient Database for Dietary Studies 2013-2014 www.ars.usda.gov/nea/bhnrc/fsrg.
Intakes of nutrients and other dietary components are based on the consumption of food and beverages, including water, and do not include intake from supplements or medications.
The table includes data from individuals 2 years and over. Breast-fed children were excluded because breast milk was not quantified in dietary recall interviews.
Although alcohol data are collected for all individuals, estimates are not presented for age groups under 20 years due to extreme variability and/or inadequate sample size.
Suggested Citation
U.S. Department of Agriculture, Agricultural Research Service. 2016. Lunch: Percentages of Selected Nutrients Contributed by Food and Beverages Consumed at Lunch, by Gender and Age,What We Eat in America, NHANES 2013-2014.

DATA SOURCE: What We Eat in America, NHANES 2013-2014, individuals 2 years and over (excluding breast-fed children), day 1. Available: www.ars.usda.gov/nea/bhnrc/fsrg.Page 1 of 5
What We Eat in America, NHANES 2013-2014
Table 18. Lunch1: Percentages2 of Selected Nutrients Contributed by Food and Beverages Consumed at Lunch,by Race/Ethnicity and Age, in the United States, 2013-2014
Race/ethnicityand age
Percentreporting3 Energy Protein
Carbo-hydrate
Totalsugars
Dietaryfiber
Totalfat
Saturatedfat
Mono-unsaturated
fat
Poly-unsaturated
fat(years) % (SE) % (SE) % (SE) % (SE) % (SE) % (SE) % (SE) % (SE) % (SE) % (SE)
Non-Hispanic White:2 - 5.............. 95* (2.1) 24 (1.2) 27 (1.7) 22 (1.3) 19 (1.3) 28 (1.8) 26 (1.0) 23 (1.7) 26 (0.9) 30 (2.0)6 - 11.............. 92 (2.5) 25 (0.8) 29 (1.2) 24 (0.9) 22 (0.8) 29 (1.8) 25 (1.0) 23 (1.0) 26 (1.3) 27 (1.3)
12 - 19.............. 88 (2.4) 28 (1.3) 30 (1.3) 26 (1.4) 23 (1.9) 27 (1.9) 30 (1.4) 30 (1.8) 31 (1.5) 29 (1.3)20 and over... 82 (0.8) 24 (0.6) 28 (0.7) 22 (0.6) 18 (0.5) 24 (0.7) 26 (0.8) 25 (0.8) 26 (0.9) 27 (1.0)
2 and over... 84 (0.8) 24 (0.5) 28 (0.6) 22 (0.5) 19 (0.5) 25 (0.6) 26 (0.7) 25 (0.7) 26 (0.7) 27 (0.9)
Non-Hispanic Black:2 - 5.............. 91* (2.4) 26 (1.4) 27 (1.3) 25 (1.3) 21 (0.7) 29 (1.2) 26 (1.8) 26 (2.3) 27 (1.7) 25 (1.9)6 - 11.............. 86 (3.1) 26 (1.5) 29 (1.7) 25 (1.6) 22 (1.8) 31 (2.0) 26 (1.8) 26 (1.8) 26 (1.9) 27 (2.4)
12 - 19.............. 78 (3.3) 25 (1.6) 29 (3.2) 24 (1.1) 21 (1.5) 26 (2.7) 24 (1.8) 23 (2.0) 24 (1.9) 26 (1.7)20 and over... 72 (1.7) 22 (0.8) 26 (1.1) 21 (0.6) 18 (0.6) 23 (1.0) 23 (1.0) 22 (1.0) 23 (1.0) 26 (0.9)
2 and over... 75 (1.7) 23 (0.8) 27 (1.2) 22 (0.6) 19 (0.6) 24 (1.1) 24 (0.9) 22 (1.0) 24 (0.9) 26 (1.0)
Non-Hispanic Asian4:2 - 5.............. 94* (3.9) 24* (1.7) 26* (3.2) 23* (1.7) 18* (1.6) 25* (2.4) 25* (1.5) 21* (2.1) 28* (1.8) 29* (2.6)6 - 11.............. 98* (1.6) 29 (1.9) 32 (2.8) 29 (2.5) 23 (3.4) 34 (2.7) 27 (2.0) 22* (3.4) 27 (2.3) 36 (2.6)
12 - 19.............. 91* (3.4) 29 (1.8) 32 (3.7) 27 (2.2) 22 (1.7) 32 (2.6) 30 (1.6) 27 (2.5) 29 (1.6) 35 (1.4)20 and over... 91 (1.6) 28 (1.1) 31 (1.4) 27 (1.1) 19 (1.0) 29 (1.1) 28 (1.3) 26 (1.4) 28 (1.5) 29 (1.4)
2 and over... 92 (1.5) 28 (0.9) 31 (1.2) 27 (1.0) 20 (0.9) 30 (1.0) 28 (1.0) 26 (1.0) 28 (1.1) 30 (1.1)
Hispanic:2 - 5.............. 83 (3.3) 21 (1.1) 24 (1.7) 19 (1.1) 14 (1.2) 24 (1.5) 22 (1.2) 21 (1.3) 23 (1.2) 23 (1.1)6 - 11.............. 85 (2.9) 24 (1.0) 29 (1.0) 22 (1.1) 20 (1.6) 26 (1.4) 25 (1.3) 23 (1.3) 26 (1.6) 28 (1.5)
12 - 19.............. 76 (3.7) 26 (1.5) 27 (2.1) 24 (1.5) 20 (1.5) 27 (2.0) 27 (1.5) 26 (1.8) 27 (1.5) 30 (1.6)20 and over... 71 (1.5) 24 (0.9) 27 (1.2) 23 (0.9) 19 (1.0) 26 (1.3) 24 (0.9) 23 (0.9) 24 (1.0) 26 (1.0)
2 and over... 75 (1.2) 24 (0.8) 27 (1.0) 23 (0.8) 19 (0.9) 26 (1.2) 25 (0.8) 23 (0.9) 25 (0.9) 27 (0.9)

DATA SOURCE: What We Eat in America, NHANES 2013-2014, individuals 2 years and over (excluding breast-fed children), day 1. Available: www.ars.usda.gov/nea/bhnrc/fsrg.Page 2 of 5
What We Eat in America, NHANES 2013-2014
Table 18. Lunch1: Percentages2 of Selected Nutrients Contributed by Food and Beverages Consumed at Lunch,by Race/Ethnicity and Age, in the United States, 2013-2014 (continued)
Race/ethnicityand age
Choles-terol
Vitamin A(RAE)
Beta-carotene Lycopene Thiamin
Ribo-flavin Niacin Vitamin B6
Folate(DFE)
(years) % (SE) % (SE) % (SE) % (SE) % (SE) % (SE) % (SE) % (SE) % (SE)
Non-Hispanic White:2 - 5.............. 24 (4.1) 24 (1.2) 48 (6.2) 34 (7.7) 23 (1.7) 19 (1.0) 27 (1.2) 22 (1.2) 19 (1.6)6 - 11.............. 21 (1.9) 22 (2.6) 33 (8.1) 34 (6.2) 25 (1.3) 24 (1.7) 27 (1.1) 25 (2.0) 20 (1.4)
12 - 19.............. 26 (1.8) 22 (2.1) 27 (6.9) 36 (8.9) 27 (2.1) 24 (1.8) 27 (1.3) 22 (1.8) 22 (1.6)20 and over... 26 (0.8) 22 (1.2) 29 (2.4) 26 (1.5) 25 (0.7) 20 (0.6) 26 (0.7) 23 (0.9) 22 (0.7)
2 and over... 25 (0.6) 22 (1.0) 29 (2.1) 28 (1.7) 25 (0.7) 20 (0.6) 26 (0.6) 23 (0.9) 22 (0.7)
Non-Hispanic Black:2 - 5.............. 21 (1.6) 22 (1.4) 38 (9.7) 38 (8.2) 26 (2.1) 23 (1.7) 27 (2.2) 22 (1.6) 22 (2.2)6 - 11.............. 25 (2.7) 26 (3.0) 39 (8.0) 28 (3.2) 23 (1.4) 27 (1.7) 24 (1.2) 22 (1.5) 22 (1.1)
12 - 19.............. 23 (3.2) 20 (2.2) 32 (5.2) 38 (5.1) 25 (1.6) 23 (2.0) 29 (1.7) 25 (2.2) 21 (2.7)20 and over... 24 (1.2) 20 (1.7) 24 (3.1) 31 (3.4) 22 (1.1) 19 (0.8) 24 (0.9) 22 (0.9) 21 (1.1)
2 and over... 24 (1.3) 20 (1.4) 26 (2.8) 32 (2.6) 23 (1.0) 21 (0.8) 25 (0.9) 22 (0.9) 21 (1.0)
Non-Hispanic Asian4:2 - 5.............. 34* (6.7) 24* (3.4) 47*(11.5) 15* (6.2) 25* (2.3) 22* (2.2) 26* (5.2) 22* (3.3) 24* (2.5)6 - 11.............. 33 (3.3) 24 (3.2) 32*(10.8) 32*(12.0) 28 (2.6) 24 (2.8) 31 (2.9) 27 (2.3) 25 (2.7)
12 - 19.............. 34 (4.9) 27 (3.6) 40 (7.6) 26*(10.4) 28 (4.0) 25 (3.7) 31 (3.4) 28 (3.5) 28 (4.2)20 and over... 29 (1.1) 29 (3.6) 38 (6.3) 25 (3.0) 30 (1.1) 22 (0.8) 31 (1.5) 31 (1.5) 30 (1.1)
2 and over... 30 (1.3) 28 (2.6) 38 (5.3) 26 (3.1) 29 (1.2) 23 (1.0) 31 (1.4) 30 (1.4) 29 (1.2)
Hispanic:2 - 5.............. 20 (2.7) 14 (1.0) 28 (3.8) 37 (8.5) 21 (1.2) 16 (1.2) 23 (1.6) 17 (1.6) 18 (1.0)6 - 11.............. 26 (1.2) 18 (1.2) 25 (3.7) 26 (4.6) 21 (1.0) 22 (1.2) 25 (1.3) 22 (1.4) 17 (1.2)
12 - 19.............. 23 (2.2) 22 (1.9) 29 (6.2) 37 (4.2) 25 (1.5) 23 (1.6) 27 (1.7) 23 (1.6) 24 (1.5)20 and over... 24 (1.6) 20 (1.0) 28 (2.6) 32 (2.4) 24 (0.9) 19 (0.9) 25 (1.0) 23 (1.4) 23 (1.2)
2 and over... 24 (1.2) 20 (0.8) 28 (2.2) 32 (2.3) 23 (0.7) 19 (0.8) 25 (0.8) 23 (0.9) 22 (0.9)
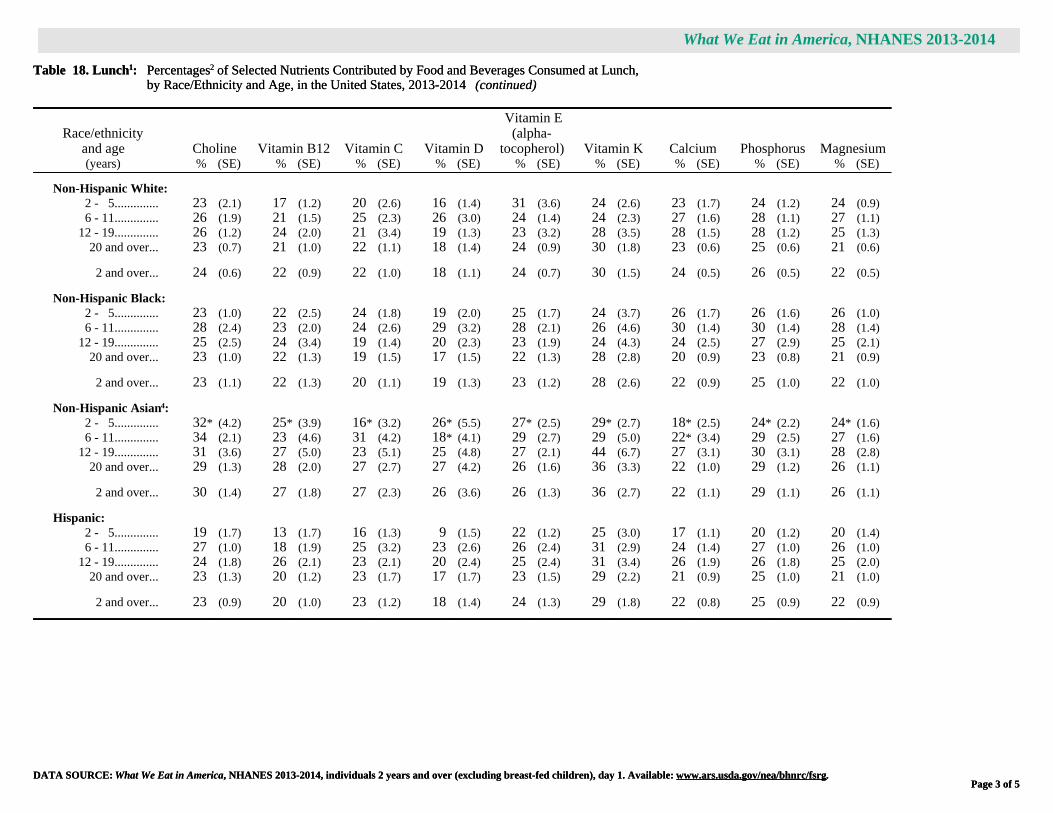
DATA SOURCE: What We Eat in America, NHANES 2013-2014, individuals 2 years and over (excluding breast-fed children), day 1. Available: www.ars.usda.gov/nea/bhnrc/fsrg.Page 3 of 5
What We Eat in America, NHANES 2013-2014
Table 18. Lunch1: Percentages2 of Selected Nutrients Contributed by Food and Beverages Consumed at Lunch,by Race/Ethnicity and Age, in the United States, 2013-2014 (continued)
Race/ethnicityand age Choline Vitamin B12 Vitamin C Vitamin D
Vitamin E(alpha-
tocopherol) Vitamin K Calcium Phosphorus Magnesium(years) % (SE) % (SE) % (SE) % (SE) % (SE) % (SE) % (SE) % (SE) % (SE)
Non-Hispanic White:2 - 5.............. 23 (2.1) 17 (1.2) 20 (2.6) 16 (1.4) 31 (3.6) 24 (2.6) 23 (1.7) 24 (1.2) 24 (0.9)6 - 11.............. 26 (1.9) 21 (1.5) 25 (2.3) 26 (3.0) 24 (1.4) 24 (2.3) 27 (1.6) 28 (1.1) 27 (1.1)
12 - 19.............. 26 (1.2) 24 (2.0) 21 (3.4) 19 (1.3) 23 (3.2) 28 (3.5) 28 (1.5) 28 (1.2) 25 (1.3)20 and over... 23 (0.7) 21 (1.0) 22 (1.1) 18 (1.4) 24 (0.9) 30 (1.8) 23 (0.6) 25 (0.6) 21 (0.6)
2 and over... 24 (0.6) 22 (0.9) 22 (1.0) 18 (1.1) 24 (0.7) 30 (1.5) 24 (0.5) 26 (0.5) 22 (0.5)
Non-Hispanic Black:2 - 5.............. 23 (1.0) 22 (2.5) 24 (1.8) 19 (2.0) 25 (1.7) 24 (3.7) 26 (1.7) 26 (1.6) 26 (1.0)6 - 11.............. 28 (2.4) 23 (2.0) 24 (2.6) 29 (3.2) 28 (2.1) 26 (4.6) 30 (1.4) 30 (1.4) 28 (1.4)
12 - 19.............. 25 (2.5) 24 (3.4) 19 (1.4) 20 (2.3) 23 (1.9) 24 (4.3) 24 (2.5) 27 (2.9) 25 (2.1)20 and over... 23 (1.0) 22 (1.3) 19 (1.5) 17 (1.5) 22 (1.3) 28 (2.8) 20 (0.9) 23 (0.8) 21 (0.9)
2 and over... 23 (1.1) 22 (1.3) 20 (1.1) 19 (1.3) 23 (1.2) 28 (2.6) 22 (0.9) 25 (1.0) 22 (1.0)
Non-Hispanic Asian4:2 - 5.............. 32* (4.2) 25* (3.9) 16* (3.2) 26* (5.5) 27* (2.5) 29* (2.7) 18* (2.5) 24* (2.2) 24* (1.6)6 - 11.............. 34 (2.1) 23 (4.6) 31 (4.2) 18* (4.1) 29 (2.7) 29 (5.0) 22* (3.4) 29 (2.5) 27 (1.6)
12 - 19.............. 31 (3.6) 27 (5.0) 23 (5.1) 25 (4.8) 27 (2.1) 44 (6.7) 27 (3.1) 30 (3.1) 28 (2.8)20 and over... 29 (1.3) 28 (2.0) 27 (2.7) 27 (4.2) 26 (1.6) 36 (3.3) 22 (1.0) 29 (1.2) 26 (1.1)
2 and over... 30 (1.4) 27 (1.8) 27 (2.3) 26 (3.6) 26 (1.3) 36 (2.7) 22 (1.1) 29 (1.1) 26 (1.1)
Hispanic:2 - 5.............. 19 (1.7) 13 (1.7) 16 (1.3) 9 (1.5) 22 (1.2) 25 (3.0) 17 (1.1) 20 (1.2) 20 (1.4)6 - 11.............. 27 (1.0) 18 (1.9) 25 (3.2) 23 (2.6) 26 (2.4) 31 (2.9) 24 (1.4) 27 (1.0) 26 (1.0)
12 - 19.............. 24 (1.8) 26 (2.1) 23 (2.1) 20 (2.4) 25 (2.4) 31 (3.4) 26 (1.9) 26 (1.8) 25 (2.0)20 and over... 23 (1.3) 20 (1.2) 23 (1.7) 17 (1.7) 23 (1.5) 29 (2.2) 21 (0.9) 25 (1.0) 21 (1.0)
2 and over... 23 (0.9) 20 (1.0) 23 (1.2) 18 (1.4) 24 (1.3) 29 (1.8) 22 (0.8) 25 (0.9) 22 (0.9)

DATA SOURCE: What We Eat in America, NHANES 2013-2014, individuals 2 years and over (excluding breast-fed children), day 1. Available: www.ars.usda.gov/nea/bhnrc/fsrg.Page 4 of 5
What We Eat in America, NHANES 2013-2014
Table 18. Lunch1: Percentages2 of Selected Nutrients Contributed by Food and Beverages Consumed at Lunch,by Race/Ethnicity and Age, in the United States, 2013-2014 (continued)
Race/ethnicityand age Iron Zinc Copper Selenium Potassium Sodium Caffeine Alcohol(years) % (SE) % (SE) % (SE) % (SE) % (SE) % (SE) % (SE) % (SE)
Non-Hispanic White:2 - 5.............. 19 (1.5) 21 (1.3) 24 (1.2) 29 (2.2) 24 (0.8) 29 (1.7) 15* (7.7) -- -- 6 - 11.............. 22 (1.0) 25 (1.1) 27 (1.3) 28 (1.1) 29 (1.5) 30 (1.3) 16 (4.2) -- --
12 - 19.............. 24 (1.7) 25 (1.9) 24 (1.7) 30 (1.5) 27 (1.3) 32 (1.4) 19 (3.7) -- -- 20 and over... 22 (0.7) 24 (0.7) 22 (0.8) 29 (0.7) 23 (0.6) 30 (0.7) 10 (0.5) 3 (1.0)
2 and over... 22 (0.5) 24 (0.6) 22 (0.7) 29 (0.6) 24 (0.5) 30 (0.6) 10 (0.5) -- --
Non-Hispanic Black:2 - 5.............. 22 (1.7) 24 (1.6) 25 (1.1) 29 (2.0) 27 (1.2) 29 (1.6) 10* (4.6) -- -- 6 - 11.............. 22 (1.3) 26 (1.6) 28 (1.6) 28 (1.4) 30 (1.5) 28 (1.7) 14 (2.9) -- --
12 - 19.............. 23 (1.9) 24 (2.9) 26 (2.8) 30 (2.4) 28 (2.1) 29 (2.3) 19* (6.5) -- -- 20 and over... 20 (1.0) 23 (1.0) 21 (1.4) 26 (1.0) 23 (1.0) 26 (1.0) 12 (1.8) 4* (1.3)
2 and over... 21 (0.9) 24 (1.1) 22 (1.3) 27 (1.0) 24 (1.0) 27 (1.0) 12 (1.4) -- --
Non-Hispanic Asian4:2 - 5.............. 21* (1.9) 33* (8.5) 32* (4.6) 30* (4.2) 24* (1.6) 27* (3.0) 15* (5.0) -- -- 6 - 11.............. 29 (3.2) 33 (6.3) 32 (2.4) 32 (2.5) 30 (2.1) 32 (2.8) 15* (7.1) -- --
12 - 19.............. 28 (2.9) 29 (3.9) 29 (3.1) 36 (3.9) 30 (3.2) 32 (3.2) 12* (5.3) -- -- 20 and over... 29 (1.1) 30 (1.3) 25 (0.9) 31 (1.3) 28 (1.2) 34 (1.5) 13 (1.4) 5* (2.1)
2 and over... 28 (1.1) 30 (1.4) 26 (1.0) 32 (1.2) 28 (1.0) 34 (1.3) 13 (1.3) -- --
Hispanic:2 - 5.............. 18 (1.1) 19 (1.2) 20 (1.3) 27 (1.5) 19 (1.4) 28 (1.3) 15 (3.6) -- -- 6 - 11.............. 18 (0.9) 23 (1.1) 23 (1.6) 28 (1.3) 27 (1.0) 28 (1.0) 14 (3.0) -- --
12 - 19.............. 23 (1.2) 25 (1.8) 23 (1.6) 28 (2.1) 25 (1.9) 29 (1.6) 16 (3.5) -- -- 20 and over... 23 (0.9) 25 (1.2) 22 (1.1) 26 (1.0) 24 (0.9) 28 (1.1) 10 (0.8) 7* (2.7)
2 and over... 22 (0.7) 25 (0.9) 22 (0.9) 27 (0.9) 24 (0.8) 28 (1.0) 10 (0.8) -- --

What We Eat in America, NHANES 2013-2014
Page 5 of 5Page 5 of 5
Symbol Legend
* Indicates an estimate that may be less statistically reliable than estimates that are not flagged. The rules for flagging estimated percentages and ratios are as follows:
Percent reporting: An estimated percentage between 25 and 75 percent is flagged when based on a sample size of less than 30 times the variance inflation factor (VIF), where the VIFrepresents a broadly calculated average design effect, or when the relative standard error is greater than 30 percent. An estimated percentage less than or equal to 25 percent or greater thanor equal to 75 percent is flagged when the smaller of np and n(1-p) is less than 8 times the VIF, where n is the sample size and p is the percentage expressed as a fraction. The VIF used inthis table is 1.98.
Nutrient ratios expressed as percentages: An estimated ratio between 25 and 75 percent is flagged when based on a sample size n* of less than 30 times the variance inflation factor(VIF), where the VIF represents a broadly calculated average design effect and n* is the number of individuals in the sample reporting non-zero intake of the respective nutrient. Anestimated ratio less than or equal to 25 percent or greater than or equal to 75 percent, is flagged when the smaller of n*p and n* (1-p) is less than 8 times the VIF, where p is the percentageexpressed as a fraction. Additionally, an estimated ratio is flagged when either the relative standard error or p/(1-p) times the relative standard error is greater than 30 percent. The VIFused in this table is 1.98.
Footnotes
1 Lunch includes eating occasions designated by the respondent as "brunch", "lunch" or the Spanish equivalent "comida." Please note these eating occasions include consumption of beveragesincluding water.
2 Percentages are estimated as a ratio of total nutrients from lunch for all individuals to total daily nutrient intakes for all individuals. Total daily nutrient intakes are available from:www.ars.usda.gov/nea/bhnrc/fsrg. See Table 2. Nutrient Intakes from Food and Beverages: Mean Amounts Consumed per Individual, by Race/Ethnicity and Age, in the United States,2013-2014.
3 The percentage of respondents in the race/ethnicity/age group who reported consuming at least one item at an eating occasion designated as lunch.
4 A new sampling methodology was implemented for NHANES 2011-2012 to oversample non-Hispanic non-black Asians in addition to the ongoing oversample of Hispanics, non-Hispanicblacks, low-income whites/others, and whites/others 80+ years.
Abbreviations
SE = standard error; RAE = retinol activity equivalents; DFE = dietary folate equivalents.
Notes Applicable to All Tables in Series: What We Eat in America, NHANES 2013-2014
Sample weights designed for dietary analysis were used to allow estimates representative of the U. S. population for the years of collection.
The statistics in this table are estimated from Day 1 dietary recall interviews conducted in the What We Eat in America, National Health and Nutrition Examination Survey (NHANES) 2013-2014.The 24-hour dietary recalls were conducted in-person, by trained interviewers, using the USDA 5-step Automated Multiple-Pass Method. Food intakes were coded and nutrient values weredetermined using the USDA Food and Nutrient Database for Dietary Studies 2013-2014 www.ars.usda.gov/nea/bhnrc/fsrg.
Intakes of nutrients and other dietary components are based on the consumption of food and beverages, including water, and do not include intake from supplements or medications.
The table includes data from individuals 2 years and over. Breast-fed children were excluded because breast milk was not quantified in dietary recall interviews.
Although alcohol data are collected for all individuals, estimates are not presented for age groups under 20 years due to extreme variability and/or inadequate sample size.
Suggested Citation
U.S. Department of Agriculture, Agricultural Research Service. 2016. Lunch: Percentages of Selected Nutrients Contributed by Food and Beverages Consumed at Lunch, by Race/Ethnicity andAge, What We Eat in America, NHANES 2013-2014.

DATA SOURCE: What We Eat in America, NHANES 2013-2014, individuals 2 years and over (excluding breast-fed children), day 1. Available: www.ars.usda.gov/nea/bhnrc/fsrg.Page 1 of 5
What We Eat in America, NHANES 2013-2014
Table 19. Lunch1: Percentages2 of Selected Nutrients Contributed by Food and Beverages Consumed at Lunch,by Family Income (in Dollars) and Age, in the United States, 2013-2014
Family incomein dollarsand age
Percentreporting3 Energy Protein
Carbo-hydrate
Totalsugars
Dietaryfiber
Totalfat
Saturatedfat
Mono-unsaturated
fat
Poly-unsaturated
fat(years) % (SE) % (SE) % (SE) % (SE) % (SE) % (SE) % (SE) % (SE) % (SE) % (SE)
$0 - $24,999:2 - 5.............. 86 (3.9) 21 (1.0) 24 (1.3) 20 (1.2) 16 (1.3) 25 (1.8) 21 (1.2) 19 (1.8) 22 (1.1) 22 (1.0)6 - 11.............. 83 (3.8) 25 (1.3) 28 (1.6) 24 (1.3) 21 (1.3) 30 (2.3) 26 (1.4) 25 (1.5) 27 (1.7) 27 (1.8)
12 - 19.............. 78 (2.1) 24 (1.7) 27 (2.4) 23 (1.6) 19 (1.0) 25 (3.4) 25 (2.0) 24 (2.0) 25 (2.2) 28 (2.5)20 and over... 73 (1.3) 22 (0.6) 26 (0.7) 20 (0.6) 16 (0.5) 24 (0.8) 24 (0.7) 22 (0.7) 24 (0.8) 26 (0.9)
2 and over... 75 (1.1) 22 (0.4) 26 (0.6) 21 (0.4) 17 (0.4) 24 (0.8) 24 (0.5) 23 (0.5) 24 (0.5) 26 (0.7)
$25,000 - $74,999:2 - 5.............. 91 (2.9) 24 (0.8) 25 (1.1) 21 (1.2) 17 (1.5) 25 (1.4) 27 (0.9) 24 (1.5) 28 (1.1) 29 (1.4)6 - 11.............. 87 (2.2) 24 (0.6) 29 (1.2) 22 (0.7) 20 (1.3) 27 (0.9) 24 (0.8) 22 (0.7) 25 (0.7) 27 (1.4)
12 - 19.............. 82 (2.4) 27 (1.6) 29 (1.9) 26 (1.4) 23 (1.3) 29 (1.9) 28 (1.9) 27 (1.8) 28 (2.2) 30 (2.2)20 and over... 78 (0.9) 23 (0.6) 28 (0.6) 22 (0.6) 18 (0.6) 24 (0.8) 25 (0.9) 24 (1.0) 25 (1.0) 27 (0.9)
2 and over... 79 (0.9) 24 (0.6) 28 (0.6) 22 (0.5) 19 (0.5) 25 (0.7) 26 (0.8) 24 (0.9) 26 (1.0) 27 (0.8)
$75,000 and higher:2 - 5.............. 97* (1.5) 25 (1.6) 30 (1.6) 23 (1.5) 19 (2.0) 29 (1.6) 28 (1.8) 26 (2.4) 28 (1.7) 30 (3.4)6 - 11.............. 97* (1.1) 26 (1.0) 30 (1.3) 26 (1.1) 23 (1.4) 29 (1.8) 25 (1.1) 23 (1.2) 26 (1.6) 28 (1.2)
12 - 19.............. 91 (2.1) 28 (1.3) 31 (2.3) 26 (1.4) 24 (2.1) 28 (2.0) 30 (1.4) 29 (1.6) 31 (1.5) 30 (1.7)20 and over... 87 (1.6) 25 (0.7) 29 (0.9) 24 (0.8) 19 (0.9) 25 (0.7) 26 (0.6) 25 (0.7) 26 (0.5) 27 (1.1)
2 and over... 89 (1.3) 25 (0.6) 29 (0.7) 24 (0.6) 20 (0.9) 26 (0.7) 26 (0.5) 25 (0.5) 26 (0.3) 27 (0.9)
All Individuals4:2 - 5.............. 91 (1.7) 23 (0.7) 26 (1.1) 21 (0.7) 18 (0.8) 27 (0.9) 25 (0.8) 23 (1.0) 26 (0.7) 27 (1.1)6 - 11.............. 90 (1.3) 25 (0.4) 29 (0.7) 24 (0.5) 22 (0.7) 29 (1.0) 25 (0.5) 23 (0.5) 26 (0.7) 27 (0.8)
12 - 19.............. 84 (1.7) 27 (0.8) 29 (0.9) 25 (0.8) 22 (1.0) 27 (1.3) 28 (0.9) 28 (1.1) 28 (0.9) 29 (0.9)20 and over... 80 (0.7) 23 (0.4) 28 (0.5) 22 (0.4) 18 (0.4) 24 (0.5) 25 (0.6) 24 (0.6) 25 (0.6) 27 (0.7)
2 and over... 82 (0.7) 24 (0.4) 28 (0.4) 23 (0.3) 19 (0.3) 25 (0.5) 26 (0.5) 24 (0.5) 26 (0.5) 27 (0.6)

DATA SOURCE: What We Eat in America, NHANES 2013-2014, individuals 2 years and over (excluding breast-fed children), day 1. Available: www.ars.usda.gov/nea/bhnrc/fsrg.Page 2 of 5
What We Eat in America, NHANES 2013-2014
Table 19. Lunch1: Percentages2 of Selected Nutrients Contributed by Food and Beverages Consumed at Lunch,by Family Income (in Dollars) and Age, in the United States, 2013-2014 (continued)
Family incomein dollarsand age
Choles-terol
Vitamin A(RAE)
Beta-carotene Lycopene Thiamin
Ribo-flavin Niacin Vitamin B6
Folate(DFE)
(years) % (SE) % (SE) % (SE) % (SE) % (SE) % (SE) % (SE) % (SE) % (SE)
$0 - $24,999:2 - 5.............. 17 (2.6) 16 (1.7) 29 (6.8) 36 (7.5) 22 (1.5) 18 (1.7) 25 (1.3) 19 (1.3) 18 (1.3)6 - 11.............. 23 (1.4) 24 (2.2) 36 (6.9) 31 (2.8) 24 (1.8) 25 (1.5) 23 (1.5) 21 (1.8) 20 (2.1)
12 - 19.............. 23 (2.1) 21 (1.9) 27 (5.0) 30 (5.0) 26 (2.2) 23 (2.1) 26 (2.3) 23 (2.7) 23 (3.0)20 and over... 24 (1.0) 21 (1.7) 29 (4.0) 24 (2.7) 23 (0.7) 18 (0.4) 24 (0.7) 23 (1.0) 20 (0.9)
2 and over... 24 (0.8) 21 (1.3) 29 (3.4) 26 (2.1) 23 (0.5) 19 (0.3) 24 (0.6) 23 (0.9) 21 (0.7)
$25,000 - $74,999:2 - 5.............. 22 (1.6) 23 (1.6) 53 (5.0) 34 (4.2) 20 (1.3) 17 (0.8) 24 (1.9) 20 (0.9) 17 (1.1)6 - 11.............. 25 (1.7) 23 (2.9) 39 (6.6) 36 (5.6) 22 (0.8) 24 (1.5) 25 (1.0) 26 (2.5) 19 (1.0)
12 - 19.............. 27 (2.0) 23 (2.3) 25* (8.2) 35 (6.2) 26 (2.6) 24 (2.6) 29 (2.9) 26 (3.5) 23 (2.7)20 and over... 25 (1.2) 22 (1.1) 30 (2.9) 29 (1.8) 24 (0.8) 20 (0.6) 25 (0.7) 23 (0.7) 22 (0.7)
2 and over... 25 (0.9) 22 (0.9) 31 (2.5) 31 (1.6) 24 (0.7) 20 (0.7) 26 (0.8) 23 (0.8) 22 (0.7)
$75,000 and higher:2 - 5.............. 31 (3.3) 23 (2.0) 39 (9.7) 31 (7.5) 26 (1.7) 21 (1.2) 28 (0.7) 24 (1.2) 22 (2.0)6 - 11.............. 23 (1.9) 21 (2.5) 30 (8.5) 24 (5.4) 26 (1.7) 23 (1.5) 29 (1.6) 24 (1.4) 21 (1.6)
12 - 19.............. 26 (2.5) 22 (2.6) 33 (7.8) 38*(12.6) 26 (2.3) 24 (1.6) 28 (2.5) 22 (2.6) 22 (2.2)20 and over... 26 (0.7) 22 (1.3) 28 (2.2) 27 (2.7) 26 (0.7) 21 (0.8) 28 (0.9) 24 (1.0) 23 (0.9)
2 and over... 26 (0.7) 22 (0.9) 29 (1.7) 28 (2.9) 26 (0.6) 21 (0.7) 28 (0.8) 24 (0.9) 23 (0.7)
All Individuals4:2 - 5.............. 23 (2.1) 21 (0.8) 42 (4.0) 34 (4.5) 23 (1.1) 19 (0.7) 26 (0.8) 21 (0.7) 19 (0.9)6 - 11.............. 24 (1.2) 22 (1.7) 33 (5.6) 31 (4.1) 24 (0.8) 24 (1.1) 26 (0.6) 24 (1.2) 20 (1.0)
12 - 19.............. 25 (1.1) 22 (1.4) 29 (5.4) 36 (3.9) 26 (1.3) 24 (1.1) 28 (1.0) 23 (1.3) 23 (1.3)20 and over... 25 (0.6) 22 (1.0) 29 (1.9) 28 (1.3) 25 (0.5) 20 (0.4) 26 (0.5) 23 (0.6) 22 (0.6)
2 and over... 25 (0.4) 22 (0.7) 29 (1.6) 29 (1.2) 25 (0.4) 20 (0.4) 26 (0.4) 23 (0.5) 22 (0.5)

DATA SOURCE: What We Eat in America, NHANES 2013-2014, individuals 2 years and over (excluding breast-fed children), day 1. Available: www.ars.usda.gov/nea/bhnrc/fsrg.Page 3 of 5
What We Eat in America, NHANES 2013-2014
Table 19. Lunch1: Percentages2 of Selected Nutrients Contributed by Food and Beverages Consumed at Lunch,by Family Income (in Dollars) and Age, in the United States, 2013-2014 (continued)
Family incomein dollarsand age Choline Vitamin B12 Vitamin C Vitamin D
Vitamin E(alpha-
tocopherol) Vitamin K Calcium Phosphorus Magnesium(years) % (SE) % (SE) % (SE) % (SE) % (SE) % (SE) % (SE) % (SE) % (SE)
$0 - $24,999:2 - 5.............. 18 (1.8) 15 (2.4) 19 (2.1) 13 (2.3) 23 (1.2) 21 (3.0) 19 (1.8) 22 (1.6) 22 (1.3)6 - 11.............. 25 (1.5) 20 (1.3) 24 (2.8) 25 (1.8) 25 (1.8) 26 (4.0) 27 (1.6) 28 (1.4) 27 (1.5)
12 - 19.............. 24 (2.1) 25 (2.2) 19 (2.0) 23 (1.6) 22 (2.5) 27 (3.2) 26 (2.0) 26 (2.1) 23 (2.2)20 and over... 22 (0.8) 21 (1.2) 20 (1.3) 16 (1.1) 22 (0.9) 26 (2.6) 20 (0.7) 23 (0.7) 20 (0.6)
2 and over... 23 (0.6) 21 (0.9) 20 (1.2) 17 (0.9) 23 (0.7) 26 (2.3) 21 (0.5) 24 (0.5) 21 (0.4)
$25,000 - $74,999:2 - 5.............. 22 (0.8) 17 (1.7) 20 (1.9) 15 (1.9) 26 (1.2) 25 (2.0) 19 (0.8) 22 (0.7) 21 (0.5)6 - 11.............. 29 (1.7) 22 (1.9) 24 (2.4) 27 (3.5) 26 (1.3) 32 (3.3) 26 (1.8) 28 (1.2) 26 (1.2)
12 - 19.............. 26 (1.2) 25 (3.3) 21 (2.6) 20 (1.8) 23 (4.2) 30 (3.6) 26 (1.9) 27 (1.8) 25 (1.9)20 and over... 24 (0.9) 23 (1.0) 21 (1.1) 19 (1.3) 23 (1.1) 31 (2.1) 23 (0.7) 25 (0.6) 21 (0.7)
2 and over... 24 (0.7) 23 (1.1) 21 (0.9) 20 (1.0) 23 (1.0) 31 (1.8) 23 (0.6) 25 (0.6) 22 (0.6)
$75,000 and higher:2 - 5.............. 28 (2.0) 21 (1.4) 21 (3.0) 18 (1.9) 32 (5.4) 28 (3.7) 25 (2.3) 26 (1.4) 26 (1.2)6 - 11.............. 25 (1.6) 20 (1.4) 27 (2.6) 24 (2.8) 24 (1.8) 17 (2.5) 26 (1.6) 28 (1.1) 28 (1.4)
12 - 19.............. 27 (1.8) 23 (2.2) 23 (3.9) 19 (1.8) 28 (1.7) 28 (3.6) 27 (1.5) 29 (1.4) 27 (1.6)20 and over... 24 (0.8) 21 (1.4) 24 (1.1) 17 (2.2) 25 (1.0) 32 (1.8) 23 (0.6) 26 (0.8) 22 (0.7)
2 and over... 24 (0.8) 21 (1.1) 24 (1.1) 18 (1.5) 25 (0.8) 31 (1.4) 24 (0.5) 26 (0.6) 23 (0.6)
All Individuals4:2 - 5.............. 22 (1.3) 17 (1.1) 19 (1.2) 15 (1.1) 27 (1.9) 24 (1.6) 21 (1.0) 23 (0.8) 23 (0.6)6 - 11.............. 27 (1.2) 21 (0.9) 25 (1.2) 25 (2.0) 25 (1.1) 26 (1.7) 27 (1.0) 28 (0.6) 27 (0.7)
12 - 19.............. 26 (0.8) 24 (1.3) 21 (2.0) 20 (1.1) 24 (2.0) 29 (2.4) 27 (1.0) 28 (0.9) 25 (1.0)20 and over... 23 (0.6) 22 (0.7) 22 (0.8) 18 (1.1) 23 (0.7) 30 (1.5) 22 (0.5) 25 (0.5) 21 (0.4)
2 and over... 24 (0.4) 22 (0.6) 22 (0.7) 19 (0.8) 24 (0.6) 30 (1.3) 23 (0.4) 25 (0.4) 22 (0.4)

DATA SOURCE: What We Eat in America, NHANES 2013-2014, individuals 2 years and over (excluding breast-fed children), day 1. Available: www.ars.usda.gov/nea/bhnrc/fsrg.Page 4 of 5
What We Eat in America, NHANES 2013-2014
Table 19. Lunch1: Percentages2 of Selected Nutrients Contributed by Food and Beverages Consumed at Lunch,by Family Income (in Dollars) and Age, in the United States, 2013-2014 (continued)
Family incomein dollarsand age Iron Zinc Copper Selenium Potassium Sodium Caffeine Alcohol(years) % (SE) % (SE) % (SE) % (SE) % (SE) % (SE) % (SE) % (SE)
$0 - $24,999:2 - 5.............. 19 (1.2) 19 (1.3) 21 (1.2) 25 (1.6) 22 (1.3) 27 (1.4) 8* (2.0) -- -- 6 - 11.............. 22 (1.8) 24 (1.6) 26 (1.5) 27 (1.5) 29 (1.4) 29 (1.5) 12 (2.9) -- --
12 - 19.............. 23 (2.1) 25 (2.4) 23 (2.5) 29 (2.6) 25 (2.5) 28 (2.6) 17 (3.4) -- -- 20 and over... 21 (0.6) 23 (0.7) 21 (0.8) 26 (0.7) 22 (0.6) 27 (0.7) 8 (0.7) 5* (1.7)
2 and over... 21 (0.5) 23 (0.5) 22 (0.7) 27 (0.5) 23 (0.4) 27 (0.6) 9 (0.7) -- --
$25,000 - $74,999:2 - 5.............. 17 (1.2) 20 (1.0) 21 (1.2) 27 (1.8) 23 (1.1) 28 (1.1) 19 (5.2) -- -- 6 - 11.............. 21 (0.9) 25 (1.5) 26 (1.9) 27 (1.2) 30 (1.7) 28 (0.9) 13 (3.4) -- --
12 - 19.............. 24 (2.4) 24 (2.6) 25 (1.8) 30 (2.0) 28 (1.5) 30 (1.9) 20 (4.4) -- -- 20 and over... 22 (0.7) 26 (0.8) 22 (0.8) 28 (0.7) 24 (0.5) 29 (0.6) 10 (0.6) 3* (0.7)
2 and over... 22 (0.7) 25 (0.8) 22 (0.6) 28 (0.6) 24 (0.5) 29 (0.6) 10 (0.5) -- --
$75,000 and higher:2 - 5.............. 21 (1.2) 25 (2.5) 26 (1.9) 32 (1.9) 25 (1.5) 32 (1.8) 20* (6.5) -- -- 6 - 11.............. 22 (1.1) 26 (1.1) 26 (1.0) 30 (1.5) 28 (1.4) 30 (1.6) 20 (5.7) -- --
12 - 19.............. 24 (2.4) 26 (2.9) 25 (2.1) 32 (2.3) 28 (1.9) 32 (1.9) 21 (5.1) -- -- 20 and over... 23 (0.7) 25 (0.9) 22 (0.8) 29 (0.9) 24 (0.8) 30 (1.0) 11 (0.9) 3* (1.1)
2 and over... 23 (0.5) 25 (0.6) 23 (0.7) 30 (0.8) 25 (0.7) 30 (0.7) 11 (0.9) -- --
All Individuals4:2 - 5.............. 19 (0.9) 22 (1.1) 23 (0.9) 28 (1.3) 23 (0.7) 29 (0.9) 14 (3.7) -- -- 6 - 11.............. 21 (0.6) 25 (0.7) 26 (0.9) 28 (0.7) 29 (0.9) 29 (0.7) 15 (2.5) -- --
12 - 19.............. 24 (1.1) 25 (1.2) 24 (1.2) 30 (1.0) 27 (0.9) 30 (0.9) 18 (2.8) -- -- 20 and over... 22 (0.5) 25 (0.5) 22 (0.6) 28 (0.5) 24 (0.5) 29 (0.6) 10 (0.5) 4 (0.7)
2 and over... 22 (0.4) 25 (0.5) 23 (0.5) 28 (0.4) 24 (0.4) 29 (0.4) 10 (0.5) -- --

What We Eat in America, NHANES 2013-2014
Page 5 of 5Page 5 of 5
Symbol Legend
* Indicates an estimate that may be less statistically reliable than estimates that are not flagged. The rules for flagging estimated percentages and ratios are as follows:
Percent reporting: An estimated percentage between 25 and 75 percent is flagged when based on a sample size of less than 30 times the variance inflation factor (VIF), where the VIFrepresents a broadly calculated average design effect, or when the relative standard error is greater than 30 percent. An estimated percentage less than or equal to 25 percent or greater thanor equal to 75 percent is flagged when the smaller of np and n(1-p) is less than 8 times the VIF, where n is the sample size and p is the percentage expressed as a fraction. The VIF used inthis table is 1.98.
Nutrient ratios expressed as percentages: An estimated ratio between 25 and 75 percent is flagged when based on a sample size n* of less than 30 times the variance inflation factor(VIF), where the VIF represents a broadly calculated average design effect and n* is the number of individuals in the sample reporting non-zero intake of the respective nutrient. Anestimated ratio less than or equal to 25 percent or greater than or equal to 75 percent, is flagged when the smaller of n*p and n* (1-p) is less than 8 times the VIF, where p is the percentageexpressed as a fraction. Additionally, an estimated ratio is flagged when either the relative standard error or p/(1-p) times the relative standard error is greater than 30 percent. The VIFused in this table is 1.98.
Footnotes
1 Lunch includes eating occasions designated by the respondent as "brunch", "lunch" or the Spanish equivalent "comida." Please note these eating occasions include consumption of beveragesincluding water.
2 Percentages are estimated as a ratio of total nutrients from lunch for all individuals to total daily nutrient intakes for all individuals. Total daily nutrient intakes are available from:www.ars.usda.gov/nea/bhnrc/fsrg. See Table 3. Nutrient Intakes from Food and Beverages: Mean Amounts Consumed per Individual, by Family Income (in Dollars) and Age, in the UnitedStates, 2013-2014.
3 The percentage of respondents in the income/age group who reported consuming at least one item at an eating occasion designated as lunch.
4 Includes persons of all income levels or with unknown family income.
Abbreviations
SE = standard error; RAE = retinol activity equivalents; DFE = dietary folate equivalents.
Notes Applicable to All Tables in Series: What We Eat in America, NHANES 2013-2014
Sample weights designed for dietary analysis were used to allow estimates representative of the U. S. population for the years of collection.
The statistics in this table are estimated from Day 1 dietary recall interviews conducted in the What We Eat in America, National Health and Nutrition Examination Survey (NHANES) 2013-2014.The 24-hour dietary recalls were conducted in-person, by trained interviewers, using the USDA 5-step Automated Multiple-Pass Method. Food intakes were coded and nutrient values weredetermined using the USDA Food and Nutrient Database for Dietary Studies 2013-2014 www.ars.usda.gov/nea/bhnrc/fsrg.
Intakes of nutrients and other dietary components are based on the consumption of food and beverages, including water, and do not include intake from supplements or medications.
The table includes data from individuals 2 years and over. Breast-fed children were excluded because breast milk was not quantified in dietary recall interviews.
Although alcohol data are collected for all individuals, estimates are not presented for age groups under 20 years due to extreme variability and/or inadequate sample size.
Suggested Citation
U.S. Department of Agriculture, Agricultural Research Service. 2016. Lunch: Percentages of Selected Nutrients Contributed by Food and Beverages Consumed at Lunch, by Family Income (inDollars) and Age, What We Eat in America, NHANES 2013-2014.

DATA SOURCE: What We Eat in America, NHANES 2013-2014, individuals 2 years and over (excluding breast-fed children), day 1. Available: www.ars.usda.gov/nea/bhnrc/fsrg.Page 1 of 5
What We Eat in America, NHANES 2013-2014
Table 20. Lunch1: Percentages2 of Selected Nutrients Contributed by Food and Beverages Consumed at Lunch,by Family Income (as % of Poverty Level3) and Age, in the United States, 2013-2014
Family income as% of poverty level
and age Percent
reporting4 Energy Protein Carbo-hydrate
Totalsugars
Dietaryfiber
Totalfat
Saturatedfat
Mono-unsaturated
fat
Poly-unsaturated
fat(years) % (SE) % (SE) % (SE) % (SE) % (SE) % (SE) % (SE) % (SE) % (SE) % (SE)
Under 131% poverty:2 - 5.............. 88 (3.4) 22 (1.0) 25 (1.4) 21 (1.1) 16 (1.3) 25 (1.2) 23 (1.1) 22 (1.6) 24 (1.0) 23 (0.9)6 - 11.............. 85 (2.7) 25 (1.0) 28 (1.3) 23 (1.0) 21 (1.1) 28 (1.7) 25 (1.0) 24 (1.0) 26 (1.3) 27 (1.3)
12 - 19.............. 79 (1.7) 26 (1.5) 29 (2.1) 24 (1.3) 21 (0.9) 26 (2.5) 27 (1.8) 25 (1.9) 26 (1.9) 30 (2.1)20 and over... 71 (1.3) 21 (0.6) 25 (0.7) 20 (0.7) 16 (0.6) 24 (0.7) 23 (0.6) 22 (0.6) 23 (0.6) 25 (0.8)
2 and over... 75 (1.1) 22 (0.4) 26 (0.5) 21 (0.5) 18 (0.5) 25 (0.6) 24 (0.5) 23 (0.6) 24 (0.4) 26 (0.6)
131-350% poverty:2 - 5.............. 92 (1.8) 23 (1.1) 26 (1.6) 20 (1.4) 17 (1.3) 24 (1.6) 25 (1.6) 21 (2.0) 26 (1.5) 28 (2.1)6 - 11.............. 90 (2.6) 26 (1.0) 31 (1.1) 24 (1.1) 22 (1.3) 29 (1.1) 26 (1.2) 24 (1.3) 27 (1.5) 28 (1.5)
12 - 19.............. 84 (3.0) 27 (1.4) 29 (2.0) 26 (1.5) 22 (1.8) 29 (2.0) 28 (1.5) 27 (1.5) 28 (1.8) 29 (2.1)20 and over... 79 (1.3) 24 (0.7) 28 (0.7) 22 (0.7) 18 (0.8) 24 (1.0) 26 (1.0) 25 (1.1) 26 (1.1) 28 (0.9)
2 and over... 81 (1.1) 25 (0.6) 29 (0.6) 23 (0.6) 19 (0.6) 25 (0.9) 26 (0.8) 25 (0.9) 26 (1.0) 28 (0.8)
Over 350% poverty:2 - 5.............. 97* (1.7) 26 (1.7) 29 (1.7) 24 (1.6) 20 (2.3) 31 (1.8) 30 (2.0) 29 (2.7) 29 (1.8) 32 (3.8)6 - 11.............. 97* (1.6) 25 (1.1) 28 (1.5) 26 (1.3) 23 (1.6) 29 (2.4) 24 (1.2) 22 (1.4) 24 (1.2) 27 (1.7)
12 - 19.............. 92 (2.8) 28 (1.7) 29 (2.1) 27 (1.9) 25 (2.6) 27 (2.4) 30 (1.7) 29 (2.1) 31 (1.9) 29 (1.7)20 and over... 85 (1.3) 24 (0.8) 29 (1.0) 23 (0.8) 19 (1.0) 25 (0.7) 26 (0.8) 24 (1.0) 25 (0.6) 27 (1.1)
2 and over... 87 (1.1) 24 (0.7) 29 (0.8) 24 (0.7) 20 (1.0) 25 (0.7) 26 (0.8) 25 (0.9) 26 (0.6) 27 (1.0)
All Individuals5:2 - 5.............. 91 (1.7) 23 (0.7) 26 (1.1) 21 (0.7) 18 (0.8) 27 (0.9) 25 (0.8) 23 (1.0) 26 (0.7) 27 (1.1)6 - 11.............. 90 (1.3) 25 (0.4) 29 (0.7) 24 (0.5) 22 (0.7) 29 (1.0) 25 (0.5) 23 (0.5) 26 (0.7) 27 (0.8)
12 - 19.............. 84 (1.7) 27 (0.8) 29 (0.9) 25 (0.8) 22 (1.0) 27 (1.3) 28 (0.9) 28 (1.1) 28 (0.9) 29 (0.9)20 and over... 80 (0.7) 23 (0.4) 28 (0.5) 22 (0.4) 18 (0.4) 24 (0.5) 25 (0.6) 24 (0.6) 25 (0.6) 27 (0.7)
2 and over... 82 (0.7) 24 (0.4) 28 (0.4) 23 (0.3) 19 (0.3) 25 (0.5) 26 (0.5) 24 (0.5) 26 (0.5) 27 (0.6)

DATA SOURCE: What We Eat in America, NHANES 2013-2014, individuals 2 years and over (excluding breast-fed children), day 1. Available: www.ars.usda.gov/nea/bhnrc/fsrg.Page 2 of 5
What We Eat in America, NHANES 2013-2014
Table 20. Lunch1: Percentages2 of Selected Nutrients Contributed by Food and Beverages Consumed at Lunch,by Family Income (as % of Poverty Level3) and Age, in the United States, 2013-2014 (continued)
Family income as% of poverty level
and age Choles-
terol Vitamin A
(RAE) Beta-
carotene Lycopene Thiamin Ribo-flavin Niacin Vitamin B6
Folate(DFE)
(years) % (SE) % (SE) % (SE) % (SE) % (SE) % (SE) % (SE) % (SE) % (SE)
Under 131% poverty:2 - 5.............. 19 (2.4) 18 (1.1) 35 (5.0) 35 (6.2) 22 (1.7) 18 (1.6) 24 (1.3) 19 (1.3) 18 (1.5)6 - 11.............. 25 (1.7) 24 (1.9) 42 (6.8) 30 (3.4) 23 (1.2) 24 (1.1) 23 (1.1) 21 (1.4) 18 (1.5)
12 - 19.............. 24 (2.2) 22 (1.7) 31 (4.2) 33 (4.1) 26 (2.0) 23 (1.8) 28 (2.2) 24 (2.5) 23 (2.2)20 and over... 23 (0.9) 19 (1.1) 26 (2.3) 23 (2.5) 22 (0.8) 18 (0.5) 24 (0.8) 23 (1.0) 21 (1.1)
2 and over... 23 (0.7) 20 (0.6) 28 (1.5) 26 (2.2) 23 (0.6) 19 (0.4) 24 (0.7) 23 (0.9) 21 (0.6)
131-350% poverty:2 - 5.............. 22 (2.2) 23 (1.7) 56 (7.9) 33 (5.4) 20 (1.6) 18 (1.0) 27 (1.9) 21 (1.4) 17 (1.1)6 - 11.............. 24 (1.6) 20 (2.6) 33 (5.3) 33 (7.3) 23 (1.2) 24 (1.2) 27 (1.6) 27 (2.7) 19 (1.0)
12 - 19.............. 26 (2.3) 20 (2.2) 19* (6.4) 33 (4.5) 28 (2.7) 24 (2.2) 29 (2.3) 25 (2.8) 23 (2.5)20 and over... 27 (1.0) 23 (1.7) 32 (3.1) 29 (1.8) 25 (1.1) 20 (0.8) 26 (0.9) 23 (1.0) 22 (0.8)
2 and over... 26 (0.9) 23 (1.3) 31 (2.7) 30 (1.3) 25 (1.0) 21 (0.8) 26 (0.9) 23 (0.9) 22 (0.8)
Over 350% poverty:2 - 5.............. 32 (4.0) 24 (2.5) 33*(11.7) 32*(12.1) 27 (1.6) 21 (1.1) 27 (0.6) 24 (1.6) 24 (2.4)6 - 11.............. 21 (2.0) 22 (3.7) 30*(10.1) 25 (4.0) 26 (2.2) 24 (1.7) 29 (1.4) 24 (1.4) 22 (2.2)
12 - 19.............. 26 (2.0) 25 (2.8) 41 (7.7) 43*(14.1) 25 (2.0) 24 (2.3) 26 (2.9) 20 (2.8) 23 (2.9)20 and over... 25 (1.2) 22 (1.4) 29 (2.1) 28 (2.5) 26 (0.5) 20 (0.8) 27 (0.8) 24 (0.9) 23 (0.9)
2 and over... 25 (1.1) 22 (1.1) 30 (1.9) 29 (2.6) 26 (0.5) 21 (0.8) 27 (0.7) 24 (0.9) 23 (0.8)
All Individuals5:2 - 5.............. 23 (2.1) 21 (0.8) 42 (4.0) 34 (4.5) 23 (1.1) 19 (0.7) 26 (0.8) 21 (0.7) 19 (0.9)6 - 11.............. 24 (1.2) 22 (1.7) 33 (5.6) 31 (4.1) 24 (0.8) 24 (1.1) 26 (0.6) 24 (1.2) 20 (1.0)
12 - 19.............. 25 (1.1) 22 (1.4) 29 (5.4) 36 (3.9) 26 (1.3) 24 (1.1) 28 (1.0) 23 (1.3) 23 (1.3)20 and over... 25 (0.6) 22 (1.0) 29 (1.9) 28 (1.3) 25 (0.5) 20 (0.4) 26 (0.5) 23 (0.6) 22 (0.6)
2 and over... 25 (0.4) 22 (0.7) 29 (1.6) 29 (1.2) 25 (0.4) 20 (0.4) 26 (0.4) 23 (0.5) 22 (0.5)

DATA SOURCE: What We Eat in America, NHANES 2013-2014, individuals 2 years and over (excluding breast-fed children), day 1. Available: www.ars.usda.gov/nea/bhnrc/fsrg.Page 3 of 5
What We Eat in America, NHANES 2013-2014
Table 20. Lunch1: Percentages2 of Selected Nutrients Contributed by Food and Beverages Consumed at Lunch,by Family Income (as % of Poverty Level3) and Age, in the United States, 2013-2014 (continued)
Family income as% of poverty level
and age Choline Vitamin B12 Vitamin C Vitamin D
Vitamin E(alpha-
tocopherol) Vitamin K Calcium Phosphorus Magnesium(years) % (SE) % (SE) % (SE) % (SE) % (SE) % (SE) % (SE) % (SE) % (SE)
Under 131% poverty:2 - 5.............. 19 (1.6) 16 (2.4) 18 (2.0) 13 (2.0) 24 (1.3) 22 (2.4) 20 (1.5) 22 (1.5) 23 (1.2)6 - 11.............. 27 (1.6) 21 (1.4) 23 (2.4) 26 (1.7) 25 (1.5) 29 (3.1) 27 (1.1) 28 (1.0) 26 (1.1)
12 - 19.............. 25 (1.8) 25 (1.9) 21 (1.9) 22 (1.3) 23 (2.4) 29 (2.9) 26 (1.8) 27 (1.9) 25 (1.8)20 and over... 22 (0.8) 20 (0.6) 21 (1.4) 17 (1.1) 22 (0.8) 27 (2.1) 20 (0.6) 23 (0.6) 20 (0.6)
2 and over... 23 (0.5) 20 (0.6) 21 (1.1) 18 (0.9) 22 (0.6) 27 (1.7) 22 (0.4) 24 (0.4) 21 (0.4)
131-350% poverty:2 - 5.............. 23 (1.3) 17 (1.7) 20 (1.9) 16 (2.2) 25 (1.3) 22 (2.3) 18 (1.0) 22 (1.1) 21 (0.8)6 - 11.............. 29 (1.5) 20 (1.4) 28 (2.4) 26 (2.8) 25 (1.7) 31 (2.1) 27 (1.7) 28 (1.1) 28 (0.9)
12 - 19.............. 26 (1.6) 25 (2.7) 19 (2.5) 19 (2.0) 23 (4.0) 28 (4.0) 26 (1.6) 27 (1.6) 25 (1.6)20 and over... 25 (0.8) 24 (1.4) 21 (1.4) 18 (1.7) 23 (1.4) 31 (2.0) 23 (1.0) 25 (0.8) 22 (0.9)
2 and over... 25 (0.6) 23 (1.2) 21 (1.1) 19 (1.3) 23 (1.2) 30 (1.7) 23 (0.8) 26 (0.7) 22 (0.7)
Over 350% poverty:2 - 5.............. 28 (2.4) 22 (1.2) 22 (3.4) 18 (2.0) 34 (6.4) 31 (4.0) 26 (2.1) 27 (1.4) 26 (1.1)6 - 11.............. 23 (1.8) 21 (1.8) 26 (4.1) 23 (3.3) 25 (2.3) 14 (2.1) 26 (2.0) 27 (1.2) 27 (1.4)
12 - 19.............. 26 (2.1) 23 (2.6) 25 (4.9) 20 (2.2) 28 (1.8) 28 (3.2) 27 (1.9) 28 (1.8) 26 (2.0)20 and over... 23 (1.1) 21 (1.3) 23 (1.2) 19 (2.2) 25 (0.9) 32 (2.1) 23 (0.8) 26 (0.9) 22 (0.8)
2 and over... 23 (1.0) 21 (1.1) 23 (1.3) 19 (1.7) 25 (0.8) 31 (1.7) 24 (0.7) 26 (0.8) 22 (0.7)
All Individuals5:2 - 5.............. 22 (1.3) 17 (1.1) 19 (1.2) 15 (1.1) 27 (1.9) 24 (1.6) 21 (1.0) 23 (0.8) 23 (0.6)6 - 11.............. 27 (1.2) 21 (0.9) 25 (1.2) 25 (2.0) 25 (1.1) 26 (1.7) 27 (1.0) 28 (0.6) 27 (0.7)
12 - 19.............. 26 (0.8) 24 (1.3) 21 (2.0) 20 (1.1) 24 (2.0) 29 (2.4) 27 (1.0) 28 (0.9) 25 (1.0)20 and over... 23 (0.6) 22 (0.7) 22 (0.8) 18 (1.1) 23 (0.7) 30 (1.5) 22 (0.5) 25 (0.5) 21 (0.4)
2 and over... 24 (0.4) 22 (0.6) 22 (0.7) 19 (0.8) 24 (0.6) 30 (1.3) 23 (0.4) 25 (0.4) 22 (0.4)

DATA SOURCE: What We Eat in America, NHANES 2013-2014, individuals 2 years and over (excluding breast-fed children), day 1. Available: www.ars.usda.gov/nea/bhnrc/fsrg.Page 4 of 5
What We Eat in America, NHANES 2013-2014
Table 20. Lunch1: Percentages2 of Selected Nutrients Contributed by Food and Beverages Consumed at Lunch,by Family Income (as % of Poverty Level3) and Age, in the United States, 2013-2014 (continued)
Family income as% of poverty level
and age Iron Zinc Copper Selenium Potassium Sodium Caffeine Alcohol(years) % (SE) % (SE) % (SE) % (SE) % (SE) % (SE) % (SE) % (SE)
Under 131% poverty:2 - 5.............. 19 (1.3) 20 (1.4) 22 (1.2) 26 (1.7) 22 (1.3) 27 (1.3) 11 (2.5) -- -- 6 - 11.............. 21 (1.1) 23 (1.2) 25 (1.6) 27 (1.1) 28 (1.2) 28 (1.1) 12 (2.4) -- --
12 - 19.............. 23 (1.7) 26 (2.0) 24 (2.0) 30 (2.3) 26 (2.0) 29 (2.3) 16 (2.7) -- -- 20 and over... 21 (0.8) 23 (0.7) 21 (0.7) 26 (0.8) 22 (0.7) 27 (0.7) 9 (1.0) 5* (1.5)
2 and over... 21 (0.5) 23 (0.5) 22 (0.5) 26 (0.6) 23 (0.5) 27 (0.6) 9 (0.9) -- --
131-350% poverty:2 - 5.............. 17 (1.3) 20 (1.1) 20 (1.3) 27 (2.0) 23 (1.3) 29 (1.4) 13* (4.6) -- -- 6 - 11.............. 21 (1.0) 26 (1.4) 28 (1.4) 28 (1.3) 31 (1.2) 30 (0.7) 13 (3.0) -- --
12 - 19.............. 24 (1.9) 24 (2.0) 24 (1.8) 31 (2.1) 27 (1.3) 31 (1.7) 21 (4.4) -- -- 20 and over... 23 (0.8) 26 (0.9) 23 (1.3) 29 (0.7) 24 (0.7) 29 (0.7) 10 (0.8) 5 (1.5)
2 and over... 22 (0.7) 25 (0.8) 23 (1.0) 29 (0.6) 25 (0.6) 30 (0.6) 10 (0.8) -- --
Over 350% poverty:2 - 5.............. 22 (1.4) 26 (3.0) 27 (2.0) 33 (2.0) 25 (1.6) 32 (2.0) 26*(11.1) -- -- 6 - 11.............. 22 (1.3) 25 (1.3) 26 (1.3) 28 (1.7) 27 (1.6) 30 (1.8) 22* (6.5) -- --
12 - 19.............. 24 (3.1) 25 (3.3) 25 (2.7) 31 (2.2) 28 (2.3) 30 (1.8) 21 (5.8) -- -- 20 and over... 23 (0.8) 25 (1.0) 22 (0.8) 29 (1.0) 24 (0.8) 30 (1.0) 11 (0.8) 3* (0.7)
2 and over... 23 (0.6) 25 (0.8) 22 (0.7) 29 (0.8) 25 (0.8) 30 (0.8) 11 (0.8) -- --
All Individuals5:2 - 5.............. 19 (0.9) 22 (1.1) 23 (0.9) 28 (1.3) 23 (0.7) 29 (0.9) 14 (3.7) -- -- 6 - 11.............. 21 (0.6) 25 (0.7) 26 (0.9) 28 (0.7) 29 (0.9) 29 (0.7) 15 (2.5) -- --
12 - 19.............. 24 (1.1) 25 (1.2) 24 (1.2) 30 (1.0) 27 (0.9) 30 (0.9) 18 (2.8) -- -- 20 and over... 22 (0.5) 25 (0.5) 22 (0.6) 28 (0.5) 24 (0.5) 29 (0.6) 10 (0.5) 4 (0.7)
2 and over... 22 (0.4) 25 (0.5) 23 (0.5) 28 (0.4) 24 (0.4) 29 (0.4) 10 (0.5) -- --

What We Eat in America, NHANES 2013-2014
Page 5 of 5Page 5 of 5
Symbol Legend
* Indicates an estimate that may be less statistically reliable than estimates that are not flagged. The rules for flagging estimated percentages and ratios are as follows:
Percent reporting: An estimated percentage between 25 and 75 percent is flagged when based on a sample size of less than 30 times the variance inflation factor (VIF), where the VIFrepresents a broadly calculated average design effect, or when the relative standard error is greater than 30 percent. An estimated percentage less than or equal to 25 percent or greater thanor equal to 75 percent is flagged when the smaller of np and n(1-p) is less than 8 times the VIF, where n is the sample size and p is the percentage expressed as a fraction. The VIF used inthis table is 1.98.
Nutrient ratios expressed as percentages: An estimated ratio between 25 and 75 percent is flagged when based on a sample size n* of less than 30 times the variance inflation factor(VIF), where the VIF represents a broadly calculated average design effect and n* is the number of individuals in the sample reporting non-zero intake of the respective nutrient. Anestimated ratio less than or equal to 25 percent or greater than or equal to 75 percent, is flagged when the smaller of n*p and n* (1-p) is less than 8 times the VIF, where p is the percentageexpressed as a fraction. Additionally, an estimated ratio is flagged when either the relative standard error or p/(1-p) times the relative standard error is greater than 30 percent. The VIFused in this table is 1.98.
Footnotes
1 Lunch includes eating occasions designated by the respondent as "brunch", "lunch" or the Spanish equivalent "comida." Please note these eating occasions include consumption of beveragesincluding water.
2 Percentages are estimated as a ratio of total nutrients from lunch for all individuals to total daily nutrient intakes for all individuals. Total daily nutrient intakes are available from:www.ars.usda.gov/nea/bhnrc/fsrg. See Table 4. Nutrient Intakes from Food and Beverages: Mean Amounts Consumed per Individual, by Family Income (as % of Poverty Level) and Age, in theUnited States, 2013-2014.
3 The ratio of family income to poverty expressed as a percentage. The Department of Health and Human Services’ poverty guidelines were used as the poverty measure to calculate the ratio, http://aspe.hhs.gov/poverty/.
4 The percentage of respondents in the income/age group who reported consuming at least one item at an eating occasion designated as lunch.
5 Includes persons of all income levels or with unknown family income.
Abbreviations
SE = standard error; RAE = retinol activity equivalents; DFE = dietary folate equivalents.
Notes Applicable to All Tables in Series: What We Eat in America, NHANES 2013-2014
Sample weights designed for dietary analysis were used to allow estimates representative of the U. S. population for the years of collection.
The statistics in this table are estimated from Day 1 dietary recall interviews conducted in the What We Eat in America, National Health and Nutrition Examination Survey (NHANES) 2013-2014.The 24-hour dietary recalls were conducted in-person, by trained interviewers, using the USDA 5-step Automated Multiple-Pass Method. Food intakes were coded and nutrient values weredetermined using the USDA Food and Nutrient Database for Dietary Studies 2013-2014 www.ars.usda.gov/nea/bhnrc/fsrg.
Intakes of nutrients and other dietary components are based on the consumption of food and beverages, including water, and do not include intake from supplements or medications.
The table includes data from individuals 2 years and over. Breast-fed children were excluded because breast milk was not quantified in dietary recall interviews.
Although alcohol data are collected for all individuals, estimates are not presented for age groups under 20 years due to extreme variability and/or inadequate sample size.
Suggested Citation
U.S. Department of Agriculture, Agricultural Research Service. 2016. Lunch: Percentages of Selected Nutrients Contributed by Food and Beverages Consumed at Lunch, by Family Income (as %of Poverty Level) and Age, What We Eat in America, NHANES 2013-2014.

DATA SOURCE: What We Eat in America, NHANES 2013-2014, individuals 2 years and over (excluding breast-fed children), day 1. Available: www.ars.usda.gov/nea/bhnrc/fsrg.Page 1 of 5
What We Eat in America, NHANES 2013-2014
Table 21. Dinner1: Percentages2 of Selected Nutrients Contributed by Food and Beverages Consumed at Dinner,by Gender and Age, in the United States, 2013-2014
Genderand age
Percentreporting3 Energy Protein
Carbo-hydrate
Totalsugars
Dietaryfiber
Totalfat
Saturatedfat
Mono-unsaturated
fat
Poly-unsaturated
fat(years) % (SE) % (SE) % (SE) % (SE) % (SE) % (SE) % (SE) % (SE) % (SE) % (SE)
Males:2 - 5.............. 95 (1.3) 27 (0.8) 35 (1.6) 24 (0.9) 18 (0.9) 28 (1.2) 29 (1.0) 28 (1.1) 30 (1.1) 29 (1.2)6 - 11.............. 96 (1.1) 33 (1.3) 40 (1.6) 28 (1.5) 22 (1.7) 31 (1.9) 36 (1.3) 36 (1.8) 36 (1.3) 34 (1.7)
12 - 19.............. 91 (0.9) 33 (1.3) 42 (1.5) 28 (1.4) 22 (1.1) 34 (2.1) 34 (1.2) 32 (1.5) 35 (1.1) 36 (1.9)
20 - 29.............. 93 (1.4) 36 (1.8) 43 (2.1) 31 (1.7) 22 (1.4) 35 (1.6) 39 (2.1) 38 (2.6) 39 (2.0) 39 (2.2)30 - 39.............. 90 (2.4) 34 (1.3) 42 (1.3) 30 (1.2) 21 (1.3) 35 (1.7) 36 (1.2) 36 (1.5) 36 (1.3) 37 (1.5)40 - 49.............. 91 (1.4) 36 (1.1) 45 (1.9) 31 (1.5) 22 (1.8) 39 (1.8) 38 (1.2) 37 (1.5) 39 (1.3) 39 (1.7)
50 - 59.............. 94 (1.6) 37 (1.3) 45 (1.6) 34 (1.4) 26 (1.4) 41 (1.9) 39 (1.5) 39 (2.0) 38 (1.5) 40 (1.5)60 - 69.............. 92 (2.0) 34 (1.5) 40 (1.6) 32 (1.7) 25 (1.9) 38 (2.6) 34 (1.4) 33 (1.3) 33 (1.4) 35 (2.3)70 and over...... 93 (1.6) 37 (1.3) 45 (1.3) 32 (1.4) 26 (2.7) 37 (1.3) 39 (1.4) 38 (1.4) 38 (1.6) 40 (1.7)
2 - 19............ 93 (0.7) 32 (1.0) 40 (1.2) 28 (1.1) 21 (1.0) 32 (1.5) 34 (1.0) 33 (1.2) 34 (1.0) 34 (1.4)20 and over... 92 (0.5) 36 (0.7) 43 (0.9) 32 (0.8) 23 (0.9) 37 (0.8) 38 (0.8) 37 (0.8) 37 (0.7) 38 (1.0)
2 and over... 93 (0.4) 35 (0.5) 43 (0.7) 31 (0.6) 23 (0.7) 36 (0.7) 37 (0.6) 36 (0.7) 37 (0.6) 38 (0.7)
Females:2 - 5.............. 96* (1.3) 26 (1.2) 32 (1.6) 23 (1.3) 17 (1.5) 28 (1.6) 29 (1.5) 28 (1.7) 30 (1.4) 29 (1.9)6 - 11.............. 94 (1.0) 30 (0.8) 37 (0.9) 28 (0.7) 21 (0.7) 32 (1.5) 32 (1.2) 31 (1.6) 32 (1.2) 32 (1.3)
12 - 19.............. 90 (2.5) 34 (0.8) 43 (1.4) 29 (0.9) 21 (1.3) 36 (1.6) 37 (1.0) 35 (1.1) 37 (1.1) 38 (1.2)
20 - 29.............. 94 (1.4) 35 (0.9) 44 (1.0) 30 (0.6) 22 (1.0) 37 (1.4) 39 (1.3) 39 (1.5) 39 (1.3) 38 (1.9)30 - 39.............. 93 (1.0) 34 (0.9) 39 (1.1) 30 (1.0) 24 (1.2) 35 (1.4) 36 (1.2) 35 (1.7) 36 (1.4) 36 (1.1)40 - 49.............. 94 (0.9) 35 (1.0) 42 (1.1) 31 (1.2) 22 (1.4) 36 (1.0) 36 (1.5) 36 (1.9) 35 (1.5) 37 (1.6)
50 - 59.............. 94 (1.3) 35 (1.2) 42 (1.3) 30 (1.3) 22 (1.5) 37 (1.3) 36 (1.4) 34 (1.5) 37 (1.4) 39 (1.9)60 - 69.............. 93 (1.4) 35 (1.5) 41 (1.3) 31 (1.6) 24 (1.5) 35 (2.1) 35 (1.6) 36 (1.6) 35 (1.7) 35 (2.4)70 and over...... 95 (1.0) 37 (0.8) 45 (1.0) 32 (0.5) 25 (0.8) 35 (1.5) 41 (1.2) 39 (1.3) 40 (1.2) 42 (1.4)
2 - 19............ 92 (1.3) 31 (0.5) 39 (0.6) 27 (0.5) 20 (0.8) 33 (1.0) 34 (0.6) 32 (0.9) 34 (0.6) 34 (0.8)20 and over... 94 (0.5) 35 (0.4) 42 (0.4) 31 (0.4) 23 (0.6) 36 (0.6) 37 (0.5) 36 (0.5) 37 (0.6) 38 (0.8)
2 and over... 93 (0.5) 34 (0.4) 41 (0.3) 30 (0.4) 22 (0.6) 35 (0.5) 36 (0.4) 35 (0.4) 36 (0.5) 37 (0.7)
Males and females:2 - 19............ 93 (0.8) 32 (0.7) 40 (0.7) 28 (0.7) 21 (0.7) 33 (1.1) 34 (0.7) 33 (0.9) 34 (0.7) 34 (0.9)20 and over... 93 (0.4) 35 (0.5) 43 (0.6) 31 (0.5) 23 (0.6) 37 (0.7) 37 (0.6) 37 (0.6) 37 (0.6) 38 (0.7)
2 and over... 93 (0.3) 35 (0.4) 42 (0.4) 30 (0.4) 23 (0.5) 36 (0.6) 37 (0.4) 36 (0.5) 36 (0.5) 37 (0.6)

DATA SOURCE: What We Eat in America, NHANES 2013-2014, individuals 2 years and over (excluding breast-fed children), day 1. Available: www.ars.usda.gov/nea/bhnrc/fsrg.Page 2 of 5
What We Eat in America, NHANES 2013-2014
Table 21. Dinner1: Percentages2 of Selected Nutrients Contributed by Food and Beverages Consumed at Dinner,by Gender and Age, in the United States, 2013-2014 (continued)
Genderand age
Choles-terol
Vitamin A(RAE)
Beta-carotene Lycopene Thiamin
Ribo-flavin Niacin Vitamin B6
Folate(DFE)
(years) % (SE) % (SE) % (SE) % (SE) % (SE) % (SE) % (SE) % (SE) % (SE)
Males:2 - 5.............. 32 (3.2) 20 (0.9) 30 (2.6) 49 (8.2) 28 (1.5) 23 (0.9) 32 (1.4) 28 (1.0) 26 (1.7)6 - 11.............. 38 (2.5) 28 (1.9) 37 (6.3) 54 (6.2) 33 (2.0) 26 (1.4) 36 (1.5) 31 (1.4) 30 (1.9)
12 - 19.............. 39 (1.8) 26 (1.7) 47 (6.1) 51 (6.5) 30 (1.7) 26 (1.1) 37 (2.0) 33 (2.2) 29 (2.1)
20 - 29.............. 37 (2.3) 29 (3.0) 38 (5.7) 47 (4.4) 37 (2.4) 30 (2.3) 39 (2.2) 35 (2.4) 35 (2.3)30 - 39.............. 37 (1.6) 34 (2.0) 51 (4.9) 53 (6.9) 37 (1.5) 29 (1.7) 36 (2.0) 31 (2.5) 35 (1.9)40 - 49.............. 40 (1.5) 32 (2.5) 47 (6.1) 59 (4.7) 39 (1.7) 30 (1.9) 42 (2.4) 40 (2.8) 36 (1.4)
50 - 59.............. 39 (2.4) 39 (2.4) 69 (3.6) 68 (5.1) 39 (1.7) 29 (1.5) 41 (1.1) 37 (1.5) 34 (2.1)60 - 69.............. 35 (2.1) 34 (2.1) 57 (4.7) 62 (6.8) 35 (1.6) 28 (1.6) 39 (1.7) 38 (1.7) 34 (2.1)70 and over...... 42 (2.7) 32 (2.9) 56 (5.6) 63 (3.1) 34 (1.3) 29 (1.3) 41 (1.4) 38 (1.7) 30 (1.4)
2 - 19............ 38 (1.7) 26 (1.2) 40 (2.5) 52 (4.6) 31 (1.3) 26 (0.9) 36 (1.4) 32 (1.6) 29 (1.3)20 and over... 38 (0.9) 33 (1.2) 52 (2.9) 58 (2.5) 37 (0.9) 29 (1.1) 39 (0.9) 36 (0.9) 34 (0.7)
2 and over... 38 (0.7) 32 (1.0) 50 (2.6) 57 (1.7) 36 (0.7) 28 (0.8) 39 (0.7) 35 (0.7) 33 (0.7)
Females:2 - 5.............. 31 (2.0) 21 (1.5) 36 (6.3) 51 (6.4) 25 (1.3) 21 (0.9) 30 (1.5) 26 (1.6) 22 (1.7)6 - 11.............. 32 (1.5) 25 (1.3) 45 (4.8) 57 (4.7) 31 (1.4) 24 (0.8) 34 (1.4) 30 (1.4) 30 (1.3)
12 - 19.............. 42 (2.3) 27 (1.9) 45 (5.3) 55 (5.9) 34 (0.9) 27 (1.1) 39 (1.1) 35 (1.4) 31 (1.7)
20 - 29.............. 41 (2.3) 35 (3.0) 53 (5.5) 54 (5.6) 36 (1.0) 30 (1.1) 39 (1.6) 34 (2.7) 31 (1.0)30 - 39.............. 36 (1.9) 35 (2.0) 45 (5.2) 50 (3.7) 34 (1.4) 30 (2.2) 38 (1.1) 35 (1.5) 35 (1.3)40 - 49.............. 38 (1.9) 33 (2.2) 45 (3.9) 60 (3.8) 37 (1.0) 27 (0.9) 40 (1.2) 39 (0.9) 37 (1.3)
50 - 59.............. 40 (2.4) 34 (2.4) 50 (4.2) 57 (6.4) 34 (2.1) 27 (1.5) 41 (1.8) 40 (1.9) 34 (1.9)60 - 69.............. 36 (1.4) 37 (3.0) 56 (5.8) 53 (5.1) 36 (1.4) 27 (1.0) 38 (1.3) 35 (1.4) 35 (1.7)70 and over...... 42 (2.1) 36 (2.0) 57 (3.2) 46 (5.2) 34 (0.9) 29 (0.9) 41 (1.0) 39 (1.4) 32 (1.0)
2 - 19............ 36 (1.1) 25 (0.7) 44 (2.7) 55 (3.7) 31 (0.8) 25 (0.6) 36 (0.6) 32 (0.9) 29 (1.1)20 and over... 39 (1.0) 35 (1.0) 50 (2.1) 54 (2.0) 35 (0.5) 28 (0.6) 39 (0.5) 37 (0.7) 34 (0.6)
2 and over... 38 (0.8) 33 (0.8) 50 (1.7) 54 (2.2) 34 (0.5) 27 (0.5) 39 (0.5) 36 (0.6) 33 (0.6)
Males and females:2 - 19............ 37 (1.2) 26 (0.9) 42 (1.7) 53 (3.6) 31 (0.9) 25 (0.7) 36 (1.0) 32 (1.1) 29 (0.9)20 and over... 38 (0.8) 34 (0.9) 51 (1.8) 56 (2.0) 36 (0.6) 29 (0.7) 39 (0.6) 36 (0.7) 34 (0.5)
2 and over... 38 (0.6) 32 (0.8) 50 (1.6) 56 (1.8) 35 (0.5) 28 (0.5) 39 (0.5) 35 (0.6) 33 (0.5)

DATA SOURCE: What We Eat in America, NHANES 2013-2014, individuals 2 years and over (excluding breast-fed children), day 1. Available: www.ars.usda.gov/nea/bhnrc/fsrg.Page 3 of 5
What We Eat in America, NHANES 2013-2014
Table 21. Dinner1: Percentages2 of Selected Nutrients Contributed by Food and Beverages Consumed at Dinner,by Gender and Age, in the United States, 2013-2014 (continued)
Genderand age Choline Vitamin B12 Vitamin C Vitamin D
Vitamin E(alpha-
tocopherol) Vitamin K Calcium Phosphorus Magnesium(years) % (SE) % (SE) % (SE) % (SE) % (SE) % (SE) % (SE) % (SE) % (SE)
Males:2 - 5.............. 30 (1.9) 24 (2.1) 24 (3.4) 22 (2.8) 26 (1.0) 40 (2.9) 22 (1.4) 29 (1.2) 27 (1.0)6 - 11.............. 33 (2.0) 30 (1.7) 22 (1.8) 22 (1.8) 31 (1.6) 35 (5.1) 29 (1.8) 33 (1.4) 30 (1.5)
12 - 19.............. 37 (1.5) 26 (1.7) 25 (2.7) 19 (2.3) 34 (1.4) 49 (2.7) 26 (1.4) 34 (1.4) 32 (1.4)
20 - 29.............. 36 (1.9) 36 (3.3) 27 (3.0) 28 (4.7) 32 (2.6) 46 (3.1) 31 (2.9) 37 (2.3) 33 (1.7)30 - 39.............. 37 (1.6) 32 (2.7) 29 (2.9) 31 (2.0) 31 (1.4) 44 (3.8) 30 (1.3) 35 (1.4) 31 (1.3)40 - 49.............. 40 (1.3) 39 (3.6) 36 (2.8) 38 (8.1) 36 (2.3) 50 (2.3) 31 (2.0) 38 (1.4) 34 (1.2)
50 - 59.............. 38 (1.9) 37 (3.0) 37 (2.7) 33 (4.1) 36 (1.5) 62 (2.6) 32 (2.2) 39 (1.6) 34 (1.5)60 - 69.............. 35 (1.3) 35 (2.6) 32 (3.3) 30 (4.4) 33 (2.9) 56 (4.0) 28 (2.1) 34 (1.6) 31 (1.8)70 and over...... 41 (1.4) 33 (3.5) 29 (2.3) 32 (3.6) 35 (1.9) 55 (2.8) 28 (1.6) 37 (1.2) 33 (1.2)
2 - 19............ 34 (1.4) 27 (1.2) 24 (1.4) 21 (1.5) 32 (1.2) 43 (2.2) 26 (1.0) 33 (1.1) 31 (1.1)20 and over... 38 (0.8) 35 (1.5) 31 (1.1) 32 (1.9) 34 (1.1) 52 (1.8) 30 (1.2) 37 (0.9) 33 (0.7)
2 and over... 37 (0.5) 33 (1.0) 30 (0.9) 29 (1.3) 33 (0.9) 51 (1.6) 29 (0.9) 36 (0.6) 32 (0.5)
Females:2 - 5.............. 28 (1.2) 22 (1.4) 20 (2.5) 15 (1.1) 28 (2.1) 41 (4.0) 20 (1.3) 26 (1.3) 25 (1.3)6 - 11.............. 31 (1.1) 27 (1.7) 24 (2.2) 17 (1.4) 31 (1.6) 46 (5.8) 24 (1.1) 30 (0.9) 29 (0.8)
12 - 19.............. 39 (1.5) 29 (2.0) 27 (3.0) 22 (2.2) 34 (1.1) 49 (3.7) 28 (1.4) 36 (1.2) 32 (1.1)
20 - 29.............. 38 (1.7) 36 (2.4) 28 (1.7) 30 (2.7) 33 (1.3) 45 (3.2) 31 (1.3) 38 (1.0) 32 (0.9)30 - 39.............. 35 (1.7) 39 (3.1) 30 (2.8) 27 (3.3) 34 (1.7) 41 (4.1) 29 (1.4) 35 (0.9) 29 (0.7)40 - 49.............. 37 (0.8) 39 (2.3) 33 (3.6) 32 (4.3) 33 (1.6) 45 (2.1) 29 (1.4) 37 (1.1) 31 (0.7)
50 - 59.............. 38 (1.6) 37 (3.9) 34 (1.7) 26 (4.0) 37 (1.7) 46 (2.5) 27 (1.5) 35 (1.4) 30 (1.2)60 - 69.............. 36 (1.4) 39 (2.7) 30 (2.5) 30 (4.4) 33 (1.8) 53 (4.4) 29 (1.3) 35 (1.2) 30 (1.3)70 and over...... 40 (1.3) 34 (1.9) 26 (1.7) 27 (1.9) 37 (1.1) 54 (2.9) 30 (0.8) 37 (0.8) 32 (0.8)
2 - 19............ 34 (0.7) 27 (1.4) 24 (1.6) 18 (1.2) 32 (0.8) 47 (3.0) 25 (0.8) 32 (0.6) 30 (0.6)20 and over... 37 (0.7) 38 (1.2) 30 (1.1) 29 (1.5) 34 (0.8) 47 (1.3) 29 (0.4) 36 (0.4) 31 (0.4)
2 and over... 37 (0.6) 35 (1.0) 29 (1.0) 26 (1.1) 34 (0.7) 47 (1.2) 28 (0.4) 35 (0.4) 30 (0.4)
Males and females:2 - 19............ 34 (0.9) 27 (1.0) 24 (1.3) 20 (1.3) 32 (1.0) 45 (2.1) 26 (0.8) 32 (0.7) 30 (0.8)20 and over... 38 (0.6) 36 (1.2) 31 (1.0) 31 (1.5) 34 (0.9) 49 (1.3) 30 (0.7) 37 (0.6) 32 (0.5)
2 and over... 37 (0.4) 34 (0.9) 29 (0.9) 28 (1.0) 34 (0.7) 49 (1.2) 29 (0.6) 36 (0.5) 31 (0.4)
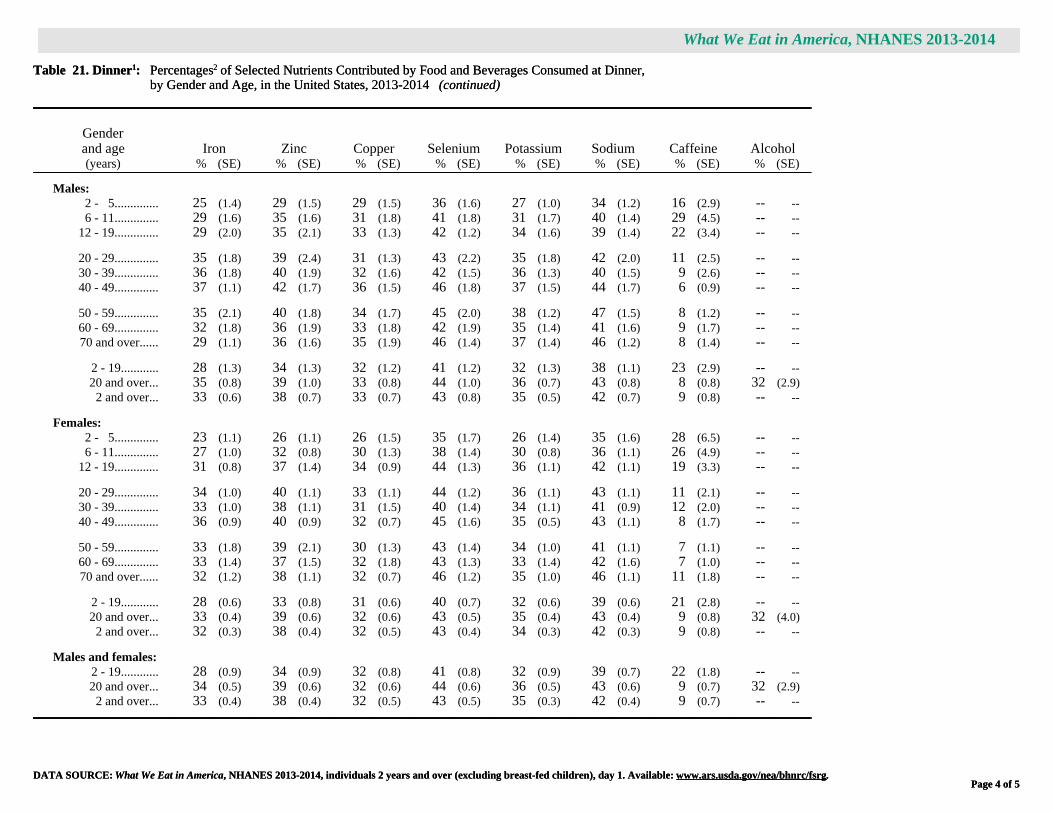
DATA SOURCE: What We Eat in America, NHANES 2013-2014, individuals 2 years and over (excluding breast-fed children), day 1. Available: www.ars.usda.gov/nea/bhnrc/fsrg.Page 4 of 5
What We Eat in America, NHANES 2013-2014
Table 21. Dinner1: Percentages2 of Selected Nutrients Contributed by Food and Beverages Consumed at Dinner,by Gender and Age, in the United States, 2013-2014 (continued)
Genderand age Iron Zinc Copper Selenium Potassium Sodium Caffeine Alcohol(years) % (SE) % (SE) % (SE) % (SE) % (SE) % (SE) % (SE) % (SE)
Males:2 - 5.............. 25 (1.4) 29 (1.5) 29 (1.5) 36 (1.6) 27 (1.0) 34 (1.2) 16 (2.9) -- -- 6 - 11.............. 29 (1.6) 35 (1.6) 31 (1.8) 41 (1.8) 31 (1.7) 40 (1.4) 29 (4.5) -- --
12 - 19.............. 29 (2.0) 35 (2.1) 33 (1.3) 42 (1.2) 34 (1.6) 39 (1.4) 22 (3.4) -- --
20 - 29.............. 35 (1.8) 39 (2.4) 31 (1.3) 43 (2.2) 35 (1.8) 42 (2.0) 11 (2.5) -- -- 30 - 39.............. 36 (1.8) 40 (1.9) 32 (1.6) 42 (1.5) 36 (1.3) 40 (1.5) 9 (2.6) -- -- 40 - 49.............. 37 (1.1) 42 (1.7) 36 (1.5) 46 (1.8) 37 (1.5) 44 (1.7) 6 (0.9) -- --
50 - 59.............. 35 (2.1) 40 (1.8) 34 (1.7) 45 (2.0) 38 (1.2) 47 (1.5) 8 (1.2) -- -- 60 - 69.............. 32 (1.8) 36 (1.9) 33 (1.8) 42 (1.9) 35 (1.4) 41 (1.6) 9 (1.7) -- -- 70 and over...... 29 (1.1) 36 (1.6) 35 (1.9) 46 (1.4) 37 (1.4) 46 (1.2) 8 (1.4) -- --
2 - 19............ 28 (1.3) 34 (1.3) 32 (1.2) 41 (1.2) 32 (1.3) 38 (1.1) 23 (2.9) -- -- 20 and over... 35 (0.8) 39 (1.0) 33 (0.8) 44 (1.0) 36 (0.7) 43 (0.8) 8 (0.8) 32 (2.9)
2 and over... 33 (0.6) 38 (0.7) 33 (0.7) 43 (0.8) 35 (0.5) 42 (0.7) 9 (0.8) -- --
Females:2 - 5.............. 23 (1.1) 26 (1.1) 26 (1.5) 35 (1.7) 26 (1.4) 35 (1.6) 28 (6.5) -- -- 6 - 11.............. 27 (1.0) 32 (0.8) 30 (1.3) 38 (1.4) 30 (0.8) 36 (1.1) 26 (4.9) -- --
12 - 19.............. 31 (0.8) 37 (1.4) 34 (0.9) 44 (1.3) 36 (1.1) 42 (1.1) 19 (3.3) -- --
20 - 29.............. 34 (1.0) 40 (1.1) 33 (1.1) 44 (1.2) 36 (1.1) 43 (1.1) 11 (2.1) -- -- 30 - 39.............. 33 (1.0) 38 (1.1) 31 (1.5) 40 (1.4) 34 (1.1) 41 (0.9) 12 (2.0) -- -- 40 - 49.............. 36 (0.9) 40 (0.9) 32 (0.7) 45 (1.6) 35 (0.5) 43 (1.1) 8 (1.7) -- --
50 - 59.............. 33 (1.8) 39 (2.1) 30 (1.3) 43 (1.4) 34 (1.0) 41 (1.1) 7 (1.1) -- -- 60 - 69.............. 33 (1.4) 37 (1.5) 32 (1.8) 43 (1.3) 33 (1.4) 42 (1.6) 7 (1.0) -- -- 70 and over...... 32 (1.2) 38 (1.1) 32 (0.7) 46 (1.2) 35 (1.0) 46 (1.1) 11 (1.8) -- --
2 - 19............ 28 (0.6) 33 (0.8) 31 (0.6) 40 (0.7) 32 (0.6) 39 (0.6) 21 (2.8) -- -- 20 and over... 33 (0.4) 39 (0.6) 32 (0.6) 43 (0.5) 35 (0.4) 43 (0.4) 9 (0.8) 32 (4.0)
2 and over... 32 (0.3) 38 (0.4) 32 (0.5) 43 (0.4) 34 (0.3) 42 (0.3) 9 (0.8) -- --
Males and females:2 - 19............ 28 (0.9) 34 (0.9) 32 (0.8) 41 (0.8) 32 (0.9) 39 (0.7) 22 (1.8) -- -- 20 and over... 34 (0.5) 39 (0.6) 32 (0.6) 44 (0.6) 36 (0.5) 43 (0.6) 9 (0.7) 32 (2.9)
2 and over... 33 (0.4) 38 (0.4) 32 (0.5) 43 (0.5) 35 (0.3) 42 (0.4) 9 (0.7) -- --

What We Eat in America, NHANES 2013-2014
Page 5 of 5Page 5 of 5
Symbol Legend
* Indicates an estimate that may be less statistically reliable than estimates that are not flagged. The rules for flagging estimated percentages and ratios are as follows:
Percent reporting: An estimated percentage between 25 and 75 percent is flagged when based on a sample size of less than 30 times the variance inflation factor (VIF), where the VIFrepresents a broadly calculated average design effect, or when the relative standard error is greater than 30 percent. An estimated percentage less than or equal to 25 percent or greater thanor equal to 75 percent is flagged when the smaller of np and n(1-p) is less than 8 times the VIF, where n is the sample size and p is the percentage expressed as a fraction. The VIF used inthis table is 1.98.
Nutrient ratios expressed as percentages: An estimated ratio between 25 and 75 percent is flagged when based on a sample size n* of less than 30 times the variance inflation factor(VIF), where the VIF represents a broadly calculated average design effect and n* is the number of individuals in the sample reporting non-zero intake of the respective nutrient. Anestimated ratio less than or equal to 25 percent or greater than or equal to 75 percent, is flagged when the smaller of n*p and n* (1-p) is less than 8 times the VIF, where p is the percentageexpressed as a fraction. Additionally, an estimated ratio is flagged when either the relative standard error or p/(1-p) times the relative standard error is greater than 30 percent. The VIFused in this table is 1.98.
Footnotes
1 Dinner includes eating occasions designated by the respondent as "dinner", "supper", or the Spanish equivalent "cena." Please note these eating occasions include consumption of beveragesincluding water.
2 Percentages are estimated as a ratio of total nutrients from dinner for all individuals to total daily nutrient intakes for all individuals. Total daily nutrient intakes are available from:www.ars.usda.gov/nea/bhnrc/fsrg. See Table 1. Nutrient Intakes from Food and Beverages: Mean Amounts Consumed per Individual, by Gender and Age, in the United States, 2013-2014.
3 The percentage of respondents in the gender/age group who reported consuming at least one item at an eating occasion designated as dinner.
Abbreviations
SE = standard error; RAE = retinol activity equivalents; DFE = dietary folate equivalents.
Notes Applicable to All Tables in Series: What We Eat in America, NHANES 2013-2014
Sample weights designed for dietary analysis were used to allow estimates representative of the U. S. population for the years of collection.
The statistics in this table are estimated from Day 1 dietary recall interviews conducted in the What We Eat in America, National Health and Nutrition Examination Survey (NHANES) 2013-2014.The 24-hour dietary recalls were conducted in-person, by trained interviewers, using the USDA 5-step Automated Multiple-Pass Method. Food intakes were coded and nutrient values weredetermined using the USDA Food and Nutrient Database for Dietary Studies 2013-2014 www.ars.usda.gov/nea/bhnrc/fsrg.
Intakes of nutrients and other dietary components are based on the consumption of food and beverages, including water, and do not include intake from supplements or medications.
The table includes data from individuals 2 years and over. Breast-fed children were excluded because breast milk was not quantified in dietary recall interviews.
Although alcohol data are collected for all individuals, estimates are not presented for age groups under 20 years due to extreme variability and/or inadequate sample size.
Suggested Citation
U.S. Department of Agriculture, Agricultural Research Service. 2016. Dinner: Percentages of Selected Nutrients Contributed by Food and Beverages Consumed at Dinner, by Gender and Age,What We Eat in America, NHANES 2013-2014.

DATA SOURCE: What We Eat in America, NHANES 2013-2014, individuals 2 years and over (excluding breast-fed children), day 1. Available: www.ars.usda.gov/nea/bhnrc/fsrg.Page 1 of 5
What We Eat in America, NHANES 2013-2014
Table 22. Dinner1: Percentages2 of Selected Nutrients Contributed by Food and Beverages Consumed at Dinner,by Race/Ethnicity and Age, in the United States, 2013-2014
Race/ethnicityand age
Percentreporting3 Energy Protein
Carbo-hydrate
Totalsugars
Dietaryfiber
Totalfat
Saturatedfat
Mono-unsaturated
fat
Poly-unsaturated
fat(years) % (SE) % (SE) % (SE) % (SE) % (SE) % (SE) % (SE) % (SE) % (SE) % (SE)
Non-Hispanic White:2 - 5.............. 98* (1.2) 28 (0.9) 36 (1.8) 24 (1.2) 18 (1.4) 28 (1.3) 31 (1.0) 31 (1.2) 32 (1.1) 27 (1.4)6 - 11.............. 97* (0.8) 33 (1.2) 40 (1.7) 28 (1.2) 22 (1.4) 31 (2.0) 36 (1.5) 36 (2.1) 35 (1.6) 35 (2.1)
12 - 19.............. 93 (2.5) 34 (1.0) 44 (0.9) 28 (1.2) 21 (1.0) 36 (2.6) 37 (1.1) 34 (1.2) 37 (1.2) 40 (2.1)20 and over... 95 (0.4) 36 (0.6) 44 (0.8) 32 (0.6) 23 (0.7) 38 (0.9) 38 (0.7) 37 (0.8) 38 (0.8) 39 (0.9)
2 and over... 95 (0.4) 35 (0.5) 43 (0.7) 31 (0.5) 23 (0.6) 37 (0.8) 38 (0.6) 37 (0.7) 37 (0.6) 39 (0.8)
Non-Hispanic Black:2 - 5.............. 96* (1.8) 30 (2.8) 38 (3.4) 27 (2.3) 22 (2.5) 31 (2.1) 31 (3.8) 28 (3.8) 32 (3.9) 34 (4.0)6 - 11.............. 93 (1.9) 33 (1.5) 39 (1.8) 30 (1.5) 25 (1.5) 35 (2.2) 34 (1.8) 34 (1.8) 35 (1.8) 33 (2.0)
12 - 19.............. 86 (2.2) 34 (2.5) 42 (2.3) 30 (2.4) 23 (2.3) 35 (3.2) 36 (2.7) 36 (3.5) 37 (2.6) 35 (2.2)20 and over... 88 (1.5) 35 (1.4) 44 (1.4) 31 (1.3) 24 (1.0) 37 (1.2) 36 (1.2) 36 (1.3) 36 (1.3) 36 (1.2)
2 and over... 89 (1.1) 34 (1.2) 43 (1.2) 30 (1.1) 24 (0.9) 37 (1.3) 36 (1.1) 35 (1.4) 36 (1.0) 36 (1.0)
Non-Hispanic Asian4:2 - 5.............. 98* (1.4) 26* (3.2) 33* (3.1) 24* (3.0) 14* (2.8) 25* (3.7) 23* (3.5) 21* (3.9) 24* (3.3) 25* (3.6)6 - 11.............. 99* (0.8) 29 (1.2) 35 (1.8) 27 (1.7) 17* (2.2) 27 (2.4) 28 (3.2) 26 (3.7) 30 (3.9) 27 (4.3)
12 - 19.............. 85 (6.9) 32 (2.6) 39 (3.2) 30 (2.9) 22 (5.1) 31 (3.1) 31 (2.7) 28 (3.2) 32 (2.8) 32 (2.5)20 and over... 98* (0.7) 37 (1.0) 43 (1.3) 33 (1.1) 25 (1.5) 36 (1.0) 38 (1.4) 36 (1.4) 37 (1.5) 40 (1.5)
2 and over... 96 (0.8) 35 (1.0) 42 (1.3) 32 (0.9) 23 (1.5) 35 (0.8) 36 (1.3) 33 (1.4) 36 (1.4) 37 (1.3)
Hispanic:2 - 5.............. 89 (3.1) 23 (1.6) 28 (2.1) 21 (1.6) 15 (1.3) 25 (2.8) 25 (1.8) 22 (1.8) 25 (1.8) 27 (2.4)6 - 11.............. 90 (1.1) 29 (2.4) 35 (3.0) 26 (2.1) 20 (1.7) 31 (3.0) 31 (2.7) 31 (3.0) 31 (2.6) 30 (2.5)
12 - 19.............. 88 (2.0) 32 (1.4) 38 (1.8) 30 (1.5) 23 (1.7) 34 (2.1) 32 (1.5) 31 (1.8) 31 (1.8) 31 (1.4)20 and over... 86 (1.4) 32 (0.6) 38 (1.1) 29 (0.6) 24 (0.9) 33 (0.8) 34 (0.7) 34 (0.8) 34 (0.6) 34 (1.1)
2 and over... 87 (1.1) 31 (0.6) 37 (0.9) 29 (0.5) 22 (0.7) 32 (0.7) 33 (0.7) 33 (0.8) 33 (0.8) 33 (0.8)

DATA SOURCE: What We Eat in America, NHANES 2013-2014, individuals 2 years and over (excluding breast-fed children), day 1. Available: www.ars.usda.gov/nea/bhnrc/fsrg.Page 2 of 5
What We Eat in America, NHANES 2013-2014
Table 22. Dinner1: Percentages2 of Selected Nutrients Contributed by Food and Beverages Consumed at Dinner,by Race/Ethnicity and Age, in the United States, 2013-2014 (continued)
Race/ethnicityand age
Choles-terol
Vitamin A(RAE)
Beta-carotene Lycopene Thiamin
Ribo-flavin Niacin Vitamin B6
Folate(DFE)
(years) % (SE) % (SE) % (SE) % (SE) % (SE) % (SE) % (SE) % (SE) % (SE)
Non-Hispanic White:2 - 5.............. 37 (3.5) 21 (1.6) 31 (5.1) 61 (7.8) 28 (1.6) 23 (1.2) 31 (1.2) 27 (0.8) 24 (1.7)6 - 11.............. 38 (3.8) 28 (2.2) 37 (7.7) 57 (6.9) 33 (1.9) 26 (1.4) 37 (2.0) 31 (2.1) 29 (1.7)
12 - 19.............. 43 (2.0) 27 (1.7) 45 (6.0) 57 (9.7) 30 (2.0) 26 (1.5) 38 (2.2) 34 (2.3) 30 (2.2)20 and over... 40 (1.0) 34 (0.9) 53 (1.9) 60 (2.4) 37 (0.8) 29 (0.8) 40 (0.7) 37 (0.8) 34 (0.6)
2 and over... 40 (1.0) 33 (0.8) 51 (1.6) 59 (2.2) 35 (0.7) 28 (0.6) 40 (0.6) 36 (0.7) 33 (0.6)
Non-Hispanic Black:2 - 5.............. 36 (5.1) 20 (2.3) 48 (9.2) 57 (7.6) 28 (2.4) 22 (2.4) 34 (2.2) 29 (1.9) 24 (2.9)6 - 11.............. 36 (3.1) 25 (2.7) 45 (9.7) 57 (6.2) 31 (1.6) 25 (1.4) 35 (1.5) 30 (2.0) 31 (2.1)
12 - 19.............. 41 (2.8) 27 (2.7) 46 (5.6) 47 (7.3) 33 (2.3) 28 (2.3) 36 (2.1) 32 (2.4) 28 (3.6)20 and over... 39 (1.5) 39 (2.3) 59 (3.9) 54 (3.8) 37 (1.7) 32 (1.2) 40 (1.5) 39 (1.5) 37 (2.0)
2 and over... 39 (1.3) 35 (2.1) 57 (3.6) 53 (3.4) 36 (1.4) 30 (1.1) 39 (1.2) 37 (1.3) 34 (1.5)
Non-Hispanic Asian4:2 - 5.............. 27* (4.2) 20* (2.2) 27* (7.4) 73*(11.3) 28* (1.9) 21* (2.3) 33* (2.8) 27* (3.0) 29* (3.3)6 - 11.............. 29 (4.9) 26 (4.0) 50 (8.8) 40*(12.5) 33 (3.0) 24 (3.4) 38 (2.0) 34 (2.6) 36 (3.2)
12 - 19.............. 40 (5.5) 29 (3.4) 50 (7.5) 47 (12.2) 33 (3.2) 25 (2.8) 38 (2.9) 37 (3.5) 30 (2.3)20 and over... 39 (1.7) 35 (3.3) 44 (5.4) 53 (6.1) 37 (1.2) 30 (0.9) 42 (1.5) 40 (1.5) 38 (1.1)
2 and over... 38 (1.7) 33 (2.7) 44 (4.7) 51 (5.2) 36 (1.1) 29 (0.8) 41 (1.3) 39 (1.5) 36 (0.9)
Hispanic:2 - 5.............. 26 (4.5) 18 (1.3) 33 (5.2) 30 (6.4) 24 (2.3) 19 (1.5) 29 (2.2) 26 (2.4) 24 (2.1)6 - 11.............. 32 (2.7) 26 (2.3) 44 (5.4) 55 (5.6) 31 (3.0) 24 (2.1) 33 (2.5) 29 (2.1) 29 (2.8)
12 - 19.............. 33 (2.5) 25 (2.2) 47 (4.9) 48 (4.4) 32 (1.3) 26 (1.5) 36 (1.4) 33 (1.6) 31 (1.4)20 and over... 31 (1.2) 30 (2.0) 43 (3.8) 44 (2.6) 33 (1.2) 27 (1.6) 34 (1.1) 32 (1.4) 32 (0.8)
2 and over... 31 (0.9) 28 (1.1) 43 (3.1) 45 (2.3) 32 (1.0) 26 (0.9) 34 (0.9) 31 (1.0) 31 (0.6)

DATA SOURCE: What We Eat in America, NHANES 2013-2014, individuals 2 years and over (excluding breast-fed children), day 1. Available: www.ars.usda.gov/nea/bhnrc/fsrg.Page 3 of 5
What We Eat in America, NHANES 2013-2014
Table 22. Dinner1: Percentages2 of Selected Nutrients Contributed by Food and Beverages Consumed at Dinner,by Race/Ethnicity and Age, in the United States, 2013-2014 (continued)
Race/ethnicityand age Choline Vitamin B12 Vitamin C Vitamin D
Vitamin E(alpha-
tocopherol) Vitamin K Calcium Phosphorus Magnesium(years) % (SE) % (SE) % (SE) % (SE) % (SE) % (SE) % (SE) % (SE) % (SE)
Non-Hispanic White:2 - 5.............. 32 (1.8) 26 (2.3) 22 (4.2) 22 (3.3) 27 (1.4) 40 (2.4) 24 (1.5) 29 (1.2) 27 (1.1)6 - 11.............. 34 (2.6) 29 (1.7) 23 (3.1) 21 (2.0) 31 (1.7) 41 (8.8) 28 (1.7) 33 (1.3) 30 (1.3)
12 - 19.............. 40 (1.6) 27 (2.5) 26 (3.9) 21 (3.1) 38 (1.6) 56 (3.7) 27 (1.7) 36 (1.2) 34 (1.4)20 and over... 39 (0.8) 36 (1.3) 31 (1.2) 32 (2.0) 34 (1.2) 51 (1.3) 30 (1.0) 37 (0.8) 32 (0.6)
2 and over... 38 (0.6) 34 (1.0) 30 (1.3) 30 (1.5) 34 (1.0) 50 (1.3) 30 (0.8) 36 (0.6) 32 (0.4)
Non-Hispanic Black:2 - 5.............. 33 (3.7) 24 (3.0) 30 (3.0) 15 (3.0) 32 (3.3) 52 (6.3) 21 (3.1) 29 (3.0) 29 (2.6)6 - 11.............. 34 (2.2) 28 (0.8) 26 (3.4) 16 (2.6) 34 (2.7) 50 (4.8) 26 (1.6) 32 (1.5) 33 (1.3)
12 - 19.............. 38 (2.3) 31 (2.9) 23 (1.7) 21 (2.9) 31 (2.2) 47 (3.6) 31 (2.7) 35 (2.4) 32 (2.1)20 and over... 39 (1.5) 43 (1.8) 31 (1.7) 33 (2.9) 34 (1.4) 49 (3.8) 31 (1.6) 38 (1.3) 33 (1.1)
2 and over... 38 (1.3) 39 (1.3) 29 (1.5) 29 (2.1) 34 (1.3) 49 (3.4) 30 (1.5) 37 (1.1) 33 (0.9)
Non-Hispanic Asian4:2 - 5.............. 24* (2.9) 22* (3.4) 23* (5.0) 19* (3.2) 22* (5.3) 32* (4.5) 22* (4.0) 27* (3.1) 27* (3.0)6 - 11.............. 28 (2.5) 26 (3.7) 23 (2.8) 25 (6.6) 26 (2.2) 35 (5.3) 20* (2.6) 27 (1.8) 28 (1.4)
12 - 19.............. 38 (3.5) 24 (4.0) 32 (5.2) 17 (3.9) 33 (2.5) 38 (4.0) 20 (3.0) 32 (2.8) 31 (2.3)20 and over... 39 (1.5) 38 (1.3) 33 (1.6) 26 (2.6) 36 (1.5) 49 (2.2) 28 (0.7) 37 (1.0) 34 (1.0)
2 and over... 37 (1.5) 35 (1.4) 32 (1.5) 24 (2.4) 35 (1.4) 47 (2.0) 26 (0.5) 35 (0.9) 33 (0.8)
Hispanic:2 - 5.............. 25 (2.9) 19 (1.8) 19 (3.2) 14 (1.8) 24 (2.6) 36 (5.5) 16 (1.1) 23 (1.7) 23 (1.9)6 - 11.............. 30 (2.4) 30 (3.4) 22 (2.5) 17 (1.8) 28 (2.5) 34 (3.1) 25 (2.6) 29 (2.6) 28 (2.4)
12 - 19.............. 32 (2.0) 26 (1.3) 25 (1.8) 19 (2.3) 29 (2.4) 36 (2.3) 25 (2.0) 32 (1.6) 30 (1.6)20 and over... 31 (1.1) 32 (2.1) 28 (2.0) 25 (1.0) 31 (0.8) 45 (3.2) 27 (0.8) 33 (0.9) 29 (0.9)
2 and over... 31 (0.8) 30 (1.4) 26 (1.4) 22 (0.7) 30 (1.0) 42 (2.4) 26 (0.5) 32 (0.6) 29 (0.7)

DATA SOURCE: What We Eat in America, NHANES 2013-2014, individuals 2 years and over (excluding breast-fed children), day 1. Available: www.ars.usda.gov/nea/bhnrc/fsrg.Page 4 of 5
What We Eat in America, NHANES 2013-2014
Table 22. Dinner1: Percentages2 of Selected Nutrients Contributed by Food and Beverages Consumed at Dinner,by Race/Ethnicity and Age, in the United States, 2013-2014 (continued)
Race/ethnicityand age Iron Zinc Copper Selenium Potassium Sodium Caffeine Alcohol(years) % (SE) % (SE) % (SE) % (SE) % (SE) % (SE) % (SE) % (SE)
Non-Hispanic White:2 - 5.............. 25 (1.3) 29 (1.6) 29 (1.4) 38 (1.7) 28 (0.8) 37 (1.6) 25 (5.7) -- -- 6 - 11.............. 28 (1.4) 35 (1.5) 30 (1.9) 43 (1.8) 32 (1.8) 40 (1.7) 25 (4.1) -- --
12 - 19.............. 29 (2.0) 37 (2.7) 35 (1.5) 45 (1.0) 37 (1.5) 41 (1.1) 19 (3.1) -- -- 20 and over... 34 (0.7) 39 (0.8) 32 (0.7) 45 (0.7) 36 (0.6) 44 (0.7) 8 (0.8) 35 (4.0)
2 and over... 33 (0.5) 38 (0.6) 32 (0.6) 45 (0.6) 36 (0.5) 44 (0.7) 8 (0.7) -- --
Non-Hispanic Black:2 - 5.............. 25 (1.9) 31 (2.2) 32 (3.0) 39 (4.2) 30 (2.9) 36 (3.2) 32*(11.5) -- -- 6 - 11.............. 28 (1.5) 34 (0.9) 35 (1.8) 39 (2.3) 32 (1.7) 38 (1.1) 30 (7.9) -- --
12 - 19.............. 30 (2.6) 36 (2.8) 33 (2.3) 42 (2.0) 34 (2.1) 41 (2.7) 27 (5.8) -- -- 20 and over... 36 (1.3) 43 (1.1) 34 (1.1) 45 (1.5) 37 (1.0) 42 (1.5) 13 (1.2) 23 (5.4)
2 and over... 34 (1.2) 41 (0.9) 34 (0.9) 44 (1.1) 36 (0.9) 41 (1.3) 14 (1.2) -- --
Non-Hispanic Asian4:2 - 5.............. 25* (3.1) 26* (4.4) 26* (2.6) 36* (4.2) 24* (2.8) 36* (3.5) 15* (7.9) -- -- 6 - 11.............. 30 (2.1) 29 (4.0) 26 (2.2) 35 (2.1) 28 (2.1) 38 (1.4) 10* (5.8) -- --
12 - 19.............. 30 (1.6) 36 (2.5) 32 (2.3) 38 (3.1) 33 (2.3) 38 (3.6) 5* (1.7) -- -- 20 and over... 37 (1.0) 40 (1.1) 35 (0.7) 43 (1.7) 36 (0.9) 43 (1.4) 11 (2.7) 43 (5.6)
2 and over... 35 (0.8) 38 (1.1) 33 (0.8) 41 (1.6) 35 (0.9) 42 (1.3) 11 (2.6) -- --
Hispanic:2 - 5.............. 24 (2.1) 23 (1.1) 24 (2.6) 29 (2.1) 22 (2.3) 28 (2.1) 16 (3.4) -- -- 6 - 11.............. 28 (2.8) 33 (3.0) 32 (3.3) 36 (3.3) 29 (2.1) 35 (3.1) 33 (7.9) -- --
12 - 19.............. 30 (1.6) 34 (2.2) 31 (1.4) 38 (1.7) 32 (1.6) 37 (1.6) 28 (3.7) -- -- 20 and over... 31 (0.8) 36 (0.7) 29 (0.6) 37 (0.9) 32 (0.8) 37 (1.0) 12 (1.3) 19 (3.0)
2 and over... 30 (0.6) 34 (0.7) 29 (0.7) 37 (0.9) 31 (0.6) 37 (0.8) 13 (1.2) -- --
What We Eat in America, NHANES 2013-2014
Page 5 of 5Page 5 of 5
Symbol Legend
* Indicates an estimate that may be less statistically reliable than estimates that are not flagged. The rules for flagging estimated percentages and ratios are as follows:
Percent reporting: An estimated percentage between 25 and 75 percent is flagged when based on a sample size of less than 30 times the variance inflation factor (VIF), where the VIFrepresents a broadly calculated average design effect, or when the relative standard error is greater than 30 percent. An estimated percentage less than or equal to 25 percent or greater thanor equal to 75 percent is flagged when the smaller of np and n(1-p) is less than 8 times the VIF, where n is the sample size and p is the percentage expressed as a fraction. The VIF used inthis table is 1.98.
Nutrient ratios expressed as percentages: An estimated ratio between 25 and 75 percent is flagged when based on a sample size n* of less than 30 times the variance inflation factor(VIF), where the VIF represents a broadly calculated average design effect and n* is the number of individuals in the sample reporting non-zero intake of the respective nutrient. Anestimated ratio less than or equal to 25 percent or greater than or equal to 75 percent, is flagged when the smaller of n*p and n* (1-p) is less than 8 times the VIF, where p is the percentageexpressed as a fraction. Additionally, an estimated ratio is flagged when either the relative standard error or p/(1-p) times the relative standard error is greater than 30 percent. The VIFused in this table is 1.98.
Footnotes
1 Dinner includes eating occasions designated by the respondent as "dinner", "supper", or the Spanish equivalent "cena." Please note these eating occasions include consumption of beveragesincluding water.
2 Percentages are estimated as a ratio of total nutrients from dinner for all individuals to total daily nutrient intakes for all individuals. Total daily nutrient intakes are available from:www.ars.usda.gov/nea/bhnrc/fsrg. See Table 2. Nutrient Intakes from Food and Beverages: Mean Amounts Consumed per Individual, by Race/Ethnicity and Age, in the United States,2013-2014.
3 The percentage of respondents in the race/ethnicity/age group who reported consuming at least one item at an eating occasion designated as dinner.
4 A new sampling methodology was implemented for NHANES 2011-2012 to oversample non-Hispanic non-black Asians in addition to the ongoing oversample of Hispanics, non-Hispanicblacks, low-income whites/others, and whites/others 80+ years.
Abbreviations
SE = standard error; RAE = retinol activity equivalents; DFE = dietary folate equivalents.
Notes Applicable to All Tables in Series: What We Eat in America, NHANES 2013-2014
Sample weights designed for dietary analysis were used to allow estimates representative of the U. S. population for the years of collection.
The statistics in this table are estimated from Day 1 dietary recall interviews conducted in the What We Eat in America, National Health and Nutrition Examination Survey (NHANES) 2013-2014.The 24-hour dietary recalls were conducted in-person, by trained interviewers, using the USDA 5-step Automated Multiple-Pass Method. Food intakes were coded and nutrient values weredetermined using the USDA Food and Nutrient Database for Dietary Studies 2013-2014 www.ars.usda.gov/nea/bhnrc/fsrg.
Intakes of nutrients and other dietary components are based on the consumption of food and beverages, including water, and do not include intake from supplements or medications.
The table includes data from individuals 2 years and over. Breast-fed children were excluded because breast milk was not quantified in dietary recall interviews.
Although alcohol data are collected for all individuals, estimates are not presented for age groups under 20 years due to extreme variability and/or inadequate sample size.
Suggested Citation
U.S. Department of Agriculture, Agricultural Research Service. 2016. Dinner: Percentages of Selected Nutrients Contributed by Food and Beverages Consumed at Dinner, by Race/Ethnicity andAge, What We Eat in America, NHANES 2013-2014.
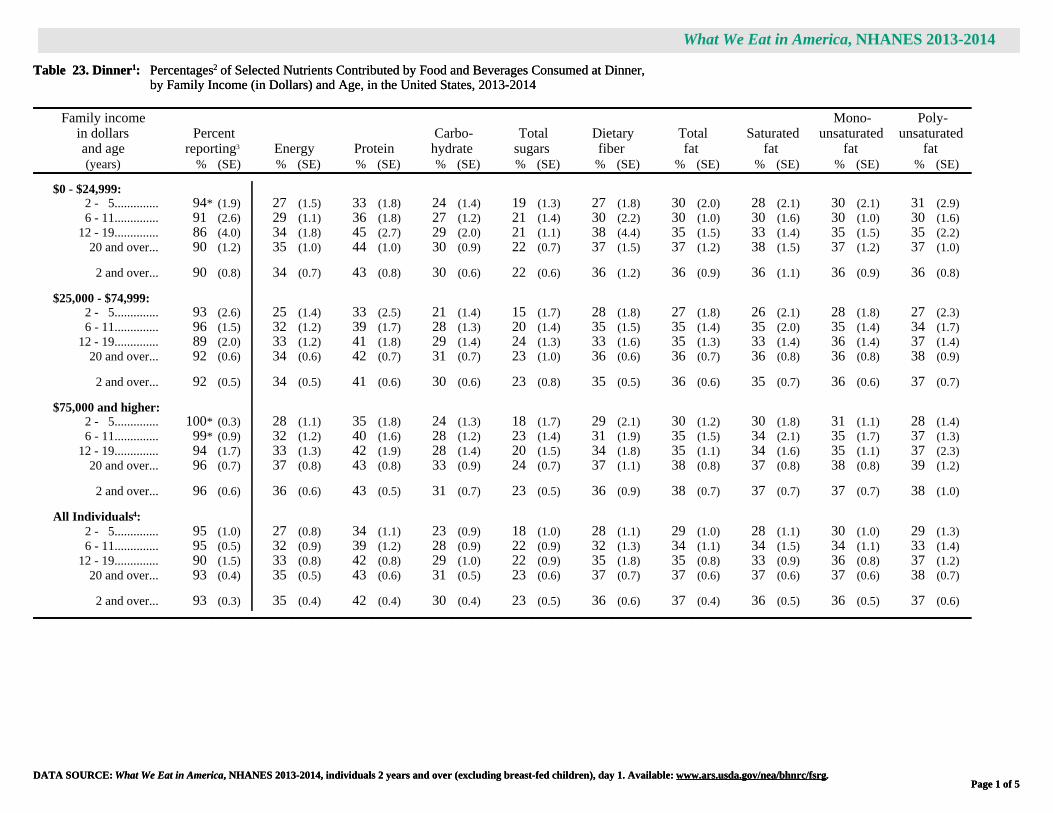
DATA SOURCE: What We Eat in America, NHANES 2013-2014, individuals 2 years and over (excluding breast-fed children), day 1. Available: www.ars.usda.gov/nea/bhnrc/fsrg.Page 1 of 5
What We Eat in America, NHANES 2013-2014
Table 23. Dinner1: Percentages2 of Selected Nutrients Contributed by Food and Beverages Consumed at Dinner,by Family Income (in Dollars) and Age, in the United States, 2013-2014
Family incomein dollarsand age
Percentreporting3 Energy Protein
Carbo-hydrate
Totalsugars
Dietaryfiber
Totalfat
Saturatedfat
Mono-unsaturated
fat
Poly-unsaturated
fat(years) % (SE) % (SE) % (SE) % (SE) % (SE) % (SE) % (SE) % (SE) % (SE) % (SE)
$0 - $24,999:2 - 5.............. 94* (1.9) 27 (1.5) 33 (1.8) 24 (1.4) 19 (1.3) 27 (1.8) 30 (2.0) 28 (2.1) 30 (2.1) 31 (2.9)6 - 11.............. 91 (2.6) 29 (1.1) 36 (1.8) 27 (1.2) 21 (1.4) 30 (2.2) 30 (1.0) 30 (1.6) 30 (1.0) 30 (1.6)
12 - 19.............. 86 (4.0) 34 (1.8) 45 (2.7) 29 (2.0) 21 (1.1) 38 (4.4) 35 (1.5) 33 (1.4) 35 (1.5) 35 (2.2)20 and over... 90 (1.2) 35 (1.0) 44 (1.0) 30 (0.9) 22 (0.7) 37 (1.5) 37 (1.2) 38 (1.5) 37 (1.2) 37 (1.0)
2 and over... 90 (0.8) 34 (0.7) 43 (0.8) 30 (0.6) 22 (0.6) 36 (1.2) 36 (0.9) 36 (1.1) 36 (0.9) 36 (0.8)
$25,000 - $74,999:2 - 5.............. 93 (2.6) 25 (1.4) 33 (2.5) 21 (1.4) 15 (1.7) 28 (1.8) 27 (1.8) 26 (2.1) 28 (1.8) 27 (2.3)6 - 11.............. 96 (1.5) 32 (1.2) 39 (1.7) 28 (1.3) 20 (1.4) 35 (1.5) 35 (1.4) 35 (2.0) 35 (1.4) 34 (1.7)
12 - 19.............. 89 (2.0) 33 (1.2) 41 (1.8) 29 (1.4) 24 (1.3) 33 (1.6) 35 (1.3) 33 (1.4) 36 (1.4) 37 (1.4)20 and over... 92 (0.6) 34 (0.6) 42 (0.7) 31 (0.7) 23 (1.0) 36 (0.6) 36 (0.7) 36 (0.8) 36 (0.8) 38 (0.9)
2 and over... 92 (0.5) 34 (0.5) 41 (0.6) 30 (0.6) 23 (0.8) 35 (0.5) 36 (0.6) 35 (0.7) 36 (0.6) 37 (0.7)
$75,000 and higher:2 - 5.............. 100* (0.3) 28 (1.1) 35 (1.8) 24 (1.3) 18 (1.7) 29 (2.1) 30 (1.2) 30 (1.8) 31 (1.1) 28 (1.4)6 - 11.............. 99* (0.9) 32 (1.2) 40 (1.6) 28 (1.2) 23 (1.4) 31 (1.9) 35 (1.5) 34 (2.1) 35 (1.7) 37 (1.3)
12 - 19.............. 94 (1.7) 33 (1.3) 42 (1.9) 28 (1.4) 20 (1.5) 34 (1.8) 35 (1.1) 34 (1.6) 35 (1.1) 37 (2.3)20 and over... 96 (0.7) 37 (0.8) 43 (0.8) 33 (0.9) 24 (0.7) 37 (1.1) 38 (0.8) 37 (0.8) 38 (0.8) 39 (1.2)
2 and over... 96 (0.6) 36 (0.6) 43 (0.5) 31 (0.7) 23 (0.5) 36 (0.9) 38 (0.7) 37 (0.7) 37 (0.7) 38 (1.0)
All Individuals4:2 - 5.............. 95 (1.0) 27 (0.8) 34 (1.1) 23 (0.9) 18 (1.0) 28 (1.1) 29 (1.0) 28 (1.1) 30 (1.0) 29 (1.3)6 - 11.............. 95 (0.5) 32 (0.9) 39 (1.2) 28 (0.9) 22 (0.9) 32 (1.3) 34 (1.1) 34 (1.5) 34 (1.1) 33 (1.4)
12 - 19.............. 90 (1.5) 33 (0.8) 42 (0.8) 29 (1.0) 22 (0.9) 35 (1.8) 35 (0.8) 33 (0.9) 36 (0.8) 37 (1.2)20 and over... 93 (0.4) 35 (0.5) 43 (0.6) 31 (0.5) 23 (0.6) 37 (0.7) 37 (0.6) 37 (0.6) 37 (0.6) 38 (0.7)
2 and over... 93 (0.3) 35 (0.4) 42 (0.4) 30 (0.4) 23 (0.5) 36 (0.6) 37 (0.4) 36 (0.5) 36 (0.5) 37 (0.6)

DATA SOURCE: What We Eat in America, NHANES 2013-2014, individuals 2 years and over (excluding breast-fed children), day 1. Available: www.ars.usda.gov/nea/bhnrc/fsrg.Page 2 of 5
What We Eat in America, NHANES 2013-2014
Table 23. Dinner1: Percentages2 of Selected Nutrients Contributed by Food and Beverages Consumed at Dinner,by Family Income (in Dollars) and Age, in the United States, 2013-2014 (continued)
Family incomein dollarsand age
Choles-terol
Vitamin A(RAE)
Beta-carotene Lycopene Thiamin
Ribo-flavin Niacin Vitamin B6
Folate(DFE)
(years) % (SE) % (SE) % (SE) % (SE) % (SE) % (SE) % (SE) % (SE) % (SE)
$0 - $24,999:2 - 5.............. 30 (3.4) 23 (3.0) 43 (8.6) 35 (7.9) 26 (2.0) 22 (1.1) 31 (2.2) 28 (2.2) 25 (2.0)6 - 11.............. 35 (1.7) 21 (2.3) 41 (7.9) 51 (5.2) 28 (2.1) 22 (1.4) 33 (1.8) 29 (2.0) 28 (2.0)
12 - 19.............. 41 (2.8) 30 (2.6) 51 (7.1) 53 (8.1) 35 (2.4) 29 (1.6) 41 (2.4) 39 (2.7) 33 (2.7)20 and over... 39 (1.5) 33 (1.7) 48 (4.4) 57 (3.8) 37 (1.3) 30 (1.3) 38 (0.9) 35 (1.3) 35 (1.3)
2 and over... 38 (1.3) 32 (1.3) 48 (3.9) 55 (3.5) 35 (0.9) 29 (1.0) 38 (0.9) 35 (1.1) 34 (0.8)
$25,000 - $74,999:2 - 5.............. 32 (4.4) 20 (1.7) 28 (2.9) 51 (3.9) 27 (1.4) 21 (1.8) 29 (1.4) 26 (2.4) 24 (2.0)6 - 11.............. 34 (1.8) 25 (2.0) 28 (4.8) 51 (5.7) 33 (1.9) 25 (1.5) 37 (2.3) 31 (2.6) 31 (1.7)
12 - 19.............. 37 (2.1) 25 (1.6) 43 (3.5) 54 (6.8) 31 (2.5) 25 (1.4) 36 (1.8) 32 (2.3) 28 (2.8)20 and over... 36 (0.9) 32 (1.0) 49 (2.4) 52 (2.2) 36 (0.8) 28 (0.9) 38 (0.9) 36 (1.1) 33 (1.0)
2 and over... 36 (0.8) 30 (0.8) 47 (2.2) 52 (1.7) 35 (0.7) 27 (0.8) 38 (0.8) 35 (1.1) 32 (0.9)
$75,000 and higher:2 - 5.............. 32 (2.8) 21 (1.8) 33 (4.8) 63 (7.2) 26 (1.6) 23 (1.5) 32 (1.5) 27 (1.2) 24 (1.7)6 - 11.............. 37 (4.1) 30 (2.1) 47 (8.0) 67 (5.3) 34 (2.5) 28 (1.8) 35 (1.7) 32 (1.8) 31 (2.5)
12 - 19.............. 41 (2.3) 27 (2.6) 44 (7.7) 54 (13.4) 30 (2.1) 26 (1.8) 37 (3.0) 33 (3.4) 29 (2.3)20 and over... 41 (1.1) 36 (1.6) 54 (2.9) 60 (3.2) 37 (0.7) 29 (1.1) 41 (0.8) 38 (0.9) 34 (1.0)
2 and over... 41 (0.8) 34 (1.4) 52 (2.5) 60 (2.8) 35 (0.7) 28 (0.8) 40 (0.7) 36 (0.9) 33 (1.0)
All Individuals4:2 - 5.............. 31 (1.8) 21 (1.0) 33 (3.5) 50 (4.7) 26 (1.1) 22 (0.7) 31 (1.2) 27 (1.0) 24 (1.3)6 - 11.............. 35 (2.0) 26 (1.3) 40 (5.1) 56 (4.3) 32 (1.4) 25 (1.0) 35 (1.3) 31 (1.2) 30 (1.3)
12 - 19.............. 40 (1.3) 27 (1.2) 46 (3.3) 53 (4.9) 31 (1.3) 26 (0.9) 37 (1.3) 34 (1.5) 30 (1.6)20 and over... 38 (0.8) 34 (0.9) 51 (1.8) 56 (2.0) 36 (0.6) 29 (0.7) 39 (0.6) 36 (0.7) 34 (0.5)
2 and over... 38 (0.6) 32 (0.8) 50 (1.6) 56 (1.8) 35 (0.5) 28 (0.5) 39 (0.5) 35 (0.6) 33 (0.5)

DATA SOURCE: What We Eat in America, NHANES 2013-2014, individuals 2 years and over (excluding breast-fed children), day 1. Available: www.ars.usda.gov/nea/bhnrc/fsrg.Page 3 of 5
What We Eat in America, NHANES 2013-2014
Table 23. Dinner1: Percentages2 of Selected Nutrients Contributed by Food and Beverages Consumed at Dinner,by Family Income (in Dollars) and Age, in the United States, 2013-2014 (continued)
Family incomein dollarsand age Choline Vitamin B12 Vitamin C Vitamin D
Vitamin E(alpha-
tocopherol) Vitamin K Calcium Phosphorus Magnesium(years) % (SE) % (SE) % (SE) % (SE) % (SE) % (SE) % (SE) % (SE) % (SE)
$0 - $24,999:2 - 5.............. 29 (2.1) 25 (2.4) 23 (2.7) 20 (4.3) 30 (3.3) 45 (5.7) 21 (2.1) 27 (1.6) 25 (1.3)6 - 11.............. 31 (1.4) 26 (1.8) 22 (2.1) 14 (2.4) 30 (2.0) 39 (5.0) 22 (1.9) 28 (1.6) 27 (1.4)
12 - 19.............. 40 (2.4) 30 (1.8) 28 (2.5) 24 (2.2) 35 (2.4) 46 (3.8) 29 (1.9) 37 (2.0) 35 (2.4)20 and over... 37 (1.0) 36 (1.9) 27 (2.0) 30 (2.2) 34 (1.3) 49 (2.9) 32 (1.6) 38 (1.2) 32 (1.1)
2 and over... 37 (1.0) 34 (1.4) 26 (1.5) 27 (1.7) 34 (1.0) 48 (2.4) 30 (1.2) 36 (0.9) 32 (0.8)
$25,000 - $74,999:2 - 5.............. 29 (2.7) 23 (3.6) 21 (3.0) 19 (4.0) 25 (2.4) 42 (2.5) 20 (1.9) 26 (2.2) 26 (1.9)6 - 11.............. 31 (1.9) 29 (2.6) 25 (3.0) 16 (2.0) 31 (1.5) 38 (2.6) 25 (1.3) 32 (1.1) 31 (1.0)
12 - 19.............. 35 (1.7) 26 (2.6) 24 (3.2) 19 (2.3) 32 (1.6) 49 (5.1) 27 (1.7) 34 (1.4) 32 (1.6)20 and over... 36 (0.7) 33 (1.4) 31 (1.5) 27 (1.9) 33 (1.3) 47 (2.2) 28 (0.8) 35 (0.6) 31 (0.5)
2 and over... 35 (0.6) 32 (1.2) 30 (1.3) 24 (1.4) 32 (1.1) 46 (1.8) 28 (0.6) 34 (0.5) 31 (0.5)
$75,000 and higher:2 - 5.............. 29 (1.6) 22 (1.6) 20 (3.4) 17 (2.1) 27 (2.8) 36 (3.0) 23 (2.1) 29 (1.5) 28 (1.3)6 - 11.............. 34 (2.6) 30 (2.2) 21 (3.1) 26 (2.4) 32 (1.9) 46 (10.0) 30 (1.9) 33 (1.4) 30 (1.2)
12 - 19.............. 37 (2.1) 27 (2.2) 25 (3.3) 20 (3.4) 35 (2.1) 52 (3.4) 26 (2.2) 34 (1.4) 31 (1.3)20 and over... 40 (1.0) 39 (1.9) 33 (1.7) 35 (2.8) 35 (1.3) 51 (1.5) 30 (1.0) 37 (0.8) 33 (0.8)
2 and over... 39 (0.7) 36 (1.4) 31 (1.7) 32 (2.1) 35 (1.0) 51 (1.4) 29 (0.9) 36 (0.6) 32 (0.6)
All Individuals4:2 - 5.............. 29 (1.0) 23 (1.3) 22 (2.5) 18 (1.8) 27 (1.3) 41 (2.0) 21 (1.1) 27 (0.9) 26 (1.0)6 - 11.............. 32 (1.4) 29 (1.1) 23 (1.8) 20 (1.4) 31 (1.3) 40 (4.8) 27 (1.3) 32 (1.0) 30 (1.0)
12 - 19.............. 38 (1.1) 27 (1.4) 26 (2.3) 20 (2.0) 34 (1.1) 49 (2.6) 27 (1.2) 35 (0.9) 32 (1.1)20 and over... 38 (0.6) 36 (1.2) 31 (1.0) 31 (1.5) 34 (0.9) 49 (1.3) 30 (0.7) 37 (0.6) 32 (0.5)
2 and over... 37 (0.4) 34 (0.9) 29 (0.9) 28 (1.0) 34 (0.7) 49 (1.2) 29 (0.6) 36 (0.5) 31 (0.4)

DATA SOURCE: What We Eat in America, NHANES 2013-2014, individuals 2 years and over (excluding breast-fed children), day 1. Available: www.ars.usda.gov/nea/bhnrc/fsrg.Page 4 of 5
What We Eat in America, NHANES 2013-2014
Table 23. Dinner1: Percentages2 of Selected Nutrients Contributed by Food and Beverages Consumed at Dinner,by Family Income (in Dollars) and Age, in the United States, 2013-2014 (continued)
Family incomein dollarsand age Iron Zinc Copper Selenium Potassium Sodium Caffeine Alcohol(years) % (SE) % (SE) % (SE) % (SE) % (SE) % (SE) % (SE) % (SE)
$0 - $24,999:2 - 5.............. 25 (1.7) 28 (1.6) 27 (1.8) 34 (2.1) 26 (1.8) 33 (1.9) 22 (5.4) -- -- 6 - 11.............. 27 (1.6) 31 (1.8) 30 (1.6) 37 (2.0) 27 (1.2) 35 (1.1) 29 (5.4) -- --
12 - 19.............. 33 (2.7) 38 (1.9) 34 (2.7) 43 (2.8) 38 (2.8) 41 (2.3) 19 (3.2) -- -- 20 and over... 34 (1.3) 39 (1.4) 32 (1.0) 44 (1.1) 35 (1.0) 42 (0.9) 9 (1.3) 26 (2.2)
2 and over... 33 (0.9) 38 (1.1) 32 (0.8) 43 (0.8) 34 (0.9) 41 (0.8) 10 (1.3) -- --
$25,000 - $74,999:2 - 5.............. 24 (1.5) 27 (1.9) 29 (2.7) 35 (1.9) 25 (1.6) 33 (1.9) 15* (4.9) -- -- 6 - 11.............. 29 (1.5) 34 (2.1) 34 (2.4) 40 (1.8) 31 (1.5) 39 (1.6) 28 (4.9) -- --
12 - 19.............. 28 (2.3) 34 (2.8) 33 (1.4) 42 (1.7) 34 (1.6) 39 (1.5) 23 (4.1) -- -- 20 and over... 33 (0.7) 38 (0.9) 31 (0.7) 42 (0.7) 35 (0.6) 42 (0.7) 10 (0.8) 28 (3.9)
2 and over... 32 (0.6) 37 (0.7) 32 (0.6) 42 (0.6) 35 (0.6) 41 (0.6) 11 (0.8) -- --
$75,000 and higher:2 - 5.............. 24 (1.5) 28 (2.3) 28 (1.5) 36 (1.8) 28 (1.0) 36 (1.7) 24 (5.4) -- -- 6 - 11.............. 28 (1.9) 35 (1.5) 29 (1.9) 42 (1.9) 32 (1.4) 40 (1.7) 26 (5.3) -- --
12 - 19.............. 28 (1.7) 37 (1.9) 33 (1.3) 44 (2.0) 34 (2.1) 41 (1.6) 21 (3.6) -- -- 20 and over... 35 (0.8) 39 (1.0) 34 (1.1) 45 (0.9) 36 (0.8) 45 (0.9) 7 (0.7) 39 (5.5)
2 and over... 33 (0.7) 38 (0.7) 33 (0.8) 44 (0.6) 35 (0.6) 44 (0.8) 8 (0.6) -- --
All Individuals4:2 - 5.............. 24 (0.9) 27 (0.9) 28 (1.3) 35 (1.2) 26 (0.8) 34 (0.9) 23 (4.2) -- -- 6 - 11.............. 28 (1.1) 34 (1.0) 31 (1.1) 40 (1.4) 31 (1.1) 39 (1.1) 28 (3.3) -- --
12 - 19.............. 30 (1.4) 36 (1.7) 33 (0.9) 43 (0.8) 35 (1.2) 40 (0.9) 21 (2.5) -- -- 20 and over... 34 (0.5) 39 (0.6) 32 (0.6) 44 (0.6) 36 (0.5) 43 (0.6) 9 (0.7) 32 (2.9)
2 and over... 33 (0.4) 38 (0.4) 32 (0.5) 43 (0.5) 35 (0.3) 42 (0.4) 9 (0.7) -- --

What We Eat in America, NHANES 2013-2014
Page 5 of 5Page 5 of 5
Symbol Legend
* Indicates an estimate that may be less statistically reliable than estimates that are not flagged. The rules for flagging estimated percentages and ratios are as follows:
Percent reporting: An estimated percentage between 25 and 75 percent is flagged when based on a sample size of less than 30 times the variance inflation factor (VIF), where the VIFrepresents a broadly calculated average design effect, or when the relative standard error is greater than 30 percent. An estimated percentage less than or equal to 25 percent or greater thanor equal to 75 percent is flagged when the smaller of np and n(1-p) is less than 8 times the VIF, where n is the sample size and p is the percentage expressed as a fraction. The VIF used inthis table is 1.98.
Nutrient ratios expressed as percentages: An estimated ratio between 25 and 75 percent is flagged when based on a sample size n* of less than 30 times the variance inflation factor(VIF), where the VIF represents a broadly calculated average design effect and n* is the number of individuals in the sample reporting non-zero intake of the respective nutrient. Anestimated ratio less than or equal to 25 percent or greater than or equal to 75 percent, is flagged when the smaller of n*p and n* (1-p) is less than 8 times the VIF, where p is the percentageexpressed as a fraction. Additionally, an estimated ratio is flagged when either the relative standard error or p/(1-p) times the relative standard error is greater than 30 percent. The VIFused in this table is 1.98.
Footnotes
1 Dinner includes eating occasions designated by the respondent as "dinner", "supper", or the Spanish equivalent "cena." Please note these eating occasions include consumption of beveragesincluding water.
2 Percentages are estimated as a ratio of total nutrients from dinner for all individuals to total daily nutrient intakes for all individuals. Total daily nutrient intakes are available from:www.ars.usda.gov/nea/bhnrc/fsrg. See Table 3. Nutrient Intakes from Food and Beverages: Mean Amounts Consumed per Individual, by Family Income (in Dollars) and Age, in the UnitedStates, 2013-2014.
3 The percentage of respondents in the income/age group who reported consuming at least one item at an eating occasion designated as dinner.
4 Includes persons of all income levels or with unknown family income.
Abbreviations
SE = standard error; RAE = retinol activity equivalents; DFE = dietary folate equivalents.
Notes Applicable to All Tables in Series: What We Eat in America, NHANES 2013-2014
Sample weights designed for dietary analysis were used to allow estimates representative of the U. S. population for the years of collection.
The statistics in this table are estimated from Day 1 dietary recall interviews conducted in the What We Eat in America, National Health and Nutrition Examination Survey (NHANES) 2013-2014.The 24-hour dietary recalls were conducted in-person, by trained interviewers, using the USDA 5-step Automated Multiple-Pass Method. Food intakes were coded and nutrient values weredetermined using the USDA Food and Nutrient Database for Dietary Studies 2013-2014 www.ars.usda.gov/nea/bhnrc/fsrg.
Intakes of nutrients and other dietary components are based on the consumption of food and beverages, including water, and do not include intake from supplements or medications.
The table includes data from individuals 2 years and over. Breast-fed children were excluded because breast milk was not quantified in dietary recall interviews.
Although alcohol data are collected for all individuals, estimates are not presented for age groups under 20 years due to extreme variability and/or inadequate sample size.
Suggested Citation
U.S. Department of Agriculture, Agricultural Research Service. 2016. Dinner: Percentages of Selected Nutrients Contributed by Food and Beverages Consumed at Dinner, by Family Income (inDollars) and Age, What We Eat in America, NHANES 2013-2014.

DATA SOURCE: What We Eat in America, NHANES 2013-2014, individuals 2 years and over (excluding breast-fed children), day 1. Available: www.ars.usda.gov/nea/bhnrc/fsrg.Page 1 of 5
What We Eat in America, NHANES 2013-2014
Table 24. Dinner1: Percentages2 of Selected Nutrients Contributed by Food and Beverages Consumed at Dinner,by Family Income (as % of Poverty Level3) and Age, in the United States, 2013-2014
Family income as% of poverty level
and age Percent
reporting4 Energy Protein Carbo-hydrate
Totalsugars
Dietaryfiber
Totalfat
Saturatedfat
Mono-unsaturated
fat
Poly-unsaturated
fat(years) % (SE) % (SE) % (SE) % (SE) % (SE) % (SE) % (SE) % (SE) % (SE) % (SE)
Under 131% poverty:2 - 5.............. 93 (2.0) 26 (1.3) 32 (1.5) 24 (1.3) 18 (1.1) 27 (1.5) 28 (1.8) 27 (1.6) 29 (1.9) 29 (2.7)6 - 11.............. 94 (0.9) 32 (1.2) 38 (1.5) 28 (0.9) 22 (0.9) 33 (1.8) 33 (1.8) 34 (2.7) 33 (1.4) 31 (1.9)
12 - 19.............. 86 (3.0) 33 (1.1) 43 (1.9) 29 (1.2) 22 (1.3) 36 (2.8) 35 (1.0) 34 (0.9) 35 (1.1) 34 (1.7)20 and over... 90 (1.0) 34 (0.9) 44 (1.1) 30 (0.8) 22 (0.6) 37 (1.5) 37 (1.1) 38 (1.4) 37 (1.1) 37 (1.0)
2 and over... 90 (0.5) 33 (0.8) 42 (1.0) 29 (0.6) 22 (0.4) 36 (1.1) 36 (1.0) 36 (1.2) 36 (1.0) 35 (0.9)
131-350% poverty:2 - 5.............. 95* (2.5) 27 (1.5) 36 (2.5) 22 (1.4) 16 (2.1) 30 (2.2) 30 (2.3) 30 (3.3) 30 (2.0) 29 (2.1)6 - 11.............. 96* (1.6) 31 (2.1) 37 (1.9) 28 (2.2) 21 (2.3) 34 (2.3) 34 (2.3) 33 (2.7) 35 (2.3) 34 (2.4)
12 - 19.............. 90 (2.4) 33 (2.3) 42 (2.8) 29 (2.4) 23 (2.5) 34 (2.7) 36 (2.0) 33 (2.1) 36 (1.6) 37 (2.9)20 and over... 93 (0.8) 35 (0.8) 43 (1.1) 31 (0.8) 23 (1.0) 36 (1.0) 37 (0.9) 36 (0.9) 36 (0.9) 38 (1.2)
2 and over... 93 (0.6) 34 (0.6) 42 (0.9) 30 (0.8) 23 (1.0) 36 (0.9) 36 (0.6) 35 (0.6) 36 (0.6) 37 (0.8)
Over 350% poverty:2 - 5.............. 100* (0.2) 26 (1.3) 34 (2.1) 23 (1.6) 17 (2.4) 27 (2.2) 28 (1.3) 27 (1.4) 30 (1.3) 27 (1.6)6 - 11.............. 100* (0.2) 32 (1.1) 41 (1.6) 28 (1.2) 23 (0.9) 29 (2.4) 35 (1.6) 34 (2.3) 35 (1.4) 38 (1.6)
12 - 19.............. 94* (2.3) 32 (1.5) 42 (2.4) 27 (1.4) 19 (1.3) 34 (1.6) 36 (1.9) 34 (2.1) 35 (2.0) 38 (1.9)20 and over... 96 (0.8) 36 (0.8) 42 (0.8) 33 (0.8) 24 (0.8) 37 (1.1) 38 (0.7) 37 (0.7) 38 (0.7) 39 (1.0)
2 and over... 96 (0.7) 36 (0.7) 42 (0.8) 31 (0.7) 23 (0.7) 36 (0.9) 37 (0.6) 36 (0.7) 37 (0.6) 39 (1.0)
All Individuals5:2 - 5.............. 95 (1.0) 27 (0.8) 34 (1.1) 23 (0.9) 18 (1.0) 28 (1.1) 29 (1.0) 28 (1.1) 30 (1.0) 29 (1.3)6 - 11.............. 95 (0.5) 32 (0.9) 39 (1.2) 28 (0.9) 22 (0.9) 32 (1.3) 34 (1.1) 34 (1.5) 34 (1.1) 33 (1.4)
12 - 19.............. 90 (1.5) 33 (0.8) 42 (0.8) 29 (1.0) 22 (0.9) 35 (1.8) 35 (0.8) 33 (0.9) 36 (0.8) 37 (1.2)20 and over... 93 (0.4) 35 (0.5) 43 (0.6) 31 (0.5) 23 (0.6) 37 (0.7) 37 (0.6) 37 (0.6) 37 (0.6) 38 (0.7)
2 and over... 93 (0.3) 35 (0.4) 42 (0.4) 30 (0.4) 23 (0.5) 36 (0.6) 37 (0.4) 36 (0.5) 36 (0.5) 37 (0.6)

DATA SOURCE: What We Eat in America, NHANES 2013-2014, individuals 2 years and over (excluding breast-fed children), day 1. Available: www.ars.usda.gov/nea/bhnrc/fsrg.Page 2 of 5
What We Eat in America, NHANES 2013-2014
Table 24. Dinner1: Percentages2 of Selected Nutrients Contributed by Food and Beverages Consumed at Dinner,by Family Income (as % of Poverty Level3) and Age, in the United States, 2013-2014 (continued)
Family income as% of poverty level
and age Choles-
terol Vitamin A
(RAE) Beta-
carotene Lycopene Thiamin Ribo-flavin Niacin Vitamin B6
Folate(DFE)
(years) % (SE) % (SE) % (SE) % (SE) % (SE) % (SE) % (SE) % (SE) % (SE)
Under 131% poverty:2 - 5.............. 29 (2.8) 21 (2.0) 40 (6.1) 39 (7.2) 26 (1.7) 21 (0.8) 30 (2.0) 27 (1.8) 24 (1.8)6 - 11.............. 37 (1.7) 25 (1.9) 38 (6.3) 55 (4.6) 31 (1.5) 24 (1.0) 36 (1.5) 31 (1.8) 29 (1.5)
12 - 19.............. 38 (1.8) 27 (1.8) 46 (5.6) 50 (6.1) 34 (1.4) 28 (0.8) 39 (1.7) 36 (2.0) 32 (1.5)20 and over... 38 (1.5) 34 (1.4) 51 (3.3) 55 (4.0) 37 (1.2) 29 (1.0) 38 (1.1) 35 (1.4) 35 (1.4)
2 and over... 38 (1.2) 31 (1.0) 49 (2.8) 53 (3.6) 35 (0.9) 28 (0.8) 38 (1.0) 34 (1.2) 33 (1.0)
131-350% poverty:2 - 5.............. 35 (4.7) 23 (1.8) 27 (4.8) 56 (5.7) 28 (1.2) 23 (1.6) 31 (1.4) 28 (1.9) 26 (1.8)6 - 11.............. 32 (3.3) 24 (1.9) 36 (5.1) 56 (8.5) 33 (2.4) 25 (1.9) 36 (2.0) 29 (2.1) 32 (2.5)
12 - 19.............. 39 (3.6) 26 (1.9) 42 (6.0) 59 (5.9) 31 (3.0) 26 (2.0) 36 (3.3) 32 (3.7) 28 (3.4)20 and over... 37 (0.8) 32 (1.0) 47 (2.5) 53 (1.9) 36 (0.9) 30 (1.1) 39 (1.4) 37 (1.4) 33 (1.0)
2 and over... 37 (0.5) 30 (0.9) 46 (2.2) 54 (1.6) 35 (0.7) 29 (0.9) 38 (1.1) 35 (1.2) 32 (0.8)
Over 350% poverty:2 - 5.............. 31 (4.8) 19 (1.5) 33 (6.3) 61 (11.5) 25 (2.0) 23 (1.8) 31 (2.0) 26 (1.5) 23 (1.9)6 - 11.............. 37 (4.8) 30 (1.6) 44 (9.5) 62 (3.7) 33 (2.8) 28 (1.5) 35 (1.8) 33 (2.1) 30 (2.8)
12 - 19.............. 43 (3.6) 28 (3.6) 49 (8.6) 46*(14.8) 29 (2.3) 25 (1.9) 37 (2.3) 33 (2.7) 29 (3.0)20 and over... 40 (1.1) 35 (1.5) 53 (2.9) 59 (3.4) 36 (1.0) 28 (1.0) 40 (0.9) 37 (1.1) 34 (1.1)
2 and over... 40 (1.0) 33 (1.4) 52 (2.5) 58 (3.0) 35 (0.9) 28 (0.9) 39 (0.8) 36 (1.0) 33 (1.1)
All Individuals5:2 - 5.............. 31 (1.8) 21 (1.0) 33 (3.5) 50 (4.7) 26 (1.1) 22 (0.7) 31 (1.2) 27 (1.0) 24 (1.3)6 - 11.............. 35 (2.0) 26 (1.3) 40 (5.1) 56 (4.3) 32 (1.4) 25 (1.0) 35 (1.3) 31 (1.2) 30 (1.3)
12 - 19.............. 40 (1.3) 27 (1.2) 46 (3.3) 53 (4.9) 31 (1.3) 26 (0.9) 37 (1.3) 34 (1.5) 30 (1.6)20 and over... 38 (0.8) 34 (0.9) 51 (1.8) 56 (2.0) 36 (0.6) 29 (0.7) 39 (0.6) 36 (0.7) 34 (0.5)
2 and over... 38 (0.6) 32 (0.8) 50 (1.6) 56 (1.8) 35 (0.5) 28 (0.5) 39 (0.5) 35 (0.6) 33 (0.5)

DATA SOURCE: What We Eat in America, NHANES 2013-2014, individuals 2 years and over (excluding breast-fed children), day 1. Available: www.ars.usda.gov/nea/bhnrc/fsrg.Page 3 of 5
What We Eat in America, NHANES 2013-2014
Table 24. Dinner1: Percentages2 of Selected Nutrients Contributed by Food and Beverages Consumed at Dinner,by Family Income (as % of Poverty Level3) and Age, in the United States, 2013-2014 (continued)
Family income as% of poverty level
and age Choline Vitamin B12 Vitamin C Vitamin D
Vitamin E(alpha-
tocopherol) Vitamin K Calcium Phosphorus Magnesium(years) % (SE) % (SE) % (SE) % (SE) % (SE) % (SE) % (SE) % (SE) % (SE)
Under 131% poverty:2 - 5.............. 28 (1.7) 23 (1.8) 24 (2.7) 18 (3.4) 28 (2.7) 43 (5.0) 20 (1.4) 25 (1.3) 24 (1.2)6 - 11.............. 33 (1.3) 29 (2.5) 25 (2.0) 15 (1.5) 31 (1.4) 41 (3.4) 24 (1.9) 31 (1.3) 30 (1.2)
12 - 19.............. 37 (1.4) 28 (1.1) 26 (2.6) 22 (2.0) 33 (2.0) 45 (3.1) 28 (1.1) 36 (1.3) 34 (1.6)20 and over... 37 (1.0) 36 (1.6) 27 (1.9) 29 (2.2) 34 (1.2) 47 (2.9) 31 (1.3) 37 (1.0) 32 (0.9)
2 and over... 36 (0.8) 33 (1.1) 26 (1.3) 26 (1.5) 34 (1.1) 46 (2.4) 29 (1.0) 36 (0.8) 31 (0.8)
131-350% poverty:2 - 5.............. 31 (2.8) 26 (3.7) 19 (2.6) 23 (4.3) 28 (2.4) 42 (2.2) 23 (2.2) 29 (2.0) 28 (2.0)6 - 11.............. 30 (2.2) 28 (2.2) 24 (2.6) 17 (2.0) 31 (2.8) 39 (2.3) 26 (1.5) 32 (1.7) 30 (1.6)
12 - 19.............. 37 (3.3) 26 (2.5) 24 (3.9) 21 (2.8) 34 (2.2) 51 (5.0) 28 (2.0) 35 (2.4) 33 (2.4)20 and over... 37 (0.9) 36 (2.2) 30 (1.2) 31 (4.0) 33 (1.5) 47 (2.3) 30 (0.9) 37 (0.9) 32 (0.7)
2 and over... 36 (0.7) 34 (1.6) 29 (0.9) 28 (3.0) 33 (1.2) 47 (1.8) 29 (0.7) 36 (0.6) 32 (0.6)
Over 350% poverty:2 - 5.............. 28 (2.4) 22 (1.8) 19 (3.9) 16 (1.8) 24 (3.0) 37 (3.4) 22 (1.9) 28 (1.4) 26 (1.3)6 - 11.............. 34 (2.6) 30 (1.6) 20 (3.5) 27 (1.9) 31 (1.7) 46 (12.4) 30 (2.1) 33 (1.3) 30 (1.4)
12 - 19.............. 38 (2.9) 28 (2.9) 26 (3.0) 18 (3.2) 34 (1.7) 52 (3.3) 25 (2.1) 33 (2.2) 30 (1.3)20 and over... 39 (1.2) 36 (1.7) 33 (1.6) 31 (2.9) 35 (1.0) 51 (1.8) 29 (0.8) 36 (0.8) 32 (0.7)
2 and over... 38 (1.1) 35 (1.4) 31 (1.6) 29 (2.2) 35 (0.8) 51 (1.8) 29 (0.8) 35 (0.8) 31 (0.6)
All Individuals5:2 - 5.............. 29 (1.0) 23 (1.3) 22 (2.5) 18 (1.8) 27 (1.3) 41 (2.0) 21 (1.1) 27 (0.9) 26 (1.0)6 - 11.............. 32 (1.4) 29 (1.1) 23 (1.8) 20 (1.4) 31 (1.3) 40 (4.8) 27 (1.3) 32 (1.0) 30 (1.0)
12 - 19.............. 38 (1.1) 27 (1.4) 26 (2.3) 20 (2.0) 34 (1.1) 49 (2.6) 27 (1.2) 35 (0.9) 32 (1.1)20 and over... 38 (0.6) 36 (1.2) 31 (1.0) 31 (1.5) 34 (0.9) 49 (1.3) 30 (0.7) 37 (0.6) 32 (0.5)
2 and over... 37 (0.4) 34 (0.9) 29 (0.9) 28 (1.0) 34 (0.7) 49 (1.2) 29 (0.6) 36 (0.5) 31 (0.4)

DATA SOURCE: What We Eat in America, NHANES 2013-2014, individuals 2 years and over (excluding breast-fed children), day 1. Available: www.ars.usda.gov/nea/bhnrc/fsrg.Page 4 of 5
What We Eat in America, NHANES 2013-2014
Table 24. Dinner1: Percentages2 of Selected Nutrients Contributed by Food and Beverages Consumed at Dinner,by Family Income (as % of Poverty Level3) and Age, in the United States, 2013-2014 (continued)
Family income as% of poverty level
and age Iron Zinc Copper Selenium Potassium Sodium Caffeine Alcohol(years) % (SE) % (SE) % (SE) % (SE) % (SE) % (SE) % (SE) % (SE)
Under 131% poverty:2 - 5.............. 24 (1.5) 26 (1.0) 27 (1.6) 34 (1.8) 25 (1.6) 32 (1.7) 20 (4.4) -- -- 6 - 11.............. 28 (1.4) 33 (1.5) 34 (2.0) 40 (1.8) 30 (1.2) 37 (1.1) 30 (5.6) -- --
12 - 19.............. 32 (1.4) 37 (0.9) 33 (1.5) 42 (1.8) 36 (1.8) 40 (1.6) 22 (3.1) -- -- 20 and over... 35 (1.5) 40 (1.3) 33 (0.9) 44 (1.3) 35 (1.0) 42 (1.1) 9 (1.3) 22 (4.5)
2 and over... 33 (1.0) 38 (1.0) 33 (0.7) 43 (1.0) 34 (0.8) 41 (0.9) 10 (1.3) -- --
131-350% poverty:2 - 5.............. 26 (1.3) 29 (1.7) 31 (2.6) 38 (1.8) 27 (1.5) 35 (1.6) 21* (6.7) -- -- 6 - 11.............. 29 (2.1) 34 (2.3) 31 (2.3) 39 (2.7) 31 (1.8) 39 (2.1) 32 (4.6) -- --
12 - 19.............. 28 (3.1) 34 (3.3) 34 (2.0) 43 (2.5) 34 (2.5) 40 (1.9) 21 (4.9) -- -- 20 and over... 33 (0.9) 38 (1.0) 31 (1.0) 43 (1.0) 36 (0.8) 43 (1.0) 11 (1.2) 31 (4.3)
2 and over... 32 (0.7) 37 (0.6) 32 (0.9) 42 (0.8) 35 (0.7) 42 (0.7) 12 (1.2) -- --
Over 350% poverty:2 - 5.............. 23 (1.7) 27 (2.9) 27 (1.6) 34 (2.2) 27 (1.1) 35 (1.9) 18* (6.0) -- -- 6 - 11.............. 27 (2.0) 35 (1.1) 29 (2.0) 42 (2.2) 32 (1.3) 40 (1.7) 21 (5.2) -- --
12 - 19.............. 29 (1.6) 38 (2.3) 33 (1.7) 43 (2.8) 34 (1.8) 41 (1.7) 19* (5.9) -- -- 20 and over... 35 (0.9) 38 (1.0) 33 (0.9) 44 (0.8) 36 (0.7) 44 (0.9) 6 (0.5) 36 (5.0)
2 and over... 33 (0.8) 38 (0.9) 33 (0.8) 44 (0.8) 35 (0.7) 43 (0.8) 7 (0.5) -- --
All Individuals5:2 - 5.............. 24 (0.9) 27 (0.9) 28 (1.3) 35 (1.2) 26 (0.8) 34 (0.9) 23 (4.2) -- -- 6 - 11.............. 28 (1.1) 34 (1.0) 31 (1.1) 40 (1.4) 31 (1.1) 39 (1.1) 28 (3.3) -- --
12 - 19.............. 30 (1.4) 36 (1.7) 33 (0.9) 43 (0.8) 35 (1.2) 40 (0.9) 21 (2.5) -- -- 20 and over... 34 (0.5) 39 (0.6) 32 (0.6) 44 (0.6) 36 (0.5) 43 (0.6) 9 (0.7) 32 (2.9)
2 and over... 33 (0.4) 38 (0.4) 32 (0.5) 43 (0.5) 35 (0.3) 42 (0.4) 9 (0.7) -- --

What We Eat in America, NHANES 2013-2014
Page 5 of 5Page 5 of 5
Symbol Legend
* Indicates an estimate that may be less statistically reliable than estimates that are not flagged. The rules for flagging estimated percentages and ratios are as follows:
Percent reporting: An estimated percentage between 25 and 75 percent is flagged when based on a sample size of less than 30 times the variance inflation factor (VIF), where the VIFrepresents a broadly calculated average design effect, or when the relative standard error is greater than 30 percent. An estimated percentage less than or equal to 25 percent or greater thanor equal to 75 percent is flagged when the smaller of np and n(1-p) is less than 8 times the VIF, where n is the sample size and p is the percentage expressed as a fraction. The VIF used inthis table is 1.98.
Nutrient ratios expressed as percentages: An estimated ratio between 25 and 75 percent is flagged when based on a sample size n* of less than 30 times the variance inflation factor(VIF), where the VIF represents a broadly calculated average design effect and n* is the number of individuals in the sample reporting non-zero intake of the respective nutrient. Anestimated ratio less than or equal to 25 percent or greater than or equal to 75 percent, is flagged when the smaller of n*p and n* (1-p) is less than 8 times the VIF, where p is the percentageexpressed as a fraction. Additionally, an estimated ratio is flagged when either the relative standard error or p/(1-p) times the relative standard error is greater than 30 percent. The VIFused in this table is 1.98.
Footnotes
1 Dinner includes eating occasions designated by the respondent as "dinner", "supper", or the Spanish equivalent "cena." Please note these eating occasions include consumption of beveragesincluding water.
2 Percentages are estimated as a ratio of total nutrients from dinner for all individuals to total daily nutrient intakes for all individuals. Total daily nutrient intakes are available from:www.ars.usda.gov/nea/bhnrc/fsrg. See Table 4. Nutrient Intakes from Food and Beverages: Mean Amounts Consumed per Individual, by Family Income (as % of Poverty Level) and Age, in theUnited States, 2013-2014.
3 The ratio of family income to poverty expressed as a percentage. The Department of Health and Human Services’ poverty guidelines were used as the poverty measure to calculate the ratio, http://aspe.hhs.gov/poverty/.
4 The percentage of respondents in the income/age group who reported consuming at least one item at an eating occasion designated as dinner.
5 Includes persons of all income levels or with unknown family income.
Abbreviations
SE = standard error; RAE = retinol activity equivalents; DFE = dietary folate equivalents.
Notes Applicable to All Tables in Series: What We Eat in America, NHANES 2013-2014
Sample weights designed for dietary analysis were used to allow estimates representative of the U. S. population for the years of collection.
The statistics in this table are estimated from Day 1 dietary recall interviews conducted in the What We Eat in America, National Health and Nutrition Examination Survey (NHANES) 2013-2014.The 24-hour dietary recalls were conducted in-person, by trained interviewers, using the USDA 5-step Automated Multiple-Pass Method. Food intakes were coded and nutrient values weredetermined using the USDA Food and Nutrient Database for Dietary Studies 2013-2014 www.ars.usda.gov/nea/bhnrc/fsrg.
Intakes of nutrients and other dietary components are based on the consumption of food and beverages, including water, and do not include intake from supplements or medications.
The table includes data from individuals 2 years and over. Breast-fed children were excluded because breast milk was not quantified in dietary recall interviews.
Although alcohol data are collected for all individuals, estimates are not presented for age groups under 20 years due to extreme variability and/or inadequate sample size.
Suggested Citation
U.S. Department of Agriculture, Agricultural Research Service. 2016. Dinner: Percentages of Selected Nutrients Contributed by Food and Beverages Consumed at Dinner, by Family Income (as %of Poverty Level) and Age, What We Eat in America, NHANES 2013-2014.

DATA SOURCE: What We Eat in America, NHANES 2013-2014, individuals 2 years and over (excluding breast-fed children), day 1. Available: www.ars.usda.gov/nea/bhnrc/fsrg.Page 1 of 5
What We Eat in America, NHANES 2013-2014
Table 25. Snacks1: Percentages2 of Selected Nutrients Contributed by Food and Beverages Consumed at Snack Occasions,by Gender and Age, in the United States, 2013-2014
Genderand age
Percentreporting3 Energy Protein
Carbo-hydrate
Totalsugars
Dietaryfiber
Totalfat
Saturatedfat
Mono-unsaturated
fat
Poly-unsaturated
fat(years) % (SE) % (SE) % (SE) % (SE) % (SE) % (SE) % (SE) % (SE) % (SE) % (SE)
Males:2 - 5.............. 98* (0.4) 30 (0.9) 19 (1.2) 35 (1.0) 42 (1.4) 25 (1.2) 27 (1.4) 29 (1.6) 26 (1.3) 28 (2.0)6 - 11.............. 97 (0.9) 24 (1.3) 14 (1.2) 28 (1.2) 35 (1.8) 21 (1.1) 23 (1.7) 25 (2.8) 22 (1.6) 23 (1.0)
12 - 19.............. 92 (1.6) 23 (1.5) 13 (1.0) 26 (1.6) 35 (1.8) 20 (1.2) 21 (1.4) 22 (1.4) 20 (1.4) 21 (2.4)
20 - 29.............. 94 (1.5) 25 (1.1) 14 (1.4) 28 (1.1) 39 (1.6) 21 (1.6) 21 (1.6) 20 (1.2) 20 (2.0) 22 (2.5)30 - 39.............. 95 (1.2) 25 (1.3) 13 (1.0) 28 (1.3) 39 (1.8) 22 (1.2) 21 (1.4) 22 (1.5) 22 (1.5) 21 (1.7)40 - 49.............. 95 (1.8) 24 (1.1) 12 (1.0) 27 (1.2) 39 (1.8) 18 (1.4) 20 (1.3) 22 (1.6) 19 (1.4) 18 (1.9)
50 - 59.............. 96 (1.0) 24 (1.9) 13 (1.1) 26 (2.1) 36 (2.4) 18 (1.6) 20 (1.9) 21 (2.1) 21 (2.2) 18 (1.7)60 - 69.............. 94 (1.9) 26 (2.2) 16 (2.2) 28 (1.8) 38 (2.0) 21 (2.6) 26 (2.8) 27 (2.2) 26 (3.0) 24 (4.2)70 and over...... 92 (2.0) 20 (1.4) 11 (0.9) 22 (1.9) 32 (3.3) 16 (1.1) 19 (1.4) 22 (1.7) 20 (1.6) 15 (1.3)
2 - 19............ 95 (0.7) 24 (0.8) 14 (0.6) 28 (0.9) 36 (0.9) 21 (0.8) 23 (0.9) 24 (0.9) 21 (1.0) 23 (1.5)20 and over... 94 (0.8) 24 (0.8) 13 (0.7) 27 (0.8) 38 (1.1) 19 (0.8) 21 (1.0) 22 (1.0) 21 (1.0) 20 (1.3)
2 and over... 94 (0.6) 24 (0.6) 13 (0.5) 27 (0.6) 37 (0.9) 20 (0.6) 21 (0.8) 22 (0.9) 21 (0.7) 21 (0.9)
Females:2 - 5.............. 98* (0.8) 32 (1.0) 21 (1.1) 36 (1.1) 43 (1.7) 28 (1.3) 30 (1.4) 31 (1.4) 29 (1.4) 31 (1.9)6 - 11.............. 97* (0.6) 25 (1.4) 15 (1.2) 29 (1.4) 35 (1.6) 23 (1.7) 24 (1.7) 25 (1.7) 24 (1.8) 25 (1.9)
12 - 19.............. 91 (1.2) 25 (0.9) 14 (0.8) 29 (1.4) 39 (2.8) 21 (1.2) 23 (1.2) 24 (1.3) 22 (1.6) 21 (1.2)
20 - 29.............. 95 (0.8) 26 (1.6) 13 (1.0) 30 (1.4) 41 (1.9) 21 (1.7) 22 (1.5) 23 (1.7) 22 (1.5) 20 (1.5)30 - 39.............. 96 (1.1) 24 (1.2) 13 (0.7) 28 (1.4) 39 (1.8) 20 (1.4) 21 (1.3) 22 (1.7) 22 (1.4) 19 (1.3)40 - 49.............. 97* (0.4) 26 (1.4) 14 (0.9) 29 (1.4) 41 (2.1) 22 (1.3) 25 (1.7) 25 (1.8) 25 (1.9) 23 (1.9)
50 - 59.............. 96 (1.5) 24 (1.5) 13 (1.1) 28 (1.5) 38 (1.9) 20 (1.4) 21 (1.5) 24 (1.7) 22 (1.5) 19 (1.6)60 - 69.............. 97* (0.9) 24 (1.1) 13 (0.8) 28 (1.2) 38 (2.0) 20 (0.9) 21 (1.4) 23 (1.7) 21 (1.7) 19 (1.6)70 and over...... 94 (1.2) 19 (0.9) 10 (0.5) 23 (1.1) 31 (1.5) 17 (1.1) 19 (1.2) 19 (1.6) 19 (1.2) 17 (1.0)
2 - 19............ 95 (0.6) 26 (0.7) 16 (0.4) 30 (0.9) 39 (1.7) 23 (0.9) 24 (1.0) 25 (1.0) 24 (1.0) 24 (1.2)20 and over... 96 (0.5) 24 (0.7) 13 (0.4) 28 (0.7) 39 (1.1) 20 (0.6) 22 (0.7) 23 (0.8) 22 (0.8) 20 (0.8)
2 and over... 96 (0.5) 25 (0.6) 13 (0.4) 28 (0.6) 39 (1.1) 21 (0.6) 22 (0.7) 23 (0.8) 22 (0.7) 21 (0.7)
Males and females:2 - 19............ 95 (0.5) 25 (0.6) 15 (0.5) 29 (0.7) 37 (1.0) 22 (0.7) 23 (0.7) 25 (0.8) 22 (0.7) 23 (1.1)20 and over... 95 (0.6) 24 (0.6) 13 (0.5) 27 (0.6) 38 (0.9) 20 (0.6) 21 (0.7) 22 (0.8) 22 (0.8) 20 (0.9)
2 and over... 95 (0.5) 24 (0.5) 13 (0.4) 28 (0.5) 38 (0.8) 20 (0.5) 22 (0.6) 23 (0.7) 22 (0.6) 21 (0.7)
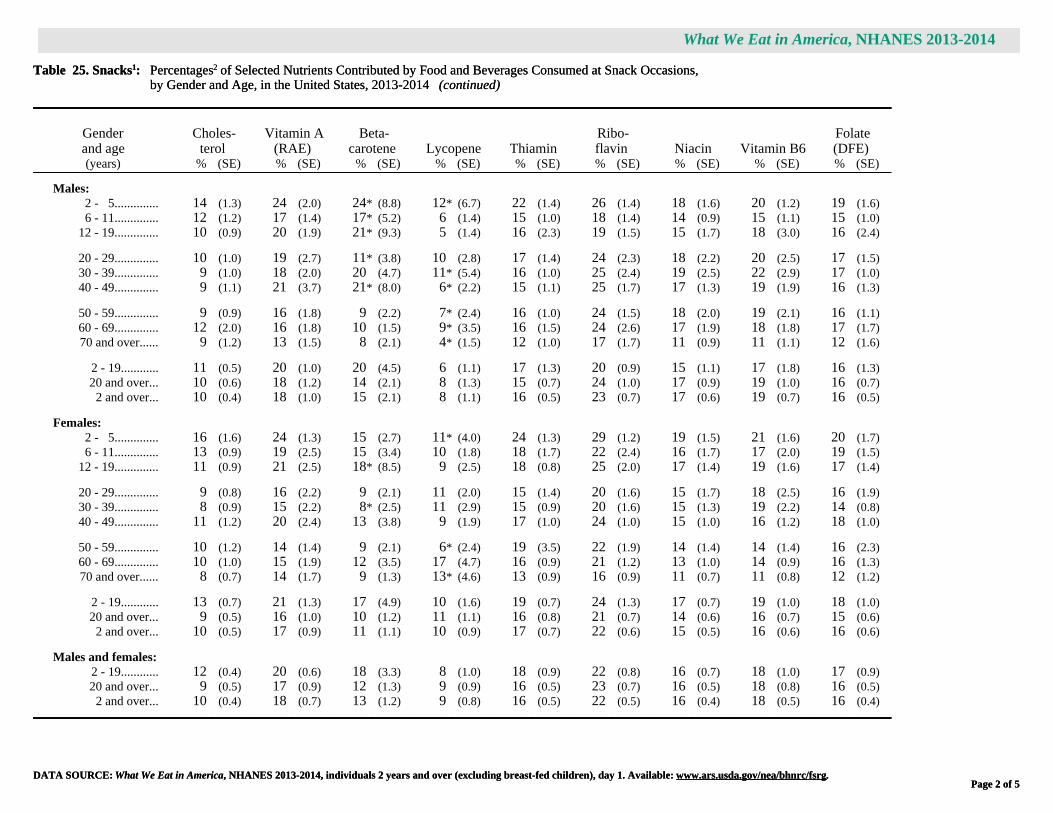
DATA SOURCE: What We Eat in America, NHANES 2013-2014, individuals 2 years and over (excluding breast-fed children), day 1. Available: www.ars.usda.gov/nea/bhnrc/fsrg.Page 2 of 5
What We Eat in America, NHANES 2013-2014
Table 25. Snacks1: Percentages2 of Selected Nutrients Contributed by Food and Beverages Consumed at Snack Occasions,by Gender and Age, in the United States, 2013-2014 (continued)
Genderand age
Choles-terol
Vitamin A(RAE)
Beta-carotene Lycopene Thiamin
Ribo-flavin Niacin Vitamin B6
Folate(DFE)
(years) % (SE) % (SE) % (SE) % (SE) % (SE) % (SE) % (SE) % (SE) % (SE)
Males:2 - 5.............. 14 (1.3) 24 (2.0) 24* (8.8) 12* (6.7) 22 (1.4) 26 (1.4) 18 (1.6) 20 (1.2) 19 (1.6)6 - 11.............. 12 (1.2) 17 (1.4) 17* (5.2) 6 (1.4) 15 (1.0) 18 (1.4) 14 (0.9) 15 (1.1) 15 (1.0)
12 - 19.............. 10 (0.9) 20 (1.9) 21* (9.3) 5 (1.4) 16 (2.3) 19 (1.5) 15 (1.7) 18 (3.0) 16 (2.4)
20 - 29.............. 10 (1.0) 19 (2.7) 11* (3.8) 10 (2.8) 17 (1.4) 24 (2.3) 18 (2.2) 20 (2.5) 17 (1.5)30 - 39.............. 9 (1.0) 18 (2.0) 20 (4.7) 11* (5.4) 16 (1.0) 25 (2.4) 19 (2.5) 22 (2.9) 17 (1.0)40 - 49.............. 9 (1.1) 21 (3.7) 21* (8.0) 6* (2.2) 15 (1.1) 25 (1.7) 17 (1.3) 19 (1.9) 16 (1.3)
50 - 59.............. 9 (0.9) 16 (1.8) 9 (2.2) 7* (2.4) 16 (1.0) 24 (1.5) 18 (2.0) 19 (2.1) 16 (1.1)60 - 69.............. 12 (2.0) 16 (1.8) 10 (1.5) 9* (3.5) 16 (1.5) 24 (2.6) 17 (1.9) 18 (1.8) 17 (1.7)70 and over...... 9 (1.2) 13 (1.5) 8 (2.1) 4* (1.5) 12 (1.0) 17 (1.7) 11 (0.9) 11 (1.1) 12 (1.6)
2 - 19............ 11 (0.5) 20 (1.0) 20 (4.5) 6 (1.1) 17 (1.3) 20 (0.9) 15 (1.1) 17 (1.8) 16 (1.3)20 and over... 10 (0.6) 18 (1.2) 14 (2.1) 8 (1.3) 15 (0.7) 24 (1.0) 17 (0.9) 19 (1.0) 16 (0.7)
2 and over... 10 (0.4) 18 (1.0) 15 (2.1) 8 (1.1) 16 (0.5) 23 (0.7) 17 (0.6) 19 (0.7) 16 (0.5)
Females:2 - 5.............. 16 (1.6) 24 (1.3) 15 (2.7) 11* (4.0) 24 (1.3) 29 (1.2) 19 (1.5) 21 (1.6) 20 (1.7)6 - 11.............. 13 (0.9) 19 (2.5) 15 (3.4) 10 (1.8) 18 (1.7) 22 (2.4) 16 (1.7) 17 (2.0) 19 (1.5)
12 - 19.............. 11 (0.9) 21 (2.5) 18* (8.5) 9 (2.5) 18 (0.8) 25 (2.0) 17 (1.4) 19 (1.6) 17 (1.4)
20 - 29.............. 9 (0.8) 16 (2.2) 9 (2.1) 11 (2.0) 15 (1.4) 20 (1.6) 15 (1.7) 18 (2.5) 16 (1.9)30 - 39.............. 8 (0.9) 15 (2.2) 8* (2.5) 11 (2.9) 15 (0.9) 20 (1.6) 15 (1.3) 19 (2.2) 14 (0.8)40 - 49.............. 11 (1.2) 20 (2.4) 13 (3.8) 9 (1.9) 17 (1.0) 24 (1.0) 15 (1.0) 16 (1.2) 18 (1.0)
50 - 59.............. 10 (1.2) 14 (1.4) 9 (2.1) 6* (2.4) 19 (3.5) 22 (1.9) 14 (1.4) 14 (1.4) 16 (2.3)60 - 69.............. 10 (1.0) 15 (1.9) 12 (3.5) 17 (4.7) 16 (0.9) 21 (1.2) 13 (1.0) 14 (0.9) 16 (1.3)70 and over...... 8 (0.7) 14 (1.7) 9 (1.3) 13* (4.6) 13 (0.9) 16 (0.9) 11 (0.7) 11 (0.8) 12 (1.2)
2 - 19............ 13 (0.7) 21 (1.3) 17 (4.9) 10 (1.6) 19 (0.7) 24 (1.3) 17 (0.7) 19 (1.0) 18 (1.0)20 and over... 9 (0.5) 16 (1.0) 10 (1.2) 11 (1.1) 16 (0.8) 21 (0.7) 14 (0.6) 16 (0.7) 15 (0.6)
2 and over... 10 (0.5) 17 (0.9) 11 (1.1) 10 (0.9) 17 (0.7) 22 (0.6) 15 (0.5) 16 (0.6) 16 (0.6)
Males and females:2 - 19............ 12 (0.4) 20 (0.6) 18 (3.3) 8 (1.0) 18 (0.9) 22 (0.8) 16 (0.7) 18 (1.0) 17 (0.9)20 and over... 9 (0.5) 17 (0.9) 12 (1.3) 9 (0.9) 16 (0.5) 23 (0.7) 16 (0.5) 18 (0.8) 16 (0.5)
2 and over... 10 (0.4) 18 (0.7) 13 (1.2) 9 (0.8) 16 (0.5) 22 (0.5) 16 (0.4) 18 (0.5) 16 (0.4)

DATA SOURCE: What We Eat in America, NHANES 2013-2014, individuals 2 years and over (excluding breast-fed children), day 1. Available: www.ars.usda.gov/nea/bhnrc/fsrg.Page 3 of 5
What We Eat in America, NHANES 2013-2014
Table 25. Snacks1: Percentages2 of Selected Nutrients Contributed by Food and Beverages Consumed at Snack Occasions,by Gender and Age, in the United States, 2013-2014 (continued)
Genderand age Choline Vitamin B12 Vitamin C Vitamin D
Vitamin E(alpha-
tocopherol) Vitamin K Calcium Phosphorus Magnesium(years) % (SE) % (SE) % (SE) % (SE) % (SE) % (SE) % (SE) % (SE) % (SE)
Males:2 - 5.............. 19 (1.6) 21 (1.9) 37 (3.4) 26 (3.3) 29 (1.9) 25 (2.3) 28 (2.4) 24 (1.6) 27 (1.2)6 - 11.............. 14 (1.3) 14 (1.7) 25 (1.8) 15 (1.9) 25 (1.3) 18 (2.7) 20 (1.6) 17 (1.3) 23 (1.2)
12 - 19.............. 13 (1.1) 18 (2.5) 25 (3.4) 20 (1.8) 23 (1.8) 16 (1.5) 23 (0.8) 18 (1.0) 24 (1.3)
20 - 29.............. 17 (1.3) 20 (2.7) 25 (3.4) 22 (5.8) 30 (3.8) 11 (1.3) 25 (2.1) 20 (1.7) 29 (1.6)30 - 39.............. 16 (1.3) 17 (2.8) 32 (4.2) 17 (2.0) 30 (2.6) 13 (2.9) 26 (1.3) 20 (1.3) 28 (1.5)40 - 49.............. 17 (1.1) 18 (2.4) 24 (3.2) 18 (4.2) 22 (2.4) 10 (1.1) 25 (1.9) 19 (1.3) 26 (1.3)
50 - 59.............. 18 (2.2) 13 (1.6) 21 (1.5) 12 (2.1) 22 (2.1) 11 (1.7) 23 (1.6) 19 (1.3) 28 (2.0)60 - 69.............. 17 (2.1) 18 (2.7) 21 (3.1) 18 (2.6) 26 (4.2) 11 (2.3) 27 (2.7) 21 (2.4) 28 (2.8)70 and over...... 12 (1.2) 10 (1.5) 15 (1.5) 13 (2.1) 16 (1.5) 7 (1.2) 22 (1.8) 16 (1.3) 20 (1.3)
2 - 19............ 14 (0.7) 17 (1.4) 28 (1.9) 19 (1.4) 25 (1.2) 18 (1.2) 22 (0.9) 19 (0.7) 24 (0.8)20 and over... 16 (0.8) 17 (1.1) 24 (1.2) 17 (1.5) 25 (1.9) 11 (0.9) 25 (1.1) 19 (1.0) 27 (0.9)
2 and over... 16 (0.6) 17 (0.9) 25 (1.1) 18 (1.2) 25 (1.5) 12 (0.8) 24 (0.9) 19 (0.7) 26 (0.7)
Females:2 - 5.............. 22 (1.1) 23 (1.5) 40 (2.8) 29 (1.7) 30 (2.2) 24 (2.1) 32 (1.5) 27 (1.2) 31 (1.1)6 - 11.............. 15 (0.8) 15 (2.6) 30 (2.1) 16 (2.8) 30 (2.6) 18 (2.6) 21 (1.6) 19 (1.3) 25 (1.6)
12 - 19.............. 14 (0.6) 21 (2.2) 26 (2.6) 20 (2.2) 27 (2.3) 12 (1.5) 25 (1.2) 19 (0.9) 25 (1.0)
20 - 29.............. 15 (1.5) 15 (1.9) 29 (2.7) 17 (2.2) 26 (2.0) 10 (1.1) 24 (1.6) 18 (1.3) 27 (1.6)30 - 39.............. 14 (0.9) 15 (1.6) 23 (2.7) 16 (2.1) 23 (2.1) 9 (1.7) 24 (1.4) 18 (0.9) 26 (1.1)40 - 49.............. 15 (0.9) 16 (1.2) 23 (2.2) 19 (2.1) 27 (1.9) 11 (1.9) 28 (1.5) 20 (1.1) 30 (1.3)
50 - 59.............. 14 (1.1) 13 (1.7) 20 (1.6) 13 (1.9) 19 (1.9) 9 (1.3) 26 (1.5) 19 (1.7) 28 (2.3)60 - 69.............. 14 (1.3) 11 (1.4) 25 (2.3) 12 (1.9) 20 (1.3) 9 (1.1) 25 (1.2) 18 (1.1) 25 (1.0)70 and over...... 12 (0.7) 10 (1.2) 22 (1.7) 14 (2.1) 16 (2.0) 8 (1.3) 19 (1.1) 14 (0.6) 22 (0.7)
2 - 19............ 16 (0.5) 19 (1.1) 31 (1.8) 21 (1.1) 28 (1.7) 16 (1.4) 25 (0.7) 20 (0.6) 26 (0.9)20 and over... 14 (0.6) 14 (0.6) 24 (0.6) 15 (0.8) 22 (0.9) 9 (0.6) 25 (0.7) 18 (0.6) 27 (0.6)
2 and over... 14 (0.5) 15 (0.5) 25 (0.7) 17 (0.7) 24 (0.9) 10 (0.6) 25 (0.5) 18 (0.5) 27 (0.6)
Males and females:2 - 19............ 15 (0.5) 18 (0.8) 29 (1.6) 20 (1.0) 26 (1.2) 17 (0.8) 24 (0.7) 19 (0.6) 25 (0.7)20 and over... 15 (0.6) 15 (0.7) 24 (0.7) 16 (1.1) 24 (1.2) 10 (0.6) 25 (0.8) 19 (0.7) 27 (0.7)
2 and over... 15 (0.5) 16 (0.6) 25 (0.7) 17 (0.9) 24 (1.0) 11 (0.5) 25 (0.6) 19 (0.5) 27 (0.5)

DATA SOURCE: What We Eat in America, NHANES 2013-2014, individuals 2 years and over (excluding breast-fed children), day 1. Available: www.ars.usda.gov/nea/bhnrc/fsrg.Page 4 of 5
What We Eat in America, NHANES 2013-2014
Table 25. Snacks1: Percentages2 of Selected Nutrients Contributed by Food and Beverages Consumed at Snack Occasions,by Gender and Age, in the United States, 2013-2014 (continued)
Genderand age Iron Zinc Copper Selenium Potassium Sodium Caffeine Alcohol(years) % (SE) % (SE) % (SE) % (SE) % (SE) % (SE) % (SE) % (SE)
Males:2 - 5.............. 22 (1.5) 21 (1.1) 29 (1.6) 16 (1.0) 28 (1.2) 20 (1.6) 58 (7.3) -- -- 6 - 11.............. 17 (1.1) 15 (1.0) 24 (1.4) 12 (1.0) 19 (1.4) 15 (0.8) 47 (7.3) -- --
12 - 19.............. 16 (1.5) 15 (1.3) 26 (1.6) 10 (1.1) 19 (0.8) 15 (1.0) 40 (3.4) -- --
20 - 29.............. 17 (1.5) 17 (1.4) 29 (1.7) 12 (1.2) 22 (1.6) 14 (1.1) 47 (7.3) -- -- 30 - 39.............. 16 (1.1) 16 (1.3) 29 (1.5) 11 (1.0) 22 (1.5) 14 (0.9) 35 (4.6) -- -- 40 - 49.............. 15 (1.3) 14 (1.2) 25 (1.5) 10 (1.1) 21 (1.3) 11 (0.9) 44 (4.5) -- --
50 - 59.............. 16 (1.2) 16 (1.6) 27 (1.9) 11 (1.6) 21 (1.2) 12 (1.0) 46 (5.0) -- -- 60 - 69.............. 17 (2.2) 18 (1.9) 29 (2.8) 13 (1.8) 22 (1.9) 16 (1.8) 39 (3.7) -- -- 70 and over...... 11 (1.0) 11 (1.0) 19 (1.4) 8 (0.7) 17 (1.3) 10 (0.7) 31 (4.4) -- --
2 - 19............ 17 (0.9) 16 (0.7) 26 (1.0) 12 (0.6) 21 (0.7) 16 (0.6) 42 (3.6) -- -- 20 and over... 16 (0.8) 15 (0.9) 27 (1.0) 11 (0.8) 21 (0.8) 13 (0.5) 41 (2.3) 64 (2.6)
2 and over... 16 (0.5) 16 (0.6) 27 (0.9) 11 (0.5) 21 (0.6) 14 (0.3) 41 (2.2) -- --
Females:2 - 5.............. 23 (1.2) 23 (1.8) 32 (1.1) 18 (1.1) 30 (1.3) 21 (1.1) 46 (7.4) -- -- 6 - 11.............. 21 (2.0) 18 (0.9) 28 (1.8) 13 (1.2) 21 (1.1) 16 (1.2) 43 (6.3) -- --
12 - 19.............. 19 (1.0) 17 (0.9) 27 (1.1) 12 (0.6) 20 (1.0) 16 (0.7) 42 (6.3) -- --
20 - 29.............. 16 (1.6) 16 (1.3) 28 (1.7) 10 (0.9) 21 (1.3) 13 (0.9) 36 (5.6) -- -- 30 - 39.............. 16 (1.0) 17 (1.2) 29 (1.4) 11 (0.7) 20 (1.3) 14 (0.9) 32 (2.8) -- -- 40 - 49.............. 19 (1.2) 18 (0.9) 31 (1.5) 11 (0.8) 23 (1.1) 14 (1.1) 37 (2.5) -- --
50 - 59.............. 18 (2.5) 16 (1.7) 31 (2.0) 10 (1.0) 21 (1.3) 13 (1.1) 42 (6.3) -- -- 60 - 69.............. 17 (1.2) 15 (0.8) 27 (1.1) 10 (0.8) 21 (1.1) 13 (0.9) 36 (3.2) -- -- 70 and over...... 13 (1.1) 13 (0.8) 26 (0.9) 7 (0.6) 17 (0.6) 9 (0.6) 23 (1.7) -- --
2 - 19............ 20 (0.8) 19 (0.7) 28 (0.9) 13 (0.5) 22 (0.7) 17 (0.5) 43 (5.2) -- -- 20 and over... 17 (0.6) 16 (0.5) 29 (0.8) 10 (0.4) 21 (0.6) 13 (0.4) 36 (2.2) 65 (3.8)
2 and over... 18 (0.6) 17 (0.5) 29 (0.7) 11 (0.3) 21 (0.5) 14 (0.3) 36 (2.1) -- --
Males and females:2 - 19............ 18 (0.8) 17 (0.5) 27 (0.8) 12 (0.5) 21 (0.6) 16 (0.4) 42 (3.0) -- -- 20 and over... 16 (0.5) 16 (0.6) 28 (0.7) 11 (0.5) 21 (0.6) 13 (0.4) 39 (1.9) 64 (2.4)
2 and over... 17 (0.4) 16 (0.4) 28 (0.6) 11 (0.3) 21 (0.5) 14 (0.3) 39 (1.8) -- --
What We Eat in America, NHANES 2013-2014
Page 5 of 5Page 5 of 5
Symbol Legend
* Indicates an estimate that may be less statistically reliable than estimates that are not flagged. The rules for flagging estimated percentages and ratios are as follows:
Percent reporting: An estimated percentage between 25 and 75 percent is flagged when based on a sample size of less than 30 times the variance inflation factor (VIF), where the VIFrepresents a broadly calculated average design effect, or when the relative standard error is greater than 30 percent. An estimated percentage less than or equal to 25 percent or greater thanor equal to 75 percent is flagged when the smaller of np and n(1-p) is less than 8 times the VIF, where n is the sample size and p is the percentage expressed as a fraction. The VIF used inthis table is 1.98.
Nutrient ratios expressed as percentages: An estimated ratio between 25 and 75 percent is flagged when based on a sample size n* of less than 30 times the variance inflation factor(VIF), where the VIF represents a broadly calculated average design effect and n* is the number of individuals in the sample reporting non-zero intake of the respective nutrient. Anestimated ratio less than or equal to 25 percent or greater than or equal to 75 percent, is flagged when the smaller of n*p and n* (1-p) is less than 8 times the VIF, where p is the percentageexpressed as a fraction. Additionally, an estimated ratio is flagged when either the relative standard error or p/(1-p) times the relative standard error is greater than 30 percent. The VIFused in this table is 1.98.
Footnotes
1 Snack occasions were reported as distinct eating occasions during the dietary interview and consisted of one or more food and beverage items, including plain water. Water was the only itemreported in approximately 25 percent of the snack occasions. Survey respondents selected the name of all eating occasions from a fixed list that was provided during the interview. All reports of"snack", "drink" or "extended consumption" (items that were consumed over a long period of time) were included as snack occasions. Spanish language interviewers used Spanish languagesnack occasion names: "merienda", "entre comida", "botana", "bocadillo", "tentempie", and "bebida".
2 Percentages are estimated as a ratio of total nutrients from snacks for all individuals to total daily nutrient intakes for all individuals. Total daily nutrient intakes are available from:www.ars.usda.gov/nea/bhnrc/fsrg. See Table 1. Nutrient Intakes from Food and Beverages: Mean Amounts Consumed per Individual, by Gender and Age, in the United States, 2013-2014.
3 The percentage of respondents in the gender/age group who reported consuming at least one item at an eating occasion designated as snack.
Abbreviations
SE = standard error; RAE = retinol activity equivalents; DFE = dietary folate equivalents.
Notes Applicable to All Tables in Series: What We Eat in America, NHANES 2013-2014
Sample weights designed for dietary analysis were used to allow estimates representative of the U. S. population for the years of collection.
The statistics in this table are estimated from Day 1 dietary recall interviews conducted in the What We Eat in America, National Health and Nutrition Examination Survey (NHANES) 2013-2014.The 24-hour dietary recalls were conducted in-person, by trained interviewers, using the USDA 5-step Automated Multiple-Pass Method. Food intakes were coded and nutrient values weredetermined using the USDA Food and Nutrient Database for Dietary Studies 2013-2014 www.ars.usda.gov/nea/bhnrc/fsrg.
Intakes of nutrients and other dietary components are based on the consumption of food and beverages, including water, and do not include intake from supplements or medications.
The table includes data from individuals 2 years and over. Breast-fed children were excluded because breast milk was not quantified in dietary recall interviews.
Although alcohol data are collected for all individuals, estimates are not presented for age groups under 20 years due to extreme variability and/or inadequate sample size.
Suggested Citation
U.S. Department of Agriculture, Agricultural Research Service. 2016. Snacks: Percentages of Selected Nutrients Contributed by Food and Beverages Consumed at Snack Occasions, by Genderand Age, What We Eat in America, NHANES 2013-2014.

DATA SOURCE: What We Eat in America, NHANES 2013-2014, individuals 2 years and over (excluding breast-fed children), day 1. Available: www.ars.usda.gov/nea/bhnrc/fsrg.Page 1 of 5
What We Eat in America, NHANES 2013-2014
Table 26. Snacks1: Percentages2 of Selected Nutrients Contributed by Food and Beverages Consumed at Snack Occasions,by Race/Ethnicity and Age, in the United States, 2013-2014
Race/ethnicityand age
Percentreporting3 Energy Protein
Carbo-hydrate
Totalsugars
Dietaryfiber
Totalfat
Saturatedfat
Mono-unsaturated
fat
Poly-unsaturated
fat(years) % (SE) % (SE) % (SE) % (SE) % (SE) % (SE) % (SE) % (SE) % (SE) % (SE)
Non-Hispanic White:2 - 5.............. 99* (0.5) 29 (1.1) 19 (1.2) 34 (1.4) 40 (1.7) 24 (2.0) 28 (1.1) 28 (1.4) 27 (1.1) 30 (2.5)6 - 11.............. 99* (0.4) 25 (1.3) 14 (1.5) 29 (1.2) 36 (1.4) 23 (1.7) 24 (1.7) 25 (2.3) 23 (2.0) 23 (1.9)
12 - 19.............. 93 (1.8) 22 (1.3) 12 (0.9) 27 (1.9) 36 (2.7) 19 (1.4) 20 (1.3) 21 (1.2) 19 (1.4) 19 (2.5)20 and over... 96 (0.6) 24 (0.7) 13 (0.7) 28 (0.7) 39 (1.1) 20 (0.8) 21 (0.9) 23 (0.9) 22 (0.9) 20 (1.2)
2 and over... 96 (0.5) 24 (0.5) 13 (0.5) 28 (0.5) 38 (0.9) 20 (0.7) 21 (0.8) 23 (0.9) 21 (0.7) 20 (0.9)
Non-Hispanic Black:2 - 5.............. 93* (3.3) 26 (2.1) 15 (1.9) 30 (1.8) 36 (2.5) 25 (1.7) 26 (3.1) 25 (3.0) 25 (2.7) 28 (4.1)6 - 11.............. 90 (1.7) 23 (2.3) 15 (2.1) 27 (2.4) 32 (2.2) 18 (1.7) 22 (2.6) 22 (2.5) 21 (2.4) 25 (3.3)
12 - 19.............. 89 (1.5) 29 (1.9) 16 (1.1) 33 (2.4) 41 (3.1) 26 (2.1) 28 (1.7) 28 (2.2) 27 (1.5) 29 (1.6)20 and over... 92 (0.8) 28 (1.6) 15 (1.0) 32 (1.6) 40 (1.5) 24 (1.3) 25 (1.4) 25 (1.4) 24 (1.5) 25 (1.5)
2 and over... 91 (0.7) 28 (1.4) 15 (0.9) 31 (1.4) 40 (1.5) 24 (1.2) 25 (1.4) 25 (1.5) 24 (1.4) 25 (1.5)
Non-Hispanic Asian4:2 - 5.............. 97* (2.1) 31* (3.8) 19* (3.0) 35* (4.1) 48* (5.6) 30* (3.3) 32* (4.2) 36* (5.2) 28* (2.8) 28* (3.9)6 - 11.............. 97* (2.7) 26 (2.0) 16* (1.8) 28 (2.1) 41 (3.6) 24 (2.6) 28 (3.0) 33 (4.5) 26 (2.7) 22* (3.0)
12 - 19.............. 93* (2.7) 24 (2.4) 14 (2.8) 26 (2.8) 36 (5.1) 21 (1.1) 26 (3.3) 29 (3.5) 25 (3.8) 22 (3.5)20 and over... 94 (1.3) 19 (1.0) 10 (0.8) 21 (1.1) 35 (1.5) 17 (0.9) 18 (1.2) 19 (1.4) 19 (1.6) 16 (1.1)
2 and over... 94 (1.2) 20 (0.8) 11 (0.8) 23 (0.9) 36 (1.4) 18 (0.9) 20 (1.0) 22 (1.0) 21 (1.3) 17 (1.1)
Hispanic:2 - 5.............. 99* (0.5) 34 (1.3) 25 (1.4) 39 (1.6) 49 (1.8) 30 (1.5) 33 (1.4) 35 (1.6) 31 (1.4) 31 (2.0)6 - 11.............. 95* (1.1) 24 (1.7) 15 (1.7) 28 (1.4) 34 (1.5) 22 (1.6) 24 (2.2) 24 (2.4) 23 (2.1) 25 (2.1)
12 - 19.............. 91 (1.4) 23 (1.0) 13 (0.7) 27 (1.3) 37 (2.4) 20 (1.2) 22 (1.1) 23 (1.2) 22 (1.3) 22 (1.7)20 and over... 94 (1.3) 22 (0.6) 12 (0.5) 24 (0.9) 34 (1.3) 18 (0.8) 20 (1.0) 20 (1.1) 20 (1.2) 18 (0.8)
2 and over... 94 (1.0) 23 (0.6) 13 (0.4) 26 (0.7) 35 (0.9) 19 (0.7) 21 (0.9) 22 (1.0) 21 (1.1) 20 (0.9)

DATA SOURCE: What We Eat in America, NHANES 2013-2014, individuals 2 years and over (excluding breast-fed children), day 1. Available: www.ars.usda.gov/nea/bhnrc/fsrg.Page 2 of 5
What We Eat in America, NHANES 2013-2014
Table 26. Snacks1: Percentages2 of Selected Nutrients Contributed by Food and Beverages Consumed at Snack Occasions,by Race/Ethnicity and Age, in the United States, 2013-2014 (continued)
Race/ethnicityand age
Choles-terol
Vitamin A(RAE)
Beta-carotene Lycopene Thiamin
Ribo-flavin Niacin Vitamin B6
Folate(DFE)
(years) % (SE) % (SE) % (SE) % (SE) % (SE) % (SE) % (SE) % (SE) % (SE)
Non-Hispanic White:2 - 5.............. 16 (1.7) 24 (2.0) 20* (7.4) 5* (2.1) 20 (1.5) 25 (1.2) 17 (1.6) 19 (1.4) 18 (2.2)6 - 11.............. 12 (1.5) 18 (1.9) 17 (5.2) 6* (1.7) 17 (1.5) 21 (2.7) 14 (1.9) 16 (2.2) 17 (1.6)
12 - 19.............. 10 (1.0) 22 (2.1) 25* (8.6) 5* (2.3) 17 (2.6) 22 (1.5) 16 (1.7) 19 (2.9) 15 (2.0)20 and over... 10 (0.6) 17 (1.2) 11 (1.9) 8 (1.5) 15 (0.6) 23 (0.9) 15 (0.6) 17 (1.0) 15 (0.6)
2 and over... 10 (0.5) 18 (1.0) 13 (1.7) 7 (1.2) 16 (0.7) 23 (0.7) 15 (0.5) 17 (0.8) 16 (0.5)
Non-Hispanic Black:2 - 5.............. 11 (1.9) 18 (1.9) 7* (1.6) 2* (0.5) 19 (1.5) 21 (1.6) 16 (1.4) 18 (1.7) 17 (2.0)6 - 11.............. 12 (1.8) 14 (1.8) 12 (3.1) 8* (4.0) 18 (3.1) 17 (2.1) 17 (3.4) 18 (4.2) 18 (3.2)
12 - 19.............. 12 (1.1) 22 (2.6) 16 (4.4) 12* (5.5) 21 (2.2) 23 (2.2) 19 (1.7) 21 (2.6) 25 (4.7)20 and over... 11 (0.9) 16 (1.0) 13 (2.2) 11 (2.4) 18 (1.1) 22 (0.9) 18 (1.0) 19 (1.1) 19 (1.4)
2 and over... 11 (0.8) 17 (1.0) 13 (2.1) 11 (2.2) 18 (1.1) 22 (0.9) 18 (0.9) 19 (1.0) 19 (1.6)
Non-Hispanic Asian4:2 - 5.............. 15* (1.9) 22* (2.3) 9* (3.6) 1* (1.1) 22* (2.3) 28* (2.5) 18* (3.4) 21* (3.8) 17* (3.3)6 - 11.............. 13* (1.2) 21* (2.8) 15* (4.2) 17* (7.2) 16* (1.4) 22* (1.9) 12* (1.4) 15* (2.1) 12* (1.1)
12 - 19.............. 11* (2.4) 21 (2.9) 6* (2.5) 8* (4.7) 17 (2.6) 24 (3.2) 15 (3.4) 16 (2.9) 17 (2.6)20 and over... 7 (0.9) 15 (2.3) 11 (3.1) 17 (4.6) 13 (0.8) 21 (1.4) 11 (0.9) 13 (1.0) 12 (1.0)
2 and over... 8 (0.9) 16 (1.9) 11 (2.7) 15 (3.6) 14 (0.6) 21 (1.2) 12 (0.8) 14 (0.9) 13 (0.9)
Hispanic:2 - 5.............. 18 (1.3) 31 (1.6) 26 (3.9) 25* (9.9) 27 (1.4) 34 (1.7) 22 (1.5) 26 (2.1) 25 (2.0)6 - 11.............. 12 (1.5) 17 (1.4) 18 (4.0) 9 (0.9) 17 (1.1) 18 (1.3) 16 (0.9) 16 (1.0) 17 (1.2)
12 - 19.............. 10 (0.8) 17 (1.0) 12 (1.7) 7 (1.4) 15 (0.9) 18 (0.9) 14 (0.9) 15 (1.1) 16 (1.2)20 and over... 9 (0.6) 17 (1.1) 13 (2.5) 11 (1.8) 15 (0.5) 23 (1.0) 18 (1.1) 20 (1.4) 16 (0.7)
2 and over... 10 (0.5) 18 (0.6) 14 (2.1) 11 (1.1) 16 (0.4) 22 (0.6) 17 (0.8) 19 (1.0) 17 (0.5)

DATA SOURCE: What We Eat in America, NHANES 2013-2014, individuals 2 years and over (excluding breast-fed children), day 1. Available: www.ars.usda.gov/nea/bhnrc/fsrg.Page 3 of 5
What We Eat in America, NHANES 2013-2014
Table 26. Snacks1: Percentages2 of Selected Nutrients Contributed by Food and Beverages Consumed at Snack Occasions,by Race/Ethnicity and Age, in the United States, 2013-2014 (continued)
Race/ethnicityand age Choline Vitamin B12 Vitamin C Vitamin D
Vitamin E(alpha-
tocopherol) Vitamin K Calcium Phosphorus Magnesium(years) % (SE) % (SE) % (SE) % (SE) % (SE) % (SE) % (SE) % (SE) % (SE)
Non-Hispanic White:2 - 5.............. 21 (1.8) 20 (1.5) 37 (3.1) 24 (2.1) 28 (2.6) 27 (2.6) 27 (1.8) 24 (1.5) 27 (1.4)6 - 11.............. 15 (1.4) 15 (2.2) 27 (2.3) 16 (2.4) 28 (2.3) 15 (2.2) 20 (1.9) 18 (1.5) 25 (1.7)
12 - 19.............. 14 (1.2) 21 (2.9) 23 (4.3) 20 (2.9) 21 (2.1) 11 (1.7) 23 (1.1) 17 (1.0) 24 (1.4)20 and over... 16 (0.8) 15 (0.7) 22 (1.1) 16 (1.4) 24 (1.7) 9 (0.8) 24 (1.0) 19 (0.9) 27 (0.9)
2 and over... 16 (0.6) 16 (0.8) 23 (1.1) 17 (1.2) 24 (1.4) 10 (0.7) 24 (0.8) 19 (0.7) 27 (0.7)
Non-Hispanic Black:2 - 5.............. 15 (1.5) 15 (1.5) 27 (2.6) 22 (3.0) 30 (2.8) 16 (2.4) 23 (2.0) 19 (1.8) 25 (2.2)6 - 11.............. 14 (1.5) 13 (2.3) 27 (4.5) 13 (2.3) 25 (2.5) 16 (1.8) 18 (2.4) 17 (2.1) 21 (1.9)
12 - 19.............. 16 (1.1) 19 (3.3) 34 (4.1) 22 (3.9) 35 (2.5) 20 (1.9) 25 (2.0) 21 (1.5) 29 (1.7)20 and over... 17 (1.5) 14 (1.0) 27 (1.4) 16 (2.2) 27 (1.6) 15 (2.9) 26 (1.1) 20 (1.3) 29 (1.2)
2 and over... 17 (1.2) 15 (0.8) 28 (1.3) 17 (1.8) 28 (1.5) 16 (2.5) 25 (1.2) 20 (1.1) 28 (1.1)
Non-Hispanic Asian4:2 - 5.............. 19* (1.9) 21* (3.0) 44* (7.6) 22* (3.8) 30* (4.0) 25* (6.8) 31* (3.3) 25* (2.9) 28* (2.8)6 - 11.............. 15* (2.1) 18* (1.8) 29 (4.2) 19* (4.6) 26 (2.7) 29 (7.2) 28 (2.6) 23 (2.2) 26 (2.1)
12 - 19.............. 15 (1.9) 21 (4.6) 25* (8.5) 25 (3.6) 27 (5.8) 13* (4.1) 31 (3.2) 20 (2.9) 26 (2.3)20 and over... 10 (0.8) 12 (1.4) 26 (1.9) 14 (2.6) 23 (1.9) 5 (0.8) 25 (1.9) 14 (1.0) 22 (1.2)
2 and over... 12 (0.9) 14 (1.5) 26 (1.9) 16 (2.4) 24 (2.0) 7 (1.1) 26 (1.6) 16 (1.1) 23 (1.1)
Hispanic:2 - 5.............. 24 (1.3) 30 (1.9) 44 (4.0) 38 (2.2) 33 (1.7) 25 (2.3) 39 (2.0) 31 (1.6) 34 (1.5)6 - 11.............. 14 (1.5) 13 (1.1) 29 (2.7) 14 (1.6) 27 (2.0) 22 (2.8) 21 (2.2) 18 (1.8) 22 (1.3)
12 - 19.............. 13 (0.8) 15 (1.1) 26 (2.4) 18 (1.5) 28 (3.2) 19 (2.6) 23 (1.4) 17 (0.9) 24 (1.0)20 and over... 14 (0.6) 18 (1.5) 25 (1.0) 18 (1.0) 23 (1.2) 11 (1.0) 25 (1.0) 17 (0.5) 25 (0.8)
2 and over... 15 (0.5) 18 (0.9) 27 (1.0) 19 (0.8) 24 (1.2) 14 (1.0) 25 (0.9) 18 (0.5) 25 (0.7)

DATA SOURCE: What We Eat in America, NHANES 2013-2014, individuals 2 years and over (excluding breast-fed children), day 1. Available: www.ars.usda.gov/nea/bhnrc/fsrg.Page 4 of 5
What We Eat in America, NHANES 2013-2014
Table 26. Snacks1: Percentages2 of Selected Nutrients Contributed by Food and Beverages Consumed at Snack Occasions,by Race/Ethnicity and Age, in the United States, 2013-2014 (continued)
Race/ethnicityand age Iron Zinc Copper Selenium Potassium Sodium Caffeine Alcohol(years) % (SE) % (SE) % (SE) % (SE) % (SE) % (SE) % (SE) % (SE)
Non-Hispanic White:2 - 5.............. 20 (1.4) 20 (1.5) 29 (1.4) 15 (1.1) 27 (1.0) 19 (1.6) 49 (4.5) -- -- 6 - 11.............. 19 (1.9) 17 (1.8) 28 (2.1) 11 (1.1) 20 (1.7) 14 (1.2) 47 (7.8) -- --
12 - 19.............. 15 (1.6) 15 (1.2) 26 (1.6) 10 (0.9) 18 (0.9) 15 (1.0) 40 (4.4) -- -- 20 and over... 16 (0.7) 16 (0.8) 29 (1.0) 10 (0.6) 21 (0.8) 13 (0.4) 40 (2.1) 62 (3.4)
2 and over... 16 (0.6) 16 (0.7) 28 (0.9) 10 (0.5) 21 (0.6) 13 (0.4) 40 (2.0) -- --
Non-Hispanic Black:2 - 5.............. 21 (1.6) 18 (1.6) 27 (2.9) 13 (1.8) 22 (2.5) 17 (2.0) 42*(12.7) -- -- 6 - 11.............. 18 (3.0) 16 (1.8) 22 (1.8) 15 (2.9) 18 (1.4) 17 (2.3) 48 (7.5) -- --
12 - 19.............. 24 (3.3) 20 (2.5) 28 (1.6) 15 (1.6) 23 (1.2) 19 (1.4) 43 (7.4) -- -- 20 and over... 19 (1.1) 16 (0.8) 28 (1.1) 12 (1.0) 23 (0.9) 16 (1.2) 32 (3.3) 72 (4.6)
2 and over... 20 (1.2) 17 (0.8) 28 (0.9) 13 (0.9) 23 (0.7) 17 (1.0) 33 (3.2) -- --
Non-Hispanic Asian4:2 - 5.............. 20* (3.7) 19* (2.6) 26* (3.9) 14* (2.5) 31* (2.3) 19* (3.1) 56*(14.3) -- -- 6 - 11.............. 17* (1.5) 16* (1.7) 26 (2.5) 15* (2.8) 24 (2.3) 16* (1.9) 63*(11.0) -- --
12 - 19.............. 16 (2.8) 18 (3.3) 25 (2.9) 11* (2.3) 21 (3.0) 16 (2.7) 80 (5.5) -- -- 20 and over... 13 (1.0) 13 (1.1) 24 (1.4) 9 (0.9) 17 (0.9) 8 (1.0) 32 (3.1) 52 (6.1)
2 and over... 14 (0.8) 14 (1.0) 24 (1.4) 10 (0.6) 19 (0.9) 10 (0.9) 34 (3.1) -- --
Hispanic:2 - 5.............. 25 (2.0) 28 (1.7) 35 (1.5) 21 (1.2) 36 (1.4) 24 (1.3) 60 (6.0) -- -- 6 - 11.............. 18 (1.1) 16 (1.5) 23 (1.6) 13 (1.6) 20 (1.7) 16 (1.8) 43 (5.1) -- --
12 - 19.............. 18 (1.5) 15 (1.1) 26 (1.1) 11 (0.7) 20 (1.2) 15 (0.8) 37 (3.9) -- -- 20 and over... 15 (0.6) 14 (0.5) 26 (0.7) 11 (0.5) 19 (0.5) 13 (0.5) 30 (1.8) 74 (4.9)
2 and over... 17 (0.5) 15 (0.5) 26 (0.7) 12 (0.5) 20 (0.5) 14 (0.4) 31 (1.8) -- --

What We Eat in America, NHANES 2013-2014
Page 5 of 5Page 5 of 5
Symbol Legend
* Indicates an estimate that may be less statistically reliable than estimates that are not flagged. The rules for flagging estimated percentages and ratios are as follows:
Percent reporting: An estimated percentage between 25 and 75 percent is flagged when based on a sample size of less than 30 times the variance inflation factor (VIF), where the VIFrepresents a broadly calculated average design effect, or when the relative standard error is greater than 30 percent. An estimated percentage less than or equal to 25 percent or greater thanor equal to 75 percent is flagged when the smaller of np and n(1-p) is less than 8 times the VIF, where n is the sample size and p is the percentage expressed as a fraction. The VIF used inthis table is 1.98.
Nutrient ratios expressed as percentages: An estimated ratio between 25 and 75 percent is flagged when based on a sample size n* of less than 30 times the variance inflation factor(VIF), where the VIF represents a broadly calculated average design effect and n* is the number of individuals in the sample reporting non-zero intake of the respective nutrient. Anestimated ratio less than or equal to 25 percent or greater than or equal to 75 percent, is flagged when the smaller of n*p and n* (1-p) is less than 8 times the VIF, where p is the percentageexpressed as a fraction. Additionally, an estimated ratio is flagged when either the relative standard error or p/(1-p) times the relative standard error is greater than 30 percent. The VIFused in this table is 1.98.
Footnotes
1 Snack occasions were reported as distinct eating occasions during the dietary interview and consisted of one or more food and beverage items, including plain water. Water was the only itemreported in approximately 25 percent of the snack occasions. Survey respondents selected the name of all eating occasions from a fixed list that was provided during the interview. All reports of"snack", "drink" or "extended consumption" (items that were consumed over a long period of time) were included as snack occasions. Spanish language interviewers used Spanish languagesnack occasion names: "merienda", "entre comida", "botana", "bocadillo", "tentempie", and "bebida".
2 Percentages are estimated as a ratio of total nutrients from snacks for all individuals to total daily nutrient intakes for all individuals. Total daily nutrient intakes are available from:www.ars.usda.gov/nea/bhnrc/fsrg. See Table 2. Nutrient Intakes from Food and Beverages: Mean Amounts Consumed per Individual, by Race/Ethnicity and Age, in the United States,2013-2014.
3 The percentage of respondents in the race/ethnicity/age group who reported consuming at least one item at an eating occasion designated as snack.
4 A new sampling methodology was implemented for NHANES 2011-2012 to oversample non-Hispanic non-black Asians in addition to the ongoing oversample of Hispanics, non-Hispanicblacks, low-income whites/others, and whites/others 80+ years.
Abbreviations
SE = standard error; RAE = retinol activity equivalents; DFE = dietary folate equivalents.
Notes Applicable to All Tables in Series: What We Eat in America, NHANES 2013-2014
Sample weights designed for dietary analysis were used to allow estimates representative of the U. S. population for the years of collection.
The statistics in this table are estimated from Day 1 dietary recall interviews conducted in the What We Eat in America, National Health and Nutrition Examination Survey (NHANES) 2013-2014.The 24-hour dietary recalls were conducted in-person, by trained interviewers, using the USDA 5-step Automated Multiple-Pass Method. Food intakes were coded and nutrient values weredetermined using the USDA Food and Nutrient Database for Dietary Studies 2013-2014 www.ars.usda.gov/nea/bhnrc/fsrg.
Intakes of nutrients and other dietary components are based on the consumption of food and beverages, including water, and do not include intake from supplements or medications.
The table includes data from individuals 2 years and over. Breast-fed children were excluded because breast milk was not quantified in dietary recall interviews.
Although alcohol data are collected for all individuals, estimates are not presented for age groups under 20 years due to extreme variability and/or inadequate sample size.
Suggested Citation
U.S. Department of Agriculture, Agricultural Research Service. 2016. Snacks: Percentages of Selected Nutrients Contributed by Food and Beverages Consumed at Snack Occasions, byRace/Ethnicity and Age, What We Eat in America, NHANES 2013-2014.

DATA SOURCE: What We Eat in America, NHANES 2013-2014, individuals 2 years and over (excluding breast-fed children), day 1. Available: www.ars.usda.gov/nea/bhnrc/fsrg.Page 1 of 5
What We Eat in America, NHANES 2013-2014
Table 27. Snacks1: Percentages2 of Selected Nutrients Contributed by Food and Beverages Consumed at Snack Occasions,by Family Income (in Dollars) and Age, in the United States, 2013-2014
Family incomein dollarsand age
Percentreporting3 Energy Protein
Carbo-hydrate
Totalsugars
Dietaryfiber
Totalfat
Saturatedfat
Mono-unsaturated
fat
Poly-unsaturated
fat(years) % (SE) % (SE) % (SE) % (SE) % (SE) % (SE) % (SE) % (SE) % (SE) % (SE)
$0 - $24,999:2 - 5.............. 98* (0.8) 30 (1.4) 20 (1.6) 34 (1.5) 42 (1.9) 28 (1.6) 29 (1.7) 30 (1.8) 27 (1.4) 29 (2.5)6 - 11.............. 96* (1.4) 25 (1.8) 17 (1.9) 27 (1.8) 34 (2.3) 21 (1.7) 26 (2.1) 26 (2.5) 25 (2.0) 28 (2.7)
12 - 19.............. 90 (2.2) 27 (1.3) 13 (0.8) 32 (1.6) 44 (2.2) 22 (1.6) 24 (1.9) 26 (2.1) 23 (2.2) 23 (2.0)20 and over... 94 (0.8) 27 (0.7) 14 (0.6) 31 (1.0) 43 (1.1) 20 (1.1) 22 (1.1) 23 (1.3) 22 (1.1) 21 (1.1)
2 and over... 94 (0.8) 27 (0.6) 14 (0.5) 31 (0.8) 42 (1.0) 21 (0.8) 23 (1.0) 24 (1.2) 23 (1.0) 22 (1.1)
$25,000 - $74,999:2 - 5.............. 98* (0.9) 34 (1.6) 23 (1.7) 39 (1.8) 47 (2.9) 29 (2.1) 30 (2.4) 32 (2.9) 29 (2.5) 30 (2.1)6 - 11.............. 97* (0.9) 24 (1.2) 14 (1.1) 28 (1.4) 36 (2.3) 21 (1.2) 22 (1.4) 23 (1.5) 21 (1.6) 22 (1.5)
12 - 19.............. 91 (1.6) 22 (0.9) 13 (1.0) 25 (0.9) 32 (1.4) 20 (1.1) 20 (1.3) 22 (1.5) 20 (1.7) 20 (1.5)20 and over... 96 (0.6) 24 (0.9) 14 (0.7) 28 (0.9) 38 (1.1) 20 (1.1) 21 (1.0) 22 (1.0) 21 (1.1) 20 (1.4)
2 and over... 95 (0.5) 24 (0.7) 14 (0.5) 28 (0.8) 38 (1.0) 20 (0.9) 21 (0.8) 22 (0.8) 21 (1.0) 20 (1.2)
$75,000 and higher:2 - 5.............. 100* (0.3) 29 (1.3) 17 (1.2) 33 (2.0) 40 (2.2) 22 (2.1) 27 (1.2) 27 (1.5) 27 (1.4) 30 (3.0)6 - 11.............. 98* (0.9) 25 (1.1) 14 (0.9) 28 (1.2) 35 (1.5) 23 (1.5) 24 (1.3) 27 (2.4) 23 (1.4) 22 (1.1)
12 - 19.............. 93 (2.4) 23 (1.8) 12 (0.8) 26 (2.3) 34 (3.3) 20 (1.2) 21 (1.7) 23 (1.7) 20 (1.6) 21 (3.3)20 and over... 96 (0.7) 23 (0.9) 12 (0.7) 25 (1.0) 35 (1.3) 19 (0.7) 21 (0.8) 22 (0.8) 22 (0.8) 20 (1.0)
2 and over... 96 (0.6) 23 (0.7) 13 (0.6) 26 (0.7) 35 (1.1) 20 (0.6) 21 (0.6) 23 (0.8) 22 (0.6) 20 (0.7)
All Individuals4:2 - 5.............. 98* (0.5) 31 (0.7) 20 (1.0) 35 (0.9) 42 (1.4) 26 (1.0) 29 (1.1) 30 (1.1) 27 (1.1) 30 (1.6)6 - 11.............. 97 (0.6) 25 (0.8) 15 (0.8) 28 (0.7) 35 (1.1) 22 (0.8) 24 (1.1) 25 (1.6) 23 (1.1) 24 (1.2)
12 - 19.............. 92 (1.0) 23 (0.9) 13 (0.7) 28 (1.2) 37 (1.8) 21 (0.9) 22 (0.9) 23 (0.9) 21 (1.0) 21 (1.5)20 and over... 95 (0.6) 24 (0.6) 13 (0.5) 27 (0.6) 38 (0.9) 20 (0.6) 21 (0.7) 22 (0.8) 22 (0.8) 20 (0.9)
2 and over... 95 (0.5) 24 (0.5) 13 (0.4) 28 (0.5) 38 (0.8) 20 (0.5) 22 (0.6) 23 (0.7) 22 (0.6) 21 (0.7)

DATA SOURCE: What We Eat in America, NHANES 2013-2014, individuals 2 years and over (excluding breast-fed children), day 1. Available: www.ars.usda.gov/nea/bhnrc/fsrg.Page 2 of 5
What We Eat in America, NHANES 2013-2014
Table 27. Snacks1: Percentages2 of Selected Nutrients Contributed by Food and Beverages Consumed at Snack Occasions,by Family Income (in Dollars) and Age, in the United States, 2013-2014 (continued)
Family incomein dollarsand age
Choles-terol
Vitamin A(RAE)
Beta-carotene Lycopene Thiamin
Ribo-flavin Niacin Vitamin B6
Folate(DFE)
(years) % (SE) % (SE) % (SE) % (SE) % (SE) % (SE) % (SE) % (SE) % (SE)
$0 - $24,999:2 - 5.............. 14 (1.3) 24 (2.4) 23* (7.1) 21*(10.9) 22 (1.2) 26 (2.1) 18 (1.2) 21 (1.6) 18 (1.4)6 - 11.............. 15 (2.0) 17 (2.0) 16 (3.1) 8* (2.8) 18 (1.7) 19 (2.2) 18 (1.5) 18 (1.9) 17 (1.6)
12 - 19.............. 10 (1.0) 20 (1.5) 13 (3.1) 11* (3.7) 17 (0.6) 22 (2.2) 17 (1.8) 18 (2.5) 17 (1.4)20 and over... 11 (0.9) 21 (1.6) 16 (3.7) 11 (3.2) 18 (0.9) 24 (0.9) 18 (0.8) 18 (1.0) 18 (0.8)
2 and over... 11 (0.8) 20 (1.4) 16 (3.2) 11 (2.6) 18 (0.6) 24 (0.8) 18 (0.7) 18 (1.0) 18 (0.6)
$25,000 - $74,999:2 - 5.............. 16 (2.6) 25 (2.2) 15 (3.7) 10* (3.0) 27 (2.9) 31 (1.9) 23 (3.2) 23 (2.7) 23 (2.6)6 - 11.............. 12 (1.0) 19 (2.1) 28 (7.7) 8 (1.7) 17 (1.3) 20 (2.5) 14 (1.1) 15 (1.6) 18 (1.6)
12 - 19.............. 9 (0.9) 21 (3.2) 27*(11.1) 4 (1.1) 15 (1.3) 21 (1.9) 14 (1.3) 16 (1.7) 15 (2.1)20 and over... 9 (0.6) 16 (1.1) 11 (1.0) 11 (1.2) 16 (1.0) 23 (1.1) 17 (1.1) 19 (1.4) 16 (0.9)
2 and over... 10 (0.5) 17 (0.9) 13 (1.6) 10 (0.9) 16 (0.9) 23 (0.9) 17 (0.9) 19 (1.1) 16 (0.8)
$75,000 and higher:2 - 5.............. 16 (2.2) 24 (3.0) 23*(13.0) 5* (3.4) 20 (1.9) 25 (1.6) 16 (1.4) 18 (1.9) 18 (2.7)6 - 11.............. 13 (1.3) 16 (1.8) 8 (2.2) 6* (1.7) 15 (1.5) 20 (1.9) 13 (1.0) 14 (1.0) 14 (1.8)
12 - 19.............. 11 (1.1) 21 (2.3) 19*(10.2) 6* (2.9) 18 (3.1) 21 (2.1) 16 (2.3) 20 (4.4) 16 (2.2)20 and over... 9 (0.7) 16 (1.1) 11 (1.8) 7 (1.2) 14 (0.6) 21 (1.0) 14 (0.7) 16 (1.0) 14 (0.8)
2 and over... 10 (0.5) 17 (0.9) 12 (1.9) 7 (1.1) 15 (0.5) 21 (0.8) 14 (0.6) 17 (0.9) 15 (0.5)
All Individuals4:2 - 5.............. 15 (1.2) 24 (1.4) 20 (5.3) 12* (4.1) 23 (1.1) 27 (1.1) 19 (1.2) 21 (1.1) 20 (1.3)6 - 11.............. 12 (0.9) 17 (1.2) 16 (3.3) 8 (1.0) 17 (0.8) 20 (1.5) 15 (0.9) 16 (1.1) 17 (0.9)
12 - 19.............. 10 (0.6) 20 (1.3) 19 (5.6) 7 (1.7) 17 (1.5) 21 (1.1) 16 (1.0) 18 (1.7) 17 (1.3)20 and over... 9 (0.5) 17 (0.9) 12 (1.3) 9 (0.9) 16 (0.5) 23 (0.7) 16 (0.5) 18 (0.8) 16 (0.5)
2 and over... 10 (0.4) 18 (0.7) 13 (1.2) 9 (0.8) 16 (0.5) 22 (0.5) 16 (0.4) 18 (0.5) 16 (0.4)

DATA SOURCE: What We Eat in America, NHANES 2013-2014, individuals 2 years and over (excluding breast-fed children), day 1. Available: www.ars.usda.gov/nea/bhnrc/fsrg.Page 3 of 5
What We Eat in America, NHANES 2013-2014
Table 27. Snacks1: Percentages2 of Selected Nutrients Contributed by Food and Beverages Consumed at Snack Occasions,by Family Income (in Dollars) and Age, in the United States, 2013-2014 (continued)
Family incomein dollarsand age Choline Vitamin B12 Vitamin C Vitamin D
Vitamin E(alpha-
tocopherol) Vitamin K Calcium Phosphorus Magnesium(years) % (SE) % (SE) % (SE) % (SE) % (SE) % (SE) % (SE) % (SE) % (SE)
$0 - $24,999:2 - 5.............. 19 (1.1) 21 (2.7) 40 (3.9) 27 (3.7) 31 (2.5) 21 (2.9) 33 (2.9) 26 (1.9) 30 (1.4)6 - 11.............. 16 (1.8) 15 (2.1) 28 (2.2) 17 (3.1) 27 (1.7) 27 (3.6) 22 (2.4) 19 (2.0) 24 (1.6)
12 - 19.............. 13 (0.8) 19 (3.7) 29 (4.5) 16 (2.5) 28 (3.6) 19 (3.3) 25 (1.4) 18 (1.1) 26 (1.5)20 and over... 17 (0.8) 17 (1.2) 29 (1.9) 21 (1.4) 25 (1.3) 13 (1.3) 26 (1.2) 20 (0.8) 28 (0.6)
2 and over... 17 (0.7) 17 (1.2) 30 (1.5) 20 (1.3) 25 (1.3) 15 (1.1) 26 (1.0) 20 (0.6) 28 (0.5)
$25,000 - $74,999:2 - 5.............. 22 (1.8) 24 (2.8) 40 (4.0) 29 (4.2) 32 (2.8) 25 (2.2) 33 (2.7) 28 (2.1) 31 (2.2)6 - 11.............. 14 (1.2) 14 (2.3) 28 (2.9) 14 (3.0) 25 (1.3) 18 (2.3) 20 (2.4) 17 (1.6) 23 (2.1)
12 - 19.............. 13 (0.7) 17 (2.3) 25 (2.9) 23 (2.8) 23 (1.5) 12 (1.9) 24 (1.5) 18 (1.0) 24 (1.0)20 and over... 16 (0.8) 16 (1.1) 23 (1.0) 15 (1.5) 25 (2.2) 10 (0.8) 25 (1.2) 19 (1.0) 28 (1.2)
2 and over... 15 (0.7) 16 (0.9) 24 (1.0) 17 (1.2) 25 (1.7) 11 (0.7) 25 (0.9) 19 (0.8) 27 (1.1)
$75,000 and higher:2 - 5.............. 20 (2.3) 20 (2.1) 34 (4.7) 26 (2.7) 27 (3.5) 27 (4.3) 25 (1.6) 22 (1.3) 25 (1.1)6 - 11.............. 15 (1.1) 13 (1.4) 27 (2.4) 15 (2.2) 28 (1.9) 13 (2.0) 20 (1.3) 18 (0.8) 24 (1.2)
12 - 19.............. 15 (1.7) 21 (3.6) 23 (4.3) 20 (2.8) 24 (2.9) 13 (2.6) 23 (1.5) 18 (1.2) 24 (1.7)20 and over... 14 (1.0) 14 (1.0) 19 (1.1) 15 (1.5) 22 (1.1) 9 (0.7) 24 (0.8) 18 (0.8) 26 (0.9)
2 and over... 15 (0.8) 15 (1.0) 21 (0.9) 16 (1.3) 23 (0.9) 9 (0.6) 23 (0.7) 18 (0.6) 25 (0.7)
All Individuals4:2 - 5.............. 21 (1.1) 22 (1.5) 39 (2.5) 27 (2.1) 30 (1.7) 24 (1.4) 30 (1.7) 25 (1.2) 29 (0.9)6 - 11.............. 15 (0.8) 14 (1.2) 27 (1.1) 15 (1.5) 27 (1.2) 18 (1.8) 20 (1.1) 18 (0.9) 24 (1.0)
12 - 19.............. 14 (0.7) 19 (1.7) 26 (2.6) 20 (1.6) 25 (1.8) 14 (1.2) 24 (0.6) 18 (0.7) 25 (1.0)20 and over... 15 (0.6) 15 (0.7) 24 (0.7) 16 (1.1) 24 (1.2) 10 (0.6) 25 (0.8) 19 (0.7) 27 (0.7)
2 and over... 15 (0.5) 16 (0.6) 25 (0.7) 17 (0.9) 24 (1.0) 11 (0.5) 25 (0.6) 19 (0.5) 27 (0.5)

DATA SOURCE: What We Eat in America, NHANES 2013-2014, individuals 2 years and over (excluding breast-fed children), day 1. Available: www.ars.usda.gov/nea/bhnrc/fsrg.Page 4 of 5
What We Eat in America, NHANES 2013-2014
Table 27. Snacks1: Percentages2 of Selected Nutrients Contributed by Food and Beverages Consumed at Snack Occasions,by Family Income (in Dollars) and Age, in the United States, 2013-2014 (continued)
Family incomein dollarsand age Iron Zinc Copper Selenium Potassium Sodium Caffeine Alcohol(years) % (SE) % (SE) % (SE) % (SE) % (SE) % (SE) % (SE) % (SE)
$0 - $24,999:2 - 5.............. 20 (1.1) 22 (1.7) 31 (1.3) 16 (1.5) 30 (1.7) 20 (1.5) 63 (5.2) -- -- 6 - 11.............. 18 (1.7) 16 (1.6) 24 (1.5) 15 (2.0) 21 (1.8) 18 (1.8) 43 (7.6) -- --
12 - 19.............. 20 (1.6) 17 (1.2) 28 (2.1) 12 (1.0) 20 (1.2) 16 (0.8) 51 (5.3) -- -- 20 and over... 18 (0.8) 17 (0.7) 28 (0.8) 12 (0.7) 23 (0.8) 15 (0.8) 42 (2.6) 69 (2.8)
2 and over... 18 (0.5) 17 (0.6) 28 (0.7) 12 (0.5) 23 (0.7) 15 (0.6) 43 (2.6) -- --
$25,000 - $74,999:2 - 5.............. 26 (3.1) 25 (2.7) 33 (2.9) 20 (1.6) 31 (2.1) 23 (2.6) 55 (10.0) -- -- 6 - 11.............. 20 (1.7) 17 (2.1) 25 (2.2) 13 (1.2) 19 (2.0) 15 (0.9) 51 (7.8) -- --
12 - 19.............. 16 (1.5) 14 (1.4) 25 (1.1) 10 (0.9) 19 (0.8) 16 (1.0) 39 (3.5) -- -- 20 and over... 16 (0.8) 16 (0.7) 28 (1.2) 11 (0.6) 20 (0.7) 13 (0.5) 38 (2.4) 69 (3.7)
2 and over... 17 (0.8) 16 (0.6) 28 (1.1) 11 (0.4) 21 (0.7) 14 (0.4) 38 (2.3) -- --
$75,000 and higher:2 - 5.............. 21 (2.4) 19 (1.1) 28 (1.0) 14 (0.9) 26 (1.1) 18 (1.4) 40 (5.8) -- -- 6 - 11.............. 18 (1.9) 15 (1.0) 28 (1.6) 11 (1.0) 21 (1.0) 14 (1.1) 41 (7.2) -- --
12 - 19.............. 15 (1.3) 16 (1.3) 26 (2.0) 9 (1.0) 19 (1.4) 14 (0.7) 38 (6.5) -- -- 20 and over... 15 (0.7) 16 (0.7) 28 (0.8) 10 (0.8) 20 (0.9) 12 (0.5) 36 (2.5) 58 (4.9)
2 and over... 16 (0.6) 16 (0.6) 28 (0.6) 10 (0.6) 20 (0.7) 13 (0.4) 36 (2.4) -- --
All Individuals4:2 - 5.............. 22 (1.1) 22 (1.2) 30 (1.0) 17 (0.8) 29 (1.1) 20 (1.0) 52 (3.8) -- -- 6 - 11.............. 19 (1.2) 16 (0.8) 26 (1.1) 12 (0.7) 20 (1.0) 15 (0.6) 45 (4.8) -- --
12 - 19.............. 17 (1.0) 16 (0.8) 26 (1.0) 11 (0.7) 20 (0.7) 15 (0.6) 41 (3.4) -- -- 20 and over... 16 (0.5) 16 (0.6) 28 (0.7) 11 (0.5) 21 (0.6) 13 (0.4) 39 (1.9) 64 (2.4)
2 and over... 17 (0.4) 16 (0.4) 28 (0.6) 11 (0.3) 21 (0.5) 14 (0.3) 39 (1.8) -- --

What We Eat in America, NHANES 2013-2014
Page 5 of 5Page 5 of 5
Symbol Legend
* Indicates an estimate that may be less statistically reliable than estimates that are not flagged. The rules for flagging estimated percentages and ratios are as follows:
Percent reporting: An estimated percentage between 25 and 75 percent is flagged when based on a sample size of less than 30 times the variance inflation factor (VIF), where the VIFrepresents a broadly calculated average design effect, or when the relative standard error is greater than 30 percent. An estimated percentage less than or equal to 25 percent or greater thanor equal to 75 percent is flagged when the smaller of np and n(1-p) is less than 8 times the VIF, where n is the sample size and p is the percentage expressed as a fraction. The VIF used inthis table is 1.98.
Nutrient ratios expressed as percentages: An estimated ratio between 25 and 75 percent is flagged when based on a sample size n* of less than 30 times the variance inflation factor(VIF), where the VIF represents a broadly calculated average design effect and n* is the number of individuals in the sample reporting non-zero intake of the respective nutrient. Anestimated ratio less than or equal to 25 percent or greater than or equal to 75 percent, is flagged when the smaller of n*p and n* (1-p) is less than 8 times the VIF, where p is the percentageexpressed as a fraction. Additionally, an estimated ratio is flagged when either the relative standard error or p/(1-p) times the relative standard error is greater than 30 percent. The VIFused in this table is 1.98.
Footnotes
1 Snack occasions were reported as distinct eating occasions during the dietary interview and consisted of one or more food and beverage items, including plain water. Water was the only itemreported in approximately 25 percent of the snack occasions. Survey respondents selected the name of all eating occasions from a fixed list that was provided during the interview. All reports of"snack", "drink" or "extended consumption" (items that were consumed over a long period of time) were included as snack occasions. Spanish language interviewers used Spanish languagesnack occasion names: "merienda", "entre comida", "botana", "bocadillo", "tentempie", and "bebida".
2 Percentages are estimated as a ratio of total nutrients from snacks for all individuals to total daily nutrient intakes for all individuals. Total daily nutrient intakes are available from:www.ars.usda.gov/nea/bhnrc/fsrg. See Table 3. Nutrient Intakes from Food and Beverages: Mean Amounts Consumed per Individual, by Family Income (in Dollars) and Age, in the UnitedStates, 2013-2014.
3 The percentage of respondents in the income/age group who reported consuming at least one item at an eating occasion designated as snack.
4 Includes persons of all income levels or with unknown family income.
Abbreviations
SE = standard error; RAE = retinol activity equivalents; DFE = dietary folate equivalents.
Notes Applicable to All Tables in Series: What We Eat in America, NHANES 2013-2014
Sample weights designed for dietary analysis were used to allow estimates representative of the U. S. population for the years of collection.
The statistics in this table are estimated from Day 1 dietary recall interviews conducted in the What We Eat in America, National Health and Nutrition Examination Survey (NHANES) 2013-2014.The 24-hour dietary recalls were conducted in-person, by trained interviewers, using the USDA 5-step Automated Multiple-Pass Method. Food intakes were coded and nutrient values weredetermined using the USDA Food and Nutrient Database for Dietary Studies 2013-2014 www.ars.usda.gov/nea/bhnrc/fsrg.
Intakes of nutrients and other dietary components are based on the consumption of food and beverages, including water, and do not include intake from supplements or medications.
The table includes data from individuals 2 years and over. Breast-fed children were excluded because breast milk was not quantified in dietary recall interviews.
Although alcohol data are collected for all individuals, estimates are not presented for age groups under 20 years due to extreme variability and/or inadequate sample size.
Suggested Citation
U.S. Department of Agriculture, Agricultural Research Service. 2016. Snacks: Percentages of Selected Nutrients Contributed by Food and Beverages Consumed at Snack Occasions, by FamilyIncome (in Dollars) and Age, What We Eat in America, NHANES 2013-2014.

DATA SOURCE: What We Eat in America, NHANES 2013-2014, individuals 2 years and over (excluding breast-fed children), day 1. Available: www.ars.usda.gov/nea/bhnrc/fsrg.Page 1 of 5
What We Eat in America, NHANES 2013-2014
Table 28. Snacks1: Percentages2 of Selected Nutrients Contributed by Food and Beverages Consumed at Snack Occasions,by Family Income (as % of Poverty Level3) and Age, in the United States, 2013-2014
Family income as% of poverty level
and age Percent
reporting4 Energy Protein Carbo-hydrate
Totalsugars
Dietaryfiber
Totalfat
Saturatedfat
Mono-unsaturated
fat
Poly-unsaturated
fat(years) % (SE) % (SE) % (SE) % (SE) % (SE) % (SE) % (SE) % (SE) % (SE) % (SE)
Under 131% poverty:2 - 5.............. 98* (0.7) 31 (1.6) 21 (1.7) 35 (1.7) 43 (2.0) 29 (1.3) 30 (1.7) 30 (1.9) 28 (1.6) 31 (2.4)6 - 11.............. 96 (0.9) 25 (1.3) 15 (1.1) 28 (1.2) 34 (1.5) 21 (1.0) 25 (1.9) 24 (2.0) 24 (1.6) 27 (2.3)
12 - 19.............. 89 (2.1) 25 (1.2) 13 (0.8) 30 (1.7) 40 (2.7) 22 (1.7) 23 (1.6) 24 (1.7) 22 (1.7) 22 (1.8)20 and over... 93 (0.9) 27 (0.9) 14 (0.6) 31 (1.0) 43 (1.2) 20 (0.9) 22 (1.1) 23 (1.3) 22 (1.1) 21 (1.2)
2 and over... 93 (0.8) 27 (0.8) 14 (0.5) 31 (0.9) 42 (1.0) 21 (0.7) 23 (1.1) 23 (1.2) 22 (1.1) 22 (1.2)
131-350% poverty:2 - 5.............. 98* (1.0) 33 (1.4) 21 (1.5) 39 (1.9) 45 (3.1) 27 (2.0) 29 (2.4) 31 (3.5) 27 (2.5) 30 (2.3)6 - 11.............. 96* (1.3) 24 (1.1) 14 (1.2) 28 (1.4) 36 (2.1) 21 (1.7) 21 (1.2) 23 (1.5) 20 (1.4) 21 (1.6)
12 - 19.............. 91 (2.4) 22 (1.9) 12 (1.1) 26 (1.8) 35 (2.6) 20 (1.7) 21 (2.1) 22 (1.9) 20 (1.9) 21 (3.6)20 and over... 95 (0.6) 24 (1.0) 13 (0.8) 27 (1.1) 37 (1.3) 20 (1.1) 21 (1.2) 22 (1.2) 21 (1.3) 20 (1.5)
2 and over... 95 (0.6) 24 (0.7) 13 (0.6) 27 (0.7) 37 (1.1) 21 (0.9) 22 (0.9) 23 (0.9) 21 (1.0) 20 (1.1)
Over 350% poverty:2 - 5.............. 99* (0.4) 29 (1.6) 18 (1.2) 33 (2.4) 40 (3.6) 22 (2.4) 27 (1.3) 27 (1.7) 27 (1.4) 28 (2.9)6 - 11.............. 99* (0.6) 25 (1.5) 14 (1.1) 29 (1.4) 36 (1.9) 23 (1.8) 25 (2.1) 28 (3.7) 24 (1.8) 22 (1.5)
12 - 19.............. 96* (1.4) 22 (1.6) 14 (1.3) 26 (1.9) 33 (2.4) 20 (1.4) 21 (1.9) 23 (2.2) 21 (2.0) 19 (2.2)20 and over... 97 (0.7) 23 (1.0) 13 (0.8) 25 (0.9) 36 (1.4) 19 (0.6) 21 (0.8) 22 (0.8) 22 (0.8) 19 (1.1)
2 and over... 97 (0.6) 23 (0.9) 13 (0.7) 26 (0.8) 36 (1.1) 20 (0.6) 21 (0.7) 23 (0.9) 22 (0.7) 20 (0.9)
All Individuals5:2 - 5.............. 98* (0.5) 31 (0.7) 20 (1.0) 35 (0.9) 42 (1.4) 26 (1.0) 29 (1.1) 30 (1.1) 27 (1.1) 30 (1.6)6 - 11.............. 97 (0.6) 25 (0.8) 15 (0.8) 28 (0.7) 35 (1.1) 22 (0.8) 24 (1.1) 25 (1.6) 23 (1.1) 24 (1.2)
12 - 19.............. 92 (1.0) 23 (0.9) 13 (0.7) 28 (1.2) 37 (1.8) 21 (0.9) 22 (0.9) 23 (0.9) 21 (1.0) 21 (1.5)20 and over... 95 (0.6) 24 (0.6) 13 (0.5) 27 (0.6) 38 (0.9) 20 (0.6) 21 (0.7) 22 (0.8) 22 (0.8) 20 (0.9)
2 and over... 95 (0.5) 24 (0.5) 13 (0.4) 28 (0.5) 38 (0.8) 20 (0.5) 22 (0.6) 23 (0.7) 22 (0.6) 21 (0.7)

DATA SOURCE: What We Eat in America, NHANES 2013-2014, individuals 2 years and over (excluding breast-fed children), day 1. Available: www.ars.usda.gov/nea/bhnrc/fsrg.Page 2 of 5
What We Eat in America, NHANES 2013-2014
Table 28. Snacks1: Percentages2 of Selected Nutrients Contributed by Food and Beverages Consumed at Snack Occasions,by Family Income (as % of Poverty Level3) and Age, in the United States, 2013-2014 (continued)
Family income as% of poverty level
and age Choles-
terol Vitamin A
(RAE) Beta-
carotene Lycopene Thiamin Ribo-flavin Niacin Vitamin B6
Folate(DFE)
(years) % (SE) % (SE) % (SE) % (SE) % (SE) % (SE) % (SE) % (SE) % (SE)
Under 131% poverty:2 - 5.............. 15 (1.5) 24 (1.8) 19 (4.7) 20* (8.7) 23 (1.4) 28 (1.9) 19 (1.3) 22 (1.2) 20 (1.5)6 - 11.............. 13 (1.1) 16 (1.8) 14 (3.4) 7 (2.0) 17 (1.2) 18 (1.2) 16 (0.8) 16 (0.6) 17 (1.2)
12 - 19.............. 9 (0.8) 19 (1.2) 13 (2.4) 11 (2.8) 17 (1.0) 22 (1.4) 17 (1.4) 19 (1.8) 17 (1.4)20 and over... 10 (0.7) 20 (1.3) 15 (2.2) 13 (2.7) 17 (0.7) 25 (1.0) 18 (1.0) 20 (1.2) 17 (0.8)
2 and over... 11 (0.6) 20 (0.9) 15 (1.8) 12 (1.9) 17 (0.5) 24 (0.7) 18 (0.8) 19 (0.9) 17 (0.5)
131-350% poverty:2 - 5.............. 13 (2.3) 24 (3.0) 14* (4.5) 7* (2.2) 26 (2.8) 30 (1.6) 21 (3.3) 21 (2.5) 22 (2.0)6 - 11.............. 12 (1.0) 20 (2.5) 27* (8.0) 7 (1.6) 16 (1.3) 21 (2.7) 13 (1.2) 16 (1.8) 16 (1.2)
12 - 19.............. 10 (1.1) 23 (3.7) 35 (10.2) 3* (0.9) 13 (1.2) 19 (1.9) 12 (1.6) 14 (2.1) 14 (2.1)20 and over... 9 (0.6) 16 (1.5) 11 (2.2) 10 (1.4) 15 (0.9) 22 (1.2) 16 (1.1) 18 (1.4) 16 (1.1)
2 and over... 10 (0.5) 18 (1.2) 14 (2.4) 9 (1.0) 15 (0.7) 22 (0.8) 16 (0.8) 18 (0.9) 16 (0.9)
Over 350% poverty:2 - 5.............. 17 (1.7) 25 (3.7) 29*(15.3) 6* (4.8) 20 (1.8) 24 (1.4) 16 (1.6) 19 (2.4) 17 (2.6)6 - 11.............. 13 (1.2) 15 (2.1) 8* (2.9) 7* (2.2) 16 (1.7) 19 (1.4) 14 (1.3) 14 (1.4) 16 (2.2)
12 - 19.............. 12 (1.6) 18 (2.1) 8* (2.8) 9* (4.1) 21 (4.3) 23 (2.2) 19 (3.0) 23 (5.5) 18 (2.7)20 and over... 9 (0.6) 16 (1.2) 12 (1.7) 7 (1.4) 15 (0.9) 22 (1.0) 15 (0.7) 16 (1.0) 15 (0.6)
2 and over... 10 (0.6) 16 (1.2) 12 (1.7) 7 (1.3) 16 (0.9) 22 (0.9) 15 (0.7) 17 (1.0) 15 (0.6)
All Individuals5:2 - 5.............. 15 (1.2) 24 (1.4) 20 (5.3) 12* (4.1) 23 (1.1) 27 (1.1) 19 (1.2) 21 (1.1) 20 (1.3)6 - 11.............. 12 (0.9) 17 (1.2) 16 (3.3) 8 (1.0) 17 (0.8) 20 (1.5) 15 (0.9) 16 (1.1) 17 (0.9)
12 - 19.............. 10 (0.6) 20 (1.3) 19 (5.6) 7 (1.7) 17 (1.5) 21 (1.1) 16 (1.0) 18 (1.7) 17 (1.3)20 and over... 9 (0.5) 17 (0.9) 12 (1.3) 9 (0.9) 16 (0.5) 23 (0.7) 16 (0.5) 18 (0.8) 16 (0.5)
2 and over... 10 (0.4) 18 (0.7) 13 (1.2) 9 (0.8) 16 (0.5) 22 (0.5) 16 (0.4) 18 (0.5) 16 (0.4)

DATA SOURCE: What We Eat in America, NHANES 2013-2014, individuals 2 years and over (excluding breast-fed children), day 1. Available: www.ars.usda.gov/nea/bhnrc/fsrg.Page 3 of 5
What We Eat in America, NHANES 2013-2014
Table 28. Snacks1: Percentages2 of Selected Nutrients Contributed by Food and Beverages Consumed at Snack Occasions,by Family Income (as % of Poverty Level3) and Age, in the United States, 2013-2014 (continued)
Family income as% of poverty level
and age Choline Vitamin B12 Vitamin C Vitamin D
Vitamin E(alpha-
tocopherol) Vitamin K Calcium Phosphorus Magnesium(years) % (SE) % (SE) % (SE) % (SE) % (SE) % (SE) % (SE) % (SE) % (SE)
Under 131% poverty:2 - 5.............. 21 (1.2) 22 (2.1) 41 (3.5) 29 (3.0) 32 (2.3) 22 (2.7) 33 (2.6) 27 (2.0) 31 (1.4)6 - 11.............. 14 (0.9) 13 (1.1) 28 (2.0) 15 (1.7) 26 (1.8) 21 (2.1) 21 (1.7) 18 (1.3) 23 (0.9)
12 - 19.............. 13 (0.6) 19 (2.3) 29 (3.8) 17 (1.7) 28 (3.1) 18 (2.8) 24 (1.2) 18 (1.0) 25 (1.3)20 and over... 17 (0.9) 18 (1.2) 30 (1.5) 20 (1.2) 26 (1.2) 14 (1.4) 26 (1.0) 19 (0.7) 28 (0.8)
2 and over... 16 (0.7) 18 (0.9) 30 (1.2) 20 (1.0) 26 (1.3) 16 (1.0) 26 (0.8) 20 (0.6) 28 (0.6)
131-350% poverty:2 - 5.............. 20 (1.7) 23 (3.1) 40 (4.6) 25 (4.7) 30 (2.9) 28 (3.0) 30 (2.8) 26 (1.9) 30 (2.3)6 - 11.............. 14 (1.1) 14 (1.9) 28 (3.3) 14 (2.7) 26 (2.1) 18 (2.1) 20 (2.4) 17 (1.8) 23 (1.8)
12 - 19.............. 14 (1.6) 16 (2.1) 26 (4.3) 21 (2.8) 22 (2.3) 12 (2.1) 23 (1.3) 18 (1.4) 24 (1.7)20 and over... 15 (0.8) 15 (1.1) 23 (1.0) 14 (1.2) 25 (2.6) 10 (1.1) 24 (1.2) 19 (1.1) 27 (1.3)
2 and over... 15 (0.6) 15 (0.8) 25 (1.0) 16 (1.1) 25 (2.0) 11 (1.0) 24 (0.9) 19 (0.7) 26 (1.1)
Over 350% poverty:2 - 5.............. 21 (2.3) 20 (2.2) 34 (5.2) 27 (2.4) 26 (4.3) 23 (2.6) 25 (1.5) 22 (1.3) 26 (1.4)6 - 11.............. 15 (1.2) 14 (1.6) 26 (3.6) 16 (3.1) 27 (2.2) 12 (2.3) 19 (2.0) 18 (1.2) 24 (1.3)
12 - 19.............. 15 (1.3) 24 (3.9) 21 (3.9) 23 (3.0) 25 (2.7) 12 (2.6) 24 (1.4) 18 (1.4) 25 (1.4)20 and over... 15 (1.1) 15 (1.2) 20 (1.1) 16 (2.2) 22 (1.1) 8 (0.6) 24 (0.9) 19 (1.0) 26 (0.8)
2 and over... 15 (1.0) 15 (1.2) 21 (0.9) 17 (1.9) 22 (1.0) 9 (0.6) 24 (0.8) 19 (0.9) 26 (0.7)
All Individuals5:2 - 5.............. 21 (1.1) 22 (1.5) 39 (2.5) 27 (2.1) 30 (1.7) 24 (1.4) 30 (1.7) 25 (1.2) 29 (0.9)6 - 11.............. 15 (0.8) 14 (1.2) 27 (1.1) 15 (1.5) 27 (1.2) 18 (1.8) 20 (1.1) 18 (0.9) 24 (1.0)
12 - 19.............. 14 (0.7) 19 (1.7) 26 (2.6) 20 (1.6) 25 (1.8) 14 (1.2) 24 (0.6) 18 (0.7) 25 (1.0)20 and over... 15 (0.6) 15 (0.7) 24 (0.7) 16 (1.1) 24 (1.2) 10 (0.6) 25 (0.8) 19 (0.7) 27 (0.7)
2 and over... 15 (0.5) 16 (0.6) 25 (0.7) 17 (0.9) 24 (1.0) 11 (0.5) 25 (0.6) 19 (0.5) 27 (0.5)
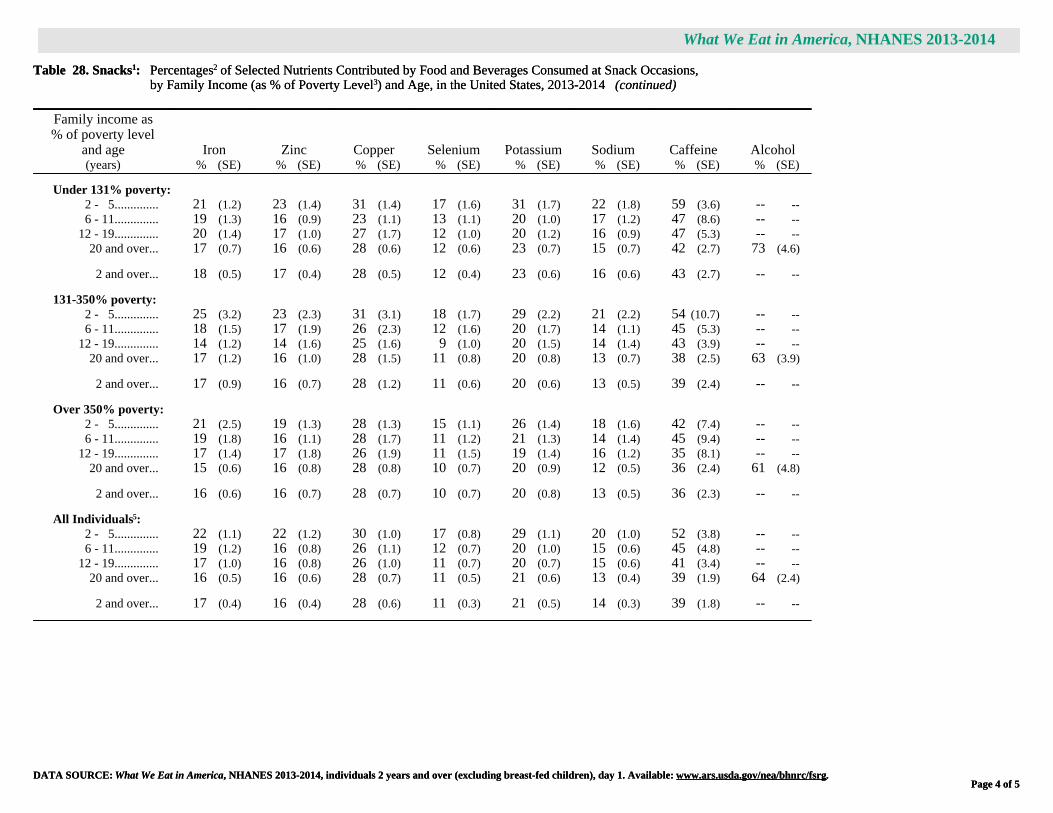
DATA SOURCE: What We Eat in America, NHANES 2013-2014, individuals 2 years and over (excluding breast-fed children), day 1. Available: www.ars.usda.gov/nea/bhnrc/fsrg.Page 4 of 5
What We Eat in America, NHANES 2013-2014
Table 28. Snacks1: Percentages2 of Selected Nutrients Contributed by Food and Beverages Consumed at Snack Occasions,by Family Income (as % of Poverty Level3) and Age, in the United States, 2013-2014 (continued)
Family income as% of poverty level
and age Iron Zinc Copper Selenium Potassium Sodium Caffeine Alcohol(years) % (SE) % (SE) % (SE) % (SE) % (SE) % (SE) % (SE) % (SE)
Under 131% poverty:2 - 5.............. 21 (1.2) 23 (1.4) 31 (1.4) 17 (1.6) 31 (1.7) 22 (1.8) 59 (3.6) -- -- 6 - 11.............. 19 (1.3) 16 (0.9) 23 (1.1) 13 (1.1) 20 (1.0) 17 (1.2) 47 (8.6) -- --
12 - 19.............. 20 (1.4) 17 (1.0) 27 (1.7) 12 (1.0) 20 (1.2) 16 (0.9) 47 (5.3) -- -- 20 and over... 17 (0.7) 16 (0.6) 28 (0.6) 12 (0.6) 23 (0.7) 15 (0.7) 42 (2.7) 73 (4.6)
2 and over... 18 (0.5) 17 (0.4) 28 (0.5) 12 (0.4) 23 (0.6) 16 (0.6) 43 (2.7) -- --
131-350% poverty:2 - 5.............. 25 (3.2) 23 (2.3) 31 (3.1) 18 (1.7) 29 (2.2) 21 (2.2) 54 (10.7) -- -- 6 - 11.............. 18 (1.5) 17 (1.9) 26 (2.3) 12 (1.6) 20 (1.7) 14 (1.1) 45 (5.3) -- --
12 - 19.............. 14 (1.2) 14 (1.6) 25 (1.6) 9 (1.0) 20 (1.5) 14 (1.4) 43 (3.9) -- -- 20 and over... 17 (1.2) 16 (1.0) 28 (1.5) 11 (0.8) 20 (0.8) 13 (0.7) 38 (2.5) 63 (3.9)
2 and over... 17 (0.9) 16 (0.7) 28 (1.2) 11 (0.6) 20 (0.6) 13 (0.5) 39 (2.4) -- --
Over 350% poverty:2 - 5.............. 21 (2.5) 19 (1.3) 28 (1.3) 15 (1.1) 26 (1.4) 18 (1.6) 42 (7.4) -- -- 6 - 11.............. 19 (1.8) 16 (1.1) 28 (1.7) 11 (1.2) 21 (1.3) 14 (1.4) 45 (9.4) -- --
12 - 19.............. 17 (1.4) 17 (1.8) 26 (1.9) 11 (1.5) 19 (1.4) 16 (1.2) 35 (8.1) -- -- 20 and over... 15 (0.6) 16 (0.8) 28 (0.8) 10 (0.7) 20 (0.9) 12 (0.5) 36 (2.4) 61 (4.8)
2 and over... 16 (0.6) 16 (0.7) 28 (0.7) 10 (0.7) 20 (0.8) 13 (0.5) 36 (2.3) -- --
All Individuals5:2 - 5.............. 22 (1.1) 22 (1.2) 30 (1.0) 17 (0.8) 29 (1.1) 20 (1.0) 52 (3.8) -- -- 6 - 11.............. 19 (1.2) 16 (0.8) 26 (1.1) 12 (0.7) 20 (1.0) 15 (0.6) 45 (4.8) -- --
12 - 19.............. 17 (1.0) 16 (0.8) 26 (1.0) 11 (0.7) 20 (0.7) 15 (0.6) 41 (3.4) -- -- 20 and over... 16 (0.5) 16 (0.6) 28 (0.7) 11 (0.5) 21 (0.6) 13 (0.4) 39 (1.9) 64 (2.4)
2 and over... 17 (0.4) 16 (0.4) 28 (0.6) 11 (0.3) 21 (0.5) 14 (0.3) 39 (1.8) -- --

What We Eat in America, NHANES 2013-2014
Page 5 of 5Page 5 of 5
Symbol Legend
* Indicates an estimate that may be less statistically reliable than estimates that are not flagged. The rules for flagging estimated percentages and ratios are as follows:
Percent reporting: An estimated percentage between 25 and 75 percent is flagged when based on a sample size of less than 30 times the variance inflation factor (VIF), where the VIFrepresents a broadly calculated average design effect, or when the relative standard error is greater than 30 percent. An estimated percentage less than or equal to 25 percent or greater thanor equal to 75 percent is flagged when the smaller of np and n(1-p) is less than 8 times the VIF, where n is the sample size and p is the percentage expressed as a fraction. The VIF used inthis table is 1.98.
Nutrient ratios expressed as percentages: An estimated ratio between 25 and 75 percent is flagged when based on a sample size n* of less than 30 times the variance inflation factor(VIF), where the VIF represents a broadly calculated average design effect and n* is the number of individuals in the sample reporting non-zero intake of the respective nutrient. Anestimated ratio less than or equal to 25 percent or greater than or equal to 75 percent, is flagged when the smaller of n*p and n* (1-p) is less than 8 times the VIF, where p is the percentageexpressed as a fraction. Additionally, an estimated ratio is flagged when either the relative standard error or p/(1-p) times the relative standard error is greater than 30 percent. The VIFused in this table is 1.98.
Footnotes
1 Snack occasions were reported as distinct eating occasions during the dietary interview and consisted of one or more food and beverage items, including plain water. Water was the only itemreported in approximately 25 percent of the snack occasions. Survey respondents selected the name of all eating occasions from a fixed list that was provided during the interview. All reports of"snack", "drink" or "extended consumption" (items that were consumed over a long period of time) were included as snack occasions. Spanish language interviewers used Spanish languagesnack occasion names: "merienda", "entre comida", "botana", "bocadillo", "tentempie", and "bebida".
2 Percentages are estimated as a ratio of total nutrients from snacks for all individuals to total daily nutrient intakes for all individuals. Total daily nutrient intakes are available from:www.ars.usda.gov/nea/bhnrc/fsrg. See Table 4. Nutrient Intakes from Food and Beverages: Mean Amounts Consumed per Individual, by Family Income (as % of Poverty Level) and Age, in theUnited States, 2013-2014.
3 The ratio of family income to poverty expressed as a percentage. The Department of Health and Human Services’ poverty guidelines were used as the poverty measure to calculate the ratio, http://aspe.hhs.gov/poverty/.
4 The percentage of respondents in the income/age group who reported consuming at least one item at an eating occasion designated as snack.
5 Includes persons of all income levels or with unknown family income.
Abbreviations
SE = standard error; RAE = retinol activity equivalents; DFE = dietary folate equivalents.
Notes Applicable to All Tables in Series: What We Eat in America, NHANES 2013-2014
Sample weights designed for dietary analysis were used to allow estimates representative of the U. S. population for the years of collection.
The statistics in this table are estimated from Day 1 dietary recall interviews conducted in the What We Eat in America, National Health and Nutrition Examination Survey (NHANES) 2013-2014.The 24-hour dietary recalls were conducted in-person, by trained interviewers, using the USDA 5-step Automated Multiple-Pass Method. Food intakes were coded and nutrient values weredetermined using the USDA Food and Nutrient Database for Dietary Studies 2013-2014 www.ars.usda.gov/nea/bhnrc/fsrg.
Intakes of nutrients and other dietary components are based on the consumption of food and beverages, including water, and do not include intake from supplements or medications.
The table includes data from individuals 2 years and over. Breast-fed children were excluded because breast milk was not quantified in dietary recall interviews.
Although alcohol data are collected for all individuals, estimates are not presented for age groups under 20 years due to extreme variability and/or inadequate sample size.
Suggested Citation
U.S. Department of Agriculture, Agricultural Research Service. 2016. Snacks: Percentages of Selected Nutrients Contributed by Food and Beverages Consumed at Snack Occasions, by FamilyIncome (as % of Poverty Level) and Age, What We Eat in America, NHANES 2013-2014.

DATA SOURCE: What We Eat in America, NHANES 2013-2014, individuals 2 years and over (excluding breast-fed children), day 1. Available: www.ars.usda.gov/nea/bhnrc/fsrg.Page 1 of 2
What We Eat in America, NHANES 2013-2014
Table 29. Snacks: Distribution of Snack Occasions1,by Gender and Age, in the United States, 2013-2014
──────────────────────────────── Number of snack occasions ────────────────────────────────────Genderand age
Samplesize Zero One Two Three Four Five Six
Sevenor more
(years) % (SE) % (SE) % (SE) % (SE) % (SE) % (SE) % (SE) % (SE)
Males:2 - 5.............. 337 2* (0.4) 10 (2.3) 24 (3.2) 28 (4.7) 18 (2.5) 9 (1.6) 7 (1.8) 3* (0.9)6 - 11.............. 537 3 (0.9) 22 (4.5) 25 (2.6) 23 (3.5) 16 (2.1) 7 (1.5) 2* (0.5) 2* (0.5)
12 - 19.............. 646 8 (1.6) 19 (2.5) 28 (1.7) 24 (2.4) 10 (1.6) 5 (1.1) 4 (1.4) 2* (1.0)
20 - 29.............. 424 6 (1.5) 21 (3.0) 23 (1.8) 23 (2.7) 14 (2.0) 7 (2.1) 3* (1.4) 5 (1.3)30 - 39.............. 429 5 (1.2) 15 (1.8) 19 (2.1) 25 (3.0) 17 (2.1) 6 (1.3) 8 (1.9) 4 (1.4)40 - 49.............. 410 5 (1.8) 14 (1.9) 20 (2.6) 26 (3.5) 17 (2.9) 8 (1.7) 5 (1.6) 4 (1.2)
50 - 59.............. 398 4 (1.0) 21 (2.2) 21 (3.7) 20 (3.4) 15 (2.5) 9 (3.1) 5 (1.6) 4 (1.7)60 - 69.............. 395 6 (1.9) 16 (3.0) 17 (2.3) 23 (2.3) 15 (2.6) 14 (3.2) 2* (0.9) 7 (2.6)70 and over...... 358 8 (2.0) 17 (2.5) 23 (2.8) 20 (3.4) 16 (3.4) 9 (1.9) 3* (1.1) 3* (1.1)
2 - 19............ 1520 5 (0.7) 18 (2.1) 26 (1.4) 24 (2.0) 13 (0.9) 6 (0.6) 4 (0.7) 2 (0.7)20 and over... 2414 6 (0.8) 18 (1.2) 20 (1.0) 23 (1.7) 16 (1.4) 9 (0.8) 4 (0.8) 5 (0.7)
2 and over... 3934 6 (0.6) 18 (1.2) 22 (0.9) 23 (1.3) 15 (1.1) 8 (0.6) 4 (0.6) 4 (0.5)
Females:2 - 5.............. 339 2* (0.8) 9 (1.9) 20 (3.3) 25 (3.0) 22 (2.9) 10 (2.2) 7 (1.1) 5 (1.8)6 - 11.............. 510 3* (0.6) 17 (2.9) 24 (2.2) 30 (3.0) 12 (1.4) 7 (1.4) 5 (1.7) 1* (0.5)
12 - 19.............. 650 9 (1.2) 21 (1.9) 30 (3.4) 21 (2.9) 11 (1.5) 5 (1.4) 2* (0.9) 2* (0.9)
20 - 29.............. 430 5 (0.8) 19 (2.7) 24 (3.7) 23 (2.9) 14 (2.0) 8 (1.5) 5 (1.7) 3* (1.2)30 - 39.............. 463 4 (1.1) 13 (2.0) 21 (2.6) 24 (2.9) 20 (2.6) 10 (1.9) 4 (0.9) 4 (1.2)40 - 49.............. 487 3* (0.4) 14 (1.8) 20 (2.0) 23 (2.8) 18 (2.8) 11 (2.2) 6 (1.8) 6 (1.3)
50 - 59.............. 439 4 (1.5) 12 (1.5) 21 (2.6) 21 (2.0) 17 (2.8) 14 (3.2) 5 (2.2) 6 (1.7)60 - 69.............. 433 3* (0.9) 14 (2.1) 19 (2.6) 20 (1.8) 18 (2.4) 15 (2.7) 5 (1.3) 6 (1.8)70 and over...... 381 6 (1.2) 17 (3.1) 27 (2.1) 21 (2.4) 17 (2.1) 7 (1.6) 3* (0.6) 2* (0.4)
2 - 19............ 1499 5 (0.6) 17 (1.3) 26 (2.4) 25 (1.8) 14 (1.2) 7 (1.0) 4 (0.7) 2 (0.6)20 and over... 2633 4 (0.5) 15 (1.3) 22 (0.8) 22 (1.4) 17 (0.9) 11 (1.3) 5 (0.6) 4 (0.6)
2 and over... 4132 4 (0.5) 15 (1.1) 23 (0.9) 23 (1.3) 16 (0.8) 10 (1.0) 5 (0.5) 4 (0.5)
Males and females:2 - 19............ 3019 5 (0.5) 18 (1.0) 26 (1.6) 25 (1.5) 14 (0.7) 7 (0.6) 4 (0.5) 2 (0.6)20 and over... 5047 5 (0.6) 16 (1.1) 21 (0.7) 22 (1.4) 17 (0.8) 10 (0.8) 5 (0.5) 4 (0.5)
2 and over... 8066 5 (0.5) 17 (1.0) 22 (0.7) 23 (1.2) 16 (0.7) 9 (0.6) 5 (0.4) 4 (0.4)

What We Eat in America, NHANES 2013-2014
Page 2 of 2Page 2 of 2
Symbol Legend
* Indicates an estimate that may be less statistically reliable than estimates that are not flagged. The rules for flagging estimated percentages are as follows:
Percent reporting: An estimated percentage between 25 and 75 percent is flagged when based on a sample size of less than 30 times the variance inflation factor (VIF), where the VIFrepresents a broadly calculated average design effect, or when the relative standard error is greater than 30 percent. An estimated percentage less than or equal to 25 percent or greater thanor equal to 75 percent is flagged when the smaller of np and n(1-p) is less than 8 times the VIF, where n is the sample size and p is the percentage expressed as a fraction. The VIF used inthis table is 1.98.
Footnotes
1 Snack occasions were reported as distinct eating occasions during the dietary interview and consisted of one or more food and beverage items, including plain water. Water was the only itemreported in approximately 25 percent of the snack occasions. Survey respondents selected the name of all eating occasions from a fixed list that was provided during the interview. All reports of"snack", "drink" or "extended consumption" (items that were consumed over a long period of time) were included as snack occasions. Spanish language interviewers used Spanish languagesnack occasion names: "merienda", "entre comida", "botana", "bocadillo", "tentempie", and "bebida".
Abbreviations
SE = standard error.
Notes Applicable to All Tables in Series: What We Eat in America, NHANES 2013-2014
Sample weights designed for dietary analysis were used to allow estimates representative of the U. S. population for the years of collection.
The statistics in this table are estimated from Day 1 dietary recall interviews conducted in the What We Eat in America, National Health and Nutrition Examination Survey (NHANES) 2013-2014.The 24-hour dietary recalls were conducted in-person, by trained interviewers, using the USDA 5-step Automated Multiple-Pass Method. Food intakes were coded and nutrient values weredetermined using the USDA Food and Nutrient Database for Dietary Studies 2013-2014 www.ars.usda.gov/nea/bhnrc/fsrg.
Intakes of nutrients and other dietary components are based on the consumption of food and beverages, including water, and do not include intake from supplements or medications.
The table includes data from individuals 2 years and over. Breast-fed children were excluded because breast milk was not quantified in dietary recall interviews.
Although alcohol data are collected for all individuals, estimates are not presented for age groups under 20 years due to extreme variability and/or inadequate sample size.
Suggested Citation
U.S. Department of Agriculture, Agricultural Research Service. 2016. Snacks: Distribution of Snack Occasions, by Gender and Age, What We Eat in America, NHANES 2013-2014.
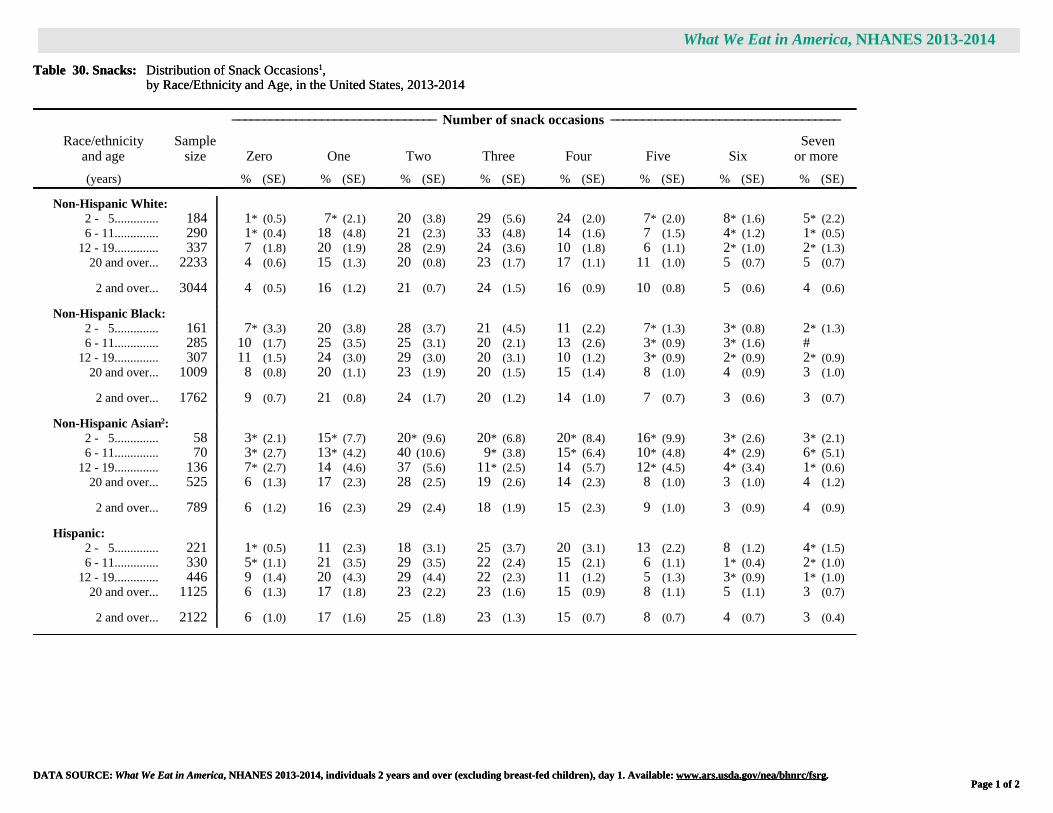
DATA SOURCE: What We Eat in America, NHANES 2013-2014, individuals 2 years and over (excluding breast-fed children), day 1. Available: www.ars.usda.gov/nea/bhnrc/fsrg.Page 1 of 2
What We Eat in America, NHANES 2013-2014
Table 30. Snacks: Distribution of Snack Occasions1,by Race/Ethnicity and Age, in the United States, 2013-2014
──────────────────────────────── Number of snack occasions ────────────────────────────────────Race/ethnicity
and ageSample
size Zero One Two Three Four Five Six Sevenor more
(years) % (SE) % (SE) % (SE) % (SE) % (SE) % (SE) % (SE) % (SE)
Non-Hispanic White:2 - 5.............. 184 1* (0.5) 7* (2.1) 20 (3.8) 29 (5.6) 24 (2.0) 7* (2.0) 8* (1.6) 5* (2.2)6 - 11.............. 290 1* (0.4) 18 (4.8) 21 (2.3) 33 (4.8) 14 (1.6) 7 (1.5) 4* (1.2) 1* (0.5)
12 - 19.............. 337 7 (1.8) 20 (1.9) 28 (2.9) 24 (3.6) 10 (1.8) 6 (1.1) 2* (1.0) 2* (1.3)20 and over... 2233 4 (0.6) 15 (1.3) 20 (0.8) 23 (1.7) 17 (1.1) 11 (1.0) 5 (0.7) 5 (0.7)
2 and over... 3044 4 (0.5) 16 (1.2) 21 (0.7) 24 (1.5) 16 (0.9) 10 (0.8) 5 (0.6) 4 (0.6)
Non-Hispanic Black:2 - 5.............. 161 7* (3.3) 20 (3.8) 28 (3.7) 21 (4.5) 11 (2.2) 7* (1.3) 3* (0.8) 2* (1.3)6 - 11.............. 285 10 (1.7) 25 (3.5) 25 (3.1) 20 (2.1) 13 (2.6) 3* (0.9) 3* (1.6) #
12 - 19.............. 307 11 (1.5) 24 (3.0) 29 (3.0) 20 (3.1) 10 (1.2) 3* (0.9) 2* (0.9) 2* (0.9)20 and over... 1009 8 (0.8) 20 (1.1) 23 (1.9) 20 (1.5) 15 (1.4) 8 (1.0) 4 (0.9) 3 (1.0)
2 and over... 1762 9 (0.7) 21 (0.8) 24 (1.7) 20 (1.2) 14 (1.0) 7 (0.7) 3 (0.6) 3 (0.7)
Non-Hispanic Asian2:2 - 5.............. 58 3* (2.1) 15* (7.7) 20* (9.6) 20* (6.8) 20* (8.4) 16* (9.9) 3* (2.6) 3* (2.1)6 - 11.............. 70 3* (2.7) 13* (4.2) 40 (10.6) 9* (3.8) 15* (6.4) 10* (4.8) 4* (2.9) 6* (5.1)
12 - 19.............. 136 7* (2.7) 14 (4.6) 37 (5.6) 11* (2.5) 14 (5.7) 12* (4.5) 4* (3.4) 1* (0.6)20 and over... 525 6 (1.3) 17 (2.3) 28 (2.5) 19 (2.6) 14 (2.3) 8 (1.0) 3 (1.0) 4 (1.2)
2 and over... 789 6 (1.2) 16 (2.3) 29 (2.4) 18 (1.9) 15 (2.3) 9 (1.0) 3 (0.9) 4 (0.9)
Hispanic:2 - 5.............. 221 1* (0.5) 11 (2.3) 18 (3.1) 25 (3.7) 20 (3.1) 13 (2.2) 8 (1.2) 4* (1.5)6 - 11.............. 330 5* (1.1) 21 (3.5) 29 (3.5) 22 (2.4) 15 (2.1) 6 (1.1) 1* (0.4) 2* (1.0)
12 - 19.............. 446 9 (1.4) 20 (4.3) 29 (4.4) 22 (2.3) 11 (1.2) 5 (1.3) 3* (0.9) 1* (1.0)20 and over... 1125 6 (1.3) 17 (1.8) 23 (2.2) 23 (1.6) 15 (0.9) 8 (1.1) 5 (1.1) 3 (0.7)
2 and over... 2122 6 (1.0) 17 (1.6) 25 (1.8) 23 (1.3) 15 (0.7) 8 (0.7) 4 (0.7) 3 (0.4)

What We Eat in America, NHANES 2013-2014
Page 2 of 2Page 2 of 2
Symbol Legend
* Indicates an estimate that may be less statistically reliable than estimates that are not flagged. The rules for flagging estimated percentages are as follows:
Percent reporting: An estimated percentage between 25 and 75 percent is flagged when based on a sample size of less than 30 times the variance inflation factor (VIF), where the VIFrepresents a broadly calculated average design effect, or when the relative standard error is greater than 30 percent. An estimated percentage less than or equal to 25 percent or greater thanor equal to 75 percent is flagged when the smaller of np and n(1-p) is less than 8 times the VIF, where n is the sample size and p is the percentage expressed as a fraction. The VIF used inthis table is 1.98.
# Indicates a non-zero value too small to report.
Footnotes
1 Snack occasions were reported as distinct eating occasions during the dietary interview and consisted of one or more food and beverage items, including plain water. Water was the only itemreported in approximately 25 percent of the snack occasions. Survey respondents selected the name of all eating occasions from a fixed list that was provided during the interview. All reports of"snack", "drink" or "extended consumption" (items that were consumed over a long period of time) were included as snack occasions. Spanish language interviewers used Spanish languagesnack occasion names: "merienda", "entre comida", "botana", "bocadillo", "tentempie", and "bebida".
2 A new sampling methodology was implemented for NHANES 2011-2012 to oversample non-Hispanic non-black Asians in addition to the ongoing oversample of Hispanics, non-Hispanicblacks, low-income whites/others, and whites/others 80+ years.
Abbreviations
SE = standard error.
Notes Applicable to All Tables in Series: What We Eat in America, NHANES 2013-2014
Sample weights designed for dietary analysis were used to allow estimates representative of the U. S. population for the years of collection.
The statistics in this table are estimated from Day 1 dietary recall interviews conducted in the What We Eat in America, National Health and Nutrition Examination Survey (NHANES) 2013-2014.The 24-hour dietary recalls were conducted in-person, by trained interviewers, using the USDA 5-step Automated Multiple-Pass Method. Food intakes were coded and nutrient values weredetermined using the USDA Food and Nutrient Database for Dietary Studies 2013-2014 www.ars.usda.gov/nea/bhnrc/fsrg.
Intakes of nutrients and other dietary components are based on the consumption of food and beverages, including water, and do not include intake from supplements or medications.
The table includes data from individuals 2 years and over. Breast-fed children were excluded because breast milk was not quantified in dietary recall interviews.
Although alcohol data are collected for all individuals, estimates are not presented for age groups under 20 years due to extreme variability and/or inadequate sample size.
Suggested Citation
U.S. Department of Agriculture, Agricultural Research Service. 2016. Snacks: Distribution of Snack Occasions, by Race/Ethnicity and Age, What We Eat in America, NHANES 2013-2014.

DATA SOURCE: What We Eat in America, NHANES 2013-2014, individuals 2 years and over (excluding breast-fed children), day 1. Available: www.ars.usda.gov/nea/bhnrc/fsrg.Page 1 of 2
What We Eat in America, NHANES 2013-2014
Table 31. Snacks: Distribution of Snack Occasions1,by Family Income (in Dollars) and Age, in the United States, 2013-2014
──────────────────────────────── Number of snack occasions ────────────────────────────────────Family income
in dollarsand age
Samplesize Zero One Two Three Four Five Six
Sevenor more
(years) % (SE) % (SE) % (SE) % (SE) % (SE) % (SE) % (SE) % (SE)
$0 - $24,999:2 - 5.............. 241 2* (0.8) 15 (3.9) 24 (4.5) 22 (4.6) 17 (3.5) 10 (2.5) 5* (1.4) 5* (1.7)6 - 11.............. 330 4* (1.4) 23 (3.6) 28 (3.5) 19 (2.5) 16 (3.2) 5 (2.0) 3* (0.9) 2* (1.0)
12 - 19.............. 398 10 (2.2) 20 (2.2) 32 (2.4) 21 (1.9) 11 (2.0) 3* (0.7) 2* (1.2) 2* (1.1)20 and over... 1550 6 (0.8) 19 (1.5) 23 (1.5) 22 (1.4) 16 (1.3) 6 (0.7) 4 (0.8) 4 (0.7)
2 and over... 2519 6 (0.8) 19 (1.0) 24 (1.2) 22 (1.1) 16 (1.0) 6 (0.7) 4 (0.6) 4 (0.6)
$25,000 - $74,999:2 - 5.............. 255 2* (0.9) 10 (2.2) 24 (4.5) 23 (3.9) 21 (3.0) 8 (3.0) 7 (2.6) 5* (2.0)6 - 11.............. 400 3* (0.9) 27 (4.4) 25 (2.6) 21 (2.3) 12 (2.0) 9 (2.3) 2* (1.0) 1* (0.5)
12 - 19.............. 478 9 (1.6) 24 (3.6) 29 (2.7) 23 (3.0) 9 (1.5) 3 (1.1) 2* (1.2) #20 and over... 1882 4 (0.6) 17 (1.5) 20 (1.2) 24 (1.7) 16 (0.9) 11 (1.5) 4 (0.6) 4 (0.8)
2 and over... 3015 5 (0.5) 18 (1.1) 22 (1.1) 23 (1.3) 15 (0.7) 10 (1.1) 4 (0.6) 3 (0.7)
$75,000 and higher:2 - 5.............. 153 # 4* (2.1) 18 (4.3) 34 (7.2) 22 (4.0) 9* (2.2) 9* (3.2) 3* (1.1)6 - 11.............. 270 2* (0.9) 10 (1.7) 24 (4.0) 36 (4.7) 15 (1.5) 6 (1.7) 5* (1.8) 2* (0.7)
12 - 19.............. 334 7 (2.4) 18 (2.2) 25 (3.6) 23 (4.8) 11 (2.6) 9 (1.8) 3* (1.8) 3* (1.8)20 and over... 1303 4 (0.7) 14 (1.5) 22 (1.5) 21 (2.1) 18 (1.8) 10 (1.2) 6 (0.9) 6 (0.7)
2 and over... 2060 4 (0.6) 13 (1.3) 22 (1.5) 23 (1.9) 17 (1.4) 10 (0.9) 6 (0.7) 5 (0.6)
All Individuals2:2 - 5.............. 676 2* (0.5) 9 (1.6) 22 (3.0) 26 (3.3) 20 (1.6) 9 (1.5) 7 (1.0) 4 (1.3)6 - 11.............. 1047 3 (0.6) 20 (2.8) 25 (2.0) 26 (2.8) 14 (1.4) 7 (1.0) 3 (0.8) 2 (0.4)
12 - 19.............. 1296 8 (1.0) 20 (1.3) 29 (2.1) 22 (2.1) 10 (1.2) 5 (0.7) 3 (0.8) 2 (0.8)20 and over... 5047 5 (0.6) 16 (1.1) 21 (0.7) 22 (1.4) 17 (0.8) 10 (0.8) 5 (0.5) 4 (0.5)
2 and over... 8066 5 (0.5) 17 (1.0) 22 (0.7) 23 (1.2) 16 (0.7) 9 (0.6) 5 (0.4) 4 (0.4)

What We Eat in America, NHANES 2013-2014
Page 2 of 2Page 2 of 2
Symbol Legend
* Indicates an estimate that may be less statistically reliable than estimates that are not flagged. The rules for flagging estimated percentages are as follows:
Percent reporting: An estimated percentage between 25 and 75 percent is flagged when based on a sample size of less than 30 times the variance inflation factor (VIF), where the VIFrepresents a broadly calculated average design effect, or when the relative standard error is greater than 30 percent. An estimated percentage less than or equal to 25 percent or greater thanor equal to 75 percent is flagged when the smaller of np and n(1-p) is less than 8 times the VIF, where n is the sample size and p is the percentage expressed as a fraction. The VIF used inthis table is 1.98.
# Indicates a non-zero value too small to report.
Footnotes
1 Snack occasions were reported as distinct eating occasions during the dietary interview and consisted of one or more food and beverage items, including plain water. Water was the only itemreported in approximately 25 percent of the snack occasions. Survey respondents selected the name of all eating occasions from a fixed list that was provided during the interview. All reports of"snack", "drink" or "extended consumption" (items that were consumed over a long period of time) were included as snack occasions. Spanish language interviewers used Spanish languagesnack occasion names: "merienda", "entre comida", "botana", "bocadillo", "tentempie", and "bebida".
2 Includes persons of all income levels or with unknown family income.
Abbreviations
SE = standard error.
Notes Applicable to All Tables in Series: What We Eat in America, NHANES 2013-2014
Sample weights designed for dietary analysis were used to allow estimates representative of the U. S. population for the years of collection.
The statistics in this table are estimated from Day 1 dietary recall interviews conducted in the What We Eat in America, National Health and Nutrition Examination Survey (NHANES) 2013-2014.The 24-hour dietary recalls were conducted in-person, by trained interviewers, using the USDA 5-step Automated Multiple-Pass Method. Food intakes were coded and nutrient values weredetermined using the USDA Food and Nutrient Database for Dietary Studies 2013-2014 www.ars.usda.gov/nea/bhnrc/fsrg.
Intakes of nutrients and other dietary components are based on the consumption of food and beverages, including water, and do not include intake from supplements or medications.
The table includes data from individuals 2 years and over. Breast-fed children were excluded because breast milk was not quantified in dietary recall interviews.
Although alcohol data are collected for all individuals, estimates are not presented for age groups under 20 years due to extreme variability and/or inadequate sample size.
Suggested Citation
U.S. Department of Agriculture, Agricultural Research Service. 2016. Snacks: Distribution of Snack Occasions, by Family Income (in Dollars) and Age, What We Eat in America, NHANES2013-2014.

DATA SOURCE: What We Eat in America, NHANES 2013-2014, individuals 2 years and over (excluding breast-fed children), day 1. Available: www.ars.usda.gov/nea/bhnrc/fsrg.Page 1 of 2
What We Eat in America, NHANES 2013-2014
Table 32. Snacks: Distribution of Snack Occasions1,by Family Income (as % of Poverty Level2) and Age, in the United States, 2013-2014
──────────────────────────────── Number of snack occasions ────────────────────────────────────Family income as% of poverty level
and ageSample
size Zero One Two Three Four Five Six Sevenor more
(years) % (SE) % (SE) % (SE) % (SE) % (SE) % (SE) % (SE) % (SE)
Under 131% poverty:2 - 5.............. 329 2* (0.7) 14 (2.7) 24 (3.6) 23 (4.2) 16 (3.1) 9 (1.8) 7 (1.8) 5 (2.2)6 - 11.............. 494 4 (0.9) 25 (3.4) 28 (2.5) 19 (2.4) 15 (2.4) 5 (1.1) 3* (0.9) 2* (0.8)
12 - 19.............. 555 11 (2.1) 21 (1.7) 30 (2.8) 21 (2.1) 11 (2.1) 2* (0.6) 2* (1.0) 1* (0.8)20 and over... 1596 7 (0.9) 20 (1.6) 22 (1.1) 23 (1.5) 16 (1.0) 6 (0.7) 4 (0.9) 3 (0.4)
2 and over... 2974 7 (0.8) 20 (1.3) 24 (1.0) 22 (1.0) 15 (0.8) 5 (0.6) 4 (0.8) 3 (0.3)
131-350% poverty:2 - 5.............. 200 2* (1.0) 10 (2.4) 20 (5.2) 24 (4.0) 26 (5.5) 10 (4.1) 4* (1.3) 4* (1.9)6 - 11.............. 302 4* (1.3) 23 (3.8) 21 (3.5) 24 (3.5) 13 (2.6) 9 (2.4) 5* (2.4) 1* (0.6)
12 - 19.............. 402 9 (2.4) 23 (4.1) 27 (3.9) 22 (2.4) 8 (1.4) 5 (1.4) 4* (1.4) 1* (1.0)20 and over... 1622 5 (0.6) 16 (1.3) 21 (1.2) 24 (1.5) 15 (0.9) 10 (1.1) 4 (0.7) 4 (0.7)
2 and over... 2526 5 (0.6) 17 (1.1) 22 (1.2) 24 (1.2) 15 (0.8) 9 (0.9) 4 (0.7) 4 (0.5)
Over 350% poverty:2 - 5.............. 109 1* (0.4) 3* (1.0) 20 (5.2) 36 (9.6) 19 (5.6) 8* (2.4) 10* (4.4) 3* (1.3)6 - 11.............. 194 1* (0.6) 8* (1.5) 28 (5.9) 38 (4.5) 14 (2.6) 7* (2.2) 2* (0.9) 2* (1.3)
12 - 19.............. 239 4* (1.4) 17 (2.1) 26 (4.1) 25 (5.6) 13 (3.6) 10 (2.6) 2* (1.0) 3* (1.9)20 and over... 1468 3 (0.7) 14 (1.5) 21 (1.3) 21 (2.0) 19 (1.8) 11 (1.2) 6 (0.9) 5 (0.7)
2 and over... 2010 3 (0.6) 13 (1.4) 22 (1.4) 23 (1.9) 18 (1.6) 11 (1.0) 5 (0.8) 5 (0.6)
All Individuals3:2 - 5.............. 676 2* (0.5) 9 (1.6) 22 (3.0) 26 (3.3) 20 (1.6) 9 (1.5) 7 (1.0) 4 (1.3)6 - 11.............. 1047 3 (0.6) 20 (2.8) 25 (2.0) 26 (2.8) 14 (1.4) 7 (1.0) 3 (0.8) 2 (0.4)
12 - 19.............. 1296 8 (1.0) 20 (1.3) 29 (2.1) 22 (2.1) 10 (1.2) 5 (0.7) 3 (0.8) 2 (0.8)20 and over... 5047 5 (0.6) 16 (1.1) 21 (0.7) 22 (1.4) 17 (0.8) 10 (0.8) 5 (0.5) 4 (0.5)
2 and over... 8066 5 (0.5) 17 (1.0) 22 (0.7) 23 (1.2) 16 (0.7) 9 (0.6) 5 (0.4) 4 (0.4)

What We Eat in America, NHANES 2013-2014
Page 2 of 2Page 2 of 2
Symbol Legend
* Indicates an estimate that may be less statistically reliable than estimates that are not flagged. The rules for flagging estimated percentages are as follows:
Percent reporting: An estimated percentage between 25 and 75 percent is flagged when based on a sample size of less than 30 times the variance inflation factor (VIF), where the VIFrepresents a broadly calculated average design effect, or when the relative standard error is greater than 30 percent. An estimated percentage less than or equal to 25 percent or greater thanor equal to 75 percent is flagged when the smaller of np and n(1-p) is less than 8 times the VIF, where n is the sample size and p is the percentage expressed as a fraction. The VIF used inthis table is 1.98.
Footnotes
1 Snack occasions were reported as distinct eating occasions during the dietary interview and consisted of one or more food and beverage items, including plain water. Water was the only itemreported in approximately 25 percent of the snack occasions. Survey respondents selected the name of all eating occasions from a fixed list that was provided during the interview. All reports of"snack", "drink" or "extended consumption" (items that were consumed over a long period of time) were included as snack occasions. Spanish language interviewers used Spanish languagesnack occasion names: "merienda", "entre comida", "botana", "bocadillo", "tentempie", and "bebida".
2 The ratio of family income to poverty expressed as a percentage. The Department of Health and Human Services’ poverty guidelines were used as the poverty measure to calculate the ratio, http://aspe.hhs.gov/poverty/.
3 Includes persons of all income levels or with unknown family income.
Abbreviations
SE = standard error.
Notes Applicable to All Tables in Series: What We Eat in America, NHANES 2013-2014
Sample weights designed for dietary analysis were used to allow estimates representative of the U. S. population for the years of collection.
The statistics in this table are estimated from Day 1 dietary recall interviews conducted in the What We Eat in America, National Health and Nutrition Examination Survey (NHANES) 2013-2014.The 24-hour dietary recalls were conducted in-person, by trained interviewers, using the USDA 5-step Automated Multiple-Pass Method. Food intakes were coded and nutrient values weredetermined using the USDA Food and Nutrient Database for Dietary Studies 2013-2014 www.ars.usda.gov/nea/bhnrc/fsrg.
Intakes of nutrients and other dietary components are based on the consumption of food and beverages, including water, and do not include intake from supplements or medications.
The table includes data from individuals 2 years and over. Breast-fed children were excluded because breast milk was not quantified in dietary recall interviews.
Although alcohol data are collected for all individuals, estimates are not presented for age groups under 20 years due to extreme variability and/or inadequate sample size.
Suggested Citation
U.S. Department of Agriculture, Agricultural Research Service. 2016. Snacks: Distribution of Snack Occasions, by Family Income (as % of Poverty Level) and Age, What We Eat in America,NHANES 2013-2014.

DATA SOURCE: What We Eat in America, NHANES 2013-2014, individuals 2 years and over (excluding breast-fed children), day 1. Available: www.ars.usda.gov/nea/bhnrc/fsrg.Page 1 of 2
What We Eat in America, NHANES 2013-2014
Table 33. Meals and Snacks: Distribution of Meal Patterns1 and Snack Occasions2,by Gender and Age, in the United States, 2013-2014
───── Breakfast, lunch, and dinner ───── ─────────── Any two meals ─────────── ──────── Any one meal or less ──────── Number of snack occasions Number of snack occasions Number of snack occasionsGender
and age 1 or less 2 or 3 4 or more 1 or less 2 or 3 4 or more 1 or less 2 or 3 4 or more
(years) % (SE) % (SE) % (SE) % (SE) % (SE) % (SE) % (SE) % (SE) % (SE) % (SE) % (SE) % (SE)
Males:2 - 5.............. 85 (2.5) 10 (2.0) 47 (4.4) 29 (4.1) 13 (2.2) 2*(0.8) 4*(0.9) 7 (2.0) 1*(0.6) 0*(0.0) 1*(0.3) 1*(0.4)6 - 11.............. 78 (1.8) 21 (3.9) 39 (3.5) 18 (2.3) 20 (1.7) 4 (1.5) 9 (1.2) 7 (1.8) 3*(0.8) 1*(0.3) 1*(0.7) 1*(0.1)
12 - 19.............. 61 (3.5) 17 (2.6) 34 (2.4) 9 (2.1) 31 (3.5) 9 (1.4) 14 (1.9) 8 (1.3) 8 (1.2) 1*(0.4) 3 (1.0) 3 (0.8)
20 - 29.............. 55 (3.3) 17 (2.9) 23 (2.3) 16 (1.4) 34 (3.5) 7 (1.8) 18 (2.6) 8 (1.5) 11 (1.6) 3*(1.0) 4 (0.7) 4 (1.1)30 - 39.............. 61 (2.4) 14 (2.2) 24 (3.0) 22 (2.7) 34 (2.7) 6 (0.8) 17 (2.6) 11 (2.3) 6 (1.4) 1*(0.3) 2*(1.0) 2*(0.9)40 - 49.............. 63 (3.5) 13 (2.6) 25 (2.5) 25 (4.1) 32 (3.2) 6 (1.1) 18 (2.6) 8 (1.6) 5 (1.6) 1*(0.5) 3*(1.3) 2*(0.7)
50 - 59.............. 65 (4.1) 17 (2.0) 26 (4.2) 22 (3.0) 29 (3.8) 7 (1.6) 13 (2.1) 9 (2.8) 6 (1.2) 1*(0.3) 3*(0.6) 2*(1.2)60 - 69.............. 64 (3.9) 14 (1.9) 25 (2.8) 25 (4.1) 28 (3.9) 7 (2.4) 12 (2.2) 10 (1.4) 7 (1.7) 1*(0.2) 4*(1.1) 3*(1.1)70 and over...... 68 (2.8) 20 (3.0) 28 (2.6) 20 (3.4) 28 (2.8) 6 (1.4) 12 (2.0) 10 (1.9) 4*(1.4) # 2*(0.9) 1*(0.7)
2 - 19............ 71 (1.9) 17 (1.6) 38 (2.2) 16 (1.6) 24 (1.8) 6 (1.0) 10 (1.1) 7 (0.8) 5 (0.6) 1*(0.2) 2 (0.4) 2 (0.3)20 and over... 62 (1.3) 16 (1.2) 25 (1.1) 21 (1.6) 31 (1.4) 6 (0.8) 15 (1.2) 9 (1.0) 7 (0.5) 1 (0.3) 3 (0.2) 3 (0.5)
2 and over... 64 (1.1) 16 (1.1) 28 (1.0) 20 (1.4) 29 (1.1) 6 (0.7) 14 (0.8) 9 (0.8) 6 (0.5) 1 (0.2) 3 (0.2) 2 (0.4)
Females:2 - 5.............. 81 (2.3) 8 (2.1) 39 (4.5) 34 (4.3) 19 (2.3) 2*(1.0) 7 (1.4) 10 (1.7) # 0*(0.0) # #6 - 11.............. 76 (2.0) 15 (2.5) 44 (3.1) 17 (1.9) 22 (2.2) 5 (1.5) 9 (1.5) 7 (1.7) 2*(0.9) # 1*(0.8) 1*(0.5)
12 - 19.............. 55 (3.4) 17 (1.9) 28 (2.5) 9 (2.5) 37 (2.7) 11 (1.0) 18 (2.3) 7 (1.4) 8 (2.0) 1*(0.6) 4 (2.0) 2 (0.7)
20 - 29.............. 60 (2.3) 15 (2.7) 27 (3.1) 18 (2.2) 32 (2.1) 7 (1.6) 14 (2.1) 10 (1.6) 8 (1.6) 1*(0.4) 6 (1.3) 2*(0.4)30 - 39.............. 62 (2.6) 11 (1.5) 29 (3.1) 23 (1.9) 33 (2.3) 6 (1.3) 14 (1.1) 13 (2.0) 5 (1.2) # 3*(0.8) 2*(0.7)40 - 49.............. 70 (2.2) 13 (2.2) 31 (2.7) 26 (4.1) 25 (2.5) 3*(1.0) 11 (1.5) 11 (1.5) 5 (0.8) # 1*(0.4) 3*(0.7)
50 - 59.............. 69 (2.7) 12 (2.4) 31 (2.5) 27 (3.6) 26 (2.5) 3*(0.9) 10 (1.7) 13 (2.0) 5 (1.3) 2*(0.9) 1*(0.5) 2*(0.6)60 - 69.............. 72 (2.3) 11 (2.1) 29 (2.2) 32 (3.0) 24 (2.2) 4 (0.9) 9 (1.6) 11 (1.9) 4 (1.1) 2*(0.8) 1*(0.5) 1*(0.4)70 and over...... 74 (2.7) 17 (2.6) 36 (3.4) 21 (2.4) 23 (2.8) 6 (1.2) 10 (1.5) 7 (1.5) 3*(0.9) 1*(0.4) 1*(0.6) 1*(0.4)
2 - 19............ 67 (2.5) 14 (1.2) 36 (2.1) 17 (2.1) 28 (2.1) 7 (0.8) 13 (1.6) 8 (0.9) 5 (0.9) 1*(0.3) 2 (0.8) 1 (0.4)20 and over... 68 (1.0) 13 (1.1) 30 (1.4) 24 (1.7) 27 (0.8) 5 (0.6) 11 (0.4) 11 (0.7) 5 (0.5) 1 (0.2) 2 (0.4) 2 (0.3)
2 and over... 68 (1.1) 13 (1.0) 31 (1.0) 23 (1.4) 27 (0.9) 5 (0.5) 12 (0.5) 10 (0.6) 5 (0.5) 1 (0.2) 2 (0.3) 2 (0.3)
Males and females:2 - 19............ 69 (2.0) 16 (0.8) 37 (1.6) 17 (1.5) 26 (1.7) 7 (0.9) 12 (1.1) 8 (0.6) 5 (0.6) 1 (0.2) 2 (0.4) 2 (0.3)20 and over... 65 (0.8) 14 (1.0) 28 (0.8) 23 (1.4) 29 (0.7) 6 (0.6) 13 (0.6) 10 (0.6) 6 (0.4) 1 (0.2) 3 (0.2) 2 (0.3)
2 and over... 66 (0.9) 15 (0.8) 30 (0.6) 21 (1.2) 28 (0.7) 6 (0.6) 13 (0.5) 10 (0.5) 6 (0.4) 1 (0.2) 3 (0.1) 2 (0.3)

What We Eat in America, NHANES 2013-2014
Page 2 of 2Page 2 of 2
Symbol Legend
* Indicates an estimate that may be less statistically reliable than estimates that are not flagged. The rules for flagging estimated percentages are as follows:
Percent reporting: An estimated percentage between 25 and 75 percent is flagged when based on a sample size of less than 30 times the variance inflation factor (VIF), where the VIFrepresents a broadly calculated average design effect, or when the relative standard error is greater than 30 percent. An estimated percentage less than or equal to 25 percent or greater thanor equal to 75 percent is flagged when the smaller of np and n(1-p) is less than 8 times the VIF, where n is the sample size and p is the percentage expressed as a fraction. The VIF used inthis table is 1.98.
# Indicates a non-zero value too small to report.
Footnotes
1 Meals Patterns are categorized into the following:
Breakfast, lunch, and dinner: the respondent reported each of the three meals as follows: breakfast includes all eating occasions designated by the respondent as "breakfast", or theSpanish equivalents "desayuno", and "almuerzo"; lunch includes all eating occasions designated as "brunch", "lunch" or the Spanish equivalent "comida"; and dinner includes all eatingoccasions designated as "dinner", "supper", or the Spanish equivalent "cena".
Any two meals: the respondent reported any combination of two of the three meals -- breakfast, lunch or dinner.
Any one meal or less: the respondent reported one of the three meals, or no meal.
2 Snack occasions were reported as distinct eating occasions during the dietary interview and consisted of one or more food and beverage items, including plain water. Water was the only itemreported in approximately 25 percent of the snack occasions. Survey respondents selected the name of all eating occasions from a fixed list that was provided during the interview. All reports of"snack", "drink" or "extended consumption" (items that were consumed over a long period of time) were included as snack occasions. Spanish language interviewers used Spanish languagesnack occasion names: "merienda", "entre comida", "botana", "bocadillo", "tentempie", and "bebida".
Abbreviations
SE standard error.
Notes Applicable to All Tables in Series: What We Eat in America, NHANES 2013-2014
Sample weights designed for dietary analysis were used to allow estimates representative of the U. S. population for the years of collection.
The statistics in this table are estimated from Day 1 dietary recall interviews conducted in the What We Eat in America, National Health and Nutrition Examination Survey (NHANES) 2013-2014.The 24-hour dietary recalls were conducted in-person, by trained interviewers, using the USDA 5-step Automated Multiple-Pass Method. Food intakes were coded and nutrient values weredetermined using the USDA Food and Nutrient Database for Dietary Studies 2013-2014 www.ars.usda.gov/nea/bhnrc/fsrg.
Intakes of nutrients and other dietary components are based on the consumption of food and beverages, including water, and do not include intake from supplements or medications.
The table includes data from individuals 2 years and over. Breast-fed children were excluded because breast milk was not quantified in dietary recall interviews.
Although alcohol data are collected for all individuals, estimates are not presented for age groups under 20 years due to extreme variability and/or inadequate sample size.
Suggested Citation
U.S. Department of Agriculture, Agricultural Research Service. 2016. Meals and Snacks: Distribution of Meal Patterns and Snack Occasions, by Gender and Age, What We Eat in America,NHANES 2013-2014.

DATA SOURCE: What We Eat in America, NHANES 2013-2014, individuals 2 years and over (excluding breast-fed children), day 1. Available: www.ars.usda.gov/nea/bhnrc/fsrg.Page 1 of 2
What We Eat in America, NHANES 2013-2014
Table 34. Meals and Snacks: Distribution of Meal Patterns1 and Snack Occasions2,by Race/Ethnicity and Age, in the United States, 2013-2014
───── Breakfast, lunch, and dinner ───── ─────────── Any two meals ─────────── ──────── Any one meal or less ──────── Number of snack occasions Number of snack occasions Number of snack occasionsRace/ethnicity
and age 1 or less 2 or 3 4 or more 1 or less 2 or 3 4 or more 1 or less 2 or 3 4 or more
(years) % (SE) % (SE) % (SE) % (SE) % (SE) % (SE) % (SE) % (SE) % (SE) % (SE) % (SE) % (SE)
Non-Hispanic White:2 - 5.............. 90 (2.1) 6*(1.6) 46 (4.2) 38 (2.6) 10 (2.1) 1*(0.9) 3*(1.3) 5*(2.0) 0*(0.0) 0*(0.0) 0*(0.0) 0*(0.0)6 - 11.............. 83 (2.3) 16 (4.2) 48 (4.5) 19 (2.2) 16 (2.3) 3*(1.2) 5*(1.6) 7 (2.4) 1*(0.7) # 1*(0.7) #
12 - 19.............. 65 (4.6) 18 (2.6) 38 (2.5) 10 (3.2) 27 (4.0) 9 (1.6) 11 (1.8) 7 (1.3) 7 (2.4) 1*(0.4) 4*(2.0) 3*(0.8)20 and over... 70 (1.0) 14 (1.2) 29 (1.1) 27 (1.9) 25 (1.1) 4 (0.6) 12 (0.9) 10 (0.7) 5 (0.5) 1 (0.3) 2 (0.2) 2 (0.4)
2 and over... 72 (1.2) 14 (1.0) 32 (0.8) 25 (1.6) 24 (1.1) 4 (0.6) 11 (0.8) 9 (0.6) 4 (0.5) 1 (0.2) 2 (0.2) 2 (0.3)
Non-Hispanic Black:2 - 5.............. 79 (3.7) 22 (3.5) 39 (4.6) 18 (3.4) 18 (4.0) 5*(1.6) 9*(2.3) 4*(1.8) 3*(1.5) 0*(0.0) 1*(0.8) 2*(1.2)6 - 11.............. 68 (4.0) 22 (3.4) 34 (3.2) 11 (2.7) 27 (3.3) 10 (2.7) 9 (2.1) 8 (1.9) 5*(1.6) 3*(1.2) 1*(0.8) 1*(1.0)
12 - 19.............. 38 (3.6) 14 (3.1) 20 (1.4) 4*(1.1) 49 (4.3) 17 (3.6) 22 (1.6) 10 (2.0) 13 (2.3) 4*(1.5) 7 (1.5) 2*(1.1)20 and over... 49 (1.2) 15 (0.8) 20 (0.9) 14 (0.7) 37 (1.4) 10 (1.1) 16 (1.1) 11 (1.5) 14 (1.3) 2 (0.4) 7 (0.6) 4 (0.7)
2 and over... 51 (1.3) 16 (0.6) 23 (0.9) 13 (0.5) 37 (1.3) 11 (1.1) 16 (0.8) 10 (1.1) 12 (1.0) 2 (0.4) 6 (0.5) 4 (0.6)
Non-Hispanic Asian3:2 - 5.............. 90*(3.6) 14*(5.8) 37*(10.3) 39*(8.3) 8*(3.5) 4*(3.1) 3*(2.0) 1*(0.8) 2*(1.8) 0*(0.0) 0*(0.0) 2*(1.8)6 - 11.............. 92*(3.2) 16*(5.8) 42 (9.1) 34(10.2) 8*(3.2) # 7*(2.7) 1*(0.8) 0*(0.0) 0*(0.0) 0*(0.0) 0*(0.0)
12 - 19.............. 54 (8.9) 12 (4.0) 26 (5.3) 16 (7.0) 43 (8.6) 9*(3.3) 21 (6.1) 14 (4.7) 3*(1.0) # 1*(0.6) 1*(0.8)20 and over... 74 (3.7) 17 (2.8) 34 (3.0) 23 (2.6) 23 (3.6) 6 (2.1) 10 (2.1) 7 (1.5) 3*(1.0) # 2*(1.0) 1*(0.4)
2 and over... 74 (2.8) 16 (2.5) 34 (3.0) 24 (2.6) 23 (2.7) 5 (1.8) 11 (1.5) 7 (1.1) 3 (0.8) # 2*(0.7) 1*(0.3)
Hispanic:2 - 5.............. 68 (3.6) 9 (2.3) 33 (2.8) 27 (4.0) 31 (3.5) 3*(0.8) 9 (1.7) 18 (3.0) 1*(0.8) 0*(0.0) 1*(0.5) 1*(0.4)6 - 11.............. 66 (1.9) 20 (2.0) 31 (2.6) 15 (1.9) 31 (2.0) 6 (2.2) 17 (1.7) 8 (1.6) 4*(1.5) 0*(0.0) 2*(1.0) 1*(0.9)
12 - 19.............. 53 (3.7) 19 (3.3) 24 (3.3) 10 (2.1) 38 (4.2) 8 (2.0) 23 (4.8) 6 (1.1) 9 (1.8) 2*(0.9) 4 (1.0) 3*(1.1)20 and over... 51 (2.2) 13 (1.7) 24 (2.6) 14 (1.7) 42 (1.8) 9 (0.7) 20 (1.8) 13 (1.2) 7 (1.2) 1*(0.4) 3 (1.1) 3 (0.7)
2 and over... 54 (1.4) 14 (1.0) 25 (1.9) 15 (1.3) 39 (1.2) 8 (0.7) 19 (1.3) 12 (0.9) 6 (0.7) 1 (0.2) 3 (0.6) 3 (0.5)

What We Eat in America, NHANES 2013-2014
Page 2 of 2Page 2 of 2
Symbol Legend
* Indicates an estimate that may be less statistically reliable than estimates that are not flagged. The rules for flagging estimated percentages are as follows:
Percent reporting: An estimated percentage between 25 and 75 percent is flagged when based on a sample size of less than 30 times the variance inflation factor (VIF), where the VIFrepresents a broadly calculated average design effect, or when the relative standard error is greater than 30 percent. An estimated percentage less than or equal to 25 percent or greater thanor equal to 75 percent is flagged when the smaller of np and n(1-p) is less than 8 times the VIF, where n is the sample size and p is the percentage expressed as a fraction. The VIF used inthis table is 1.98.
# Indicates a non-zero value too small to report.
Footnotes
1 Meals Patterns are categorized into the following:
Breakfast, lunch, and dinner: the respondent reported each of the three meals as follows: breakfast includes all eating occasions designated by the respondent as "breakfast", or theSpanish equivalents "desayuno", and "almuerzo"; lunch includes all eating occasions designated as "brunch", "lunch" or the Spanish equivalent "comida"; and dinner includes all eatingoccasions designated as "dinner", "supper", or the Spanish equivalent "cena".
Any two meals: the respondent reported any combination of two of the three meals -- breakfast, lunch or dinner.
Any one meal or less: the respondent reported one of the three meals, or no meal.
2 Snack occasions were reported as distinct eating occasions during the dietary interview and consisted of one or more food and beverage items, including plain water. Water was the only itemreported in approximately 25 percent of the snack occasions. Survey respondents selected the name of all eating occasions from a fixed list that was provided during the interview. All reports of"snack", "drink" or "extended consumption" (items that were consumed over a long period of time) were included as snack occasions. Spanish language interviewers used Spanish languagesnack occasion names: "merienda", "entre comida", "botana", "bocadillo", "tentempie", and "bebida".
3 A new sampling methodology was implemented for NHANES 2011-2012 to oversample non-Hispanic non-black Asians in addition to the ongoing oversample of Hispanics, non-Hispanicblacks, low-income whites/others, and whites/others 80+ years.
Abbreviations
SE standard error.
Notes Applicable to All Tables in Series: What We Eat in America, NHANES 2013-2014
Sample weights designed for dietary analysis were used to allow estimates representative of the U. S. population for the years of collection.
The statistics in this table are estimated from Day 1 dietary recall interviews conducted in the What We Eat in America, National Health and Nutrition Examination Survey (NHANES) 2013-2014.The 24-hour dietary recalls were conducted in-person, by trained interviewers, using the USDA 5-step Automated Multiple-Pass Method. Food intakes were coded and nutrient values weredetermined using the USDA Food and Nutrient Database for Dietary Studies 2013-2014 www.ars.usda.gov/nea/bhnrc/fsrg.
Intakes of nutrients and other dietary components are based on the consumption of food and beverages, including water, and do not include intake from supplements or medications.
The table includes data from individuals 2 years and over. Breast-fed children were excluded because breast milk was not quantified in dietary recall interviews.
Although alcohol data are collected for all individuals, estimates are not presented for age groups under 20 years due to extreme variability and/or inadequate sample size.
Suggested Citation
U.S. Department of Agriculture, Agricultural Research Service. 2016. Meals and Snacks: Distribution of Meal Patterns and Snack Occasions, by Race/Ethnicity and Age, What We Eat inAmerica, NHANES 2013-2014.

DATA SOURCE: What We Eat in America, NHANES 2013-2014, individuals 2 years and over (excluding breast-fed children), day 1. Available: www.ars.usda.gov/nea/bhnrc/fsrg.Page 1 of 2
What We Eat in America, NHANES 2013-2014
Table 35. Meals and Snacks: Distribution of Meal Patterns1 and Snack Occasions2,by Family Income (in Dollars) and Age, in the United States, 2013-2014
───── Breakfast, lunch, and dinner ───── ─────────── Any two meals ─────────── ──────── Any one meal or less ──────── Number of snack occasions Number of snack occasions Number of snack occasionsFamily income
in dollarsand age 1 or less 2 or 3 4 or more 1 or less 2 or 3 4 or more 1 or less 2 or 3 4 or more(years) % (SE) % (SE) % (SE) % (SE) % (SE) % (SE) % (SE) % (SE) % (SE) % (SE) % (SE) % (SE)
$0 - $24,999:2 - 5.............. 77 (4.6) 13 (3.0) 39 (6.0) 24 (4.9) 22 (4.7) 4*(1.5) 6*(1.3) 12 (3.5) 1*(0.7) 0*(0.0) 1*(0.5) #6 - 11.............. 66 (4.0) 21 (3.6) 30 (3.3) 15 (2.6) 30 (3.9) 5 (1.6) 16 (2.1) 10 (2.7) 3*(1.0) 1*(0.5) 2*(0.8) 1*(0.6)
12 - 19.............. 47 (4.5) 16 (3.1) 25 (2.3) 6 (1.5) 39 (4.1) 12 (2.1) 20 (2.4) 8 (2.3) 14 (3.4) 3*(1.1) 8 (3.3) 3*(0.7)20 and over... 55 (1.7) 15 (0.8) 23 (1.3) 16 (1.7) 35 (1.3) 7 (0.9) 16 (1.0) 12 (0.9) 11 (1.1) 2 (0.6) 5 (0.7) 3 (0.5)
2 and over... 56 (1.1) 16 (0.7) 25 (1.2) 15 (1.3) 34 (1.1) 7 (0.8) 16 (0.7) 11 (0.8) 10 (0.8) 2 (0.5) 5 (0.5) 3 (0.4)
$25,000 - $74,999:2 - 5.............. 78 (4.5) 9 (1.7) 39 (6.2) 30 (4.3) 21 (4.2) 3*(1.2) 8 (2.7) 10 (3.4) 1*(0.5) 0*(0.0) # #6 - 11.............. 72 (2.6) 23 (3.5) 34 (2.6) 15 (2.2) 25 (2.5) 7 (2.0) 10 (2.4) 8 (3.3) 3*(1.2) 1*(0.4) 1*(0.7) 1*(0.6)
12 - 19.............. 53 (3.9) 18 (3.1) 29 (3.9) 6 (1.3) 38 (4.6) 13 (2.0) 19 (3.2) 6 (1.6) 8 (1.7) 2*(0.6) 4 (0.9) 3*(1.0)20 and over... 62 (1.2) 13 (1.2) 28 (1.2) 21 (1.4) 33 (1.4) 7 (0.9) 14 (1.1) 12 (0.9) 6 (0.5) 1*(0.2) 3 (0.3) 2 (0.4)
2 and over... 62 (1.2) 14 (1.0) 29 (0.8) 19 (1.1) 32 (1.5) 8 (0.8) 14 (1.1) 11 (0.8) 6 (0.5) 1 (0.1) 3 (0.3) 2 (0.4)
$75,000 and higher:2 - 5.............. 95*(2.2) 5*(2.0) 50 (7.1) 41 (6.0) 4*(2.2) # 2*(1.0) 3*(1.3) # 0*(0.0) 0*(0.0) #6 - 11.............. 91 (2.0) 10 (2.5) 56 (3.2) 25 (1.8) 9 (2.0) 2*(0.9) 4*(1.1) 4*(1.0) 0*(0.0) 0*(0.0) 0*(0.0) 0*(0.0)
12 - 19.............. 71 (5.9) 18 (2.0) 38 (5.0) 15 (3.9) 25 (5.2) 7 (2.2) 9 (2.0) 9 (1.6) 4*(2.3) # 1*(1.0) 3*(1.4)20 and over... 76 (1.6) 14 (1.7) 30 (2.0) 31 (2.7) 21 (1.6) 2 (0.5) 11 (1.1) 8 (0.8) 3 (0.6) # 1*(0.2) 1 (0.5)
2 and over... 77 (1.6) 14 (1.4) 34 (1.6) 29 (2.3) 20 (1.5) 3 (0.6) 10 (0.9) 8 (0.6) 3 (0.6) # 1 (0.2) 1 (0.5)
All Individuals3:2 - 5.............. 83 (1.9) 9 (1.5) 43 (3.5) 31 (2.5) 16 (1.8) 2*(0.6) 5 (0.9) 8 (1.6) 1*(0.3) 0*(0.0) # #6 - 11.............. 77 (1.6) 18 (2.5) 41 (2.6) 18 (1.5) 21 (1.6) 5 (1.1) 9 (1.1) 7 (1.6) 2 (0.5) # 1*(0.5) 1*(0.2)
12 - 19.............. 58 (3.1) 17 (1.7) 31 (1.8) 9 (2.0) 34 (2.7) 10 (1.0) 16 (1.9) 8 (0.7) 8 (1.4) 1 (0.4) 4 (1.0) 3 (0.6)20 and over... 65 (0.8) 14 (1.0) 28 (0.8) 23 (1.4) 29 (0.7) 6 (0.6) 13 (0.6) 10 (0.6) 6 (0.4) 1 (0.2) 3 (0.2) 2 (0.3)
2 and over... 66 (0.9) 15 (0.8) 30 (0.6) 21 (1.2) 28 (0.7) 6 (0.6) 13 (0.5) 10 (0.5) 6 (0.4) 1 (0.2) 3 (0.1) 2 (0.3)

What We Eat in America, NHANES 2013-2014
Page 2 of 2Page 2 of 2
Symbol Legend
* Indicates an estimate that may be less statistically reliable than estimates that are not flagged. The rules for flagging estimated percentages are as follows:
Percent reporting: An estimated percentage between 25 and 75 percent is flagged when based on a sample size of less than 30 times the variance inflation factor (VIF), where the VIFrepresents a broadly calculated average design effect, or when the relative standard error is greater than 30 percent. An estimated percentage less than or equal to 25 percent or greater thanor equal to 75 percent is flagged when the smaller of np and n(1-p) is less than 8 times the VIF, where n is the sample size and p is the percentage expressed as a fraction. The VIF used inthis table is 1.98.
# Indicates a non-zero value too small to report.
Footnotes
1 Meals Patterns are categorized into the following:
Breakfast, lunch, and dinner: the respondent reported each of the three meals as follows: breakfast includes all eating occasions designated by the respondent as "breakfast", or theSpanish equivalents "desayuno", and "almuerzo"; lunch includes all eating occasions designated as "brunch", "lunch" or the Spanish equivalent "comida"; and dinner includes all eatingoccasions designated as "dinner", "supper", or the Spanish equivalent "cena".
Any two meals: the respondent reported any combination of two of the three meals -- breakfast, lunch or dinner.
Any one meal or less: the respondent reported one of the three meals, or no meal.
2 Snack occasions were reported as distinct eating occasions during the dietary interview and consisted of one or more food and beverage items, including plain water. Water was the only itemreported in approximately 25 percent of the snack occasions. Survey respondents selected the name of all eating occasions from a fixed list that was provided during the interview. All reports of"snack", "drink" or "extended consumption" (items that were consumed over a long period of time) were included as snack occasions. Spanish language interviewers used Spanish languagesnack occasion names: "merienda", "entre comida", "botana", "bocadillo", "tentempie", and "bebida".
3 Includes persons of all income levels or with unknown family income.
Abbreviations
SE standard error.
Notes Applicable to All Tables in Series: What We Eat in America, NHANES 2013-2014
Sample weights designed for dietary analysis were used to allow estimates representative of the U. S. population for the years of collection.
The statistics in this table are estimated from Day 1 dietary recall interviews conducted in the What We Eat in America, National Health and Nutrition Examination Survey (NHANES) 2013-2014.The 24-hour dietary recalls were conducted in-person, by trained interviewers, using the USDA 5-step Automated Multiple-Pass Method. Food intakes were coded and nutrient values weredetermined using the USDA Food and Nutrient Database for Dietary Studies 2013-2014 www.ars.usda.gov/nea/bhnrc/fsrg.
Intakes of nutrients and other dietary components are based on the consumption of food and beverages, including water, and do not include intake from supplements or medications.
The table includes data from individuals 2 years and over. Breast-fed children were excluded because breast milk was not quantified in dietary recall interviews.
Although alcohol data are collected for all individuals, estimates are not presented for age groups under 20 years due to extreme variability and/or inadequate sample size.
Suggested Citation
U.S. Department of Agriculture, Agricultural Research Service. 2016. Meals and Snacks: Distribution of Meal Patterns and Snack Occasions, by Family Income (in Dollars) and Age, What WeEat in America, NHANES 2013-2014.

DATA SOURCE: What We Eat in America, NHANES 2013-2014, individuals 2 years and over (excluding breast-fed children), day 1. Available: www.ars.usda.gov/nea/bhnrc/fsrg.Page 1 of 2
What We Eat in America, NHANES 2013-2014
Table 36. Meals and Snacks: Distribution of Meal Patterns1 and Snack Occasions2,by Family Income (as % of Poverty Level3) and Age, in the United States, 2013-2014
───── Breakfast, lunch, and dinner ───── ─────────── Any two meals ─────────── ──────── Any one meal or less ──────── Number of snack occasions Number of snack occasions Number of snack occasionsFamily income as
% of poverty leveland age 1 or less 2 or 3 4 or more 1 or less 2 or 3 4 or more 1 or less 2 or 3 4 or more(years) % (SE) % (SE) % (SE) % (SE) % (SE) % (SE) % (SE) % (SE) % (SE) % (SE) % (SE) % (SE)
Under 131% poverty:2 - 5.............. 77 (3.8) 12 (2.1) 40 (5.1) 25 (4.5) 23 (3.9) 3*(1.3) 7 (1.0) 13 (3.1) 1*(0.5) 0*(0.0) 1*(0.4) #6 - 11.............. 68 (2.3) 21 (2.7) 32 (2.3) 15 (2.2) 28 (2.0) 7 (1.9) 14 (1.5) 8 (1.8) 4 (0.9) 1*(0.3) 2*(0.6) 1*(0.4)
12 - 19.............. 49 (3.9) 17 (2.8) 26 (1.8) 6 (1.0) 39 (3.8) 12 (1.6) 19 (2.7) 8 (2.5) 13 (2.6) 3 (1.0) 6 (2.4) 4 (0.8)20 and over... 50 (1.4) 16 (1.3) 21 (1.3) 13 (1.6) 39 (1.6) 8 (1.0) 19 (1.1) 12 (1.1) 11 (1.1) 3 (0.6) 5 (0.7) 3 (0.6)
2 and over... 54 (1.2) 17 (1.0) 24 (1.1) 13 (1.2) 36 (1.3) 8 (1.0) 17 (0.9) 11 (0.9) 10 (0.9) 2 (0.4) 5 (0.6) 3 (0.4)
131-350% poverty:2 - 5.............. 83 (4.2) 9 (2.1) 37 (6.7) 37 (6.3) 17 (4.0) 3*(1.2) 6*(2.7) 8*(2.4) 1*(0.6) 0*(0.0) # #6 - 11.............. 78 (3.1) 22 (3.4) 36 (4.8) 19 (2.6) 21 (3.1) 4*(1.4) 8 (2.2) 8 (3.4) 2*(0.8) 1*(0.5) 1*(0.6) #
12 - 19.............. 55 (3.4) 19 (3.7) 29 (4.4) 7 (1.5) 37 (4.1) 12 (2.2) 16 (2.6) 9 (1.7) 8 (2.1) 1*(0.3) 5 (1.5) 2*(1.0)20 and over... 64 (2.0) 13 (1.3) 30 (1.6) 21 (1.3) 31 (2.0) 7 (0.9) 13 (1.6) 11 (0.9) 6 (0.7) 1*(0.3) 3 (0.4) 2 (0.4)
2 and over... 65 (1.7) 15 (0.8) 30 (1.1) 20 (1.2) 30 (1.8) 7 (0.9) 13 (1.3) 10 (0.7) 5 (0.7) 1 (0.2) 3 (0.4) 2 (0.4)
Over 350% poverty:2 - 5.............. 95*(2.8) 3*(0.8) 55 (9.3) 37 (7.5) 5*(2.7) # 2*(1.4) 3*(1.5) # 0*(0.0) 0*(0.0) #6 - 11.............. 92 (2.2) 7*(1.8) 62 (3.0) 23 (2.9) 8 (2.2) 1*(0.8) 4*(1.6) 3*(1.0) 0*(0.0) 0*(0.0) 0*(0.0) 0*(0.0)
12 - 19.............. 74 (6.4) 15 (2.7) 42 (6.5) 18 (5.3) 22 (5.5) 6*(2.3) 9 (2.3) 7 (2.1) 3*(2.1) 0*(0.0) # 3*(2.0)20 and over... 75 (1.6) 14 (1.6) 30 (1.8) 31 (2.2) 22 (1.5) 3 (0.7) 11 (1.0) 9 (0.8) 3 (0.6) # 1 (0.3) 2 (0.4)
2 and over... 76 (1.4) 13 (1.5) 34 (1.7) 29 (2.0) 21 (1.3) 3 (0.6) 10 (0.8) 8 (0.5) 3 (0.5) # 1 (0.3) 2 (0.4)
All Individuals4:2 - 5.............. 83 (1.9) 9 (1.5) 43 (3.5) 31 (2.5) 16 (1.8) 2*(0.6) 5 (0.9) 8 (1.6) 1*(0.3) 0*(0.0) # #6 - 11.............. 77 (1.6) 18 (2.5) 41 (2.6) 18 (1.5) 21 (1.6) 5 (1.1) 9 (1.1) 7 (1.6) 2 (0.5) # 1*(0.5) 1*(0.2)
12 - 19.............. 58 (3.1) 17 (1.7) 31 (1.8) 9 (2.0) 34 (2.7) 10 (1.0) 16 (1.9) 8 (0.7) 8 (1.4) 1 (0.4) 4 (1.0) 3 (0.6)20 and over... 65 (0.8) 14 (1.0) 28 (0.8) 23 (1.4) 29 (0.7) 6 (0.6) 13 (0.6) 10 (0.6) 6 (0.4) 1 (0.2) 3 (0.2) 2 (0.3)
2 and over... 66 (0.9) 15 (0.8) 30 (0.6) 21 (1.2) 28 (0.7) 6 (0.6) 13 (0.5) 10 (0.5) 6 (0.4) 1 (0.2) 3 (0.1) 2 (0.3)

What We Eat in America, NHANES 2013-2014
Page 2 of 2Page 2 of 2
Symbol Legend
* Indicates an estimate that may be less statistically reliable than estimates that are not flagged. The rules for flagging estimated percentages are as follows:
Percent reporting: An estimated percentage between 25 and 75 percent is flagged when based on a sample size of less than 30 times the variance inflation factor (VIF), where the VIFrepresents a broadly calculated average design effect, or when the relative standard error is greater than 30 percent. An estimated percentage less than or equal to 25 percent or greater thanor equal to 75 percent is flagged when the smaller of np and n(1-p) is less than 8 times the VIF, where n is the sample size and p is the percentage expressed as a fraction. The VIF used inthis table is 1.98.
# Indicates a non-zero value too small to report.
Footnotes
1 Meals Patterns are categorized into the following:
Breakfast, lunch, and dinner: the respondent reported each of the three meals as follows: breakfast includes all eating occasions designated by the respondent as "breakfast", or theSpanish equivalents "desayuno", and "almuerzo"; lunch includes all eating occasions designated as "brunch", "lunch" or the Spanish equivalent "comida"; and dinner includes all eatingoccasions designated as "dinner", "supper", or the Spanish equivalent "cena".
Any two meals: the respondent reported any combination of two of the three meals -- breakfast, lunch or dinner.
Any one meal or less: the respondent reported one of the three meals, or no meal.
2 Snack occasions were reported as distinct eating occasions during the dietary interview and consisted of one or more food and beverage items, including plain water. Water was the only itemreported in approximately 25 percent of the snack occasions. Survey respondents selected the name of all eating occasions from a fixed list that was provided during the interview. All reports of"snack", "drink" or "extended consumption" (items that were consumed over a long period of time) were included as snack occasions. Spanish language interviewers used Spanish languagesnack occasion names: "merienda", "entre comida", "botana", "bocadillo", "tentempie", and "bebida".
3 The ratio of family income to poverty expressed as a percentage. The Department of Health and Human Services’ poverty guidelines were used as the poverty measure to calculate the ratio, http://aspe.hhs.gov/poverty/.
4 Includes persons of all income levels or with unknown family income.
Abbreviations
SE standard error.
Notes Applicable to All Tables in Series: What We Eat in America, NHANES 2013-2014
Sample weights designed for dietary analysis were used to allow estimates representative of the U. S. population for the years of collection.
The statistics in this table are estimated from Day 1 dietary recall interviews conducted in the What We Eat in America, National Health and Nutrition Examination Survey (NHANES) 2013-2014.The 24-hour dietary recalls were conducted in-person, by trained interviewers, using the USDA 5-step Automated Multiple-Pass Method. Food intakes were coded and nutrient values weredetermined using the USDA Food and Nutrient Database for Dietary Studies 2013-2014 www.ars.usda.gov/nea/bhnrc/fsrg.
Intakes of nutrients and other dietary components are based on the consumption of food and beverages, including water, and do not include intake from supplements or medications.
The table includes data from individuals 2 years and over. Breast-fed children were excluded because breast milk was not quantified in dietary recall interviews.
Although alcohol data are collected for all individuals, estimates are not presented for age groups under 20 years due to extreme variability and/or inadequate sample size.
Suggested Citation
U.S. Department of Agriculture, Agricultural Research Service. 2016. Meals and Snacks: Distribution of Meal Patterns and Snack Occasions, by Family Income (as % of Poverty Level) and Age,What We Eat in America, NHANES 2013-2014.

Page 1 of 23Available: www.ars.usda.gov/nea/bhnrc/fsrg.
DATA SOURCE: What We Eat in America, NHANES 2013-2014, day 1 food and supplement intake data, 2 years and over (excluding individuals pregnant, lactating, breast-fed, or with incomplete supplement data.).
See page 23 for footnotes.
What We Eat in America, NHANES 2013-2014
Table 37. Total Nutrient Intakes: Percent Reporting and Mean Amounts1 of Selected2 Vitamins and Minerals from Food and Beverages3 and Dietary Supplements4,by Gender and Age, in the United States, 2013-2014
T h i a m i n
──────────────── All Individuals 5 ──────────────── ────────────── Supplement Users 6 ────────────── ─ Non-users 7 ─
Genderand age
Percentreporting
supplementthiamin 8
SampleSize Food Supplement
Food plussupplement
Samplesize Food Supplement
Food plussupplement Food
(years) % (SE) mg (SE) mg (SE) mg (SE) mg (SE) mg (SE) mg (SE) mg (SE)
Males and females:2 - 5.............. 9 (1.9) 664 1.25 (0.031) 0.11 (0.029) 1.36 (0.047) -- -- -- 1.24 (0.032)6 - 11.............. 5 (1.0) 1039 1.60 (0.036) 0.13* (0.067) 1.74 (0.089) -- -- -- 1.59 (0.035)
12 - 19.............. 7 (0.9) 1271 1.68 (0.043) 0.75* (0.267) 2.43 (0.258) 68 2.46 (0.412) 11.00* (3.653) 13.46 (3.801) 1.62 (0.055)
Males:20 - 39.............. 13 (1.7) 846 1.96 (0.042) 1.95 (0.576) 3.91 (0.565) 92 2.17 (0.129) 14.50 (3.141) 16.67 (3.169) 1.93 (0.048)40 - 59.............. 25 (2.8) 791 1.86 (0.037) 3.55 (0.796) 5.41 (0.784) 159 1.98 (0.075) 14.10 (3.191) 16.08 (3.200) 1.82 (0.038)60 and over...... 36 (1.7) 723 1.76 (0.057) 12.99* (7.407) 14.74* (7.428) 206 1.74 (0.077) 36.02*(19.633) 37.76*(19.684) 1.77 (0.072)
20 and over... 23 (1.6) 2360 1.87 (0.025) 5.29* (1.957) 7.16 (1.964) 457 1.93 (0.041) 22.61* (7.390) 24.54* (7.392) 1.85 (0.031)
Females:20 - 39.............. 16 (1.9) 791 1.41 (0.034) 0.89 (0.233) 2.30 (0.224) 110 1.38 (0.058) 5.66 (1.189) 7.03 (1.187) 1.42 (0.043)40 - 59.............. 23 (1.7) 899 1.38 (0.041) 3.05 (0.711) 4.44 (0.719) 172 1.42 (0.136) 13.33 (2.894) 14.75 (2.940) 1.37 (0.037)60 and over...... 37 (2.3) 780 1.32 (0.028) 10.21* (3.964) 11.53* (3.951) 252 1.46 (0.053) 27.27*(10.621) 28.73*(10.602) 1.25 (0.026)
20 and over... 25 (1.4) 2470 1.38 (0.020) 4.40 (1.133) 5.78 (1.127) 534 1.43 (0.048) 17.81 (4.764) 19.23 (4.745) 1.36 (0.023)
All Individuals:2 and over... 20 (0.9) 7804 1.61 (0.018) 3.75 (0.842) 5.36 (0.850) 1168 1.70 (0.039) 18.97 (3.958) 20.66 (3.975) 1.59 (0.021)

Page 2 of 23Available: www.ars.usda.gov/nea/bhnrc/fsrg.
DATA SOURCE: What We Eat in America, NHANES 2013-2014, day 1 food and supplement intake data, 2 years and over (excluding individuals pregnant, lactating, breast-fed, or with incomplete supplement data.).
See page 23 for footnotes.
What We Eat in America, NHANES 2013-2014
Table 37. Total Nutrient Intakes: Percent Reporting and Mean Amounts1 of Selected2 Vitamins and Minerals from Food and Beverages3 and Dietary Supplements4,by Gender and Age, in the United States, 2013-2014 (continued)
R i b o f l a v i n
──────────────── All Individuals 5 ──────────────── ────────────── Supplement Users 6 ────────────── ─ Non-users 7 ─
Genderand age
Percentreporting
supplementriboflavin 8
SampleSize Food Supplement
Food plussupplement
Samplesize Food Supplement
Food plussupplement Food
(years) % (SE) mg (SE) mg (SE) mg (SE) mg (SE) mg (SE) mg (SE) mg (SE)
Males and females:2 - 5.............. 9 (1.9) 664 1.71 (0.047) 0.13 (0.032) 1.84 (0.062) -- -- -- 1.72 (0.049)6 - 11.............. 5 (1.0) 1039 1.99 (0.037) 0.17* (0.099) 2.16 (0.115) -- -- -- 1.99 (0.040)
12 - 19.............. 7 (0.9) 1271 2.13 (0.071) 0.60* (0.193) 2.73 (0.201) 68 3.59 (0.770) 8.82* (2.831) 12.41 (3.251) 2.02 (0.076)
Males:20 - 39.............. 13 (1.7) 846 2.70 (0.098) 1.46 (0.386) 4.16 (0.401) 92 3.11 (0.201) 10.87 (2.134) 13.97 (2.139) 2.63 (0.108)40 - 59.............. 25 (2.8) 791 2.54 (0.041) 2.77 (0.622) 5.31 (0.623) 161 2.84 (0.116) 10.94 (2.071) 13.79 (2.097) 2.43 (0.057)60 and over...... 36 (1.7) 723 2.32 (0.053) 2.60 (0.664) 4.92 (0.686) 204 2.35 (0.078) 7.29 (1.666) 9.64 (1.710) 2.30 (0.078)
20 and over... 23 (1.5) 2360 2.54 (0.040) 2.23 (0.357) 4.77 (0.369) 457 2.72 (0.059) 9.53 (1.246) 12.25 (1.263) 2.49 (0.052)
Females:20 - 39.............. 16 (2.1) 791 1.80 (0.044) 0.94 (0.254) 2.73 (0.253) 111 1.93 (0.134) 5.85 (1.309) 7.78 (1.299) 1.77 (0.056)40 - 59.............. 23 (1.7) 899 1.87 (0.037) 1.96 (0.469) 3.83 (0.480) 172 1.91 (0.100) 8.55 (1.854) 10.47 (1.919) 1.85 (0.036)60 and over...... 37 (2.3) 780 1.81 (0.043) 3.54 (0.359) 5.34 (0.363) 252 2.02 (0.076) 9.45 (1.072) 11.47 (1.107) 1.68 (0.039)
20 and over... 25 (1.5) 2470 1.83 (0.025) 2.08 (0.273) 3.90 (0.280) 535 1.96 (0.045) 8.37 (0.981) 10.33 (1.004) 1.78 (0.030)
All Individuals:2 and over... 20 (0.9) 7804 2.14 (0.029) 1.71 (0.177) 3.85 (0.190) 1168 2.35 (0.068) 8.64 (0.797) 10.99 (0.819) 2.08 (0.032)

Page 3 of 23Available: www.ars.usda.gov/nea/bhnrc/fsrg.
DATA SOURCE: What We Eat in America, NHANES 2013-2014, day 1 food and supplement intake data, 2 years and over (excluding individuals pregnant, lactating, breast-fed, or with incomplete supplement data.).
See page 23 for footnotes.
What We Eat in America, NHANES 2013-2014
Table 37. Total Nutrient Intakes: Percent Reporting and Mean Amounts1 of Selected2 Vitamins and Minerals from Food and Beverages3 and Dietary Supplements4,by Gender and Age, in the United States, 2013-2014 (continued)
N i a c i n
──────────────── All Individuals 5 ──────────────── ────────────── Supplement Users 6 ────────────── ─ Non-users 7 ─
Genderand age
Percentreporting
supplementniacin 8
SampleSize Food Supplement
Food plussupplement
Samplesize Food Supplement
Food plussupplement Food
(years) % (SE) mg (SE) mg (SE) mg (SE) mg (SE) mg (SE) mg (SE) mg (SE)
Males and females:2 - 5.............. 9 (1.9) 664 15.5 (0.39) 1.2 (0.29) 16.7 (0.53) -- -- -- 15.6 (0.40)6 - 11.............. 5 (1.0) 1039 21.1 (0.43) 0.9 (0.19) 22.0 (0.50) 61 20.9 (1.35) 16.4 (2.08) 37.3 (2.09) 21.1 (0.45)
12 - 19.............. 8 (1.2) 1271 26.1 (0.74) 2.0 (0.41) 28.0 (0.91) 79 39.3 (7.35) 23.9 (3.95) 63.2 (9.46) 24.9 (0.92)
Males:20 - 39.............. 15 (1.8) 846 35.9 (1.03) 4.7 (0.87) 40.6 (1.12) 103 39.0 (2.53) 32.2 (4.57) 71.2 (4.81) 35.4 (1.07)40 - 59.............. 26 (2.6) 791 31.1 (0.61) 7.7 (1.00) 38.8 (1.13) 164 32.8 (1.49) 29.7 (2.32) 62.5 (3.32) 30.5 (0.71)60 and over...... 39 (2.2) 723 26.8 (0.46) 21.8 (4.66) 48.6 (4.52) 220 26.9 (0.99) 55.2 (10.51) 82.1 (10.55) 26.7 (0.69)
20 and over... 25 (1.7) 2360 31.9 (0.41) 10.0 (1.32) 41.9 (1.32) 487 31.9 (0.61) 40.3 (4.63) 72.2 (4.66) 31.9 (0.50)
Females:20 - 39.............. 18 (2.0) 791 22.5 (0.61) 3.5 (0.48) 26.0 (0.86) 127 23.8 (1.40) 19.8 (1.53) 43.5 (2.26) 22.2 (0.69)40 - 59.............. 24 (1.8) 899 21.5 (0.37) 9.6 (2.61) 31.1 (2.79) 181 22.1 (0.81) 39.6 (8.77) 61.6 (8.72) 21.3 (0.46)60 and over...... 40 (2.3) 780 19.6 (0.56) 14.7 (1.03) 34.3 (1.21) 264 20.7 (0.73) 37.0 (3.19) 57.7 (3.25) 18.9 (0.62)
20 and over... 27 (1.5) 2470 21.3 (0.24) 9.1 (0.98) 30.4 (1.02) 572 21.9 (0.31) 34.1 (2.89) 56.0 (2.87) 21.1 (0.31)
All Individuals:2 and over... 21 (1.0) 7804 25.5 (0.23) 7.6 (0.68) 33.0 (0.73) 1249 26.9 (0.63) 35.6 (2.23) 62.4 (2.37) 25.1 (0.28)
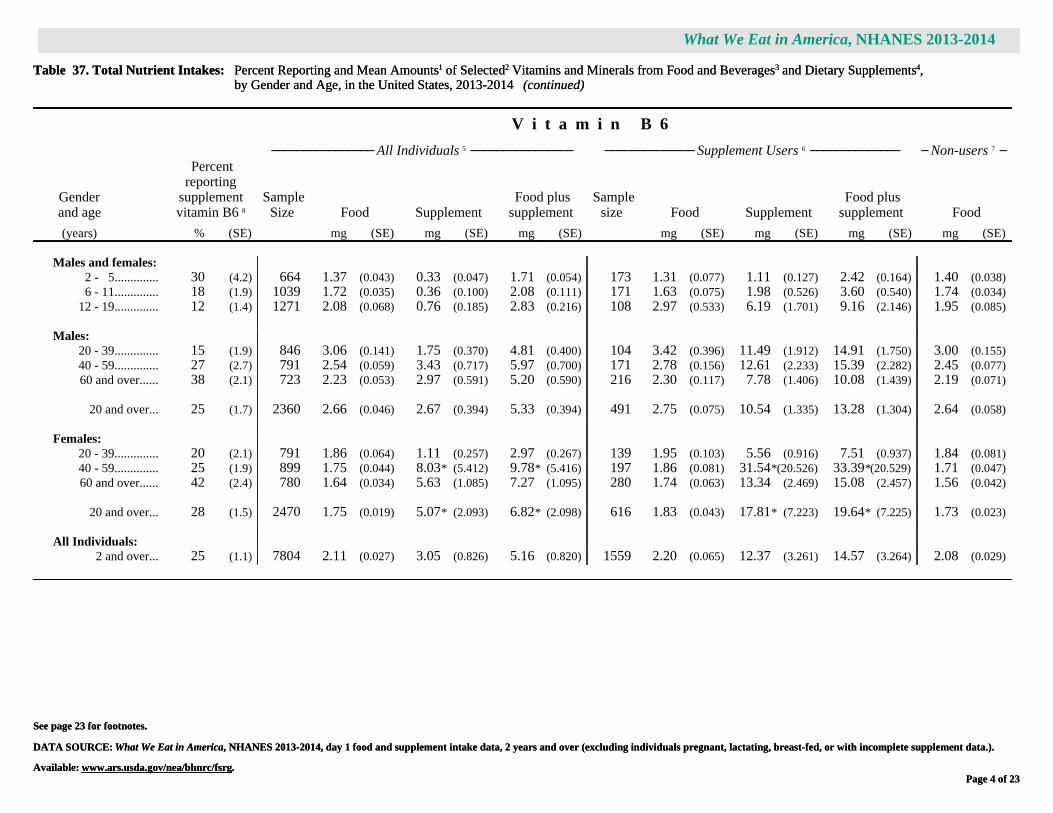
Page 4 of 23Available: www.ars.usda.gov/nea/bhnrc/fsrg.
DATA SOURCE: What We Eat in America, NHANES 2013-2014, day 1 food and supplement intake data, 2 years and over (excluding individuals pregnant, lactating, breast-fed, or with incomplete supplement data.).
See page 23 for footnotes.
What We Eat in America, NHANES 2013-2014
Table 37. Total Nutrient Intakes: Percent Reporting and Mean Amounts1 of Selected2 Vitamins and Minerals from Food and Beverages3 and Dietary Supplements4,by Gender and Age, in the United States, 2013-2014 (continued)
V i t a m i n B 6
──────────────── All Individuals 5 ──────────────── ────────────── Supplement Users 6 ────────────── ─ Non-users 7 ─
Genderand age
Percentreporting
supplementvitamin B6 8
SampleSize Food Supplement
Food plussupplement
Samplesize Food Supplement
Food plussupplement Food
(years) % (SE) mg (SE) mg (SE) mg (SE) mg (SE) mg (SE) mg (SE) mg (SE)
Males and females:2 - 5.............. 30 (4.2) 664 1.37 (0.043) 0.33 (0.047) 1.71 (0.054) 173 1.31 (0.077) 1.11 (0.127) 2.42 (0.164) 1.40 (0.038)6 - 11.............. 18 (1.9) 1039 1.72 (0.035) 0.36 (0.100) 2.08 (0.111) 171 1.63 (0.075) 1.98 (0.526) 3.60 (0.540) 1.74 (0.034)
12 - 19.............. 12 (1.4) 1271 2.08 (0.068) 0.76 (0.185) 2.83 (0.216) 108 2.97 (0.533) 6.19 (1.701) 9.16 (2.146) 1.95 (0.085)
Males:20 - 39.............. 15 (1.9) 846 3.06 (0.141) 1.75 (0.370) 4.81 (0.400) 104 3.42 (0.396) 11.49 (1.912) 14.91 (1.750) 3.00 (0.155)40 - 59.............. 27 (2.7) 791 2.54 (0.059) 3.43 (0.717) 5.97 (0.700) 171 2.78 (0.156) 12.61 (2.233) 15.39 (2.282) 2.45 (0.077)60 and over...... 38 (2.1) 723 2.23 (0.053) 2.97 (0.591) 5.20 (0.590) 216 2.30 (0.117) 7.78 (1.406) 10.08 (1.439) 2.19 (0.071)
20 and over... 25 (1.7) 2360 2.66 (0.046) 2.67 (0.394) 5.33 (0.394) 491 2.75 (0.075) 10.54 (1.335) 13.28 (1.304) 2.64 (0.058)
Females:20 - 39.............. 20 (2.1) 791 1.86 (0.064) 1.11 (0.257) 2.97 (0.267) 139 1.95 (0.103) 5.56 (0.916) 7.51 (0.937) 1.84 (0.081)40 - 59.............. 25 (1.9) 899 1.75 (0.044) 8.03* (5.412) 9.78* (5.416) 197 1.86 (0.081) 31.54*(20.526) 33.39*(20.529) 1.71 (0.047)60 and over...... 42 (2.4) 780 1.64 (0.034) 5.63 (1.085) 7.27 (1.095) 280 1.74 (0.063) 13.34 (2.469) 15.08 (2.457) 1.56 (0.042)
20 and over... 28 (1.5) 2470 1.75 (0.019) 5.07* (2.093) 6.82* (2.098) 616 1.83 (0.043) 17.81* (7.223) 19.64* (7.225) 1.73 (0.023)
All Individuals:2 and over... 25 (1.1) 7804 2.11 (0.027) 3.05 (0.826) 5.16 (0.820) 1559 2.20 (0.065) 12.37 (3.261) 14.57 (3.264) 2.08 (0.029)

Page 5 of 23Available: www.ars.usda.gov/nea/bhnrc/fsrg.
DATA SOURCE: What We Eat in America, NHANES 2013-2014, day 1 food and supplement intake data, 2 years and over (excluding individuals pregnant, lactating, breast-fed, or with incomplete supplement data.).
See page 23 for footnotes.
What We Eat in America, NHANES 2013-2014
Table 37. Total Nutrient Intakes: Percent Reporting and Mean Amounts1 of Selected2 Vitamins and Minerals from Food and Beverages3 and Dietary Supplements4,by Gender and Age, in the United States, 2013-2014 (continued)
F o l i c a c i d
──────────────── All Individuals 5 ──────────────── ────────────── Supplement Users 6 ────────────── ─ Non-users 7 ─
Genderand age
Percentreporting
supplementfolic acid 8
SampleSize Food Supplement
Food plussupplement
Samplesize Food Supplement
Food plussupplement Food
(years) % (SE) µg (SE) µg (SE) µg (SE) µg (SE) µg (SE) µg (SE) µg (SE)
Males and females:2 - 5.............. 29 (4.3) 664 170 (6.6) 54 (7.3) 224 (6.7) 168 148 (12.2) 186 (13.4) 334 (18.4) 179 (7.1)6 - 11.............. 18 (2.0) 1039 214 (8.7) 35 (3.9) 249 (9.7) 168 199 (10.9) 198 (12.7) 397 (20.2) 217 (10.5)
12 - 19.............. 12 (1.4) 1271 220 (11.9) 38 (5.2) 258 (11.2) 107 313 (64.6) 319 (17.2) 633 (68.6) 207 (13.0)
Males:20 - 39.............. 15 (1.9) 846 224 (10.1) 61 (8.2) 285 (15.7) 106 274 (25.9) 403 (17.6) 677 (31.5) 215 (13.0)40 - 59.............. 26 (2.6) 791 198 (10.5) 115 (12.3) 313 (9.7) 167 192 (20.6) 443 (17.3) 635 (23.8) 200 (11.8)60 and over...... 37 (1.9) 723 196 (10.5) 190 (22.4) 386 (29.6) 205 216 (25.4) 513 (53.9) 728 (63.4) 185 (10.3)
20 and over... 25 (1.7) 2360 208 (5.3) 113 (9.0) 321 (11.9) 478 220 (11.5) 460 (21.8) 680 (30.4) 203 (6.1)
Females:20 - 39.............. 20 (1.9) 791 159 (8.1) 90 (9.1) 249 (12.8) 144 151 (12.1) 440 (21.6) 591 (22.0) 162 (11.1)40 - 59.............. 26 (2.1) 899 146 (8.3) 111 (9.2) 257 (14.5) 193 146 (16.8) 432 (13.4) 578 (20.6) 146 (8.2)60 and over...... 41 (2.3) 780 148 (4.4) 200 (13.2) 349 (14.0) 271 171 (10.1) 493 (13.7) 664 (17.1) 133 (5.0)
20 and over... 28 (1.4) 2470 151 (3.8) 130 (6.2) 281 (7.8) 608 157 (7.9) 459 (7.6) 616 (10.1) 149 (4.1)
All Individuals:2 and over... 24 (1.1) 7804 186 (4.2) 101 (4.2) 288 (6.2) 1529 192 (7.1) 419 (11.4) 611 (14.2) 184 (4.7)

Page 6 of 23Available: www.ars.usda.gov/nea/bhnrc/fsrg.
DATA SOURCE: What We Eat in America, NHANES 2013-2014, day 1 food and supplement intake data, 2 years and over (excluding individuals pregnant, lactating, breast-fed, or with incomplete supplement data.).
See page 23 for footnotes.
What We Eat in America, NHANES 2013-2014
Table 37. Total Nutrient Intakes: Percent Reporting and Mean Amounts1 of Selected2 Vitamins and Minerals from Food and Beverages3 and Dietary Supplements4,by Gender and Age, in the United States, 2013-2014 (continued)
F o l a t e ( D F E )
──────────────── All Individuals 5 ──────────────── ────────────── Supplement Users 6 ────────────── ─ Non-users 7 ─
Genderand age
Percentreporting
supplementfolate (DFE) 8
SampleSize Food Supplement
Food plussupplement
Samplesize Food Supplement
Food plussupplement Food
(years) % (SE) µg (SE) µg (SE) µg (SE) µg (SE) µg (SE) µg (SE) µg (SE)
Males and females:2 - 5.............. 29 (4.3) 664 417 (12.8) 93 (12.3) 509 (13.3) 168 390 (24.0) 315 (22.8) 706 (36.6) 428 (12.9)6 - 11.............. 18 (2.0) 1039 519 (16.4) 60 (6.7) 579 (18.1) 168 495 (19.2) 337 (21.6) 832 (35.7) 524 (19.6)
12 - 19.............. 12 (1.4) 1271 547 (20.9) 64 (8.9) 611 (20.1) 107 737 (117.5) 543 (29.2) 1279 (125.4) 521 (24.3)
Males:20 - 39.............. 15 (1.9) 846 640 (18.4) 104 (13.9) 744 (26.8) 106 715 (49.7) 684 (30.0) 1400 (58.4) 627 (24.1)40 - 59.............. 26 (2.6) 791 589 (16.4) 196 (20.9) 785 (16.2) 167 607 (32.6) 753 (29.4) 1360 (37.1) 583 (19.1)60 and over...... 37 (1.9) 723 560 (19.7) 323 (38.0) 883 (53.4) 205 594 (42.4) 872 (91.7) 1466 (109.9) 540 (23.4)
20 and over... 25 (1.7) 2360 602 (10.2) 192 (15.3) 794 (21.6) 478 628 (21.4) 781 (37.1) 1409 (52.8) 593 (11.7)
Females:20 - 39.............. 20 (1.9) 791 470 (14.0) 153 (15.5) 622 (20.1) 144 481 (17.9) 748 (36.8) 1228 (31.4) 467 (19.5)40 - 59.............. 26 (2.1) 899 449 (16.0) 188 (15.6) 637 (27.4) 193 489 (33.5) 735 (22.8) 1223 (40.1) 435 (13.7)60 and over...... 41 (2.3) 780 445 (9.5) 340 (22.4) 785 (24.6) 271 502 (21.2) 838 (23.2) 1340 (30.4) 407 (10.8)
20 and over... 28 (1.4) 2470 455 (7.3) 220 (10.6) 675 (13.6) 608 492 (13.9) 781 (13.0) 1273 (16.8) 440 (8.0)
All Individuals:2 and over... 24 (1.1) 7804 524 (8.1) 172 (7.2) 696 (11.7) 1529 551 (14.6) 712 (19.3) 1263 (26.7) 515 (9.1)

Page 7 of 23Available: www.ars.usda.gov/nea/bhnrc/fsrg.
DATA SOURCE: What We Eat in America, NHANES 2013-2014, day 1 food and supplement intake data, 2 years and over (excluding individuals pregnant, lactating, breast-fed, or with incomplete supplement data.).
See page 23 for footnotes.
What We Eat in America, NHANES 2013-2014
Table 37. Total Nutrient Intakes: Percent Reporting and Mean Amounts1 of Selected2 Vitamins and Minerals from Food and Beverages3 and Dietary Supplements4,by Gender and Age, in the United States, 2013-2014 (continued)
C h o l i n e
──────────────── All Individuals 5 ──────────────── ────────────── Supplement Users 6 ────────────── ─ Non-users 7 ─
Genderand age
Percentreporting
supplementcholine 8
SampleSize Food Supplement
Food plussupplement
Samplesize Food Supplement
Food plussupplement Food
(years) % (SE) mg (SE) mg (SE) mg (SE) mg (SE) mg (SE) mg (SE) mg (SE)
Males and females:2 - 5.............. 11 (2.7) 664 209 (6.7) 1* (0.3) 210 (6.6) 68 214 (7.9) 10 (2.1) 224 (7.7) 208 (8.0)6 - 11.............. 8 (0.8) 1039 247 (4.6) 1* (0.3) 248 (4.6) 77 244 (10.6) 10* (3.3) 253 (10.3) 247 (4.7)
12 - 19.............. 6 (1.0) 1271 282 (6.3) 1* (0.4) 283 (6.1) -- -- -- 271 (7.4)
Males:20 - 39.............. 3 (0.6) 846 414 (8.6) # 415 (8.6) -- -- -- 413 (8.3)40 - 59.............. 4 (0.9) 791 420 (11.2) 1* (0.6) 421 (11.3) -- -- -- 423 (10.7)60 and over...... 5 (1.7) 723 357 (7.3) 2* (0.9) 359 (6.8) -- -- -- 356 (8.6)
20 and over... 4 (0.7) 2360 402 (6.4) 1 (0.3) 403 (6.4) 77 388 (22.9) 31 (7.3) 419 (27.9) 402 (6.3)
Females:20 - 39.............. 4 (1.1) 791 280 (5.1) 1* (0.4) 281 (5.1) -- -- -- 280 (4.9)40 - 59.............. 6 (1.4) 899 280 (5.9) 1* (0.4) 281 (5.8) -- -- -- 277 (6.2)60 and over...... 7 (1.2) 780 269 (7.6) 2 (0.4) 271 (7.7) -- -- -- 267 (8.0)
20 and over... 6 (0.8) 2470 277 (3.8) 1 (0.3) 278 (3.8) 115 304 (18.4) 21 (3.4) 325 (19.6) 275 (4.0)
All Individuals:2 and over... 5 (0.5) 7804 318 (3.4) 1 (0.2) 319 (3.4) 379 332 (14.3) 20 (2.4) 352 (14.4) 318 (3.2)

Page 8 of 23Available: www.ars.usda.gov/nea/bhnrc/fsrg.
DATA SOURCE: What We Eat in America, NHANES 2013-2014, day 1 food and supplement intake data, 2 years and over (excluding individuals pregnant, lactating, breast-fed, or with incomplete supplement data.).
See page 23 for footnotes.
What We Eat in America, NHANES 2013-2014
Table 37. Total Nutrient Intakes: Percent Reporting and Mean Amounts1 of Selected2 Vitamins and Minerals from Food and Beverages3 and Dietary Supplements4,by Gender and Age, in the United States, 2013-2014 (continued)
V i t a m i n B 1 2
──────────────── All Individuals 5 ──────────────── ────────────── Supplement Users 6 ────────────── ─ Non-users 7 ─
Genderand age
Percentreporting
supplementvitamin B12 8
SampleSize Food Supplement
Food plussupplement
Samplesize Food Supplement
Food plussupplement Food
(years) % (SE) µg (SE) µg (SE) µg (SE) µg (SE) µg (SE) µg (SE) µg (SE)
Males and females:2 - 5.............. 30 (4.3) 664 3.88 (0.119) 1.1 (0.15) 5.0 (0.16) 170 3.70 (0.222) 3.7 (0.33) 7.4 (0.39) 3.95 (0.114)6 - 11.............. 18 (2.0) 1039 4.73 (0.113) 0.8 (0.08) 5.5 (0.15) 170 4.58 (0.147) 4.3 (0.18) 8.9 (0.24) 4.76 (0.144)
12 - 19.............. 12 (1.4) 1271 5.25 (0.157) 7.9* (4.62) 13.1* (4.69) 106 6.94 (1.294) 65.9* (38.09) 72.8* (38.38) 5.02 (0.206)
Males:20 - 39.............. 16 (1.8) 846 7.05 (0.412) 8.5* (2.79) 15.5 (2.76) 106 7.82 (0.396) 54.7* (17.44) 62.5 (17.33) 6.91 (0.451)40 - 59.............. 28 (2.3) 791 5.57 (0.211) 82.7* (33.63) 88.3* (33.59) 178 6.34 (0.562) 297.8*(118.72) 304.1*(118.70) 5.27 (0.242)60 and over...... 39 (2.1) 723 5.03 (0.220) 93.6* (35.03) 98.6* (35.07) 223 5.13 (0.235) 241.9* (86.28) 247.0* (86.34) 4.97 (0.386)
20 and over... 26 (1.5) 2360 6.00 (0.153) 56.9 (13.98) 62.9 (13.93) 507 6.23 (0.317) 220.7 (52.58) 226.9 (52.50) 5.93 (0.165)
Females:20 - 39.............. 21 (2.0) 791 4.08 (0.133) 29.1* (10.85) 33.2* (10.84) 146 4.09 (0.363) 138.5* (48.89) 142.6* (48.97) 4.07 (0.169)40 - 59.............. 28 (1.9) 899 3.80 (0.122) 93.5 (27.27) 97.3 (27.23) 208 3.53 (0.159) 338.5 (100.76) 342.0 (100.69) 3.90 (0.185)60 and over...... 43 (2.3) 780 4.01 (0.171) 97.8 (15.41) 101.8 (15.44) 291 4.09 (0.232) 225.7 (36.43) 229.8 (36.39) 3.95 (0.277)
20 and over... 30 (1.5) 2470 3.95 (0.106) 73.6 (9.77) 77.6 (9.78) 645 3.89 (0.150) 245.6 (34.56) 249.5 (34.53) 3.98 (0.142)
All Individuals:2 and over... 25 (1.0) 7804 4.93 (0.073) 50.2 (6.41) 55.1 (6.42) 1598 4.98 (0.202) 198.1 (28.75) 203.1 (28.73) 4.91 (0.070)

Page 9 of 23Available: www.ars.usda.gov/nea/bhnrc/fsrg.
DATA SOURCE: What We Eat in America, NHANES 2013-2014, day 1 food and supplement intake data, 2 years and over (excluding individuals pregnant, lactating, breast-fed, or with incomplete supplement data.).
See page 23 for footnotes.
What We Eat in America, NHANES 2013-2014
Table 37. Total Nutrient Intakes: Percent Reporting and Mean Amounts1 of Selected2 Vitamins and Minerals from Food and Beverages3 and Dietary Supplements4,by Gender and Age, in the United States, 2013-2014 (continued)
V i t a m i n C
──────────────── All Individuals 5 ──────────────── ────────────── Supplement Users 6 ────────────── ─ Non-users 7 ─
Genderand age
Percentreporting
supplementvitamin C 8
SampleSize Food Supplement
Food plussupplement
Samplesize Food Supplement
Food plussupplement Food
(years) % (SE) mg (SE) mg (SE) mg (SE) mg (SE) mg (SE) mg (SE) mg (SE)
Males and females:2 - 5.............. 32 (4.4) 664 78.0 (4.51) 22.9* (12.08) 100.9 (10.54) 184 75.0 (7.73) 72.1* (34.41) 147.0 (32.26) 79.4 (4.50)6 - 11.............. 20 (2.3) 1039 74.5 (1.70) 15.3 (3.98) 89.9 (4.99) 184 79.4 (5.01) 75.5 (18.86) 154.9 (19.68) 73.3 (2.32)
12 - 19.............. 13 (1.5) 1271 70.0 (3.18) 24.4 (5.08) 94.4 (5.90) 120 99.8 (11.31) 193.7 (34.68) 293.5 (38.33) 65.6 (3.24)
Males:20 - 39.............. 17 (2.0) 846 84.6 (4.40) 50.1 (13.84) 134.7 (15.18) 119 81.0 (7.41) 288.9 (56.48) 369.8 (53.80) 85.4 (5.33)40 - 59.............. 29 (2.3) 791 79.2 (3.20) 81.0 (16.13) 160.2 (16.82) 190 105.7 (11.16) 283.6 (58.00) 389.3 (58.99) 68.6 (3.01)60 and over...... 42 (2.2) 723 86.3 (4.84) 116.0 (21.40) 202.2 (20.09) 245 91.6 (6.08) 274.7 (44.28) 366.3 (44.01) 82.4 (5.63)
20 and over... 28 (1.7) 2360 83.1 (2.33) 77.8 (10.03) 160.9 (11.46) 554 94.4 (3.28) 281.5 (31.12) 375.9 (30.44) 78.7 (3.27)
Females:20 - 39.............. 21 (1.9) 791 72.2 (2.90) 27.8 (5.02) 100.0 (5.69) 148 87.5 (10.15) 134.9 (20.63) 222.3 (24.15) 68.2 (3.09)40 - 59.............. 28 (1.7) 899 73.4 (3.78) 67.3 (8.40) 140.6 (8.69) 214 84.5 (8.88) 242.7 (23.72) 327.2 (27.43) 69.1 (4.33)60 and over...... 46 (2.5) 780 78.3 (3.68) 138.6 (25.81) 216.9 (25.33) 309 87.8 (6.51) 304.1 (56.31) 391.9 (55.37) 70.3 (3.23)
20 and over... 31 (1.4) 2470 74.4 (2.27) 74.8 (9.49) 149.2 (9.91) 671 86.6 (4.86) 245.2 (27.32) 331.8 (27.73) 69.0 (2.77)
All Individuals:2 and over... 27 (1.1) 7804 77.3 (1.27) 62.7 (6.58) 140.0 (7.30) 1713 89.2 (2.34) 235.4 (21.67) 324.6 (22.28) 73.0 (1.71)
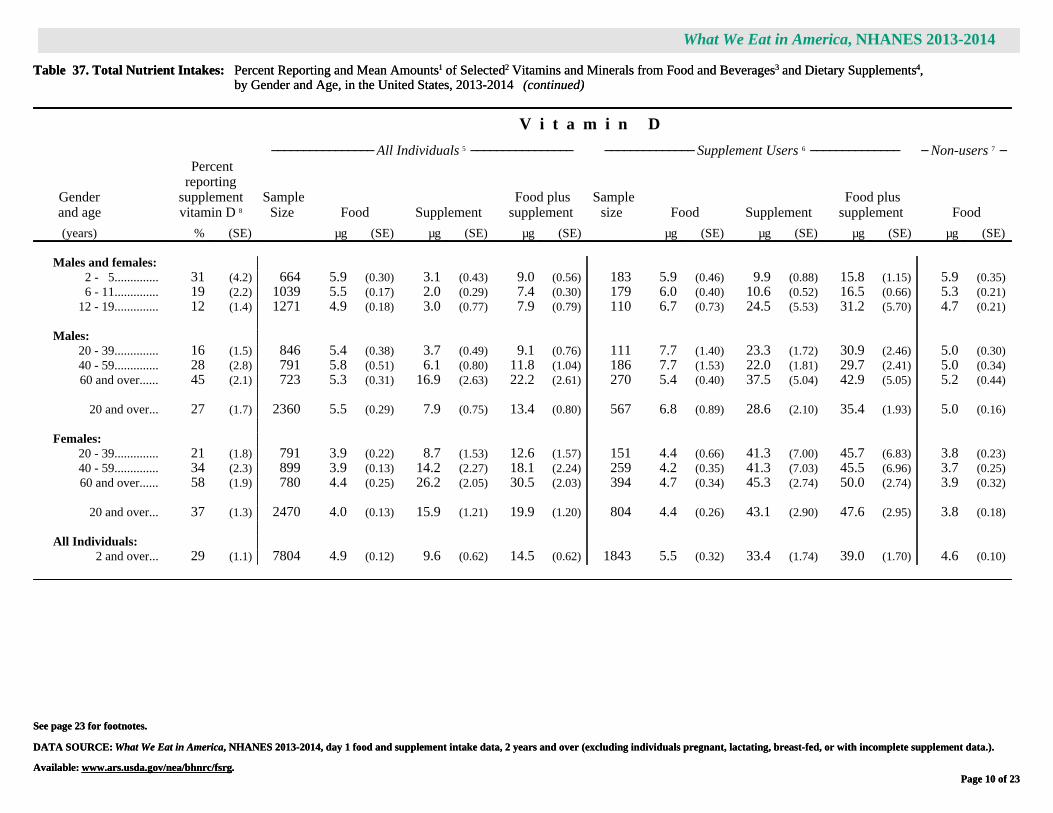
Page 10 of 23Available: www.ars.usda.gov/nea/bhnrc/fsrg.
DATA SOURCE: What We Eat in America, NHANES 2013-2014, day 1 food and supplement intake data, 2 years and over (excluding individuals pregnant, lactating, breast-fed, or with incomplete supplement data.).
See page 23 for footnotes.
What We Eat in America, NHANES 2013-2014
Table 37. Total Nutrient Intakes: Percent Reporting and Mean Amounts1 of Selected2 Vitamins and Minerals from Food and Beverages3 and Dietary Supplements4,by Gender and Age, in the United States, 2013-2014 (continued)
V i t a m i n D
──────────────── All Individuals 5 ──────────────── ────────────── Supplement Users 6 ────────────── ─ Non-users 7 ─
Genderand age
Percentreporting
supplementvitamin D 8
SampleSize Food Supplement
Food plussupplement
Samplesize Food Supplement
Food plussupplement Food
(years) % (SE) µg (SE) µg (SE) µg (SE) µg (SE) µg (SE) µg (SE) µg (SE)
Males and females:2 - 5.............. 31 (4.2) 664 5.9 (0.30) 3.1 (0.43) 9.0 (0.56) 183 5.9 (0.46) 9.9 (0.88) 15.8 (1.15) 5.9 (0.35)6 - 11.............. 19 (2.2) 1039 5.5 (0.17) 2.0 (0.29) 7.4 (0.30) 179 6.0 (0.40) 10.6 (0.52) 16.5 (0.66) 5.3 (0.21)
12 - 19.............. 12 (1.4) 1271 4.9 (0.18) 3.0 (0.77) 7.9 (0.79) 110 6.7 (0.73) 24.5 (5.53) 31.2 (5.70) 4.7 (0.21)
Males:20 - 39.............. 16 (1.5) 846 5.4 (0.38) 3.7 (0.49) 9.1 (0.76) 111 7.7 (1.40) 23.3 (1.72) 30.9 (2.46) 5.0 (0.30)40 - 59.............. 28 (2.8) 791 5.8 (0.51) 6.1 (0.80) 11.8 (1.04) 186 7.7 (1.53) 22.0 (1.81) 29.7 (2.41) 5.0 (0.34)60 and over...... 45 (2.1) 723 5.3 (0.31) 16.9 (2.63) 22.2 (2.61) 270 5.4 (0.40) 37.5 (5.04) 42.9 (5.05) 5.2 (0.44)
20 and over... 27 (1.7) 2360 5.5 (0.29) 7.9 (0.75) 13.4 (0.80) 567 6.8 (0.89) 28.6 (2.10) 35.4 (1.93) 5.0 (0.16)
Females:20 - 39.............. 21 (1.8) 791 3.9 (0.22) 8.7 (1.53) 12.6 (1.57) 151 4.4 (0.66) 41.3 (7.00) 45.7 (6.83) 3.8 (0.23)40 - 59.............. 34 (2.3) 899 3.9 (0.13) 14.2 (2.27) 18.1 (2.24) 259 4.2 (0.35) 41.3 (7.03) 45.5 (6.96) 3.7 (0.25)60 and over...... 58 (1.9) 780 4.4 (0.25) 26.2 (2.05) 30.5 (2.03) 394 4.7 (0.34) 45.3 (2.74) 50.0 (2.74) 3.9 (0.32)
20 and over... 37 (1.3) 2470 4.0 (0.13) 15.9 (1.21) 19.9 (1.20) 804 4.4 (0.26) 43.1 (2.90) 47.6 (2.95) 3.8 (0.18)
All Individuals:2 and over... 29 (1.1) 7804 4.9 (0.12) 9.6 (0.62) 14.5 (0.62) 1843 5.5 (0.32) 33.4 (1.74) 39.0 (1.70) 4.6 (0.10)

Page 11 of 23Available: www.ars.usda.gov/nea/bhnrc/fsrg.
DATA SOURCE: What We Eat in America, NHANES 2013-2014, day 1 food and supplement intake data, 2 years and over (excluding individuals pregnant, lactating, breast-fed, or with incomplete supplement data.).
See page 23 for footnotes.
What We Eat in America, NHANES 2013-2014
Table 37. Total Nutrient Intakes: Percent Reporting and Mean Amounts1 of Selected2 Vitamins and Minerals from Food and Beverages3 and Dietary Supplements4,by Gender and Age, in the United States, 2013-2014 (continued)
V i t a m i n K
──────────────── All Individuals 5 ──────────────── ────────────── Supplement Users 6 ────────────── ─ Non-users 7 ─
Genderand age
Percentreporting
supplementvitamin K 8
SampleSize Food Supplement
Food plussupplement
Samplesize Food Supplement
Food plussupplement Food
(years) % (SE) µg (SE) µg (SE) µg (SE) µg (SE) µg (SE) µg (SE) µg (SE)
Males and females:2 - 5.............. 1* (1.0) 664 49.7 (2.19) 0.4* (0.28) 50.1 (2.07) -- -- -- 49.7 (2.23)6 - 11.............. # 1039 73.4 (5.59) 0.1* (0.04) 73.5 (5.58) -- -- -- 73.5 (5.61)
12 - 19.............. 5 (0.7) 1271 81.2 (5.63) 1.5 (0.25) 82.8 (5.66) -- -- -- 81.3 (5.56)
Males:20 - 39.............. 11 (1.3) 846 121.5 (8.59) 4.5 (0.67) 126.0 (8.63) 81 145.7 (29.20) 38.9 (3.14) 184.6 (30.47) 118.4 (7.31)40 - 59.............. 23 (2.8) 791 123.4 (8.62) 7.9 (1.03) 131.3 (8.94) 144 166.8 (19.89) 34.9 (2.65) 201.7 (20.98) 110.7 (6.52)60 and over...... 33 (1.7) 723 116.4 (7.97) 11.4 (1.75) 127.9 (8.02) 180 113.8 (10.04) 34.7 (4.28) 148.5 (11.23) 117.7 (10.29)
20 and over... 21 (1.5) 2360 120.9 (5.31) 7.5 (0.74) 128.4 (5.25) 405 141.6 (9.83) 35.6 (1.62) 177.2 (9.71) 115.5 (5.25)
Females:20 - 39.............. 12 (1.6) 791 118.8 (10.99) 5.9 (1.56) 124.6 (11.38) 81 193.8* (73.08) 47.7 (9.42) 241.5* (76.04) 108.2 (7.64)40 - 59.............. 18 (1.5) 899 131.5 (9.82) 27.6* (20.91) 159.1 (24.43) 128 162.4 (20.33) 152.0*(106.39) 314.4*(119.91) 124.7 (11.15)60 and over...... 32 (2.4) 780 119.7 (5.04) 13.2 (1.57) 132.9 (4.79) 216 131.5 (12.40) 41.0 (5.08) 172.5 (12.58) 114.2 (6.69)
20 and over... 20 (1.2) 2470 124.0 (5.24) 16.3* (7.96) 140.3 (10.05) 425 154.6 (17.83) 80.5* (37.66) 235.1 (45.87) 116.2 (5.64)
All Individuals:2 and over... 16 (0.9) 7804 110.0 (2.83) 9.2* (3.22) 119.2 (3.91) 884 145.2 (8.72) 56.9* (17.94) 202.0 (20.23) 103.3 (3.43)

Page 12 of 23Available: www.ars.usda.gov/nea/bhnrc/fsrg.
DATA SOURCE: What We Eat in America, NHANES 2013-2014, day 1 food and supplement intake data, 2 years and over (excluding individuals pregnant, lactating, breast-fed, or with incomplete supplement data.).
See page 23 for footnotes.
What We Eat in America, NHANES 2013-2014
Table 37. Total Nutrient Intakes: Percent Reporting and Mean Amounts1 of Selected2 Vitamins and Minerals from Food and Beverages3 and Dietary Supplements4,by Gender and Age, in the United States, 2013-2014 (continued)
L y c o p e n e
──────────────── All Individuals 5 ──────────────── ────────────── Supplement Users 6 ────────────── ─ Non-users 7 ─
Genderand age
Percentreporting
supplementlycopene 8
SampleSize Food Supplement
Food plussupplement
Samplesize Food Supplement
Food plussupplement Food
(years) % (SE) µg (SE) µg (SE) µg (SE) µg (SE) µg (SE) µg (SE) µg (SE)
Males and females:2 - 5.............. # 664 3002 (324.7) 1* (0.9) 3003 (325.0) -- -- -- 3005 (324.6)6 - 11.............. # 1039 4082 (269.2) # 4082 (269.2) -- -- -- 4079 (269.7)
12 - 19.............. 2 (0.5) 1271 4678 (265.1) 9* (3.2) 4687 (265.3) -- -- -- 4687 (273.1)
Males:20 - 39.............. 8 (1.3) 846 5702 (306.4) 40 (8.0) 5742 (305.1) -- -- -- 5741 (339.3)40 - 59.............. 17 (2.5) 791 5452 (470.0) 100 (15.2) 5553 (474.1) 109 4138 (767.9) 578 (102.8) 4716 (777.6) 5728 (535.6)60 and over...... 25 (2.3) 723 6349 (530.1) 149 (38.0) 6498 (525.7) 136 6171 (1028.7) 607 (148.2) 6778 (1026.0) 6407 (719.1)
20 and over... 15 (1.4) 2360 5772 (293.1) 89 (10.5) 5861 (295.3) 297 5151 (399.0) 581 (72.8) 5732 (385.6) 5885 (339.2)
Females:20 - 39.............. 1* (0.5) 791 4335 (294.2) 18* (6.9) 4353 (293.1) -- -- -- 4338 (299.1)40 - 59.............. 4 (1.1) 899 4323 (142.6) 22* (7.2) 4345 (142.2) -- -- -- 4219 (154.0)60 and over...... 13 (1.3) 780 4077 (395.4) 53 (6.1) 4130 (394.3) 88 4340 (919.2) 400 (48.6) 4740 (937.2) 4036 (420.6)
20 and over... 6 (0.7) 2470 4256 (174.8) 30 (2.7) 4286 (174.8) 128 4975 (658.9) 516 (46.2) 5490 (657.9) 4212 (188.2)
All Individuals:2 and over... 8 (0.7) 7804 4794 (117.6) 46 (4.4) 4840 (118.3) 444 5076 (328.3) 559 (52.2) 5636 (334.5) 4769 (134.2)

Page 13 of 23Available: www.ars.usda.gov/nea/bhnrc/fsrg.
DATA SOURCE: What We Eat in America, NHANES 2013-2014, day 1 food and supplement intake data, 2 years and over (excluding individuals pregnant, lactating, breast-fed, or with incomplete supplement data.).
See page 23 for footnotes.
What We Eat in America, NHANES 2013-2014
Table 37. Total Nutrient Intakes: Percent Reporting and Mean Amounts1 of Selected2 Vitamins and Minerals from Food and Beverages3 and Dietary Supplements4,by Gender and Age, in the United States, 2013-2014 (continued)
L u t e i n + z e a x a n t h i n
──────────────── All Individuals 5 ──────────────── ────────────── Supplement Users 6 ────────────── ─ Non-users 7 ─
Genderand age
Percentreporting
supplementlutein +
zeaxanthin 8
SampleSize Food Supplement
Food plussupplement
Samplesize Food Supplement
Food plussupplement Food
(years) % (SE) µg (SE) µg (SE) µg (SE) µg (SE) µg (SE) µg (SE) µg (SE)
Males and females:2 - 5.............. # 664 594 (30.2) 2* (1.7) 596 (29.4) -- -- -- 594 (30.1)6 - 11.............. # 1039 914 (119.7) 1* (0.4) 915 (119.7) -- -- -- 914 (120.0)
12 - 19.............. 2 (0.5) 1271 956 (81.4) 8* (3.8) 964 (83.5) -- -- -- 950 (83.5)
Males:20 - 39.............. 3 (1.0) 846 1567 (183.8) 44* (19.1) 1611 (188.4) -- -- -- 1559 (187.7)40 - 59.............. 12 (1.4) 791 1613 (149.8) 76 (22.4) 1689 (162.5) 75 3318 (789.3) 653 (177.7) 3970 (911.2) 1390 (100.2)60 and over...... 21 (2.3) 723 1505 (163.4) 221 (49.9) 1725 (174.7) 120 1728 (377.3) 1050 (207.4) 2778 (490.3) 1445 (174.6)
20 and over... 11 (1.0) 2360 1568 (106.7) 100 (16.8) 1668 (108.3) 225 2361 (166.9) 925 (115.3) 3286 (218.0) 1473 (111.8)
Females:20 - 39.............. 3 (0.9) 791 1711 (273.4) 27* (13.7) 1739 (272.0) -- -- -- 1687 (280.0)40 - 59.............. 7 (1.4) 899 1870 (199.9) 86* (30.1) 1956 (194.9) -- -- -- 1845 (214.6)60 and over...... 23 (1.6) 780 1627 (87.1) 186 (24.4) 1813 (92.1) 147 1556 (224.4) 825 (98.0) 2382 (245.5) 1648 (94.5)
20 and over... 10 (1.0) 2470 1748 (115.6) 95 (12.9) 1844 (108.6) 218 1822 (179.3) 951 (139.6) 2774 (232.1) 1740 (131.2)
All Individuals:2 and over... 8 (0.6) 7804 1464 (57.3) 75 (8.1) 1538 (56.5) 462 2076 (115.3) 925 (79.2) 3002 (141.6) 1410 (65.0)

Page 14 of 23Available: www.ars.usda.gov/nea/bhnrc/fsrg.
DATA SOURCE: What We Eat in America, NHANES 2013-2014, day 1 food and supplement intake data, 2 years and over (excluding individuals pregnant, lactating, breast-fed, or with incomplete supplement data.).
See page 23 for footnotes.
What We Eat in America, NHANES 2013-2014
Table 37. Total Nutrient Intakes: Percent Reporting and Mean Amounts1 of Selected2 Vitamins and Minerals from Food and Beverages3 and Dietary Supplements4,by Gender and Age, in the United States, 2013-2014 (continued)
C a l c i u m
──────────────── All Individuals 5 ──────────────── ────────────── Supplement Users 6 ────────────── ─ Non-users 7 ─
Genderand age
Percentreporting
supplementcalcium 8
SampleSize Food Supplement
Food plussupplement
Samplesize Food Supplement
Food plussupplement Food
(years) % (SE) mg (SE) mg (SE) mg (SE) mg (SE) mg (SE) mg (SE) mg (SE)
Males and females:2 - 5.............. 9 (1.8) 664 931 (33.0) 12 (3.0) 943 (33.5) -- -- -- 931 (35.3)6 - 11.............. 6 (1.0) 1039 1074 (29.8) 8 (1.8) 1082 (30.7) 73 1070 (58.6) 125 (21.0) 1194 (63.3) 1074 (31.3)
12 - 19.............. 9 (1.2) 1271 1021 (23.8) 24 (3.9) 1045 (22.7) 85 1274 (94.5) 279 (28.2) 1553 (80.7) 997 (27.2)
Males:20 - 39.............. 17 (2.0) 846 1193 (39.2) 49 (7.3) 1241 (41.8) 117 1495 (80.0) 286 (21.1) 1781 (90.1) 1131 (41.4)40 - 59.............. 28 (2.9) 791 1053 (25.6) 90 (12.0) 1142 (25.8) 180 1178 (54.7) 316 (30.1) 1494 (50.0) 1003 (22.5)60 and over...... 46 (3.1) 723 977 (28.4) 174 (17.1) 1150 (31.7) 262 1034 (47.8) 378 (17.2) 1412 (48.1) 928 (35.0)
20 and over... 28 (2.1) 2360 1088 (18.4) 95 (8.0) 1182 (22.8) 559 1193 (32.8) 334 (13.9) 1527 (32.9) 1046 (17.1)
Females:20 - 39.............. 20 (2.3) 791 876 (21.4) 79 (11.2) 955 (22.7) 139 896 (31.6) 398 (29.5) 1294 (48.8) 871 (28.9)40 - 59.............. 34 (2.4) 899 846 (19.9) 216 (23.9) 1062 (28.5) 252 880 (41.4) 632 (36.7) 1512 (47.4) 828 (23.6)60 and over...... 53 (2.5) 780 818 (29.5) 358 (24.8) 1175 (44.0) 368 888 (37.3) 680 (25.1) 1568 (46.1) 739 (26.0)
20 and over... 35 (1.6) 2470 847 (12.8) 212 (14.2) 1059 (20.6) 759 886 (16.8) 609 (24.4) 1495 (25.0) 827 (16.5)
All Individuals:2 and over... 26 (1.0) 7804 980 (11.9) 120 (6.3) 1100 (15.7) 1526 1032 (19.0) 465 (12.7) 1497 (24.5) 962 (12.7)

Page 15 of 23Available: www.ars.usda.gov/nea/bhnrc/fsrg.
DATA SOURCE: What We Eat in America, NHANES 2013-2014, day 1 food and supplement intake data, 2 years and over (excluding individuals pregnant, lactating, breast-fed, or with incomplete supplement data.).
See page 23 for footnotes.
What We Eat in America, NHANES 2013-2014
Table 37. Total Nutrient Intakes: Percent Reporting and Mean Amounts1 of Selected2 Vitamins and Minerals from Food and Beverages3 and Dietary Supplements4,by Gender and Age, in the United States, 2013-2014 (continued)
P h o s p h o r u s
──────────────── All Individuals 5 ──────────────── ────────────── Supplement Users 6 ────────────── ─ Non-users 7 ─
Genderand age
Percentreporting
supplementphosphorus 8
SampleSize Food Supplement
Food plussupplement
Samplesize Food Supplement
Food plussupplement Food
(years) % (SE) mg (SE) mg (SE) mg (SE) mg (SE) mg (SE) mg (SE) mg (SE)
Males and females:2 - 5.............. 2* (0.8) 664 1053 (32.3) 1* (0.6) 1054 (32.3) -- -- -- 1054 (34.5)6 - 11.............. 1* (0.5) 1039 1289 (21.2) 1* (0.5) 1291 (21.5) -- -- -- 1289 (21.8)
12 - 19.............. 3 (0.8) 1271 1356 (23.2) 3* (1.3) 1359 (22.6) -- -- -- 1348 (26.4)
Males:20 - 39.............. 4 (0.8) 846 1754 (37.5) 2 (0.5) 1755 (37.6) -- -- -- 1747 (38.7)40 - 59.............. 14 (2.0) 791 1633 (34.5) 6 (0.8) 1639 (34.1) 91 1878 (149.2) 40 (4.8) 1918 (147.1) 1592 (32.3)60 and over...... 27 (1.8) 723 1416 (22.1) 15 (2.7) 1431 (23.5) 146 1510 (59.9) 54 (8.7) 1563 (67.2) 1381 (30.5)
20 and over... 14 (1.1) 2360 1625 (18.6) 6 (0.9) 1632 (18.8) 271 1697 (56.6) 47 (5.1) 1744 (56.3) 1614 (21.0)
Females:20 - 39.............. 4 (1.1) 791 1215 (20.9) 1 (0.3) 1216 (21.0) -- -- -- 1204 (22.4)40 - 59.............. 11 (1.1) 899 1191 (16.5) 6 (1.3) 1197 (17.0) 77 1228 (74.8) 53 (9.1) 1281 (78.4) 1187 (14.2)60 and over...... 24 (2.2) 780 1125 (29.3) 12 (1.6) 1137 (29.7) 171 1225 (59.3) 52 (5.3) 1277 (62.4) 1094 (26.8)
20 and over... 12 (0.9) 2470 1180 (13.8) 6 (0.6) 1186 (13.9) 282 1251 (44.7) 49 (4.0) 1301 (45.8) 1170 (13.2)
All Individuals:2 and over... 10 (0.7) 7804 1369 (10.9) 5 (0.4) 1375 (10.9) 612 1482 (36.2) 51 (3.0) 1533 (36.2) 1356 (12.4)
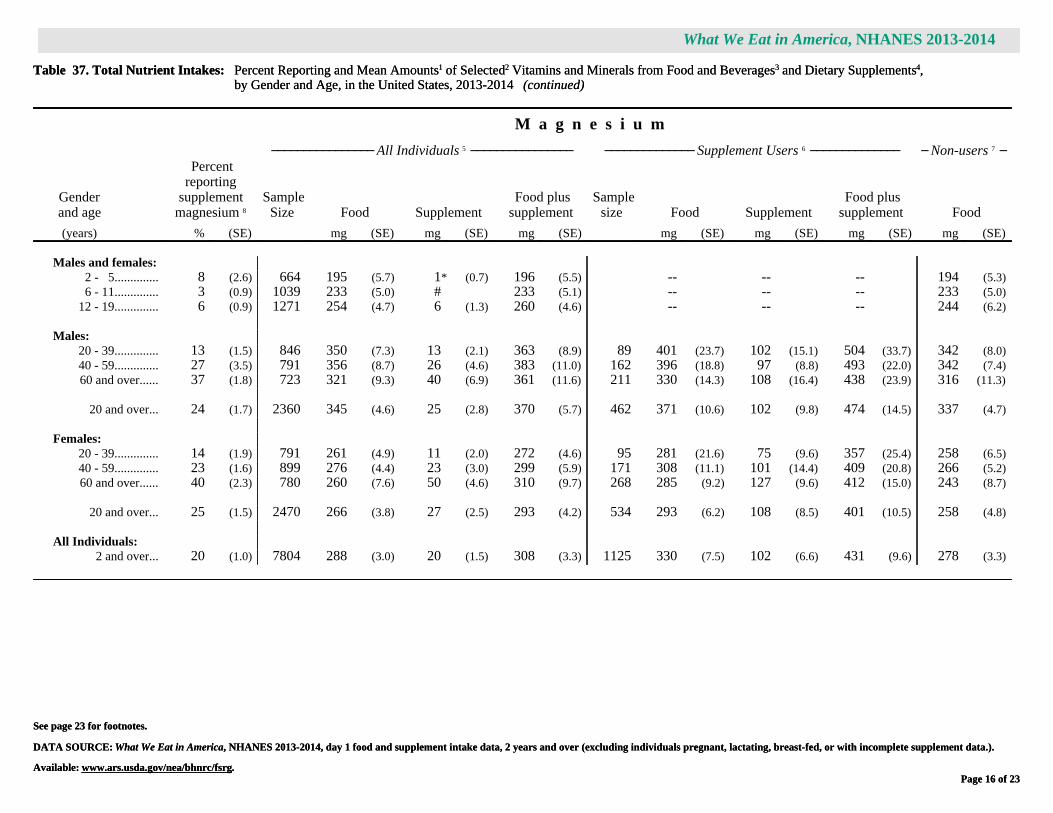
Page 16 of 23Available: www.ars.usda.gov/nea/bhnrc/fsrg.
DATA SOURCE: What We Eat in America, NHANES 2013-2014, day 1 food and supplement intake data, 2 years and over (excluding individuals pregnant, lactating, breast-fed, or with incomplete supplement data.).
See page 23 for footnotes.
What We Eat in America, NHANES 2013-2014
Table 37. Total Nutrient Intakes: Percent Reporting and Mean Amounts1 of Selected2 Vitamins and Minerals from Food and Beverages3 and Dietary Supplements4,by Gender and Age, in the United States, 2013-2014 (continued)
M a g n e s i u m
──────────────── All Individuals 5 ──────────────── ────────────── Supplement Users 6 ────────────── ─ Non-users 7 ─
Genderand age
Percentreporting
supplementmagnesium 8
SampleSize Food Supplement
Food plussupplement
Samplesize Food Supplement
Food plussupplement Food
(years) % (SE) mg (SE) mg (SE) mg (SE) mg (SE) mg (SE) mg (SE) mg (SE)
Males and females:2 - 5.............. 8 (2.6) 664 195 (5.7) 1* (0.7) 196 (5.5) -- -- -- 194 (5.3)6 - 11.............. 3 (0.9) 1039 233 (5.0) # 233 (5.1) -- -- -- 233 (5.0)
12 - 19.............. 6 (0.9) 1271 254 (4.7) 6 (1.3) 260 (4.6) -- -- -- 244 (6.2)
Males:20 - 39.............. 13 (1.5) 846 350 (7.3) 13 (2.1) 363 (8.9) 89 401 (23.7) 102 (15.1) 504 (33.7) 342 (8.0)40 - 59.............. 27 (3.5) 791 356 (8.7) 26 (4.6) 383 (11.0) 162 396 (18.8) 97 (8.8) 493 (22.0) 342 (7.4)60 and over...... 37 (1.8) 723 321 (9.3) 40 (6.9) 361 (11.6) 211 330 (14.3) 108 (16.4) 438 (23.9) 316 (11.3)
20 and over... 24 (1.7) 2360 345 (4.6) 25 (2.8) 370 (5.7) 462 371 (10.6) 102 (9.8) 474 (14.5) 337 (4.7)
Females:20 - 39.............. 14 (1.9) 791 261 (4.9) 11 (2.0) 272 (4.6) 95 281 (21.6) 75 (9.6) 357 (25.4) 258 (6.5)40 - 59.............. 23 (1.6) 899 276 (4.4) 23 (3.0) 299 (5.9) 171 308 (11.1) 101 (14.4) 409 (20.8) 266 (5.2)60 and over...... 40 (2.3) 780 260 (7.6) 50 (4.6) 310 (9.7) 268 285 (9.2) 127 (9.6) 412 (15.0) 243 (8.7)
20 and over... 25 (1.5) 2470 266 (3.8) 27 (2.5) 293 (4.2) 534 293 (6.2) 108 (8.5) 401 (10.5) 258 (4.8)
All Individuals:2 and over... 20 (1.0) 7804 288 (3.0) 20 (1.5) 308 (3.3) 1125 330 (7.5) 102 (6.6) 431 (9.6) 278 (3.3)

Page 17 of 23Available: www.ars.usda.gov/nea/bhnrc/fsrg.
DATA SOURCE: What We Eat in America, NHANES 2013-2014, day 1 food and supplement intake data, 2 years and over (excluding individuals pregnant, lactating, breast-fed, or with incomplete supplement data.).
See page 23 for footnotes.
What We Eat in America, NHANES 2013-2014
Table 37. Total Nutrient Intakes: Percent Reporting and Mean Amounts1 of Selected2 Vitamins and Minerals from Food and Beverages3 and Dietary Supplements4,by Gender and Age, in the United States, 2013-2014 (continued)
I r o n
──────────────── All Individuals 5 ──────────────── ────────────── Supplement Users 6 ────────────── ─ Non-users 7 ─
Genderand age
Percentreporting
supplementiron 8
SampleSize Food Supplement
Food plussupplement
Samplesize Food Supplement
Food plussupplement Food
(years) % (SE) mg (SE) mg (SE) mg (SE) mg (SE) mg (SE) mg (SE) mg (SE)
Males and females:2 - 5.............. 6 (0.8) 664 11.4 (0.35) 0.9 (0.22) 12.3 (0.40) -- -- -- 11.4 (0.38)6 - 11.............. 4 (0.8) 1039 14.3 (0.28) 0.6 (0.12) 14.8 (0.33) -- -- -- 14.3 (0.30)
12 - 19.............. 5 (0.6) 1271 14.8 (0.29) 1.1 (0.30) 15.9 (0.41) -- -- -- 14.5 (0.32)
Males:20 - 39.............. 5 (1.0) 846 17.2 (0.36) 0.7 (0.15) 17.9 (0.44) -- -- -- 17.1 (0.39)40 - 59.............. 12 (1.5) 791 16.5 (0.43) 2.2 (0.46) 18.7 (0.46) 66 17.8 (1.19) 18.8 (3.31) 36.6 (3.75) 16.4 (0.49)60 and over...... 16 (2.1) 723 16.0 (0.54) 4.4 (0.70) 20.3 (0.82) 97 19.0 (2.56) 27.2 (3.60) 46.2 (3.86) 15.4 (0.55)
20 and over... 10 (1.1) 2360 16.7 (0.22) 2.2 (0.31) 18.8 (0.33) 202 18.6 (0.95) 20.8 (2.20) 39.4 (2.21) 16.4 (0.22)
Females:20 - 39.............. 16 (2.0) 791 12.4 (0.26) 3.8 (0.62) 16.3 (0.67) 113 12.9 (0.76) 24.3 (2.74) 37.2 (2.45) 12.4 (0.32)40 - 59.............. 18 (1.6) 899 12.7 (0.43) 3.6 (0.47) 16.3 (0.63) 131 12.2 (0.91) 19.9 (2.21) 32.2 (2.39) 12.8 (0.53)60 and over...... 24 (2.5) 780 12.2 (0.28) 5.9 (0.90) 18.1 (0.84) 161 12.8 (0.43) 25.0 (2.84) 37.8 (2.87) 12.0 (0.33)
20 and over... 19 (1.1) 2470 12.5 (0.17) 4.3 (0.36) 16.8 (0.41) 405 12.6 (0.34) 22.9 (1.47) 35.6 (1.44) 12.5 (0.19)
All Individuals:2 and over... 12 (0.7) 7804 14.4 (0.15) 2.7 (0.19) 17.1 (0.22) 749 14.8 (0.41) 21.9 (0.90) 36.8 (0.85) 14.3 (0.15)

Page 18 of 23Available: www.ars.usda.gov/nea/bhnrc/fsrg.
DATA SOURCE: What We Eat in America, NHANES 2013-2014, day 1 food and supplement intake data, 2 years and over (excluding individuals pregnant, lactating, breast-fed, or with incomplete supplement data.).
See page 23 for footnotes.
What We Eat in America, NHANES 2013-2014
Table 37. Total Nutrient Intakes: Percent Reporting and Mean Amounts1 of Selected2 Vitamins and Minerals from Food and Beverages3 and Dietary Supplements4,by Gender and Age, in the United States, 2013-2014 (continued)
Z i n c
──────────────── All Individuals 5 ──────────────── ────────────── Supplement Users 6 ────────────── ─ Non-users 7 ─
Genderand age
Percentreporting
supplementzinc 8
SampleSize Food Supplement
Food plussupplement
Samplesize Food Supplement
Food plussupplement Food
(years) % (SE) mg (SE) mg (SE) mg (SE) mg (SE) mg (SE) mg (SE) mg (SE)
Males and females:2 - 5.............. 28 (3.7) 664 8.0 (0.15) 1.0 (0.13) 9.0 (0.18) 163 7.6 (0.22) 3.6 (0.52) 11.2 (0.54) 8.1 (0.16)6 - 11.............. 16 (2.1) 1039 9.9 (0.23) 0.6 (0.10) 10.5 (0.27) 161 9.8 (0.23) 4.0 (0.41) 13.8 (0.54) 9.9 (0.25)
12 - 19.............. 10 (1.2) 1271 11.2 (0.28) 1.0 (0.18) 12.2 (0.39) 88 17.4 (3.53) 10.1 (1.06) 27.5 (4.21) 10.5 (0.33)
Males:20 - 39.............. 14 (1.7) 846 14.3 (0.29) 1.9 (0.24) 16.2 (0.42) 93 15.7 (0.76) 14.1 (0.54) 29.8 (1.11) 14.1 (0.34)40 - 59.............. 28 (3.1) 791 12.9 (0.31) 4.8 (0.72) 17.7 (0.64) 168 13.1 (0.63) 17.4 (1.57) 30.5 (1.61) 12.8 (0.28)60 and over...... 38 (2.2) 723 11.8 (0.27) 6.8 (0.80) 18.7 (0.92) 213 12.2 (0.64) 18.2 (1.63) 30.4 (1.92) 11.6 (0.35)
20 and over... 25 (1.8) 2360 13.2 (0.15) 4.2 (0.39) 17.4 (0.40) 474 13.3 (0.39) 17.0 (0.89) 30.3 (1.05) 13.1 (0.13)
Females:20 - 39.............. 17 (2.0) 791 9.5 (0.24) 2.4 (0.32) 11.9 (0.37) 121 9.4 (0.50) 13.8 (0.72) 23.3 (0.62) 9.5 (0.29)40 - 59.............. 22 (1.7) 899 9.2 (0.18) 3.1 (0.23) 12.3 (0.36) 172 9.1 (0.34) 14.4 (0.93) 23.6 (1.00) 9.2 (0.21)60 and over...... 41 (2.6) 780 9.0 (0.27) 7.2 (0.47) 16.1 (0.55) 273 9.5 (0.42) 17.6 (0.72) 27.1 (0.80) 8.5 (0.29)
20 and over... 26 (1.4) 2470 9.2 (0.12) 4.0 (0.23) 13.3 (0.29) 566 9.4 (0.24) 15.7 (0.52) 25.1 (0.55) 9.2 (0.15)
All Individuals:2 and over... 23 (1.1) 7804 10.9 (0.10) 3.3 (0.17) 14.2 (0.21) 1452 11.3 (0.31) 14.5 (0.50) 25.8 (0.63) 10.8 (0.12)

Page 19 of 23Available: www.ars.usda.gov/nea/bhnrc/fsrg.
DATA SOURCE: What We Eat in America, NHANES 2013-2014, day 1 food and supplement intake data, 2 years and over (excluding individuals pregnant, lactating, breast-fed, or with incomplete supplement data.).
See page 23 for footnotes.
What We Eat in America, NHANES 2013-2014
Table 37. Total Nutrient Intakes: Percent Reporting and Mean Amounts1 of Selected2 Vitamins and Minerals from Food and Beverages3 and Dietary Supplements4,by Gender and Age, in the United States, 2013-2014 (continued)
C o p p e r
──────────────── All Individuals 5 ──────────────── ────────────── Supplement Users 6 ────────────── ─ Non-users 7 ─
Genderand age
Percentreporting
supplementcopper 8
SampleSize Food Supplement
Food plussupplement
Samplesize Food Supplement
Food plussupplement Food
(years) % (SE) mg (SE) mg (SE) mg (SE) mg (SE) mg (SE) mg (SE) mg (SE)
Males and females:2 - 5.............. 6 (1.2) 664 0.8 (0.02) 0.1 (0.02) 0.9 (0.04) -- -- -- 0.7 (0.02)6 - 11.............. 4 (0.8) 1039 0.9 (0.03) 0.1 (0.01) 1.0 (0.03) -- -- -- 0.9 (0.02)
12 - 19.............. 6 (0.8) 1271 1.0 (0.02) 0.1 (0.03) 1.1 (0.04) -- -- -- 1.0 (0.03)
Males:20 - 39.............. 13 (1.6) 846 1.4 (0.03) 0.2 (0.03) 1.6 (0.04) 86 1.5 (0.07) 1.6 (0.08) 3.1 (0.13) 1.4 (0.04)40 - 59.............. 25 (3.0) 791 1.4 (0.04) 0.3 (0.05) 1.8 (0.07) 155 1.6 (0.08) 1.3 (0.08) 2.9 (0.14) 1.4 (0.04)60 and over...... 36 (2.1) 723 1.3 (0.02) 0.4 (0.04) 1.7 (0.05) 201 1.4 (0.09) 1.1 (0.07) 2.5 (0.12) 1.3 (0.05)
20 and over... 23 (1.6) 2360 1.4 (0.02) 0.3 (0.03) 1.7 (0.03) 442 1.5 (0.06) 1.3 (0.05) 2.8 (0.09) 1.4 (0.02)
Females:20 - 39.............. 13 (1.7) 791 1.1 (0.02) 0.2 (0.03) 1.3 (0.03) 88 1.1 (0.09) 1.6 (0.10) 2.7 (0.14) 1.1 (0.03)40 - 59.............. 19 (1.7) 899 1.1 (0.03) 0.3 (0.02) 1.4 (0.04) 147 1.2 (0.06) 1.4 (0.10) 2.6 (0.11) 1.1 (0.02)60 and over...... 38 (2.6) 780 1.1 (0.04) 0.4 (0.04) 1.5 (0.06) 255 1.2 (0.06) 1.2 (0.05) 2.3 (0.08) 1.1 (0.04)
20 and over... 23 (1.4) 2470 1.1 (0.02) 0.3 (0.02) 1.4 (0.03) 490 1.2 (0.04) 1.3 (0.04) 2.5 (0.05) 1.1 (0.02)
All Individuals:2 and over... 18 (1.0) 7804 1.2 (0.01) 0.2 (0.01) 1.4 (0.02) 1069 1.3 (0.04) 1.3 (0.03) 2.7 (0.06) 1.1 (0.01)

Page 20 of 23Available: www.ars.usda.gov/nea/bhnrc/fsrg.
DATA SOURCE: What We Eat in America, NHANES 2013-2014, day 1 food and supplement intake data, 2 years and over (excluding individuals pregnant, lactating, breast-fed, or with incomplete supplement data.).
See page 23 for footnotes.
What We Eat in America, NHANES 2013-2014
Table 37. Total Nutrient Intakes: Percent Reporting and Mean Amounts1 of Selected2 Vitamins and Minerals from Food and Beverages3 and Dietary Supplements4,by Gender and Age, in the United States, 2013-2014 (continued)
S o d i u m
──────────────── All Individuals 5 ──────────────── ────────────── Supplement Users 6 ────────────── ─ Non-users 7 ─
Genderand age
Percentreporting
supplementsodium 8
SampleSize Food Supplement
Food plussupplement
Samplesize Food Supplement
Food plussupplement Food
(years) % (SE) mg (SE) mg (SE) mg (SE) mg (SE) mg (SE) mg (SE) mg (SE)
Males and females:2 - 5.............. 11 (2.0) 664 2238 (57.1) 1 (0.2) 2238 (57.1) 62 2260 (99.3) 9 (0.8) 2269 (99.0) 2235 (64.5)6 - 11.............. 5 (1.0) 1039 2991 (53.5) 1 (0.1) 2992 (53.6) 68 2739 (187.1) 11 (1.0) 2750 (187.0) 3005 (56.7)
12 - 19.............. 2 (0.6) 1271 3419 (65.2) 1* (0.2) 3419 (65.2) -- -- -- 3408 (61.0)
Males:20 - 39.............. 4 (0.7) 846 4372 (75.5) 2* (0.5) 4373 (75.5) -- -- -- 4343 (81.2)40 - 59.............. 5 (1.3) 791 4167 (94.8) 2* (1.1) 4169 (94.4) -- -- -- 4171 (98.5)60 and over...... 10 (2.5) 723 3580 (75.9) 4 (1.0) 3584 (76.1) -- -- -- 3628 (107.6)
20 and over... 6 (0.9) 2360 4099 (55.8) 2 (0.6) 4101 (55.8) 106 3936 (207.3) 40 (5.3) 3976 (204.6) 4109 (63.2)
Females:20 - 39.............. 3 (1.0) 791 3184 (47.9) 1* (0.2) 3184 (47.9) -- -- -- 3192 (47.4)40 - 59.............. 10 (1.2) 899 2962 (44.1) 2 (0.5) 2964 (44.3) -- -- -- 2946 (36.7)60 and over...... 10 (1.2) 780 2753 (64.1) 3 (0.8) 2757 (64.1) 69 2968 (162.7) 34 (6.4) 3003 (164.3) 2729 (60.6)
20 and over... 8 (0.7) 2470 2975 (22.7) 2 (0.3) 2977 (22.7) 148 3031 (114.8) 28 (2.8) 3059 (113.9) 2970 (25.9)
All Individuals:2 and over... 6 (0.5) 7804 3411 (28.0) 2 (0.3) 3412 (28.0) 410 3290 (80.3) 29 (3.3) 3319 (79.3) 3419 (29.0)

Page 21 of 23Available: www.ars.usda.gov/nea/bhnrc/fsrg.
DATA SOURCE: What We Eat in America, NHANES 2013-2014, day 1 food and supplement intake data, 2 years and over (excluding individuals pregnant, lactating, breast-fed, or with incomplete supplement data.).
See page 23 for footnotes.
What We Eat in America, NHANES 2013-2014
Table 37. Total Nutrient Intakes: Percent Reporting and Mean Amounts1 of Selected2 Vitamins and Minerals from Food and Beverages3 and Dietary Supplements4,by Gender and Age, in the United States, 2013-2014 (continued)
P o t a s s i u m
──────────────── All Individuals 5 ──────────────── ────────────── Supplement Users 6 ────────────── ─ Non-users 7 ─
Genderand age
Percentreporting
supplementpotassium 8
SampleSize Food Supplement
Food plussupplement
Samplesize Food Supplement
Food plussupplement Food
(years) % (SE) mg (SE) mg (SE) mg (SE) mg (SE) mg (SE) mg (SE) mg (SE)
Males and females:2 - 5.............. 1* (0.9) 664 1908 (70.7) # 1908 (70.7) -- -- -- 1891 (64.5)6 - 11.............. 1* (0.7) 1039 2157 (36.8) # 2157 (36.8) -- -- -- 2152 (36.1)
12 - 19.............. 2 (0.6) 1271 2276 (44.3) 2 (0.5) 2278 (44.2) -- -- -- 2247 (53.9)
Males:20 - 39.............. 7 (1.2) 846 2997 (51.5) 6 (1.1) 3003 (51.7) -- -- -- 2971 (59.4)40 - 59.............. 19 (2.4) 791 3111 (60.6) 17 (3.0) 3128 (60.5) 116 3565 (207.1) 89 (10.2) 3654 (207.2) 3003 (51.2)60 and over...... 28 (2.0) 723 2892 (50.2) 26 (2.7) 2918 (51.8) 159 3061 (78.5) 92 (6.5) 3152 (82.9) 2826 (60.4)
20 and over... 17 (1.3) 2360 3012 (35.4) 15 (1.8) 3027 (36.4) 324 3315 (111.1) 90 (6.2) 3404 (111.7) 2952 (41.2)
Females:20 - 39.............. 6 (1.3) 791 2223 (53.1) 4 (0.9) 2227 (52.9) -- -- -- 2200 (56.1)40 - 59.............. 13 (1.4) 899 2389 (42.3) 10 (1.0) 2399 (42.2) 79 2741 (169.6) 75 (6.1) 2816 (171.7) 2338 (32.9)60 and over...... 26 (1.8) 780 2310 (58.5) 25 (2.2) 2335 (57.9) 185 2618 (115.3) 96 (8.3) 2714 (114.2) 2202 (51.9)
20 and over... 14 (1.2) 2470 2312 (36.4) 12 (1.0) 2324 (36.2) 306 2652 (105.7) 85 (5.7) 2737 (105.3) 2255 (34.4)
All Individuals:2 and over... 12 (0.8) 7804 2537 (27.5) 11 (0.9) 2547 (27.9) 667 3015 (86.3) 87 (5.6) 3102 (87.1) 2471 (27.1)
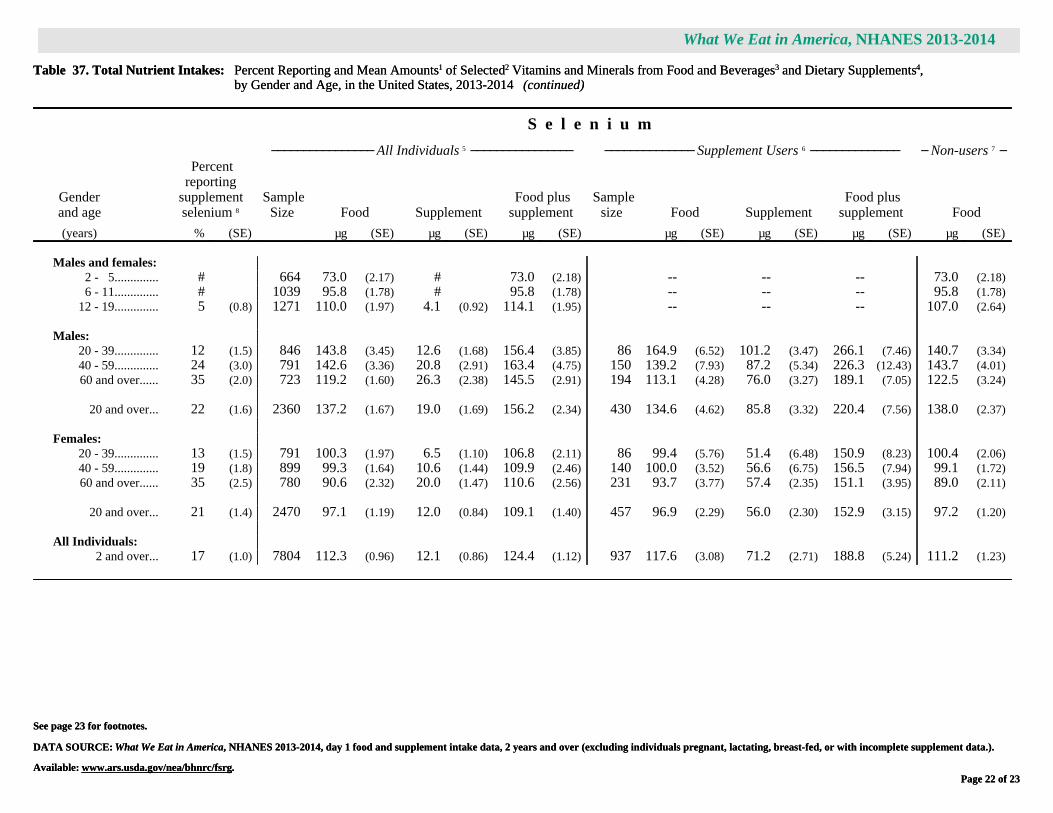
Page 22 of 23Available: www.ars.usda.gov/nea/bhnrc/fsrg.
DATA SOURCE: What We Eat in America, NHANES 2013-2014, day 1 food and supplement intake data, 2 years and over (excluding individuals pregnant, lactating, breast-fed, or with incomplete supplement data.).
See page 23 for footnotes.
What We Eat in America, NHANES 2013-2014
Table 37. Total Nutrient Intakes: Percent Reporting and Mean Amounts1 of Selected2 Vitamins and Minerals from Food and Beverages3 and Dietary Supplements4,by Gender and Age, in the United States, 2013-2014 (continued)
S e l e n i u m
──────────────── All Individuals 5 ──────────────── ────────────── Supplement Users 6 ────────────── ─ Non-users 7 ─
Genderand age
Percentreporting
supplementselenium 8
SampleSize Food Supplement
Food plussupplement
Samplesize Food Supplement
Food plussupplement Food
(years) % (SE) µg (SE) µg (SE) µg (SE) µg (SE) µg (SE) µg (SE) µg (SE)
Males and females:2 - 5.............. # 664 73.0 (2.17) # 73.0 (2.18) -- -- -- 73.0 (2.18)6 - 11.............. # 1039 95.8 (1.78) # 95.8 (1.78) -- -- -- 95.8 (1.78)
12 - 19.............. 5 (0.8) 1271 110.0 (1.97) 4.1 (0.92) 114.1 (1.95) -- -- -- 107.0 (2.64)
Males:20 - 39.............. 12 (1.5) 846 143.8 (3.45) 12.6 (1.68) 156.4 (3.85) 86 164.9 (6.52) 101.2 (3.47) 266.1 (7.46) 140.7 (3.34)40 - 59.............. 24 (3.0) 791 142.6 (3.36) 20.8 (2.91) 163.4 (4.75) 150 139.2 (7.93) 87.2 (5.34) 226.3 (12.43) 143.7 (4.01)60 and over...... 35 (2.0) 723 119.2 (1.60) 26.3 (2.38) 145.5 (2.91) 194 113.1 (4.28) 76.0 (3.27) 189.1 (7.05) 122.5 (3.24)
20 and over... 22 (1.6) 2360 137.2 (1.67) 19.0 (1.69) 156.2 (2.34) 430 134.6 (4.62) 85.8 (3.32) 220.4 (7.56) 138.0 (2.37)
Females:20 - 39.............. 13 (1.5) 791 100.3 (1.97) 6.5 (1.10) 106.8 (2.11) 86 99.4 (5.76) 51.4 (6.48) 150.9 (8.23) 100.4 (2.06)40 - 59.............. 19 (1.8) 899 99.3 (1.64) 10.6 (1.44) 109.9 (2.46) 140 100.0 (3.52) 56.6 (6.75) 156.5 (7.94) 99.1 (1.72)60 and over...... 35 (2.5) 780 90.6 (2.32) 20.0 (1.47) 110.6 (2.56) 231 93.7 (3.77) 57.4 (2.35) 151.1 (3.95) 89.0 (2.11)
20 and over... 21 (1.4) 2470 97.1 (1.19) 12.0 (0.84) 109.1 (1.40) 457 96.9 (2.29) 56.0 (2.30) 152.9 (3.15) 97.2 (1.20)
All Individuals:2 and over... 17 (1.0) 7804 112.3 (0.96) 12.1 (0.86) 124.4 (1.12) 937 117.6 (3.08) 71.2 (2.71) 188.8 (5.24) 111.2 (1.23)

What We Eat in America, NHANES 2013-2014
Page 23 of 23Page 23 of 23
Symbol Legend
* Indicates an estimate that may be less statistically reliable than estimates that are not flagged. The rules for flagging estimated means and percentages are as follows:
Mean: An estimated mean is flagged when the relative standard error is greater than 30 percent.
Percent reporting a supplement intake: An estimated percentage between 25 and 75 percent is flagged when based on a sample size of less than 30 times the variance inflation factor(VIF), where the VIF represents a broadly calculated average design effect, or when the relative standard error is greater than 30 percent. An estimated percentage less than or equal to 25percent or greater than or equal to 75 percent is flagged when the smaller of np and n(1-p) is less than 8 times the VIF, where n is the sample size and p is the percentage expressed as afraction. The VIF used in this table is 1.98.
# Indicates a non-zero value too small to report.
-- Estimated mean not presented where sample size is less than 30 times the variance inflation factor (VIF), i.e., sample size less than 59 for VIF = 1.98.
Footnotes
1 Sample weights designed for dietary analysis were used to allow estimates representative of the U. S. population for the years of collection.
2 Selection of the 22 vitamins, minerals, and carotenoids was based on the availability of Day 1 nutrient intakes from both food and dietary supplements. At the time of this release, supplementdata were not available for vitamin A, vitamin E, and other carotenoids.
Niacin: values do not include niacin-equivalents from tryptophan.Folic acid: the synthetic form of folate used as a fortificant in foods and dietary supplements.Folate (DFE): µg dietary folate equivalents = µg food folate + (1.7*µg folic acid).Vitamin D: 1 µg = 40 International Units (IU).Calcium and Magnesium: supplement intake includes non-prescription antacids.
3 Food and beverage intake was estimated from Day 1 dietary recall interviews conducted in the What We Eat in America, National Health and Nutrition Examination Survey (NHANES)2013-2014. The 24-hour dietary recalls were conducted in-person, by trained interviewers, using the USDA 5-step Automated Multiple-Pass Method. Food intakes were coded and nutrientvalues were determined using the USDA Food and Nutrient Database for Dietary Studies 2013-2014 www.ars.usda.gov/nea/bhnrc/fsrg.
4 Dietary supplement intake was estimated from the Day 1 Total Dietary Supplements File (DS1TOT_h) of NHANES 2013-2014. Collected as part of the dietary supplement component of the24-hour dietary recall, intakes now reflect the same timeframe as the food and beverage intake. Data are collected on the usage of all vitamins, minerals, herbals, and other dietary supplements aswell as non-prescription antacids and calculated using the NHANES-Dietary Supplement Database. Documentation available at: http://www.cdc.gov/nchs/nhanes/nhanes2013-2014/DS1TOT_h.htm.
5 All Individuals: includes both supplement users and non-users 2 years and over. Pregnant and/or lactating females, breast-fed children, and individuals with incomplete dietary supplementcomponent of the 24-hour dietary recall were excluded.
6 Supplement Users: includes individuals who reported taking at least one multi- and/or single-nutrient supplement that contained the vitamin or mineral displayed on this page.
7 Non-users: includes individuals who did not report taking any dietary supplement that contained the vitamin or mineral displayed on this page. Non-users may include individuals that reportedother dietary supplements.
8 The weighted percentage of respondents in the gender/age group who reported taking at least one multi- and /or single- nutrient supplement containing this nutrient.
Abbreviations
SE = standard error; DFE = dietary folate equivalents.
Suggested Citation
U.S. Department of Agriculture, Agricultural Research Service. 2017. Total Nutrient Intakes: Percent Reporting and Mean Amounts of Selected Vitamins and Minerals from Food and Beveragesand Dietary Supplements, by Gender and Age, What We Eat in America, NHANES 2013-2014. Available: www.ars.usda.gov/nea/bhnrc/fsrg.

Page 1 of 23Available: www.ars.usda.gov/nea/bhnrc/fsrg.
DATA SOURCE: What We Eat in America, NHANES 2013-2014, day 1 food and supplement intake data, 2 years and over (excluding individuals pregnant, lactating, breast-fed, or with incomplete supplement data.).
See page 23 for footnotes.
What We Eat in America, NHANES 2013-2014
Table 38. Total Nutrient Intakes: Percent Reporting and Mean Amounts1 of Selected2 Vitamins and Minerals from Food and Beverages3 and Dietary Supplements4,by Race/Ethnicity and Age, in the United States, 2013-2014
T h i a m i n
──────────────── All Individuals 5 ──────────────── ────────────── Supplement Users 6 ────────────── ─ Non-users 7 ─
Race/ethnicityand age
Percentreporting
supplementthiamin 8
SampleSize Food Supplement
Food plussupplement
Samplesize Food Supplement
Food plussupplement Food
(years) % (SE) mg (SE) mg (SE) mg (SE) mg (SE) mg (SE) mg (SE) mg (SE)
Non-Hispanic White:2 - 19.............. 8 (0.8) 799 1.58 (0.042) 0.48* (0.185) 2.06 (0.185) 62 2.18 (0.393) 6.31* (2.636) 8.48* (2.917) 1.53 (0.048)
20 and over.......... 29 (1.6) 2146 1.64 (0.020) 6.12 (1.435) 7.76 (1.439) 570 1.69 (0.038) 21.31 (4.749) 23.00 (4.754) 1.62 (0.030)
2 and over... 24 (1.2) 2945 1.63 (0.020) 4.95 (1.131) 6.57 (1.137) 632 1.72 (0.045) 20.33 (4.476) 22.05 (4.495) 1.60 (0.025)
Non-Hispanic Black:2 - 19.............. 5 (1.2) 745 1.50 (0.038) 0.07 (0.019) 1.57 (0.042) -- -- -- 1.49 (0.041)
20 and over.......... 16 (0.9) 970 1.52 (0.030) 3.44* (1.185) 4.96 (1.192) 161 1.61 (0.054) 21.41* (7.942) 23.02* (7.934) 1.51 (0.032)
2 and over... 13 (0.7) 1715 1.52 (0.020) 2.47* (0.865) 3.98 (0.874) 200 1.61 (0.052) 19.32* (7.104) 20.93* (7.093) 1.50 (0.022)
Non-Hispanic Asian 9:
2 - 19.............. 11 (1.7) 259 1.61 (0.083) 0.79* (0.503) 2.41 (0.531) -- -- -- 1.55 (0.086)20 and over.......... 21 (2.0) 492 1.57 (0.034) 2.82* (1.127) 4.39 (1.122) 99 1.70 (0.100) 13.38* (4.705) 15.08* (4.709) 1.54 (0.030)
2 and over... 19 (1.4) 751 1.58 (0.032) 2.34* (0.913) 3.92 (0.914) 121 1.76 (0.091) 12.60* (4.462) 14.36* (4.457) 1.54 (0.032)
Hispanic:2 - 19.............. 5 (0.9) 981 1.57 (0.038) 0.45* (0.409) 2.02 (0.428) -- -- -- 1.57 (0.038)
20 and over.......... 13 (1.3) 1076 1.64 (0.032) 1.63 (0.284) 3.26 (0.289) 145 1.49 (0.079) 12.67 (1.731) 14.16 (1.704) 1.66 (0.034)
2 and over... 10 (0.9) 2057 1.62 (0.031) 1.22 (0.264) 2.84 (0.278) 188 1.50 (0.071) 11.92 (2.160) 13.42 (2.161) 1.63 (0.034)

Page 2 of 23Available: www.ars.usda.gov/nea/bhnrc/fsrg.
DATA SOURCE: What We Eat in America, NHANES 2013-2014, day 1 food and supplement intake data, 2 years and over (excluding individuals pregnant, lactating, breast-fed, or with incomplete supplement data.).
See page 23 for footnotes.
What We Eat in America, NHANES 2013-2014
Table 38. Total Nutrient Intakes: Percent Reporting and Mean Amounts1 of Selected2 Vitamins and Minerals from Food and Beverages3 and Dietary Supplements4,by Race/Ethnicity and Age, in the United States, 2013-2014 (continued)
R i b o f l a v i n
──────────────── All Individuals 5 ──────────────── ────────────── Supplement Users 6 ────────────── ─ Non-users 7 ─
Race/ethnicityand age
Percentreporting
supplementriboflavin 8
SampleSize Food Supplement
Food plussupplement
Samplesize Food Supplement
Food plussupplement Food
(years) % (SE) mg (SE) mg (SE) mg (SE) mg (SE) mg (SE) mg (SE) mg (SE)
Non-Hispanic White:2 - 19.............. 8 (0.8) 799 2.13 (0.042) 0.52* (0.192) 2.65 (0.180) 62 3.09 (0.712) 6.76* (2.696) 9.85* (3.195) 2.05 (0.063)
20 and over.......... 29 (1.5) 2146 2.29 (0.028) 2.58 (0.376) 4.87 (0.382) 572 2.41 (0.059) 8.97 (1.104) 11.39 (1.138) 2.24 (0.040)
2 and over... 24 (1.1) 2945 2.26 (0.028) 2.15 (0.269) 4.41 (0.278) 634 2.46 (0.082) 8.83 (0.942) 11.29 (0.967) 2.19 (0.033)
Non-Hispanic Black:2 - 19.............. 5 (1.2) 745 1.72 (0.036) 0.09 (0.023) 1.80 (0.050) -- -- -- 1.70 (0.033)
20 and over.......... 16 (0.9) 970 1.80 (0.035) 1.50 (0.342) 3.30 (0.364) 161 1.94 (0.070) 9.37 (2.177) 11.30 (2.215) 1.77 (0.040)
2 and over... 13 (0.7) 1715 1.77 (0.023) 1.09 (0.238) 2.87 (0.250) 200 1.95 (0.055) 8.58 (1.984) 10.52 (1.998) 1.75 (0.027)
Non-Hispanic Asian 9:
2 - 19.............. 10 (1.3) 259 1.97 (0.083) 0.62* (0.415) 2.59 (0.382) -- -- -- 1.92 (0.079)20 and over.......... 21 (2.0) 492 1.78 (0.050) 1.83* (0.653) 3.61 (0.674) 98 2.03 (0.106) 8.76* (2.827) 10.79 (2.892) 1.72 (0.048)
2 and over... 18 (1.4) 751 1.83 (0.055) 1.54* (0.519) 3.37 (0.534) 119 2.08 (0.118) 8.46* (2.614) 10.54 (2.647) 1.77 (0.051)
Hispanic:2 - 19.............. 5 (0.9) 981 1.90 (0.050) 0.17* (0.099) 2.08 (0.125) -- -- -- 1.91 (0.051)
20 and over.......... 13 (1.3) 1076 2.13 (0.088) 1.17 (0.251) 3.31 (0.267) 145 1.95 (0.162) 9.04 (1.378) 10.99 (1.421) 2.16 (0.087)
2 and over... 10 (0.9) 2057 2.05 (0.072) 0.83 (0.176) 2.89 (0.205) 188 1.92 (0.145) 8.03 (1.176) 9.95 (1.217) 2.07 (0.069)

Page 3 of 23Available: www.ars.usda.gov/nea/bhnrc/fsrg.
DATA SOURCE: What We Eat in America, NHANES 2013-2014, day 1 food and supplement intake data, 2 years and over (excluding individuals pregnant, lactating, breast-fed, or with incomplete supplement data.).
See page 23 for footnotes.
What We Eat in America, NHANES 2013-2014
Table 38. Total Nutrient Intakes: Percent Reporting and Mean Amounts1 of Selected2 Vitamins and Minerals from Food and Beverages3 and Dietary Supplements4,by Race/Ethnicity and Age, in the United States, 2013-2014 (continued)
N i a c i n
──────────────── All Individuals 5 ──────────────── ────────────── Supplement Users 6 ────────────── ─ Non-users 7 ─
Race/ethnicityand age
Percentreporting
supplementniacin 8
SampleSize Food Supplement
Food plussupplement
Samplesize Food Supplement
Food plussupplement Food
(years) % (SE) mg (SE) mg (SE) mg (SE) mg (SE) mg (SE) mg (SE) mg (SE)
Non-Hispanic White:2 - 19.............. 9 (1.0) 799 23.1 (0.73) 1.8 (0.35) 24.8 (0.88) 75 32.3 (6.82) 19.8 (3.80) 52.1 (9.35) 22.1 (0.72)
20 and over.......... 31 (1.7) 2146 26.4 (0.31) 11.9 (1.34) 38.3 (1.33) 617 26.6 (0.47) 38.5 (3.03) 65.1 (3.08) 26.4 (0.36)
2 and over... 26 (1.3) 2945 25.7 (0.35) 9.8 (1.03) 35.5 (1.14) 692 27.0 (0.82) 37.1 (2.70) 64.1 (3.00) 25.3 (0.36)
Non-Hispanic Black:2 - 19.............. 5 (1.2) 745 21.2 (0.41) 0.7 (0.18) 21.9 (0.46) -- -- -- 21.1 (0.41)
20 and over.......... 17 (1.1) 970 26.1 (0.50) 4.8 (0.71) 30.9 (0.68) 166 26.0 (1.19) 28.9 (3.02) 54.9 (2.66) 26.1 (0.51)
2 and over... 13 (0.8) 1715 24.7 (0.39) 3.6 (0.51) 28.3 (0.48) 205 25.8 (1.09) 27.5 (2.64) 53.3 (2.27) 24.5 (0.40)
Non-Hispanic Asian 9:
2 - 19.............. 10 (1.7) 259 22.2 (1.74) 2.2 (0.36) 24.4 (2.01) -- -- -- 21.6 (1.82)20 and over.......... 23 (2.0) 492 24.7 (0.64) 6.2 (0.85) 31.0 (1.08) 108 26.1 (1.25) 26.9 (2.26) 52.9 (3.09) 24.3 (0.68)
2 and over... 20 (1.4) 751 24.2 (0.64) 5.3 (0.65) 29.4 (0.88) 130 26.2 (1.10) 26.1 (2.07) 52.4 (2.74) 23.6 (0.72)
Hispanic:2 - 19.............. 5 (0.9) 981 21.7 (0.58) 1.1 (0.30) 22.7 (0.79) -- -- -- 21.8 (0.64)
20 and over.......... 14 (1.2) 1076 27.5 (0.91) 5.5* (1.79) 33.1 (2.10) 150 26.3 (2.04) 40.0 (11.86) 66.2 (12.68) 27.7 (0.95)
2 and over... 11 (0.8) 2057 25.5 (0.74) 4.0 (1.20) 29.5 (1.54) 193 25.2 (1.77) 36.6 (9.77) 61.8 (10.59) 25.6 (0.80)

Page 4 of 23Available: www.ars.usda.gov/nea/bhnrc/fsrg.
DATA SOURCE: What We Eat in America, NHANES 2013-2014, day 1 food and supplement intake data, 2 years and over (excluding individuals pregnant, lactating, breast-fed, or with incomplete supplement data.).
See page 23 for footnotes.
What We Eat in America, NHANES 2013-2014
Table 38. Total Nutrient Intakes: Percent Reporting and Mean Amounts1 of Selected2 Vitamins and Minerals from Food and Beverages3 and Dietary Supplements4,by Race/Ethnicity and Age, in the United States, 2013-2014 (continued)
V i t a m i n B 6
──────────────── All Individuals 5 ──────────────── ────────────── Supplement Users 6 ────────────── ─ Non-users 7 ─
Race/ethnicityand age
Percentreporting
supplementvitamin B6 8
SampleSize Food Supplement
Food plussupplement
Samplesize Food Supplement
Food plussupplement Food
(years) % (SE) mg (SE) mg (SE) mg (SE) mg (SE) mg (SE) mg (SE) mg (SE)
Non-Hispanic White:2 - 19.............. 22 (2.2) 799 1.89 (0.062) 0.80 (0.197) 2.69 (0.227) 167 2.06 (0.294) 3.65* (1.108) 5.71 (1.360) 1.84 (0.077)
20 and over.......... 32 (1.6) 2146 2.21 (0.038) 3.29 (0.583) 5.50 (0.571) 636 2.28 (0.054) 10.29 (1.570) 12.58 (1.549) 2.17 (0.035)
2 and over... 30 (1.4) 2945 2.14 (0.037) 2.77 (0.438) 4.91 (0.427) 803 2.25 (0.085) 9.28 (1.255) 11.53 (1.236) 2.10 (0.029)
Non-Hispanic Black:2 - 19.............. 10 (2.2) 745 1.63 (0.047) 0.14 (0.034) 1.77 (0.059) 90 1.89 (0.097) 1.38 (0.088) 3.27 (0.171) 1.60 (0.050)
20 and over.......... 18 (1.1) 970 2.02 (0.049) 10.78* (8.737) 12.81* (8.750) 179 2.02 (0.101) 58.93*(47.440) 60.94*(47.441) 2.03 (0.061)
2 and over... 16 (0.8) 1715 1.91 (0.040) 7.71* (6.159) 9.62* (6.159) 269 1.99 (0.082) 48.33*(38.571) 50.32*(38.570) 1.90 (0.050)
Non-Hispanic Asian 9:
2 - 19.............. 28 (3.2) 259 1.88 (0.119) 0.85* (0.354) 2.72 (0.359) -- -- -- 1.88 (0.166)20 and over.......... 24 (2.1) 492 2.07 (0.059) 2.22* (0.690) 4.29 (0.725) 113 2.27 (0.142) 9.33 (2.434) 11.60 (2.546) 2.00 (0.054)
2 and over... 25 (1.8) 751 2.02 (0.058) 1.90 (0.532) 3.92 (0.548) 168 2.17 (0.109) 7.68 (1.849) 9.85 (1.923) 1.98 (0.066)
Hispanic:2 - 19.............. 11 (1.9) 981 1.79 (0.055) 0.18 (0.034) 1.97 (0.075) 104 1.67 (0.107) 1.68 (0.131) 3.35 (0.182) 1.80 (0.060)
20 and over.......... 14 (1.1) 1076 2.36 (0.147) 2.31 (0.638) 4.67 (0.631) 158 2.14 (0.194) 16.38 (3.562) 18.53 (3.524) 2.40 (0.156)
2 and over... 13 (0.9) 2057 2.17 (0.108) 1.58 (0.415) 3.75 (0.427) 262 2.01 (0.148) 12.23 (2.756) 14.24 (2.713) 2.19 (0.114)

Page 5 of 23Available: www.ars.usda.gov/nea/bhnrc/fsrg.
DATA SOURCE: What We Eat in America, NHANES 2013-2014, day 1 food and supplement intake data, 2 years and over (excluding individuals pregnant, lactating, breast-fed, or with incomplete supplement data.).
See page 23 for footnotes.
What We Eat in America, NHANES 2013-2014
Table 38. Total Nutrient Intakes: Percent Reporting and Mean Amounts1 of Selected2 Vitamins and Minerals from Food and Beverages3 and Dietary Supplements4,by Race/Ethnicity and Age, in the United States, 2013-2014 (continued)
F o l i c a c i d
──────────────── All Individuals 5 ──────────────── ────────────── Supplement Users 6 ────────────── ─ Non-users 7 ─
Race/ethnicityand age
Percentreporting
supplementfolic acid 8
SampleSize Food Supplement
Food plussupplement
Samplesize Food Supplement
Food plussupplement Food
(years) % (SE) µg (SE) µg (SE) µg (SE) µg (SE) µg (SE) µg (SE) µg (SE)
Non-Hispanic White:2 - 19.............. 21 (2.4) 799 203 (11.5) 47 (4.7) 251 (12.9) 164 225 (36.0) 221 (12.5) 446 (42.6) 198 (14.2)
20 and over.......... 31 (1.6) 2146 185 (5.6) 142 (7.1) 327 (8.8) 623 191 (7.9) 451 (13.6) 642 (16.8) 183 (7.0)
2 and over... 29 (1.4) 2945 189 (5.7) 122 (5.8) 311 (7.5) 787 196 (8.4) 416 (13.8) 612 (18.2) 186 (7.4)
Non-Hispanic Black:2 - 19.............. 10 (2.3) 745 222 (13.4) 24 (6.4) 246 (11.9) 90 226 (34.8) 248 (13.7) 474 (40.6) 221 (13.4)
20 and over.......... 18 (1.1) 970 163 (3.7) 99 (14.6) 261 (15.1) 174 173 (8.5) 554 (70.4) 727 (74.5) 160 (4.6)
2 and over... 15 (0.8) 1715 180 (3.8) 77 (9.9) 257 (10.2) 264 183 (10.9) 498 (55.7) 681 (60.5) 179 (4.4)
Non-Hispanic Asian 9:
2 - 19.............. 26 (4.0) 259 210 (18.1) 56 (13.6) 266 (18.4) -- -- -- 212 (22.9)20 and over.......... 23 (1.9) 492 160 (6.4) 106 (11.0) 266 (12.5) 111 153 (18.0) 457 (19.8) 611 (24.4) 162 (7.6)
2 and over... 24 (1.6) 751 172 (7.6) 94 (8.8) 266 (10.3) 163 166 (12.3) 396 (15.0) 562 (13.9) 173 (9.6)
Hispanic:2 - 19.............. 10 (2.0) 981 208 (9.0) 29 (4.6) 237 (11.9) 101 213 (22.5) 280 (27.5) 493 (36.1) 207 (9.1)
20 and over.......... 14 (1.2) 1076 169 (7.1) 66 (4.9) 234 (8.6) 158 171 (19.4) 453 (23.6) 624 (24.9) 168 (8.0)
2 and over... 13 (1.1) 2057 182 (6.8) 53 (3.8) 235 (8.3) 259 182 (16.9) 406 (20.0) 588 (20.8) 182 (7.1)

Page 6 of 23Available: www.ars.usda.gov/nea/bhnrc/fsrg.
DATA SOURCE: What We Eat in America, NHANES 2013-2014, day 1 food and supplement intake data, 2 years and over (excluding individuals pregnant, lactating, breast-fed, or with incomplete supplement data.).
See page 23 for footnotes.
What We Eat in America, NHANES 2013-2014
Table 38. Total Nutrient Intakes: Percent Reporting and Mean Amounts1 of Selected2 Vitamins and Minerals from Food and Beverages3 and Dietary Supplements4,by Race/Ethnicity and Age, in the United States, 2013-2014 (continued)
F o l a t e ( D F E )
──────────────── All Individuals 5 ──────────────── ────────────── Supplement Users 6 ────────────── ─ Non-users 7 ─
Race/ethnicityand age
Percentreporting
supplementfolate (DFE) 8
SampleSize Food Supplement
Food plussupplement
Samplesize Food Supplement
Food plussupplement Food
(years) % (SE) µg (SE) µg (SE) µg (SE) µg (SE) µg (SE) µg (SE) µg (SE)
Non-Hispanic White:2 - 19.............. 21 (2.4) 799 501 (20.9) 81 (7.9) 581 (23.3) 164 551 (67.3) 376 (21.3) 927 (79.5) 487 (26.5)
20 and over.......... 31 (1.6) 2146 534 (10.2) 241 (12.1) 774 (16.4) 623 562 (13.5) 766 (23.2) 1328 (30.4) 521 (13.6)
2 and over... 29 (1.4) 2945 527 (10.0) 207 (9.8) 734 (13.8) 787 561 (16.7) 707 (23.5) 1267 (34.5) 513 (13.4)
Non-Hispanic Black:2 - 19.............. 10 (2.3) 745 524 (23.1) 41 (10.8) 566 (20.4) 90 527 (59.8) 421 (23.4) 948 (70.4) 524 (22.8)
20 and over.......... 18 (1.1) 970 478 (10.5) 168 (24.8) 646 (26.7) 174 501 (15.6) 941 (119.7) 1443 (124.8) 473 (13.0)
2 and over... 15 (0.8) 1715 492 (7.6) 131 (16.8) 623 (16.9) 264 506 (15.9) 846 (94.7) 1352 (100.3) 489 (9.0)
Non-Hispanic Asian 9:
2 - 19.............. 26 (4.0) 259 533 (34.3) 96 (23.1) 628 (36.8) -- -- -- 538 (42.5)20 and over.......... 23 (1.9) 492 526 (13.9) 180 (18.8) 705 (26.0) 111 540 (33.5) 778 (33.6) 1317 (51.7) 521 (18.9)
2 and over... 24 (1.6) 751 527 (15.6) 160 (14.9) 687 (22.2) 163 534 (20.5) 673 (25.5) 1207 (30.4) 525 (21.0)
Hispanic:2 - 19.............. 10 (2.0) 981 524 (19.9) 49 (7.8) 573 (24.8) 101 526 (50.5) 476 (46.8) 1003 (71.3) 524 (19.9)
20 and over.......... 14 (1.2) 1076 537 (18.0) 111 (8.3) 649 (20.2) 158 534 (45.5) 770 (40.1) 1304 (58.3) 538 (19.0)
2 and over... 13 (1.1) 2057 533 (17.3) 90 (6.5) 623 (20.1) 259 532 (38.1) 690 (34.0) 1223 (42.6) 533 (17.4)

Page 7 of 23Available: www.ars.usda.gov/nea/bhnrc/fsrg.
DATA SOURCE: What We Eat in America, NHANES 2013-2014, day 1 food and supplement intake data, 2 years and over (excluding individuals pregnant, lactating, breast-fed, or with incomplete supplement data.).
See page 23 for footnotes.
What We Eat in America, NHANES 2013-2014
Table 38. Total Nutrient Intakes: Percent Reporting and Mean Amounts1 of Selected2 Vitamins and Minerals from Food and Beverages3 and Dietary Supplements4,by Race/Ethnicity and Age, in the United States, 2013-2014 (continued)
C h o l i n e
──────────────── All Individuals 5 ──────────────── ────────────── Supplement Users 6 ────────────── ─ Non-users 7 ─
Race/ethnicityand age
Percentreporting
supplementcholine 8
SampleSize Food Supplement
Food plussupplement
Samplesize Food Supplement
Food plussupplement Food
(years) % (SE) mg (SE) mg (SE) mg (SE) mg (SE) mg (SE) mg (SE) mg (SE)
Non-Hispanic White:2 - 19.............. 10 (1.6) 799 257 (5.3) 1* (0.4) 258 (5.4) 76 343 (49.5) 11* (3.9) 355 (50.4) 247 (6.6)
20 and over.......... 6 (0.9) 2146 334 (4.9) 1 (0.3) 336 (4.8) 115 324 (14.9) 25 (4.0) 349 (17.3) 335 (5.0)
2 and over... 7 (0.6) 2945 318 (4.1) 1 (0.2) 319 (4.0) 191 330 (17.2) 21 (2.6) 351 (16.7) 317 (3.8)
Non-Hispanic Black:2 - 19.............. 2 (0.7) 745 237 (5.9) # 237 (5.9) -- -- -- 234 (5.9)
20 and over.......... 3 (0.8) 970 346 (8.8) # 346 (8.8) -- -- -- 345 (8.2)
2 and over... 3 (0.5) 1715 314 (7.2) # 314 (7.3) -- -- -- 313 (6.9)
Non-Hispanic Asian 9:
2 - 19.............. 15 (2.3) 259 290 (20.8) 2* (1.2) 292 (20.8) -- -- -- 297 (23.1)20 and over.......... 4 (0.8) 492 331 (8.8) 1* (0.4) 332 (8.8) -- -- -- 329 (9.3)
2 and over... 7 (1.0) 751 322 (10.8) 1* (0.4) 323 (10.9) -- -- -- 322 (11.4)
Hispanic:2 - 19.............. 4 (1.4) 981 262 (6.7) 1* (0.3) 263 (6.8) -- -- -- 262 (7.0)
20 and over.......... 3 (0.6) 1076 361 (7.6) 1* (0.4) 362 (7.5) -- -- -- 359 (7.5)
2 and over... 3 (0.6) 2057 327 (7.3) 1* (0.3) 328 (7.2) 75 354 (19.7) 26 (6.1) 380 (21.3) 326 (7.2)

Page 8 of 23Available: www.ars.usda.gov/nea/bhnrc/fsrg.
DATA SOURCE: What We Eat in America, NHANES 2013-2014, day 1 food and supplement intake data, 2 years and over (excluding individuals pregnant, lactating, breast-fed, or with incomplete supplement data.).
See page 23 for footnotes.
What We Eat in America, NHANES 2013-2014
Table 38. Total Nutrient Intakes: Percent Reporting and Mean Amounts1 of Selected2 Vitamins and Minerals from Food and Beverages3 and Dietary Supplements4,by Race/Ethnicity and Age, in the United States, 2013-2014 (continued)
V i t a m i n B 1 2
──────────────── All Individuals 5 ──────────────── ────────────── Supplement Users 6 ────────────── ─ Non-users 7 ─
Race/ethnicityand age
Percentreporting
supplementvitamin B12 8
SampleSize Food Supplement
Food plussupplement
Samplesize Food Supplement
Food plussupplement Food
(years) % (SE) µg (SE) µg (SE) µg (SE) µg (SE) µg (SE) µg (SE) µg (SE)
Non-Hispanic White:2 - 19.............. 21 (2.4) 799 5.02 (0.142) 2.6* (0.82) 7.6 (0.88) 164 5.44 (0.703) 12.2* (4.55) 17.7 (5.17) 4.90 (0.183)
20 and over.......... 33 (1.4) 2146 5.07 (0.098) 85.1 (11.58) 90.2 (11.59) 662 5.08 (0.209) 256.0 (41.02) 261.1 (40.93) 5.07 (0.111)
2 and over... 31 (1.3) 2945 5.06 (0.092) 67.9 (9.37) 73.0 (9.38) 826 5.13 (0.241) 220.7 (35.64) 225.8 (35.58) 5.03 (0.088)
Non-Hispanic Black:2 - 19.............. 10 (2.2) 745 4.09 (0.111) 1.3* (0.86) 5.4 (0.89) 90 4.34 (0.417) 12.5* (8.63) 16.8* (8.80) 4.06 (0.101)
20 and over.......... 19 (1.0) 970 4.76 (0.205) 31.4 (4.63) 36.2 (4.71) 187 4.65 (0.480) 166.3 (24.61) 171.0 (25.00) 4.78 (0.209)
2 and over... 16 (0.8) 1715 4.56 (0.150) 22.7 (3.12) 27.3 (3.16) 277 4.60 (0.388) 138.7 (21.10) 143.3 (21.38) 4.56 (0.162)
Non-Hispanic Asian 9:
2 - 19.............. 27 (3.9) 259 4.86 (0.324) 1.7 (0.20) 6.5 (0.38) -- -- -- 4.84 (0.455)20 and over.......... 25 (1.9) 492 4.07 (0.189) 42.7* (13.63) 46.7 (13.74) 118 4.22 (0.252) 170.8* (53.50) 175.0* (53.54) 4.02 (0.214)
2 and over... 25 (1.6) 751 4.26 (0.154) 33.0* (10.78) 37.3 (10.84) 171 4.40 (0.195) 130.0* (42.19) 134.4* (42.18) 4.21 (0.181)
Hispanic:2 - 19.............. 10 (2.0) 981 4.77 (0.106) 10.1* (9.89) 14.9* (9.85) 103 4.31 (0.200) 96.1* (86.99) 100.4* (86.93) 4.83 (0.112)
20 and over.......... 14 (1.1) 1076 4.83 (0.222) 17.7* (6.07) 22.6 (6.24) 164 4.63 (0.518) 122.5* (45.34) 127.2* (45.53) 4.86 (0.222)
2 and over... 13 (0.9) 2057 4.81 (0.143) 15.1* (6.97) 19.9* (7.07) 267 4.54 (0.383) 115.3* (53.47) 119.8* (53.56) 4.85 (0.148)

Page 9 of 23Available: www.ars.usda.gov/nea/bhnrc/fsrg.
DATA SOURCE: What We Eat in America, NHANES 2013-2014, day 1 food and supplement intake data, 2 years and over (excluding individuals pregnant, lactating, breast-fed, or with incomplete supplement data.).
See page 23 for footnotes.
What We Eat in America, NHANES 2013-2014
Table 38. Total Nutrient Intakes: Percent Reporting and Mean Amounts1 of Selected2 Vitamins and Minerals from Food and Beverages3 and Dietary Supplements4,by Race/Ethnicity and Age, in the United States, 2013-2014 (continued)
V i t a m i n C
──────────────── All Individuals 5 ──────────────── ────────────── Supplement Users 6 ────────────── ─ Non-users 7 ─
Race/ethnicityand age
Percentreporting
supplementvitamin C 8
SampleSize Food Supplement
Food plussupplement
Samplesize Food Supplement
Food plussupplement Food
(years) % (SE) mg (SE) mg (SE) mg (SE) mg (SE) mg (SE) mg (SE) mg (SE)
Non-Hispanic White:2 - 19.............. 23 (2.2) 799 67.1 (2.23) 27.6 (5.68) 94.8 (6.81) 177 82.7 (5.85) 119.9 (29.95) 202.6 (30.43) 62.5 (3.07)
20 and over.......... 35 (1.5) 2146 75.7 (1.74) 92.4 (12.22) 168.1 (13.05) 699 88.4 (3.11) 267.2 (32.48) 355.7 (32.74) 68.9 (2.60)
2 and over... 32 (1.2) 2945 73.9 (1.18) 78.9 (9.15) 152.8 (9.50) 876 87.6 (3.22) 245.3 (27.69) 332.8 (27.65) 67.4 (1.82)
Non-Hispanic Black:2 - 19.............. 11 (2.4) 745 78.6 (4.03) 10.3* (4.18) 88.9 (6.59) 97 97.0 (6.27) 95.3 (25.27) 192.3 (27.52) 76.4 (4.21)
20 and over.......... 20 (0.9) 970 80.9 (3.44) 50.3 (4.59) 131.2 (6.15) 193 84.9 (4.78) 257.5 (24.10) 342.4 (26.60) 79.9 (3.91)
2 and over... 17 (1.1) 1715 80.2 (2.79) 38.8 (3.92) 119.0 (5.77) 290 87.1 (4.17) 227.6 (21.24) 314.7 (23.75) 78.8 (2.97)
Non-Hispanic Asian 9:
2 - 19.............. 31 (3.7) 259 79.3 (8.16) 38.0* (23.44) 117.3 (26.68) 62 84.8 (12.65) 123.8* (69.51) 208.6* (69.08) 76.8 (9.61)20 and over.......... 27 (2.5) 492 87.2 (4.72) 62.8 (16.83) 150.0 (19.26) 135 102.3 (11.96) 233.5 (47.26) 335.8 (54.46) 81.6 (4.67)
2 and over... 28 (2.2) 751 85.3 (4.39) 57.0 (14.68) 142.3 (16.91) 197 97.8 (9.95) 205.0 (42.45) 302.8 (46.57) 80.5 (4.51)
Hispanic:2 - 19.............. 12 (2.0) 981 80.7 (3.31) 10.9 (3.26) 91.5 (5.98) 115 78.4 (12.54) 89.7 (22.05) 168.1 (28.26) 81.0 (3.13)
20 and over.......... 16 (1.1) 1076 89.4 (6.25) 34.9 (4.13) 124.3 (6.27) 177 103.5 (12.27) 221.2 (21.84) 324.7 (27.81) 86.8 (5.93)
2 and over... 15 (0.9) 2057 86.4 (4.75) 26.7 (2.52) 113.1 (5.15) 292 96.3 (10.89) 183.8 (14.71) 280.1 (19.13) 84.7 (4.28)

Page 10 of 23Available: www.ars.usda.gov/nea/bhnrc/fsrg.
DATA SOURCE: What We Eat in America, NHANES 2013-2014, day 1 food and supplement intake data, 2 years and over (excluding individuals pregnant, lactating, breast-fed, or with incomplete supplement data.).
See page 23 for footnotes.
What We Eat in America, NHANES 2013-2014
Table 38. Total Nutrient Intakes: Percent Reporting and Mean Amounts1 of Selected2 Vitamins and Minerals from Food and Beverages3 and Dietary Supplements4,by Race/Ethnicity and Age, in the United States, 2013-2014 (continued)
V i t a m i n D
──────────────── All Individuals 5 ──────────────── ────────────── Supplement Users 6 ────────────── ─ Non-users 7 ─
Race/ethnicityand age
Percentreporting
supplementvitamin D 8
SampleSize Food Supplement
Food plussupplement
Samplesize Food Supplement
Food plussupplement Food
(years) % (SE) µg (SE) µg (SE) µg (SE) µg (SE) µg (SE) µg (SE) µg (SE)
Non-Hispanic White:2 - 19.............. 22 (2.3) 799 5.4 (0.12) 3.6 (0.45) 9.0 (0.45) 171 6.6 (0.45) 16.4 (2.54) 23.0 (2.60) 5.1 (0.14)
20 and over.......... 38 (1.6) 2146 5.0 (0.21) 13.5 (0.83) 18.5 (0.84) 781 5.8 (0.43) 35.4 (1.76) 41.1 (1.59) 4.5 (0.19)
2 and over... 35 (1.4) 2945 5.1 (0.17) 11.4 (0.61) 16.5 (0.62) 952 5.9 (0.39) 32.9 (1.49) 38.7 (1.42) 4.7 (0.15)
Non-Hispanic Black:2 - 19.............. 10 (2.2) 745 4.2 (0.21) 1.2 (0.28) 5.4 (0.41) 92 5.1 (0.36) 11.9 (0.62) 17.0 (0.87) 4.1 (0.20)
20 and over.......... 22 (1.1) 970 4.1 (0.17) 9.6* (2.90) 13.6 (3.00) 222 4.2 (0.21) 44.0 (11.71) 48.2 (11.86) 4.0 (0.17)
2 and over... 18 (0.9) 1715 4.1 (0.11) 7.2 (2.02) 11.3 (2.08) 314 4.4 (0.16) 38.8 (10.16) 43.2 (10.25) 4.0 (0.11)
Non-Hispanic Asian 9:
2 - 19.............. 34 (4.3) 259 6.5 (0.56) 4.6 (0.78) 11.0 (0.97) 63 6.4 (0.98) 13.4 (1.91) 19.8 (1.53) 6.5 (0.88)20 and over.......... 33 (2.3) 492 4.6 (0.29) 12.9 (3.85) 17.5 (3.85) 155 3.9 (0.32) 39.1 (11.20) 43.0 (11.21) 4.9 (0.43)
2 and over... 33 (2.4) 751 5.0 (0.29) 11.0 (2.99) 16.0 (2.98) 218 4.5 (0.36) 32.9 (8.59) 37.4 (8.59) 5.3 (0.44)
Hispanic:2 - 19.............. 11 (1.6) 981 5.5 (0.14) 1.2 (0.17) 6.6 (0.21) 109 5.4 (0.18) 10.7 (0.66) 16.2 (0.72) 5.5 (0.16)
20 and over.......... 16 (1.2) 1076 4.5 (0.19) 7.5* (3.06) 12.0 (3.01) 186 4.7 (0.58) 46.7* (17.74) 51.5* (17.61) 4.4 (0.20)
2 and over... 14 (1.0) 2057 4.8 (0.15) 5.4* (2.02) 10.2 (1.99) 295 4.9 (0.44) 37.4* (13.17) 42.3* (13.08) 4.8 (0.14)

Page 11 of 23Available: www.ars.usda.gov/nea/bhnrc/fsrg.
DATA SOURCE: What We Eat in America, NHANES 2013-2014, day 1 food and supplement intake data, 2 years and over (excluding individuals pregnant, lactating, breast-fed, or with incomplete supplement data.).
See page 23 for footnotes.
What We Eat in America, NHANES 2013-2014
Table 38. Total Nutrient Intakes: Percent Reporting and Mean Amounts1 of Selected2 Vitamins and Minerals from Food and Beverages3 and Dietary Supplements4,by Race/Ethnicity and Age, in the United States, 2013-2014 (continued)
V i t a m i n K
──────────────── All Individuals 5 ──────────────── ────────────── Supplement Users 6 ────────────── ─ Non-users 7 ─
Race/ethnicityand age
Percentreporting
supplementvitamin K 8
SampleSize Food Supplement
Food plussupplement
Samplesize Food Supplement
Food plussupplement Food
(years) % (SE) µg (SE) µg (SE) µg (SE) µg (SE) µg (SE) µg (SE) µg (SE)
Non-Hispanic White:2 - 19.............. 3 (0.5) 799 75.2 (4.75) 1.1 (0.27) 76.4 (4.65) -- -- -- 75.7 (4.77)
20 and over.......... 25 (1.5) 2146 122.7 (4.84) 9.3 (0.74) 132.0 (4.99) 490 151.3 (10.79) 36.9 (2.28) 188.2 (11.52) 113.2 (5.76)
2 and over... 21 (1.3) 2945 112.8 (4.02) 7.6 (0.61) 120.4 (4.18) 514 148.3 (10.80) 36.8 (2.25) 185.0 (11.51) 103.7 (4.58)
Non-Hispanic Black:2 - 19.............. 1* (0.5) 745 72.2 (6.03) 0.3* (0.14) 72.5 (6.09) -- -- -- 72.2 (6.07)
20 and over.......... 13 (0.8) 970 124.4 (7.03) 6.4 (1.60) 130.8 (7.55) 133 144.6 (19.18) 48.8 (12.05) 193.4 (25.52) 121.4 (8.32)
2 and over... 10 (0.5) 1715 109.3 (6.20) 4.6 (1.16) 113.9 (6.53) 140 142.5 (19.14) 48.3 (11.74) 190.7 (25.36) 105.8 (7.03)
Non-Hispanic Asian 9:
2 - 19.............. 6* (0.8) 259 85.2 (9.87) 1.7 (0.36) 86.9 (9.83) -- -- -- 82.9 (9.81)20 and over.......... 16 (1.7) 492 166.6 (16.49) 5.6 (0.81) 172.3 (16.66) 80 169.3 (22.83) 34.3 (2.63) 203.6 (23.71) 166.1 (19.52)
2 and over... 14 (1.3) 751 147.5 (13.03) 4.7 (0.62) 152.2 (13.14) 89 164.8 (20.70) 33.8 (2.71) 198.6 (21.41) 144.7 (14.70)
Hispanic:2 - 19.............. 1* (0.5) 981 64.9 (3.02) 0.3* (0.13) 65.2 (3.09) -- -- -- 64.2 (2.68)
20 and over.......... 10 (1.0) 1076 111.2 (8.57) 32.1* (28.07) 143.3 (30.08) 116 114.8 (11.10) 316.1*(280.88) 430.9*(284.84) 110.8 (9.79)
2 and over... 7 (0.7) 2057 95.4 (6.17) 21.2* (18.51) 116.6 (20.33) 126 115.2 (10.90) 299.0*(264.16) 414.2*(268.12) 93.9 (6.61)
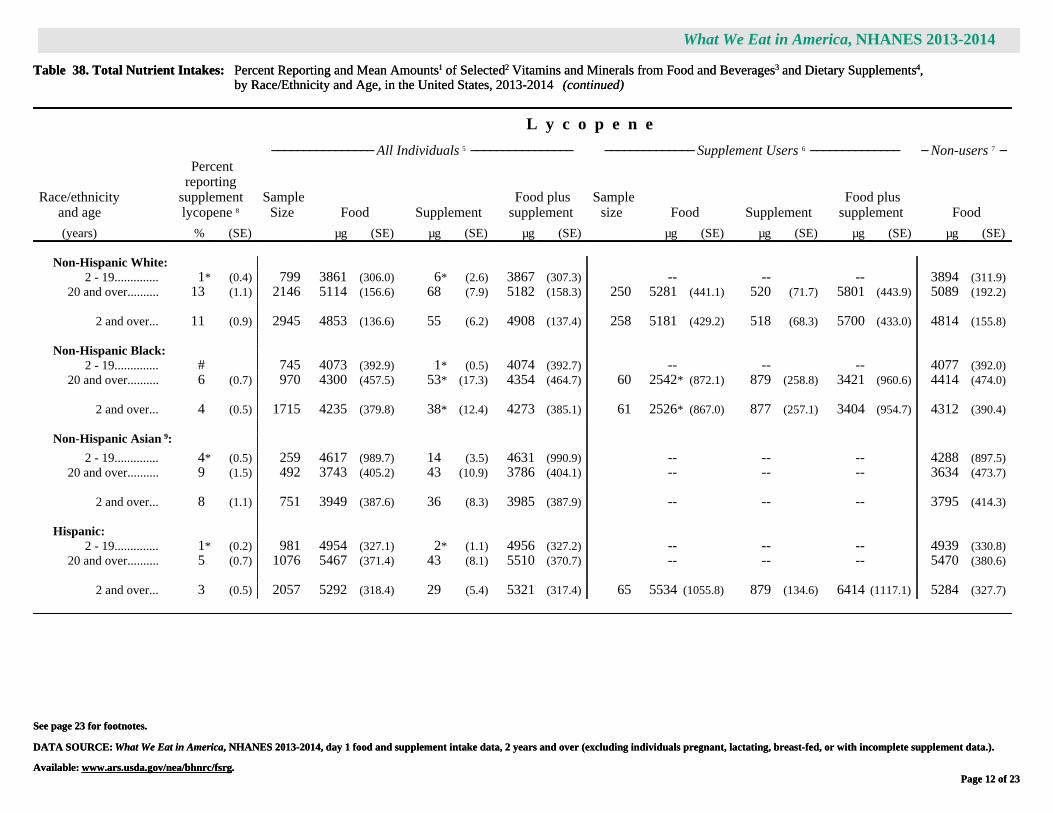
Page 12 of 23Available: www.ars.usda.gov/nea/bhnrc/fsrg.
DATA SOURCE: What We Eat in America, NHANES 2013-2014, day 1 food and supplement intake data, 2 years and over (excluding individuals pregnant, lactating, breast-fed, or with incomplete supplement data.).
See page 23 for footnotes.
What We Eat in America, NHANES 2013-2014
Table 38. Total Nutrient Intakes: Percent Reporting and Mean Amounts1 of Selected2 Vitamins and Minerals from Food and Beverages3 and Dietary Supplements4,by Race/Ethnicity and Age, in the United States, 2013-2014 (continued)
L y c o p e n e
──────────────── All Individuals 5 ──────────────── ────────────── Supplement Users 6 ────────────── ─ Non-users 7 ─
Race/ethnicityand age
Percentreporting
supplementlycopene 8
SampleSize Food Supplement
Food plussupplement
Samplesize Food Supplement
Food plussupplement Food
(years) % (SE) µg (SE) µg (SE) µg (SE) µg (SE) µg (SE) µg (SE) µg (SE)
Non-Hispanic White:2 - 19.............. 1* (0.4) 799 3861 (306.0) 6* (2.6) 3867 (307.3) -- -- -- 3894 (311.9)
20 and over.......... 13 (1.1) 2146 5114 (156.6) 68 (7.9) 5182 (158.3) 250 5281 (441.1) 520 (71.7) 5801 (443.9) 5089 (192.2)
2 and over... 11 (0.9) 2945 4853 (136.6) 55 (6.2) 4908 (137.4) 258 5181 (429.2) 518 (68.3) 5700 (433.0) 4814 (155.8)
Non-Hispanic Black:2 - 19.............. # 745 4073 (392.9) 1* (0.5) 4074 (392.7) -- -- -- 4077 (392.0)
20 and over.......... 6 (0.7) 970 4300 (457.5) 53* (17.3) 4354 (464.7) 60 2542* (872.1) 879 (258.8) 3421 (960.6) 4414 (474.0)
2 and over... 4 (0.5) 1715 4235 (379.8) 38* (12.4) 4273 (385.1) 61 2526* (867.0) 877 (257.1) 3404 (954.7) 4312 (390.4)
Non-Hispanic Asian 9:
2 - 19.............. 4* (0.5) 259 4617 (989.7) 14 (3.5) 4631 (990.9) -- -- -- 4288 (897.5)20 and over.......... 9 (1.5) 492 3743 (405.2) 43 (10.9) 3786 (404.1) -- -- -- 3634 (473.7)
2 and over... 8 (1.1) 751 3949 (387.6) 36 (8.3) 3985 (387.9) -- -- -- 3795 (414.3)
Hispanic:2 - 19.............. 1* (0.2) 981 4954 (327.1) 2* (1.1) 4956 (327.2) -- -- -- 4939 (330.8)
20 and over.......... 5 (0.7) 1076 5467 (371.4) 43 (8.1) 5510 (370.7) -- -- -- 5470 (380.6)
2 and over... 3 (0.5) 2057 5292 (318.4) 29 (5.4) 5321 (317.4) 65 5534 (1055.8) 879 (134.6) 6414 (1117.1) 5284 (327.7)

Page 13 of 23Available: www.ars.usda.gov/nea/bhnrc/fsrg.
DATA SOURCE: What We Eat in America, NHANES 2013-2014, day 1 food and supplement intake data, 2 years and over (excluding individuals pregnant, lactating, breast-fed, or with incomplete supplement data.).
See page 23 for footnotes.
What We Eat in America, NHANES 2013-2014
Table 38. Total Nutrient Intakes: Percent Reporting and Mean Amounts1 of Selected2 Vitamins and Minerals from Food and Beverages3 and Dietary Supplements4,by Race/Ethnicity and Age, in the United States, 2013-2014 (continued)
L u t e i n + z e a x a n t h i n
──────────────── All Individuals 5 ──────────────── ────────────── Supplement Users 6 ────────────── ─ Non-users 7 ─
Race/ethnicityand age
Percentreporting
supplementlutein +
zeaxanthin 8
SampleSize Food Supplement
Food plussupplement
Samplesize Food Supplement
Food plussupplement Food
(years) % (SE) µg (SE) µg (SE) µg (SE) µg (SE) µg (SE) µg (SE) µg (SE)
Non-Hispanic White:2 - 19.............. 1* (0.5) 799 928 (81.9) 6* (3.3) 934 (82.3) -- -- -- 924 (83.6)
20 and over.......... 13 (0.9) 2146 1655 (114.8) 106 (13.1) 1761 (111.7) 263 2085 (136.2) 841 (85.8) 2927 (160.5) 1593 (133.7)
2 and over... 10 (0.7) 2945 1504 (89.3) 85 (10.1) 1589 (86.9) 274 2064 (126.8) 832 (82.8) 2895 (148.7) 1439 (102.6)
Non-Hispanic Black:2 - 19.............. 0* (0.0) 745 898 (105.4) 0* (0.0) 898 (105.4) -- -- -- 898 (105.4)
20 and over.......... 6 (1.2) 970 1626 (100.7) 62* (19.2) 1688 (100.6) 61 1715 (465.6) 1022 (243.2) 2736 (485.5) 1620 (87.5)
2 and over... 4 (0.8) 1715 1415 (90.5) 44* (14.1) 1460 (93.0) 61 1715 (465.6) 1022 (243.2) 2736 (485.5) 1402 (81.9)
Non-Hispanic Asian 9:
2 - 19.............. 4* (0.4) 259 1085 (165.3) 14* (5.7) 1100 (162.3) -- -- -- 1073 (164.1)20 and over.......... 11 (1.4) 492 2553 (324.6) 244* (98.2) 2797 (356.5) -- -- -- 2447 (371.5)
2 and over... 9 (1.1) 751 2208 (254.4) 190* (79.6) 2398 (290.7) -- -- -- 2104 (280.7)
Hispanic:2 - 19.............. # 981 706 (44.4) 2* (1.7) 708 (45.2) -- -- -- 706 (44.6)
20 and over.......... 5 (0.6) 1076 1500 (142.9) 48 (14.3) 1548 (141.7) -- -- -- 1483 (153.5)
2 and over... 3 (0.4) 2057 1229 (96.3) 32 (9.4) 1261 (95.6) 61 1824 (258.7) 995 (271.0) 2818 (365.0) 1209 (100.5)

Page 14 of 23Available: www.ars.usda.gov/nea/bhnrc/fsrg.
DATA SOURCE: What We Eat in America, NHANES 2013-2014, day 1 food and supplement intake data, 2 years and over (excluding individuals pregnant, lactating, breast-fed, or with incomplete supplement data.).
See page 23 for footnotes.
What We Eat in America, NHANES 2013-2014
Table 38. Total Nutrient Intakes: Percent Reporting and Mean Amounts1 of Selected2 Vitamins and Minerals from Food and Beverages3 and Dietary Supplements4,by Race/Ethnicity and Age, in the United States, 2013-2014 (continued)
C a l c i u m
──────────────── All Individuals 5 ──────────────── ────────────── Supplement Users 6 ────────────── ─ Non-users 7 ─
Race/ethnicityand age
Percentreporting
supplementcalcium 8
SampleSize Food Supplement
Food plussupplement
Samplesize Food Supplement
Food plussupplement Food
(years) % (SE) mg (SE) mg (SE) mg (SE) mg (SE) mg (SE) mg (SE) mg (SE)
Non-Hispanic White:2 - 19.............. 10 (1.0) 799 1064 (28.9) 18 (3.7) 1083 (28.4) 82 1197 (99.0) 186 (25.7) 1383 (93.5) 1050 (35.5)
20 and over.......... 38 (1.6) 2146 999 (18.5) 189 (10.7) 1188 (25.0) 765 1053 (22.0) 497 (15.6) 1550 (29.8) 966 (23.7)
2 and over... 32 (1.2) 2945 1013 (16.9) 153 (8.4) 1166 (21.6) 847 1063 (23.6) 477 (14.6) 1539 (32.0) 989 (20.8)
Non-Hispanic Black:2 - 19.............. 4 (1.3) 745 873 (26.4) 10* (3.2) 883 (26.4) -- -- -- 863 (29.3)
20 and over.......... 19 (1.1) 970 825 (20.5) 85 (8.6) 909 (22.5) 194 888 (38.2) 437 (32.4) 1325 (41.7) 809 (21.6)
2 and over... 15 (0.7) 1715 839 (18.8) 63 (5.9) 902 (20.0) 236 904 (38.5) 421 (29.6) 1325 (42.3) 827 (19.7)
Non-Hispanic Asian 9:
2 - 19.............. 13 (1.5) 259 985 (47.4) 31 (6.8) 1016 (46.8) -- -- -- 957 (46.6)20 and over.......... 29 (2.1) 492 733 (26.8) 134 (14.7) 867 (26.9) 143 779 (36.1) 457 (37.7) 1237 (53.7) 714 (35.5)
2 and over... 26 (1.8) 751 792 (27.6) 110 (12.1) 902 (26.2) 167 827 (35.0) 429 (30.4) 1256 (45.8) 780 (33.7)
Hispanic:2 - 19.............. 4 (0.9) 981 1035 (25.6) 10 (2.3) 1045 (25.9) -- -- -- 1037 (25.3)
20 and over.......... 16 (1.1) 1076 1017 (26.2) 60 (7.4) 1077 (28.4) 190 1007 (75.5) 371 (31.8) 1378 (55.3) 1019 (27.1)
2 and over... 12 (0.9) 2057 1023 (22.2) 43 (5.3) 1066 (23.1) 233 1005 (71.6) 354 (25.8) 1359 (53.9) 1025 (21.5)

Page 15 of 23Available: www.ars.usda.gov/nea/bhnrc/fsrg.
DATA SOURCE: What We Eat in America, NHANES 2013-2014, day 1 food and supplement intake data, 2 years and over (excluding individuals pregnant, lactating, breast-fed, or with incomplete supplement data.).
See page 23 for footnotes.
What We Eat in America, NHANES 2013-2014
Table 38. Total Nutrient Intakes: Percent Reporting and Mean Amounts1 of Selected2 Vitamins and Minerals from Food and Beverages3 and Dietary Supplements4,by Race/Ethnicity and Age, in the United States, 2013-2014 (continued)
P h o s p h o r u s
──────────────── All Individuals 5 ──────────────── ────────────── Supplement Users 6 ────────────── ─ Non-users 7 ─
Race/ethnicityand age
Percentreporting
supplementphosphorus 8
SampleSize Food Supplement
Food plussupplement
Samplesize Food Supplement
Food plussupplement Food
(years) % (SE) mg (SE) mg (SE) mg (SE) mg (SE) mg (SE) mg (SE) mg (SE)
Non-Hispanic White:2 - 19.............. 3 (0.8) 799 1296 (25.7) 3* (1.2) 1299 (25.4) -- -- -- 1294 (27.2)
20 and over.......... 16 (1.0) 2146 1411 (14.5) 8 (0.8) 1419 (14.9) 333 1515 (41.9) 48 (4.3) 1563 (42.5) 1391 (16.6)
2 and over... 13 (0.9) 2945 1387 (13.5) 7 (0.6) 1394 (13.7) 361 1510 (40.3) 50 (3.7) 1560 (40.1) 1369 (15.0)
Non-Hispanic Black:2 - 19.............. 1* (0.4) 745 1165 (21.9) # 1166 (21.9) -- -- -- 1158 (22.0)
20 and over.......... 7 (1.0) 970 1311 (26.4) 3 (0.5) 1314 (26.2) 76 1389 (102.8) 38 (3.2) 1427 (104.3) 1305 (31.0)
2 and over... 5 (0.8) 1715 1269 (20.3) 2 (0.4) 1271 (20.2) 81 1420 (104.0) 39 (2.9) 1458 (105.7) 1261 (24.3)
Non-Hispanic Asian 9:
2 - 19.............. 5* (2.3) 259 1273 (49.0) 4* (2.1) 1278 (49.1) -- -- -- 1261 (51.0)20 and over.......... 12 (1.0) 492 1238 (31.1) 5 (0.8) 1243 (31.1) -- -- -- 1239 (36.0)
2 and over... 10 (0.8) 751 1246 (30.8) 5 (0.9) 1251 (31.0) 69 1260 (59.5) 46 (7.1) 1306 (58.9) 1245 (34.1)
Hispanic:2 - 19.............. 1* (0.4) 981 1303 (29.1) 1* (0.4) 1304 (29.0) -- -- -- 1303 (29.9)
20 and over.......... 6 (0.6) 1076 1483 (33.5) 3 (0.7) 1486 (33.4) 76 1354 (100.6) 52 (10.6) 1406 (93.6) 1492 (32.4)
2 and over... 4 (0.3) 2057 1422 (30.4) 2 (0.4) 1424 (30.3) 86 1354 (90.9) 54 (9.7) 1408 (83.6) 1425 (29.6)

Page 16 of 23Available: www.ars.usda.gov/nea/bhnrc/fsrg.
DATA SOURCE: What We Eat in America, NHANES 2013-2014, day 1 food and supplement intake data, 2 years and over (excluding individuals pregnant, lactating, breast-fed, or with incomplete supplement data.).
See page 23 for footnotes.
What We Eat in America, NHANES 2013-2014
Table 38. Total Nutrient Intakes: Percent Reporting and Mean Amounts1 of Selected2 Vitamins and Minerals from Food and Beverages3 and Dietary Supplements4,by Race/Ethnicity and Age, in the United States, 2013-2014 (continued)
M a g n e s i u m
──────────────── All Individuals 5 ──────────────── ────────────── Supplement Users 6 ────────────── ─ Non-users 7 ─
Race/ethnicityand age
Percentreporting
supplementmagnesium 8
SampleSize Food Supplement
Food plussupplement
Samplesize Food Supplement
Food plussupplement Food
(years) % (SE) mg (SE) mg (SE) mg (SE) mg (SE) mg (SE) mg (SE) mg (SE)
Non-Hispanic White:2 - 19.............. 7 (1.1) 799 238 (4.3) 4 (1.0) 241 (4.3) 61 337 (61.0) 51 (12.7) 388 (64.4) 230 (5.2)
20 and over.......... 30 (1.4) 2146 307 (4.3) 32 (2.8) 339 (5.2) 588 331 (7.3) 108 (9.0) 439 (11.5) 297 (4.6)
2 and over... 25 (1.2) 2945 293 (4.0) 26 (2.5) 319 (5.0) 649 332 (8.0) 104 (8.7) 436 (11.3) 280 (4.2)
Non-Hispanic Black:2 - 19.............. 2* (0.5) 745 218 (3.9) 4* (2.3) 222 (4.6) -- -- -- 216 (4.0)
20 and over.......... 15 (0.7) 970 279 (5.2) 14 (1.0) 294 (5.3) 150 309 (15.6) 98 (6.1) 407 (14.6) 274 (6.5)
2 and over... 11 (0.5) 1715 261 (3.7) 11 (1.0) 273 (3.6) 163 311 (13.2) 102 (9.3) 413 (11.9) 255 (4.2)
Non-Hispanic Asian 9:
2 - 19.............. 7 (0.8) 259 259 (12.6) 4 (0.9) 263 (12.9) -- -- -- 256 (12.7)20 and over.......... 20 (1.9) 492 310 (8.7) 19 (2.5) 328 (9.7) 99 352 (24.7) 94 (8.1) 446 (28.8) 299 (8.6)
2 and over... 17 (1.5) 751 298 (8.8) 15 (2.1) 313 (9.7) 113 348 (24.3) 90 (8.0) 438 (29.0) 287 (8.4)
Hispanic:2 - 19.............. 3 (0.7) 981 238 (5.8) 1* (0.4) 239 (5.9) -- -- -- 237 (5.8)
20 and over.......... 12 (1.0) 1076 318 (7.1) 11 (1.9) 330 (7.8) 143 318 (20.6) 93 (16.4) 411 (24.2) 318 (7.0)
2 and over... 9 (0.7) 2057 291 (6.6) 8 (1.4) 299 (7.1) 172 313 (20.6) 88 (13.7) 401 (22.5) 289 (6.2)

Page 17 of 23Available: www.ars.usda.gov/nea/bhnrc/fsrg.
DATA SOURCE: What We Eat in America, NHANES 2013-2014, day 1 food and supplement intake data, 2 years and over (excluding individuals pregnant, lactating, breast-fed, or with incomplete supplement data.).
See page 23 for footnotes.
What We Eat in America, NHANES 2013-2014
Table 38. Total Nutrient Intakes: Percent Reporting and Mean Amounts1 of Selected2 Vitamins and Minerals from Food and Beverages3 and Dietary Supplements4,by Race/Ethnicity and Age, in the United States, 2013-2014 (continued)
I r o n
──────────────── All Individuals 5 ──────────────── ────────────── Supplement Users 6 ────────────── ─ Non-users 7 ─
Race/ethnicityand age
Percentreporting
supplementiron 8
SampleSize Food Supplement
Food plussupplement
Samplesize Food Supplement
Food plussupplement Food
(years) % (SE) mg (SE) mg (SE) mg (SE) mg (SE) mg (SE) mg (SE) mg (SE)
Non-Hispanic White:2 - 19.............. 5 (0.9) 799 13.9 (0.35) 0.9* (0.31) 14.8 (0.44) -- -- -- 13.7 (0.39)
20 and over.......... 17 (1.3) 2146 14.6 (0.20) 3.7 (0.34) 18.3 (0.36) 346 14.7 (0.52) 21.7 (1.21) 36.4 (1.26) 14.6 (0.24)
2 and over... 15 (1.0) 2945 14.4 (0.19) 3.2 (0.28) 17.6 (0.30) 390 14.8 (0.51) 21.5 (1.27) 36.4 (1.29) 14.4 (0.22)
Non-Hispanic Black:2 - 19.............. 5 (1.4) 745 13.7 (0.23) 0.8* (0.27) 14.6 (0.38) -- -- -- 13.6 (0.20)
20 and over.......... 10 (1.1) 970 14.2 (0.24) 3.2 (0.36) 17.3 (0.43) 103 15.2 (0.87) 30.8 (3.23) 46.0 (3.47) 14.0 (0.21)
2 and over... 9 (0.7) 1715 14.0 (0.18) 2.5 (0.28) 16.5 (0.33) 144 15.5 (0.81) 28.8 (2.72) 44.3 (2.75) 13.9 (0.16)
Non-Hispanic Asian 9:
2 - 19.............. 9 (1.1) 259 13.6 (0.72) 1.8 (0.20) 15.5 (0.78) -- -- -- 13.1 (0.70)20 and over.......... 12 (1.2) 492 13.5 (0.28) 2.1 (0.35) 15.6 (0.48) -- -- -- 13.5 (0.34)
2 and over... 11 (0.9) 751 13.5 (0.34) 2.0 (0.29) 15.6 (0.50) 68 14.6 (1.19) 18.2 (1.76) 32.8 (2.42) 13.4 (0.38)
Hispanic:2 - 19.............. 4 (0.5) 981 14.3 (0.40) 0.7 (0.11) 15.0 (0.40) -- -- -- 14.3 (0.41)
20 and over.......... 8 (0.8) 1076 15.1 (0.29) 1.7 (0.28) 16.8 (0.48) 96 13.6 (0.84) 21.2 (2.48) 34.8 (2.35) 15.2 (0.32)
2 and over... 7 (0.6) 2057 14.8 (0.25) 1.4 (0.21) 16.2 (0.36) 130 13.4 (0.71) 21.0 (1.96) 34.5 (1.77) 14.9 (0.27)

Page 18 of 23Available: www.ars.usda.gov/nea/bhnrc/fsrg.
DATA SOURCE: What We Eat in America, NHANES 2013-2014, day 1 food and supplement intake data, 2 years and over (excluding individuals pregnant, lactating, breast-fed, or with incomplete supplement data.).
See page 23 for footnotes.
What We Eat in America, NHANES 2013-2014
Table 38. Total Nutrient Intakes: Percent Reporting and Mean Amounts1 of Selected2 Vitamins and Minerals from Food and Beverages3 and Dietary Supplements4,by Race/Ethnicity and Age, in the United States, 2013-2014 (continued)
Z i n c
──────────────── All Individuals 5 ──────────────── ────────────── Supplement Users 6 ────────────── ─ Non-users 7 ─
Race/ethnicityand age
Percentreporting
supplementzinc 8
SampleSize Food Supplement
Food plussupplement
Samplesize Food Supplement
Food plussupplement Food
(years) % (SE) mg (SE) mg (SE) mg (SE) mg (SE) mg (SE) mg (SE) mg (SE)
Non-Hispanic White:2 - 19.............. 19 (2.2) 799 10.3 (0.23) 1.0 (0.15) 11.3 (0.27) 146 12.2 (1.78) 5.4 (0.71) 17.6 (2.29) 9.9 (0.34)
20 and over.......... 30 (1.5) 2146 11.3 (0.13) 5.0 (0.25) 16.3 (0.31) 605 11.4 (0.30) 16.5 (0.65) 27.9 (0.79) 11.3 (0.13)
2 and over... 28 (1.1) 2945 11.1 (0.14) 4.2 (0.19) 15.3 (0.26) 751 11.5 (0.38) 15.0 (0.64) 26.5 (0.80) 10.9 (0.17)
Non-Hispanic Black:2 - 19.............. 9 (2.2) 745 9.4 (0.17) 0.6 (0.18) 10.1 (0.23) 87 10.6 (1.08) 6.7 (0.67) 17.3 (1.58) 9.3 (0.17)
20 and over.......... 17 (0.9) 970 10.5 (0.26) 2.7 (0.12) 13.3 (0.33) 165 10.9 (0.42) 16.3 (0.70) 27.2 (0.90) 10.5 (0.29)
2 and over... 15 (0.6) 1715 10.2 (0.17) 2.1 (0.11) 12.3 (0.23) 252 10.9 (0.27) 14.5 (0.32) 25.4 (0.46) 10.1 (0.19)
Non-Hispanic Asian 9:
2 - 19.............. 26 (3.9) 259 10.7 (0.80) 1.3 (0.35) 12.0 (0.91) -- -- -- 10.9 (0.97)20 and over.......... 22 (2.1) 492 10.2 (0.25) 3.8 (0.63) 14.0 (0.59) 108 11.0 (0.57) 17.4 (1.77) 28.4 (1.89) 10.0 (0.30)
2 and over... 23 (1.9) 751 10.3 (0.33) 3.2 (0.48) 13.6 (0.53) 157 10.8 (0.54) 14.1 (1.38) 24.9 (1.48) 10.2 (0.34)
Hispanic:2 - 19.............. 10 (1.6) 981 10.0 (0.27) 0.6 (0.11) 10.7 (0.35) 96 9.3 (0.42) 6.8 (1.06) 16.0 (1.15) 10.1 (0.28)
20 and over.......... 13 (1.0) 1076 11.6 (0.25) 1.7 (0.18) 13.3 (0.37) 142 11.0 (0.96) 13.9 (0.87) 24.9 (1.23) 11.7 (0.30)
2 and over... 12 (0.8) 2057 11.0 (0.23) 1.4 (0.14) 12.4 (0.32) 238 10.5 (0.70) 11.9 (0.90) 22.4 (0.92) 11.1 (0.25)

Page 19 of 23Available: www.ars.usda.gov/nea/bhnrc/fsrg.
DATA SOURCE: What We Eat in America, NHANES 2013-2014, day 1 food and supplement intake data, 2 years and over (excluding individuals pregnant, lactating, breast-fed, or with incomplete supplement data.).
See page 23 for footnotes.
What We Eat in America, NHANES 2013-2014
Table 38. Total Nutrient Intakes: Percent Reporting and Mean Amounts1 of Selected2 Vitamins and Minerals from Food and Beverages3 and Dietary Supplements4,by Race/Ethnicity and Age, in the United States, 2013-2014 (continued)
C o p p e r
──────────────── All Individuals 5 ──────────────── ────────────── Supplement Users 6 ────────────── ─ Non-users 7 ─
Race/ethnicityand age
Percentreporting
supplementcopper 8
SampleSize Food Supplement
Food plussupplement
Samplesize Food Supplement
Food plussupplement Food
(years) % (SE) mg (SE) mg (SE) mg (SE) mg (SE) mg (SE) mg (SE) mg (SE)
Non-Hispanic White:2 - 19.............. 6 (0.8) 799 0.9 (0.02) 0.1 (0.02) 1.0 (0.03) -- -- -- 0.9 (0.02)
20 and over.......... 28 (1.6) 2146 1.2 (0.02) 0.4 (0.02) 1.6 (0.03) 550 1.3 (0.04) 1.3 (0.02) 2.6 (0.05) 1.2 (0.02)
2 and over... 23 (1.2) 2945 1.2 (0.02) 0.3 (0.02) 1.5 (0.03) 601 1.3 (0.04) 1.3 (0.03) 2.6 (0.05) 1.1 (0.01)
Non-Hispanic Black:2 - 19.............. 4 (1.1) 745 0.9 (0.02) 0.2* (0.10) 1.0 (0.09) -- -- -- 0.8 (0.02)
20 and over.......... 14 (0.7) 970 1.1 (0.03) 0.2 (0.02) 1.3 (0.03) 141 1.3 (0.06) 1.4 (0.11) 2.7 (0.10) 1.1 (0.03)
2 and over... 11 (0.6) 1715 1.1 (0.02) 0.2 (0.04) 1.2 (0.03) 175 1.3 (0.05) 1.7 (0.29) 3.0 (0.28) 1.0 (0.02)
Non-Hispanic Asian 9:
2 - 19.............. 8 (1.8) 259 1.1 (0.07) 0.1 (0.03) 1.2 (0.09) -- -- -- 1.1 (0.07)20 and over.......... 20 (1.8) 492 1.4 (0.04) 0.3 (0.04) 1.7 (0.07) 97 1.6 (0.13) 1.4 (0.08) 2.9 (0.17) 1.4 (0.04)
2 and over... 17 (1.5) 751 1.3 (0.04) 0.2 (0.03) 1.6 (0.06) 111 1.6 (0.12) 1.4 (0.08) 2.9 (0.16) 1.3 (0.04)
Hispanic:2 - 19.............. 3 (0.6) 981 0.9 (0.03) 0.1 (0.01) 1.0 (0.03) -- -- -- 0.9 (0.02)
20 and over.......... 11 (1.1) 1076 1.3 (0.03) 0.2 (0.02) 1.4 (0.04) 129 1.2 (0.07) 1.4 (0.12) 2.6 (0.10) 1.3 (0.04)
2 and over... 9 (0.8) 2057 1.1 (0.03) 0.1 (0.02) 1.3 (0.03) 159 1.2 (0.08) 1.5 (0.13) 2.6 (0.09) 1.1 (0.03)

Page 20 of 23Available: www.ars.usda.gov/nea/bhnrc/fsrg.
DATA SOURCE: What We Eat in America, NHANES 2013-2014, day 1 food and supplement intake data, 2 years and over (excluding individuals pregnant, lactating, breast-fed, or with incomplete supplement data.).
See page 23 for footnotes.
What We Eat in America, NHANES 2013-2014
Table 38. Total Nutrient Intakes: Percent Reporting and Mean Amounts1 of Selected2 Vitamins and Minerals from Food and Beverages3 and Dietary Supplements4,by Race/Ethnicity and Age, in the United States, 2013-2014 (continued)
S o d i u m
──────────────── All Individuals 5 ──────────────── ────────────── Supplement Users 6 ────────────── ─ Non-users 7 ─
Race/ethnicityand age
Percentreporting
supplementsodium 8
SampleSize Food Supplement
Food plussupplement
Samplesize Food Supplement
Food plussupplement Food
(years) % (SE) mg (SE) mg (SE) mg (SE) mg (SE) mg (SE) mg (SE) mg (SE)
Non-Hispanic White:2 - 19.............. 6 (1.0) 799 3033 (63.3) 1 (0.2) 3033 (63.4) -- -- -- 3052 (66.4)
20 and over.......... 8 (0.8) 2146 3506 (33.2) 3 (0.5) 3509 (33.2) 150 3387 (109.5) 34 (4.3) 3421 (107.8) 3517 (38.0)
2 and over... 8 (0.6) 2945 3408 (32.3) 2 (0.4) 3410 (32.2) 208 3285 (107.7) 30 (3.8) 3315 (106.7) 3418 (34.7)
Non-Hispanic Black:2 - 19.............. 4 (1.2) 745 3040 (61.0) # 3040 (61.0) -- -- -- 3033 (59.5)
20 and over.......... 3 (0.7) 970 3532 (73.6) 1* (0.4) 3533 (73.8) -- -- -- 3531 (71.1)
2 and over... 4 (0.6) 1715 3389 (64.0) 1* (0.3) 3390 (64.1) 72 3427 (285.9) 24 (7.0) 3451 (289.9) 3388 (62.3)
Non-Hispanic Asian 9:
2 - 19.............. 8 (3.6) 259 3152 (158.5) 1* (0.4) 3153 (158.5) -- -- -- 3205 (172.4)20 and over.......... 4 (1.5) 492 3673 (135.8) 1* (0.6) 3675 (135.7) -- -- -- 3688 (145.4)
2 and over... 5 (0.8) 751 3551 (111.3) 1* (0.4) 3552 (111.3) -- -- -- 3578 (122.3)
Hispanic:2 - 19.............. 2 (0.8) 981 3060 (76.9) # 3060 (76.9) -- -- -- 3068 (78.0)
20 and over.......... 4 (0.5) 1076 3604 (66.3) 1 (0.3) 3605 (66.4) -- -- -- 3593 (68.1)
2 and over... 3 (0.4) 2057 3418 (56.0) 1 (0.2) 3419 (56.1) 73 3586 (143.8) 28 (5.4) 3614 (142.8) 3412 (55.1)

Page 21 of 23Available: www.ars.usda.gov/nea/bhnrc/fsrg.
DATA SOURCE: What We Eat in America, NHANES 2013-2014, day 1 food and supplement intake data, 2 years and over (excluding individuals pregnant, lactating, breast-fed, or with incomplete supplement data.).
See page 23 for footnotes.
What We Eat in America, NHANES 2013-2014
Table 38. Total Nutrient Intakes: Percent Reporting and Mean Amounts1 of Selected2 Vitamins and Minerals from Food and Beverages3 and Dietary Supplements4,by Race/Ethnicity and Age, in the United States, 2013-2014 (continued)
P o t a s s i u m
──────────────── All Individuals 5 ──────────────── ────────────── Supplement Users 6 ────────────── ─ Non-users 7 ─
Race/ethnicityand age
Percentreporting
supplementpotassium 8
SampleSize Food Supplement
Food plussupplement
Samplesize Food Supplement
Food plussupplement Food
(years) % (SE) mg (SE) mg (SE) mg (SE) mg (SE) mg (SE) mg (SE) mg (SE)
Non-Hispanic White:2 - 19.............. 2 (0.7) 799 2177 (33.1) 1* (0.4) 2178 (33.0) -- -- -- 2145 (39.0)
20 and over.......... 19 (1.0) 2146 2702 (34.0) 17 (1.5) 2719 (34.5) 383 3030 (106.1) 88 (6.9) 3118 (107.2) 2624 (28.6)
2 and over... 16 (0.9) 2945 2593 (33.4) 14 (1.2) 2606 (33.8) 401 3046 (100.3) 86 (6.9) 3132 (101.5) 2508 (29.6)
Non-Hispanic Black:2 - 19.............. # 745 1976 (39.2) # 1977 (39.2) -- -- -- 1969 (39.6)
20 and over.......... 9 (1.1) 970 2449 (41.5) 9 (1.1) 2458 (41.5) 97 2872 (153.9) 93 (7.9) 2965 (151.7) 2406 (40.8)
2 and over... 7 (0.8) 1715 2313 (32.6) 6 (0.8) 2319 (32.7) 100 2885 (146.7) 92 (8.0) 2977 (144.5) 2271 (30.1)
Non-Hispanic Asian 9:
2 - 19.............. 3* (1.6) 259 2359 (94.7) 2* (1.6) 2361 (94.6) -- -- -- 2343 (99.1)20 and over.......... 13 (1.1) 492 2585 (57.2) 11 (1.8) 2596 (56.8) 60 2988 (280.8) 90 (9.2) 3078 (278.7) 2526 (69.5)
2 and over... 10 (1.0) 751 2532 (54.4) 9 (1.6) 2541 (54.1) 66 2981 (261.9) 88 (8.7) 3069 (259.7) 2479 (64.9)
Hispanic:2 - 19.............. 1* (0.3) 981 2246 (47.3) # 2247 (47.2) -- -- -- 2249 (47.3)
20 and over.......... 7 (0.8) 1076 2697 (65.7) 5 (0.6) 2702 (66.0) 82 2869 (256.0) 78 (4.7) 2947 (256.9) 2685 (64.2)
2 and over... 5 (0.6) 2057 2543 (55.5) 3 (0.4) 2546 (55.7) 90 2819 (239.8) 77 (4.3) 2896 (240.1) 2530 (52.8)

Page 22 of 23Available: www.ars.usda.gov/nea/bhnrc/fsrg.
DATA SOURCE: What We Eat in America, NHANES 2013-2014, day 1 food and supplement intake data, 2 years and over (excluding individuals pregnant, lactating, breast-fed, or with incomplete supplement data.).
See page 23 for footnotes.
What We Eat in America, NHANES 2013-2014
Table 38. Total Nutrient Intakes: Percent Reporting and Mean Amounts1 of Selected2 Vitamins and Minerals from Food and Beverages3 and Dietary Supplements4,by Race/Ethnicity and Age, in the United States, 2013-2014 (continued)
S e l e n i u m
──────────────── All Individuals 5 ──────────────── ────────────── Supplement Users 6 ────────────── ─ Non-users 7 ─
Race/ethnicityand age
Percentreporting
supplementselenium 8
SampleSize Food Supplement
Food plussupplement
Samplesize Food Supplement
Food plussupplement Food
(years) % (SE) µg (SE) µg (SE) µg (SE) µg (SE) µg (SE) µg (SE) µg (SE)
Non-Hispanic White:2 - 19.............. 3 (0.6) 799 97.3 (2.04) 2.7 (0.66) 100.0 (2.07) -- -- -- 94.4 (2.30)
20 and over.......... 26 (1.5) 2146 115.1 (0.69) 19.0 (1.51) 134.0 (1.72) 522 115.3 (3.40) 71.7 (3.03) 187.0 (5.73) 115.0 (1.29)
2 and over... 22 (1.3) 2945 111.4 (0.88) 15.6 (1.18) 127.0 (1.42) 546 117.5 (3.73) 71.9 (3.21) 189.4 (6.13) 109.7 (1.44)
Non-Hispanic Black:2 - 19.............. 1* (0.4) 745 95.6 (2.16) 0.7* (0.31) 96.3 (2.15) -- -- -- 95.3 (2.16)
20 and over.......... 13 (0.7) 970 119.9 (2.70) 10.5 (0.51) 130.4 (2.95) 138 122.8 (5.09) 78.4 (4.67) 201.2 (9.04) 119.5 (2.85)
2 and over... 10 (0.5) 1715 112.9 (2.24) 7.6 (0.33) 120.5 (2.37) 146 122.6 (4.97) 77.3 (4.32) 199.9 (8.37) 111.8 (2.24)
Non-Hispanic Asian 9:
2 - 19.............. 5* (0.6) 259 114.5 (9.63) 3.0 (0.73) 117.5 (9.94) -- -- -- 113.6 (9.58)20 and over.......... 19 (1.8) 492 118.7 (2.89) 12.4 (1.53) 131.0 (2.86) 89 118.1 (6.72) 65.2 (3.21) 183.4 (6.80) 118.8 (2.86)
2 and over... 16 (1.4) 751 117.7 (3.52) 10.2 (1.20) 127.9 (3.58) 95 119.2 (6.33) 65.3 (3.18) 184.5 (6.65) 117.4 (3.67)
Hispanic:2 - 19.............. 1* (0.5) 981 98.3 (2.52) 0.8* (0.28) 99.0 (2.62) -- -- -- 98.4 (2.65)
20 and over.......... 11 (1.0) 1076 121.6 (2.50) 7.1 (0.79) 128.7 (2.90) 125 110.0 (8.44) 66.1 (4.92) 176.2 (12.67) 122.9 (2.60)
2 and over... 8 (0.8) 2057 113.6 (2.26) 5.0 (0.60) 118.6 (2.66) 135 109.1 (7.83) 65.9 (4.40) 175.0 (11.37) 114.0 (2.26)

What We Eat in America, NHANES 2013-2014
Page 23 of 23Page 23 of 23
Symbol Legend
* Indicates an estimate that may be less statistically reliable than estimates that are not flagged. The rules for flagging estimated means and percentages are as follows:
Mean: An estimated mean is flagged when the relative standard error is greater than 30 percent.
Percent reporting a supplement intake: An estimated percentage between 25 and 75 percent is flagged when based on a sample size of less than 30 times the variance inflation factor(VIF), where the VIF represents a broadly calculated average design effect, or when the relative standard error is greater than 30 percent. An estimated percentage less than or equal to 25percent or greater than or equal to 75 percent is flagged when the smaller of np and n(1-p) is less than 8 times the VIF, where n is the sample size and p is the percentage expressed as afraction. The VIF used in this table is 1.98.
# Indicates a non-zero value too small to report.
-- Estimated mean not presented where sample size is less than 30 times the variance inflation factor (VIF), i.e., sample size less than 59 for VIF = 1.98.
Footnotes
1 Sample weights designed for dietary analysis were used to allow estimates representative of the U. S. population for the years of collection.
2 Selection of the 22 vitamins, minerals, and carotenoids was based on the availability of Day 1 nutrient intakes from both food and dietary supplements. At the time of this release, supplementdata were not available for vitamin A, vitamin E, and other carotenoids.
Niacin: values do not include niacin-equivalents from tryptophan.Folic acid: the synthetic form of folate used as a fortificant in foods and dietary supplements.Folate (DFE): µg dietary folate equivalents = µg food folate + (1.7*µg folic acid).Vitamin D: 1 µg = 40 International Units (IU).Calcium and Magnesium: supplement intake includes non-prescription antacids.
3 Food and beverage intake was estimated from Day 1 dietary recall interviews conducted in the What We Eat in America, National Health and Nutrition Examination Survey (NHANES)2013-2014. The 24-hour dietary recalls were conducted in-person, by trained interviewers, using the USDA 5-step Automated Multiple-Pass Method. Food intakes were coded and nutrientvalues were determined using the USDA Food and Nutrient Database for Dietary Studies 2013-2014 www.ars.usda.gov/nea/bhnrc/fsrg.
4 Dietary supplement intake was estimated from the Day 1 Total Dietary Supplements File (DS1TOT_h) of NHANES 2013-2014. Collected as part of the dietary supplement component of the24-hour dietary recall, intakes now reflect the same timeframe as the food and beverage intake. Data are collected on the usage of all vitamins, minerals, herbals, and other dietary supplements aswell as non-prescription antacids and calculated using the NHANES-Dietary Supplement Database. Documentation available at: http://www.cdc.gov/nchs/nhanes/nhanes2013-2014/DS1TOT_h.htm.
5 All Individuals: includes both supplement users and non-users 2 years and over. Pregnant and/or lactating females, breast-fed children, and individuals with incomplete dietary supplementcomponent of the 24-hour dietary recall were excluded.
6 Supplement Users: includes individuals who reported taking at least one multi- and/or single-nutrient supplement that contained the vitamin or mineral displayed on this page.
7 Non-users: includes individuals who did not report taking any dietary supplement that contained the vitamin or mineral displayed on this page. Non-users may include individuals that reportedother dietary supplements.
8 The weighted percentage of respondents in the race/ethnicity/age group who reported taking at least one multi- and /or single- nutrient supplement containing this nutrient.
9 A new sampling methodology was implemented for NHANES 2011-2012 to oversample non-Hispanic non-black Asians in addition to the ongoing oversample of Hispanics, non-Hispanicblacks, low-income whites/others, and whites/others 80+ years.
Abbreviations
SE = standard error; DFE = dietary folate equivalents.
Suggested Citation
U.S. Department of Agriculture, Agricultural Research Service. 2017. Total Nutrient Intakes: Percent Reporting and Mean Amounts of Selected Vitamins and Minerals from Food and Beveragesand Dietary Supplements, by Race/Ethnicity and Age, What We Eat in America, NHANES 2013-2014. Available: www.ars.usda.gov/nea/bhnrc/fsrg.

Page 1 of 23Available: www.ars.usda.gov/nea/bhnrc/fsrg.
DATA SOURCE: What We Eat in America, NHANES 2013-2014, day 1 food and supplement intake data, 2 years and over (excluding individuals pregnant, lactating, breast-fed, or with incomplete supplement data.).
See page 23 for footnotes.
What We Eat in America, NHANES 2013-2014
Table 39. Total Nutrient Intakes: Percent Reporting and Mean Amounts1 of Selected2 Vitamins and Minerals from Food and Beverages3 and Dietary Supplements4,by Family Income (in Dollars) and Age, in the United States, 2013-2014
T h i a m i n
──────────────── All Individuals 5 ──────────────── ────────────── Supplement Users 6 ────────────── ─ Non-users 7 ─
Family incomein dollarsand age
Percentreporting
supplementthiamin 8
SampleSize Food Supplement
Food plussupplement
Samplesize Food Supplement
Food plussupplement Food
(years) % (SE) mg (SE) mg (SE) mg (SE) mg (SE) mg (SE) mg (SE) mg (SE)
$0 - $24,999:2 - 19.............. 7 (1.5) 951 1.47 (0.040) 0.75* (0.403) 2.22 (0.392) -- -- -- 1.45 (0.048)
20 and over.......... 19 (1.7) 1482 1.58 (0.041) 5.05* (2.204) 6.63* (2.198) 271 1.57 (0.058) 25.97*(10.446) 27.54*(10.419) 1.58 (0.047)
2 and over... 16 (1.4) 2433 1.55 (0.026) 3.95* (1.654) 5.50* (1.654) 317 1.60 (0.056) 24.36* (9.461) 25.95* (9.441) 1.54 (0.029)
$25,000 - $74,999:2 - 19............... 6 (1.3) 1119 1.54 (0.044) 0.28* (0.134) 1.82 (0.160) 73 2.30 (0.635) 4.47* (1.730) 6.77* (2.307) 1.49 (0.035)
20 and over.......... 24 (1.5) 1799 1.64 (0.026) 6.22* (2.408) 7.85* (2.412) 366 1.66 (0.064) 25.60* (9.463) 27.26* (9.462) 1.63 (0.025)
2 and over... 20 (1.4) 2918 1.61 (0.024) 4.81* (1.883) 6.42 (1.891) 439 1.71 (0.068) 24.06* (8.923) 25.76* (8.962) 1.59 (0.024)
$75,000 and higher:2 - 19.............. 7 (1.7) 747 1.65 (0.049) 0.22* (0.084) 1.86 (0.104) -- -- -- 1.64 (0.050)
20 and over.......... 28 (2.2) 1253 1.65 (0.029) 3.66 (0.602) 5.31 (0.612) 300 1.75 (0.071) 13.16 (2.440) 14.91 (2.444) 1.61 (0.029)
2 and over... 23 (1.6) 2000 1.65 (0.024) 2.79 (0.431) 4.44 (0.438) 352 1.75 (0.068) 12.32 (2.053) 14.07 (2.057) 1.62 (0.026)
All Individuals 9:2 - 19.............. 7 (0.5) 2974 1.57 (0.027) 0.41* (0.127) 1.98 (0.124) 177 1.99 (0.223) 6.17* (2.035) 8.16 (2.155) 1.54 (0.028)
20 and over.......... 24 (1.2) 4830 1.62 (0.018) 4.84 (1.097) 6.47 (1.103) 991 1.67 (0.037) 20.13 (4.247) 21.80 (4.253) 1.61 (0.022)
2 and over... 20 (0.9) 7804 1.61 (0.018) 3.75 (0.842) 5.36 (0.850) 1168 1.70 (0.039) 18.97 (3.958) 20.66 (3.975) 1.59 (0.021)
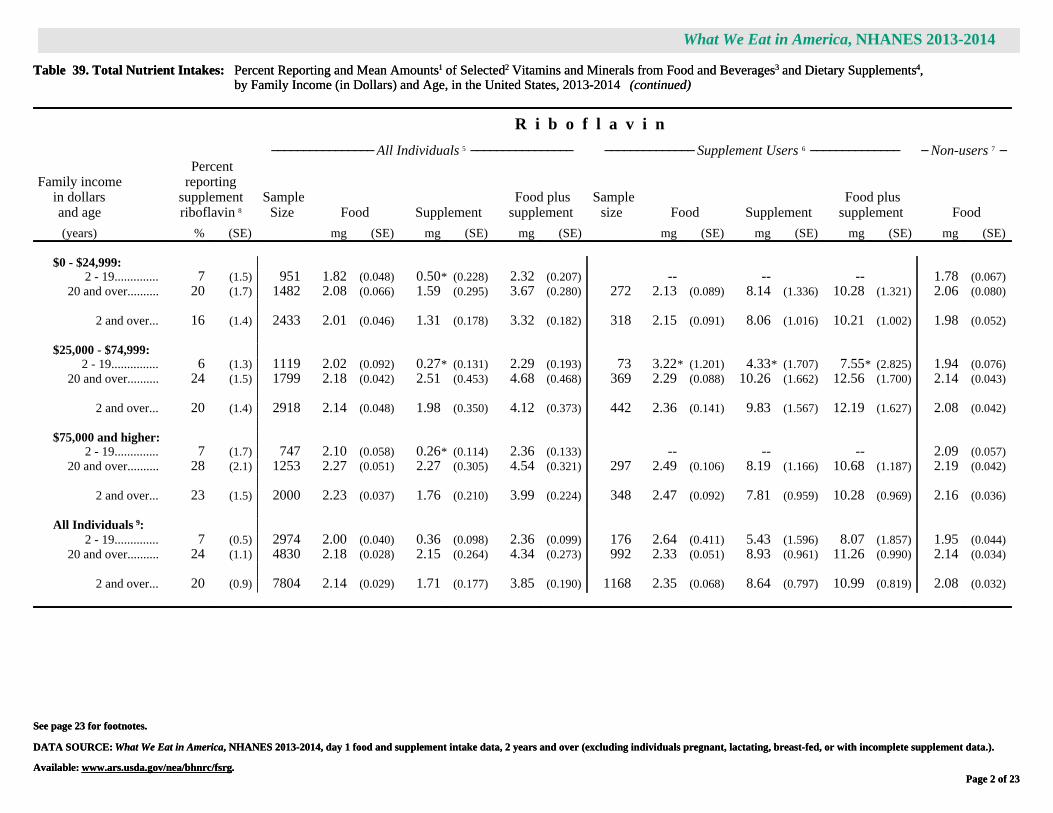
Page 2 of 23Available: www.ars.usda.gov/nea/bhnrc/fsrg.
DATA SOURCE: What We Eat in America, NHANES 2013-2014, day 1 food and supplement intake data, 2 years and over (excluding individuals pregnant, lactating, breast-fed, or with incomplete supplement data.).
See page 23 for footnotes.
What We Eat in America, NHANES 2013-2014
Table 39. Total Nutrient Intakes: Percent Reporting and Mean Amounts1 of Selected2 Vitamins and Minerals from Food and Beverages3 and Dietary Supplements4,by Family Income (in Dollars) and Age, in the United States, 2013-2014 (continued)
R i b o f l a v i n
──────────────── All Individuals 5 ──────────────── ────────────── Supplement Users 6 ────────────── ─ Non-users 7 ─
Family incomein dollarsand age
Percentreporting
supplementriboflavin 8
SampleSize Food Supplement
Food plussupplement
Samplesize Food Supplement
Food plussupplement Food
(years) % (SE) mg (SE) mg (SE) mg (SE) mg (SE) mg (SE) mg (SE) mg (SE)
$0 - $24,999:2 - 19.............. 7 (1.5) 951 1.82 (0.048) 0.50* (0.228) 2.32 (0.207) -- -- -- 1.78 (0.067)
20 and over.......... 20 (1.7) 1482 2.08 (0.066) 1.59 (0.295) 3.67 (0.280) 272 2.13 (0.089) 8.14 (1.336) 10.28 (1.321) 2.06 (0.080)
2 and over... 16 (1.4) 2433 2.01 (0.046) 1.31 (0.178) 3.32 (0.182) 318 2.15 (0.091) 8.06 (1.016) 10.21 (1.002) 1.98 (0.052)
$25,000 - $74,999:2 - 19............... 6 (1.3) 1119 2.02 (0.092) 0.27* (0.131) 2.29 (0.193) 73 3.22* (1.201) 4.33* (1.707) 7.55* (2.825) 1.94 (0.076)
20 and over.......... 24 (1.5) 1799 2.18 (0.042) 2.51 (0.453) 4.68 (0.468) 369 2.29 (0.088) 10.26 (1.662) 12.56 (1.700) 2.14 (0.043)
2 and over... 20 (1.4) 2918 2.14 (0.048) 1.98 (0.350) 4.12 (0.373) 442 2.36 (0.141) 9.83 (1.567) 12.19 (1.627) 2.08 (0.042)
$75,000 and higher:2 - 19.............. 7 (1.7) 747 2.10 (0.058) 0.26* (0.114) 2.36 (0.133) -- -- -- 2.09 (0.057)
20 and over.......... 28 (2.1) 1253 2.27 (0.051) 2.27 (0.305) 4.54 (0.321) 297 2.49 (0.106) 8.19 (1.166) 10.68 (1.187) 2.19 (0.042)
2 and over... 23 (1.5) 2000 2.23 (0.037) 1.76 (0.210) 3.99 (0.224) 348 2.47 (0.092) 7.81 (0.959) 10.28 (0.969) 2.16 (0.036)
All Individuals 9:2 - 19.............. 7 (0.5) 2974 2.00 (0.040) 0.36 (0.098) 2.36 (0.099) 176 2.64 (0.411) 5.43 (1.596) 8.07 (1.857) 1.95 (0.044)
20 and over.......... 24 (1.1) 4830 2.18 (0.028) 2.15 (0.264) 4.34 (0.273) 992 2.33 (0.051) 8.93 (0.961) 11.26 (0.990) 2.14 (0.034)
2 and over... 20 (0.9) 7804 2.14 (0.029) 1.71 (0.177) 3.85 (0.190) 1168 2.35 (0.068) 8.64 (0.797) 10.99 (0.819) 2.08 (0.032)

Page 3 of 23Available: www.ars.usda.gov/nea/bhnrc/fsrg.
DATA SOURCE: What We Eat in America, NHANES 2013-2014, day 1 food and supplement intake data, 2 years and over (excluding individuals pregnant, lactating, breast-fed, or with incomplete supplement data.).
See page 23 for footnotes.
What We Eat in America, NHANES 2013-2014
Table 39. Total Nutrient Intakes: Percent Reporting and Mean Amounts1 of Selected2 Vitamins and Minerals from Food and Beverages3 and Dietary Supplements4,by Family Income (in Dollars) and Age, in the United States, 2013-2014 (continued)
N i a c i n
──────────────── All Individuals 5 ──────────────── ────────────── Supplement Users 6 ────────────── ─ Non-users 7 ─
Family incomein dollarsand age
Percentreporting
supplementniacin 8
SampleSize Food Supplement
Food plussupplement
Samplesize Food Supplement
Food plussupplement Food
(years) % (SE) mg (SE) mg (SE) mg (SE) mg (SE) mg (SE) mg (SE) mg (SE)
$0 - $24,999:2 - 19.............. 7 (1.5) 951 21.6 (0.83) 1.9* (0.65) 23.6 (0.81) -- -- -- 20.6 (0.74)
20 and over.......... 20 (1.7) 1482 25.2 (0.76) 8.0 (0.59) 33.2 (0.94) 281 25.7 (1.40) 39.5 (2.43) 65.3 (2.86) 25.1 (0.68)
2 and over... 17 (1.4) 2433 24.3 (0.56) 6.4 (0.47) 30.8 (0.82) 328 26.8 (1.71) 38.2 (2.37) 65.0 (3.39) 23.8 (0.47)
$25,000 - $74,999:2 - 19............... 7 (1.2) 1119 22.0 (0.85) 1.1 (0.23) 23.1 (0.92) 80 31.2 (8.99) 16.4 (0.92) 47.6 (9.62) 21.3 (0.75)
20 and over.......... 26 (1.6) 1799 27.2 (0.48) 10.8 (1.61) 38.0 (1.70) 394 26.3 (1.05) 41.4 (5.10) 67.7 (5.00) 27.5 (0.53)
2 and over... 21 (1.4) 2918 26.0 (0.50) 8.5 (1.20) 34.4 (1.29) 474 26.6 (1.28) 39.5 (4.75) 66.2 (4.70) 25.8 (0.50)
$75,000 and higher:2 - 19.............. 9 (1.8) 747 22.8 (1.14) 1.4 (0.28) 24.2 (1.16) -- -- -- 23.0 (1.14)
20 and over.......... 30 (2.3) 1253 26.7 (0.30) 9.8 (1.51) 36.5 (1.58) 328 27.9 (0.87) 32.3 (3.90) 60.2 (4.44) 26.2 (0.48)
2 and over... 25 (1.5) 2000 25.7 (0.41) 7.7 (1.10) 33.4 (1.06) 385 27.2 (0.84) 30.9 (3.63) 58.2 (4.11) 25.2 (0.56)
All Individuals 9:2 - 19.............. 7 (0.6) 2974 22.3 (0.44) 1.4 (0.18) 23.7 (0.53) 190 28.8 (4.20) 19.6 (2.49) 48.4 (5.91) 21.7 (0.46)
20 and over.......... 26 (1.3) 4830 26.5 (0.21) 9.6 (0.95) 36.1 (0.96) 1059 26.7 (0.38) 37.1 (2.59) 63.8 (2.55) 26.5 (0.28)
2 and over... 21 (1.0) 7804 25.5 (0.23) 7.6 (0.68) 33.0 (0.73) 1249 26.9 (0.63) 35.6 (2.23) 62.4 (2.37) 25.1 (0.28)

Page 4 of 23Available: www.ars.usda.gov/nea/bhnrc/fsrg.
DATA SOURCE: What We Eat in America, NHANES 2013-2014, day 1 food and supplement intake data, 2 years and over (excluding individuals pregnant, lactating, breast-fed, or with incomplete supplement data.).
See page 23 for footnotes.
What We Eat in America, NHANES 2013-2014
Table 39. Total Nutrient Intakes: Percent Reporting and Mean Amounts1 of Selected2 Vitamins and Minerals from Food and Beverages3 and Dietary Supplements4,by Family Income (in Dollars) and Age, in the United States, 2013-2014 (continued)
V i t a m i n B 6
──────────────── All Individuals 5 ──────────────── ────────────── Supplement Users 6 ────────────── ─ Non-users 7 ─
Family incomein dollarsand age
Percentreporting
supplementvitamin B6 8
SampleSize Food Supplement
Food plussupplement
Samplesize Food Supplement
Food plussupplement Food
(years) % (SE) mg (SE) mg (SE) mg (SE) mg (SE) mg (SE) mg (SE) mg (SE)
$0 - $24,999:2 - 19.............. 13 (2.6) 951 1.76 (0.079) 0.53* (0.212) 2.29 (0.235) 104 2.34 (0.539) 3.95* (1.656) 6.29* (2.152) 1.67 (0.080)
20 and over.......... 22 (1.8) 1482 2.08 (0.084) 2.94 (0.687) 5.02 (0.683) 299 2.27 (0.200) 13.65 (2.921) 15.92 (2.867) 2.03 (0.062)
2 and over... 19 (1.6) 2433 2.00 (0.065) 2.32 (0.469) 4.32 (0.468) 403 2.28 (0.187) 11.93 (2.255) 14.21 (2.162) 1.93 (0.050)
$25,000 - $74,999:2 - 19............... 17 (1.7) 1119 1.79 (0.085) 0.42 (0.123) 2.21 (0.175) 185 1.86 (0.376) 2.46 (0.611) 4.32 (0.969) 1.77 (0.079)
20 and over.......... 27 (1.5) 1799 2.26 (0.066) 5.65* (2.803) 7.91* (2.793) 406 2.17 (0.094) 20.87*(10.242) 23.04*(10.250) 2.29 (0.073)
2 and over... 25 (1.3) 2918 2.15 (0.065) 4.41* (2.136) 6.56* (2.125) 591 2.12 (0.113) 17.83* (8.516) 19.96* (8.523) 2.16 (0.059)
$75,000 and higher:2 - 19.............. 23 (3.9) 747 1.86 (0.085) 0.59 (0.117) 2.45 (0.154) 150 1.75 (0.096) 2.56 (0.606) 4.32 (0.666) 1.90 (0.104)
20 and over.......... 32 (2.4) 1253 2.23 (0.039) 2.87 (0.411) 5.10 (0.420) 346 2.35 (0.100) 9.10 (1.216) 11.45 (1.232) 2.18 (0.042)
2 and over... 29 (2.2) 2000 2.14 (0.034) 2.29 (0.292) 4.43 (0.288) 496 2.23 (0.096) 7.81 (0.855) 10.05 (0.873) 2.10 (0.046)
All Individuals 9:2 - 19.............. 18 (1.5) 2974 1.81 (0.039) 0.54 (0.093) 2.35 (0.116) 452 1.94 (0.181) 3.01 (0.679) 4.95 (0.838) 1.79 (0.047)
20 and over.......... 27 (1.2) 4830 2.21 (0.030) 3.88 (1.107) 6.08 (1.099) 1107 2.26 (0.045) 14.40 (3.987) 16.66 (3.988) 2.19 (0.032)
2 and over... 25 (1.1) 7804 2.11 (0.027) 3.05 (0.826) 5.16 (0.820) 1559 2.20 (0.065) 12.37 (3.261) 14.57 (3.264) 2.08 (0.029)

Page 5 of 23Available: www.ars.usda.gov/nea/bhnrc/fsrg.
DATA SOURCE: What We Eat in America, NHANES 2013-2014, day 1 food and supplement intake data, 2 years and over (excluding individuals pregnant, lactating, breast-fed, or with incomplete supplement data.).
See page 23 for footnotes.
What We Eat in America, NHANES 2013-2014
Table 39. Total Nutrient Intakes: Percent Reporting and Mean Amounts1 of Selected2 Vitamins and Minerals from Food and Beverages3 and Dietary Supplements4,by Family Income (in Dollars) and Age, in the United States, 2013-2014 (continued)
F o l i c a c i d
──────────────── All Individuals 5 ──────────────── ────────────── Supplement Users 6 ────────────── ─ Non-users 7 ─
Family incomein dollarsand age
Percentreporting
supplementfolic acid 8
SampleSize Food Supplement
Food plussupplement
Samplesize Food Supplement
Food plussupplement Food
(years) % (SE) µg (SE) µg (SE) µg (SE) µg (SE) µg (SE) µg (SE) µg (SE)
$0 - $24,999:2 - 19.............. 13 (2.6) 951 199 (9.4) 39 (6.1) 238 (6.2) 104 209 (25.1) 287 (32.3) 496 (46.6) 197 (10.3)
20 and over.......... 21 (1.7) 1482 181 (9.1) 95 (8.7) 276 (13.7) 289 191 (12.4) 459 (13.0) 650 (13.4) 178 (8.5)
2 and over... 19 (1.5) 2433 185 (7.5) 81 (6.7) 266 (11.1) 393 194 (13.1) 427 (16.7) 622 (17.8) 183 (7.0)
$25,000 - $74,999:2 - 19............... 17 (1.8) 1119 205 (13.0) 37 (4.0) 241 (15.0) 181 229 (62.4) 221 (16.7) 450 (71.0) 200 (11.1)
20 and over.......... 26 (1.6) 1799 179 (7.7) 132 (8.4) 311 (11.4) 399 183 (10.9) 499 (26.9) 682 (31.6) 177 (9.0)
2 and over... 24 (1.4) 2918 185 (7.5) 109 (6.4) 294 (9.0) 580 191 (14.0) 454 (22.9) 644 (26.1) 183 (9.0)
$75,000 and higher:2 - 19.............. 22 (4.1) 747 208 (11.5) 48 (8.9) 256 (15.3) 145 200 (18.1) 216 (12.0) 415 (21.4) 210 (13.0)
20 and over.......... 31 (2.3) 1253 179 (4.4) 133 (10.2) 312 (12.9) 342 189 (10.0) 424 (7.3) 613 (13.5) 174 (4.1)
2 and over... 29 (2.1) 2000 186 (4.2) 111 (7.8) 298 (9.6) 487 191 (10.1) 384 (12.4) 575 (16.4) 184 (4.5)
All Individuals 9:2 - 19.............. 17 (1.6) 2974 208 (7.4) 40 (3.2) 248 (7.8) 443 217 (22.7) 232 (11.2) 449 (29.9) 206 (8.4)
20 and over.......... 26 (1.2) 4830 179 (4.3) 121 (5.2) 300 (7.4) 1086 186 (7.0) 459 (12.0) 646 (14.9) 177 (4.6)
2 and over... 24 (1.1) 7804 186 (4.2) 101 (4.2) 288 (6.2) 1529 192 (7.1) 419 (11.4) 611 (14.2) 184 (4.7)

Page 6 of 23Available: www.ars.usda.gov/nea/bhnrc/fsrg.
DATA SOURCE: What We Eat in America, NHANES 2013-2014, day 1 food and supplement intake data, 2 years and over (excluding individuals pregnant, lactating, breast-fed, or with incomplete supplement data.).
See page 23 for footnotes.
What We Eat in America, NHANES 2013-2014
Table 39. Total Nutrient Intakes: Percent Reporting and Mean Amounts1 of Selected2 Vitamins and Minerals from Food and Beverages3 and Dietary Supplements4,by Family Income (in Dollars) and Age, in the United States, 2013-2014 (continued)
F o l a t e ( D F E )
──────────────── All Individuals 5 ──────────────── ────────────── Supplement Users 6 ────────────── ─ Non-users 7 ─
Family incomein dollarsand age
Percentreporting
supplementfolate (DFE) 8
SampleSize Food Supplement
Food plussupplement
Samplesize Food Supplement
Food plussupplement Food
(years) % (SE) µg (SE) µg (SE) µg (SE) µg (SE) µg (SE) µg (SE) µg (SE)
$0 - $24,999:2 - 19.............. 13 (2.6) 951 495 (19.0) 66 (10.4) 561 (13.3) 104 536 (48.6) 488 (55.0) 1024 (87.3) 489 (21.6)
20 and over.......... 21 (1.7) 1482 514 (19.0) 162 (14.8) 675 (26.5) 289 530 (24.8) 780 (22.0) 1310 (26.3) 509 (18.6)
2 and over... 19 (1.5) 2433 509 (15.8) 137 (11.4) 646 (21.9) 393 531 (25.6) 727 (28.4) 1258 (35.1) 504 (15.0)
$25,000 - $74,999:2 - 19............... 17 (1.8) 1119 504 (24.3) 62 (6.8) 566 (27.6) 181 541 (114.1) 375 (28.4) 916 (127.8) 497 (22.1)
20 and over.......... 26 (1.6) 1799 525 (14.4) 225 (14.3) 750 (20.6) 399 540 (20.7) 848 (45.7) 1388 (56.1) 520 (15.7)
2 and over... 24 (1.4) 2918 520 (13.8) 186 (10.9) 706 (16.4) 580 540 (25.2) 771 (39.0) 1311 (45.0) 514 (15.7)
$75,000 and higher:2 - 19.............. 22 (4.1) 747 515 (19.4) 81 (15.1) 597 (24.7) 145 511 (32.3) 367 (20.4) 878 (40.8) 516 (22.3)
20 and over.......... 31 (2.3) 1253 542 (9.5) 226 (17.3) 768 (23.2) 342 585 (21.7) 721 (12.4) 1306 (27.1) 522 (10.4)
2 and over... 29 (2.1) 2000 535 (6.9) 189 (13.3) 724 (16.2) 487 571 (19.7) 653 (21.0) 1223 (32.5) 520 (9.7)
All Individuals 9:2 - 19.............. 17 (1.6) 2974 511 (13.2) 69 (5.5) 580 (13.9) 443 535 (42.7) 394 (19.1) 929 (55.1) 506 (15.3)
20 and over.......... 26 (1.2) 4830 528 (8.5) 206 (8.8) 734 (13.9) 1086 555 (13.4) 781 (20.3) 1336 (26.4) 518 (9.5)
2 and over... 24 (1.1) 7804 524 (8.1) 172 (7.2) 696 (11.7) 1529 551 (14.6) 712 (19.3) 1263 (26.7) 515 (9.1)

Page 7 of 23Available: www.ars.usda.gov/nea/bhnrc/fsrg.
DATA SOURCE: What We Eat in America, NHANES 2013-2014, day 1 food and supplement intake data, 2 years and over (excluding individuals pregnant, lactating, breast-fed, or with incomplete supplement data.).
See page 23 for footnotes.
What We Eat in America, NHANES 2013-2014
Table 39. Total Nutrient Intakes: Percent Reporting and Mean Amounts1 of Selected2 Vitamins and Minerals from Food and Beverages3 and Dietary Supplements4,by Family Income (in Dollars) and Age, in the United States, 2013-2014 (continued)
C h o l i n e
──────────────── All Individuals 5 ──────────────── ────────────── Supplement Users 6 ────────────── ─ Non-users 7 ─
Family incomein dollarsand age
Percentreporting
supplementcholine 8
SampleSize Food Supplement
Food plussupplement
Samplesize Food Supplement
Food plussupplement Food
(years) % (SE) mg (SE) mg (SE) mg (SE) mg (SE) mg (SE) mg (SE) mg (SE)
$0 - $24,999:2 - 19.............. 6 (1.8) 951 253 (7.2) 1* (0.7) 255 (6.9) -- -- -- 241 (7.4)
20 and over.......... 3 (0.5) 1482 325 (5.8) 1* (0.4) 326 (6.0) -- -- -- 324 (5.8)
2 and over... 4 (0.6) 2433 307 (4.3) 1* (0.4) 308 (4.5) 79 398 (74.1) 35 (10.2) 433 (76.0) 303 (4.8)
$25,000 - $74,999:2 - 19............... 7 (1.3) 1119 252 (4.9) 1* (0.2) 253 (4.9) 67 273 (58.8) 9 (2.0) 282 (60.1) 251 (6.1)
20 and over.......... 5 (0.8) 1799 343 (6.9) 1* (0.5) 344 (6.8) 71 336 (22.6) 29 (7.6) 364 (26.7) 343 (6.5)
2 and over... 5 (0.8) 2918 321 (6.6) 1 (0.4) 323 (6.5) 138 317 (22.4) 23 (5.4) 340 (23.8) 322 (6.0)
$75,000 and higher:2 - 19.............. 10 (1.7) 747 260 (10.2) 1* (0.3) 261 (10.2) 79 281 (18.6) 7* (2.5) 288 (17.2) 258 (11.0)
20 and over.......... 6 (1.2) 1253 345 (8.4) 1 (0.3) 346 (8.4) 70 342 (20.7) 18 (4.4) 360 (23.1) 345 (8.3)
2 and over... 7 (1.1) 2000 324 (5.5) 1 (0.2) 325 (5.5) 149 321 (13.7) 14 (2.5) 335 (15.1) 324 (5.2)
All Individuals 9:2 - 19.............. 7 (0.9) 2974 256 (3.5) 1 (0.2) 256 (3.5) 187 317 (34.0) 11 (3.0) 328 (34.9) 251 (4.1)
20 and over.......... 5 (0.7) 4830 339 (4.0) 1 (0.3) 340 (3.9) 192 339 (15.5) 25 (3.6) 364 (17.5) 339 (3.7)
2 and over... 5 (0.5) 7804 318 (3.4) 1 (0.2) 319 (3.4) 379 332 (14.3) 20 (2.4) 352 (14.4) 318 (3.2)

Page 8 of 23Available: www.ars.usda.gov/nea/bhnrc/fsrg.
DATA SOURCE: What We Eat in America, NHANES 2013-2014, day 1 food and supplement intake data, 2 years and over (excluding individuals pregnant, lactating, breast-fed, or with incomplete supplement data.).
See page 23 for footnotes.
What We Eat in America, NHANES 2013-2014
Table 39. Total Nutrient Intakes: Percent Reporting and Mean Amounts1 of Selected2 Vitamins and Minerals from Food and Beverages3 and Dietary Supplements4,by Family Income (in Dollars) and Age, in the United States, 2013-2014 (continued)
V i t a m i n B 1 2
──────────────── All Individuals 5 ──────────────── ────────────── Supplement Users 6 ────────────── ─ Non-users 7 ─
Family incomein dollarsand age
Percentreporting
supplementvitamin B12 8
SampleSize Food Supplement
Food plussupplement
Samplesize Food Supplement
Food plussupplement Food
(years) % (SE) µg (SE) µg (SE) µg (SE) µg (SE) µg (SE) µg (SE) µg (SE)
$0 - $24,999:2 - 19.............. 13 (2.6) 951 4.42 (0.169) 9.3* (8.36) 13.8* (8.27) 103 4.44 (0.444) 69.6* (61.88) 74.1* (62.09) 4.42 (0.236)
20 and over.......... 23 (1.6) 1482 4.75 (0.116) 56.9 (12.65) 61.6 (12.63) 319 4.66 (0.243) 252.5 (56.80) 257.1 (56.74) 4.78 (0.121)
2 and over... 20 (1.5) 2433 4.67 (0.091) 44.7 (10.34) 49.4 (10.34) 422 4.62 (0.239) 221.4 (51.86) 226.0 (51.86) 4.68 (0.114)
$25,000 - $74,999:2 - 19............... 17 (1.8) 1119 4.84 (0.251) 2.7* (1.19) 7.5 (1.37) 183 5.08 (1.070) 16.0* (6.95) 21.1* (7.90) 4.79 (0.231)
20 and over.......... 28 (1.6) 1799 5.06 (0.166) 81.5 (19.11) 86.5 (19.11) 421 4.78 (0.340) 291.6 (69.83) 296.4 (69.89) 5.17 (0.164)
2 and over... 25 (1.4) 2918 5.01 (0.152) 62.8 (14.65) 67.8 (14.67) 604 4.83 (0.358) 248.2 (60.46) 253.0 (60.50) 5.07 (0.134)
$75,000 and higher:2 - 19.............. 22 (4.1) 747 4.97 (0.204) 1.9* (0.73) 6.9 (0.80) 147 4.97 (0.313) 8.7* (3.76) 13.6 (4.01) 4.96 (0.273)
20 and over.......... 33 (2.2) 1253 5.03 (0.158) 50.9* (15.36) 55.9 (15.37) 352 5.42 (0.379) 156.3* (47.51) 161.7 (47.41) 4.84 (0.147)
2 and over... 30 (2.0) 2000 5.01 (0.103) 38.5 (11.31) 43.6 (11.31) 499 5.34 (0.306) 128.5* (38.62) 133.8 (38.56) 4.88 (0.110)
All Individuals 9:2 - 19.............. 18 (1.6) 2974 4.79 (0.106) 4.1* (2.12) 8.9 (2.16) 446 5.02 (0.428) 23.3* (12.45) 28.3* (12.60) 4.75 (0.129)
20 and over.......... 28 (1.1) 4830 4.97 (0.083) 65.3 (8.07) 70.3 (8.08) 1152 4.97 (0.189) 234.1 (33.12) 239.1 (33.08) 4.97 (0.088)
2 and over... 25 (1.0) 7804 4.93 (0.073) 50.2 (6.41) 55.1 (6.42) 1598 4.98 (0.202) 198.1 (28.75) 203.1 (28.73) 4.91 (0.070)

Page 9 of 23Available: www.ars.usda.gov/nea/bhnrc/fsrg.
DATA SOURCE: What We Eat in America, NHANES 2013-2014, day 1 food and supplement intake data, 2 years and over (excluding individuals pregnant, lactating, breast-fed, or with incomplete supplement data.).
See page 23 for footnotes.
What We Eat in America, NHANES 2013-2014
Table 39. Total Nutrient Intakes: Percent Reporting and Mean Amounts1 of Selected2 Vitamins and Minerals from Food and Beverages3 and Dietary Supplements4,by Family Income (in Dollars) and Age, in the United States, 2013-2014 (continued)
V i t a m i n C
──────────────── All Individuals 5 ──────────────── ────────────── Supplement Users 6 ────────────── ─ Non-users 7 ─
Family incomein dollarsand age
Percentreporting
supplementvitamin C 8
SampleSize Food Supplement
Food plussupplement
Samplesize Food Supplement
Food plussupplement Food
(years) % (SE) mg (SE) mg (SE) mg (SE) mg (SE) mg (SE) mg (SE) mg (SE)
$0 - $24,999:2 - 19.............. 15 (3.0) 951 75.3 (3.34) 26.0* (10.58) 101.3 (9.19) 111 91.9 (8.77) 173.1* (55.44) 265.0 (54.01) 72.3 (3.73)
20 and over.......... 24 (1.8) 1482 75.3 (3.62) 59.5 (8.49) 134.8 (9.26) 324 82.9 (5.94) 251.2 (25.06) 334.1 (26.15) 73.0 (4.32)
2 and over... 21 (1.8) 2433 75.3 (2.66) 50.9 (8.52) 126.2 (8.36) 435 84.5 (5.13) 237.2 (27.87) 321.7 (28.90) 72.8 (3.24)
$25,000 - $74,999:2 - 19............... 18 (1.8) 1119 69.6 (2.58) 17.1 (4.19) 86.7 (5.41) 200 78.9 (8.13) 94.9 (21.40) 173.8 (26.39) 67.5 (2.48)
20 and over.......... 30 (1.6) 1799 79.3 (2.33) 91.9 (18.30) 171.1 (19.99) 464 87.1 (5.40) 306.6 (56.03) 393.8 (55.94) 75.9 (3.29)
2 and over... 27 (1.4) 2918 77.0 (1.88) 74.2 (13.65) 151.1 (14.84) 664 85.8 (5.14) 273.2 (47.54) 359.1 (47.50) 73.6 (2.39)
$75,000 and higher:2 - 19.............. 24 (4.0) 747 74.5 (2.85) 20.4* (7.01) 94.9 (7.86) 162 85.0 (7.36) 84.4* (31.48) 169.4 (32.64) 71.2 (3.41)
20 and over.......... 33 (2.3) 1253 80.1 (3.41) 74.3 (8.00) 154.4 (9.92) 376 97.0 (4.70) 224.4 (26.05) 321.4 (28.71) 71.7 (4.50)
2 and over... 31 (2.1) 2000 78.7 (2.87) 60.7 (6.40) 139.4 (8.10) 538 94.6 (4.61) 196.8 (23.06) 291.4 (25.22) 71.6 (3.80)
All Individuals 9:2 - 19.............. 19 (1.5) 2974 73.1 (1.75) 21.0 (3.70) 94.1 (4.18) 488 84.1 (4.01) 110.2 (21.12) 194.3 (21.85) 70.5 (2.14)
20 and over.......... 29 (1.2) 4830 78.7 (1.72) 76.3 (8.55) 155.0 (9.73) 1225 90.3 (2.56) 262.3 (25.70) 352.6 (26.30) 74.0 (2.40)
2 and over... 27 (1.1) 7804 77.3 (1.27) 62.7 (6.58) 140.0 (7.30) 1713 89.2 (2.34) 235.4 (21.67) 324.6 (22.28) 73.0 (1.71)

Page 10 of 23Available: www.ars.usda.gov/nea/bhnrc/fsrg.
DATA SOURCE: What We Eat in America, NHANES 2013-2014, day 1 food and supplement intake data, 2 years and over (excluding individuals pregnant, lactating, breast-fed, or with incomplete supplement data.).
See page 23 for footnotes.
What We Eat in America, NHANES 2013-2014
Table 39. Total Nutrient Intakes: Percent Reporting and Mean Amounts1 of Selected2 Vitamins and Minerals from Food and Beverages3 and Dietary Supplements4,by Family Income (in Dollars) and Age, in the United States, 2013-2014 (continued)
V i t a m i n D
──────────────── All Individuals 5 ──────────────── ────────────── Supplement Users 6 ────────────── ─ Non-users 7 ─
Family incomein dollarsand age
Percentreporting
supplementvitamin D 8
SampleSize Food Supplement
Food plussupplement
Samplesize Food Supplement
Food plussupplement Food
(years) % (SE) µg (SE) µg (SE) µg (SE) µg (SE) µg (SE) µg (SE) µg (SE)
$0 - $24,999:2 - 19.............. 14 (2.8) 951 5.0 (0.18) 2.3 (0.61) 7.3 (0.64) 110 5.8 (0.70) 16.5 (2.11) 22.3 (2.01) 4.8 (0.22)
20 and over.......... 26 (1.6) 1482 4.4 (0.11) 8.5 (1.24) 12.9 (1.24) 374 5.2 (0.33) 32.8 (3.99) 38.0 (3.95) 4.2 (0.13)
2 and over... 23 (1.5) 2433 4.6 (0.10) 6.9 (0.91) 11.5 (0.89) 484 5.3 (0.32) 30.2 (3.48) 35.6 (3.44) 4.4 (0.13)
$25,000 - $74,999:2 - 19............... 18 (1.8) 1119 5.4 (0.21) 3.0 (0.70) 8.4 (0.87) 192 5.9 (0.56) 17.3 (4.19) 23.1 (4.45) 5.3 (0.23)
20 and over.......... 32 (1.3) 1799 4.6 (0.17) 11.9 (0.86) 16.4 (0.86) 500 4.8 (0.34) 37.3 (2.27) 42.1 (2.15) 4.4 (0.17)
2 and over... 28 (1.2) 2918 4.8 (0.14) 9.8 (0.65) 14.5 (0.64) 692 5.0 (0.32) 34.3 (1.81) 39.3 (1.71) 4.7 (0.14)
$75,000 and higher:2 - 19.............. 23 (4.1) 747 5.4 (0.23) 2.8 (0.51) 8.2 (0.62) 155 6.3 (0.35) 12.3 (1.26) 18.6 (1.42) 5.1 (0.25)
20 and over.......... 38 (2.6) 1253 5.2 (0.36) 13.2 (1.27) 18.5 (1.36) 423 6.3 (0.79) 35.0 (2.71) 41.3 (2.75) 4.6 (0.30)
2 and over... 34 (2.2) 2000 5.3 (0.25) 10.6 (0.93) 15.9 (0.96) 578 6.3 (0.64) 31.1 (2.07) 37.4 (2.19) 4.7 (0.23)
All Individuals 9:2 - 19.............. 18 (1.5) 2974 5.3 (0.10) 2.7 (0.36) 8.0 (0.39) 472 6.2 (0.26) 14.6 (1.69) 20.8 (1.74) 5.1 (0.12)
20 and over.......... 32 (1.3) 4830 4.8 (0.16) 11.9 (0.79) 16.6 (0.79) 1371 5.4 (0.37) 36.9 (1.89) 42.4 (1.77) 4.5 (0.14)
2 and over... 29 (1.1) 7804 4.9 (0.12) 9.6 (0.62) 14.5 (0.62) 1843 5.5 (0.32) 33.4 (1.74) 39.0 (1.70) 4.6 (0.10)

Page 11 of 23Available: www.ars.usda.gov/nea/bhnrc/fsrg.
DATA SOURCE: What We Eat in America, NHANES 2013-2014, day 1 food and supplement intake data, 2 years and over (excluding individuals pregnant, lactating, breast-fed, or with incomplete supplement data.).
See page 23 for footnotes.
What We Eat in America, NHANES 2013-2014
Table 39. Total Nutrient Intakes: Percent Reporting and Mean Amounts1 of Selected2 Vitamins and Minerals from Food and Beverages3 and Dietary Supplements4,by Family Income (in Dollars) and Age, in the United States, 2013-2014 (continued)
V i t a m i n K
──────────────── All Individuals 5 ──────────────── ────────────── Supplement Users 6 ────────────── ─ Non-users 7 ─
Family incomein dollarsand age
Percentreporting
supplementvitamin K 8
SampleSize Food Supplement
Food plussupplement
Samplesize Food Supplement
Food plussupplement Food
(years) % (SE) µg (SE) µg (SE) µg (SE) µg (SE) µg (SE) µg (SE) µg (SE)
$0 - $24,999:2 - 19.............. 2 (0.7) 951 70.5 (4.14) 0.6* (0.26) 71.2 (4.10) -- -- -- 69.8 (4.11)
20 and over.......... 16 (1.3) 1482 107.5 (6.14) 6.7 (1.21) 114.2 (6.73) 223 133.1 (16.29) 40.5 (6.38) 173.6 (16.18) 102.4 (6.17)
2 and over... 13 (1.1) 2433 98.0 (4.70) 5.1 (0.95) 103.1 (5.15) 237 131.9 (15.66) 39.9 (6.14) 171.8 (15.63) 93.0 (4.57)
$25,000 - $74,999:2 - 19............... 2 (0.7) 1119 68.8 (5.97) 0.5* (0.17) 69.3 (5.93) -- -- -- 68.9 (6.12)
20 and over.......... 20 (1.3) 1799 118.2 (5.70) 7.4 (0.55) 125.6 (5.46) 307 141.4 (23.97) 36.2 (2.28) 177.6 (24.12) 112.3 (5.86)
2 and over... 16 (1.2) 2918 106.5 (4.65) 5.8 (0.44) 112.3 (4.40) 324 139.0 (23.86) 35.9 (2.22) 174.9 (24.09) 100.3 (4.96)
$75,000 and higher:2 - 19.............. 3 (0.7) 747 77.3 (5.10) 1.1 (0.26) 78.4 (5.04) -- -- -- 77.3 (5.12)
20 and over.......... 24 (2.3) 1253 137.7 (4.93) 21.7* (12.19) 159.4 (15.01) 256 164.0 (11.93) 89.1* (45.60) 253.2 (53.98) 129.2 (6.19)
2 and over... 19 (1.7) 2000 122.4 (4.28) 16.5* (9.09) 138.9 (11.79) 275 160.6 (11.59) 87.0* (44.02) 247.5 (52.40) 113.5 (5.08)
All Individuals 9:2 - 19.............. 3 (0.2) 2974 72.2 (3.12) 0.8 (0.12) 73.0 (3.12) -- -- -- 72.1 (3.05)
20 and over.......... 21 (1.1) 4830 122.5 (3.42) 11.9* (4.24) 134.4 (4.63) 830 148.0 (8.76) 57.9* (18.60) 205.9 (20.72) 115.8 (4.31)
2 and over... 16 (0.9) 7804 110.0 (2.83) 9.2* (3.22) 119.2 (3.91) 884 145.2 (8.72) 56.9* (17.94) 202.0 (20.23) 103.3 (3.43)

Page 12 of 23Available: www.ars.usda.gov/nea/bhnrc/fsrg.
DATA SOURCE: What We Eat in America, NHANES 2013-2014, day 1 food and supplement intake data, 2 years and over (excluding individuals pregnant, lactating, breast-fed, or with incomplete supplement data.).
See page 23 for footnotes.
What We Eat in America, NHANES 2013-2014
Table 39. Total Nutrient Intakes: Percent Reporting and Mean Amounts1 of Selected2 Vitamins and Minerals from Food and Beverages3 and Dietary Supplements4,by Family Income (in Dollars) and Age, in the United States, 2013-2014 (continued)
L y c o p e n e
──────────────── All Individuals 5 ──────────────── ────────────── Supplement Users 6 ────────────── ─ Non-users 7 ─
Family incomein dollarsand age
Percentreporting
supplementlycopene 8
SampleSize Food Supplement
Food plussupplement
Samplesize Food Supplement
Food plussupplement Food
(years) % (SE) µg (SE) µg (SE) µg (SE) µg (SE) µg (SE) µg (SE) µg (SE)
$0 - $24,999:2 - 19.............. # 951 4228 (304.8) 2* (0.8) 4230 (304.9) -- -- -- 4236 (306.4)
20 and over.......... 6 (0.9) 1482 4461 (336.9) 35 (6.0) 4496 (337.3) 92 6421 (1317.1) 557 (104.9) 6978 (1278.9) 4330 (316.0)
2 and over... 5 (0.7) 2433 4402 (287.3) 26 (4.6) 4428 (287.9) 98 6332 (1285.6) 554 (102.6) 6886 (1247.4) 4305 (265.8)
$25,000 - $74,999:2 - 19............... 2 (0.8) 1119 3947 (308.3) 9* (4.7) 3956 (308.4) -- -- -- 3936 (331.2)
20 and over.......... 11 (1.5) 1799 4986 (232.9) 64 (12.4) 5050 (227.7) 162 5221 (487.6) 582 (112.7) 5803 (489.2) 4957 (243.5)
2 and over... 9 (1.3) 2918 4739 (199.3) 51 (9.6) 4791 (193.0) 169 5191 (489.5) 578 (106.2) 5769 (498.2) 4696 (212.0)
$75,000 and higher:2 - 19.............. 1* (0.5) 747 4300 (336.8) 2* (1.3) 4303 (337.0) -- -- -- 4301 (339.2)
20 and over.......... 14 (1.2) 1253 5603 (275.3) 77 (13.1) 5681 (280.1) 151 4469 (791.7) 559 (72.6) 5028 (804.2) 5786 (332.4)
2 and over... 11 (1.0) 2000 5274 (226.3) 58 (9.9) 5333 (229.1) 157 4464 (780.2) 554 (72.5) 5017 (794.2) 5370 (255.6)
All Individuals 9:2 - 19.............. 1 (0.2) 2974 4138 (213.7) 4* (1.5) 4142 (214.1) -- -- -- 4137 (216.7)
20 and over.......... 11 (0.9) 4830 5009 (125.7) 59 (5.8) 5069 (127.8) 425 5102 (343.8) 563 (54.9) 5665 (347.3) 4998 (149.9)
2 and over... 8 (0.7) 7804 4794 (117.6) 46 (4.4) 4840 (118.3) 444 5076 (328.3) 559 (52.2) 5636 (334.5) 4769 (134.2)
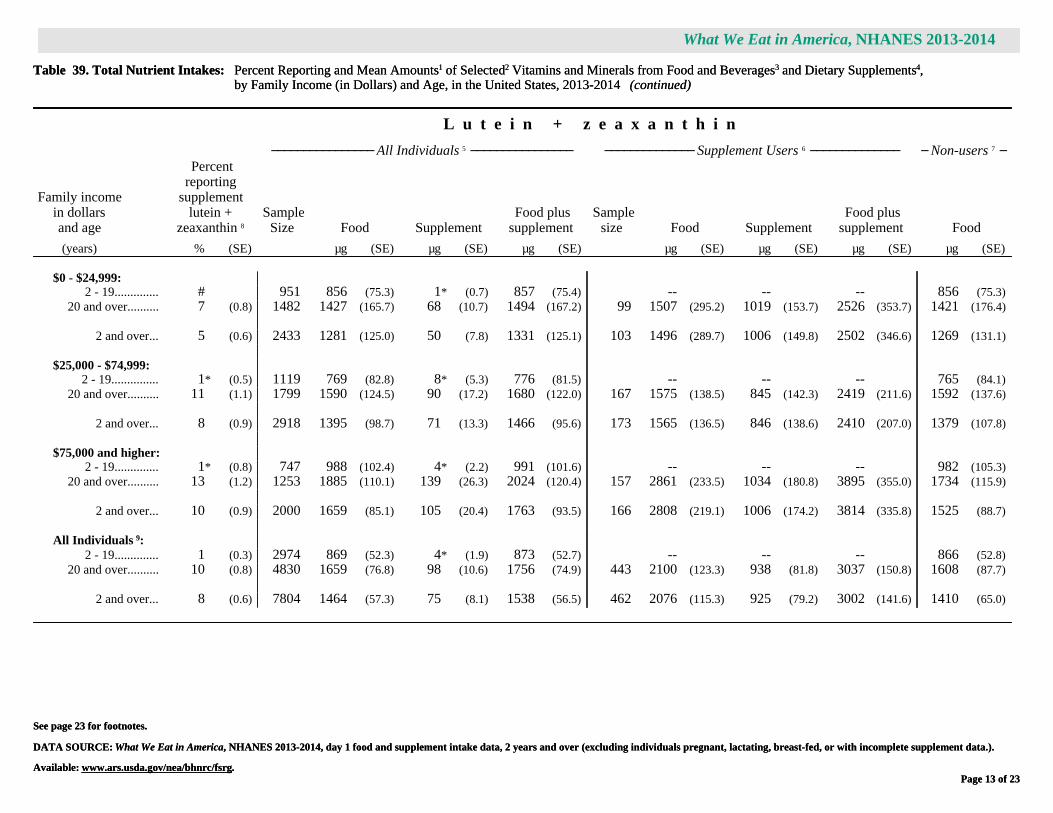
Page 13 of 23Available: www.ars.usda.gov/nea/bhnrc/fsrg.
DATA SOURCE: What We Eat in America, NHANES 2013-2014, day 1 food and supplement intake data, 2 years and over (excluding individuals pregnant, lactating, breast-fed, or with incomplete supplement data.).
See page 23 for footnotes.
What We Eat in America, NHANES 2013-2014
Table 39. Total Nutrient Intakes: Percent Reporting and Mean Amounts1 of Selected2 Vitamins and Minerals from Food and Beverages3 and Dietary Supplements4,by Family Income (in Dollars) and Age, in the United States, 2013-2014 (continued)
L u t e i n + z e a x a n t h i n
──────────────── All Individuals 5 ──────────────── ────────────── Supplement Users 6 ────────────── ─ Non-users 7 ─
Family incomein dollarsand age
Percentreporting
supplementlutein +
zeaxanthin 8
SampleSize Food Supplement
Food plussupplement
Samplesize Food Supplement
Food plussupplement Food
(years) % (SE) µg (SE) µg (SE) µg (SE) µg (SE) µg (SE) µg (SE) µg (SE)
$0 - $24,999:2 - 19.............. # 951 856 (75.3) 1* (0.7) 857 (75.4) -- -- -- 856 (75.3)
20 and over.......... 7 (0.8) 1482 1427 (165.7) 68 (10.7) 1494 (167.2) 99 1507 (295.2) 1019 (153.7) 2526 (353.7) 1421 (176.4)
2 and over... 5 (0.6) 2433 1281 (125.0) 50 (7.8) 1331 (125.1) 103 1496 (289.7) 1006 (149.8) 2502 (346.6) 1269 (131.1)
$25,000 - $74,999:2 - 19............... 1* (0.5) 1119 769 (82.8) 8* (5.3) 776 (81.5) -- -- -- 765 (84.1)
20 and over.......... 11 (1.1) 1799 1590 (124.5) 90 (17.2) 1680 (122.0) 167 1575 (138.5) 845 (142.3) 2419 (211.6) 1592 (137.6)
2 and over... 8 (0.9) 2918 1395 (98.7) 71 (13.3) 1466 (95.6) 173 1565 (136.5) 846 (138.6) 2410 (207.0) 1379 (107.8)
$75,000 and higher:2 - 19.............. 1* (0.8) 747 988 (102.4) 4* (2.2) 991 (101.6) -- -- -- 982 (105.3)
20 and over.......... 13 (1.2) 1253 1885 (110.1) 139 (26.3) 2024 (120.4) 157 2861 (233.5) 1034 (180.8) 3895 (355.0) 1734 (115.9)
2 and over... 10 (0.9) 2000 1659 (85.1) 105 (20.4) 1763 (93.5) 166 2808 (219.1) 1006 (174.2) 3814 (335.8) 1525 (88.7)
All Individuals 9:2 - 19.............. 1 (0.3) 2974 869 (52.3) 4* (1.9) 873 (52.7) -- -- -- 866 (52.8)
20 and over.......... 10 (0.8) 4830 1659 (76.8) 98 (10.6) 1756 (74.9) 443 2100 (123.3) 938 (81.8) 3037 (150.8) 1608 (87.7)
2 and over... 8 (0.6) 7804 1464 (57.3) 75 (8.1) 1538 (56.5) 462 2076 (115.3) 925 (79.2) 3002 (141.6) 1410 (65.0)

Page 14 of 23Available: www.ars.usda.gov/nea/bhnrc/fsrg.
DATA SOURCE: What We Eat in America, NHANES 2013-2014, day 1 food and supplement intake data, 2 years and over (excluding individuals pregnant, lactating, breast-fed, or with incomplete supplement data.).
See page 23 for footnotes.
What We Eat in America, NHANES 2013-2014
Table 39. Total Nutrient Intakes: Percent Reporting and Mean Amounts1 of Selected2 Vitamins and Minerals from Food and Beverages3 and Dietary Supplements4,by Family Income (in Dollars) and Age, in the United States, 2013-2014 (continued)
C a l c i u m
──────────────── All Individuals 5 ──────────────── ────────────── Supplement Users 6 ────────────── ─ Non-users 7 ─
Family incomein dollarsand age
Percentreporting
supplementcalcium 8
SampleSize Food Supplement
Food plussupplement
Samplesize Food Supplement
Food plussupplement Food
(years) % (SE) mg (SE) mg (SE) mg (SE) mg (SE) mg (SE) mg (SE) mg (SE)
$0 - $24,999:2 - 19.............. 7 (1.7) 951 957 (27.5) 17 (4.7) 975 (26.2) -- -- -- 946 (30.6)
20 and over.......... 26 (1.5) 1482 940 (21.2) 129 (10.8) 1069 (28.9) 363 1008 (41.6) 494 (24.2) 1502 (49.5) 916 (23.4)
2 and over... 21 (1.4) 2433 944 (16.6) 100 (8.9) 1045 (22.6) 413 1016 (39.9) 475 (24.4) 1492 (49.5) 925 (21.1)
$25,000 - $74,999:2 - 19............... 9 (1.4) 1119 989 (25.9) 14 (2.9) 1003 (25.6) 86 1157 (106.1) 158 (18.0) 1314 (95.7) 973 (27.6)
20 and over.......... 32 (1.7) 1799 964 (11.2) 157 (10.7) 1120 (16.0) 498 972 (28.7) 488 (24.2) 1460 (35.0) 960 (10.6)
2 and over... 27 (1.4) 2918 970 (10.4) 123 (8.9) 1093 (13.0) 584 986 (33.3) 462 (24.0) 1449 (36.0) 964 (6.8)
$75,000 and higher:2 - 19.............. 8 (1.0) 747 1099 (29.7) 18 (3.6) 1117 (30.8) 64 1039 (68.8) 217 (28.5) 1255 (75.2) 1104 (30.5)
20 and over.......... 36 (2.4) 1253 989 (26.8) 168 (12.9) 1156 (33.5) 386 1075 (48.9) 470 (16.4) 1545 (49.5) 941 (28.0)
2 and over... 29 (1.8) 2000 1017 (20.9) 130 (9.7) 1146 (23.5) 450 1072 (46.4) 451 (16.5) 1524 (46.0) 994 (22.1)
All Individuals 9:2 - 19.............. 8 (0.7) 2974 1021 (18.7) 16 (2.2) 1037 (18.5) 208 1141 (50.3) 204 (18.8) 1345 (44.8) 1011 (20.5)
20 and over.......... 32 (1.3) 4830 967 (12.7) 154 (8.5) 1121 (18.2) 1318 1023 (19.1) 486 (13.7) 1509 (24.4) 941 (13.8)
2 and over... 26 (1.0) 7804 980 (11.9) 120 (6.3) 1100 (15.7) 1526 1032 (19.0) 465 (12.7) 1497 (24.5) 962 (12.7)

Page 15 of 23Available: www.ars.usda.gov/nea/bhnrc/fsrg.
DATA SOURCE: What We Eat in America, NHANES 2013-2014, day 1 food and supplement intake data, 2 years and over (excluding individuals pregnant, lactating, breast-fed, or with incomplete supplement data.).
See page 23 for footnotes.
What We Eat in America, NHANES 2013-2014
Table 39. Total Nutrient Intakes: Percent Reporting and Mean Amounts1 of Selected2 Vitamins and Minerals from Food and Beverages3 and Dietary Supplements4,by Family Income (in Dollars) and Age, in the United States, 2013-2014 (continued)
P h o s p h o r u s
──────────────── All Individuals 5 ──────────────── ────────────── Supplement Users 6 ────────────── ─ Non-users 7 ─
Family incomein dollarsand age
Percentreporting
supplementphosphorus 8
SampleSize Food Supplement
Food plussupplement
Samplesize Food Supplement
Food plussupplement Food
(years) % (SE) mg (SE) mg (SE) mg (SE) mg (SE) mg (SE) mg (SE) mg (SE)
$0 - $24,999:2 - 19.............. 2 (1.0) 951 1227 (28.4) 3* (1.5) 1230 (27.5) -- -- -- 1217 (33.6)
20 and over.......... 11 (0.7) 1482 1335 (20.8) 6 (0.8) 1340 (21.2) 158 1340 (42.3) 53 (6.4) 1393 (45.5) 1334 (24.1)
2 and over... 9 (0.7) 2433 1307 (15.2) 5 (0.6) 1312 (15.4) 173 1360 (34.8) 57 (5.5) 1418 (37.0) 1302 (16.7)
$25,000 - $74,999:2 - 19............... 2 (0.4) 1119 1243 (21.9) 2* (0.7) 1245 (21.8) -- -- -- 1239 (23.4)
20 and over.......... 13 (1.4) 1799 1400 (18.3) 5 (1.1) 1406 (18.2) 195 1442 (38.8) 43 (7.2) 1485 (41.1) 1394 (20.6)
2 and over... 10 (1.1) 2918 1363 (15.1) 5 (0.8) 1367 (15.1) 216 1445 (39.7) 46 (6.7) 1490 (42.5) 1354 (17.6)
$75,000 and higher:2 - 19.............. 2 (0.7) 747 1336 (37.3) 3* (0.9) 1339 (37.4) -- -- -- 1338 (37.4)
20 and over.......... 16 (1.7) 1253 1453 (22.3) 8 (1.1) 1461 (22.8) 176 1600 (76.0) 49 (5.8) 1649 (74.2) 1425 (22.4)
2 and over... 13 (1.3) 2000 1423 (15.3) 7 (0.8) 1430 (15.5) 196 1583 (74.4) 52 (5.3) 1635 (72.4) 1400 (19.0)
All Individuals 9:2 - 19.............. 2 (0.5) 2974 1272 (15.3) 2* (0.6) 1274 (15.2) -- -- -- 1269 (16.3)
20 and over.......... 13 (0.8) 4830 1401 (12.3) 6 (0.6) 1407 (12.4) 553 1484 (37.5) 48 (3.7) 1532 (38.1) 1389 (14.3)
2 and over... 10 (0.7) 7804 1369 (10.9) 5 (0.4) 1375 (10.9) 612 1482 (36.2) 51 (3.0) 1533 (36.2) 1356 (12.4)
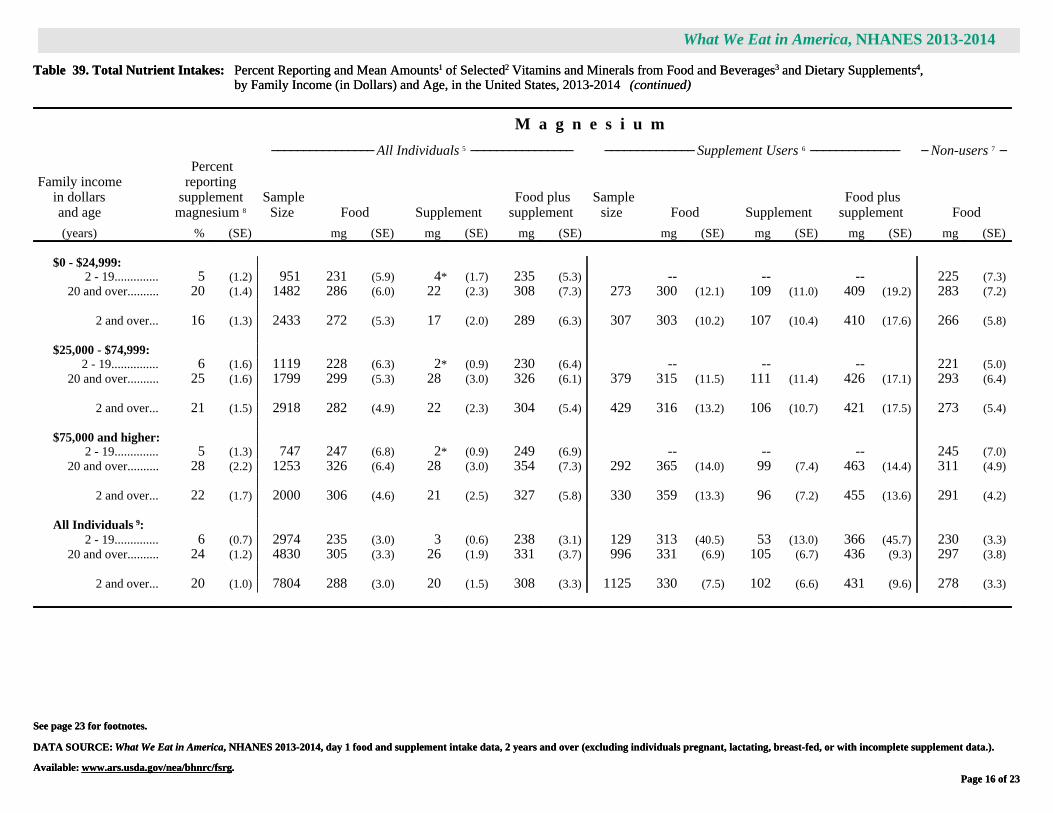
Page 16 of 23Available: www.ars.usda.gov/nea/bhnrc/fsrg.
DATA SOURCE: What We Eat in America, NHANES 2013-2014, day 1 food and supplement intake data, 2 years and over (excluding individuals pregnant, lactating, breast-fed, or with incomplete supplement data.).
See page 23 for footnotes.
What We Eat in America, NHANES 2013-2014
Table 39. Total Nutrient Intakes: Percent Reporting and Mean Amounts1 of Selected2 Vitamins and Minerals from Food and Beverages3 and Dietary Supplements4,by Family Income (in Dollars) and Age, in the United States, 2013-2014 (continued)
M a g n e s i u m
──────────────── All Individuals 5 ──────────────── ────────────── Supplement Users 6 ────────────── ─ Non-users 7 ─
Family incomein dollarsand age
Percentreporting
supplementmagnesium 8
SampleSize Food Supplement
Food plussupplement
Samplesize Food Supplement
Food plussupplement Food
(years) % (SE) mg (SE) mg (SE) mg (SE) mg (SE) mg (SE) mg (SE) mg (SE)
$0 - $24,999:2 - 19.............. 5 (1.2) 951 231 (5.9) 4* (1.7) 235 (5.3) -- -- -- 225 (7.3)
20 and over.......... 20 (1.4) 1482 286 (6.0) 22 (2.3) 308 (7.3) 273 300 (12.1) 109 (11.0) 409 (19.2) 283 (7.2)
2 and over... 16 (1.3) 2433 272 (5.3) 17 (2.0) 289 (6.3) 307 303 (10.2) 107 (10.4) 410 (17.6) 266 (5.8)
$25,000 - $74,999:2 - 19............... 6 (1.6) 1119 228 (6.3) 2* (0.9) 230 (6.4) -- -- -- 221 (5.0)
20 and over.......... 25 (1.6) 1799 299 (5.3) 28 (3.0) 326 (6.1) 379 315 (11.5) 111 (11.4) 426 (17.1) 293 (6.4)
2 and over... 21 (1.5) 2918 282 (4.9) 22 (2.3) 304 (5.4) 429 316 (13.2) 106 (10.7) 421 (17.5) 273 (5.4)
$75,000 and higher:2 - 19.............. 5 (1.3) 747 247 (6.8) 2* (0.9) 249 (6.9) -- -- -- 245 (7.0)
20 and over.......... 28 (2.2) 1253 326 (6.4) 28 (3.0) 354 (7.3) 292 365 (14.0) 99 (7.4) 463 (14.4) 311 (4.9)
2 and over... 22 (1.7) 2000 306 (4.6) 21 (2.5) 327 (5.8) 330 359 (13.3) 96 (7.2) 455 (13.6) 291 (4.2)
All Individuals 9:2 - 19.............. 6 (0.7) 2974 235 (3.0) 3 (0.6) 238 (3.1) 129 313 (40.5) 53 (13.0) 366 (45.7) 230 (3.3)
20 and over.......... 24 (1.2) 4830 305 (3.3) 26 (1.9) 331 (3.7) 996 331 (6.9) 105 (6.7) 436 (9.3) 297 (3.8)
2 and over... 20 (1.0) 7804 288 (3.0) 20 (1.5) 308 (3.3) 1125 330 (7.5) 102 (6.6) 431 (9.6) 278 (3.3)

Page 17 of 23Available: www.ars.usda.gov/nea/bhnrc/fsrg.
DATA SOURCE: What We Eat in America, NHANES 2013-2014, day 1 food and supplement intake data, 2 years and over (excluding individuals pregnant, lactating, breast-fed, or with incomplete supplement data.).
See page 23 for footnotes.
What We Eat in America, NHANES 2013-2014
Table 39. Total Nutrient Intakes: Percent Reporting and Mean Amounts1 of Selected2 Vitamins and Minerals from Food and Beverages3 and Dietary Supplements4,by Family Income (in Dollars) and Age, in the United States, 2013-2014 (continued)
I r o n
──────────────── All Individuals 5 ──────────────── ────────────── Supplement Users 6 ────────────── ─ Non-users 7 ─
Family incomein dollarsand age
Percentreporting
supplementiron 8
SampleSize Food Supplement
Food plussupplement
Samplesize Food Supplement
Food plussupplement Food
(years) % (SE) mg (SE) mg (SE) mg (SE) mg (SE) mg (SE) mg (SE) mg (SE)
$0 - $24,999:2 - 19.............. 4 (1.4) 951 13.5 (0.36) 0.9* (0.27) 14.4 (0.30) -- -- -- 13.4 (0.38)
20 and over.......... 12 (1.5) 1482 14.0 (0.38) 2.7 (0.34) 16.7 (0.51) 178 14.3 (1.13) 21.9 (1.41) 36.2 (1.49) 14.0 (0.33)
2 and over... 10 (1.2) 2433 13.9 (0.34) 2.3 (0.27) 16.1 (0.42) 211 14.5 (0.98) 21.8 (1.33) 36.2 (1.35) 13.8 (0.30)
$25,000 - $74,999:2 - 19............... 4 (0.9) 1119 13.7 (0.59) 0.8 (0.21) 14.6 (0.55) 63 14.5 (1.34) 21.3 (2.40) 35.8 (2.07) 13.7 (0.60)
20 and over.......... 15 (1.3) 1799 14.8 (0.30) 3.5 (0.49) 18.3 (0.47) 227 15.0 (0.84) 24.3 (2.14) 39.3 (2.06) 14.8 (0.33)
2 and over... 12 (1.1) 2918 14.5 (0.30) 2.9 (0.41) 17.4 (0.38) 290 14.9 (0.79) 24.1 (1.98) 39.0 (1.91) 14.5 (0.32)
$75,000 and higher:2 - 19.............. 5 (1.2) 747 14.3 (0.34) 1.0* (0.39) 15.3 (0.52) -- -- -- 14.3 (0.35)
20 and over.......... 16 (1.6) 1253 14.6 (0.17) 3.4 (0.46) 18.0 (0.47) 163 14.8 (0.52) 20.9 (1.39) 35.7 (1.45) 14.6 (0.16)
2 and over... 13 (1.1) 2000 14.6 (0.13) 2.8 (0.35) 17.4 (0.31) 202 14.8 (0.51) 20.7 (1.40) 35.5 (1.47) 14.5 (0.15)
All Individuals 9:2 - 19.............. 5 (0.5) 2974 13.9 (0.24) 0.9 (0.15) 14.8 (0.25) 142 16.2 (0.88) 19.5 (2.61) 35.6 (2.33) 13.8 (0.25)
20 and over.......... 15 (0.9) 4830 14.6 (0.15) 3.2 (0.24) 17.8 (0.26) 607 14.7 (0.44) 22.2 (0.87) 36.9 (0.85) 14.5 (0.16)
2 and over... 12 (0.7) 7804 14.4 (0.15) 2.7 (0.19) 17.1 (0.22) 749 14.8 (0.41) 21.9 (0.90) 36.8 (0.85) 14.3 (0.15)

Page 18 of 23Available: www.ars.usda.gov/nea/bhnrc/fsrg.
DATA SOURCE: What We Eat in America, NHANES 2013-2014, day 1 food and supplement intake data, 2 years and over (excluding individuals pregnant, lactating, breast-fed, or with incomplete supplement data.).
See page 23 for footnotes.
What We Eat in America, NHANES 2013-2014
Table 39. Total Nutrient Intakes: Percent Reporting and Mean Amounts1 of Selected2 Vitamins and Minerals from Food and Beverages3 and Dietary Supplements4,by Family Income (in Dollars) and Age, in the United States, 2013-2014 (continued)
Z i n c
──────────────── All Individuals 5 ──────────────── ────────────── Supplement Users 6 ────────────── ─ Non-users 7 ─
Family incomein dollarsand age
Percentreporting
supplementzinc 8
SampleSize Food Supplement
Food plussupplement
Samplesize Food Supplement
Food plussupplement Food
(years) % (SE) mg (SE) mg (SE) mg (SE) mg (SE) mg (SE) mg (SE) mg (SE)
$0 - $24,999:2 - 19.............. 12 (2.4) 951 9.7 (0.25) 0.9 (0.20) 10.6 (0.16) 96 10.7 (1.10) 7.4 (1.48) 18.1 (2.18) 9.5 (0.30)
20 and over.......... 21 (1.7) 1482 10.7 (0.24) 3.7 (0.39) 14.4 (0.53) 291 10.8 (0.39) 17.9 (1.08) 28.7 (1.06) 10.7 (0.27)
2 and over... 19 (1.6) 2433 10.4 (0.20) 3.0 (0.31) 13.4 (0.42) 387 10.8 (0.43) 16.1 (1.04) 26.9 (1.05) 10.4 (0.21)
$25,000 - $74,999:2 - 19............... 16 (2.0) 1119 10.1 (0.49) 0.9 (0.19) 11.1 (0.62) 171 11.6 (2.92) 5.9 (1.00) 17.5 (3.72) 9.9 (0.35)
20 and over.......... 26 (1.6) 1799 11.3 (0.17) 4.3 (0.36) 15.5 (0.44) 385 11.0 (0.51) 16.7 (1.05) 27.6 (1.34) 11.4 (0.17)
2 and over... 23 (1.4) 2918 11.0 (0.21) 3.5 (0.29) 14.5 (0.40) 556 11.1 (0.62) 14.9 (0.84) 26.0 (1.13) 11.0 (0.18)
$75,000 and higher:2 - 19.............. 19 (4.0) 747 10.3 (0.32) 0.9 (0.19) 11.2 (0.41) 133 10.7 (0.58) 4.7 (0.29) 15.4 (0.66) 10.2 (0.36)
20 and over.......... 29 (2.2) 1253 11.5 (0.22) 4.4 (0.26) 15.9 (0.33) 309 12.0 (0.47) 15.2 (0.68) 27.2 (0.77) 11.3 (0.23)
2 and over... 26 (1.9) 2000 11.2 (0.16) 3.5 (0.22) 14.7 (0.22) 442 11.7 (0.43) 13.3 (0.83) 25.0 (0.94) 11.0 (0.20)
All Individuals 9:2 - 19.............. 16 (1.5) 2974 10.1 (0.16) 0.9 (0.10) 11.0 (0.21) 412 11.2 (1.10) 5.6 (0.54) 16.9 (1.49) 9.9 (0.21)
20 and over.......... 25 (1.3) 4830 11.2 (0.10) 4.1 (0.22) 15.3 (0.25) 1040 11.3 (0.27) 16.3 (0.51) 27.7 (0.63) 11.1 (0.11)
2 and over... 23 (1.1) 7804 10.9 (0.10) 3.3 (0.17) 14.2 (0.21) 1452 11.3 (0.31) 14.5 (0.50) 25.8 (0.63) 10.8 (0.12)

Page 19 of 23Available: www.ars.usda.gov/nea/bhnrc/fsrg.
DATA SOURCE: What We Eat in America, NHANES 2013-2014, day 1 food and supplement intake data, 2 years and over (excluding individuals pregnant, lactating, breast-fed, or with incomplete supplement data.).
See page 23 for footnotes.
What We Eat in America, NHANES 2013-2014
Table 39. Total Nutrient Intakes: Percent Reporting and Mean Amounts1 of Selected2 Vitamins and Minerals from Food and Beverages3 and Dietary Supplements4,by Family Income (in Dollars) and Age, in the United States, 2013-2014 (continued)
C o p p e r
──────────────── All Individuals 5 ──────────────── ────────────── Supplement Users 6 ────────────── ─ Non-users 7 ─
Family incomein dollarsand age
Percentreporting
supplementcopper 8
SampleSize Food Supplement
Food plussupplement
Samplesize Food Supplement
Food plussupplement Food
(years) % (SE) mg (SE) mg (SE) mg (SE) mg (SE) mg (SE) mg (SE) mg (SE)
$0 - $24,999:2 - 19.............. 5 (1.4) 951 0.9 (0.03) 0.1 (0.02) 1.0 (0.03) -- -- -- 0.9 (0.03)
20 and over.......... 19 (1.7) 1482 1.2 (0.03) 0.3 (0.02) 1.4 (0.04) 256 1.2 (0.04) 1.3 (0.04) 2.5 (0.04) 1.2 (0.04)
2 and over... 15 (1.4) 2433 1.1 (0.03) 0.2 (0.02) 1.3 (0.04) 289 1.2 (0.04) 1.4 (0.05) 2.6 (0.05) 1.1 (0.03)
$25,000 - $74,999:2 - 19............... 5 (1.2) 1119 0.9 (0.03) 0.1* (0.04) 1.0 (0.05) -- -- -- 0.9 (0.02)
20 and over.......... 23 (1.4) 1799 1.2 (0.02) 0.3 (0.03) 1.5 (0.03) 348 1.2 (0.06) 1.3 (0.09) 2.6 (0.11) 1.2 (0.03)
2 and over... 19 (1.3) 2918 1.1 (0.02) 0.3 (0.03) 1.4 (0.03) 407 1.2 (0.05) 1.4 (0.10) 2.6 (0.13) 1.1 (0.02)
$75,000 and higher:2 - 19.............. 6 (1.2) 747 1.0 (0.02) 0.1 (0.02) 1.1 (0.03) -- -- -- 1.0 (0.02)
20 and over.......... 26 (2.1) 1253 1.3 (0.03) 0.3 (0.03) 1.7 (0.04) 279 1.5 (0.06) 1.3 (0.07) 2.7 (0.06) 1.3 (0.03)
2 and over... 21 (1.6) 2000 1.2 (0.02) 0.3 (0.02) 1.5 (0.02) 319 1.5 (0.05) 1.3 (0.07) 2.7 (0.06) 1.2 (0.01)
All Individuals 9:2 - 19.............. 5 (0.5) 2974 0.9 (0.01) 0.1 (0.02) 1.0 (0.02) 137 1.3 (0.15) 1.8 (0.32) 3.1 (0.37) 0.9 (0.01)
20 and over.......... 23 (1.2) 4830 1.2 (0.02) 0.3 (0.02) 1.5 (0.03) 932 1.3 (0.04) 1.3 (0.03) 2.6 (0.05) 1.2 (0.02)
2 and over... 18 (1.0) 7804 1.2 (0.01) 0.2 (0.01) 1.4 (0.02) 1069 1.3 (0.04) 1.3 (0.03) 2.7 (0.06) 1.1 (0.01)

Page 20 of 23Available: www.ars.usda.gov/nea/bhnrc/fsrg.
DATA SOURCE: What We Eat in America, NHANES 2013-2014, day 1 food and supplement intake data, 2 years and over (excluding individuals pregnant, lactating, breast-fed, or with incomplete supplement data.).
See page 23 for footnotes.
What We Eat in America, NHANES 2013-2014
Table 39. Total Nutrient Intakes: Percent Reporting and Mean Amounts1 of Selected2 Vitamins and Minerals from Food and Beverages3 and Dietary Supplements4,by Family Income (in Dollars) and Age, in the United States, 2013-2014 (continued)
S o d i u m
──────────────── All Individuals 5 ──────────────── ────────────── Supplement Users 6 ────────────── ─ Non-users 7 ─
Family incomein dollarsand age
Percentreporting
supplementsodium 8
SampleSize Food Supplement
Food plussupplement
Samplesize Food Supplement
Food plussupplement Food
(years) % (SE) mg (SE) mg (SE) mg (SE) mg (SE) mg (SE) mg (SE) mg (SE)
$0 - $24,999:2 - 19.............. 4 (1.1) 951 2995 (73.6) # 2996 (73.6) -- -- -- 3006 (72.0)
20 and over.......... 4 (0.7) 1482 3342 (41.1) 2 (0.5) 3344 (41.2) -- -- -- 3340 (45.3)
2 and over... 4 (0.6) 2433 3253 (35.3) 1 (0.4) 3254 (35.3) 90 3228 (266.4) 33 (6.0) 3261 (265.0) 3254 (40.6)
$25,000 - $74,999:2 - 19............... 6 (1.3) 1119 2967 (34.5) 1* (0.3) 2968 (34.3) 74 2870 (172.2) 15 (4.1) 2885 (172.4) 2973 (33.8)
20 and over.......... 6 (1.2) 1799 3594 (44.2) 2 (0.5) 3595 (44.3) 95 3547 (185.5) 32 (7.8) 3579 (181.6) 3596 (48.3)
2 and over... 6 (1.0) 2918 3445 (36.8) 2 (0.4) 3447 (36.8) 169 3385 (158.9) 28 (6.4) 3413 (155.6) 3449 (39.9)
$75,000 and higher:2 - 19.............. 5 (1.1) 747 3148 (112.8) 1 (0.1) 3148 (112.9) -- -- -- 3174 (109.4)
20 and over.......... 10 (1.1) 1253 3620 (56.4) 3 (0.5) 3624 (56.5) 93 3391 (189.5) 31 (4.0) 3422 (191.8) 3646 (55.6)
2 and over... 9 (0.8) 2000 3501 (53.3) 2 (0.4) 3504 (53.2) 136 3283 (158.4) 28 (2.7) 3311 (159.8) 3522 (52.6)
All Individuals 9:2 - 19.............. 5 (0.7) 2974 3036 (40.1) 1 (0.1) 3036 (40.1) 156 2754 (125.9) 13 (1.9) 2767 (126.0) 3051 (39.6)
20 and over.......... 7 (0.6) 4830 3534 (30.2) 2 (0.4) 3536 (30.2) 254 3419 (92.1) 33 (3.7) 3452 (90.6) 3542 (32.9)
2 and over... 6 (0.5) 7804 3411 (28.0) 2 (0.3) 3412 (28.0) 410 3290 (80.3) 29 (3.3) 3319 (79.3) 3419 (29.0)

Page 21 of 23Available: www.ars.usda.gov/nea/bhnrc/fsrg.
DATA SOURCE: What We Eat in America, NHANES 2013-2014, day 1 food and supplement intake data, 2 years and over (excluding individuals pregnant, lactating, breast-fed, or with incomplete supplement data.).
See page 23 for footnotes.
What We Eat in America, NHANES 2013-2014
Table 39. Total Nutrient Intakes: Percent Reporting and Mean Amounts1 of Selected2 Vitamins and Minerals from Food and Beverages3 and Dietary Supplements4,by Family Income (in Dollars) and Age, in the United States, 2013-2014 (continued)
P o t a s s i u m
──────────────── All Individuals 5 ──────────────── ────────────── Supplement Users 6 ────────────── ─ Non-users 7 ─
Family incomein dollarsand age
Percentreporting
supplementpotassium 8
SampleSize Food Supplement
Food plussupplement
Samplesize Food Supplement
Food plussupplement Food
(years) % (SE) mg (SE) mg (SE) mg (SE) mg (SE) mg (SE) mg (SE) mg (SE)
$0 - $24,999:2 - 19.............. 2 (0.8) 951 2126 (45.7) 1* (0.6) 2127 (45.5) -- -- -- 2083 (56.5)
20 and over.......... 13 (1.2) 1482 2483 (43.4) 11 (1.0) 2494 (44.0) 175 2725 (102.6) 86 (5.1) 2811 (106.1) 2447 (47.2)
2 and over... 10 (1.1) 2433 2392 (34.9) 9 (0.8) 2400 (35.5) 184 2803 (91.1) 85 (5.1) 2888 (94.7) 2345 (34.4)
$25,000 - $74,999:2 - 19............... 1* (0.5) 1119 2105 (41.3) 1* (0.4) 2106 (41.2) -- -- -- 2093 (42.8)
20 and over.......... 15 (1.3) 1799 2645 (33.6) 14 (2.8) 2659 (34.6) 228 2920 (67.7) 96 (13.4) 3016 (64.2) 2596 (38.0)
2 and over... 12 (1.0) 2918 2517 (32.9) 11 (2.1) 2528 (33.5) 242 2924 (67.5) 95 (13.2) 3019 (63.7) 2463 (37.1)
$75,000 and higher:2 - 19.............. 2* (0.7) 747 2259 (66.9) 1* (0.4) 2261 (66.8) -- -- -- 2253 (65.1)
20 and over.......... 19 (1.5) 1253 2798 (55.3) 16 (1.1) 2814 (55.5) 198 3230 (174.3) 83 (3.9) 3313 (175.7) 2696 (42.9)
2 and over... 15 (1.3) 2000 2662 (45.3) 12 (1.0) 2675 (45.4) 210 3207 (169.0) 82 (3.8) 3289 (170.7) 2567 (39.7)
All Individuals 9:2 - 19.............. 2 (0.3) 2974 2161 (27.1) 1 (0.2) 2162 (27.0) -- -- -- 2143 (31.3)
20 and over.......... 16 (0.9) 4830 2660 (30.4) 14 (1.2) 2674 (30.9) 630 3007 (94.1) 87 (5.7) 3094 (94.8) 2596 (29.3)
2 and over... 12 (0.8) 7804 2537 (27.5) 11 (0.9) 2547 (27.9) 667 3015 (86.3) 87 (5.6) 3102 (87.1) 2471 (27.1)

Page 22 of 23Available: www.ars.usda.gov/nea/bhnrc/fsrg.
DATA SOURCE: What We Eat in America, NHANES 2013-2014, day 1 food and supplement intake data, 2 years and over (excluding individuals pregnant, lactating, breast-fed, or with incomplete supplement data.).
See page 23 for footnotes.
What We Eat in America, NHANES 2013-2014
Table 39. Total Nutrient Intakes: Percent Reporting and Mean Amounts1 of Selected2 Vitamins and Minerals from Food and Beverages3 and Dietary Supplements4,by Family Income (in Dollars) and Age, in the United States, 2013-2014 (continued)
S e l e n i u m
──────────────── All Individuals 5 ──────────────── ────────────── Supplement Users 6 ────────────── ─ Non-users 7 ─
Family incomein dollarsand age
Percentreporting
supplementselenium 8
SampleSize Food Supplement
Food plussupplement
Samplesize Food Supplement
Food plussupplement Food
(years) % (SE) µg (SE) µg (SE) µg (SE) µg (SE) µg (SE) µg (SE) µg (SE)
$0 - $24,999:2 - 19.............. 3 (0.9) 951 97.3 (2.51) 1.9* (0.80) 99.2 (2.70) -- -- -- 93.5 (2.66)
20 and over.......... 18 (1.5) 1482 111.1 (1.76) 11.4 (1.13) 122.4 (2.18) 242 108.6 (3.40) 64.5 (2.85) 173.1 (4.71) 111.6 (2.13)
2 and over... 14 (1.2) 2433 107.5 (1.16) 9.0 (0.91) 116.5 (1.62) 258 115.0 (6.41) 65.0 (2.71) 180.0 (7.26) 106.3 (1.29)
$25,000 - $74,999:2 - 19............... 2 (0.8) 1119 96.3 (1.85) 2.5* (1.12) 98.8 (2.09) -- -- -- 95.3 (1.84)
20 and over.......... 21 (1.4) 1799 116.5 (1.97) 15.5 (1.55) 132.0 (1.91) 328 111.5 (3.40) 72.8 (4.61) 184.3 (6.85) 117.9 (2.21)
2 and over... 17 (1.3) 2918 111.7 (1.83) 12.4 (1.43) 124.2 (1.91) 344 112.4 (3.76) 73.8 (4.92) 186.2 (7.60) 111.6 (2.07)
$75,000 and higher:2 - 19.............. 2 (0.6) 747 99.4 (3.29) 1.4* (0.45) 100.7 (3.39) -- -- -- 99.1 (3.34)
20 and over.......... 26 (2.1) 1253 121.6 (2.06) 18.7 (1.65) 140.3 (2.97) 268 125.1 (5.22) 72.6 (2.37) 197.6 (6.23) 120.4 (2.64)
2 and over... 20 (1.7) 2000 116.0 (1.52) 14.4 (1.24) 130.3 (1.87) 283 124.5 (5.09) 72.0 (2.26) 196.6 (6.04) 113.9 (2.39)
All Individuals 9:2 - 19.............. 3 (0.4) 2974 97.7 (1.12) 1.9 (0.41) 99.6 (1.07) -- -- -- 96.1 (1.36)
20 and over.......... 22 (1.2) 4830 117.0 (1.03) 15.5 (1.10) 132.5 (1.44) 887 116.0 (2.87) 71.1 (2.57) 187.1 (4.98) 117.3 (1.30)
2 and over... 17 (1.0) 7804 112.3 (0.96) 12.1 (0.86) 124.4 (1.12) 937 117.6 (3.08) 71.2 (2.71) 188.8 (5.24) 111.2 (1.23)

What We Eat in America, NHANES 2013-2014
Page 23 of 23Page 23 of 23
Symbol Legend
* Indicates an estimate that may be less statistically reliable than estimates that are not flagged. The rules for flagging estimated means and percentages are as follows:
Mean: An estimated mean is flagged when the relative standard error is greater than 30 percent.
Percent reporting a supplement intake: An estimated percentage between 25 and 75 percent is flagged when based on a sample size of less than 30 times the variance inflation factor(VIF), where the VIF represents a broadly calculated average design effect, or when the relative standard error is greater than 30 percent. An estimated percentage less than or equal to 25percent or greater than or equal to 75 percent is flagged when the smaller of np and n(1-p) is less than 8 times the VIF, where n is the sample size and p is the percentage expressed as afraction. The VIF used in this table is 1.98.
# Indicates a non-zero value too small to report.
-- Estimated mean not presented where sample size is less than 30 times the variance inflation factor (VIF), i.e., sample size less than 59 for VIF = 1.98.
Footnotes
1 Sample weights designed for dietary analysis were used to allow estimates representative of the U. S. population for the years of collection.
2 Selection of the 22 vitamins, minerals, and carotenoids was based on the availability of Day 1 nutrient intakes from both food and dietary supplements. At the time of this release, supplementdata were not available for vitamin A, vitamin E, and other carotenoids.
Niacin: values do not include niacin-equivalents from tryptophan.Folic acid: the synthetic form of folate used as a fortificant in foods and dietary supplements.Folate (DFE): µg dietary folate equivalents = µg food folate + (1.7*µg folic acid).Vitamin D: 1 µg = 40 International Units (IU).Calcium and Magnesium: supplement intake includes non-prescription antacids.
3 Food and beverage intake was estimated from Day 1 dietary recall interviews conducted in the What We Eat in America, National Health and Nutrition Examination Survey (NHANES)2013-2014. The 24-hour dietary recalls were conducted in-person, by trained interviewers, using the USDA 5-step Automated Multiple-Pass Method. Food intakes were coded and nutrientvalues were determined using the USDA Food and Nutrient Database for Dietary Studies 2013-2014 www.ars.usda.gov/nea/bhnrc/fsrg.
4 Dietary supplement intake was estimated from the Day 1 Total Dietary Supplements File (DS1TOT_h) of NHANES 2013-2014. Collected as part of the dietary supplement component of the24-hour dietary recall, intakes now reflect the same timeframe as the food and beverage intake. Data are collected on the usage of all vitamins, minerals, herbals, and other dietary supplements aswell as non-prescription antacids and calculated using the NHANES-Dietary Supplement Database. Documentation available at: http://www.cdc.gov/nchs/nhanes/nhanes2013-2014/DS1TOT_h.htm.
5 All Individuals: includes both supplement users and non-users 2 years and over. Pregnant and/or lactating females, breast-fed children, and individuals with incomplete dietary supplementcomponent of the 24-hour dietary recall were excluded.
6 Supplement Users: includes individuals who reported taking at least one multi- and/or single-nutrient supplement that contained the vitamin or mineral displayed on this page.
7 Non-users: includes individuals who did not report taking any dietary supplement that contained the vitamin or mineral displayed on this page. Non-users may include individuals that reportedother dietary supplements.
8 The weighted percentage of respondents in the income/age group who reported taking at least one multi- and /or single- nutrient supplement containing this nutrient.
9 Includes persons of all income levels or with unknown family income.
Abbreviations
SE = standard error; DFE = dietary folate equivalents.
Suggested Citation
U.S. Department of Agriculture, Agricultural Research Service. 2017. Total Nutrient Intakes: Percent Reporting and Mean Amounts of Selected Vitamins and Minerals from Food and Beveragesand Dietary Supplements, by Family Income (in Dollars) and Age, What We Eat in America, NHANES 2013-2014. Available: www.ars.usda.gov/nea/bhnrc/fsrg.

Page 1 of 23Available: www.ars.usda.gov/nea/bhnrc/fsrg.
DATA SOURCE: What We Eat in America, NHANES 2013-2014, day 1 food and supplement intake data, 2 years and over (excluding individuals pregnant, lactating, breast-fed, or with incomplete supplement data.).
See page 23 for footnotes.
What We Eat in America, NHANES 2013-2014
Table 40. Total Nutrient Intakes: Percent Reporting and Mean Amounts1 of Selected2 Vitamins and Minerals from Food and Beverages3 and Dietary Supplements4,by Family Income (as % of Poverty Level5) and Age, in the United States, 2013-2014
T h i a m i n
──────────────── All Individuals 6 ──────────────── ────────────── Supplement Users 7 ────────────── ─ Non-users 8 ─
Family income as% of poverty level
and age
Percentreporting
supplementthiamin 9
SampleSize Food Supplement
Food plussupplement
Samplesize Food Supplement
Food plussupplement Food
(years) % (SE) mg (SE) mg (SE) mg (SE) mg (SE) mg (SE) mg (SE) mg (SE)
Under 131% poverty:2 - 19.............. 6 (1.3) 1354 1.47 (0.033) 0.59* (0.296) 2.06 (0.288) 66 1.75 (0.117) 9.81* (4.882) 11.56* (4.961) 1.46 (0.038)
20 and over.......... 18 (1.6) 1517 1.59 (0.030) 4.22* (2.266) 5.81* (2.268) 245 1.57 (0.072) 23.93*(12.404) 25.50*(12.402) 1.59 (0.032)
2 and over... 14 (1.1) 2871 1.55 (0.024) 3.02* (1.546) 4.57* (1.550) 311 1.60 (0.068) 21.90*(10.738) 23.50*(10.738) 1.54 (0.026)
131-350% poverty:2 - 19.............. 6 (1.2) 896 1.63 (0.045) 0.26* (0.125) 1.88 (0.162) 61 2.35 (0.663) 4.31* (1.787) 6.66* (2.407) 1.58 (0.038)
20 and over.......... 22 (1.4) 1558 1.63 (0.032) 5.33* (2.792) 6.96* (2.801) 307 1.57 (0.048) 23.89*(12.027) 25.46*(12.038) 1.65 (0.040)
2 and over... 18 (1.3) 2454 1.63 (0.031) 4.04* (2.121) 5.67* (2.134) 368 1.64 (0.074) 22.25*(11.148) 23.88*(11.212) 1.63 (0.034)
Over 350% poverty:2 - 19.............. 9 (2.1) 532 1.60 (0.058) 0.27* (0.112) 1.88 (0.137) -- -- -- 1.58 (0.056)
20 and over.......... 30 (1.6) 1411 1.65 (0.019) 5.33 (0.984) 6.97 (0.990) 380 1.78 (0.063) 17.59 (3.508) 19.37 (3.513) 1.59 (0.022)
2 and over... 27 (1.2) 1943 1.64 (0.020) 4.43 (0.832) 6.07 (0.837) 421 1.78 (0.062) 16.71 (3.164) 18.49 (3.168) 1.59 (0.024)
All Individuals 10:2 - 19.............. 7 (0.5) 2974 1.57 (0.027) 0.41* (0.127) 1.98 (0.124) 177 1.99 (0.223) 6.17* (2.035) 8.16 (2.155) 1.54 (0.028)
20 and over.......... 24 (1.2) 4830 1.62 (0.018) 4.84 (1.097) 6.47 (1.103) 991 1.67 (0.037) 20.13 (4.247) 21.80 (4.253) 1.61 (0.022)
2 and over... 20 (0.9) 7804 1.61 (0.018) 3.75 (0.842) 5.36 (0.850) 1168 1.70 (0.039) 18.97 (3.958) 20.66 (3.975) 1.59 (0.021)

Page 2 of 23Available: www.ars.usda.gov/nea/bhnrc/fsrg.
DATA SOURCE: What We Eat in America, NHANES 2013-2014, day 1 food and supplement intake data, 2 years and over (excluding individuals pregnant, lactating, breast-fed, or with incomplete supplement data.).
See page 23 for footnotes.
What We Eat in America, NHANES 2013-2014
Table 40. Total Nutrient Intakes: Percent Reporting and Mean Amounts1 of Selected2 Vitamins and Minerals from Food and Beverages3 and Dietary Supplements4,by Family Income (as % of Poverty Level5) and Age, in the United States, 2013-2014 (continued)
R i b o f l a v i n
──────────────── All Individuals 6 ──────────────── ────────────── Supplement Users 7 ────────────── ─ Non-users 8 ─
Family income as% of poverty level
and age
Percentreporting
supplementriboflavin 9
SampleSize Food Supplement
Food plussupplement
Samplesize Food Supplement
Food plussupplement Food
(years) % (SE) mg (SE) mg (SE) mg (SE) mg (SE) mg (SE) mg (SE) mg (SE)
Under 131% poverty:2 - 19.............. 6 (1.3) 1354 1.82 (0.037) 0.39* (0.167) 2.21 (0.152) 66 2.23 (0.265) 6.41* (2.754) 8.64* (3.003) 1.80 (0.051)
20 and over.......... 18 (1.5) 1517 2.07 (0.056) 1.30 (0.265) 3.37 (0.258) 245 2.15 (0.112) 7.33 (1.284) 9.49 (1.254) 2.05 (0.060)
2 and over... 14 (1.1) 2871 1.99 (0.041) 1.00 (0.169) 2.99 (0.176) 311 2.16 (0.115) 7.20 (1.161) 9.37 (1.164) 1.96 (0.043)
131-350% poverty:2 - 19.............. 6 (1.2) 896 2.12 (0.076) 0.27* (0.125) 2.40 (0.180) 61 3.41* (1.244) 4.60* (1.755) 8.01* (2.910) 2.04 (0.072)
20 and over.......... 23 (1.4) 1558 2.19 (0.050) 2.03 (0.342) 4.22 (0.348) 312 2.23 (0.077) 8.95 (1.419) 11.18 (1.441) 2.18 (0.056)
2 and over... 18 (1.3) 2454 2.17 (0.052) 1.59 (0.265) 3.76 (0.280) 373 2.33 (0.133) 8.59 (1.321) 10.92 (1.375) 2.14 (0.049)
Over 350% poverty:2 - 19.............. 9 (2.1) 532 2.06 (0.067) 0.33* (0.153) 2.39 (0.170) -- -- -- 2.05 (0.063)
20 and over.......... 30 (1.6) 1411 2.25 (0.044) 2.89 (0.458) 5.15 (0.473) 375 2.48 (0.108) 9.65 (1.596) 12.13 (1.623) 2.16 (0.033)
2 and over... 26 (1.2) 1943 2.22 (0.036) 2.44 (0.359) 4.66 (0.375) 415 2.46 (0.096) 9.29 (1.381) 11.75 (1.397) 2.14 (0.030)
All Individuals 10:2 - 19.............. 7 (0.5) 2974 2.00 (0.040) 0.36 (0.098) 2.36 (0.099) 176 2.64 (0.411) 5.43 (1.596) 8.07 (1.857) 1.95 (0.044)
20 and over.......... 24 (1.1) 4830 2.18 (0.028) 2.15 (0.264) 4.34 (0.273) 992 2.33 (0.051) 8.93 (0.961) 11.26 (0.990) 2.14 (0.034)
2 and over... 20 (0.9) 7804 2.14 (0.029) 1.71 (0.177) 3.85 (0.190) 1168 2.35 (0.068) 8.64 (0.797) 10.99 (0.819) 2.08 (0.032)
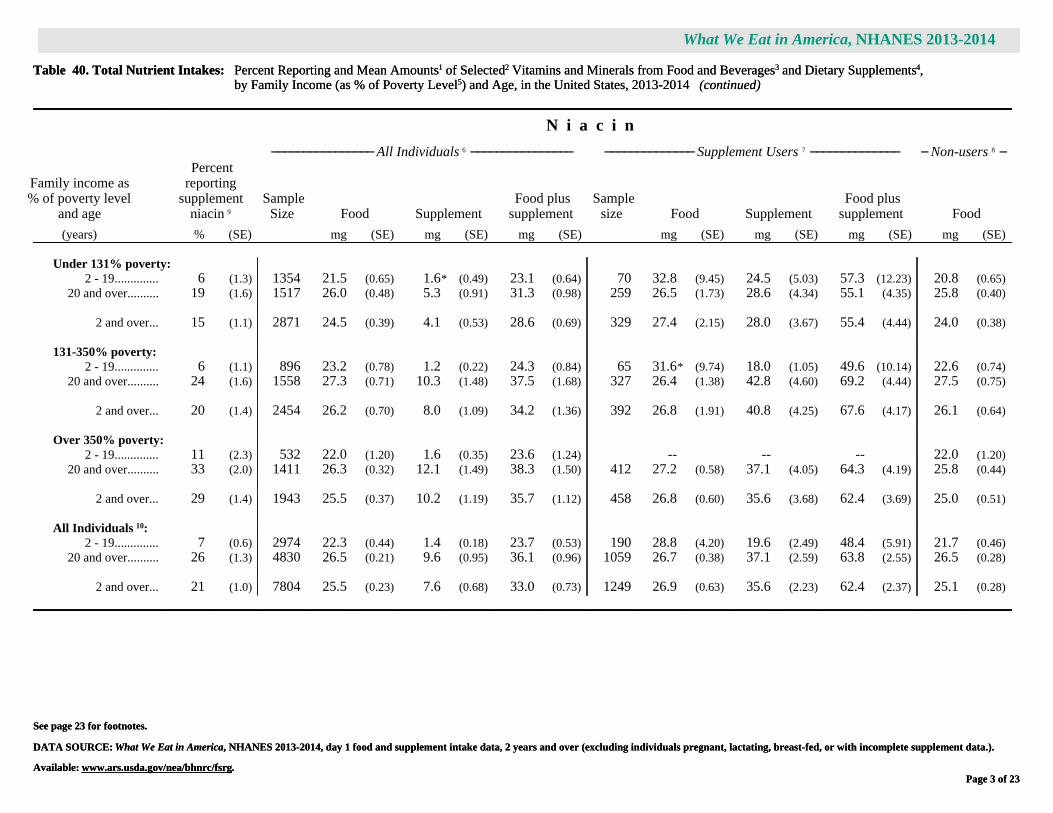
Page 3 of 23Available: www.ars.usda.gov/nea/bhnrc/fsrg.
DATA SOURCE: What We Eat in America, NHANES 2013-2014, day 1 food and supplement intake data, 2 years and over (excluding individuals pregnant, lactating, breast-fed, or with incomplete supplement data.).
See page 23 for footnotes.
What We Eat in America, NHANES 2013-2014
Table 40. Total Nutrient Intakes: Percent Reporting and Mean Amounts1 of Selected2 Vitamins and Minerals from Food and Beverages3 and Dietary Supplements4,by Family Income (as % of Poverty Level5) and Age, in the United States, 2013-2014 (continued)
N i a c i n
──────────────── All Individuals 6 ──────────────── ────────────── Supplement Users 7 ────────────── ─ Non-users 8 ─
Family income as% of poverty level
and age
Percentreporting
supplementniacin 9
SampleSize Food Supplement
Food plussupplement
Samplesize Food Supplement
Food plussupplement Food
(years) % (SE) mg (SE) mg (SE) mg (SE) mg (SE) mg (SE) mg (SE) mg (SE)
Under 131% poverty:2 - 19.............. 6 (1.3) 1354 21.5 (0.65) 1.6* (0.49) 23.1 (0.64) 70 32.8 (9.45) 24.5 (5.03) 57.3 (12.23) 20.8 (0.65)
20 and over.......... 19 (1.6) 1517 26.0 (0.48) 5.3 (0.91) 31.3 (0.98) 259 26.5 (1.73) 28.6 (4.34) 55.1 (4.35) 25.8 (0.40)
2 and over... 15 (1.1) 2871 24.5 (0.39) 4.1 (0.53) 28.6 (0.69) 329 27.4 (2.15) 28.0 (3.67) 55.4 (4.44) 24.0 (0.38)
131-350% poverty:2 - 19.............. 6 (1.1) 896 23.2 (0.78) 1.2 (0.22) 24.3 (0.84) 65 31.6* (9.74) 18.0 (1.05) 49.6 (10.14) 22.6 (0.74)
20 and over.......... 24 (1.6) 1558 27.3 (0.71) 10.3 (1.48) 37.5 (1.68) 327 26.4 (1.38) 42.8 (4.60) 69.2 (4.44) 27.5 (0.75)
2 and over... 20 (1.4) 2454 26.2 (0.70) 8.0 (1.09) 34.2 (1.36) 392 26.8 (1.91) 40.8 (4.25) 67.6 (4.17) 26.1 (0.64)
Over 350% poverty:2 - 19.............. 11 (2.3) 532 22.0 (1.20) 1.6 (0.35) 23.6 (1.24) -- -- -- 22.0 (1.20)
20 and over.......... 33 (2.0) 1411 26.3 (0.32) 12.1 (1.49) 38.3 (1.50) 412 27.2 (0.58) 37.1 (4.05) 64.3 (4.19) 25.8 (0.44)
2 and over... 29 (1.4) 1943 25.5 (0.37) 10.2 (1.19) 35.7 (1.12) 458 26.8 (0.60) 35.6 (3.68) 62.4 (3.69) 25.0 (0.51)
All Individuals 10:2 - 19.............. 7 (0.6) 2974 22.3 (0.44) 1.4 (0.18) 23.7 (0.53) 190 28.8 (4.20) 19.6 (2.49) 48.4 (5.91) 21.7 (0.46)
20 and over.......... 26 (1.3) 4830 26.5 (0.21) 9.6 (0.95) 36.1 (0.96) 1059 26.7 (0.38) 37.1 (2.59) 63.8 (2.55) 26.5 (0.28)
2 and over... 21 (1.0) 7804 25.5 (0.23) 7.6 (0.68) 33.0 (0.73) 1249 26.9 (0.63) 35.6 (2.23) 62.4 (2.37) 25.1 (0.28)

Page 4 of 23Available: www.ars.usda.gov/nea/bhnrc/fsrg.
DATA SOURCE: What We Eat in America, NHANES 2013-2014, day 1 food and supplement intake data, 2 years and over (excluding individuals pregnant, lactating, breast-fed, or with incomplete supplement data.).
See page 23 for footnotes.
What We Eat in America, NHANES 2013-2014
Table 40. Total Nutrient Intakes: Percent Reporting and Mean Amounts1 of Selected2 Vitamins and Minerals from Food and Beverages3 and Dietary Supplements4,by Family Income (as % of Poverty Level5) and Age, in the United States, 2013-2014 (continued)
V i t a m i n B 6
──────────────── All Individuals 6 ──────────────── ────────────── Supplement Users 7 ────────────── ─ Non-users 8 ─
Family income as% of poverty level
and age
Percentreporting
supplementvitamin B6 9
SampleSize Food Supplement
Food plussupplement
Samplesize Food Supplement
Food plussupplement Food
(years) % (SE) mg (SE) mg (SE) mg (SE) mg (SE) mg (SE) mg (SE) mg (SE)
Under 131% poverty:2 - 19.............. 13 (2.0) 1354 1.73 (0.063) 0.44* (0.156) 2.17 (0.173) 157 2.11 (0.374) 3.30* (1.151) 5.41 (1.494) 1.68 (0.071)
20 and over.......... 20 (1.5) 1517 2.13 (0.079) 2.15 (0.467) 4.28 (0.455) 274 2.33 (0.257) 11.00 (2.158) 13.33 (2.099) 2.08 (0.065)
2 and over... 17 (1.3) 2871 2.00 (0.061) 1.59 (0.292) 3.58 (0.299) 431 2.28 (0.218) 9.08 (1.640) 11.35 (1.601) 1.94 (0.054)
131-350% poverty:2 - 19.............. 18 (2.0) 896 1.88 (0.083) 0.48 (0.120) 2.36 (0.171) 161 1.95 (0.385) 2.65 (0.643) 4.60 (0.994) 1.87 (0.079)
20 and over.......... 26 (1.4) 1558 2.27 (0.084) 3.19 (0.594) 5.46 (0.602) 345 2.21 (0.123) 12.50 (2.245) 14.71 (2.254) 2.28 (0.087)
2 and over... 24 (1.2) 2454 2.17 (0.078) 2.50 (0.445) 4.67 (0.464) 506 2.16 (0.164) 10.58 (1.869) 12.74 (1.904) 2.17 (0.066)
Over 350% poverty:2 - 19.............. 26 (4.3) 532 1.83 (0.109) 0.67 (0.152) 2.50 (0.191) 118 1.72 (0.126) 2.60 (0.644) 4.32 (0.677) 1.87 (0.119)
20 and over.......... 34 (2.1) 1411 2.20 (0.037) 5.82* (2.738) 8.02* (2.735) 427 2.28 (0.067) 17.31* (8.060) 19.58* (8.061) 2.15 (0.042)
2 and over... 32 (2.0) 1943 2.13 (0.034) 4.91* (2.252) 7.04* (2.249) 545 2.20 (0.064) 15.22* (6.918) 17.41* (6.919) 2.10 (0.045)
All Individuals 10:2 - 19.............. 18 (1.5) 2974 1.81 (0.039) 0.54 (0.093) 2.35 (0.116) 452 1.94 (0.181) 3.01 (0.679) 4.95 (0.838) 1.79 (0.047)
20 and over.......... 27 (1.2) 4830 2.21 (0.030) 3.88 (1.107) 6.08 (1.099) 1107 2.26 (0.045) 14.40 (3.987) 16.66 (3.988) 2.19 (0.032)
2 and over... 25 (1.1) 7804 2.11 (0.027) 3.05 (0.826) 5.16 (0.820) 1559 2.20 (0.065) 12.37 (3.261) 14.57 (3.264) 2.08 (0.029)

Page 5 of 23Available: www.ars.usda.gov/nea/bhnrc/fsrg.
DATA SOURCE: What We Eat in America, NHANES 2013-2014, day 1 food and supplement intake data, 2 years and over (excluding individuals pregnant, lactating, breast-fed, or with incomplete supplement data.).
See page 23 for footnotes.
What We Eat in America, NHANES 2013-2014
Table 40. Total Nutrient Intakes: Percent Reporting and Mean Amounts1 of Selected2 Vitamins and Minerals from Food and Beverages3 and Dietary Supplements4,by Family Income (as % of Poverty Level5) and Age, in the United States, 2013-2014 (continued)
F o l i c a c i d
──────────────── All Individuals 6 ──────────────── ────────────── Supplement Users 7 ────────────── ─ Non-users 8 ─
Family income as% of poverty level
and age
Percentreporting
supplementfolic acid 9
SampleSize Food Supplement
Food plussupplement
Samplesize Food Supplement
Food plussupplement Food
(years) % (SE) µg (SE) µg (SE) µg (SE) µg (SE) µg (SE) µg (SE) µg (SE)
Under 131% poverty:2 - 19.............. 13 (2.0) 1354 202 (8.0) 35 (5.0) 238 (8.2) 156 198 (18.4) 269 (24.1) 467 (35.2) 203 (9.5)
20 and over.......... 19 (1.5) 1517 187 (10.5) 85 (8.1) 272 (15.4) 263 186 (15.0) 453 (11.6) 639 (20.5) 187 (10.8)
2 and over... 17 (1.3) 2871 192 (8.9) 69 (5.7) 261 (12.1) 419 189 (14.5) 406 (15.1) 595 (21.9) 192 (9.4)
131-350% poverty:2 - 19.............. 17 (2.0) 896 213 (16.7) 37 (4.1) 250 (19.0) 156 253 (62.4) 212 (18.1) 465 (69.4) 205 (14.1)
20 and over.......... 25 (1.4) 1558 176 (8.1) 113 (7.4) 289 (12.1) 338 172 (9.9) 455 (13.2) 627 (15.6) 177 (9.0)
2 and over... 23 (1.2) 2454 185 (8.6) 94 (6.2) 279 (12.2) 494 188 (13.4) 408 (14.7) 596 (23.5) 185 (9.3)
Over 350% poverty:2 - 19.............. 25 (4.5) 532 196 (8.5) 57 (10.6) 252 (15.5) 115 184 (16.9) 223 (13.2) 407 (26.5) 200 (10.3)
20 and over.......... 33 (2.1) 1411 178 (3.5) 156 (10.8) 334 (11.4) 424 196 (9.9) 467 (24.7) 663 (25.1) 169 (3.6)
2 and over... 32 (1.9) 1943 181 (3.6) 138 (9.7) 320 (10.5) 539 195 (9.9) 432 (24.6) 627 (24.8) 175 (3.3)
All Individuals 10:2 - 19.............. 17 (1.6) 2974 208 (7.4) 40 (3.2) 248 (7.8) 443 217 (22.7) 232 (11.2) 449 (29.9) 206 (8.4)
20 and over.......... 26 (1.2) 4830 179 (4.3) 121 (5.2) 300 (7.4) 1086 186 (7.0) 459 (12.0) 646 (14.9) 177 (4.6)
2 and over... 24 (1.1) 7804 186 (4.2) 101 (4.2) 288 (6.2) 1529 192 (7.1) 419 (11.4) 611 (14.2) 184 (4.7)

Page 6 of 23Available: www.ars.usda.gov/nea/bhnrc/fsrg.
DATA SOURCE: What We Eat in America, NHANES 2013-2014, day 1 food and supplement intake data, 2 years and over (excluding individuals pregnant, lactating, breast-fed, or with incomplete supplement data.).
See page 23 for footnotes.
What We Eat in America, NHANES 2013-2014
Table 40. Total Nutrient Intakes: Percent Reporting and Mean Amounts1 of Selected2 Vitamins and Minerals from Food and Beverages3 and Dietary Supplements4,by Family Income (as % of Poverty Level5) and Age, in the United States, 2013-2014 (continued)
F o l a t e ( D F E )
──────────────── All Individuals 6 ──────────────── ────────────── Supplement Users 7 ────────────── ─ Non-users 8 ─
Family income as% of poverty level
and age
Percentreporting
supplementfolate (DFE) 9
SampleSize Food Supplement
Food plussupplement
Samplesize Food Supplement
Food plussupplement Food
(years) % (SE) µg (SE) µg (SE) µg (SE) µg (SE) µg (SE) µg (SE) µg (SE)
Under 131% poverty:2 - 19.............. 13 (2.0) 1354 498 (16.2) 60 (8.4) 558 (15.9) 156 499 (34.8) 457 (41.0) 957 (64.2) 498 (19.6)
20 and over.......... 19 (1.5) 1517 525 (20.8) 145 (13.7) 670 (29.3) 263 521 (31.0) 771 (19.7) 1292 (39.7) 526 (20.8)
2 and over... 17 (1.3) 2871 516 (17.5) 117 (9.7) 633 (23.1) 419 516 (28.6) 690 (25.7) 1206 (41.7) 516 (18.0)
131-350% poverty:2 - 19.............. 17 (2.0) 896 523 (30.6) 62 (7.0) 585 (34.3) 156 588 (113.1) 361 (30.7) 948 (123.7) 509 (27.6)
20 and over.......... 25 (1.4) 1558 521 (16.6) 192 (12.6) 714 (21.3) 338 519 (20.6) 773 (22.4) 1293 (29.2) 522 (18.2)
2 and over... 23 (1.2) 2454 522 (16.8) 159 (10.6) 681 (21.6) 494 533 (23.9) 694 (25.0) 1227 (39.2) 519 (18.4)
Over 350% poverty:2 - 19.............. 25 (4.5) 532 494 (14.5) 96 (18.0) 590 (26.2) 115 489 (37.9) 379 (22.5) 868 (54.3) 496 (16.2)
20 and over.......... 33 (2.1) 1411 536 (7.8) 265 (18.4) 801 (18.5) 424 592 (22.7) 793 (42.0) 1385 (41.7) 509 (9.7)
2 and over... 32 (1.9) 1943 529 (6.5) 235 (16.5) 764 (17.0) 539 577 (22.1) 735 (41.7) 1313 (44.0) 506 (8.6)
All Individuals 10:2 - 19.............. 17 (1.6) 2974 511 (13.2) 69 (5.5) 580 (13.9) 443 535 (42.7) 394 (19.1) 929 (55.1) 506 (15.3)
20 and over.......... 26 (1.2) 4830 528 (8.5) 206 (8.8) 734 (13.9) 1086 555 (13.4) 781 (20.3) 1336 (26.4) 518 (9.5)
2 and over... 24 (1.1) 7804 524 (8.1) 172 (7.2) 696 (11.7) 1529 551 (14.6) 712 (19.3) 1263 (26.7) 515 (9.1)

Page 7 of 23Available: www.ars.usda.gov/nea/bhnrc/fsrg.
DATA SOURCE: What We Eat in America, NHANES 2013-2014, day 1 food and supplement intake data, 2 years and over (excluding individuals pregnant, lactating, breast-fed, or with incomplete supplement data.).
See page 23 for footnotes.
What We Eat in America, NHANES 2013-2014
Table 40. Total Nutrient Intakes: Percent Reporting and Mean Amounts1 of Selected2 Vitamins and Minerals from Food and Beverages3 and Dietary Supplements4,by Family Income (as % of Poverty Level5) and Age, in the United States, 2013-2014 (continued)
C h o l i n e
──────────────── All Individuals 6 ──────────────── ────────────── Supplement Users 7 ────────────── ─ Non-users 8 ─
Family income as% of poverty level
and age
Percentreporting
supplementcholine 9
SampleSize Food Supplement
Food plussupplement
Samplesize Food Supplement
Food plussupplement Food
(years) % (SE) mg (SE) mg (SE) mg (SE) mg (SE) mg (SE) mg (SE) mg (SE)
Under 131% poverty:2 - 19.............. 6 (1.6) 1354 248 (5.5) 1* (0.5) 249 (5.4) 62 367 (86.3) 21* (7.1) 388 (88.1) 240 (6.1)
20 and over.......... 2 (0.4) 1517 327 (6.3) 1* (0.4) 328 (6.4) -- -- -- 326 (6.4)
2 and over... 4 (0.6) 2871 301 (4.6) 1* (0.4) 302 (4.8) 102 367 (50.8) 29* (9.5) 396 (53.0) 298 (5.3)
131-350% poverty:2 - 19.............. 7 (1.2) 896 268 (6.7) # 268 (6.7) 61 306 (58.6) 6* (2.4) 313 (60.4) 265 (9.0)
20 and over.......... 5 (0.7) 1558 345 (7.4) 1* (0.4) 347 (7.2) -- -- -- 346 (7.0)
2 and over... 5 (0.6) 2454 326 (7.0) 1 (0.3) 327 (6.9) 120 329 (30.2) 21 (4.6) 349 (31.2) 325 (6.6)
Over 350% poverty:2 - 19.............. 11 (2.5) 532 252 (10.0) 1* (0.4) 252 (10.1) 61 277 (26.3) 8* (3.0) 285 (24.7) 248 (10.3)
20 and over.......... 6 (1.4) 1411 342 (6.7) 1 (0.4) 343 (6.6) 82 340 (16.1) 22 (3.8) 363 (17.4) 342 (6.4)
2 and over... 7 (1.3) 1943 326 (5.2) 1 (0.3) 327 (5.1) 143 323 (16.4) 18 (2.7) 341 (17.1) 326 (5.0)
All Individuals 10:2 - 19.............. 7 (0.9) 2974 256 (3.5) 1 (0.2) 256 (3.5) 187 317 (34.0) 11 (3.0) 328 (34.9) 251 (4.1)
20 and over.......... 5 (0.7) 4830 339 (4.0) 1 (0.3) 340 (3.9) 192 339 (15.5) 25 (3.6) 364 (17.5) 339 (3.7)
2 and over... 5 (0.5) 7804 318 (3.4) 1 (0.2) 319 (3.4) 379 332 (14.3) 20 (2.4) 352 (14.4) 318 (3.2)

Page 8 of 23Available: www.ars.usda.gov/nea/bhnrc/fsrg.
DATA SOURCE: What We Eat in America, NHANES 2013-2014, day 1 food and supplement intake data, 2 years and over (excluding individuals pregnant, lactating, breast-fed, or with incomplete supplement data.).
See page 23 for footnotes.
What We Eat in America, NHANES 2013-2014
Table 40. Total Nutrient Intakes: Percent Reporting and Mean Amounts1 of Selected2 Vitamins and Minerals from Food and Beverages3 and Dietary Supplements4,by Family Income (as % of Poverty Level5) and Age, in the United States, 2013-2014 (continued)
V i t a m i n B 1 2
──────────────── All Individuals 6 ──────────────── ────────────── Supplement Users 7 ────────────── ─ Non-users 8 ─
Family income as% of poverty level
and age
Percentreporting
supplementvitamin B12 9
SampleSize Food Supplement
Food plussupplement
Samplesize Food Supplement
Food plussupplement Food
(years) % (SE) µg (SE) µg (SE) µg (SE) µg (SE) µg (SE) µg (SE) µg (SE)
Under 131% poverty:2 - 19.............. 13 (2.0) 1354 4.48 (0.132) 7.0* (6.07) 11.4* (6.01) 157 4.33 (0.285) 52.7* (45.90) 57.0* (46.03) 4.50 (0.183)
20 and over.......... 21 (1.5) 1517 4.82 (0.152) 55.4 (12.77) 60.2 (12.78) 291 4.78 (0.321) 266.6 (62.72) 271.3 (62.73) 4.83 (0.173)
2 and over... 18 (1.4) 2871 4.71 (0.113) 39.4 (9.61) 44.1 (9.62) 448 4.67 (0.277) 215.5 (52.71) 220.2 (52.77) 4.72 (0.146)
131-350% poverty:2 - 19.............. 18 (2.0) 896 4.99 (0.277) 2.8* (1.17) 7.8 (1.32) 158 5.51 (1.227) 16.2* (6.80) 21.7* (7.74) 4.87 (0.225)
20 and over.......... 26 (1.5) 1558 5.17 (0.231) 75.7 (17.75) 80.9 (17.76) 360 4.91 (0.413) 286.6 (72.00) 291.5 (72.09) 5.26 (0.246)
2 and over... 24 (1.3) 2454 5.12 (0.227) 57.2 (13.30) 62.3 (13.34) 518 5.02 (0.519) 236.6 (60.06) 241.7 (60.17) 5.15 (0.207)
Over 350% poverty:2 - 19.............. 26 (4.4) 532 4.93 (0.335) 2.4* (1.02) 7.3 (1.12) 116 4.76 (0.445) 9.3* (4.53) 14.0* (4.72) 4.98 (0.348)
20 and over.......... 34 (1.8) 1411 4.88 (0.126) 61.2 (12.58) 66.1 (12.57) 435 5.18 (0.259) 177.4 (39.70) 182.6 (39.63) 4.72 (0.108)
2 and over... 33 (1.7) 1943 4.88 (0.110) 50.8 (10.32) 55.7 (10.30) 551 5.12 (0.228) 154.3 (34.18) 159.4 (34.10) 4.77 (0.101)
All Individuals 10:2 - 19.............. 18 (1.6) 2974 4.79 (0.106) 4.1* (2.12) 8.9 (2.16) 446 5.02 (0.428) 23.3* (12.45) 28.3* (12.60) 4.75 (0.129)
20 and over.......... 28 (1.1) 4830 4.97 (0.083) 65.3 (8.07) 70.3 (8.08) 1152 4.97 (0.189) 234.1 (33.12) 239.1 (33.08) 4.97 (0.088)
2 and over... 25 (1.0) 7804 4.93 (0.073) 50.2 (6.41) 55.1 (6.42) 1598 4.98 (0.202) 198.1 (28.75) 203.1 (28.73) 4.91 (0.070)

Page 9 of 23Available: www.ars.usda.gov/nea/bhnrc/fsrg.
DATA SOURCE: What We Eat in America, NHANES 2013-2014, day 1 food and supplement intake data, 2 years and over (excluding individuals pregnant, lactating, breast-fed, or with incomplete supplement data.).
See page 23 for footnotes.
What We Eat in America, NHANES 2013-2014
Table 40. Total Nutrient Intakes: Percent Reporting and Mean Amounts1 of Selected2 Vitamins and Minerals from Food and Beverages3 and Dietary Supplements4,by Family Income (as % of Poverty Level5) and Age, in the United States, 2013-2014 (continued)
V i t a m i n C
──────────────── All Individuals 6 ──────────────── ────────────── Supplement Users 7 ────────────── ─ Non-users 8 ─
Family income as% of poverty level
and age
Percentreporting
supplementvitamin C 9
SampleSize Food Supplement
Food plussupplement
Samplesize Food Supplement
Food plussupplement Food
(years) % (SE) mg (SE) mg (SE) mg (SE) mg (SE) mg (SE) mg (SE) mg (SE)
Under 131% poverty:2 - 19.............. 15 (2.2) 1354 72.9 (2.95) 20.9* (7.96) 93.8 (7.13) 167 85.3 (6.04) 143.6* (43.86) 228.8 (43.68) 70.7 (3.22)
20 and over.......... 21 (1.5) 1517 74.9 (4.15) 54.3 (6.49) 129.2 (8.48) 295 78.4 (6.13) 254.6 (22.22) 333.0 (22.44) 74.0 (4.57)
2 and over... 19 (1.4) 2871 74.2 (2.79) 43.3 (6.30) 117.5 (6.65) 462 80.1 (4.73) 226.6 (25.73) 306.7 (25.74) 72.8 (3.00)
131-350% poverty:2 - 19.............. 19 (1.9) 896 69.9 (3.34) 25.0 (7.37) 94.9 (7.42) 178 80.5 (9.78) 128.9 (36.37) 209.4 (34.38) 67.4 (3.16)
20 and over.......... 29 (1.4) 1558 80.5 (2.44) 78.0 (8.16) 158.5 (9.49) 394 94.9 (6.91) 272.4 (29.71) 367.3 (31.10) 74.8 (2.63)
2 and over... 26 (1.1) 2454 77.8 (2.26) 64.5 (6.48) 142.3 (7.49) 572 92.2 (6.07) 245.4 (24.81) 337.6 (25.21) 72.7 (2.24)
Over 350% poverty:2 - 19.............. 27 (4.4) 532 76.5 (3.85) 15.2 (2.76) 91.7 (6.17) 125 87.2 (5.52) 56.6 (9.99) 143.8 (13.13) 72.6 (4.53)
20 and over.......... 35 (2.2) 1411 79.0 (2.38) 92.0 (17.06) 171.0 (16.95) 466 91.2 (3.28) 259.9 (45.18) 351.1 (45.20) 72.3 (3.81)
2 and over... 34 (2.0) 1943 78.6 (2.43) 78.4 (14.45) 156.9 (14.54) 591 90.7 (2.62) 231.4 (39.02) 322.0 (39.25) 72.4 (3.72)
All Individuals 10:2 - 19.............. 19 (1.5) 2974 73.1 (1.75) 21.0 (3.70) 94.1 (4.18) 488 84.1 (4.01) 110.2 (21.12) 194.3 (21.85) 70.5 (2.14)
20 and over.......... 29 (1.2) 4830 78.7 (1.72) 76.3 (8.55) 155.0 (9.73) 1225 90.3 (2.56) 262.3 (25.70) 352.6 (26.30) 74.0 (2.40)
2 and over... 27 (1.1) 7804 77.3 (1.27) 62.7 (6.58) 140.0 (7.30) 1713 89.2 (2.34) 235.4 (21.67) 324.6 (22.28) 73.0 (1.71)

Page 10 of 23Available: www.ars.usda.gov/nea/bhnrc/fsrg.
DATA SOURCE: What We Eat in America, NHANES 2013-2014, day 1 food and supplement intake data, 2 years and over (excluding individuals pregnant, lactating, breast-fed, or with incomplete supplement data.).
See page 23 for footnotes.
What We Eat in America, NHANES 2013-2014
Table 40. Total Nutrient Intakes: Percent Reporting and Mean Amounts1 of Selected2 Vitamins and Minerals from Food and Beverages3 and Dietary Supplements4,by Family Income (as % of Poverty Level5) and Age, in the United States, 2013-2014 (continued)
V i t a m i n D
──────────────── All Individuals 6 ──────────────── ────────────── Supplement Users 7 ────────────── ─ Non-users 8 ─
Family income as% of poverty level
and age
Percentreporting
supplementvitamin D 9
SampleSize Food Supplement
Food plussupplement
Samplesize Food Supplement
Food plussupplement Food
(years) % (SE) µg (SE) µg (SE) µg (SE) µg (SE) µg (SE) µg (SE) µg (SE)
Under 131% poverty:2 - 19.............. 14 (2.2) 1354 5.0 (0.13) 2.0 (0.49) 7.0 (0.55) 164 5.6 (0.47) 14.7 (1.62) 20.3 (1.59) 4.9 (0.15)
20 and over.......... 23 (1.6) 1517 4.4 (0.15) 7.1 (1.11) 11.5 (1.14) 337 5.2 (0.34) 31.5 (4.25) 36.7 (4.19) 4.1 (0.16)
2 and over... 20 (1.5) 2871 4.6 (0.10) 5.4 (0.72) 10.0 (0.74) 501 5.3 (0.30) 27.7 (3.31) 33.0 (3.27) 4.4 (0.13)
131-350% poverty:2 - 19.............. 18 (1.8) 896 5.5 (0.28) 3.4 (0.66) 9.0 (0.79) 168 6.2 (0.79) 18.6 (3.91) 24.8 (4.14) 5.4 (0.29)
20 and over.......... 31 (1.2) 1558 4.7 (0.31) 12.0 (1.26) 16.8 (1.32) 426 5.4 (0.74) 39.4 (3.89) 44.8 (3.82) 4.4 (0.18)
2 and over... 27 (1.1) 2454 4.9 (0.25) 9.8 (0.93) 14.8 (0.99) 594 5.5 (0.71) 35.8 (3.44) 41.3 (3.45) 4.7 (0.14)
Over 350% poverty:2 - 19.............. 26 (4.6) 532 5.3 (0.30) 3.0 (0.61) 8.4 (0.86) 122 6.3 (0.56) 11.4 (0.95) 17.7 (1.33) 5.0 (0.24)
20 and over.......... 40 (2.3) 1411 5.0 (0.24) 13.7 (0.97) 18.7 (0.99) 524 5.7 (0.43) 34.1 (1.51) 39.8 (1.47) 4.6 (0.29)
2 and over... 38 (2.1) 1943 5.1 (0.20) 11.8 (0.76) 16.9 (0.76) 646 5.8 (0.37) 31.3 (1.41) 37.1 (1.39) 4.7 (0.24)
All Individuals 10:2 - 19.............. 18 (1.5) 2974 5.3 (0.10) 2.7 (0.36) 8.0 (0.39) 472 6.2 (0.26) 14.6 (1.69) 20.8 (1.74) 5.1 (0.12)
20 and over.......... 32 (1.3) 4830 4.8 (0.16) 11.9 (0.79) 16.6 (0.79) 1371 5.4 (0.37) 36.9 (1.89) 42.4 (1.77) 4.5 (0.14)
2 and over... 29 (1.1) 7804 4.9 (0.12) 9.6 (0.62) 14.5 (0.62) 1843 5.5 (0.32) 33.4 (1.74) 39.0 (1.70) 4.6 (0.10)

Page 11 of 23Available: www.ars.usda.gov/nea/bhnrc/fsrg.
DATA SOURCE: What We Eat in America, NHANES 2013-2014, day 1 food and supplement intake data, 2 years and over (excluding individuals pregnant, lactating, breast-fed, or with incomplete supplement data.).
See page 23 for footnotes.
What We Eat in America, NHANES 2013-2014
Table 40. Total Nutrient Intakes: Percent Reporting and Mean Amounts1 of Selected2 Vitamins and Minerals from Food and Beverages3 and Dietary Supplements4,by Family Income (as % of Poverty Level5) and Age, in the United States, 2013-2014 (continued)
V i t a m i n K
──────────────── All Individuals 6 ──────────────── ────────────── Supplement Users 7 ────────────── ─ Non-users 8 ─
Family income as% of poverty level
and age
Percentreporting
supplementvitamin K 9
SampleSize Food Supplement
Food plussupplement
Samplesize Food Supplement
Food plussupplement Food
(years) % (SE) µg (SE) µg (SE) µg (SE) µg (SE) µg (SE) µg (SE) µg (SE)
Under 131% poverty:2 - 19.............. 2 (0.5) 1354 66.2 (3.25) 0.5 (0.16) 66.7 (3.25) -- -- -- 65.7 (3.21)
20 and over.......... 14 (1.2) 1517 102.3 (6.06) 5.2 (0.61) 107.6 (6.25) 197 123.9 (13.32) 36.5 (2.68) 160.4 (12.41) 98.8 (6.46)
2 and over... 10 (0.8) 2871 90.4 (4.29) 3.7 (0.42) 94.1 (4.41) 216 122.1 (12.42) 36.1 (2.66) 158.2 (11.54) 86.8 (4.35)
131-350% poverty:2 - 19.............. 2 (0.7) 896 72.6 (5.85) 0.7* (0.20) 73.3 (5.81) -- -- -- 72.8 (6.01)
20 and over.......... 19 (1.3) 1558 120.9 (7.38) 7.5 (0.76) 128.4 (7.41) 265 144.8 (28.48) 38.5 (4.01) 183.4 (29.14) 115.2 (5.85)
2 and over... 15 (1.1) 2454 108.6 (5.62) 5.7 (0.52) 114.4 (5.65) 279 141.9 (28.08) 38.3 (3.91) 180.2 (28.84) 102.8 (4.84)
Over 350% poverty:2 - 19.............. 4 (0.9) 532 80.2 (6.89) 1.3 (0.29) 81.5 (6.83) -- -- -- 80.2 (6.92)
20 and over.......... 26 (1.9) 1411 135.1 (4.55) 20.7* (10.55) 155.8 (13.02) 320 160.5 (12.41) 79.2* (37.94) 239.7 (47.17) 126.1 (6.04)
2 and over... 22 (1.6) 1943 125.4 (4.30) 17.3* (8.65) 142.7 (11.27) 337 158.1 (12.26) 77.8* (36.92) 235.8 (46.10) 116.1 (5.25)
All Individuals 10:2 - 19.............. 3 (0.2) 2974 72.2 (3.12) 0.8 (0.12) 73.0 (3.12) -- -- -- 72.1 (3.05)
20 and over.......... 21 (1.1) 4830 122.5 (3.42) 11.9* (4.24) 134.4 (4.63) 830 148.0 (8.76) 57.9* (18.60) 205.9 (20.72) 115.8 (4.31)
2 and over... 16 (0.9) 7804 110.0 (2.83) 9.2* (3.22) 119.2 (3.91) 884 145.2 (8.72) 56.9* (17.94) 202.0 (20.23) 103.3 (3.43)

Page 12 of 23Available: www.ars.usda.gov/nea/bhnrc/fsrg.
DATA SOURCE: What We Eat in America, NHANES 2013-2014, day 1 food and supplement intake data, 2 years and over (excluding individuals pregnant, lactating, breast-fed, or with incomplete supplement data.).
See page 23 for footnotes.
What We Eat in America, NHANES 2013-2014
Table 40. Total Nutrient Intakes: Percent Reporting and Mean Amounts1 of Selected2 Vitamins and Minerals from Food and Beverages3 and Dietary Supplements4,by Family Income (as % of Poverty Level5) and Age, in the United States, 2013-2014 (continued)
L y c o p e n e
──────────────── All Individuals 6 ──────────────── ────────────── Supplement Users 7 ────────────── ─ Non-users 8 ─
Family income as% of poverty level
and age
Percentreporting
supplementlycopene 9
SampleSize Food Supplement
Food plussupplement
Samplesize Food Supplement
Food plussupplement Food
(years) % (SE) µg (SE) µg (SE) µg (SE) µg (SE) µg (SE) µg (SE) µg (SE)
Under 131% poverty:2 - 19.............. # 1354 4013 (269.8) 2* (0.8) 4015 (270.1) -- -- -- 4021 (268.8)
20 and over.......... 6 (0.9) 1517 4642 (307.8) 32* (10.4) 4674 (310.4) 84 6506 (1000.5) 578 (146.8) 7083 (938.8) 4533 (322.2)
2 and over... 4 (0.6) 2871 4434 (252.2) 22* (6.9) 4456 (253.2) 92 6359 (964.4) 575 (141.4) 6934 (900.9) 4358 (256.8)
131-350% poverty:2 - 19.............. 2 (0.8) 896 4403 (395.5) 9* (4.5) 4412 (397.2) -- -- -- 4404 (429.6)
20 and over.......... 9 (1.5) 1558 4831 (236.4) 56 (13.6) 4887 (237.8) 122 4074 (672.8) 631 (170.7) 4704 (698.0) 4905 (262.1)
2 and over... 7 (1.3) 2454 4722 (223.3) 44 (10.5) 4766 (223.1) 128 4092 (601.0) 620 (156.6) 4712 (642.1) 4770 (246.9)
Over 350% poverty:2 - 19.............. 1* (0.4) 532 3833 (377.3) 2* (1.2) 3835 (377.7) -- -- -- 3821 (375.6)
20 and over.......... 16 (1.1) 1411 5561 (211.7) 85 (11.0) 5646 (215.6) 196 5249 (547.6) 537 (53.5) 5786 (557.3) 5620 (243.9)
2 and over... 13 (1.0) 1943 5255 (208.8) 70 (9.3) 5326 (212.5) 201 5250 (542.3) 534 (53.3) 5784 (552.8) 5256 (218.3)
All Individuals 10:2 - 19.............. 1 (0.2) 2974 4138 (213.7) 4* (1.5) 4142 (214.1) -- -- -- 4137 (216.7)
20 and over.......... 11 (0.9) 4830 5009 (125.7) 59 (5.8) 5069 (127.8) 425 5102 (343.8) 563 (54.9) 5665 (347.3) 4998 (149.9)
2 and over... 8 (0.7) 7804 4794 (117.6) 46 (4.4) 4840 (118.3) 444 5076 (328.3) 559 (52.2) 5636 (334.5) 4769 (134.2)

Page 13 of 23Available: www.ars.usda.gov/nea/bhnrc/fsrg.
DATA SOURCE: What We Eat in America, NHANES 2013-2014, day 1 food and supplement intake data, 2 years and over (excluding individuals pregnant, lactating, breast-fed, or with incomplete supplement data.).
See page 23 for footnotes.
What We Eat in America, NHANES 2013-2014
Table 40. Total Nutrient Intakes: Percent Reporting and Mean Amounts1 of Selected2 Vitamins and Minerals from Food and Beverages3 and Dietary Supplements4,by Family Income (as % of Poverty Level5) and Age, in the United States, 2013-2014 (continued)
L u t e i n + z e a x a n t h i n
──────────────── All Individuals 6 ──────────────── ────────────── Supplement Users 7 ────────────── ─ Non-users 8 ─
Family income as% of poverty level
and age
Percentreporting
supplementlutein +
zeaxanthin 9
SampleSize Food Supplement
Food plussupplement
Samplesize Food Supplement
Food plussupplement Food
(years) % (SE) µg (SE) µg (SE) µg (SE) µg (SE) µg (SE) µg (SE) µg (SE)
Under 131% poverty:2 - 19.............. # 1354 782 (59.9) 2* (1.2) 784 (60.1) -- -- -- 782 (60.0)
20 and over.......... 6 (0.7) 1517 1353 (147.3) 48 (13.4) 1401 (150.7) 84 1829 (367.2) 828 (167.7) 2657 (444.2) 1324 (153.6)
2 and over... 4 (0.5) 2871 1164 (101.2) 33 (8.8) 1197 (102.5) 90 1801 (359.4) 820 (163.2) 2621 (434.5) 1138 (103.7)
131-350% poverty:2 - 19.............. 1* (0.5) 896 846 (71.8) 7* (5.1) 853 (70.3) -- -- -- 843 (73.1)
20 and over.......... 9 (1.0) 1558 1629 (173.3) 76 (18.8) 1706 (172.0) 133 1542 (151.4) 873 (195.3) 2415 (229.4) 1638 (187.4)
2 and over... 7 (0.7) 2454 1430 (133.5) 59 (14.0) 1489 (131.9) 137 1525 (148.6) 868 (189.5) 2393 (227.0) 1423 (142.5)
Over 350% poverty:2 - 19.............. 2* (1.0) 532 1035 (137.4) 5* (2.7) 1040 (136.4) -- -- -- 1027 (141.8)
20 and over.......... 15 (1.5) 1411 1845 (106.9) 157 (21.2) 2002 (113.6) 202 2511 (185.4) 1031 (103.3) 3542 (233.1) 1726 (115.6)
2 and over... 13 (1.3) 1943 1702 (90.2) 130 (18.6) 1832 (97.9) 210 2487 (176.5) 1013 (101.0) 3500 (221.0) 1587 (96.9)
All Individuals 10:2 - 19.............. 1 (0.3) 2974 869 (52.3) 4* (1.9) 873 (52.7) -- -- -- 866 (52.8)
20 and over.......... 10 (0.8) 4830 1659 (76.8) 98 (10.6) 1756 (74.9) 443 2100 (123.3) 938 (81.8) 3037 (150.8) 1608 (87.7)
2 and over... 8 (0.6) 7804 1464 (57.3) 75 (8.1) 1538 (56.5) 462 2076 (115.3) 925 (79.2) 3002 (141.6) 1410 (65.0)

Page 14 of 23Available: www.ars.usda.gov/nea/bhnrc/fsrg.
DATA SOURCE: What We Eat in America, NHANES 2013-2014, day 1 food and supplement intake data, 2 years and over (excluding individuals pregnant, lactating, breast-fed, or with incomplete supplement data.).
See page 23 for footnotes.
What We Eat in America, NHANES 2013-2014
Table 40. Total Nutrient Intakes: Percent Reporting and Mean Amounts1 of Selected2 Vitamins and Minerals from Food and Beverages3 and Dietary Supplements4,by Family Income (as % of Poverty Level5) and Age, in the United States, 2013-2014 (continued)
C a l c i u m
──────────────── All Individuals 6 ──────────────── ────────────── Supplement Users 7 ────────────── ─ Non-users 8 ─
Family income as% of poverty level
and age
Percentreporting
supplementcalcium 9
SampleSize Food Supplement
Food plussupplement
Samplesize Food Supplement
Food plussupplement Food
(years) % (SE) mg (SE) mg (SE) mg (SE) mg (SE) mg (SE) mg (SE) mg (SE)
Under 131% poverty:2 - 19.............. 6 (1.5) 1354 953 (24.3) 14 (3.5) 968 (24.1) 75 1032 (60.0) 232 (29.4) 1264 (78.4) 948 (26.4)
20 and over.......... 23 (1.4) 1517 939 (22.4) 108 (11.0) 1047 (31.4) 330 1022 (45.0) 460 (25.7) 1481 (52.4) 914 (23.8)
2 and over... 18 (1.2) 2871 944 (19.4) 77 (7.7) 1021 (24.5) 405 1023 (40.8) 433 (22.0) 1456 (47.0) 927 (22.8)
131-350% poverty:2 - 19.............. 9 (1.0) 896 1029 (33.7) 17 (2.7) 1046 (35.1) 73 1194 (105.4) 193 (18.7) 1387 (96.9) 1014 (36.1)
20 and over.......... 31 (1.4) 1558 968 (16.1) 156 (10.1) 1124 (11.9) 429 950 (22.1) 505 (26.9) 1455 (20.0) 976 (19.3)
2 and over... 25 (1.1) 2454 984 (15.7) 120 (8.3) 1104 (11.6) 502 972 (25.2) 478 (26.8) 1449 (19.1) 988 (17.1)
Over 350% poverty:2 - 19.............. 10 (1.2) 532 1103 (42.6) 18 (4.3) 1121 (44.9) -- -- -- 1108 (43.5)
20 and over.......... 38 (2.1) 1411 984 (25.2) 180 (11.3) 1164 (29.3) 479 1068 (50.4) 473 (16.9) 1542 (53.3) 933 (23.6)
2 and over... 33 (1.8) 1943 1005 (24.4) 152 (9.1) 1157 (25.6) 528 1068 (47.8) 458 (16.4) 1526 (49.5) 974 (23.8)
All Individuals 10:2 - 19.............. 8 (0.7) 2974 1021 (18.7) 16 (2.2) 1037 (18.5) 208 1141 (50.3) 204 (18.8) 1345 (44.8) 1011 (20.5)
20 and over.......... 32 (1.3) 4830 967 (12.7) 154 (8.5) 1121 (18.2) 1318 1023 (19.1) 486 (13.7) 1509 (24.4) 941 (13.8)
2 and over... 26 (1.0) 7804 980 (11.9) 120 (6.3) 1100 (15.7) 1526 1032 (19.0) 465 (12.7) 1497 (24.5) 962 (12.7)

Page 15 of 23Available: www.ars.usda.gov/nea/bhnrc/fsrg.
DATA SOURCE: What We Eat in America, NHANES 2013-2014, day 1 food and supplement intake data, 2 years and over (excluding individuals pregnant, lactating, breast-fed, or with incomplete supplement data.).
See page 23 for footnotes.
What We Eat in America, NHANES 2013-2014
Table 40. Total Nutrient Intakes: Percent Reporting and Mean Amounts1 of Selected2 Vitamins and Minerals from Food and Beverages3 and Dietary Supplements4,by Family Income (as % of Poverty Level5) and Age, in the United States, 2013-2014 (continued)
P h o s p h o r u s
──────────────── All Individuals 6 ──────────────── ────────────── Supplement Users 7 ────────────── ─ Non-users 8 ─
Family income as% of poverty level
and age
Percentreporting
supplementphosphorus 9
SampleSize Food Supplement
Food plussupplement
Samplesize Food Supplement
Food plussupplement Food
(years) % (SE) mg (SE) mg (SE) mg (SE) mg (SE) mg (SE) mg (SE) mg (SE)
Under 131% poverty:2 - 19.............. 2 (0.8) 1354 1215 (20.0) 2* (1.1) 1218 (19.5) -- -- -- 1209 (23.5)
20 and over.......... 9 (0.9) 1517 1340 (22.3) 4 (0.7) 1344 (22.6) 131 1342 (66.3) 46 (5.9) 1388 (63.3) 1340 (24.3)
2 and over... 7 (0.7) 2871 1299 (17.4) 3 (0.5) 1302 (17.4) 153 1360 (60.0) 53 (5.9) 1413 (57.4) 1295 (19.1)
131-350% poverty:2 - 19.............. 2 (0.5) 896 1301 (29.7) 3* (0.8) 1303 (30.1) -- -- -- 1297 (31.4)
20 and over.......... 12 (1.0) 1558 1417 (25.2) 5 (0.8) 1422 (25.4) 167 1472 (64.9) 44 (7.2) 1515 (63.3) 1410 (30.0)
2 and over... 9 (0.9) 2454 1388 (21.6) 4 (0.6) 1392 (21.8) 187 1473 (63.8) 48 (6.7) 1521 (62.0) 1379 (25.8)
Over 350% poverty:2 - 19.............. 3* (0.8) 532 1319 (47.1) 2* (0.7) 1321 (47.2) -- -- -- 1319 (46.7)
20 and over.......... 18 (1.5) 1411 1430 (21.1) 9 (1.1) 1439 (21.3) 227 1542 (46.8) 51 (5.0) 1593 (45.1) 1406 (25.6)
2 and over... 15 (1.4) 1943 1410 (18.4) 8 (0.9) 1418 (18.5) 241 1535 (45.5) 52 (4.8) 1587 (43.9) 1388 (23.7)
All Individuals 10:2 - 19.............. 2 (0.5) 2974 1272 (15.3) 2* (0.6) 1274 (15.2) -- -- -- 1269 (16.3)
20 and over.......... 13 (0.8) 4830 1401 (12.3) 6 (0.6) 1407 (12.4) 553 1484 (37.5) 48 (3.7) 1532 (38.1) 1389 (14.3)
2 and over... 10 (0.7) 7804 1369 (10.9) 5 (0.4) 1375 (10.9) 612 1482 (36.2) 51 (3.0) 1533 (36.2) 1356 (12.4)

Page 16 of 23Available: www.ars.usda.gov/nea/bhnrc/fsrg.
DATA SOURCE: What We Eat in America, NHANES 2013-2014, day 1 food and supplement intake data, 2 years and over (excluding individuals pregnant, lactating, breast-fed, or with incomplete supplement data.).
See page 23 for footnotes.
What We Eat in America, NHANES 2013-2014
Table 40. Total Nutrient Intakes: Percent Reporting and Mean Amounts1 of Selected2 Vitamins and Minerals from Food and Beverages3 and Dietary Supplements4,by Family Income (as % of Poverty Level5) and Age, in the United States, 2013-2014 (continued)
M a g n e s i u m
──────────────── All Individuals 6 ──────────────── ────────────── Supplement Users 7 ────────────── ─ Non-users 8 ─
Family income as% of poverty level
and age
Percentreporting
supplementmagnesium 9
SampleSize Food Supplement
Food plussupplement
Samplesize Food Supplement
Food plussupplement Food
(years) % (SE) mg (SE) mg (SE) mg (SE) mg (SE) mg (SE) mg (SE) mg (SE)
Under 131% poverty:2 - 19.............. 4 (0.9) 1354 225 (4.5) 3* (1.3) 229 (4.1) -- -- -- 222 (5.9)
20 and over.......... 17 (1.3) 1517 282 (5.0) 17 (2.3) 299 (6.2) 238 294 (13.8) 102 (11.8) 396 (22.9) 279 (5.2)
2 and over... 13 (1.1) 2871 263 (4.4) 12 (1.7) 276 (5.1) 288 295 (13.5) 99 (10.7) 394 (21.5) 258 (4.6)
131-350% poverty:2 - 19.............. 7 (1.5) 896 239 (6.4) 3* (0.9) 242 (6.4) -- -- -- 233 (6.0)
20 and over.......... 24 (1.2) 1558 303 (6.1) 28 (2.8) 331 (6.4) 325 313 (9.6) 118 (12.5) 431 (16.8) 300 (7.9)
2 and over... 19 (1.1) 2454 287 (5.6) 21 (2.1) 308 (6.1) 365 315 (12.5) 111 (11.6) 426 (17.8) 280 (6.5)
Over 350% poverty:2 - 19.............. 6 (1.4) 532 244 (7.7) 2* (1.0) 247 (8.0) -- -- -- 241 (7.8)
20 and over.......... 31 (1.9) 1411 322 (5.1) 31 (2.8) 353 (5.5) 374 356 (11.8) 99 (7.2) 455 (12.8) 307 (5.4)
2 and over... 26 (1.6) 1943 308 (3.7) 26 (2.5) 334 (4.6) 406 353 (11.0) 97 (7.0) 450 (11.9) 292 (4.7)
All Individuals 10:2 - 19.............. 6 (0.7) 2974 235 (3.0) 3 (0.6) 238 (3.1) 129 313 (40.5) 53 (13.0) 366 (45.7) 230 (3.3)
20 and over.......... 24 (1.2) 4830 305 (3.3) 26 (1.9) 331 (3.7) 996 331 (6.9) 105 (6.7) 436 (9.3) 297 (3.8)
2 and over... 20 (1.0) 7804 288 (3.0) 20 (1.5) 308 (3.3) 1125 330 (7.5) 102 (6.6) 431 (9.6) 278 (3.3)

Page 17 of 23Available: www.ars.usda.gov/nea/bhnrc/fsrg.
DATA SOURCE: What We Eat in America, NHANES 2013-2014, day 1 food and supplement intake data, 2 years and over (excluding individuals pregnant, lactating, breast-fed, or with incomplete supplement data.).
See page 23 for footnotes.
What We Eat in America, NHANES 2013-2014
Table 40. Total Nutrient Intakes: Percent Reporting and Mean Amounts1 of Selected2 Vitamins and Minerals from Food and Beverages3 and Dietary Supplements4,by Family Income (as % of Poverty Level5) and Age, in the United States, 2013-2014 (continued)
I r o n
──────────────── All Individuals 6 ──────────────── ────────────── Supplement Users 7 ────────────── ─ Non-users 8 ─
Family income as% of poverty level
and age
Percentreporting
supplementiron 9
SampleSize Food Supplement
Food plussupplement
Samplesize Food Supplement
Food plussupplement Food
(years) % (SE) mg (SE) mg (SE) mg (SE) mg (SE) mg (SE) mg (SE) mg (SE)
Under 131% poverty:2 - 19.............. 4 (1.0) 1354 13.6 (0.32) 0.9 (0.23) 14.4 (0.33) -- -- -- 13.5 (0.34)
20 and over.......... 11 (1.2) 1517 14.4 (0.37) 2.6 (0.28) 17.0 (0.47) 163 13.6 (0.83) 23.2 (2.06) 36.8 (2.02) 14.5 (0.38)
2 and over... 9 (0.9) 2871 14.1 (0.33) 2.0 (0.21) 16.1 (0.37) 213 13.8 (0.67) 22.8 (1.63) 36.7 (1.64) 14.1 (0.33)
131-350% poverty:2 - 19.............. 4 (0.8) 896 14.3 (0.63) 0.7 (0.21) 15.0 (0.62) -- -- -- 14.3 (0.64)
20 and over.......... 15 (1.5) 1558 14.8 (0.37) 3.3 (0.40) 18.1 (0.46) 200 15.0 (0.59) 22.1 (1.79) 37.1 (1.72) 14.8 (0.42)
2 and over... 12 (1.1) 2454 14.7 (0.37) 2.6 (0.33) 17.3 (0.42) 249 15.0 (0.54) 22.0 (1.77) 37.0 (1.72) 14.6 (0.42)
Over 350% poverty:2 - 19.............. 6 (1.5) 532 13.8 (0.44) 1.2* (0.51) 15.0 (0.73) -- -- -- 13.7 (0.42)
20 and over.......... 16 (1.3) 1411 14.5 (0.16) 3.7 (0.43) 18.2 (0.43) 202 15.0 (0.60) 22.4 (1.34) 37.5 (1.43) 14.3 (0.19)
2 and over... 15 (1.1) 1943 14.3 (0.13) 3.3 (0.36) 17.6 (0.31) 234 15.0 (0.57) 22.1 (1.29) 37.2 (1.40) 14.2 (0.17)
All Individuals 10:2 - 19.............. 5 (0.5) 2974 13.9 (0.24) 0.9 (0.15) 14.8 (0.25) 142 16.2 (0.88) 19.5 (2.61) 35.6 (2.33) 13.8 (0.25)
20 and over.......... 15 (0.9) 4830 14.6 (0.15) 3.2 (0.24) 17.8 (0.26) 607 14.7 (0.44) 22.2 (0.87) 36.9 (0.85) 14.5 (0.16)
2 and over... 12 (0.7) 7804 14.4 (0.15) 2.7 (0.19) 17.1 (0.22) 749 14.8 (0.41) 21.9 (0.90) 36.8 (0.85) 14.3 (0.15)

Page 18 of 23Available: www.ars.usda.gov/nea/bhnrc/fsrg.
DATA SOURCE: What We Eat in America, NHANES 2013-2014, day 1 food and supplement intake data, 2 years and over (excluding individuals pregnant, lactating, breast-fed, or with incomplete supplement data.).
See page 23 for footnotes.
What We Eat in America, NHANES 2013-2014
Table 40. Total Nutrient Intakes: Percent Reporting and Mean Amounts1 of Selected2 Vitamins and Minerals from Food and Beverages3 and Dietary Supplements4,by Family Income (as % of Poverty Level5) and Age, in the United States, 2013-2014 (continued)
Z i n c
──────────────── All Individuals 6 ──────────────── ────────────── Supplement Users 7 ────────────── ─ Non-users 8 ─
Family income as% of poverty level
and age
Percentreporting
supplementzinc 9
SampleSize Food Supplement
Food plussupplement
Samplesize Food Supplement
Food plussupplement Food
(years) % (SE) mg (SE) mg (SE) mg (SE) mg (SE) mg (SE) mg (SE) mg (SE)
Under 131% poverty:2 - 19.............. 12 (1.9) 1354 9.7 (0.23) 0.8 (0.15) 10.5 (0.23) 146 10.0 (0.65) 6.7 (1.01) 16.7 (1.35) 9.7 (0.29)
20 and over.......... 18 (1.5) 1517 10.8 (0.30) 3.2 (0.29) 13.9 (0.52) 256 10.5 (0.47) 17.3 (0.53) 27.8 (0.84) 10.8 (0.32)
2 and over... 16 (1.4) 2871 10.4 (0.25) 2.4 (0.21) 12.8 (0.39) 402 10.4 (0.40) 14.7 (0.71) 25.1 (0.90) 10.4 (0.28)
131-350% poverty:2 - 19.............. 17 (2.1) 896 10.4 (0.46) 0.9 (0.18) 11.3 (0.57) 147 12.3 (2.89) 5.7 (1.06) 18.0 (3.65) 10.0 (0.35)
20 and over.......... 24 (1.4) 1558 11.5 (0.19) 4.1 (0.39) 15.6 (0.43) 333 11.1 (0.49) 16.8 (1.14) 27.8 (1.38) 11.6 (0.29)
2 and over... 22 (1.2) 2454 11.2 (0.23) 3.3 (0.29) 14.5 (0.40) 480 11.3 (0.64) 14.7 (1.00) 26.0 (1.22) 11.2 (0.27)
Over 350% poverty:2 - 19.............. 21 (4.5) 532 10.2 (0.38) 1.1 (0.23) 11.2 (0.56) 105 10.5 (0.78) 4.9 (0.39) 15.4 (0.89) 10.1 (0.36)
20 and over.......... 31 (1.9) 1411 11.2 (0.19) 4.9 (0.22) 16.1 (0.25) 388 11.8 (0.42) 15.7 (0.62) 27.5 (0.79) 11.0 (0.21)
2 and over... 29 (1.7) 1943 11.0 (0.13) 4.2 (0.22) 15.3 (0.21) 493 11.6 (0.39) 14.3 (0.78) 25.9 (0.89) 10.8 (0.19)
All Individuals 10:2 - 19.............. 16 (1.5) 2974 10.1 (0.16) 0.9 (0.10) 11.0 (0.21) 412 11.2 (1.10) 5.6 (0.54) 16.9 (1.49) 9.9 (0.21)
20 and over.......... 25 (1.3) 4830 11.2 (0.10) 4.1 (0.22) 15.3 (0.25) 1040 11.3 (0.27) 16.3 (0.51) 27.7 (0.63) 11.1 (0.11)
2 and over... 23 (1.1) 7804 10.9 (0.10) 3.3 (0.17) 14.2 (0.21) 1452 11.3 (0.31) 14.5 (0.50) 25.8 (0.63) 10.8 (0.12)

Page 19 of 23Available: www.ars.usda.gov/nea/bhnrc/fsrg.
DATA SOURCE: What We Eat in America, NHANES 2013-2014, day 1 food and supplement intake data, 2 years and over (excluding individuals pregnant, lactating, breast-fed, or with incomplete supplement data.).
See page 23 for footnotes.
What We Eat in America, NHANES 2013-2014
Table 40. Total Nutrient Intakes: Percent Reporting and Mean Amounts1 of Selected2 Vitamins and Minerals from Food and Beverages3 and Dietary Supplements4,by Family Income (as % of Poverty Level5) and Age, in the United States, 2013-2014 (continued)
C o p p e r
──────────────── All Individuals 6 ──────────────── ────────────── Supplement Users 7 ────────────── ─ Non-users 8 ─
Family income as% of poverty level
and age
Percentreporting
supplementcopper 9
SampleSize Food Supplement
Food plussupplement
Samplesize Food Supplement
Food plussupplement Food
(years) % (SE) mg (SE) mg (SE) mg (SE) mg (SE) mg (SE) mg (SE) mg (SE)
Under 131% poverty:2 - 19.............. 5 (1.2) 1354 0.9 (0.02) 0.1 (0.02) 1.0 (0.02) -- -- -- 0.9 (0.02)
20 and over.......... 17 (1.5) 1517 1.1 (0.02) 0.2 (0.02) 1.4 (0.04) 227 1.1 (0.03) 1.4 (0.08) 2.6 (0.07) 1.1 (0.03)
2 and over... 13 (1.1) 2871 1.0 (0.02) 0.2 (0.02) 1.2 (0.03) 279 1.1 (0.03) 1.5 (0.09) 2.6 (0.08) 1.0 (0.02)
131-350% poverty:2 - 19.............. 5 (1.1) 896 0.9 (0.03) 0.1* (0.04) 1.1 (0.05) -- -- -- 0.9 (0.03)
20 and over.......... 22 (1.4) 1558 1.2 (0.03) 0.3 (0.03) 1.5 (0.03) 298 1.3 (0.06) 1.4 (0.06) 2.6 (0.09) 1.2 (0.04)
2 and over... 17 (1.2) 2454 1.2 (0.03) 0.2 (0.02) 1.4 (0.03) 345 1.3 (0.05) 1.4 (0.09) 2.7 (0.12) 1.1 (0.03)
Over 350% poverty:2 - 19.............. 7 (1.5) 532 1.0 (0.03) 0.1 (0.02) 1.1 (0.04) -- -- -- 1.0 (0.03)
20 and over.......... 29 (1.7) 1411 1.3 (0.03) 0.3 (0.02) 1.7 (0.03) 351 1.4 (0.06) 1.2 (0.03) 2.6 (0.06) 1.3 (0.02)
2 and over... 25 (1.5) 1943 1.3 (0.02) 0.3 (0.02) 1.6 (0.02) 382 1.4 (0.06) 1.2 (0.03) 2.6 (0.06) 1.2 (0.02)
All Individuals 10:2 - 19.............. 5 (0.5) 2974 0.9 (0.01) 0.1 (0.02) 1.0 (0.02) 137 1.3 (0.15) 1.8 (0.32) 3.1 (0.37) 0.9 (0.01)
20 and over.......... 23 (1.2) 4830 1.2 (0.02) 0.3 (0.02) 1.5 (0.03) 932 1.3 (0.04) 1.3 (0.03) 2.6 (0.05) 1.2 (0.02)
2 and over... 18 (1.0) 7804 1.2 (0.01) 0.2 (0.01) 1.4 (0.02) 1069 1.3 (0.04) 1.3 (0.03) 2.7 (0.06) 1.1 (0.01)

Page 20 of 23Available: www.ars.usda.gov/nea/bhnrc/fsrg.
DATA SOURCE: What We Eat in America, NHANES 2013-2014, day 1 food and supplement intake data, 2 years and over (excluding individuals pregnant, lactating, breast-fed, or with incomplete supplement data.).
See page 23 for footnotes.
What We Eat in America, NHANES 2013-2014
Table 40. Total Nutrient Intakes: Percent Reporting and Mean Amounts1 of Selected2 Vitamins and Minerals from Food and Beverages3 and Dietary Supplements4,by Family Income (as % of Poverty Level5) and Age, in the United States, 2013-2014 (continued)
S o d i u m
──────────────── All Individuals 6 ──────────────── ────────────── Supplement Users 7 ────────────── ─ Non-users 8 ─
Family income as% of poverty level
and age
Percentreporting
supplementsodium 9
SampleSize Food Supplement
Food plussupplement
Samplesize Food Supplement
Food plussupplement Food
(years) % (SE) mg (SE) mg (SE) mg (SE) mg (SE) mg (SE) mg (SE) mg (SE)
Under 131% poverty:2 - 19.............. 4 (1.0) 1354 2974 (47.4) # 2974 (47.4) -- -- -- 2988 (47.9)
20 and over.......... 3 (0.7) 1517 3464 (45.7) 1 (0.2) 3464 (45.7) -- -- -- 3470 (49.0)
2 and over... 3 (0.5) 2871 3302 (36.1) 1 (0.1) 3302 (36.1) 99 3007 (147.7) 19 (3.1) 3027 (146.4) 3312 (38.4)
131-350% poverty:2 - 19.............. 5 (1.2) 896 3120 (49.2) 1* (0.3) 3121 (49.2) 60 2912 (173.3) 17 (4.6) 2929 (174.2) 3132 (54.5)
20 and over.......... 7 (1.2) 1558 3550 (52.2) 2 (0.6) 3552 (52.1) 96 3433 (182.3) 30 (6.8) 3463 (181.3) 3559 (50.0)
2 and over... 6 (1.0) 2454 3441 (46.5) 2 (0.4) 3443 (46.5) 156 3317 (147.9) 27 (5.8) 3344 (147.4) 3449 (45.9)
Over 350% poverty:2 - 19.............. 7 (1.6) 532 3042 (117.6) 1 (0.1) 3042 (117.7) -- -- -- 3062 (113.2)
20 and over.......... 10 (1.0) 1411 3588 (51.5) 3 (0.6) 3591 (51.6) 102 3481 (157.1) 36 (5.0) 3517 (157.9) 3599 (51.2)
2 and over... 9 (0.8) 1943 3491 (53.2) 3 (0.5) 3494 (53.2) 136 3386 (135.7) 33 (4.1) 3418 (136.0) 3502 (52.8)
All Individuals 10:2 - 19.............. 5 (0.7) 2974 3036 (40.1) 1 (0.1) 3036 (40.1) 156 2754 (125.9) 13 (1.9) 2767 (126.0) 3051 (39.6)
20 and over.......... 7 (0.6) 4830 3534 (30.2) 2 (0.4) 3536 (30.2) 254 3419 (92.1) 33 (3.7) 3452 (90.6) 3542 (32.9)
2 and over... 6 (0.5) 7804 3411 (28.0) 2 (0.3) 3412 (28.0) 410 3290 (80.3) 29 (3.3) 3319 (79.3) 3419 (29.0)

Page 21 of 23Available: www.ars.usda.gov/nea/bhnrc/fsrg.
DATA SOURCE: What We Eat in America, NHANES 2013-2014, day 1 food and supplement intake data, 2 years and over (excluding individuals pregnant, lactating, breast-fed, or with incomplete supplement data.).
See page 23 for footnotes.
What We Eat in America, NHANES 2013-2014
Table 40. Total Nutrient Intakes: Percent Reporting and Mean Amounts1 of Selected2 Vitamins and Minerals from Food and Beverages3 and Dietary Supplements4,by Family Income (as % of Poverty Level5) and Age, in the United States, 2013-2014 (continued)
P o t a s s i u m
──────────────── All Individuals 6 ──────────────── ────────────── Supplement Users 7 ────────────── ─ Non-users 8 ─
Family income as% of poverty level
and age
Percentreporting
supplementpotassium 9
SampleSize Food Supplement
Food plussupplement
Samplesize Food Supplement
Food plussupplement Food
(years) % (SE) mg (SE) mg (SE) mg (SE) mg (SE) mg (SE) mg (SE) mg (SE)
Under 131% poverty:2 - 19.............. 2 (0.6) 1354 2080 (35.1) 1* (0.4) 2081 (34.9) -- -- -- 2050 (44.6)
20 and over.......... 10 (1.1) 1517 2460 (38.1) 8 (0.8) 2468 (38.6) 142 2553 (107.5) 79 (4.9) 2632 (108.9) 2449 (38.2)
2 and over... 7 (0.9) 2871 2334 (31.8) 6 (0.6) 2340 (32.2) 154 2648 (130.3) 78 (4.7) 2726 (131.8) 2309 (33.2)
131-350% poverty:2 - 19.............. 1* (0.6) 896 2207 (53.8) 1* (0.6) 2208 (53.6) -- -- -- 2192 (51.8)
20 and over.......... 14 (1.1) 1558 2664 (37.1) 12 (0.8) 2676 (37.5) 202 3093 (102.3) 84 (2.6) 3178 (102.0) 2592 (43.5)
2 and over... 11 (0.8) 2454 2547 (36.7) 9 (0.6) 2557 (37.0) 214 3102 (97.8) 84 (2.9) 3186 (97.5) 2479 (42.8)
Over 350% poverty:2 - 19.............. 3* (0.8) 532 2237 (73.2) 1* (0.5) 2238 (73.2) -- -- -- 2228 (70.9)
20 and over.......... 21 (1.7) 1411 2778 (46.0) 20 (2.7) 2797 (45.6) 251 3106 (127.8) 94 (10.2) 3199 (127.6) 2691 (42.7)
2 and over... 18 (1.7) 1943 2682 (39.0) 16 (2.4) 2698 (38.9) 262 3092 (124.8) 93 (10.0) 3184 (125.0) 2595 (38.9)
All Individuals 10:2 - 19.............. 2 (0.3) 2974 2161 (27.1) 1 (0.2) 2162 (27.0) -- -- -- 2143 (31.3)
20 and over.......... 16 (0.9) 4830 2660 (30.4) 14 (1.2) 2674 (30.9) 630 3007 (94.1) 87 (5.7) 3094 (94.8) 2596 (29.3)
2 and over... 12 (0.8) 7804 2537 (27.5) 11 (0.9) 2547 (27.9) 667 3015 (86.3) 87 (5.6) 3102 (87.1) 2471 (27.1)

Page 22 of 23Available: www.ars.usda.gov/nea/bhnrc/fsrg.
DATA SOURCE: What We Eat in America, NHANES 2013-2014, day 1 food and supplement intake data, 2 years and over (excluding individuals pregnant, lactating, breast-fed, or with incomplete supplement data.).
See page 23 for footnotes.
What We Eat in America, NHANES 2013-2014
Table 40. Total Nutrient Intakes: Percent Reporting and Mean Amounts1 of Selected2 Vitamins and Minerals from Food and Beverages3 and Dietary Supplements4,by Family Income (as % of Poverty Level5) and Age, in the United States, 2013-2014 (continued)
S e l e n i u m
──────────────── All Individuals 6 ──────────────── ────────────── Supplement Users 7 ────────────── ─ Non-users 8 ─
Family income as% of poverty level
and age
Percentreporting
supplementselenium 9
SampleSize Food Supplement
Food plussupplement
Samplesize Food Supplement
Food plussupplement Food
(years) % (SE) µg (SE) µg (SE) µg (SE) µg (SE) µg (SE) µg (SE) µg (SE)
Under 131% poverty:2 - 19.............. 2 (0.6) 1354 95.9 (1.63) 1.6* (0.55) 97.4 (1.78) -- -- -- 93.1 (1.85)
20 and over.......... 15 (1.5) 1517 113.5 (1.68) 9.9 (1.21) 123.3 (2.25) 212 109.2 (5.86) 65.7 (3.68) 174.9 (7.51) 114.2 (1.95)
2 and over... 11 (1.0) 2871 107.7 (1.07) 7.1 (0.83) 114.8 (1.46) 232 116.8 (8.06) 66.1 (3.94) 182.9 (10.46) 106.6 (1.42)
131-350% poverty:2 - 19.............. 2 (0.8) 896 101.3 (2.06) 2.9* (1.09) 104.2 (2.11) -- -- -- 100.3 (2.22)
20 and over.......... 20 (1.4) 1558 117.5 (2.37) 14.4 (1.49) 131.8 (2.51) 282 113.3 (5.81) 70.4 (3.91) 183.7 (8.87) 118.5 (2.60)
2 and over... 16 (1.2) 2454 113.3 (2.24) 11.5 (1.35) 124.8 (2.44) 294 114.3 (6.20) 72.3 (4.44) 186.6 (9.81) 113.2 (2.54)
Over 350% poverty:2 - 19.............. 3 (0.8) 532 95.6 (3.02) 1.3 (0.33) 96.8 (3.11) -- -- -- 95.2 (2.99)
20 and over.......... 28 (1.7) 1411 118.9 (1.74) 20.3 (1.24) 139.2 (2.41) 338 121.2 (4.09) 73.2 (3.49) 194.4 (6.03) 118.0 (2.40)
2 and over... 23 (1.6) 1943 114.8 (1.55) 16.9 (1.04) 131.7 (1.95) 353 120.9 (4.01) 72.4 (3.37) 193.3 (5.94) 112.9 (2.33)
All Individuals 10:2 - 19.............. 3 (0.4) 2974 97.7 (1.12) 1.9 (0.41) 99.6 (1.07) -- -- -- 96.1 (1.36)
20 and over.......... 22 (1.2) 4830 117.0 (1.03) 15.5 (1.10) 132.5 (1.44) 887 116.0 (2.87) 71.1 (2.57) 187.1 (4.98) 117.3 (1.30)
2 and over... 17 (1.0) 7804 112.3 (0.96) 12.1 (0.86) 124.4 (1.12) 937 117.6 (3.08) 71.2 (2.71) 188.8 (5.24) 111.2 (1.23)

What We Eat in America, NHANES 2013-2014
Page 23 of 23Page 23 of 23
Symbol Legend
* Indicates an estimate that may be less statistically reliable than estimates that are not flagged. The rules for flagging estimated means and percentages are as follows:
Mean: An estimated mean is flagged when the relative standard error is greater than 30 percent.
Percent reporting a supplement intake: An estimated percentage between 25 and 75 percent is flagged when based on a sample size of less than 30 times the variance inflation factor(VIF), where the VIF represents a broadly calculated average design effect, or when the relative standard error is greater than 30 percent. An estimated percentage less than or equal to 25percent or greater than or equal to 75 percent is flagged when the smaller of np and n(1-p) is less than 8 times the VIF, where n is the sample size and p is the percentage expressed as afraction. The VIF used in this table is 1.98.
# Indicates a non-zero value too small to report.
-- Estimated mean not presented where sample size is less than 30 times the variance inflation factor (VIF), i.e., sample size less than 59 for VIF = 1.98.
Footnotes
1 Sample weights designed for dietary analysis were used to allow estimates representative of the U. S. population for the years of collection.
2 Selection of the 22 vitamins, minerals, and carotenoids was based on the availability of Day 1 nutrient intakes from both food and dietary supplements. At the time of this release, supplementdata were not available for vitamin A, vitamin E, and other carotenoids.
Niacin: values do not include niacin-equivalents from tryptophan.Folic acid: the synthetic form of folate used as a fortificant in foods and dietary supplements.Folate (DFE): µg dietary folate equivalents = µg food folate + (1.7*µg folic acid).Vitamin D: 1 µg = 40 International Units (IU).Calcium and Magnesium: supplement intake includes non-prescription antacids.
3 Food and beverage intake was estimated from Day 1 dietary recall interviews conducted in the What We Eat in America, National Health and Nutrition Examination Survey (NHANES)2013-2014. The 24-hour dietary recalls were conducted in-person, by trained interviewers, using the USDA 5-step Automated Multiple-Pass Method. Food intakes were coded and nutrientvalues were determined using the USDA Food and Nutrient Database for Dietary Studies 2013-2014 www.ars.usda.gov/nea/bhnrc/fsrg.
4 Dietary supplement intake was estimated from the Day 1 Total Dietary Supplements File (DS1TOT_h) of NHANES 2013-2014. Collected as part of the dietary supplement component of the24-hour dietary recall, intakes now reflect the same timeframe as the food and beverage intake. Data are collected on the usage of all vitamins, minerals, herbals, and other dietary supplements aswell as non-prescription antacids and calculated using the NHANES-Dietary Supplement Database. Documentation available at: http://www.cdc.gov/nchs/nhanes/nhanes2013-2014/DS1TOT_h.htm.
5 The ratio of family income to poverty expressed as a percentage. The Department of Health and Human Services’ poverty guidelines were used as the poverty measure to calculate the ratio, http://aspe.hhs.gov/poverty/.
6 All Individuals: includes both supplement users and non-users 2 years and over. Pregnant and/or lactating females, breast-fed children, and individuals with incomplete dietary supplementcomponent of the 24-hour dietary recall were excluded.
7 Supplement Users: includes individuals who reported taking at least one multi- and/or single-nutrient supplement that contained the vitamin or mineral displayed on this page.
8 Non-users: includes individuals who did not report taking any dietary supplement that contained the vitamin or mineral displayed on this page. Non-users may include individuals that reportedother dietary supplements.
9 The weighted percentage of respondents in the income/age group who reported taking at least one multi- and /or single- nutrient supplement containing this nutrient.
10 Includes persons of all income levels or with unknown family income.
Abbreviations
SE = standard error; DFE = dietary folate equivalents.
Suggested Citation
U.S. Department of Agriculture, Agricultural Research Service. 2017. Total Nutrient Intakes: Percent Reporting and Mean Amounts of Selected Vitamins and Minerals from Food and Beveragesand Dietary Supplements, by Family Income (as % of Poverty Level) and Age, What We Eat in America, NHANES 2013-2014. Available: www.ars.usda.gov/nea/bhnrc/fsrg.