what tools are available to measure and monitor your sustainability initiative? how do you weigh...
TRANSCRIPT

What tools are available to measure and monitor your sustainability initiative?
How do you weigh costs/benefits and positives/negatives of different
systems?
Moderator: James Boyle- President & CEO, Sustainability Roundtable, Inc.
● Tad Radzinski – P.E., LEED AP, SFP, President, Sustainable Solutions
Corporation
● Steve Ashkin – CEO, The Sustainability Dashboard, LLC
● Rudi Miklosvary – EVP, Carbon Systems
1Sustainable Real Estate Roundtable © 2011 Sustainability Roundtable, Inc. Confidential – For use in connection with SR Inc Services only.
Sustainability Symposium PA/NJ 2012What you Can't Measure You Can't Change-
Measurement and Verification11:30 am – 12:30 pm ET
What You Can’t Measure You Can’t
Change Tad Radzinski, PE, LEED AP, SFP
Copyright 2012 by Sustainable Solutions Corp.
Why Measure?
• “If you can’t measure it, you can’t manage it.”• Periodic data analysis and trending will help
identify sources of loss or waste.• Simple spreadsheets to track raw materials,
chemicals, water, utilities, waste, and the associated costs.
Copyright 2012 by Sustainable Solutions Corp.
Measurement Tools
• Consultants• ENERGY STAR Portfolio Manager• Spreadsheets• Auditing Systems • Sustainable Purchasing Guidelines
– Site Specific Dashboards • Software
– Energy and Carbon Accounting Systems
Copyright 2012 by Sustainable Solutions Corp.
Value of Benchmarking
• Helps to decide where to focus efforts• Useful in developing and meeting sustainability
goals• Required by law in some municipalities• Often required for green building
documentation (e.g. LEED)
Copyright 2012 by Sustainable Solutions Corp.
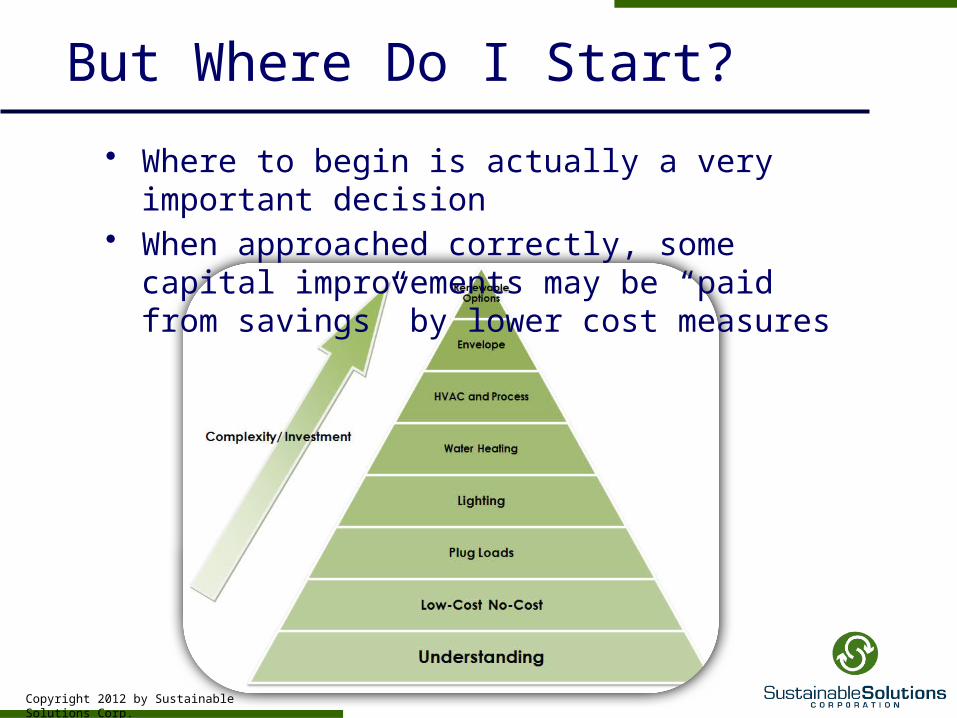
But Where Do I Start?
• Where to begin is actually a very important decision• When approached correctly, some capital
improvements may be “paid from savings” by lower cost measures
Copyright 2012 by Sustainable Solutions Corp.
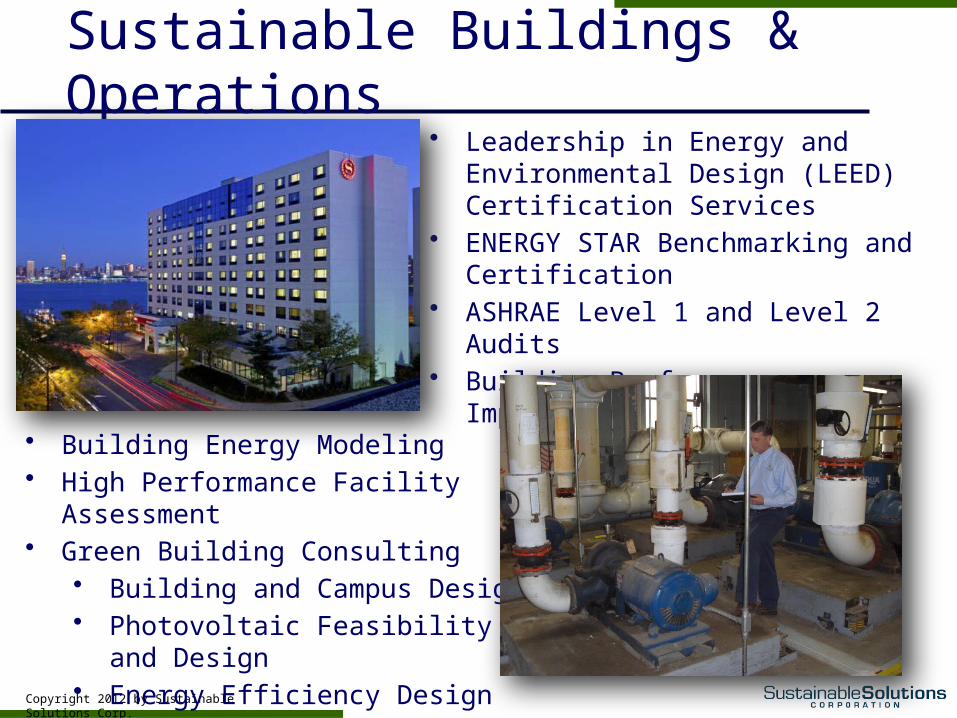
Sustainable Buildings & Operations
• Leadership in Energy and Environmental Design (LEED) Certification Services
• ENERGY STAR Benchmarking and Certification
• ASHRAE Level 1 and Level 2 Audits• Building Performance Improvement
Program (BPIP)
• Building Energy Modeling • High Performance Facility Assessment• Green Building Consulting
• Building and Campus Design • Photovoltaic Feasibility and Design • Energy Efficiency Design

Copyright 2012 by Sustainable Solutions Corp.
The Performance Improvement Process
Copyright 2012 by Sustainable Solutions Corp.
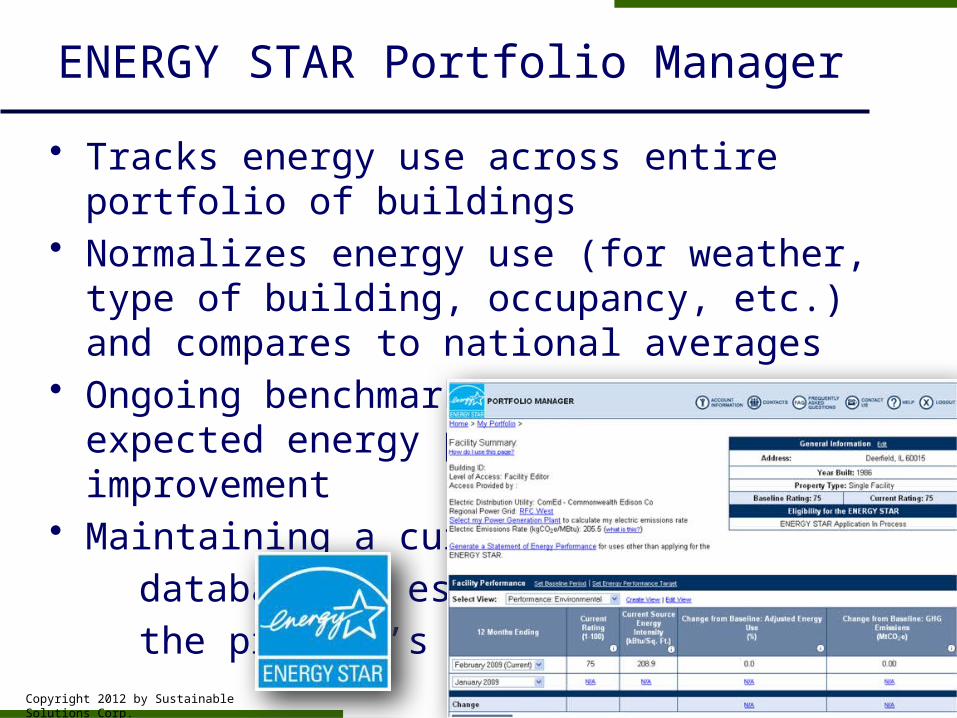
ENERGY STAR Portfolio Manager
• Tracks energy use across entire portfolio of buildings• Normalizes energy use (for weather, type of building,
occupancy, etc.) and compares to national averages• Ongoing benchmarking will verify expected energy
performance improvement• Maintaining a current database is essential to the program’s success
Copyright 2012 by Sustainable Solutions Corp.
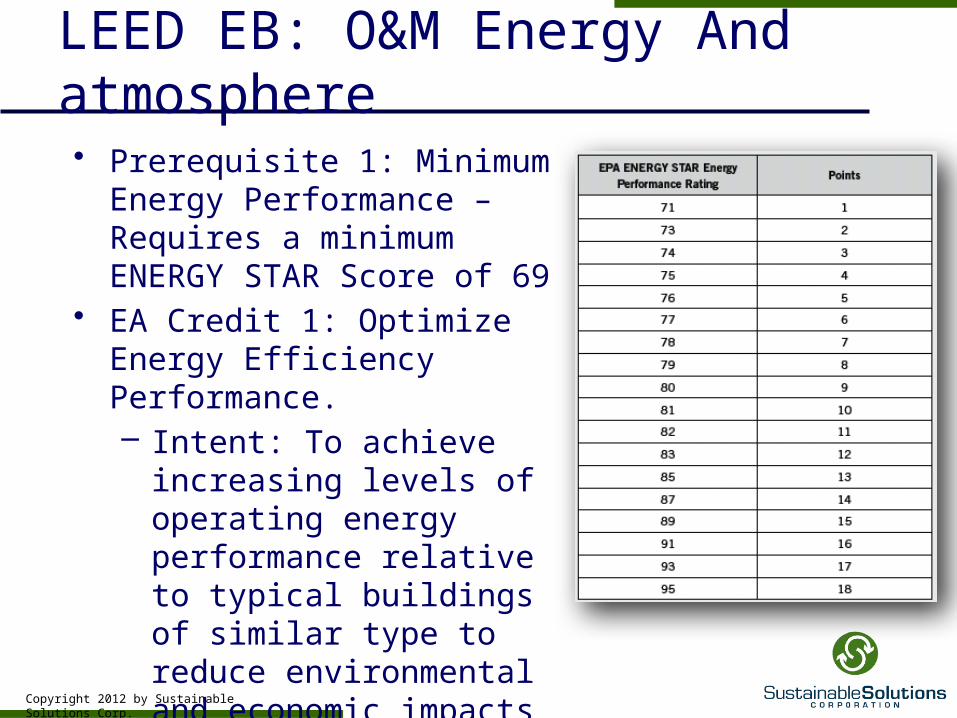
LEED EB: O&M Energy And atmosphere• Prerequisite 1: Minimum Energy
Performance – Requires a minimum ENERGY STAR Score of 69
• EA Credit 1: Optimize Energy Efficiency Performance.– Intent: To achieve increasing
levels of operating energy performance relative to typical buildings of similar type to reduce environmental and economic impacts associated with excessive energy use.

Copyright 2012 by Sustainable Solutions Corp.
Case Study Building
62
83• Benchmarking of energy
cost and consumption• Lighting changes and
occupancy sensors• HVAC operating hour
changes• Better use of BAS• Training of building
engineers
Copyright 2012 by Sustainable Solutions Corp.
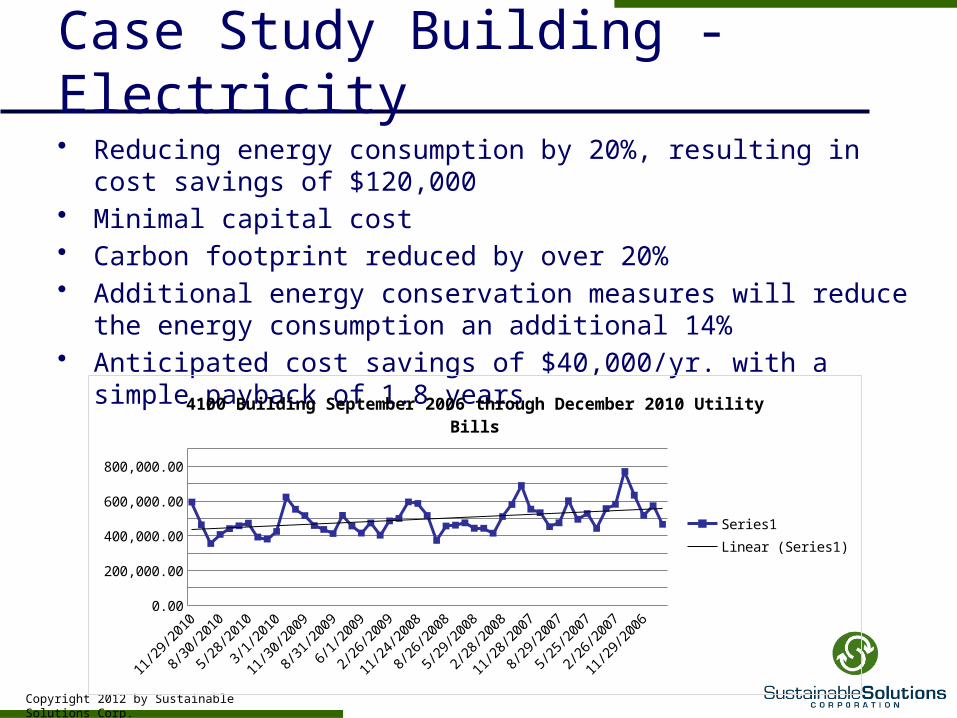
Case Study Building - Electricity• Reducing energy consumption by 20%, resulting in cost savings of $120,000 • Minimal capital cost• Carbon footprint reduced by over 20%• Additional energy conservation measures will reduce the energy
consumption an additional 14%• Anticipated cost savings of $40,000/yr. with a simple payback of 1.8 years
9/26/2006
12/5/2006
2/13/2007
4/24/2007
7/3/2007
9/11/2007
11/20/2007
1/29/2008
4/8/2008
6/17/2008
8/26/2008
11/4/2008
1/13/2009
3/24/2009
6/2/2009
8/11/2009
10/20/2009
12/29/2009
3/9/2010
5/18/2010
7/27/2010
10/5/20100.00
100,000.00
200,000.00
300,000.00
400,000.00
500,000.00
600,000.00
700,000.00
800,000.00
900,000.00
4100 Building September 2006 through December 2010 Utility Bills
Series1Linear (Series1)

Copyright 2012 by Sustainable Solutions Corp.
Contact
• Tad Radzinski, P.E. LEED AP, SFP– 610-569-1047 office– [email protected]
www.SustainableSolutionsCorporation.com

Sustainability Tools
Making Buildings BetterReducing Environmental Impacts
Saving Money
Stephen Ashkin, CEOSustainability Dashboard Tools, LLC
14

3 Take-Aways
• Climate change is the issue of our generation, but sustainability is more than just energy.
• Sustainability affects everything we do including what we buy and what our people do.
• Sustainability for most organizations requires a culture change. Herein lies our greatest challenge.
15
Why OrganizationsShould Care?
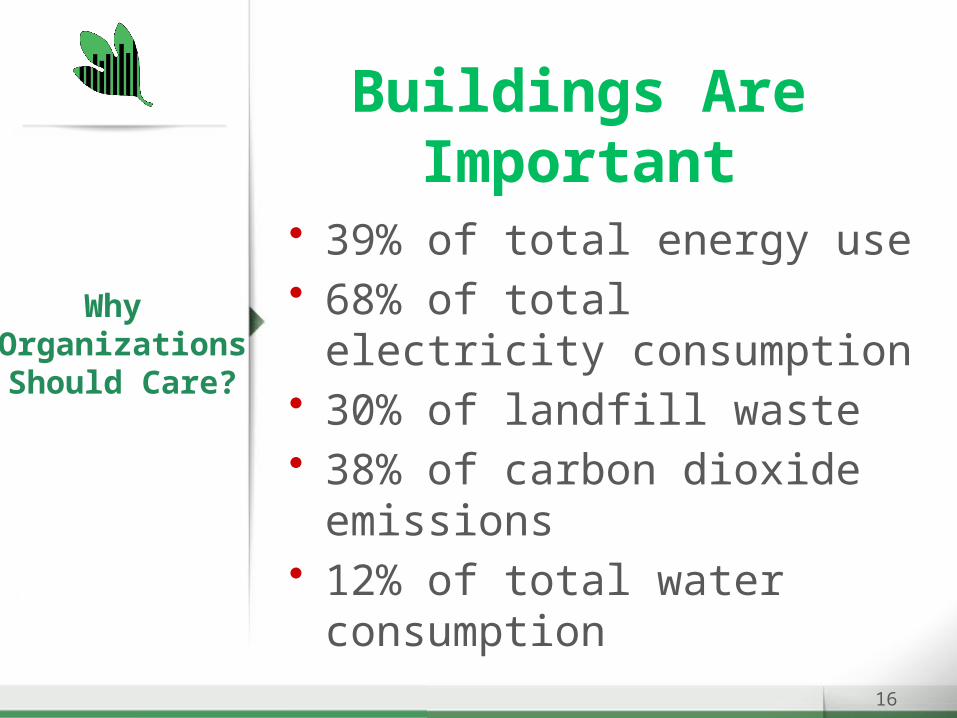
Buildings Are Important
• 39% of total energy use• 68% of total electricity
consumption• 30% of landfill waste• 38% of carbon dioxide
emissions• 12% of total water
consumption
16
Why OrganizationsShould Care?

Buildings Are Important
• $2 to $4 per sq ft for energy• $1 to $2 per sq ft for cleaning• $0.02 to $0.20 per sq ft for
water and waste• Other purchases including
office supplies, food, raw materials, etc.
17
Why OrganizationsShould Care?

Total ImpactsCost
18
Why OrganizationsShould Care?
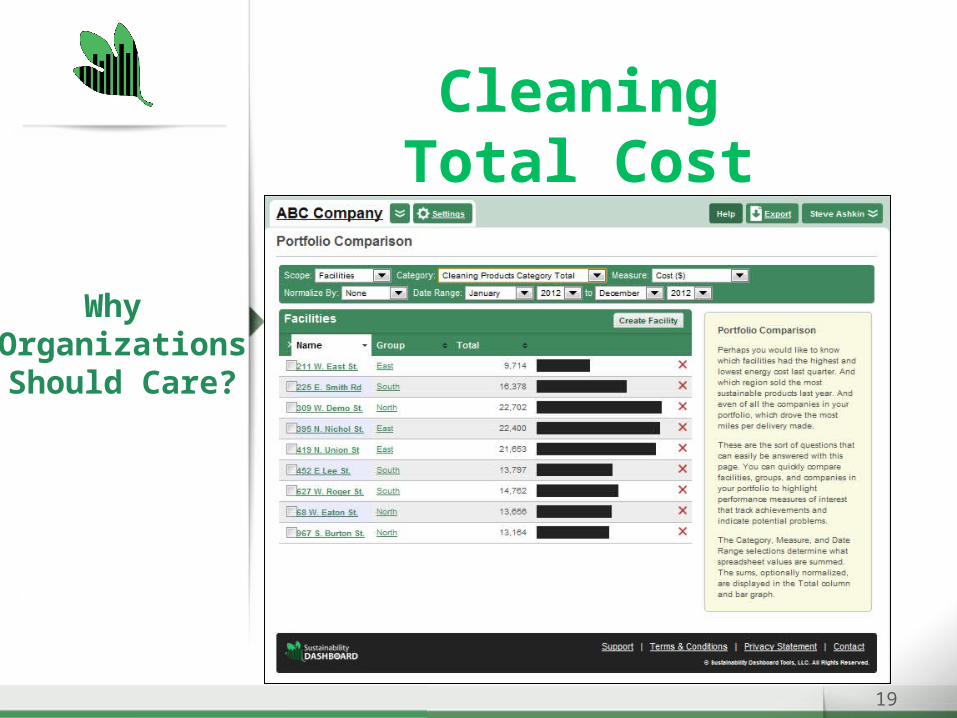
CleaningTotal Cost
19
Why OrganizationsShould Care?

CleaningPer Sq Ft
20
Why OrganizationsShould Care?
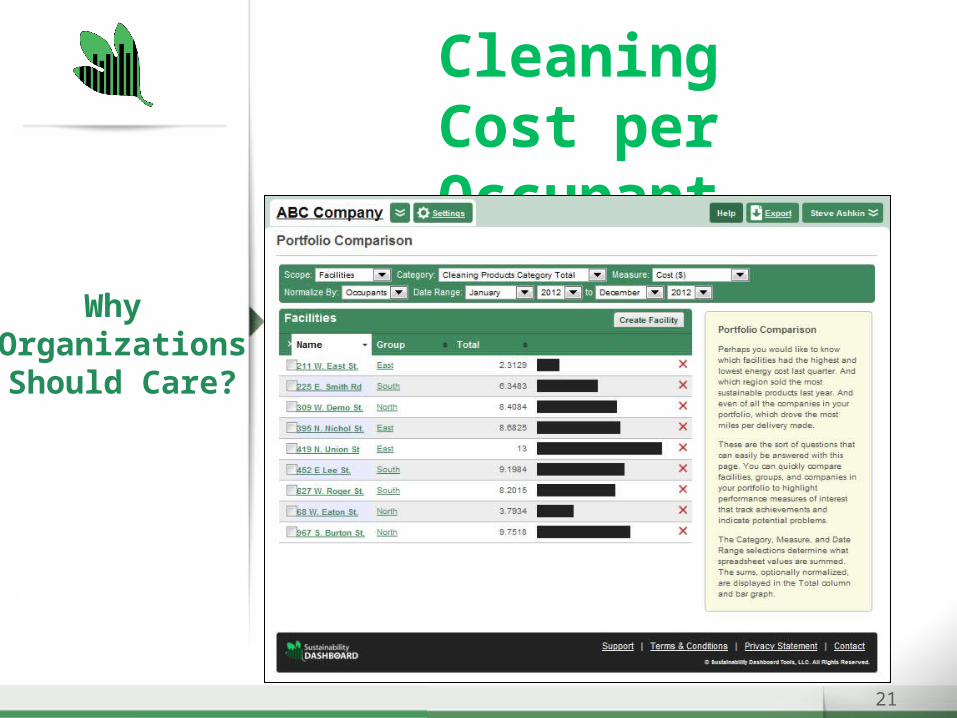
CleaningCost per Occupant
21
Why OrganizationsShould Care?

Cleaning% Green
22
Why OrganizationsShould Care?
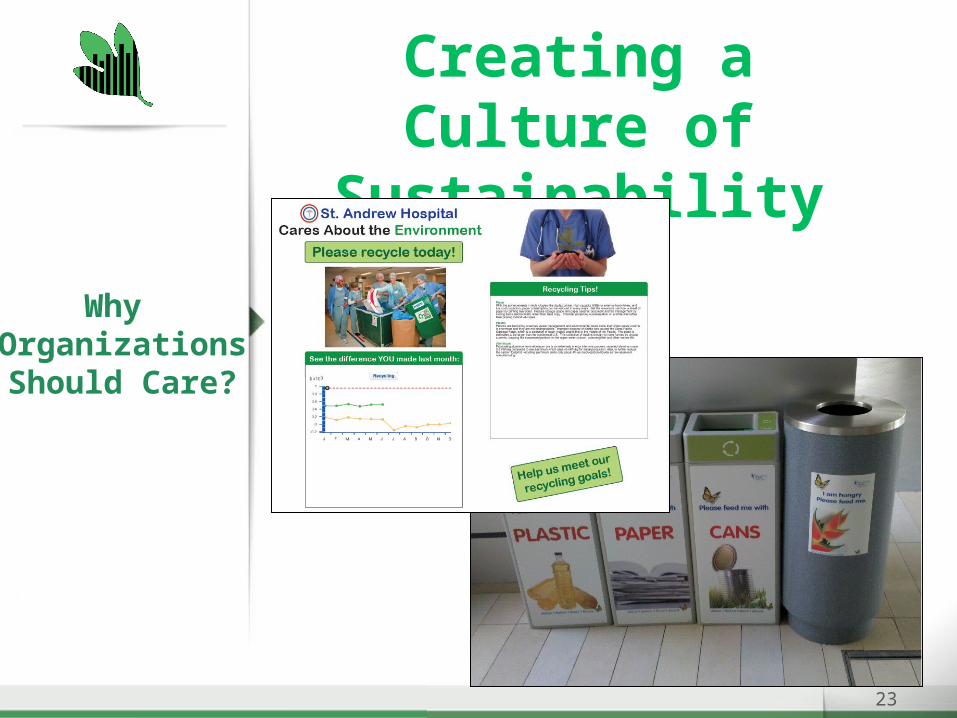
Creating a Culture of Sustainability
23
Why OrganizationsShould Care?

Creating a Culture of Sustainability
24
Why OrganizationsShould Care?

Contact:
[email]
www.green2sustainable.com
25
Stephen Ashkin
(812)[email protected]
www.green2sustainable.com
You can’t manage what you don’t measure.
The best way to predict the future is to create it.
Peter Drucker
Contact:
[email]
www.green2sustainable.com
26
Stephen Ashkin
(812)[email protected]
www.green2sustainable.com
Unless someone like you cares a whole awful lot, nothing is going to get better. It's not.
Dr. Seuss, The Lorax

NJ/PA Sustainability SymposiumRudi MiklosvaryMarch. 2012

Developing a Strategy
Manage ‘total’ energy and environmental impact to control costs, achieve sustainable targets and optimize value of assets
• Understand/ Examine your business needs• Define the scope• Acquire cost & consumption data• Evaluate and analyze• Action (implementation & control)• Performance measurement (programs)• Systems integration
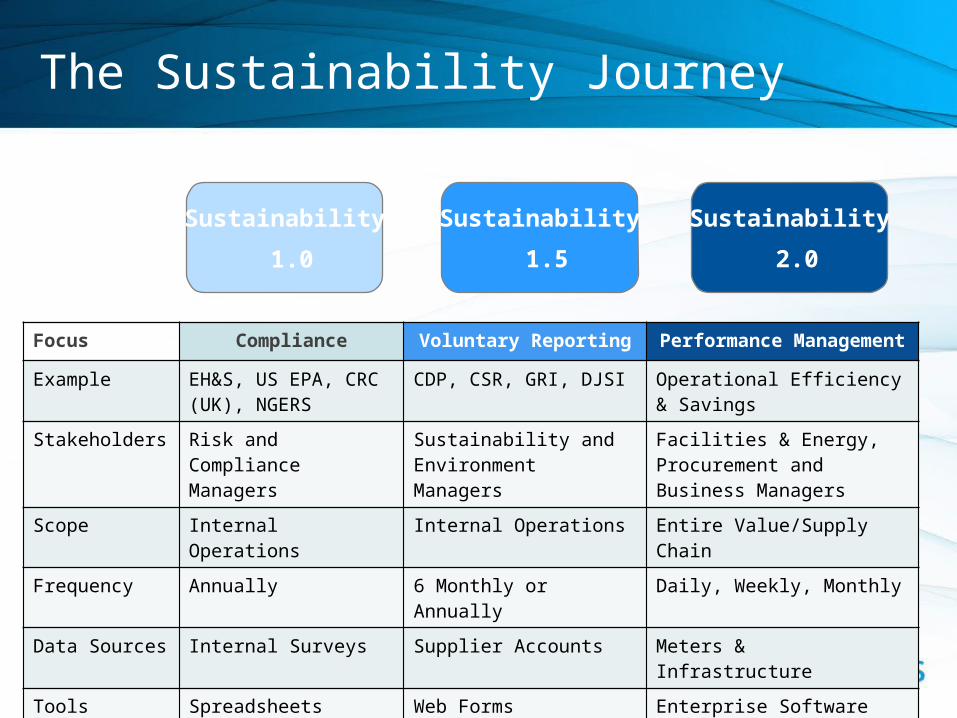
The Sustainability Journey
Focus Compliance Voluntary Reporting Performance Management
Example EH&S, US EPA, CRC (UK), NGERS
CDP, CSR, GRI, DJSI Operational Efficiency & Savings
Stakeholders Risk and Compliance Managers
Sustainability and Environment Managers
Facilities & Energy, Procurement and Business Managers
Scope Internal Operations Internal Operations Entire Value/Supply Chain
Frequency Annually 6 Monthly or Annually Daily, Weekly, Monthly
Data Sources Internal Surveys Supplier Accounts Meters & Infrastructure
Tools Spreadsheets Web Forms Enterprise Software
Sustainability
1.0
Sustainability
1.5
Sustainability
2.0

Data collection
There a variety of tools available on the market today
Match the tool set that best suits your organization and solution needs
• Simple tools – Microsoft excel, access db etc.
• Site or Local tools – BMS, dashboards, metering, automated control systems etc.
• Enterprise tools – Cloud based, systems integration, global infrastructure

Evaluate and analyze
• Evaluate the scope of your strategy and determine what goals can be achieved with the available budget
• Examine all the tools available on the market and select one that best suits your needs and objectives
• Begin identifying source data, access to source data will define the levels of automation that can be achieved in collection
• Analyze data to refine focus on the largest impact areas

Systems integration and reporting
Automated Data CaptureCapture copies of electronic data files from smart meters, supplier reports, electronic invoices and your internal IT systems for automated upload to a secure database
Manual Data CaptureQuickly and accurately enter data manually via customised web forms or preconfigured spreadsheet templates
Data Services HubsFiles in various electronic formats can be emailed to the services hubs for secure data extraction, verification and integrity testing
Global databaseThe secure SQL server manages your data and a database of global data formats, metrics and carbon emission factors for all major reporting regions around the world

Benefits of this approach
Reduce time and cost to manage energy & sustainability data• Simplify the collection of data via electronic data interchange • Free up time through scenario and rules based reporting – allowing key personnel to focus on
driving change, not managing information
Deliver up to date, business and compliance reporting• Exception reporting, automated error checking and audit trails gives you confidence in your
business decision making and reporting • Manage complex and dynamic organizational structures
Drive operational efficiency and cost savings • Develop a comprehensive sustainability performance management framework using analytical
tools and scenario models • Identify areas for operational improvement (e.g. via benchmarking) and harness cost saving
opportunities
One Penn Plaza, 36 Floor New York, NY 10119
www.globalcarbonsystems.com