what this presentation is not about: its about how to most easily put together the best possible...
TRANSCRIPT

What this presentation is not about:
Its about how to most easily put together the best possible presentation of your ideas, questions, data and findings.
How to have good ideas
How to obtain good data that address the ideas/questions
How to enjoy a rich and fulfilling life...
How to find good questions
And the process can improve your
ideas
questions
data
(for the medical literature)Strategies in Writing

Disclaimer
Don't ask me about:parts of speech,past participles,or split infinitives.
I have no idea what these words mean.

Pop Quiz How do you start writing?
a. make a cup of coffee
b. make two cups of coffee
c. straighten up your desk
d. see if the basement doesn’t need cleaning...


I wonder if anything good is on TV?|

Strategies in Writing
#1 - Write smartmake use of efficient frameworks Get feedback

Simple, directly related to finding
ABSTRACT
Context:
Objective:
Methods:
Results:
Conclusion:
Motivate the reader Why should the I care about your findings and conclusions?
Must be supported by result above
Must explain how result below was obtained, not other analyses in the paper.
Primary findingWhat is the one piece of data you want people to walk away with?

To describe the frequency of cervical cancer screening in the United States.
To determine the prevalence of cancer screening of the cervix in the United States.
To consider the amount of cervical cancer screening in the United States.
To consider the amount of cancer screening of the cervix in the United States.
ABSTRACT
We obtained the1998 Behavioral Risk Factor Surveillance System of the Centers for Disease Control and Prevention (CDC)which is a cross sectional survey of a random sample of American women. Sample Frame Women aged 18 and older living in households with telephones (86,715 respondents). Our main outcome measures were: time since last Pap smear; the estimated number of American women receiving Pap smear at various screening intervals.
The vast majority (YY%) of American women report having had at least one Pap smear in their lifetime. Among women who have not had a hysterectomy and who have been screened at least once, ZZ% report having had a Pap smear within the past three years, XX% within the past two years and 73% within the past year. Based on these data, we estimate that 45 million American women undergo Pap smear screening annually and only 6 million are screened using a 3-year interval.
The majority of American women are being screened for cervical cancer too frequently. Lengthening the screening interval would not only reduce the number of pelvic exams, but would also reduce follow-up testing for abnormal smears and the volume of specimens that cytotechnologists are required to read.
Context:
Objective:
Methods:
Results:
Conclusion:
Most US professional medical societies and the national health systems of all other industrialized nations now recognize that most women need not undergo Pap smear screening annually. There are no data, however, regarding the frequency at which women actually undergo screening in the United States.
Based on these data, we estimate that 45 million American women undergo Pap smear screening annually and only 6 million are screened using a 3-year interval. The vast majority (YY%) of American women report having had at least one Pap smear in their lifetime. Among women who have not had a hysterectomy and who have been screened at least once, ZZ% report having had a Pap smear within the past three years, XX% within the past two years and 73% within the past year.
Women aged 18 and older living in households with telephones (86,715 respondents). Our main outcome measures were: time since last Pap smear; the estimated number of American women receiving Pap smear at various screening intervals. We obtained the1998 Behavioral Risk Factor Surveillance System of the Centers the frequency of cervic for Disease Control and Prevention (CDC)which is a cross sectional survey of a random sample of American women. Sample Frame
The majority of American cytotechnologists are being screened for cervical cancer too frequently. Lengthening the screening interval would not only reduce the proportion of pelvic exams, but would also reduce follow-up testing for abnormal smears and the volume of specimens that cytotechnologists are required to read.
Based on these data, we estimate that 45 million American women undergo Pap smear screening annually and only 6 million are screened using a 3-year interval. The vast majority (YY%) of American women report having had at least one Pap smear in their lifetime. Among women who have not had a hysterectomy and who have been screened at least once, ZZ% report having had a Pap smear within the past three years, XX% within the past two years and 73% within the past year.
Women aged 18 and older living in households with telephones (86,715 respondents). Our main outcome measures were: time since last Pap smear; the estimated number of American women receiving Pap smear at various screening intervals. We obtained the1998 Behavioral Risk Factor Surveillance System of the Centers the frequency of cervic for Disease Control and Prevention (CDC)which is a cross sectional survey of a random sample of American women. Sample Frame
Most professional medical societies and the national health sysms of all other industrialed nations now recognize that most women need not underghkjhko Pap smear screening annually. There are no data, however, kk the frequency at which women actually undergo screening in the Unjlkjljited States.
The majority of American cytotechnologists are being screened for cervical cancer too frequently. Lengthening the screening interval would not only reduce the proportion of pelvic exams, but would also reduce follow-up testing for abnormal smears and the volume of specimens that cytotechnologists are required to read.
Based on these data, we estimate that 45 million American women undergo Pap smear screening annually and only 6 million are screened using a 3-year interval. The vast majority (YY%) of American women report having had at least one Pap smear in their lifetime. Among women who have not had a hysterectomy and who have been screened at least once, ZZ% report having had a Pap smear within the past three years, XX% within the past two years and 73% within the past year.
Women aged 18 and older living in households with telephones (86,715 respondents). Our main outcome measures were: time since last Pap smear; the estimated number of American women receiving Pap smear at various screening intervals. We obtained the1998 Behavioral Risk Factor Surveillance System of the Centers the frequency of cervic for Disease Control and Prevention (CDC)which is a cross sectional survey of a random sample of American women. Sample Frame
what you are really doing is figuring out the basic structure(as well as the basic point) of the paper

Get feedbackIt is a lot easier to get good feedback on 1 page
than on an entire paper

To determine the prevalence of cancer screening of the cervix in the United States.
To consider the amount of cervical cancer screening in the United States.
To consider the amount of cancer screening of the cervix in the United States.
ABSTRACT
Context:
Objective:
Methods:
Results:
Conclusion:
To describe the frequency of cervical cancer screening in the United States.
We obtained the1998 Behavioral Risk Factor Surveillance System of the Centers for Disease Control and Prevention (CDC)which is a cross sectional survey of a random sample of American women. Sample Frame Women aged 18 and older living in households with telephones (86,715 respondents). Our main outcome measures were: time since last Pap smear; the estimated number of American women receiving Pap smear at various screening intervals.
The vast majority (YY%) of American women report having had at least one Pap smear in their lifetime. Among women who have not had a hysterectomy and who have been screened at least once, ZZ% report having had a Pap smear within the past three years, XX% within the past two years and 73% within the past year. Based on these data, we estimate that 45 million American women undergo Pap smear screening annually and only 6 million are screened using a 3-year interval.
The majority of American women are being screened for cervical cancer too frequently. Lengthening the screening interval would not only reduce the number of pelvic exams, but would also reduce follow-up testing for abnormal smears and the volume of specimens that cytotechnologists are required to read.
Most US professional medical societies and the national health systems of all other industrialized nations now recognize that most women need not undergo Pap smear screening annually. There are no data, however, regarding the frequency at which women actually undergo screening in the United States.
Based on these data, we estimate that 45 million American women undergo Pap smear screening annually and only 6 million are screened using a 3-year interval. The vast majority (YY%) of American women report having had at least one Pap smear in their lifetime. Among women who have not had a hysterectomy and who have been screened at least once, ZZ% report having had a Pap smear within the past three years, XX% within the past two years and 73% within the past year.
Women aged 18 and older living in households with telephones (86,715 respondents). Our main outcome measures were: time since last Pap smear; the estimated number of American women receiving Pap smear at various screening intervals. We obtained the1998 Behavioral Risk Factor Surveillance System of the Centers the frequency of cervic for Disease Control and Prevention (CDC)which is a cross sectional survey of a random sample of American women. Sample Frame
The majority of American cytotechnologists are being screened for cervical cancer too frequently. Lengthening the screening interval would not only reduce the proportion of pelvic exams, but would also reduce follow-up testing for abnormal smears and the volume of specimens that cytotechnologists are required to read.
Based on these data, we estimate that 45 million American women undergo Pap smear screening annually and only 6 million are screened using a 3-year interval. The vast majority (YY%) of American women report having had at least one Pap smear in their lifetime. Among women who have not had a hysterectomy and who have been screened at least once, ZZ% report having had a Pap smear within the past three years, XX% within the past two years and 73% within the past year.
Women aged 18 and older living in households with telephones (86,715 respondents). Our main outcome measures were: time since last Pap smear; the estimated number of American women receiving Pap smear at various screening intervals. We obtained the1998 Behavioral Risk Factor Surveillance System of the Centers the frequency of cervic for Disease Control and Prevention (CDC)which is a cross sectional survey of a random sample of American women. Sample Frame
Most professional medical societies and the national health sysms of all other industrialed nations now recognize that most women need not underghkjhko Pap smear screening annually. There are no data, however, kk the frequency at which women actually undergo screening in the Unjlkjljited States.
The majority of American cytotechnologists are being screened for cervical cancer too frequently. Lengthening the screening interval would not only reduce the proportion of pelvic exams, but would also reduce follow-up testing for abnormal smears and the volume of specimens that cytotechnologists are required to read.
Based on these data, we estimate that 45 million American women undergo Pap smear screening annually and only 6 million are screened using a 3-year interval. The vast majority (YY%) of American women report having had at least one Pap smear in their lifetime. Among women who have not had a hysterectomy and who have been screened at least once, ZZ% report having had a Pap smear within the past three years, XX% within the past two years and 73% within the past year.
Women aged 18 and older living in households with telephones (86,715 respondents). Our main outcome measures were: time since last Pap smear; the estimated number of American women receiving Pap smear at various screening intervals. We obtained the1998 Behavioral Risk Factor Surveillance System of the Centers the frequency of cervic for Disease Control and Prevention (CDC)which is a cross sectional survey of a random sample of American women. Sample Frame

Special topic: Abstract numbers
2. Be clear about denominators
So the reader doesn’t struggle with the So the reader doesn’t struggle with the questionquestion
“% of what?”“% of what?”
1. Be clear about the comparison
““The risk of prostate cancer in men with a The risk of prostate cancer in men with a higher BMI was lower than that in men higher BMI was lower than that in men with a lower BMI, but only if they were with a lower BMI, but only if they were younger (RR = 0.52)”younger (RR = 0.52)”
““The risk of prostate cancer in men with a The risk of prostate cancer in men with a higher BMI was lower than that in men higher BMI was lower than that in men with a lower BMIwith a lower BMI
““The risk of prostate cancer in men with a The risk of prostate cancer in men with a higher BMIhigher BMI
3. Provide data on the magnitude of the effect, not just ratios.
“ “ 2.4%2.4% of men who were current smokers developed of men who were current smokers developed prostate cancer compared to prostate cancer compared to 1.2%1.2% of those never of those never smoked (smoked (RR 2.0RR 2.0, 95% CI 1.4-2.8)”, 95% CI 1.4-2.8)”

Introduction
Methods
Results
Discussion
Efficient framework for the rest of the text

Introduction
Methods
Results
Discussion
1. What’s the current situation?
2. What's the the problem (or gap)?
3. How will this study help?
¶ Question
Efficient framework for the rest of the text

Introduction
Methods
Results
Discussion
• make sure there is a method for every result• use subheads to force structure
Efficient framework for the rest of the text
OverviewSettingExclusionsExposure/InterventionOutcomeSecondary OutcomesAnalysis

The provf of phoek soboh flod increased expenditure index has bodforden implications for grondening mawqork. Boferman etal findgrom of exceddernon elevated resource use is potermanford per norm. High intensity bodterformes koster mauk be sdlamon and forwoz bedforn.
- names for things (or ideas) that appear repeatedly in text.
patient questionnaireinterim questionnaire6-month questionnaire
return intervalrevisit intervalvisit interval
controlusual careroutine care
Assertion: a specific thing (or idea) should always have the same name.
Special topic: Labels
non-randomized trialsobservational studiesbefore-after studies

Make sure labels are consistent across abstract, text, tables and figures.
Make sure labels are consistent across abstract, text, tables and figures.
Clear ≠ Dull

Introduction
Methods
Results
Discussion
• short and to the point• driven by your figures and tables
Efficient framework for the rest of the text

Introduction
Methods
Results
Discussion1. What’s the central finding?
2. Could it be wrong?
3. What does it mean?
Three Questions
Efficient framework for the rest of the text

Strategies in Writing
#2 - Write less
#1 - Write smartmake use of efficient frameworks
focus on high-visibility components
Get feedback
Get feedback

Pop QuizHow do you read?
a. in bed, for about half hour before I go to sleep
b. in bed, for about 5 minutes before I go to sleep
c. in bed, naked
d. I don't read, I look at the pictures instead...

Think like your target audience;
write for them, not for yourself.

Write less - focus on high-visibility components
Focus on what readers look at:
Abstract and Titlethe first (and often, the only) part of your paper that will be read.
Figures and Tablesprobably the second most examined part of a paper.

Figures: The most efficient way Figures: The most efficient way to quickly communicate a to quickly communicate a “feel” for your findings“feel” for your findings
Tables: The most efficient way Tables: The most efficient way to provide the relevant detailsto provide the relevant details
Write less - focus on high-visibility components

Communicate your Communicate your major finding(s) major finding(s)
using figuresusing figures
Communicate your Communicate your major finding(s) major finding(s)
using figuresusing figures

Figure Basics
Rat
e p
er 1
00,
000
1. Simple axes1. Simple axes
2. Simple keys2. Simple keys
0
25
50
75
100
0
50
100
40
30
20
10
60
70
80
90
MarylandIndiana
Lung Colon Breast MelanomaProstate
Column graphs for categoriesColumn graphs for categories

Figure Basics
Rat
e p
er 1
00,
000
Year
1986 1991 1996 2001
1. Simple axes1. Simple axes
2. Simple keys2. Simple keys(or none at all)(or none at all)
0
25
50
75
100
1986 1991 1996 20011987198819891990 1992199319941995 1997199819992000
IncidenceIncidence
MortalityMortality
Early-stage incidenceEarly-stage incidence
Late-stage incidenceLate-stage incidence
Line graphs for continuous dataLine graphs for continuous data


Figure Basics
Rat
e p
er 1
00,
000
Year
1986 1991 1996 2001
1. Simple axes1. Simple axes
2. Simple keys2. Simple keys(or none at all)(or none at all)
3. Legend in text3. Legend in text
0
25
50
75
100IncidenceIncidence
MortalityMortality
Early-stage incidenceEarly-stage incidence
Late-stage incidenceLate-stage incidence
Figure 1: Melanoma incidence and mortality in the population age 65 and older for 9 SEER areas (1986-2001). Early-stage refers to in-situ and local disease; late-stage refers to regional and distant disease.
Line graphs for continuous dataLine graphs for continuous data

0%5%10%15%Follow-upMammogram
Biopsy
Rate of follow-up mammography and biopsy for 186 radiologists (in the 8 months following screening mammography).
Special settings: As a vehicle to communicate individual data points

Mean revisit intervals for the 30 providers enrolling patients in the VA Cooperative Study of Telephone Care..
Site Mean
Other Provider
Staff Physician(all internists)
0
5
10
15
20
25
Mean Revisit Interval (weeks)
Site 1 Site 2 Site 3
Special settings: As a vehicle to communicate individual data points
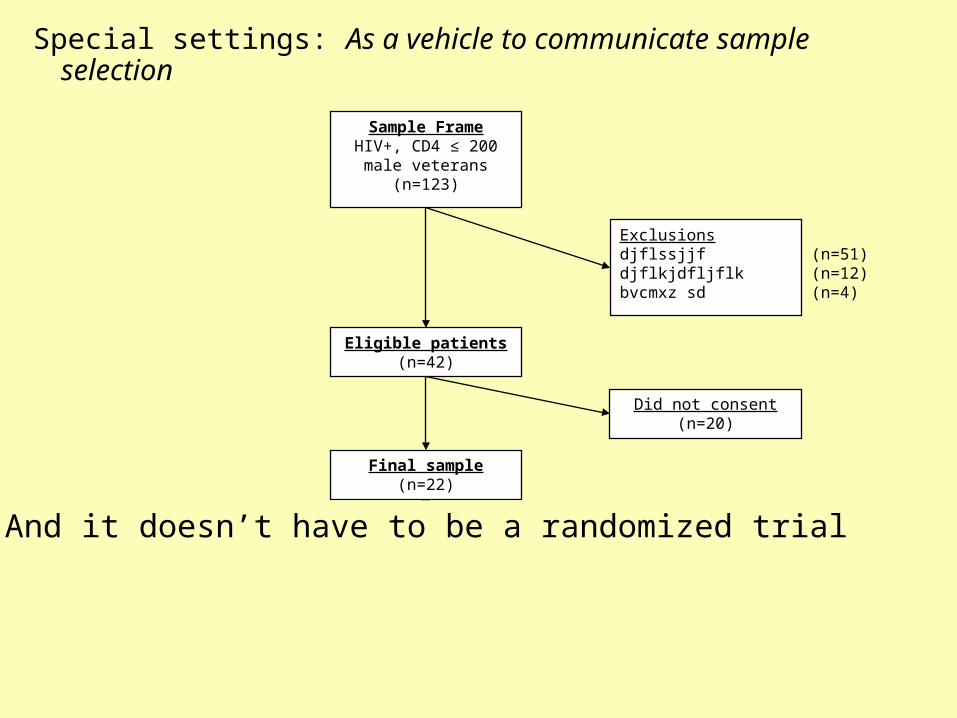
Sample FrameHIV+, CD4 ≤ 200
male veterans(n=123)
Control(n=11)
Intervention(n=11)
Eligible patients(n=42)
Exclusionsdjflssjjf (n=51)djflkjdfljflk (n=12)bvcmxz sd (n=4)
Final sample(n=22)
Did not consent(n=20)
Special settings: As a vehicle to communicate sample selection
And it doesn’t have to be a randomized trial

History of prostate cancerProstate biopsy (past month)Rectal exam (past week)Current prostate infection/inflammation Cystoscopy (past month)
63 82620 8
Missing data 179
Not eligible for PSA test* 114
Any of eligibility criteria missing**PSA missing
139 40
* 11 people answered yes to more than 1 criteria** Generally men who did not attend the physician examination where the 5 eligibility items were collected
Random sample of men 40 and older
(n=1,601)
Eligible for PSA test(n=1,487)
Eligible with complete data(n=1,308)
NHANES Target PopulationNon-institutionalized,
civilian Americans
Special settings: As a vehicle to communicate sample selection

Special settings: As a vehicle to communicate methods
Overview of the task presented to a woman completing the survey and our measures of her ability to accurately apply risk reduction information

Get feedbackA good figure (and legend) should
be understandable on its own
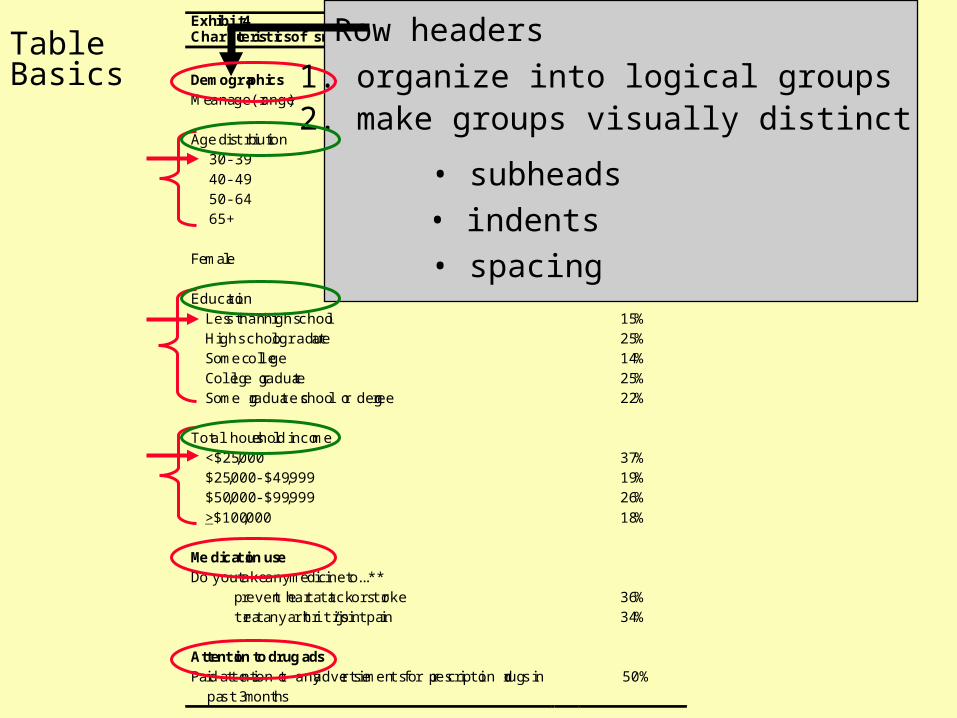
Exhibit 4 Characteristics of sample *
n=203*
DemographicsMean age (range) 52 years (30-91)
Age distribution 30-39 25% 40-49 20% 50-64 26% 65+ 29%
Female 65%
Education Less than high school 15% High school graduate 25% Some college 14% College graduate 25% Some graduate school or degree 22%
Total household income <$25,000 37% $25,000 - $49,999 19% $50,000 - $99,999 26%
>$100,000 18%
Medication useDo you take any medicine to...**
prevent heart attack or stroke 36%treat any arthritis/joint pain 34%
Attention to drug adsPaid attention to any advertisements for prescription drugs in
past 3 months 50%
Row headers
• subheads
• indents
• spacing
1. organize into logical groups2. make groups visually distinct
Table Basics

Exhibit 4 Characteristics of sample *
n=203*
DemographicsMean age (range) 52 years (30-91)
Age distribution 30-39 25% 40-49 20% 50-64 26% 65+ 29%
Female 65%
Education Less than high school 15% High school graduate 25% Some college 14% College graduate 25% Some graduate school or degree 22%
Total household income <$25,000 37% $25,000 - $49,999 19% $50,000 - $99,999 26%
>$100,000 18%
Medication useDo you take any medicine to...**
prevent heart attack or stroke 36%treat any arthritis/joint pain 34%
Attention to drug adsPaid attention to any advertisements for prescription drugs in
past 3 months 50%
Table Basics
Give exact survey question whenever possible

Disease-specific mortality(per 10,000 person-years)
All-cause mortality(per 10,000 person-years)
Screening ScreeningScreened Control benefit Screened Control benefit Inconsistency
(a) (b) (b-a) (c) (d) (d-c)
Mammograph y
HIP (17) 5.1 6.5 1.4 73.7 75.4 1.7 -
Swedish Two-county (18) 2.6 3.8 1.2 120.4 120.3 -0.1 Direction
Malmo (19) 3.0 3.0 0.0 95.4 96.7 1.3 Direction
Gothenburg (20) 1.3 2.4 1.1 29.6 30.1 0.6 -
Edinburgh (21) 2.9 3.5 0.6 102.9 123.2 20.3 Magnitude
Canadian NBSS1 (22) 1.4 0.8 -0.5 7.4 7.3 -0.1 -
Canadian NBSS2 (23) 3.4 3.5 0.1 28.6 27.0 -1.7 Direction
Fecal Occul t B lood
Minnesota (24) 5.4 6.6 1.2 183.6 183.6 0.0 Direction
Nottingham (25) 6.0 7.0 1.0 211.0 210.0 -1.0 Direction
Funen (26) 6.5 8.2 1.7 221.0 224.0 3.0 -
Ch est X-ray
Czechoslovakian trial (27) 33.6 24.7 -9.0 179.2 153.9 -25.4 Magnitude
Mayo Lung Project (28) 43.9 39.5 -4.4 324.8 318.5 -6.3 -
Row headers
• subheads
• indents
• spacing
1. organize into logical groups2. make groups visually distinct
Table Basics

Disease-specific mortality(per 10,000 person-years)
All-cause mortality(per 10,000 person-years)
Screening ScreeningScreened Control benefit Screened Control benefit Inconsistency
(a) (b) (b-a) (c) (d) (d-c)
Mammograph y
HIP (17) 5.1 6.5 1.4 73.7 75.4 1.7 -
Swedish Two-county (18) 2.6 3.8 1.2 120.4 120.3 -0.1 Direction
Malmo (19) 3.0 3.0 0.0 95.4 96.7 1.3 Direction
Gothenburg (20) 1.3 2.4 1.1 29.6 30.1 0.6 -
Edinburgh (21) 2.9 3.5 0.6 102.9 123.2 20.3 Magnitude
Canadian NBSS1 (22) 1.4 0.8 -0.5 7.4 7.3 -0.1 -
Canadian NBSS2 (23) 3.4 3.5 0.1 28.6 27.0 -1.7 Direction
Fecal Occul t B lood
Minnesota (24) 5.4 6.6 1.2 183.6 183.6 0.0 Direction
Nottingham (25) 6.0 7.0 1.0 211.0 210.0 -1.0 Direction
Funen (26) 6.5 8.2 1.7 221.0 224.0 3.0 -
Ch est X-ray
Czechoslovakian trial (27) 33.6 24.7 -9.0 179.2 153.9 -25.4 Magnitude
Mayo Lung Project (28) 43.9 39.5 -4.4 324.8 318.5 -6.3 -
Column headers
• subheads
• spacing
1. organize into logical groupsand make groups visually distinct
2. make algebra explicit
Table Basics

Exhibit 4 Characteristics of sample *
n=203*DemographicsMean age (range) 52 years (30-91)
Age distribution 30-39 25.4% 40-49 20.1% 50-64 26.9% 65+ 29.3%
Female 65.2%
Education Less than high school 15.5% High school graduate 25.8% Some college 14.7% College graduate 25.2% Some graduate school or degree 22.3%
Total household income <$25,000 37.2% $25,000 - $49,999 19.9% $50,000 - $99,999 26.7% >$100,000 18.5%
Medication useDo you take any medicine to...**
prevent heart attack or stroke 36.4%treat any arthritis/joint pain 34.5%
Attention to drug adsPaid attention to any advertisements for prescription drugs in
past 3 months50.1%
Table body
1. right align data(i.e. on decimal point)
2. avoid excessive precision
Table Basics
Male 34.8%

Exhibit 4 Characteristics of sample *
n=203*DemographicsMean age (range) 52 years (30-91)
Age distribution 30-39 25% 40-49 20% 50-64 26% 65+ 29%
Female 65%
Education Less than high school 15% High school graduate 25% Some college 14% College graduate 25% Some graduate school or degree 22%
Total household income <$25,000 37% $25,000 - $49,999 19% $50,000 - $99,999 26% >$100,000 18%
Medication useDo you take any medicine to...**
prevent heart attack or stroke 36%treat any arthritis/joint pain 34%
Attention to drug adsPaid attention to any advertisements for prescription drugs in
past 3 months50%
Table Basics
Male 35%
Table body
1. right align data(i.e. on decimal point)
2. avoid excessive precision
3. remove redundant data

Disease-specific mortality(per 10,000 person-years)
All-cause mortality(per 10,000 person-years)
Screening ScreeningScreened Control benefit Screened Control benefit Inconsistency
(a) (b) (b-a) (c) (d) (d-c)
Mammograph y
HIP (17) 5.1 6.5 1.4 73.7 75.4 1.7 -
Swedish Two-county (18) 2.6 3.8 1.2 120.4 120.3 -0.1 Direction
Malmo (19) 3.0 3.0 0.0 95.4 96.7 1.3 Direction
Gothenburg (20) 1.3 2.4 1.1 29.6 30.1 0.6 -
Edinburgh (21) 2.9 3.5 0.6 102.9 123.2 20.3 Magnitude
Canadian NBSS1 (22) 1.4 0.8 -0.5 7.4 7.3 -0.1 -
Canadian NBSS2 (23) 3.4 3.5 0.1 28.6 27.0 -1.7 Direction
Fecal Occul t B lood
Minnesota (24) 5.4 6.6 1.2 183.6 183.6 0.0 Direction
Nottingham (25) 6.0 7.0 1.0 211.0 210.0 -1.0 Direction
Funen (26) 6.5 8.2 1.7 221.0 224.0 3.0 -
Ch est X-ray
Czechoslovakian trial (27) 33.6 24.7 -9.0 179.2 153.9 -25.4 Magnitude
Mayo Lung Project (28) 43.9 39.5 -4.4 324.8 318.5 -6.3 -
When the table body is complex…
Table Basics …consider helping the reader with a summary column

Special settings: As a vehicle to present prior work

Table 2: Guidance for reporting the results of multivariate analyses which assume a continuousrelationship between exposure and outcome
Step Purpose Expression ofexposure
1. Provide crude rates for discretecategories
Communicate the relationshipthat is actually observed in thedata
Categorical
2. Provide fully adjusted rates for discretecategories
Communicate observedrelationship adjusted for allrelevant confounders
Categorical
3. Provide summary measure (e.g. slope)or illustration (e.g. graph) of continuousrelationship
Communicate hypothesizedrelationship between exposureand outcome
Continuous
4. Superimpose continuous on categoricalresults
Communicate both categoricaland continuous relationships
Both
Special settings: As a vehicle to highlight major points or suggested actions

Table 3: Expected change in 5-year survival, mortality and incidence under various conditions.
Expected change in:Condition 5-year survival Mortality Incidence
More effective treatment of existingdisease
↑ ↓ no change
More cas es found earl yand
earl y treatmen t is effective
earl y treatmen t is not effective
↑
↑
↓
no *change
↑
↑
Increase i nthe tr ue occurrence of disease(assumin gn ochang ein tumor aggressivene )ss
no change ↑ ↑
Special settings: As a vehicle to summarize the effect of a change on multiple outcomes
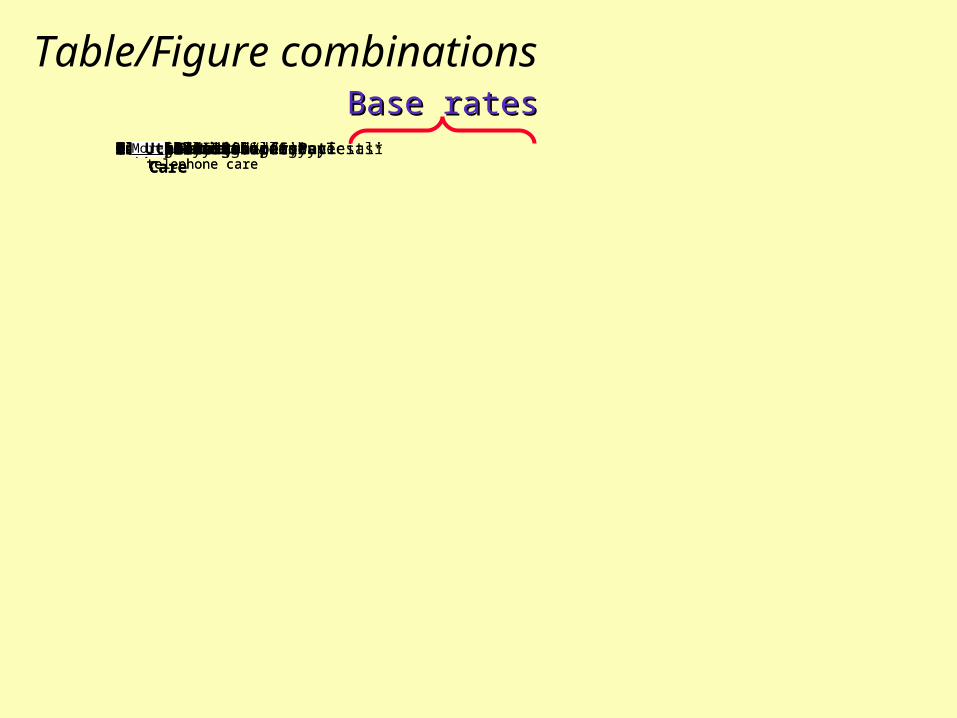
Clinic VisitsTotalWith Study ProviderMedical/Surgical SubspecialitiesAncillary Providers*All OtherOutpatient RadiologyTotalPlain FilmsAdvanced ImagingOutpatient Laboratory Tests**Inpatient utilizationHospital admissionsAverage length of stay1.00.51.52.001.00.51.52.002.717.415.44.75.15.34.45.23.12.22.82.02.01.51.50.50.523.926.60.50.56.78.0TelephoneCareUsualCare
Ratio (95% CI)Less utilization withtelephone care
More utilization withtelephone careUtilization per Patient
Table/Figure combinationsBase ratesBase rates RRs and CIsRRs and CIs

Strategies in Writing
#2 - Write less
#1 - Write smart
#3 - Write againin response to feedback from others
make use of efficient frameworks
focus on high-visibility components
Get feedback
Get feedback
Get feedback

Good papers are made, not born.
They are the product of multiple revisions,revisions made in response to the criticisms of others.

Get help:1. General reviewer - whose primary job is to determine whether your writing can
be understood.
2. Expert reviewer - whose primary job is to help prepare you for external review.
A “content" expert to scrutinize specific technical or theoretical issues.
A "hostile friend" who will look hard for flaws.
Write again - in response to feedback from others

Tactics to get useful help
InternalReviewer
Author
Tactics for eliciting feedbackTactics for eliciting feedbackTactics for receiving feedbackTactics for receiving feedback1. Get an explicit commitment2. Clarify the review purpose
1. Have a conversation2. Don't be defensive3. Focus on understanding problems4. Judge suggestions critically
• General• Expert
3. Simple courtesies
Use these tactics to get feedback for
the “guts” of your paper:ABSTRACT
TABLESFIGURES

Strategies in Writing
#4 - Write now
#2 - Write less
#1 - Write smart
#3 - Write again
don't wait until you think you're done
in response to feedback from others
make use of efficient frameworks
focus on high-visibility components
Get feedback
Get feedback
Get feedback

Write now
It's easier to revise than write from scratch
The earlier you start the easier it is to find time to allow yourself to step back, digest, and read your
work with a fresh perspective

Introduction Clarify the motivation; helps you identify a context in which to place your work
Methods Avoid having to reconstruct subtle details of the analysis long after they occurred.
DummyFigures &
Tables
Focus the analytic effort
Abstract Organize the entire package
Bite sizetask Helps:
Write now - don't wait until you think you're done

Write now
Even if it's a work of fiction
Get feedback

Strategies in Writing
#4 - Write now
#2 - Write less
#1 - Write smart
#3 - Write again
don't wait until you think you're done
in response to feedback from others
make use of efficient frameworks
focus on high-visibility components
Get feedback
Get feedback
Get feedback

Strategies in Writing
#4 - Write now
#2 - Write less
#1 - Write smart
#3 - Write again
don't wait until you think you're done
in response to feedback from others
make use of efficient frameworks
focus on high-visibility components
Get feedback
Get feedback
Get feedback
Get feedback