what the top 50 apps do with iap that the rest of us don't
TRANSCRIPT

WHAT THE TOP 50 APPS DO WITH IAP THAT THE REST OF US DON’T
Reach Engage Earn
MIKE HINESDEVELOPER EVANGELIST, AMAZON
@MikeFHines mikehines45

CREDIBLY INNOVATE PHOTO HERE
Amazon Appstore
TODAY’S AGENDAHow the Top 50 Did
What They Do Differently – Selling
What They Do Differently – Engagement
When to have a Sale
1. Get out of bed
2. Go to Conference
3. Learn something
4. Go to bed

Amazon’s Large and Active Audience
3Android devices
Fire phone
Kindle Fire
The Appstore supports a large ecosystem
Customers are 1-Click purchase ready
Available on Android tablets and phones
The only store for Amazon devices
Amazon Appstore reaches FireOS, Android, and Blackberry 10 customers
Fire TV & Fire TV Stick
BB 10

How the Top 50 apps did vs. the rest of us
TOPIC 1
12

Cohort AnalysisGroup A: Top-50 Grossing
Source: Amazon Appstore, March 2014
Group B: Rest of Freemium

Day 1: InstallsGroup A: Top-50 Grossing
iiiiiiiiiiiiiiiiiiiiiiiiiiiiiiiiiiiiiiiiiiiiiiiiiiiiiiiiiiiiiiiiiiiiiiiiiiiiiiiiiiiiiiiiiiiiiiiiiiii
Source: Amazon Appstore, March 2014
Group B: Rest of Freemium
iiiiiiiiiiiiiiiiiiiiiiiiiiiiiiiiiiiiiiiiiiiiiiiiiiiiiiiiiiiiiiiiiiiiiiiiiiiiiiiiiiiiiiiiiiiiiiiiiiii
100100installed

Day 1: Active UsersGroup A: Top-50 Grossing
iiiiiiiiiiiiiiiiiiiiiiiiiiiiiiiiiiiiiiiiiiiiiiiiiiiiiiiiiiiiiiiiiiiiiiiiiiii
iiiiiiiiiiiiiiiiiiiiiiiiiiiiiiiiiiiiiiiiiiiiiiiiiiii
Source: Amazon Appstore, March 2014
Group B: Rest of Freemium
iiiiiiiiiiiiiiiiiiiiiiiiiiiiiiiiiiiiiiiiiiiiiiiiiiIiiiiiiiiiiiiiiiiiiiiiiiiiiiiiiiiiiiiiiiiiiiiiiiiiiiiiiiiiiiiiiiiiiiiiiiiiii
4142
In active
5958
active

Day 1: UninstallsGroup A: Top-50 Grossing
iiiiiiiiiiiiiiiiiiiiiiiiiiiiiiiiiiiiiiiiiiiiiiiiiiiiiiiiiiiiiiiiiiiiiiiiiiii
iiiiiiiiiiiiiiiiii
Source: Amazon Appstore, March 2014
Group B: Rest of Freemium
iiiiiiiiiiiiiiiiiiiiiiiiiiiiiiiiiiiiiiiiiiiiiiiiiiIiiiiiiiiiiiiiiiiiiiiiii
iiiiiiiiiiii1318
uninstalled
5958
active

Day 1: Paying UsersGroup A: Top-50 Grossing
iiiiiiiiiiiiiiiiiiiiiiiiiiiiiiiiiiiiiiiiiiiiiiiiiiiii
iiiiiiiiiiiiiiiiiiiiiiiiiiiiiiiiiiiiiiiiiii
Source: Amazon Appstore, March 2014
Group B: Rest of Freemium
iiiiiiiiiiiiiiiiiiiiiiiiiiiiiiiiiiiiiiiiiiiiiiiiiiiiiiiiiiiiiiiiiiiiiiiiiiiiiiiiiiiiiiiiii1318
uninstalled
5958
active
33
paying

2.62.9
Source: Amazon Appstore, March 2014
Day 1: EngagementGroup A: Top-50 Grossing
iiiiiiiiiiiiiiiiiiiiiiiiiiiiiiiiiiiiiiiiiiiiiiiiiiiii
iiiiiiiiiiiiiiiiiiiiiiiiii iiiiiiiiiiiiiiiii
Source: Amazon Appstore, March 2014
Group B: Rest of Freemium
iiiiiiiiiiiiiiiiiiiiiiiiiiiiiiiiiiiiiiiiiiiiiiiiiiiiiiiiiiiiiiiiiiiiiiiiiiiiiiiiiiiiiiiiii1318
uninstalled
5958
active
33
paying
# of sessions / active
session length / active(minutes)
× =
avg. session length(minutes)
6.97.4 1822

6.97.4 2.62.9
Day 1: RevenueGroup A: Top-50 Grossing
iiiiiiiiiiiiiiiiiiiiiiiiiiiiiiiiiiiiiiiiiiiiiiiiiiiii
iiiiiiiiiiiiiiiiiiiiiiiiii iiiiiiiiiiiiiiiii
Source: Amazon Appstore, March 2014
Group B: Rest of Freemium
iiiiiiiiiiiiiiiiiiiiiiiiiiiiiiiiiiiiiiiiiiiiiiiiiiiiiiiiiiiiiiiiiiiiiiiiiiiiiiiiiiiiiiiiii
=×# of items / paying
100%11
2%
avg. selling price
100%
136%
100
%
154
%
ARPPU
1318
uninstalled
5958
active
33
paying
# of sessions / active
session length / active(minutes)
× =
avg. session length(minutes)
1822

Source: Amazon Appstore, March 2014
1 Day Later…Group A: Top-50 Grossing
iiiiiiiiiiiiiiiiiiiiiiiiiiiiiiiiii
iiiiiiiiiiiiiiiiiiiiiiii
Group B: Rest of Freemium
iiIiiiiiiiiiiiiiiiiiiiiiiiiiiiiiiiiii
iiiiiiiiiiiiiiiii
# of sessions / active
session length / active(minutes)
×
avg. session length(minutes)
1725
uninstalled
3437
active
11
paying
=×# of items / paying
100%10
6%
avg. selling price
100%10
7%
100
%114%
ARPPU
6.77.7
3.2
3.521
27
=
# of sessions / active

3 Days Later…Group A: Top-50 Grossing
iiiiiiiiiiiiiiiiiiiiiii
iiiiiiiiiiiiiiiiiiiiiiiiiiii
Source: Amazon Appstore, March 2014
Group B: Rest of Freemium
iiiiiiiiiiiiiiiiiii
iiiiiiiiiiiiiiiiii
# of sessions / active
session length / active(minutes)
×
avg. session length(minutes)
1928
uninstalled
1923
active
=×# of items / paying
100%
107%
avg. selling price
100%12
2%
100
%131%
ARPPU
5.9
7.92.6
3.2
15
25
=
# of sessions / active

1 Week Later…Group A: Top-50 Grossing
iiiiiiiiiiiiiiiiiii
iiiiiiiiiiiiiiiiiiiiiiiiiiiiiiii
Source: Amazon Appstore, March 2014
Group B: Rest of Freemiumiiiiiiiiiiiiii
iiiiiiiiiiiiiiiiiiii
# of sessions / active
session length / active(minutes)
×
avg. session length(minutes)
2032
uninstalled
1418
active
=×# of items / paying
100%10
2%
avg. selling price
100%
121%
100
%124%
ARPPU
5.77.4
2.63.2
15
24
=
# of sessions / active
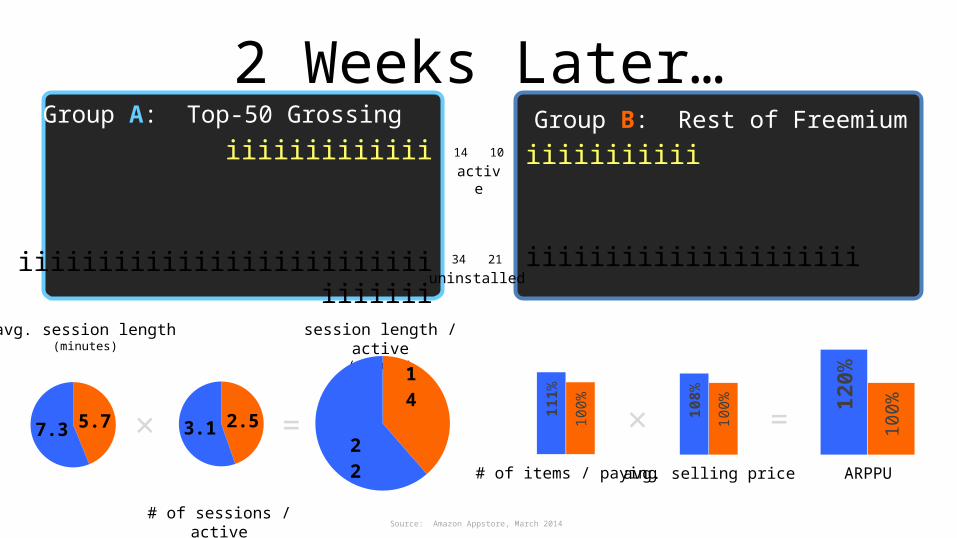
2 Weeks Later…Group A: Top-50 Grossing
iiiiiiiiiiiii
iiiiiiiiiiiiiiiiiiiiiiiiiiiiiiiii
Source: Amazon Appstore, March 2014
Group B: Rest of Freemium
iiiiiiiiiii
iiiiiiiiiiiiiiiiiiiii
# of sessions / active
session length / active(minutes)
×
avg. session length(minutes)
2134
uninstalled
1014
active
=×# of items / paying
100%11
1%
avg. selling price
100%10
8%
100
%120%
ARPPU
5.77.3
2.53.1
14
22
=
# of sessions / active

1 Month Later…Group A: Top-50 Grossing
iiiiiiii
iiiiiiiiiiiiiiiiiiiiiiiiiiiiiiiiii
Source: Amazon Appstore, March 2014
Group B: Rest of Freemium
iiii
iiiiiiiiiiiiiiiiiiiiiiii
# of sessions / active
session length / active(minutes)
× =
avg. session length(minutes)
2236
uninstalled
48
active
=×# of items / paying
100%10
3%
avg. selling price
100%
128%
100
%
131%
ARPPU
5.97.3
2.43.1
14
23
# of sessions / active

Hours Since App Download
IN-APP PURCHASING BY HOUR
Source: Amazon Appstore, March 2014
0 9 18 27 36 45 54 63 72 81 90 99 108 117 126 135 144 153 162 171 180 189 198 207 216 225 234 243 252 261 270 279 288 297

PRICE INCREASES OVER TIME
Days User Owned App
80%90%
100%110%120%130%140%150%160%170%
Source: Amazon Appstore, March 2014
+60%
averageselling price
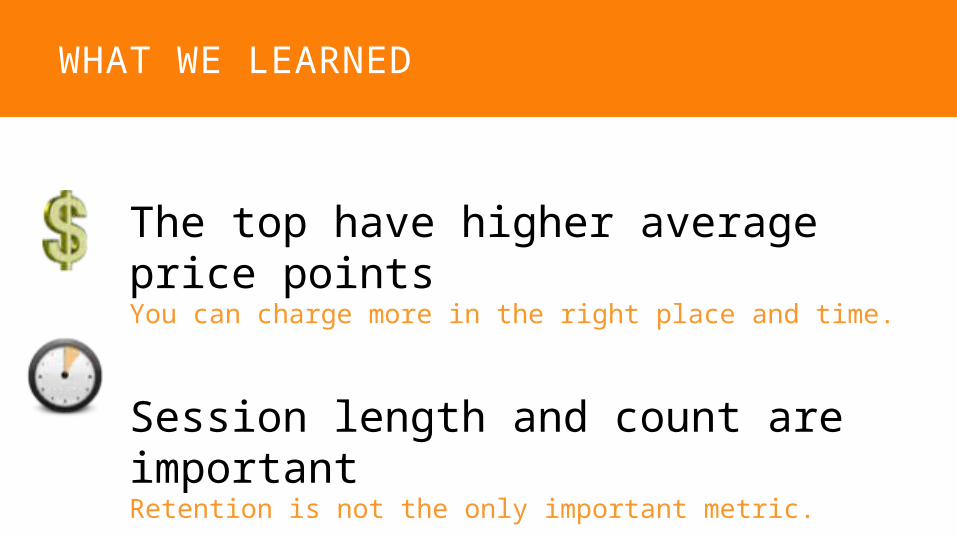
WHAT WE LEARNED
The top have higher average price pointsYou can charge more in the right place and time.
Session length and count are importantRetention is not the only important metric.

What the top 50 do differently-- Selling
TOPIC 2
2

THE TOP DEVELOPERS KNOW THE NUMBERS
?
ENGAGE CUSTOMER EARLY
MAKE IT EASY TO COME BACK
GIVE THEM A REASON TO COME BACK
37% of users who will purchase, purchase on the first day
48% of repeat purchases happen within one hour of a previous purchase
64% of revenue comes from 3rd order +
74% of revenue occurs after first 7 days
56% of revenue occurs after first 30 days

Apps with tutorials that introduce IAP items
HAVE A 2.5x HIGHER CONVERSION RATESource: Amazon Appstore, July 2013

Apps showing users how to “consume”
GET MORE REPEAT ORDERSGames that providing a post-purchasing tutorial generated 65% more repeat
orders than the market average.
Source: Amazon Appstore, March 2014

Games with bigger selection
RECEIVE MORE ORDERS PER CUSTOMERDevelopers that add new items regularly are able to re-engage their paying customers. 1.14% of the customers generate 30% of sales.
Source: Amazon Appstore, March 2014
1-5 Items 6-10 Items
11-15 Items
69%
100%
145%
ARPPU by # of IAP items for sale

Conversion Rate
INDEX: Average = 100%
Don’t confuse your customer
OFFER VARIETY, BUT NOT TOO MUCH
Source: Amazon Appstore, March 2014
1-5 Price Points
6-10 Price Points
11-15 Price Points
0%
50%
100%
150%
200%
147%
101%
52%

To sell more IAP items,
BE CLEAR ABOUT VALUEMake it obvious what the benefit is for buying different price items. Confused customers don’t buy anything.

WHAT WE LEARNED
Games with bigger selection
RECEIVE MORE ORDERS
Tutorials that introduce in-app items
HAVE HIGHER CONVERSION
Showing users how to “consume”
GETS REPEAT ORDERS
Treating in-app items like a catalogue
MAKES IT EASY TO SHOP
1.14%
of paying customers generate30% of sales
What the top 50 do differently-- Engagement
TOPIC 3
3

REDUCE BARRIERS TO FREQUENT USE

Tuning Game Difficulty
WILL ENCOURAGE LONGER SESSIONSToo hard, and users will abandon. Too easy, and they can get bored. Just right, and it becomes addictive!

Adopting Social
CAN CREATE BUZZ AND KEEP USERS ENGAGEDThis will result in more friend-to-friend marketing as players share their achievements and ranks. Players will also compete with friends and leaders and stay engaged.
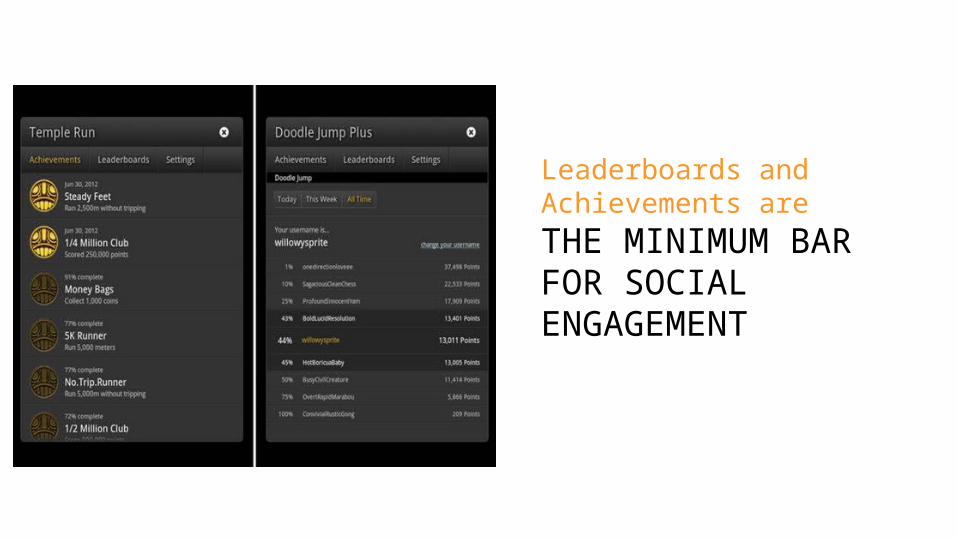
Leaderboards and Achievements areTHE MINIMUM BAR FOR SOCIAL ENGAGEMENT

Design IAP into the fabric of your game
MAKE IT EASY TO BUYOffering ways to buy your IAP items when they are needed will increase conversion.
Apps that made it easy to shop
INCREASED REVENUE 75% (ARPPU) Source: Amazon Appstore, March 2014

To be in control,
HAVE A LOT OF LEVERSUse A|B Testing to fine-tune everything from game difficulty to IAP menu choices.

WHAT WE LEARNED
Add social and tweak game difficulty to
INCREASE TIME AND COUNT OF SESSIONSCater to your best and longest customers with clear value
DIFFERENTIATE YOUR IAP CATALOGGive yourself control of your game in the wild
IMPLEMENT A|B TESTING

IF YOU ONLY DO ONE THING…
Cater to your best and longest customers
DIFFERENTIATE YOUR IAP CATALOG

IF YOU ONLY DO TWO THINGS…
Cater to your best and longest customers
DIFFERENTIATE YOUR IAP CATALOG
Make sure your IAP catalogs are
CLEAR ABOUT VALUE

Learn more: http://developer.amazon.com/welcome
Contact us: forums.developer.amazon.com Tweet: @MikeFHines
Follow us:/AmazonAppstoreForAndroid
@AmazonAppDev @MikeFHines
developer.amazon.com/blog