what the market - goldman sachs · paper: we use hedonic pricing adopted from consumer theory to...
TRANSCRIPT

The Goldman Sachs Group, Inc.
Sandra Lawson [email protected]
Sonya Banerjee [email protected]
Hui Shan [email protected]
GLOBAL MARKETS INSTITUTE
April 2019
WHAT THE MARKET PAYS FOR
Amanda Hindlian [email protected]
Steve Strongin [email protected]

Executive Summary 3
Section I: Investors Value Persistence 6
Section II: Deep Pocket Risk 18
Appendix I: More Detail on the Numbers 25
Appendix II: Segment Reporting - Two Examples 26
Disclosure Appendix 28
25 April 2019 2
Goldman Sachs Global Markets Institute
Table of Contents
The authors would like to thank Charles P. Himmelberg, Ben Snider, Jennifer Carey, Justine Fisher, Michael Hinds, Patty Lynch, Nicola Doll and Darshak Patel.
The Global Markets Institute is the research think tank within Goldman Sachs Global Investment Research. For other important disclosures, see the Disclosure Appendix.
Executive Summary
Companies tend to believe they are undervalued and misunderstood: the often-cited refrain is that markets are too short-term oriented and therefore fail to understand the potential upside that the company offers. The reality is considerably more complex. While investors do focus on quarterly numbers, a deep dive into how the market responds to earnings reports shows that investors are searching and paying for predictable revenues, while heavily discounting less persistent ones.
Thus the divide that can emerge between investors and managements is often about predictability rather than time frame. Classic finance theory (and much of the public discourse) tends to focus on how the market should value a company’s risk relative to its potential – the traditional concept of risk-reward. But actual market practice is more often about the related (but not quite identical) concepts of forecastability and persistence – what investors often refer to as “visibility.” In practice, this tends to mean that the market rewards companies for consistency and punishes them for surprises.
Companies would prefer greater trust and flexibility, which would allow them more freedom to pursue long- and short-term opportunities as they arise, even when those opportunities lack the predictability and persistence investors typically desire. The market focus on predictability and persistence may cause managements to miss interesting opportunities, which can be especially frustrating to companies that believe other (often less well-established) firms get more trust from the market, meaning higher multiples, for riskier investments than their own.
Frustrated managements often reference companies that seem to get nothing but investors’ trust. Biotechnology, various examples of specialty technology and other “pure play” stocks are good examples of when the market seems quite comfortable paying for “hope” rather than for realized, predictable performance. But these are not so much counter-examples as they are special cases of the same process: in these instances, the market tends to pay for predictable responses to specific possible forward outcomes, such as test results that may lead to government drug approvals. Despite how it may appear, “hope company” valuations usually do reflect the market’s willingness to pay for predictability – but the predictability in these cases is in risk exposures rather than in execution.
To create and enforce risk-exposure discipline, hope companies are structured best when they look more like options than cash securities, meaning when they tend to be minimally capitalized and narrowly focused. The resulting high-multiple options-like pricing behavior can create additional confusion for managements who wonder why these companies tend to receive premium valuations. Stocks are usually worth more as volatility declines and realized performance improves. In comparison, hope stocks (which again can be thought of as options) increase in value as their risk increases and, perhaps paradoxically for those who are not accustomed to options pricing, the incremental value of the optionality (or the value of hope) declines as the intrinsic value of the firm improves or realized performance stabilizes.
25 April 2019 3
Goldman Sachs Global Markets Institute

The reasons why hope companies price this way are as follows: the upside for the cash and options-like securities is similar in the “good” scenarios, but in the “bad” scenarios, investors holding the options typically aren’t exposed to the full extent of the losses. Thus, the worse the possible bad outcomes are that are embedded in the investment, the greater the relative value of the option that allows investors to limit their exposures.
The inability to avoid losses in bad scenarios is why good companies – meaning well-capitalized, consistently strong performing, diversified businesses – generally have difficulty getting paid by the market for pursuing hope projects. For existing firms with substantial financial resources, from investors’ perspectives, the more managements sell the upside of hope exposures, the more these firms are implicitly committing to continuing to spend on those exposures in bad scenarios. This “deep pocket risk” is why large firms often feel they don’t get full credit for their most ambitious projects.
In practice, managements’ repeated focus on hope projects can induce significant deep-pocket penalties that negatively affect their valuations. In these cases, firms are better off limiting communication in-line with the expenditures on these projects, rather than emphasizing their hoped for upside, thus avoiding the perception that the firm will spend itself into success. Further, it would be helpful for managements to explicitly discuss exit strategies or defunding criteria to make it clear that the downside will be capped. In contrast, for hope firms, the more managements can sell the upside, the better.
The question of whether a new effort should be spun out of an existing company or remain within it is largely dependent on the trade-off between internal synergies and the ability to manage spending in the downside scenario. The greater the internal synergies are with existing corporate infrastructure, expertise and products, the more the firm would like to keep the project inside its own walls. But these synergies can be offset by the inability to constrain spending in bad scenarios. What’s more, the less that spending can be controlled, the more sense it makes to spin the effort into an independent entity.
With these findings in mind, we show the mechanisms by which the market assesses discipline, persistence and predictability. This informs our discussion of firm structure and the types of communications that are best-suited to raising share prices over both the short- and long-term. The conclusion is that for mature companies, the more predictable the results, the higher the valuations.
This explains why, for example, financial leverage tends to be highly valued (until it becomes unsustainable and de-leveraging is then rewarded), and why cyclical price boosts to earnings – such as those caused by oil price increases or special promotions – are usually heavily discounted by the market. It also explains why the market often penalizes companies that beat on earnings but miss on revenues.
Perhaps most importantly, our findings can help guide managements to explain company performance and corporate strategy in ways that are most likely to benefit valuations, namely by being as transparent and as easy to forecast as possible. This is particularly important for firms with complex structures and strategies. While markets tend to reward stocks for simple stories – because simple businesses are easier to
25 April 2019 4
Goldman Sachs Global Markets Institute

predict and to evaluate – for some companies, complexity is part of their competitive advantage. In these cases, managements can reduce the market’s tendency to tax the company’s complexity by making it easier for investors to predict and understand the results. This can be accomplished by reorganizing corporate reporting to:
1. Create more easily predicted and persistent streams of recurring revenue;
2. Separate ongoing and persistent revenue streams from non-recurring ones; and
3. Clearly delineate new investments, along with detailed funding constraints for such new ventures.
In the end, we believe that a careful approach to corporate communications, with these findings in mind, can substantially reduce the gap between a management’s view of its own business and the price investors are willing to pay for that business.
25 April 2019 5
Goldman Sachs Global Markets Institute

Section I: Investors Value Persistence
In finance, the classic approach to valuing companies focuses on what markets should price, which is typically risk relative to reward. We take a different approach in this paper: we use hedonic pricing adopted from consumer theory to focus not on what should be priced, but on what the market is actually pricing in practice1.
Hedonic pricing models have long been used outside of finance to understand market pricing. In the housing market, for example, such models have been used to estimate how much homebuyers are willing to pay for an additional bedroom or for access to a high-quality school district. Similarly, hedonic models have been used to determine how much an airline passenger is willing to pay for more legroom.
To facilitate comparisons across sectors, we use a very general representation of each firm’s financials that can be used across all industries. This allows easy and meaningful comparisons of industry regression coefficients. To see how these methods can be employed using industry-specific models see: “Goldman Sachs Energy Group: Essential Valuation,” September 20002.
We then group the firms in our sample set together by industry and by financial characteristics. This allows us to estimate how the market values financial characteristics on a sectoral basis. Next we decompose return-on-equity (ROE) multiples for each firm in our sample using DuPont formula concepts of leverage, asset turnover and net income margin.
Additionally, we assess how much investors are willing to pay for a firm’s “story,” meaning the narrative regarding the forward outlook. We do this by using sell-side equity analysts’ forward earnings estimates, and by statistically removing from these forecasts the gains or losses that could have been derived from previously reported numbers, without input from company managements.
We next consider how the results differ by industry grouping. This helps us to better understand the impact cyclical vs. secular breakdowns and other industry characteristics can have on pricing.
Based on this analysis, we find that investors pay for persistence. We find, for example, that investors tend to pay far more for increases in leverage than for increases in asset turnover or for improvements in net income margin, since leverage tends to be highly persistent. However, as leverage becomes excessive and therefore unsustainable, the market becomes less willing to pay for it – as should be expected. We delve into the details of this work in the sections that follow. But first, we break down the explanatory power of each of the factors we considered in our analysis.
1 This is consistent with the market-based valuation (MBV) approach that we employed in the Wavefronts framework introduced in 2004. See: Strongin S., Segal L., Timcenko A., Vaidya J., Weisberger N., Wilson D., “Introducing Wavefronts: A new way of trading macro equity views,” April 2004.2 See: Ling A., Strongin S., Lanstone M., Murti A.N., Segal L., “Goldman Sachs Energy Group: Essential Valuation,” September 2000.
25 April 2019 6
Goldman Sachs Global Markets Institute

Based on our estimates, hedonic pricing explains nearly 85% of the differences that arise in valuations across sectors (see Exhibit 14 in Appendix I). 50 percentage points are explained by “fixed” firm-specific factors, meaning largely unchanging aspects of a firm, such as its market niche. Another quarter can be explained by industry and timing effects, as well as by price momentum and story. Finally, one-tenth of this figure – roughly 8% – can be explained by a firm’s actual financial results. Put another way, the nature of a firm – such as its industry – drives roughly 10 times more of its valuation than its own financial performance does.
Nevertheless, advancing from the third to the second quartile in financial performance metrics – such as in net income margin, asset turnover and leverage – can increase a firm’s price-to-book multiple by 3 to 15 percentage points, depending on the industry and the metric; advancing from the second quartile to the first can increase a firm’s price-to-book multiple by 5 to 40 percentage points. Accordingly, the way these metrics are priced has clear implications for how firms can best describe their core businesses to investors and, even more importantly, for how firms should be run to generate the most value for their shareholders.
Taken together, these factors suggest that strong, consistent performance is an essential driver of a firm’s valuation. The results also show that any form of short-termism is likely to be counterproductive.
A closer look at the model We use an unbalanced panel of Russell 1000 and Russell 2000 companies from 1980 through 2018 as the basis for our work, thereby capturing the majority of publicly traded firms in the US over nearly four decades. But, since the framework we are using applies best to companies with significant ongoing operations, we restrict the sample to companies that are profitable. Our dataset therefore includes roughly 6,500 companies across industries.
We begin the analysis by considering each firm’s market valuation as measured by its price-to-book ratio3. This ratio is directly related to a firm’s ROE, among other factors, as the following formula shows:
Following DuPont methodology, we split each firm’s ROE into three components – net income margin, asset turnover and a leverage factor – as follows:
Using this decomposition, we recast each firm’s price-to-book ratio into the below equation, where i indexes the company, t indexes time and j indexes the industry.
3 Using price-to-tangible book does not alter the results substantially.
25 April 2019 7
Goldman Sachs Global Markets Institute

We include a full set of company fixed effects in our model to control for company-specific drivers of valuation that could otherwise bias our results (differences in the quality of management teams, as one example). We also include industry-time fixed effects to control for macroeconomic and microeconomic factors that can affect industries at specific points in time (the impact of the 2000-01 recession on technology firms or of the 2008-09 financial crisis on financial services firms, as examples). And, for any given quarter, we classify each company into four market capitalization based quartiles and include size-time fixed effects, which mean that time-varying liquidity premiums do not affect our results.
We also consider each firm’s stock price performance over the preceding 12-month period to account for the effect of price momentum on valuations. We include equity analysts’ forecasts of earnings-per-share over the next fiscal year in our model, which we statistically adjust in order to isolate the part of such forecasts that cannot be explained by prior performance. This is done by regressing analysts’ forecasts against the other variables in the valuation specification and by only including the residual in the final valuation regression. This effectively amounts to “the story beyond the numbers.” For net income margin, asset turnover, leverage, consensus and momentum, we allow the coefficients to vary across industries. We discuss our findings from this work next.
The findings: persistence matters The most striking result of our analysis is that improvements in leverage have a much larger effect on company valuation than do increases in net income margin or asset turnover, as Exhibit 1 shows.
25 April 2019 8
Goldman Sachs Global Markets Institute

Since, all else equal, a 10% increase in a firm’s net income margin raises its ROE by exactly the same amount as a 10% increase in its asset turnover or leverage factor, why do investors price these drivers differently?
The correlation between what a firm’s net income margin was last year and what it is in the current quarter is 0.68. But the correlations between a firm’s past and current asset turnover and leverage ratios are each above 0.90, though the correlation is the highest for the leverage ratio. These analyses suggest that the more stable the driver of a firm’s improved results is, the more the market is willing to pay.
A further demonstration of the market’s willingness to pay for persistence is shown in Exhibit 2, which graphs the coefficients of the ROE drivers against the persistence of those drivers. The exhibit shows that the market is willing to pay more for incremental improvements in drivers that are likely to prove more persistent, both across drivers and within industries by driver.
Exhibit 1: Across industries, the market tends to pay the most for incremental improvements in leverage Estimated effect of a 1% change in net income margin, asset turnover or the leverage ratio on company valuation across industries, 1980-2018
0.2
0.4
0.5
0.0
0.1
0.2
0.3
0.4
0.5
0.6
0.7
0.8
Net income margin Asset turnover Leverage ratio
Acr
oss
indu
stri
es -
aver
age
% c
hang
e in
com
pany
va
luat
ion
with
a 1
% in
crea
se in
RO
E fa
ctor
All fundamental variables are four quarter moving averages to smooth out seasonality. *N=281,602, R2=0.84, 6,484 company fixed effects and 1,500 industry-time fixed effects included; 0.5 means a 1% increase raises P/B by 0.5%. All coefficients are statistically significant at the 0.1% level.
Source: Compustat, IBES, FactSet, Goldman Sachs Global Investment Research
25 April 2019 9
Goldman Sachs Global Markets Institute
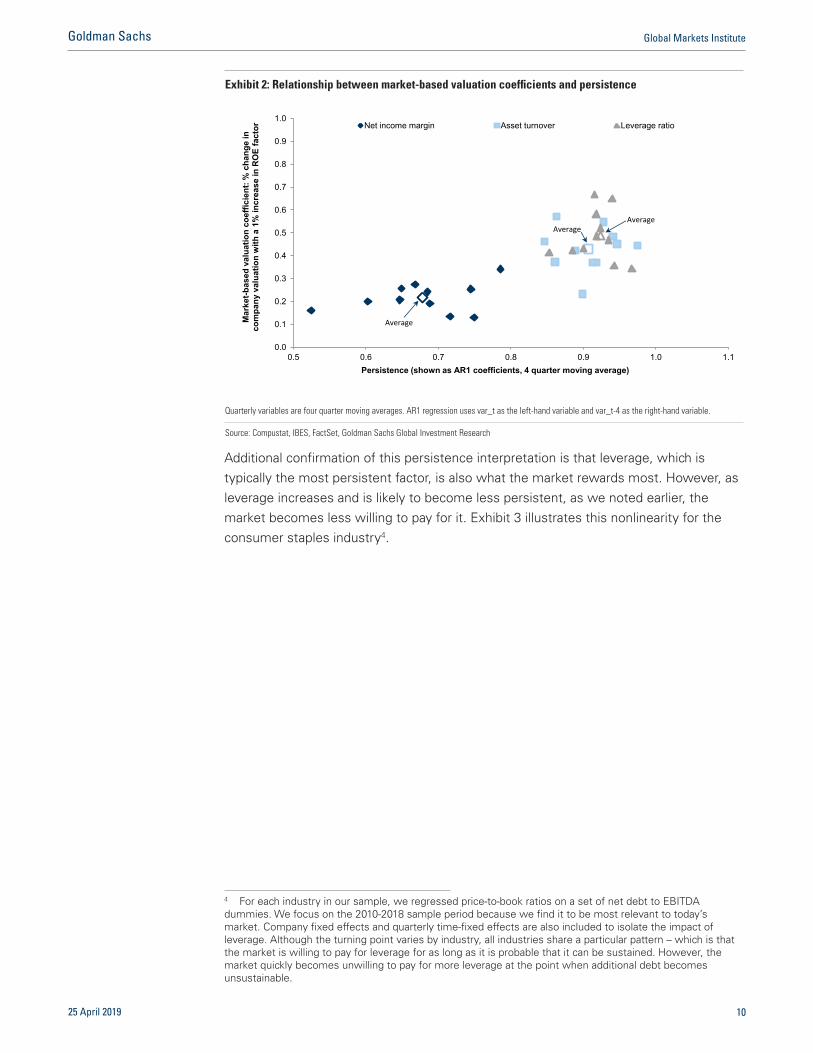
Additional confirmation of this persistence interpretation is that leverage, which is typically the most persistent factor, is also what the market rewards most. However, as leverage increases and is likely to become less persistent, as we noted earlier, the market becomes less willing to pay for it. Exhibit 3 illustrates this nonlinearity for the consumer staples industry4.
4 For each industry in our sample, we regressed price-to-book ratios on a set of net debt to EBITDA dummies. We focus on the 2010-2018 sample period because we find it to be most relevant to today’s market. Company fixed effects and quarterly time-fixed effects are also included to isolate the impact of leverage. Although the turning point varies by industry, all industries share a particular pattern – which is that the market is willing to pay for leverage for as long as it is probable that it can be sustained. However, the market quickly becomes unwilling to pay for more leverage at the point when additional debt becomes unsustainable.
Exhibit 2: Relationship between market-based valuation coefficients and persistence
0.0
0.1
0.2
0.3
0.4
0.5
0.6
0.7
0.8
0.9
1.0
0.5 0.6 0.7 0.8 0.9 1.0 1.1
Mar
ket-
base
d va
luat
ion
coef
ficie
nt: %
cha
nge
in
com
pany
val
uatio
n w
ith a
1%
incr
ease
in R
OE
fact
or
Persistence (shown as AR1 coefficients, 4 quarter moving average)
Net income margin Asset turnover Leverage ratio
Average
Average Average
Quarterly variables are four quarter moving averages. AR1 regression uses var_t as the left-hand variable and var_t-4 as the right-hand variable.
Source: Compustat, IBES, FactSet, Goldman Sachs Global Investment Research
25 April 2019 10
Goldman Sachs Global Markets Institute
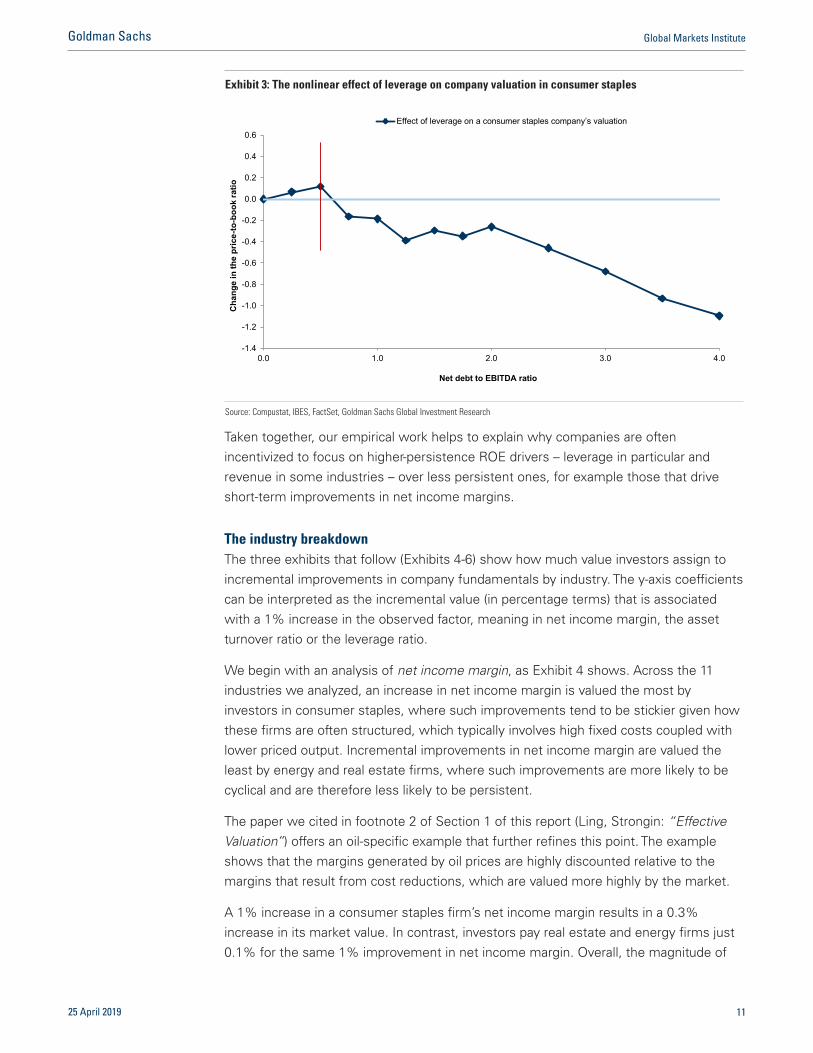
Taken together, our empirical work helps to explain why companies are often incentivized to focus on higher-persistence ROE drivers – leverage in particular and revenue in some industries – over less persistent ones, for example those that drive short-term improvements in net income margins.
The industry breakdown The three exhibits that follow (Exhibits 4-6) show how much value investors assign to incremental improvements in company fundamentals by industry. The y-axis coefficients can be interpreted as the incremental value (in percentage terms) that is associated with a 1% increase in the observed factor, meaning in net income margin, the asset turnover ratio or the leverage ratio.
We begin with an analysis of net income margin, as Exhibit 4 shows. Across the 11 industries we analyzed, an increase in net income margin is valued the most by investors in consumer staples, where such improvements tend to be stickier given how these firms are often structured, which typically involves high fixed costs coupled with lower priced output. Incremental improvements in net income margin are valued the least by energy and real estate firms, where such improvements are more likely to be cyclical and are therefore less likely to be persistent.
The paper we cited in footnote 2 of Section 1 of this report (Ling, Strongin: “Effective Valuation”) offers an oil-specific example that further refines this point. The example shows that the margins generated by oil prices are highly discounted relative to the margins that result from cost reductions, which are valued more highly by the market.
A 1% increase in a consumer staples firm’s net income margin results in a 0.3% increase in its market value. In contrast, investors pay real estate and energy firms just 0.1% for the same 1% improvement in net income margin. Overall, the magnitude of
Exhibit 3: The nonlinear effect of leverage on company valuation in consumer staples
-1.4
-1.2
-1.0
-0.8
-0.6
-0.4
-0.2
0.0
0.2
0.4
0.6
0.0 1.0 2.0 3.0 4.0
Cha
nge
in th
e pr
ice-
to-b
ook
ratio
Net debt to EBITDA ratio
Effect of leverage on a consumer staples company’s valuation
Source: Compustat, IBES, FactSet, Goldman Sachs Global Investment Research
25 April 2019 11
Goldman Sachs Global Markets Institute
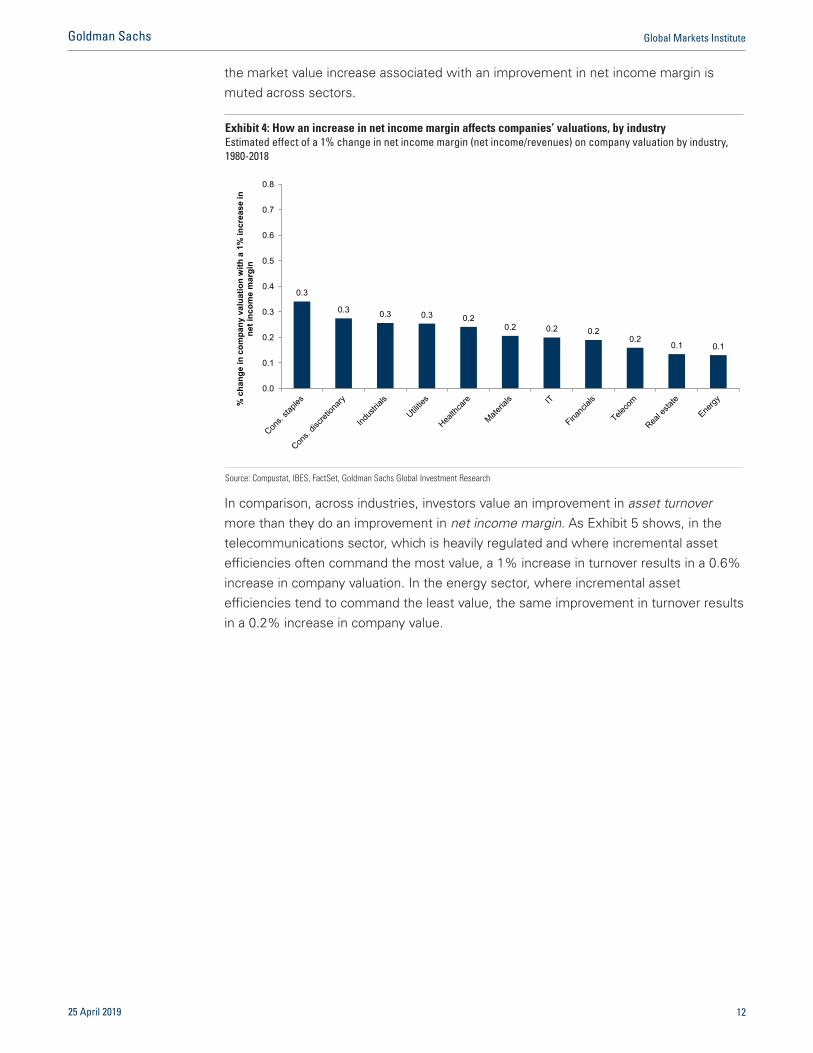
the market value increase associated with an improvement in net income margin is muted across sectors.
In comparison, across industries, investors value an improvement in asset turnover more than they do an improvement in net income margin. As Exhibit 5 shows, in the telecommunications sector, which is heavily regulated and where incremental asset efficiencies often command the most value, a 1% increase in turnover results in a 0.6% increase in company valuation. In the energy sector, where incremental asset efficiencies tend to command the least value, the same improvement in turnover results in a 0.2% increase in company value.
Exhibit 4: How an increase in net income margin affects companies’ valuations, by industry Estimated effect of a 1% change in net income margin (net income/revenues) on company valuation by industry, 1980-2018
0.3
0.3 0.3 0.3 0.2 0.2 0.2 0.2
0.2 0.1 0.1
0.0
0.1
0.2
0.3
0.4
0.5
0.6
0.7
0.8
% c
hang
e in
com
pany
val
uatio
n w
ith a
1%
incr
ease
in
net i
ncom
e m
argi
n
Source: Compustat, IBES, FactSet, Goldman Sachs Global Investment Research
25 April 2019 12
Goldman Sachs Global Markets Institute

Next, while the extent to which investors value an increase in leverage varies by industry, the data show that improvements in leverage are valued more highly across industries than are improvements in either net income margin or asset turnover. As Exhibit 6 shows, investors value leverage most in the telecommunications sector, where a 1% increase in the leverage ratio results in a 0.7% increase in the value of a company. Compare this to the financials sector, where the same increase in the leverage ratio results in a 0.3% increase in company value.
Exhibit 5: How an increase in asset turnover affects companies’ valuations, by industry Estimated effect of a 1% change in asset turnover (revenues/assets) on company valuation by industry, 1980-2018
0.6 0.5
0.5 0.5 0.5 0.4
0.4 0.4 0.4 0.4
0.2
0.0
0.1
0.2
0.3
0.4
0.5
0.6
0.7
0.8
% c
hang
e in
com
pany
val
uatio
n w
ith a
1%
incr
ease
in
asse
t tur
nove
r
Source: Compustat, IBES, FactSet, Goldman Sachs Global Investment Research
Exhibit 6: How an increase in the leverage ratio affects companies’ valuations, by industry Estimated effect of a 1% change in the leverage ratio (assets/shareholder equity) on company valuation by industry, 1980-2018
0.7 0.7
0.6
0.5 0.5 0.5
0.4 0.4 0.4
0.4 0.3
0.0
0.1
0.2
0.3
0.4
0.5
0.6
0.7
0.8
% c
hang
e in
com
pany
val
uatio
n w
ith a
1%
incr
ease
in th
e le
vera
ge ra
tio
Source: Compustat, IBES, FactSet, Goldman Sachs Global Investment Research
25 April 2019 13
Goldman Sachs Global Markets Institute
The prior three exhibits show that investors value firms’ fundamentals differently depending on the industry5 and that those differences strongly correlate to the degree of persistence of those fundamentals in each industry.
As we noted earlier, by and large the way the market prices company fundamentals corresponds closely to the logic (if not the form) of standard academic theory. The market anticipates forward results but ascribes more value to the factors it can best anticipate. In many ways, this logic is a better version of standard discounted cash flow (DCF) methods, which are unable to neatly unpack and adjust for higher and lower reliability factors within the forward forecasts.
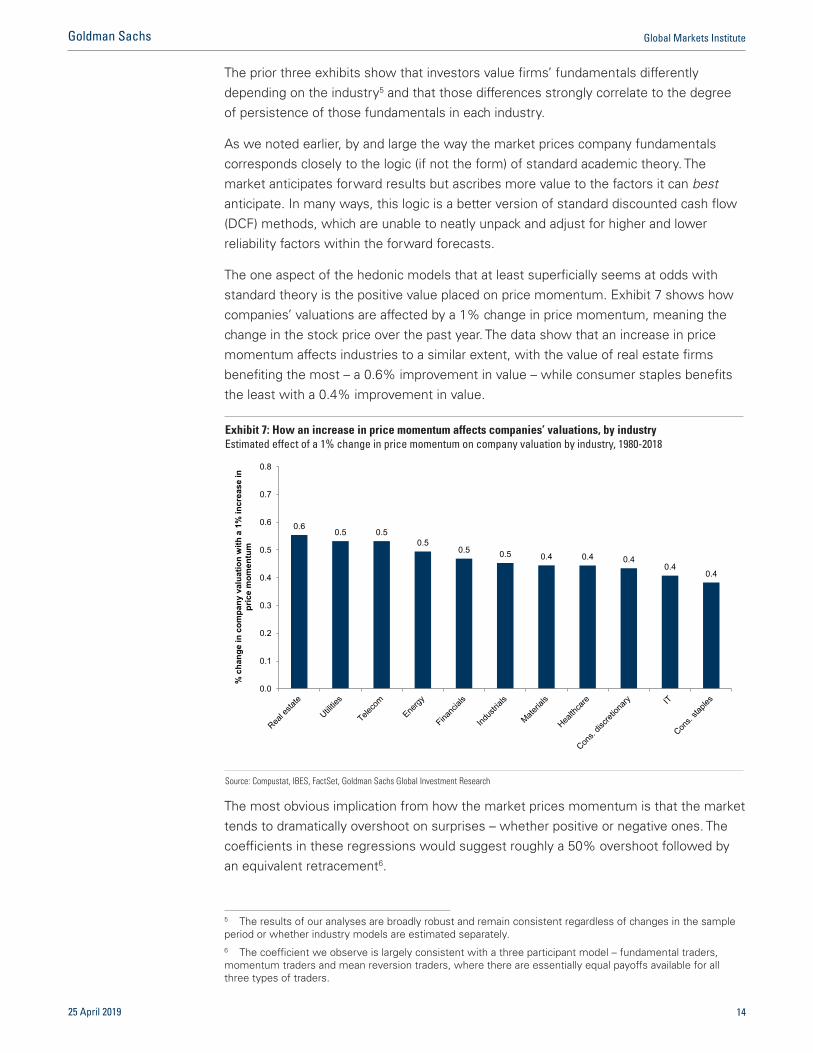
The one aspect of the hedonic models that at least superficially seems at odds with standard theory is the positive value placed on price momentum. Exhibit 7 shows how companies’ valuations are affected by a 1% change in price momentum, meaning the change in the stock price over the past year. The data show that an increase in price momentum affects industries to a similar extent, with the value of real estate firms benefiting the most – a 0.6% improvement in value – while consumer staples benefits the least with a 0.4% improvement in value.
The most obvious implication from how the market prices momentum is that the market tends to dramatically overshoot on surprises – whether positive or negative ones. The coefficients in these regressions would suggest roughly a 50% overshoot followed by an equivalent retracement6.
5 The results of our analyses are broadly robust and remain consistent regardless of changes in the sample period or whether industry models are estimated separately. 6 The coefficient we observe is largely consistent with a three participant model – fundamental traders, momentum traders and mean reversion traders, where there are essentially equal payoffs available for all three types of traders.
Exhibit 7: How an increase in price momentum affects companies’ valuations, by industry Estimated effect of a 1% change in price momentum on company valuation by industry, 1980-2018
0.6 0.5 0.5
0.5 0.5 0.5 0.4 0.4 0.4
0.4 0.4
0.0
0.1
0.2
0.3
0.4
0.5
0.6
0.7
0.8
% c
hang
e in
com
pany
val
uatio
n w
ith a
1%
incr
ease
in
pric
e m
omen
tum
Source: Compustat, IBES, FactSet, Goldman Sachs Global Investment Research
25 April 2019 14
Goldman Sachs Global Markets Institute

It is beyond the scope of this paper to speculate as to why price momentum seems to be such a significant and consistent aspect of securities pricing. Rather, we are interested in the implications for how companies’ stock prices respond to performance metrics and the incentives such price actions create for managements.
These extreme price movements are part of the reason why managements tend to think of the market as being short-term oriented, as the potential for the market to overshoot creates significant pressure to avoid a quarterly miss. The more subtle incentives are for companies to prefer smoother, albeit lower, sales and profits to maintain fundamental momentum. This can take many forms, from smoothing sales prices to more fundamental shifts in product types or customer-acquisition strategies, to the search for recurring revenues and the willingness to discount to smooth results. Such actions hold the potential to reduce longer-term performance to avoid short-term volatility. It is ironic – and somewhat counterintuitive – but the strongest incentives the market provides for short-termism are not to artificially boost short-term performance, but to dampen it instead.
This is clearly not the optimal outcome and it relates directly to corporate communications, namely the need to delineate core from non-core activities as accurately as possible, and to separate trends from noise, particularly as companies grow. Many terms have developed over time to address this issue: recurring vs. non-recurring, core vs. non-core, one-time vs. ongoing, as just a few examples. The challenge inherent to using these terms is that non-recurring items can become recurring over time. When too much judgment is used in reporting corporate results, the analysts who have to assess those results will find this more challenging to do.
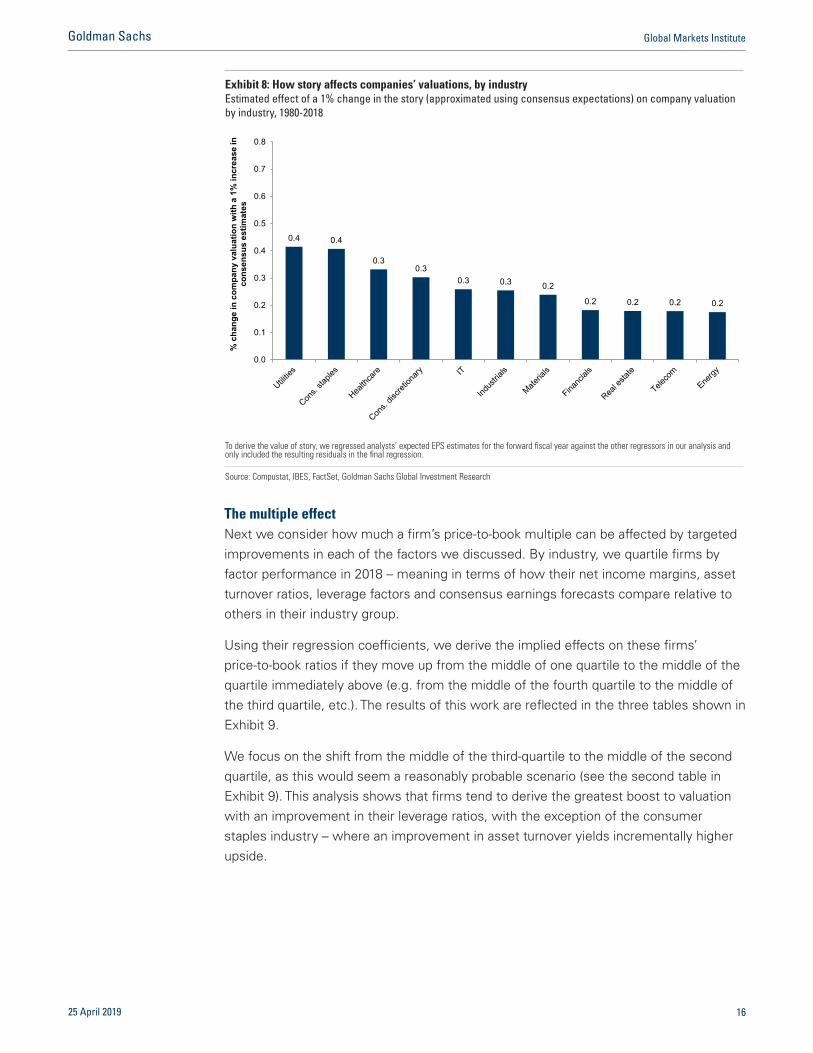
Companies are usually best served by being transparent, but they often want to control the narratives that can affect their share prices. However, this usually requires a higher level of assurance and forecastability than the more complicated parts of the company’s story tend to have.
To that end, Exhibit 8 shows how firms’ valuations are affected by “story.” Specifically, we show how a 1% change in consensus expectations affects sectoral valuations. We observe strong ties between the story and the perceived level of persistence in each sector. Energy – where stories are hard to assess (as evidenced by the fact that these companies have historically been subject to high forecast errors) – appears at the low end of the range of outcomes, while consumer staples – which have tended to be easier to forecast (given the more mature nature of many of these businesses) – appears at the high end of outcomes.
25 April 2019 15
Goldman Sachs Global Markets Institute
The multiple effect Next we consider how much a firm’s price-to-book multiple can be affected by targeted improvements in each of the factors we discussed. By industry, we quartile firms by factor performance in 2018 – meaning in terms of how their net income margins, asset turnover ratios, leverage factors and consensus earnings forecasts compare relative to others in their industry group.
Using their regression coefficients, we derive the implied effects on these firms’ price-to-book ratios if they move up from the middle of one quartile to the middle of the quartile immediately above (e.g. from the middle of the fourth quartile to the middle of the third quartile, etc.). The results of this work are reflected in the three tables shown in Exhibit 9.
We focus on the shift from the middle of the third-quartile to the middle of the second quartile, as this would seem a reasonably probable scenario (see the second table in Exhibit 9). This analysis shows that firms tend to derive the greatest boost to valuation with an improvement in their leverage ratios, with the exception of the consumer staples industry – where an improvement in asset turnover yields incrementally higher upside.
Exhibit 8: How story affects companies’ valuations, by industry Estimated effect of a 1% change in the story (approximated using consensus expectations) on company valuation by industry, 1980-2018
0.4 0.4
0.3 0.3
0.3 0.3 0.2
0.2 0.2 0.2 0.2
0.0
0.1
0.2
0.3
0.4
0.5
0.6
0.7
0.8
% c
hang
e in
com
pany
val
uatio
n w
ith a
1%
incr
ease
in
cons
ensu
s es
timat
es
To derive the value of story, we regressed analysts’ expected EPS estimates for the forward fiscal year against the other regressors in our analysis and only included the resulting residuals in the final regression.
Source: Compustat, IBES, FactSet, Goldman Sachs Global Investment Research
25 April 2019 16
Goldman Sachs Global Markets Institute
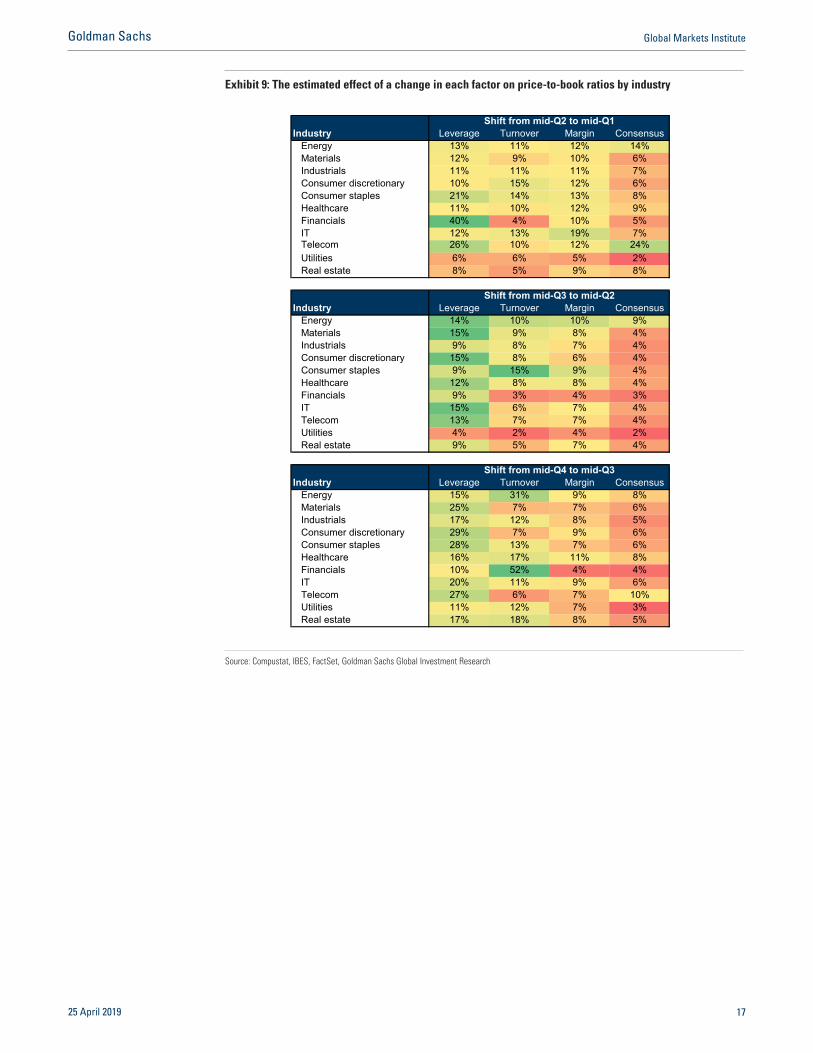
Exhibit 9: The estimated effect of a change in each factor on price-to-book ratios by industry
Shift from mid-Q2 to mid-Q1Industry Leverage Turnover Margin Consensus
Energy 13% 11% 12% 14%Materials 12% 9% 10% 6%Industrials 11% 11% 11% 7%Consumer discretionary 10% 15% 12% 6%Consumer staples 21% 14% 13% 8%Healthcare 11% 10% 12% 9%Financials 40% 4% 10% 5%IT 12% 13% 19% 7%Telecom 26% 10% 12% 24%Utilities 6% 6% 5% 2%Real estate 8% 5% 9% 8%
Shift from mid-Q3 to mid-Q2Industry Leverage Turnover Margin Consensus
Energy 14% 10% 10% 9%Materials 15% 9% 8% 4%Industrials 9% 8% 7% 4%Consumer discretionary 15% 8% 6% 4%Consumer staples 9% 15% 9% 4%Healthcare 12% 8% 8% 4%Financials 9% 3% 4% 3%IT 15% 6% 7% 4%Telecom 13% 7% 7% 4%Utilities 4% 2% 4% 2%Real estate 9% 5% 7% 4%
Shift from mid-Q4 to mid-Q3Industry Leverage Turnover Margin Consensus
Energy 15% 31% 9% 8%Materials 25% 7% 7% 6%Industrials 17% 12% 8% 5%Consumer discretionary 29% 7% 9% 6%Consumer staples 28% 13% 7% 6%Healthcare 16% 17% 11% 8%Financials 10% 52% 4% 4%IT 20% 11% 9% 6%Telecom 27% 6% 7% 10%Utilities 11% 12% 7% 3%Real estate 17% 18% 8% 5%
Source: Compustat, IBES, FactSet, Goldman Sachs Global Investment Research
25 April 2019 17
Goldman Sachs Global Markets Institute
Section II: Deep Pocket Risk
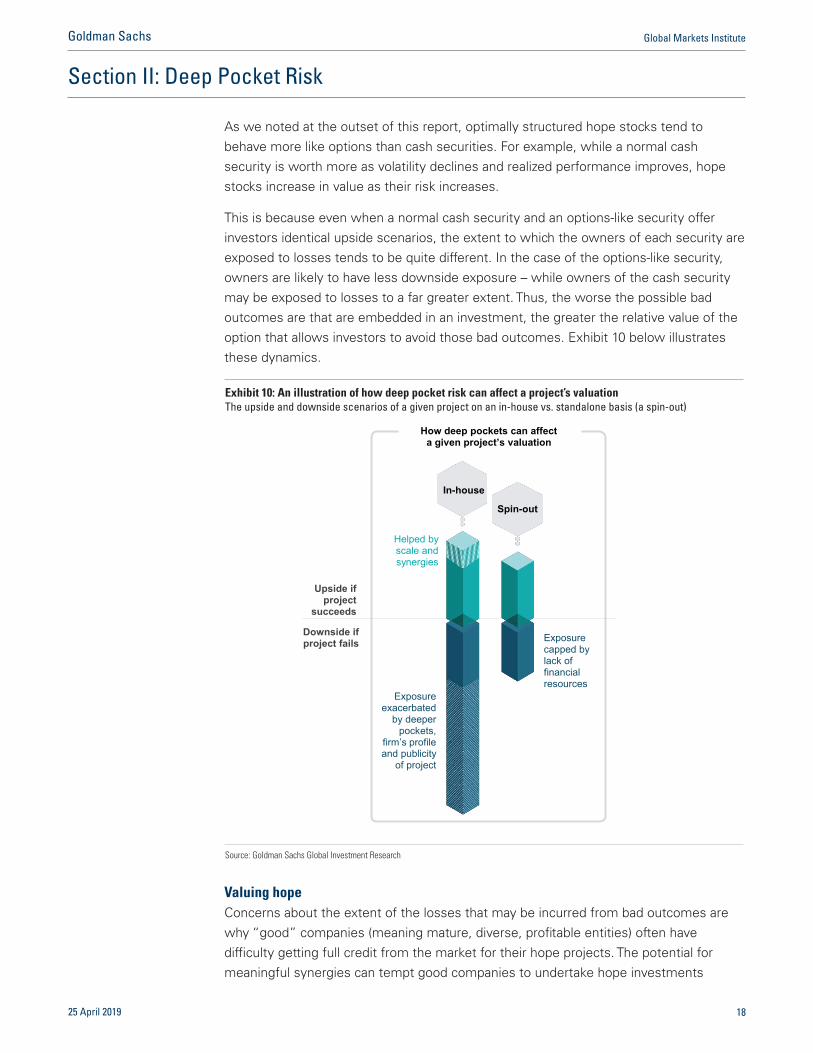
As we noted at the outset of this report, optimally structured hope stocks tend to behave more like options than cash securities. For example, while a normal cash security is worth more as volatility declines and realized performance improves, hope stocks increase in value as their risk increases.
This is because even when a normal cash security and an options-like security offer investors identical upside scenarios, the extent to which the owners of each security are exposed to losses tends to be quite different. In the case of the options-like security, owners are likely to have less downside exposure – while owners of the cash security may be exposed to losses to a far greater extent. Thus, the worse the possible bad outcomes are that are embedded in an investment, the greater the relative value of the option that allows investors to avoid those bad outcomes. Exhibit 10 below illustrates these dynamics.
Valuing hope Concerns about the extent of the losses that may be incurred from bad outcomes are why “good” companies (meaning mature, diverse, profitable entities) often have difficulty getting full credit from the market for their hope projects. The potential for meaningful synergies can tempt good companies to undertake hope investments
Exhibit 10: An illustration of how deep pocket risk can affect a project’s valuation The upside and downside scenarios of a given project on an in-house vs. standalone basis (a spin-out)
In-house
Spin-out
Exposure exacerbated
by deeper pockets,
firm’s profile and publicity
of project
Exposure capped by lack of financial resources
Helped by scale and synergies
Upside if project
succeeds
Downside if project fails
How deep pockets can affect a given project’s valuation
Source: Goldman Sachs Global Investment Research
25 April 2019 18
Goldman Sachs Global Markets Institute
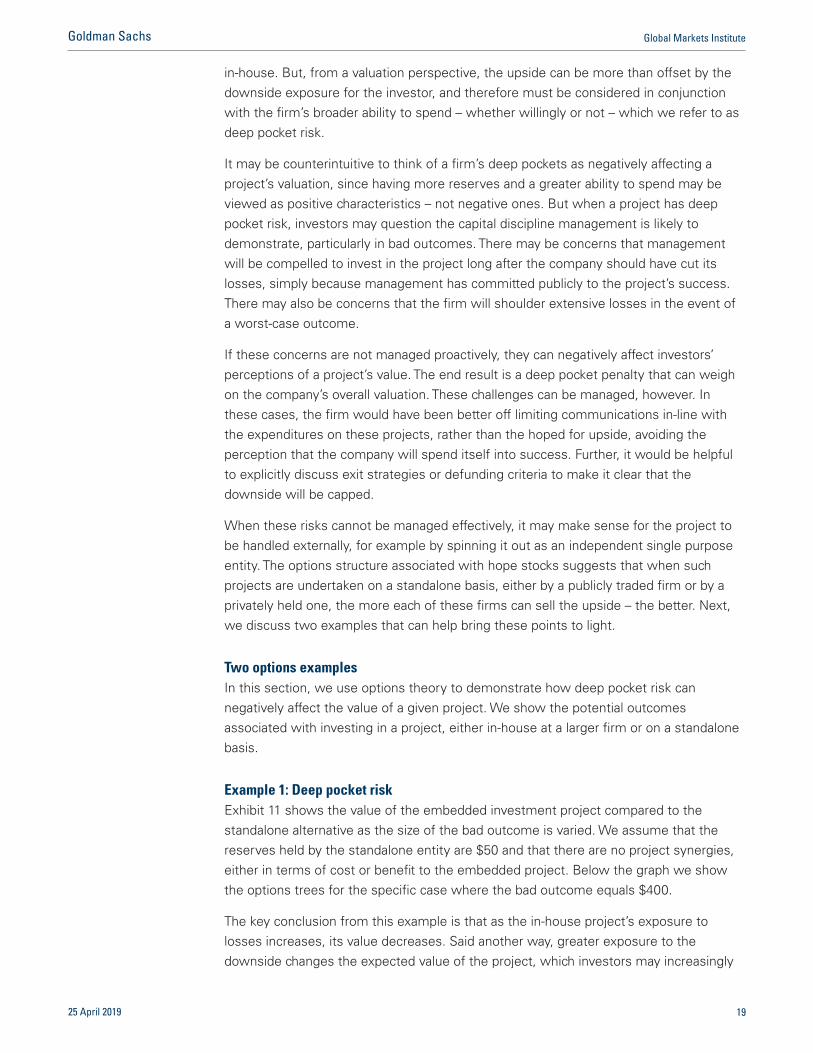
in-house. But, from a valuation perspective, the upside can be more than offset by the downside exposure for the investor, and therefore must be considered in conjunction with the firm’s broader ability to spend – whether willingly or not – which we refer to as deep pocket risk.
It may be counterintuitive to think of a firm’s deep pockets as negatively affecting a project’s valuation, since having more reserves and a greater ability to spend may be viewed as positive characteristics – not negative ones. But when a project has deep pocket risk, investors may question the capital discipline management is likely to demonstrate, particularly in bad outcomes. There may be concerns that management will be compelled to invest in the project long after the company should have cut its losses, simply because management has committed publicly to the project’s success. There may also be concerns that the firm will shoulder extensive losses in the event of a worst-case outcome.
If these concerns are not managed proactively, they can negatively affect investors’ perceptions of a project’s value. The end result is a deep pocket penalty that can weigh on the company’s overall valuation. These challenges can be managed, however. In these cases, the firm would have been better off limiting communications in-line with the expenditures on these projects, rather than the hoped for upside, avoiding the perception that the company will spend itself into success. Further, it would be helpful to explicitly discuss exit strategies or defunding criteria to make it clear that the downside will be capped.
When these risks cannot be managed effectively, it may make sense for the project to be handled externally, for example by spinning it out as an independent single purpose entity. The options structure associated with hope stocks suggests that when such projects are undertaken on a standalone basis, either by a publicly traded firm or by a privately held one, the more each of these firms can sell the upside – the better. Next, we discuss two examples that can help bring these points to light.
Two options examples In this section, we use options theory to demonstrate how deep pocket risk can negatively affect the value of a given project. We show the potential outcomes associated with investing in a project, either in-house at a larger firm or on a standalone basis.
Example 1: Deep pocket risk Exhibit 11 shows the value of the embedded investment project compared to the standalone alternative as the size of the bad outcome is varied. We assume that the reserves held by the standalone entity are $50 and that there are no project synergies, either in terms of cost or benefit to the embedded project. Below the graph we show the options trees for the specific case where the bad outcome equals $400.
The key conclusion from this example is that as the in-house project’s exposure to losses increases, its value decreases. Said another way, greater exposure to the downside changes the expected value of the project, which investors may increasingly
25 April 2019 19
Goldman Sachs Global Markets Institute

perceive to be the case if, for example, management states an inflexible commitment to the project’s long-term success (the equivalent of gradually moving down the “in-house project” line in the chart). In practice, this is why limiting the in-house project’s exposure may be possible by effectively communicating a commitment to capital discipline.
25 April 2019 20
Goldman Sachs Global Markets Institute
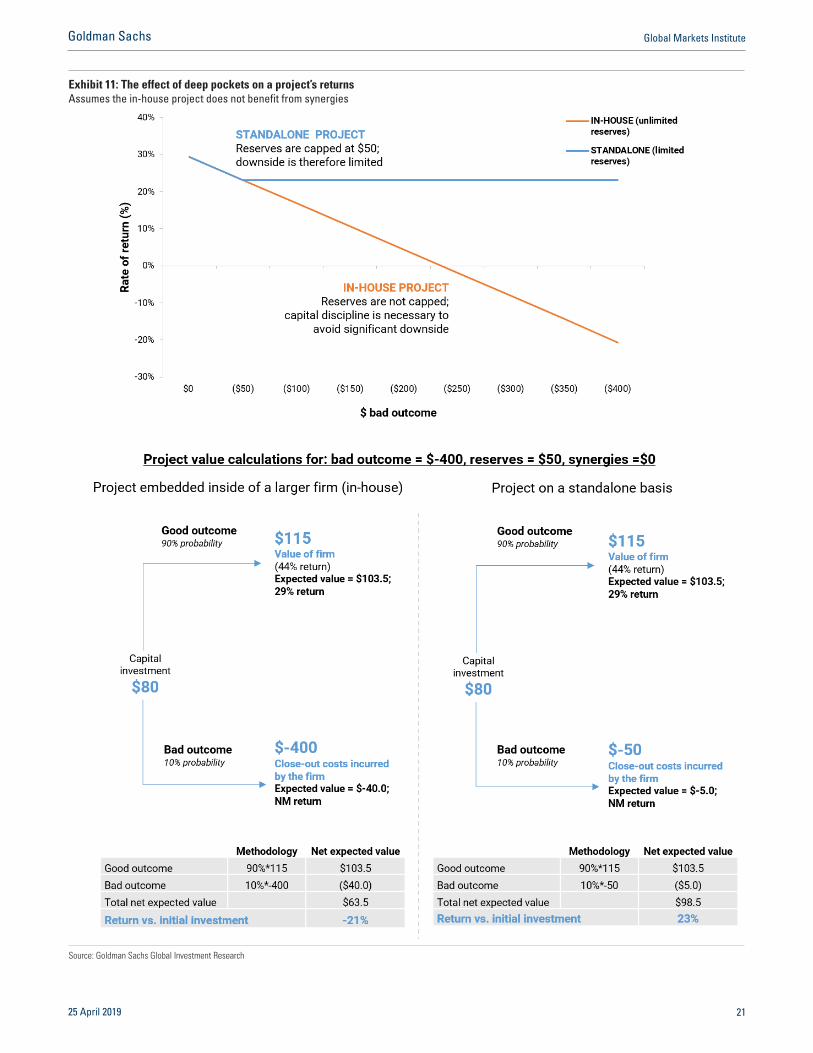
Exhibit 11: The effect of deep pockets on a project’s returns Assumes the in-house project does not benefit from synergies
Source: Goldman Sachs Global Investment Research
25 April 2019 21
Goldman Sachs Global Markets Institute

Example 2: Spinning out In Exhibit 12 we include $5 of synergies in costs. In practice, synergies could also increase the value of the good outcome (this can be accommodated simply by adding a synergy value to the good outcome for the embedded project calculations). Here we can see that the value of the embedded project increases with synergies. We keep all other values the same as in the prior example.
Whether the project should be handled in-house or on a standalone basis is dependent on the extent to which the synergies are offset by deep pocket risk. Said another way, if the in-house project can be managed so that the downside exposure is limited and the synergies are preserved, it may make sense for the project to be run in-house. In this example, the point of indifference between keeping the project in-house and spinning it out occurs where the payoff curves cross. As Exhibit 12 shows, if the bad outcome is less than $108, then maintaining the project in-house will result in a higher return. However, if the bad outcome is greater than $108, then the return will be higher for the project if it is addressed on a standalone basis instead. Of course, the exact figures are highly dependent on a series of assumptions, and changing the level of in-house synergies or the reserves held by the standalone firm would meaningfully affect the outcomes.
These analyses also help explain why multiple funding rounds are the norm for fast-growing private firms. Such privately-held firms reflect the hope-driven options structure we have described: since their ability to spend is inherently limited, reducing investors’ downside exposures, these firms are able to optimize their expected returns and achieve higher valuations on a standalone basis than they would as part of an entity with deep pockets.
In many cases, even after careful communication, the market’s assessment of a project’s deep pocket risk may be greater than management’s own assessment. When this issue arises, managements need to assess the degree to which the remaining valuation penalties are sufficient to force the spin out or whether it makes more sense to persist in-house and simply to demonstrate – by performance – that the project is accretive to the firm.
25 April 2019 22
Goldman Sachs Global Markets Institute

Exhibit 12: The extent of the downside risk dictates whether a project should be addressed in-house or on a standalone basis Assumes the in-house project benefits from synergies
Source: Goldman Sachs Global Investment Research
25 April 2019 23
Goldman Sachs Global Markets Institute

A final note on optimizing segment reporting In our analysis, we find that equity investors pay more for companies that offer persistent and predictable outcomes than for those that don’t. For companies of all types, organizing corporate reporting in ways that enhances persistence and predictability – whether in terms of risk exposures or execution – and thus investors’ ability to forecast results, can have positive effects on valuations.
For complex firms with multiple business lines, the question then becomes: for reporting purposes, how can business lines be combined to maximize the firm’s overall valuation? One strategy might seem to be to try to shift revenues and profits out of business lines with lower multiples into ones with higher multiples. But over the long-run – and often in the short-run as well – this logic usually fails. Since higher multiples typically reflect better forecastability, mixing in less forecast-able lines of business will likely be dilutive.
As an alternative that improves forecastability, we suggest the following three-part reporting strategy:
Aggregate businesses with similar drivers to create segments that are easy to 1.forecast using simple models;
Separate reporting for business lines that tend to be lumpy (and thus harder to 2.forecast) from business lines that tend to be predictable, so that the lumpy segments don’t hurt investors’ overall ability to forecast firm results;
Break out new businesses to give the market better insights into the related 3.spending and associated potential returns, and to eliminate the need for investors to have to guess at these businesses’ results near-term.
Following this three-pronged approach can help complex firms reduce any deep pocket penalties they might otherwise experience, and improve investors’ visibility into both new and existing businesses. In Appendix 2, we use simple examples to show how separating business units with differing drivers for reporting purposes can improve forecastability by roughly one-third. This is meant to be purely illustrative, as such calculations will be highly sensitive to the statistical realities of a particular company, its potential business segments and their business drivers. Nevertheless, the magnitude of the improvement in forecastability in these simple examples clearly shows that firms that put care into making their segment reporting easier to forecast could reap significant rewards in terms of their market valuations.
25 April 2019 24
Goldman Sachs Global Markets Institute

Appendix I: More Detail on the Numbers
As we noted in Section 1 of this report, the basis of our hedonic model analysis is an unbalanced panel of Russell 1000 and Russell 2000 companies from 1980 through 2018. Our focus is on firms that tend to be profitable, and our dataset therefore includes roughly 6500 companies across industries. For additional context, we show median statistics by factor of the firms in our analysis in Exhibit 13 below.
What’s more, Exhibit 14 below shows how much of the variation in firms’ price-to-book ratios can be explained by each of the factors we built into the model by considering the partial R2 of each. Crucially, company and industry-time fixed effects explain 61% of the variation in firms’ valuation, while the combination of size, momentum and consensus estimates is an incremental 15%. Net income margin, asset turnover and leverage, collectively, are roughly 8% of the total R2 of 84%.
Exhibit 13: Median statistics
Industry P/B ROE Margin Turnover Leverage Consensus Momentum Tax rate Borrow cost Debt/EBITDA
Energy 2.0 12% 9% 15% 2.1 14% 13% 34% 7% 1.2Materials 2.0 13% 5% 27% 2.2 15% 12% 35% 7% 1.3Industrials 2.1 13% 5% 31% 2.1 16% 12% 37% 7% 0.9Consumer discretionary 2.1 14% 5% 36% 2.0 16% 11% 38% 8% 0.8Consumer staples 2.5 15% 4% 39% 2.2 17% 14% 37% 7% 1.2Healthcare 3.0 14% 8% 23% 1.7 17% 15% 35% 7% 0.0Financials 1.6 12% 13% 2% 9.2 13% 14% 31% 6% 1.3IT 2.6 13% 8% 25% 1.5 15% 10% 33% 7% -0.8Telecom 2.4 13% 9% 14% 2.4 14% 13% 38% 7% 1.5Utilities 1.4 11% 9% 10% 3.0 12% 15% 35% 8% 3.0Real estate 1.9 7% 15% 4% 2.2 7% 13% 0% 6% 2.6
Fundamental measures are 4-quarter moving averages. Observations with negative margins are dropped. Debt/EBITDA refers to net debt to EBITDA ratio.
Source: Compustat, IBES, FactSet, Goldman Sachs Global Investment Research
Exhibit 14: Partial R2 of different control variables in the model
Control Variables Partial R2
Company fixed effects 50%Industry-time fixed effects 11%Size quartile-time fixed effects 7%Momentum 7%Consensus estimates 1%Net income margin 3%Asset turnover ratio 2%Leverage factor 2%
Total 84%
Source: Compustat, IBES, FactSet, Goldman Sachs Global Investment Research
25 April 2019 25
Goldman Sachs Global Markets Institute

Appendix II: Segment Reporting - Two Examples
We compare two firms that sell identical offerings: gizmos (which have stable sales and generate persistent results) and widgets (which have volatile sales and therefore generate transient results). The only difference between these two firms is how they report their financial results to investors. The first firm (Firm A) reports sales of gizmos separately from sales of widgets, while the second firm (Firm B) reports sales of gizmos and widgets together as one business line.
The analysis:
We assume x is the total earnings of a firm (either Firm A or Firm B), where x=x1+x2
We simulate two business units: unit 1 is gizmos = x1, and unit 2 is widgets = x2
Gizmos = AR1 (rho1=0.8, sigma1=1) n
Widgets = AR1 (rho2=0.1, sigma2=1) n
Firm A reports the results from its two business units separately: we forecast earnings by regressing x on x1_1 and x2_1
Firm B reports the results from its two business units together: we forecast earnings by regressing x on x_1
The results:
Firm A, which reports gizmos and widgets separately: b1 = 0.75, b2 = 0.12, R2=0.39 n
Firm B, which reports gizmos and widgets together in one segment: b = 0.56, n
R2=0.31
By comparing these firms’ R2 statistics, we are able to quantify the cost of the information that is lost due to sub-optimal reporting. The fact that Firm B has a lower R2 is suggestive of sub-optimal reporting, with the shortfall due to the fact that the differentiated signals between gizmos (x1) and widgets (x2) are lost when these businesses are reported together. It is worth noting that in another version of this analysis, the differential in R2 is negligible if both business units have the same degree of persistence.
Next, we consider the same two firms, but we now assume that their two business units – gizmos and widgets – have a mix of macro exposures (so neither business unit is entirely persistent or entirely transient). We assume that part of the gizmo and widget businesses is persistent due to their macro exposure (f1), while the remainder of both businesses is transient due to their exposure to a different macro factor (f2).
For reporting purposes, Firm A aggregates its business units by macro exposure; it combines the persistent portions of its gizmo and widgets businesses as one reporting segment, and it combines the transient portions of both businesses as another reporting segment. In comparison, Firm B reports gizmos as one segment and widgets
25 April 2019 26
Goldman Sachs Global Markets Institute

as another segment, despite the fact that these businesses have a mix of macro exposures.
The analysis:
We assume f1 and f2 are factors or macro exposures:
f1 = AR1 (rho1=0.8, sigma1=1) n
f2 = AR1 (rho2=0.1, sigma2=1) n
We assume business units y1 and z1 are exposed only to f1:
y1 = f1 + noise n
z1 = f1 + noise n
We assume business units y2 and z2 are exposed only to f2:
y2 = f2 + noise n
z2 = f2 + noise n
Firm A organizes and reports its business segments by their factor exposure:
Segment1 = y1 + z1 n
Segment2 = y2 + z2 n
Firm B organizes and reports its business segments by their business unit letter:
Segment1 = y1 + y2 n
Segment1 = z1 + z2 n
The results:
Firm A: b1 = 0.69, b2 =-0.02, R2=0.32 n
Firm B: b1 = 0.52, b2 = 0.41, R2=0.21 n
As with the first example, the difference in these firms’ R2 statistics – and the fact that Firm B has a lower R2 – is a measure of the information that is lost when the differentiated signals in the underlying business units are lost due to sub-optimal aggregation into reporting segments.
25 April 2019 27
Goldman Sachs Global Markets Institute

Disclosure Appendix
Disclosures This report has been prepared by the Global Markets Institute, the research think tank within the Global Investment Research Division of The Goldman Sachs Group, Inc. (“Goldman Sachs”).
Prior to publication, this report may have been discussed with or reviewed by persons outside of the Global Investment Research Division. While this report may discuss implications of legislative, regulatory and economic policy developments for industry sectors and the broader economy, may include strategic corporate advice and may have broad social implications, it does not recommend any individual security or an investment in any individual company and should not be relied upon in making investment decisions with respect to individual companies or securities.
Distributing entities
The Global Investment Research Division of Goldman Sachs produces and distributes research products for clients of Goldman Sachs on a global basis. Analysts based in Goldman Sachs offices around the world produce equity research on industries and companies, and research on macroeconomics, currencies, commodities and portfolio strategy. This research is disseminated in Australia by Goldman Sachs Australia Pty Ltd (ABN 21 006 797 897); in Brazil by Goldman Sachs do Brasil Corretora de Títulos e Valores Mobiliários S.A.; Ombudsman Goldman Sachs Brazil: 0800 727 5764 and / or [email protected]. Available Weekdays (except holidays), from 9am to 6pm. Ouvidoria Goldman Sachs Brasil: 0800 727 5764 e/ou [email protected]. Horário de funcionamento: segunda-feira à sexta-feira (exceto feriados), das 9h às 18h; in Canada by either Goldman Sachs Canada Inc. or Goldman Sachs & Co. LLC; in Hong Kong by Goldman Sachs (Asia) L.L.C.; in India by Goldman Sachs (India) Securities Private Ltd.; in Japan by Goldman Sachs Japan Co., Ltd.; in the Republic of Korea by Goldman Sachs (Asia) L.L.C., Seoul Branch; in New Zealand by Goldman Sachs New Zealand Limited; in Russia by OOO Goldman Sachs; in Singapore by Goldman Sachs (Singapore) Pte. (Company Number: 198602165W); and in the United States of America by Goldman Sachs & Co. LLC. Goldman Sachs International has approved this research in connection with its distribution in the United Kingdom and European Union.
European Union: Goldman Sachs International authorised by the Prudential Regulation Authority and regulated by the Financial Conduct Authority and the Prudential Regulation Authority, has approved this research in connection with its distribution in the European Union and United Kingdom; Goldman Sachs AG and Goldman Sachs International Zweigniederlassung Frankfurt, regulated by the Bundesanstalt für Finanzdienstleistungsaufsicht, may also distribute research in Germany.
Goldman Sachs conducts a global full-service, integrated investment banking, investment management and brokerage business. It has investment banking and other business relationships with governments and companies around the world, and publishes equity, fixed income, commodities and economic research about, and with implications for, those governments and companies that may be inconsistent with the views expressed in this report. In addition, its trading and investment businesses and asset management operations may take positions and make decisions without regard to the views expressed in this report.
© 2019 Goldman Sachs.
No part of this material may be (i) copied, photocopied or duplicated in any form by any means or (ii) redistributed without the prior written consent of The Goldman Sachs Group, Inc.
25 April 2019 28
Goldman Sachs Global Markets Institute