what really matters - fileextreme weather and the bottom line 10 ... events that significantly move...
TRANSCRIPT

Investment Strategy
September 2014
what really matters Quarterly Outlook Q4 2014
What really mattersOur main thrust this quarter is that real businesses matter more than the sum of diffused risks. As always, however, choices must be made. New guidance also has to emerge to adapt and to position portfolios for the current dynamic environment. Our key tactical recommendation remains: use short-term corrections to position in companies aimed at creating wealth.
Staying focused on what really matters is of particular relevance when geopolitical tensions and risk of low growth loom over Europe. The new uncertainty can breed vulnerability, but this must be weighed against the strengths of the US economy and the capacity of international companies to outperform domestic economies. We also believe that fears of a new downturn in Europe are inconsistent with growing optimism about the outlook for the US economy. And, while there is new geopolitical tension, it is occurring in a situation of energy abundance.
Our belief in the capacity of equities to be the engine for generating future returns remains. But a large dose of diversification is also necessary to mitigate old and new risks. This can be done by focusing on the industries of the future within the information technology and health care sectors; and also by considering the beneficiaries of new sources of energy. The variety of investment opportunities across emerging markets is also a rich basis for diversification and a way to invest in the recovery. Moreover, long/short equity hedge funds can mitigate the risk of a market correction.
The ABN AMRO Private Banking Research & Strategy team provide more information behind these recommendations in the pages that follow. Your Relationship Manager or local Investment Advisory Centre (see back cover) stand ready to assist you to prepare for what is ahead in the rest of 2014 and beyond.
Didier Duret
Chief Investment Officer,ABN AMRO Private Banking
September 2014
Quarterly Outlook Q4 2014

ContentWhat really matters 2
Worries that do not add up 3
ECB and Fed head in different directions 4
The staying power of equities 5
Industries matter more than geography 6
Plenty of energy 7
Bonds under the spell of central banks 8
Diversifying with hedge funds 9
Property to improve as recovery unfolds 10
Extreme weather and the bottom line 10
Private equity in flux 11
Stars align for US dollar 12
Forecasts 13
Equities key to allocation 14
Asset allocation 15
Contributors 16
This is an international ABN AMRO publication. Risk profiles and avail-ability of investment products may differ by country. Your local advisor will be able to provide more information.

What really matters Sensitive issues, such as those recently involving Russia and tensions in the Middle East, can feed short-term volatility. But what counts more is real business and how private firms are positioning themselves to become durable and profitable.
Successfully navigating today’s markets requires focus-ing on what really matters. There are many distractions, including deflation concerns in Europe, tensions between the West and Russia, fear of a hard-landing in China and, more recently, concerns that booming equity prices may end in a crash.
We attribute low probabilities that these risks will result in events that significantly move markets. Instead, it makes more sense to focus on what really matters: The US and China economies are stabilising factors in the world economy, energy supply is abundant and central banks remain vigi-lant and supportive of growth. Low leverage in the financial system further limits the chance of a heavy market correction.
With yields of bonds (underweight) at rock bottom, we believe equities (overweight) will continue to be the engine of future returns. Short-term market risks can be avoided through diversification across industries and with exposure to emerging markets and long/short hedge funds that can generate returns independent of market direction.
Key trendsXX The ECB is introducing unprecedented monetary policies
to stimulate a recovery in Europe and prompting mean-ingful structural reforms.
XX Higher US rates will take precedence over easy monetary conditions in Europe. This could accelerate the rally in the US dollar and reverse the outperformance of US equities versus European equities.
XX The right industries matter more than geography. Global
companies in IT, health care and materials can transcend the structural differences among regions.
Key challengesXX The US bond market may be too optimistic in inter-
preting the Fed’s dovish message and overestimate the central bank’s success in keeping longer-term bond yields anchored at low levels.
XX Larger margins and significant cash positions have not translated into investments. Equity buybacks do not create economic value, new investment or jobs.
XX Geopolitical tensions will continue and create bouts of short-term volatility, emphasizing the need for diligent diversification.
Key opportunitiesXX The lagging performance in European equities is an oppor-
tunity for investing in global companies in Europe. XX Geopolitics is accelerating the energy revolution. The US
energy, infrastructure and chemicals industries will benefit more than energy commodities.
XX High-yield and peripheral European bonds are the last remaining areas of value in fixed income.
XX Emerging-markets equities may withstand higher US rates due to low valuations and improved fundamentals.
XX We expect the US dollar to break through the 1.28 barrier versus the euro. The Mexican peso (MXN) and Chinese yuan (CNY) should also perform well versus the euro.
Research & StrategyDidier Duret – Chief Investment Officer
Q4 - 2014
Diversifiers
OpportunitiesEuropean and
EM equitiesIT, health care, US
energy E&P, materialsUSD,
MXN, CNY
Volatilityinsurance
Long/short, event drivenhedge funds
Listed real estate
What really matters
Source: ABN AMRO Private Banking
Quarterly Outlook Q4 2014 32 September 2014
-6
-4
-2
0
2
4
-150
-100
-50
0
50
100
03 04 05 06 07 08 09 10 11 12 13 14
House purchase (lhs)
Overall corporate (lhs)
Consumer credit and other lending (lhs)
GDP in % (rhs)
stronger demand
weaker demand
Worries that do not add up
It has been hard this year to get a clear picture of which way the global economy is heading. Early on, unusual weather patterns affected the economies in North America and in Europe. It was unclear how effective Chinese authori-ties would be in addressing the slowdown in growth. The April tax hike in Japan also distorted the normal economic pattern in that country. On top of this, geopolitical tensions have affected sentiment on financial markets, and it is unclear what impact these tensions will have on the global economy.
More recently, economic data in the eurozone has been weakening and many commentators worry that a new reces-sion may be around the corner. Low inflation could then change into deflation. It is important to note that such fears coincide with growing optimism about the US economy. The US labour market is clearly experiencing a recovery and the housing market continues to strengthen as well. While the global recovery is not very strong compared to previous recoveries, we believe that economic growth will be sustained in the quarters ahead in all key economies.
In our opinion, fears of a new downturn in Europe are inconsistent with growing optimism about the US outlook. Business cycles in the US and Europe are strongly corre-lated. Of course, divergence is not impossible, and it has happened in the past. Divergence, however, has only occurred when there was a very specific factor in one of these two economies that caused the divergence, such as German unification. Another example was in 2011 when the US continued to grow while the euro crisis and related stress in the financial system pushed Europe into a reces-sion. This time, however, we cannot see a particularly good reason why the business cycle in the US and eurozone would diverge for a sustained period.
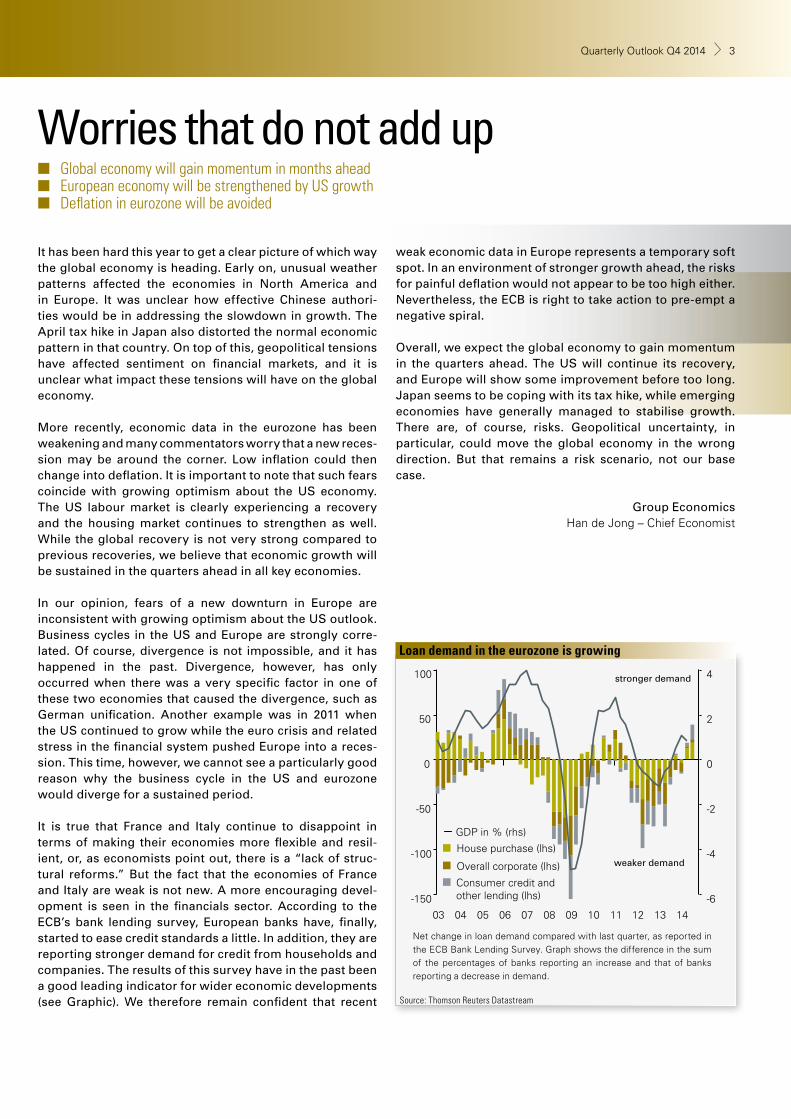
It is true that France and Italy continue to disappoint in terms of making their economies more flexible and resil-ient, or, as economists point out, there is a “lack of struc-tural reforms.” But the fact that the economies of France and Italy are weak is not new. A more encouraging devel-opment is seen in the financials sector. According to the ECB’s bank lending survey, European banks have, finally, started to ease credit standards a little. In addition, they are reporting stronger demand for credit from households and companies. The results of this survey have in the past been a good leading indicator for wider economic developments (see Graphic). We therefore remain confident that recent
weak economic data in Europe represents a temporary soft spot. In an environment of stronger growth ahead, the risks for painful deflation would not appear to be too high either. Nevertheless, the ECB is right to take action to pre-empt a negative spiral.
Overall, we expect the global economy to gain momentum in the quarters ahead. The US will continue its recovery, and Europe will show some improvement before too long. Japan seems to be coping with its tax hike, while emerging economies have generally managed to stabilise growth. There are, of course, risks. Geopolitical uncertainty, in particular, could move the global economy in the wrong direction. But that remains a risk scenario, not our base case.
Group EconomicsHan de Jong – Chief Economist
Loan demand in the eurozone is growing
Source: Thomson Reuters Datastream
Q4 - 2014
Diversifiers
OpportunitiesEuropean and
EM equitiesIT, health care, US
energy E&P, materialsUSD,
MXN, CNY
Volatilityinsurance
Long/short, event drivenhedge funds
Listed real estate
Net change in loan demand compared with last quarter, as reported in the ECB Bank Lending Survey. Graph shows the difference in the sum of the percentages of banks reporting an increase and that of banks reporting a decrease in demand.
■ Global economy will gain momentum in months ahead ■ European economy will be strengthened by US growth ■ Deflation in eurozone will be avoided
Quarterly Outlook Q4 2014 32 September 2014
1,000
1,500
2,000
2,500
3,000
3,500
2007 2008 2009 2010 2011 2012 2013 2014 2015e
adju
stm
ent
ECB and Fed head in different directions
With sluggish economic growth and a decline in inflation expectations, the ECB embarked on a new round of mone-tary stimulus measures in September. The main lending rate was cut to virtually zero, and the deposit rate moved further into negative territory. The central bank also announced an asset purchase programme focusing on asset-backed secu-rities (ABS) and covered bonds. It said that it expected this asset purchase programme and its other measures to lead to a “sizeable adjustment” of its balance sheet.
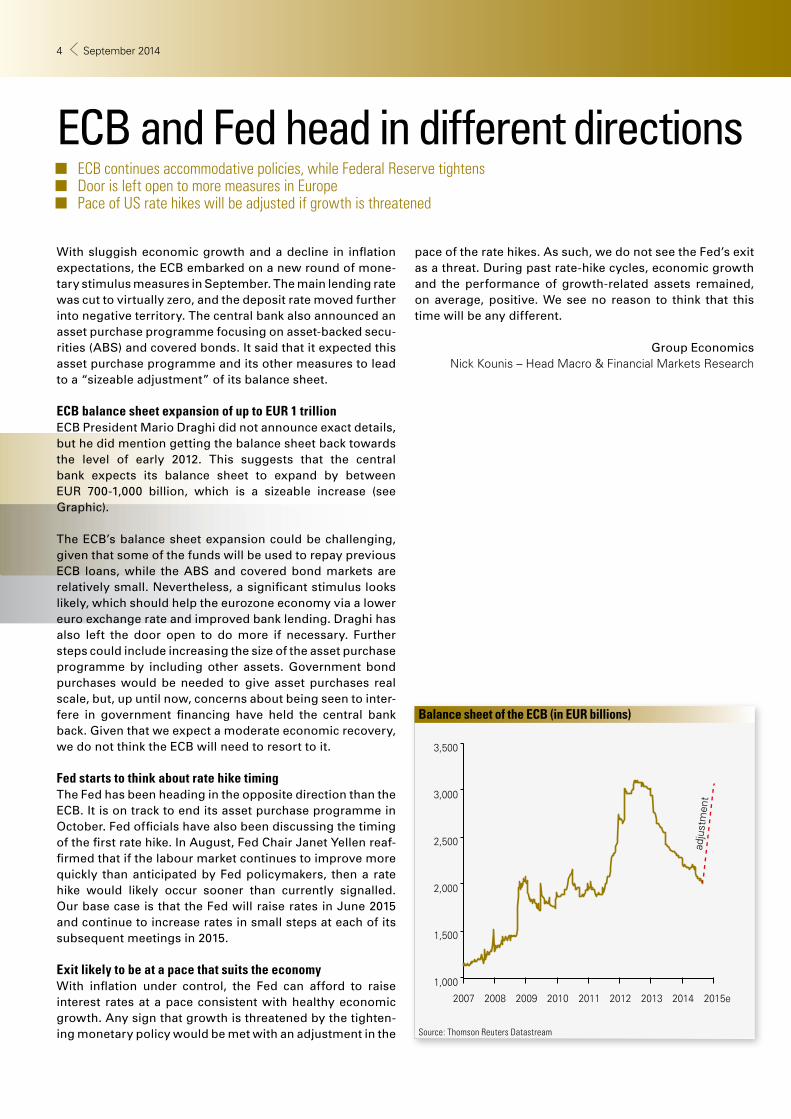
ECB balance sheet expansion of up to EUR 1 trillion ECB President Mario Draghi did not announce exact details, but he did mention getting the balance sheet back towards the level of early 2012. This suggests that the central bank expects its balance sheet to expand by between EUR 700-1,000 billion, which is a sizeable increase (see Graphic).
The ECB’s balance sheet expansion could be challenging, given that some of the funds will be used to repay previous ECB loans, while the ABS and covered bond markets are relatively small. Nevertheless, a significant stimulus looks likely, which should help the eurozone economy via a lower euro exchange rate and improved bank lending. Draghi has also left the door open to do more if necessary. Further steps could include increasing the size of the asset purchase programme by including other assets. Government bond purchases would be needed to give asset purchases real scale, but, up until now, concerns about being seen to inter-fere in government financing have held the central bank back. Given that we expect a moderate economic recovery, we do not think the ECB will need to resort to it.
Fed starts to think about rate hike timingThe Fed has been heading in the opposite direction than the ECB. It is on track to end its asset purchase programme in October. Fed officials have also been discussing the timing of the first rate hike. In August, Fed Chair Janet Yellen reaf-firmed that if the labour market continues to improve more quickly than anticipated by Fed policymakers, then a rate hike would likely occur sooner than currently signalled. Our base case is that the Fed will raise rates in June 2015 and continue to increase rates in small steps at each of its subsequent meetings in 2015.
Exit likely to be at a pace that suits the economyWith inflation under control, the Fed can afford to raise interest rates at a pace consistent with healthy economic growth. Any sign that growth is threatened by the tighten-ing monetary policy would be met with an adjustment in the
pace of the rate hikes. As such, we do not see the Fed’s exit as a threat. During past rate-hike cycles, economic growth and the performance of growth-related assets remained, on average, positive. We see no reason to think that this time will be any different.
Group Economics Nick Kounis – Head Macro & Financial Markets Research
Balance sheet of the ECB (in EUR billions)
Source: Thomson Reuters Datastream
■ ECB continues accommodative policies, while Federal Reserve tightens ■ Door is left open to more measures in Europe ■ Pace of US rate hikes will be adjusted if growth is threatened
Quarterly Outlook Q4 2014 54 September 2014
4
6
8
10
12
14
16
6 8 10 12 14 16 18
EP
S g
row
th (%
)
P/E ratio (x)
US
EU
Japan China
Latin America
EM Asia
EM EU
The staying power of equities
Equity markets have been volatile recently. Investors are worried about geopolitical tensions in the Middle East and Ukraine, there are doubts about the pace of growth in Europe and fears that accelerating US growth could lead to an earlier than anticipated hike in US interest rates.
Even though risks have risen, we believe that the relative attractiveness of equities remains. It is driven by low inter-est rates (and an associated lack of return on cash), improv-ing earnings growth and lessened systemic risk.
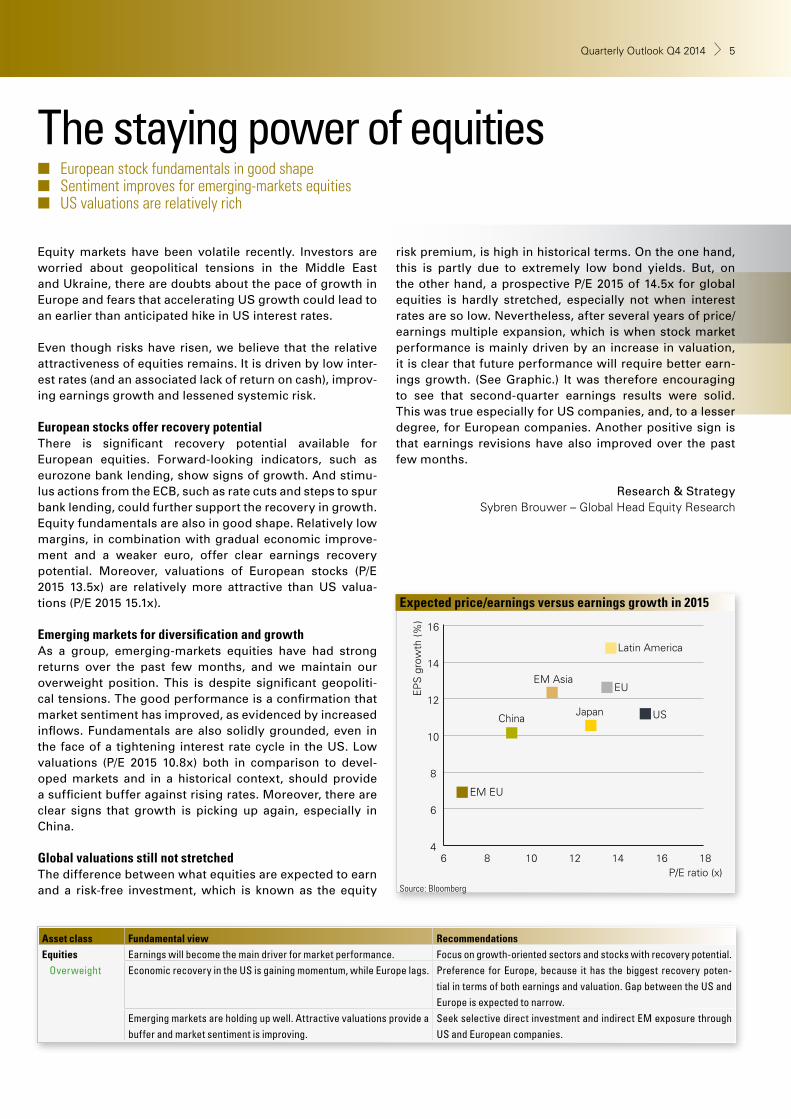
European stocks offer recovery potentialThere is significant recovery potential available for European equities. Forward-looking indicators, such as eurozone bank lending, show signs of growth. And stimu-lus actions from the ECB, such as rate cuts and steps to spur bank lending, could further support the recovery in growth. Equity fundamentals are also in good shape. Relatively low margins, in combination with gradual economic improve-ment and a weaker euro, offer clear earnings recovery potential. Moreover, valuations of European stocks (P/E 2015 13.5x) are relatively more attractive than US valua-tions (P/E 2015 15.1x).
Emerging markets for diversification and growth As a group, emerging-markets equities have had strong returns over the past few months, and we maintain our overweight position. This is despite significant geopoliti-cal tensions. The good performance is a confirmation that market sentiment has improved, as evidenced by increased inflows. Fundamentals are also solidly grounded, even in the face of a tightening interest rate cycle in the US. Low valuations (P/E 2015 10.8x) both in comparison to devel-oped markets and in a historical context, should provide a sufficient buffer against rising rates. Moreover, there are clear signs that growth is picking up again, especially in China.
Global valuations still not stretchedThe difference between what equities are expected to earn and a risk-free investment, which is known as the equity
risk premium, is high in historical terms. On the one hand, this is partly due to extremely low bond yields. But, on the other hand, a prospective P/E 2015 of 14.5x for global equities is hardly stretched, especially not when interest rates are so low. Nevertheless, after several years of price/earnings multiple expansion, which is when stock market performance is mainly driven by an increase in valuation, it is clear that future performance will require better earn-ings growth. (See Graphic.) It was therefore encouraging to see that second-quarter earnings results were solid. This was true especially for US companies, and, to a lesser degree, for European companies. Another positive sign is that earnings revisions have also improved over the past few months.
Research & StrategySybren Brouwer – Global Head Equity Research
Expected price/earnings versus earnings growth in 2015
Source: Bloomberg
Asset class Fundamental view Recommendations
Equities
OverweightEarnings will become the main driver for market performance. Focus on growth-oriented sectors and stocks with recovery potential. Economic recovery in the US is gaining momentum, while Europe lags. Preference for Europe, because it has the biggest recovery poten-
tial in terms of both earnings and valuation. Gap between the US and Europe is expected to narrow.
Emerging markets are holding up well. Attractive valuations provide a buffer and market sentiment is improving.
Seek selective direct investment and indirect EM exposure through US and European companies.
■ European stock fundamentals in good shape ■ Sentiment improves for emerging-markets equities ■ US valuations are relatively rich
Quarterly Outlook Q4 2014 54 September 2014

Industries matter more than geography
Research & StrategySybren Brouwer – Global Head Equity Research
Edith Thouin – Head Equity Theme Research
As globalisation increases, regional positioning is becom-ing a less dominant factor in corporate success. Even smaller companies can now have a global reach. The indus-try in which a company operates, its competitive position and ability to innovate are becoming more important than location. Moreover, a recognized brand, pricing power and worldwide clients are advantages that do not depend on a regional economic cycle. They also make a company more independent of geopolitical and macroeconomic risks.
It is not only large multinationals that are benefiting from the importance of industry over geography. Small and mid-cap companies with the capacity to innovate are also part of the trend. They are becoming attractive investments either on their own, as partners in the value chain or as acquisition targets of larger companies. We favour overweight posi-tions in the information technology (IT), health care and materials sectors to take advantage of this trend and other equity themes (see Graphic.) We underweight allocations to the more defensive consumer staples, telecommunica-tions and utilities sectors.
IT sector: positioned to benefit from globalisationOne of the reasons we favour the IT sector is to benefit from companies linked to trends related to globalisa-tion and innovation. Production automation companies, for example, that can improve and automate industrial processes, are expected to do well. In emerging markets, for example, manufacturers need to close productivity gaps with developed markets to stay competitive.
The internet also continues to create winners, particularly with the increase in internet access around the world. Online-shopping-related companies, for example, have had very strong performance year to date. Increasing consumer confi-dence and an improving job market will also support demand for smartphones and other electronics. Corporate IT invest-ments will be driven in the short-term by the PC replacement cycle and, over a longer term, by the need to further auto-mate production processes. We also believe that internet companies will continue to win market share from traditional players. We therefore expect that internet companies, such as the Chinese company, Tencent, and the online marketplace, eBay, will continue to do well. In terms of advertising, tradi-tional media companies, such as newspapers and broadcast-ers, will continue to lose out to companies such as Baidu.
Innovation in health care supports earnings growth Innovation and new technology are also reflected in our overweight allocation to the health care sector, which, in
general, is attractively valued. Companies engaged in biotechnology, DNA diagnostics and new surgery tech-niques typically have higher earnings growth. The more traditional health care companies are also interesting, as the segment is undergoing an increasing number of spin-offs and share buybacks that can unlock shareholder value. One advantage for investors is that these corporate actions are not correlated with GDP growth. We believe that mergers & acquisitions, spin-offs and buybacks will continue to drive performance. Our top-picks in the health-care sector are Amgen, Sanofi and GlaxoSmithKline.
Materials sector to benefit from global growthOur belief in the materials sector is based more on a cycli-cal uplift in global growth than on long-term sector trends. Our preferred subsectors within materials are chemicals, including agrichemicals, and industrial gasses. These segments are benefitting from lower input prices and reduced energy costs. We prefer Air Liquide, Monsanto, Syngenta and HeidelbergCement.
■ Companies of all sizes can “go global” ■ Globalisation can protect against geopolitical and macroeconomic risk ■ IT, health care and materials companies are preferred
Favoured equity themes and sectorsMasters of
manufacturing
Online retail Biological
solutions
IT ASML, Qualcomm, Cisco
Tencent, Baidu, Ebay
Health care Amgen, Sanofi, Gilead Sciences
Materials Monsanto, Syngenta
Other Schneider Electric, Johnson Controls
Priceline.com
Source: ABN AMRO Private Banking
Quarterly Outlook Q4 2014 76 September 2014
85
90
95
100
105
110
115
Oct-13 Jan-15 Apr-16 Jul-17 Oct-18 Jan-20 Apr-21
19 August 1 month ago 1 year ago
Based on forward prices for crude oil (Brent).
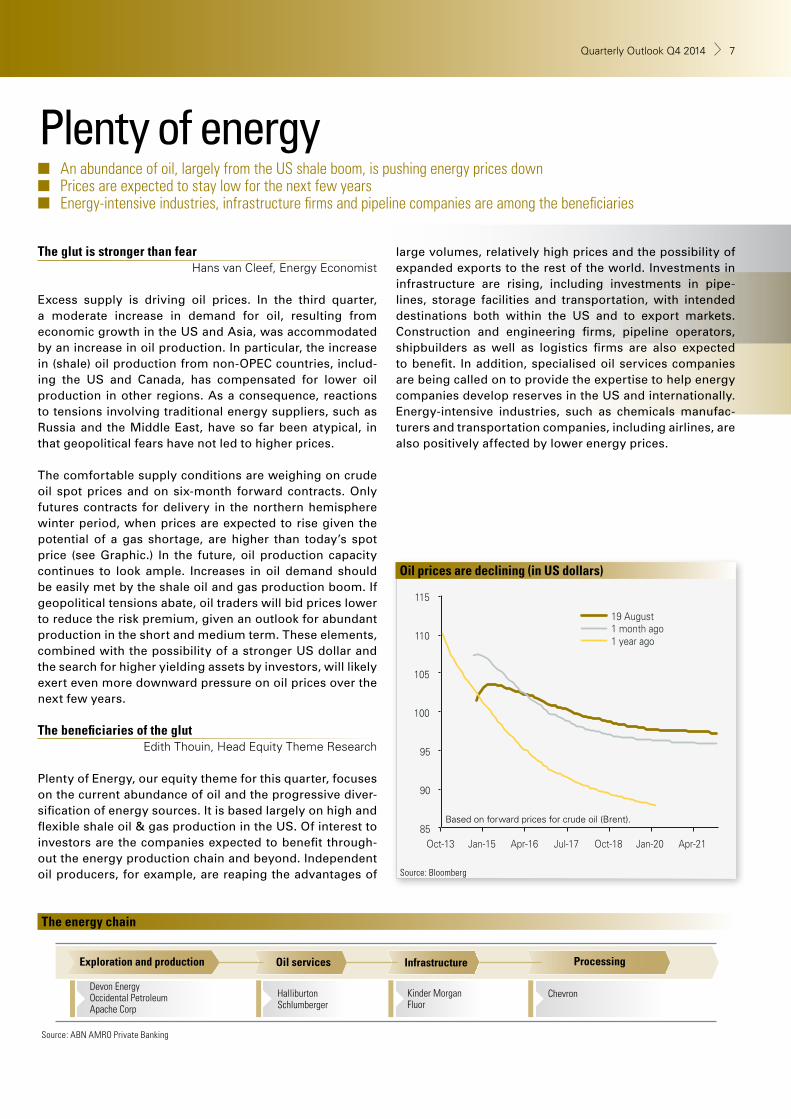
Plenty of energy
The glut is stronger than fear Hans van Cleef, Energy Economist
Excess supply is driving oil prices. In the third quarter, a moderate increase in demand for oil, resulting from economic growth in the US and Asia, was accommodated by an increase in oil production. In particular, the increase in (shale) oil production from non-OPEC countries, includ-ing the US and Canada, has compensated for lower oil production in other regions. As a consequence, reactions to tensions involving traditional energy suppliers, such as Russia and the Middle East, have so far been atypical, in that geopolitical fears have not led to higher prices. The comfortable supply conditions are weighing on crude oil spot prices and on six-month forward contracts. Only futures contracts for delivery in the northern hemisphere winter period, when prices are expected to rise given the potential of a gas shortage, are higher than today’s spot price (see Graphic.) In the future, oil production capacity continues to look ample. Increases in oil demand should be easily met by the shale oil and gas production boom. If geopolitical tensions abate, oil traders will bid prices lower to reduce the risk premium, given an outlook for abundant production in the short and medium term. These elements, combined with the possibility of a stronger US dollar and the search for higher yielding assets by investors, will likely exert even more downward pressure on oil prices over the next few years.
The beneficiaries of the glut Edith Thouin, Head Equity Theme Research
Plenty of Energy, our equity theme for this quarter, focuses on the current abundance of oil and the progressive diver-sification of energy sources. It is based largely on high and flexible shale oil & gas production in the US. Of interest to investors are the companies expected to benefit through-out the energy production chain and beyond. Independent oil producers, for example, are reaping the advantages of
Oil prices are declining (in US dollars)
Source: Bloomberg
large volumes, relatively high prices and the possibility of expanded exports to the rest of the world. Investments in infrastructure are rising, including investments in pipe-lines, storage facilities and transportation, with intended destinations both within the US and to export markets. Construction and engineering firms, pipeline operators, shipbuilders as well as logistics firms are also expected to benefit. In addition, specialised oil services companies are being called on to provide the expertise to help energy companies develop reserves in the US and internationally. Energy-intensive industries, such as chemicals manufac-turers and transportation companies, including airlines, are also positively affected by lower energy prices.
Devon EnergyOccidental PetroleumApache Corp
HalliburtonSchlumberger
Kinder MorganFluor
Chevron
Exploration and production Oil services Infrastructure Processing
Source: ABN AMRO Private Banking
The energy chain
■ An abundance of oil, largely from the US shale boom, is pushing energy prices down ■ Prices are expected to stay low for the next few years ■ Energy-intensive industries, infrastructure firms and pipeline companies are among the beneficiaries
Quarterly Outlook Q4 2014 76 September 2014
-3
-2
-1
0
1
2
3
4
5
6
Dec‘99 Nov’02 Oct’05 Sep’08 Aug’11 Jul’14
US 10-year real yield Eurozone weighted 10-year real yield
Bonds under the spell of central banks
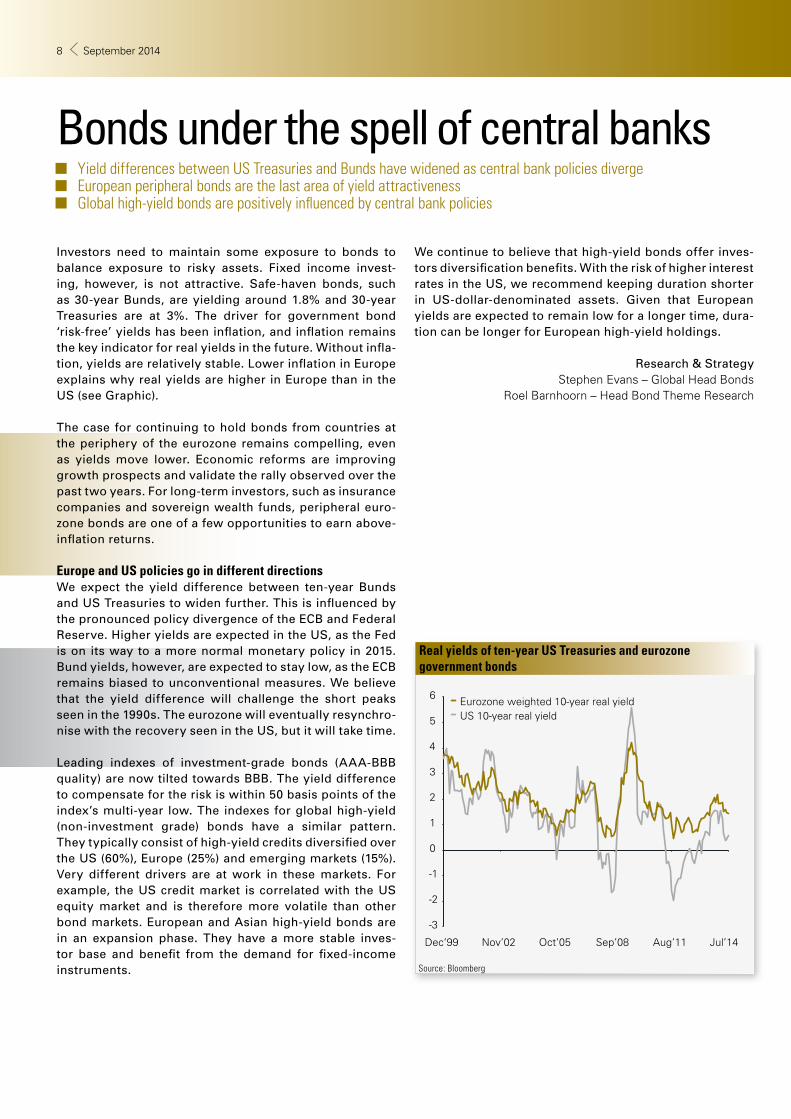
Investors need to maintain some exposure to bonds to balance exposure to risky assets. Fixed income invest-ing, however, is not attractive. Safe-haven bonds, such as 30-year Bunds, are yielding around 1.8% and 30-year Treasuries are at 3%. The driver for government bond ‘risk-free’ yields has been inflation, and inflation remains the key indicator for real yields in the future. Without infla-tion, yields are relatively stable. Lower inflation in Europe explains why real yields are higher in Europe than in the US (see Graphic).
The case for continuing to hold bonds from countries at the periphery of the eurozone remains compelling, even as yields move lower. Economic reforms are improving growth prospects and validate the rally observed over the past two years. For long-term investors, such as insurance companies and sovereign wealth funds, peripheral euro-zone bonds are one of a few opportunities to earn above-inflation returns.
Europe and US policies go in different directionsWe expect the yield difference between ten-year Bunds and US Treasuries to widen further. This is influenced by the pronounced policy divergence of the ECB and Federal Reserve. Higher yields are expected in the US, as the Fed is on its way to a more normal monetary policy in 2015. Bund yields, however, are expected to stay low, as the ECB remains biased to unconventional measures. We believe that the yield difference will challenge the short peaks seen in the 1990s. The eurozone will eventually resynchro-nise with the recovery seen in the US, but it will take time.
Leading indexes of investment-grade bonds (AAA-BBB quality) are now tilted towards BBB. The yield difference to compensate for the risk is within 50 basis points of the index’s multi-year low. The indexes for global high-yield (non-investment grade) bonds have a similar pattern. They typically consist of high-yield credits diversified over the US (60%), Europe (25%) and emerging markets (15%). Very different drivers are at work in these markets. For example, the US credit market is correlated with the US equity market and is therefore more volatile than other bond markets. European and Asian high-yield bonds are in an expansion phase. They have a more stable inves-tor base and benefit from the demand for fixed-income instruments.
Real yields of ten-year US Treasuries and eurozonegovernment bonds
Source: Bloomberg
Research & Strategy Stephen Evans – Global Head Bonds
Roel Barnhoorn – Head Bond Theme Research
■ Yield differences between US Treasuries and Bunds have widened as central bank policies diverge ■ European peripheral bonds are the last area of yield attractiveness ■ Global high-yield bonds are positively influenced by central bank policies
We continue to believe that high-yield bonds offer inves-tors diversification benefits. With the risk of higher interest rates in the US, we recommend keeping duration shorter in US-dollar-denominated assets. Given that European yields are expected to remain low for a longer time, dura-tion can be longer for European high-yield holdings.
Quarterly Outlook Q4 2014 98 September 2014
-20% -15% -10% -5% 0% 5%
MSCI AC World Index
Long/short equity
Jan 14Aug 13Jun 13
May 13Oct 12
May 12Apr 12Dec 11Nov 11Sep 11Aug 11Jul 11
Jun 11May 11Mar 11Nov 10Aug 10Jun 10
May 10Jan 10Oct 09Jun 09Feb 09Jan 09Nov 08Oct 08Sep 08
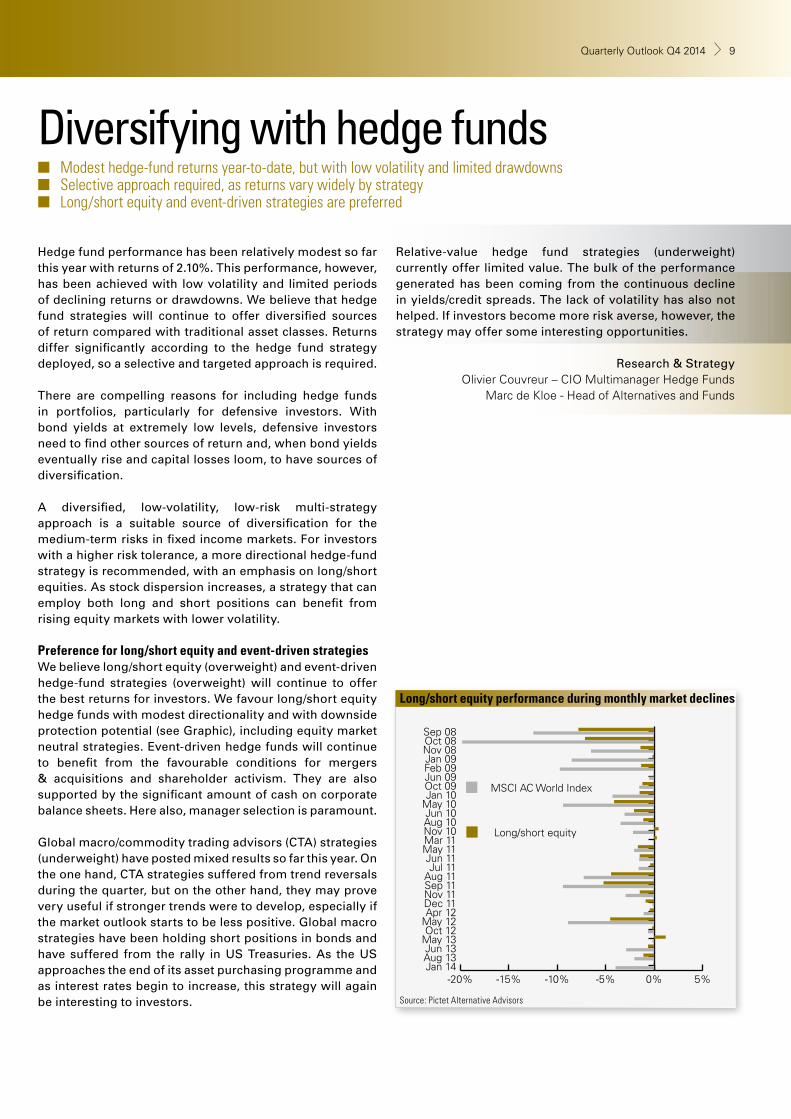
Diversifying with hedge funds ■ Modest hedge-fund returns year-to-date, but with low volatility and limited drawdowns ■ Selective approach required, as returns vary widely by strategy ■ Long/short equity and event-driven strategies are preferred
Hedge fund performance has been relatively modest so far this year with returns of 2.10%. This performance, however, has been achieved with low volatility and limited periods of declining returns or drawdowns. We believe that hedge fund strategies will continue to offer diversified sources of return compared with traditional asset classes. Returns differ significantly according to the hedge fund strategy deployed, so a selective and targeted approach is required.
There are compelling reasons for including hedge funds in portfolios, particularly for defensive investors. With bond yields at extremely low levels, defensive investors need to find other sources of return and, when bond yields eventually rise and capital losses loom, to have sources of diversification.
A diversified, low-volatility, low-risk multi-strategy approach is a suitable source of diversification for the medium-term risks in fixed income markets. For investors with a higher risk tolerance, a more directional hedge-fund strategy is recommended, with an emphasis on long/short equities. As stock dispersion increases, a strategy that can employ both long and short positions can benefit from rising equity markets with lower volatility.
Preference for long/short equity and event-driven strategiesWe believe long/short equity (overweight) and event-driven hedge-fund strategies (overweight) will continue to offer the best returns for investors. We favour long/short equity hedge funds with modest directionality and with downside protection potential (see Graphic), including equity market neutral strategies. Event-driven hedge funds will continue to benefit from the favourable conditions for mergers & acquisitions and shareholder activism. They are also supported by the significant amount of cash on corporate balance sheets. Here also, manager selection is paramount.
Global macro/commodity trading advisors (CTA) strategies (underweight) have posted mixed results so far this year. On the one hand, CTA strategies suffered from trend reversals during the quarter, but on the other hand, they may prove very useful if stronger trends were to develop, especially if the market outlook starts to be less positive. Global macro strategies have been holding short positions in bonds and have suffered from the rally in US Treasuries. As the US approaches the end of its asset purchasing programme and as interest rates begin to increase, this strategy will again be interesting to investors.
Relative-value hedge fund strategies (underweight) currently offer limited value. The bulk of the performance generated has been coming from the continuous decline in yields/credit spreads. The lack of volatility has also not helped. If investors become more risk averse, however, the strategy may offer some interesting opportunities.
Research & StrategyOlivier Couvreur – CIO Multimanager Hedge Funds
Marc de Kloe - Head of Alternatives and Funds
Long/short equity performance during monthly market declines
Source: Pictet Alternative Advisors
Quarterly Outlook Q4 2014 98 September 2014

-80 -70 -60 -50 -40 -30 -20 -10 0 10 20 30Luxembourg
ChinaTurkey
Hong KongGreeceAustria
NetherlandsCanada
GermanySingapore
SwitzerlandGlobal median
United KingdomFranceFinland
USAIndia
New ZealandSwedenAustralia
South AfricaBelgiumMexico
Japan
discount premium
Property to improve as recovery unfolds
The real estate sector has been resilient in the midst of the market’s recent gyrations. There are, however, two elements of uncertainty. In the eurozone, there is fear of deflation, while in the US, there is concern over higher interest rates. In Europe, a recession would lead to lower income growth and a decline in property valuations. High-quality property companies will be protected, however, due to their stronger balance sheets. In the US, higher interest rates are expected. A stable recovery will improve occupancy rates and rental income, especially given low levels of supply. We favour a more cyclical tilt to US property, with a bias toward commercial-real-estate invest-ment trusts. Higher rents can mitigate rising interest rates.
Valuation buffer Global real estate valuations rose slightly between the first and second quarters of 2014. The sector is, on average, however, still trading at a discount to its net asset value and offers a dividend yield of 3%. In case of modest premiums to NAVs, we believe that these valuations are justified, given the improvement in real estate fundamentals and economic data (see Graphic). Our regional preferences are as follows: US (overweight), Europe (neutral) and Asia (underweight).
Research & StrategyManuel Hernandez Fernandez – Property Specialist
The median discount (premium) to the net asset value (%) ofthe global real estate market by country
While the world is still arguing if climate change is happen-ing and if it is caused by humans, the reality is that we are living through more extreme weather conditions and expe-riencing more severe storms and unusual weather condi-tions than, say, 20 years ago. And while no single storm can be directly attributed to climate change, which is a long-term phenomenon, there is statistical evidence that more extreme weather events, mainly storms, are occurring. This is not without an effect on investment portfolios.
Insurance and re-insurance companies have been affected by greater than long-term-average economic losses. A full 90% of all S&P Global 100 Index companies iden-tify extreme weather conditions and potential climate change as an important current or near-future business
risk (Source: Climate & Energy Solutions). The main risks they see are the effects on production facilities, damaged properties or disruptions in their supply chain. There is also loss of water and power supplies, disruption of distribution chains and increased operational costs through mainte-nance costs or even higher commodity prices. Although the surveyed companies are concerned, less than 50% of them are properly prepared beyond business as usual. Needless to say, the companies that are better prepared will likely perform better when a storm strikes. This is just one example of a sustainable investing factor that can materi-ally impact the bottom line of a company.
Extreme weather and the bottom line
Sustainable DevelopmentSolange Rouschop – Sustainability Manager Retail & Private Banking
Source: SNL Financial (31 July 2014)
Net asset value (NAV) calculated as median of reported consensus estimates.
■ Financing costs will stay low for longer in Europe ■ US high-quality property is protected from higher rates ■ Average dividend yield of 3%
■ Severe storms appear to be increasing ■ A large percentage of companies believe extreme weather is a business risk ■ Most companies are unprepared for severe weather conditions
Quarterly Outlook Q4 2014 1110 September 2014
0 1,000 2,000 3,000 4,000 5,000
Unrealized portfolio value
Capital raised but not yetinvested
2000
2001
2002
2003
2004
2005
2006
2007
2008
2009
2010
2011
2012
2013
2014
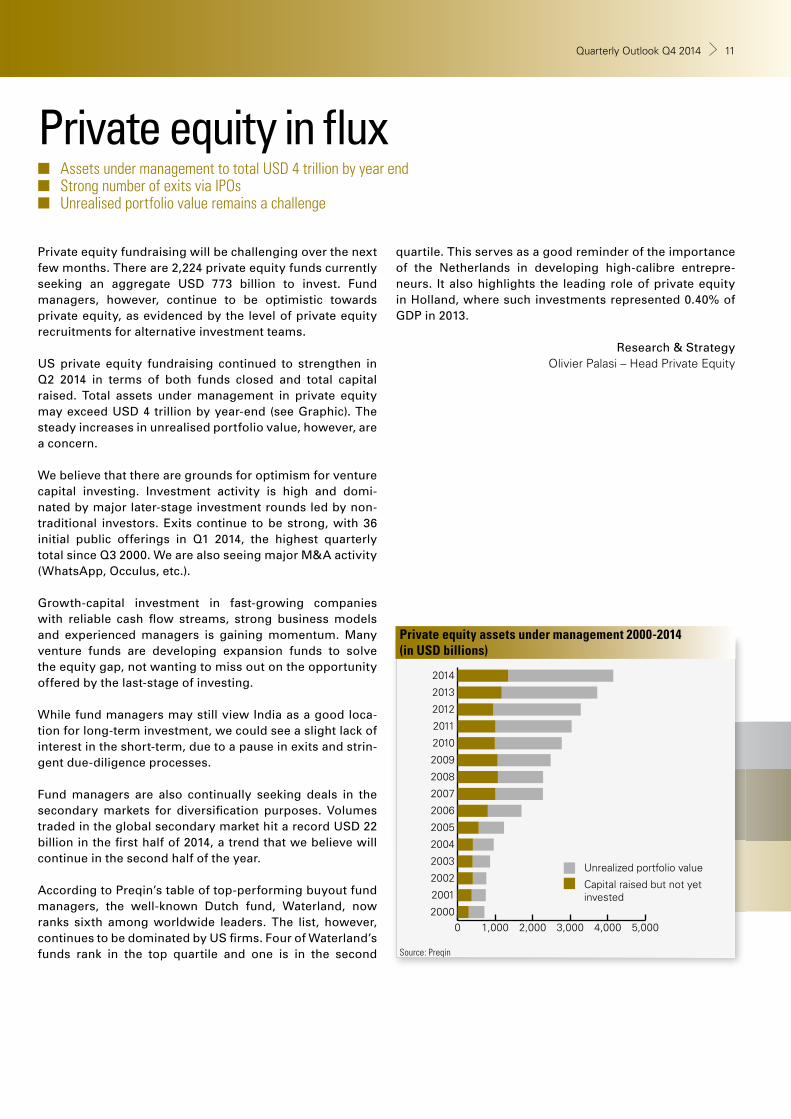
Private equity in flux
Private equity fundraising will be challenging over the next few months. There are 2,224 private equity funds currently seeking an aggregate USD 773 billion to invest. Fund managers, however, continue to be optimistic towards private equity, as evidenced by the level of private equity recruitments for alternative investment teams.
US private equity fundraising continued to strengthen in Q2 2014 in terms of both funds closed and total capital raised. Total assets under management in private equity may exceed USD 4 trillion by year-end (see Graphic). The steady increases in unrealised portfolio value, however, are a concern.
We believe that there are grounds for optimism for venture capital investing. Investment activity is high and domi-nated by major later-stage investment rounds led by non-traditional investors. Exits continue to be strong, with 36 initial public offerings in Q1 2014, the highest quarterly total since Q3 2000. We are also seeing major M&A activity (WhatsApp, Occulus, etc.).
Growth-capital investment in fast-growing companies with reliable cash flow streams, strong business models and experienced managers is gaining momentum. Many venture funds are developing expansion funds to solve the equity gap, not wanting to miss out on the opportunity offered by the last-stage of investing.
While fund managers may still view India as a good loca-tion for long-term investment, we could see a slight lack of interest in the short-term, due to a pause in exits and strin-gent due-diligence processes.
Fund managers are also continually seeking deals in the secondary markets for diversification purposes. Volumes traded in the global secondary market hit a record USD 22 billion in the first half of 2014, a trend that we believe will continue in the second half of the year.
According to Preqin’s table of top-performing buyout fund managers, the well-known Dutch fund, Waterland, now ranks sixth among worldwide leaders. The list, however, continues to be dominated by US firms. Four of Waterland’s funds rank in the top quartile and one is in the second
quartile. This serves as a good reminder of the importance of the Netherlands in developing high-calibre entrepre-neurs. It also highlights the leading role of private equity in Holland, where such investments represented 0.40% of GDP in 2013.
Research & StrategyOlivier Palasi – Head Private Equity
Private equity assets under management 2000-2014 (in USD billions)
Source: Preqin
■ Assets under management to total USD 4 trillion by year end ■ Strong number of exits via IPOs ■ Unrealised portfolio value remains a challenge
Quarterly Outlook Q4 2014 1110 September 2014
0.0
0.5
1.0
1.5
2.0ABN AMRO view
Market view
Dec '15Sep '15Jun '15Mar '15Dec '14Sep '14
Stars align for US dollar
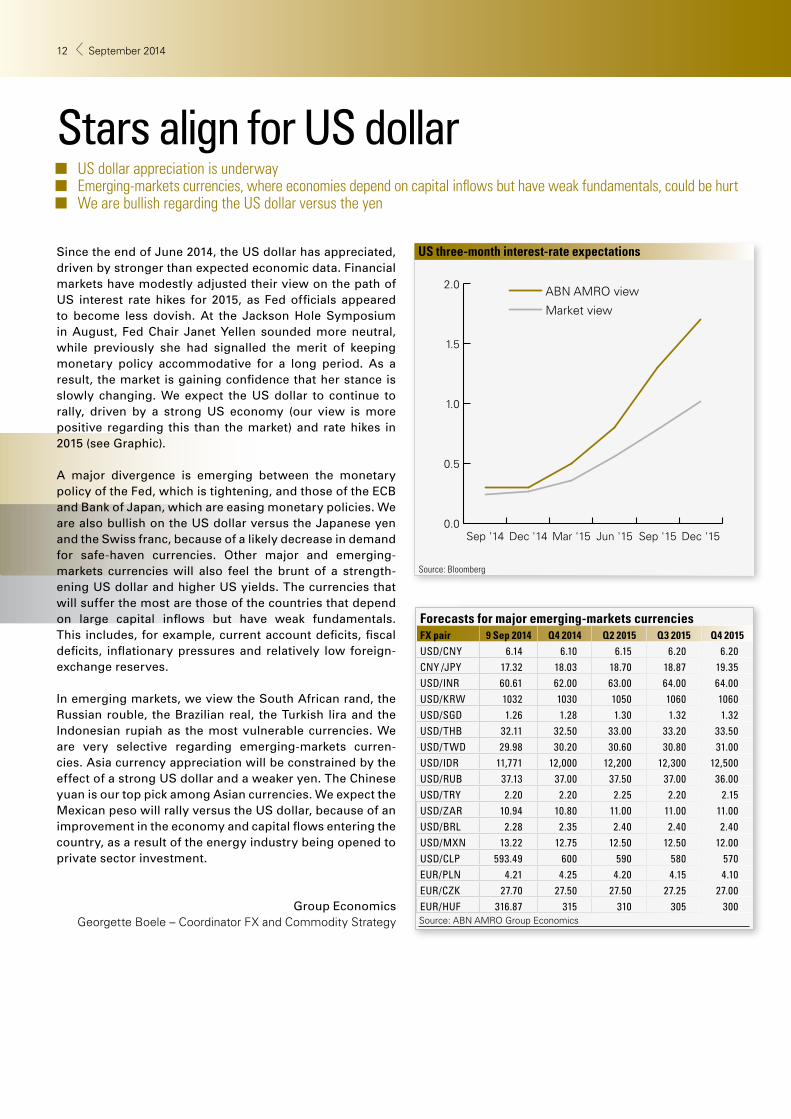
Since the end of June 2014, the US dollar has appreciated, driven by stronger than expected economic data. Financial markets have modestly adjusted their view on the path of US interest rate hikes for 2015, as Fed officials appeared to become less dovish. At the Jackson Hole Symposium in August, Fed Chair Janet Yellen sounded more neutral, while previously she had signalled the merit of keeping monetary policy accommodative for a long period. As a result, the market is gaining confidence that her stance is slowly changing. We expect the US dollar to continue to rally, driven by a strong US economy (our view is more positive regarding this than the market) and rate hikes in 2015 (see Graphic).
A major divergence is emerging between the monetary policy of the Fed, which is tightening, and those of the ECB and Bank of Japan, which are easing monetary policies. We are also bullish on the US dollar versus the Japanese yen and the Swiss franc, because of a likely decrease in demand for safe-haven currencies. Other major and emerging-markets currencies will also feel the brunt of a strength-ening US dollar and higher US yields. The currencies that will suffer the most are those of the countries that depend on large capital inflows but have weak fundamentals. This includes, for example, current account deficits, fiscal deficits, inflationary pressures and relatively low foreign-exchange reserves.
In emerging markets, we view the South African rand, the Russian rouble, the Brazilian real, the Turkish lira and the Indonesian rupiah as the most vulnerable currencies. We are very selective regarding emerging-markets curren-cies. Asia currency appreciation will be constrained by the effect of a strong US dollar and a weaker yen. The Chinese yuan is our top pick among Asian currencies. We expect the Mexican peso will rally versus the US dollar, because of an improvement in the economy and capital flows entering the country, as a result of the energy industry being opened to private sector investment.
Group EconomicsGeorgette Boele – Coordinator FX and Commodity Strategy
US three-month interest-rate expectations
Source: Bloomberg
■ US dollar appreciation is underway ■ Emerging-markets currencies, where economies depend on capital inflows but have weak fundamentals, could be hurt ■ We are bullish regarding the US dollar versus the yen
Forecasts for major emerging-markets currenciesFX pair 9 Sep 2014 Q4 2014 Q2 2015 Q3 2015 Q4 2015
USD/CNY 6.14 6.10 6.15 6.20 6.20CNY /JPY 17.32 18.03 18.70 18.87 19.35USD/INR 60.61 62.00 63.00 64.00 64.00USD/KRW 1032 1030 1050 1060 1060USD/SGD 1.26 1.28 1.30 1.32 1.32USD/THB 32.11 32.50 33.00 33.20 33.50USD/TWD 29.98 30.20 30.60 30.80 31.00USD/IDR 11,771 12,000 12,200 12,300 12,500USD/RUB 37.13 37.00 37.50 37.00 36.00USD/TRY 2.20 2.20 2.25 2.20 2.15USD/ZAR 10.94 10.80 11.00 11.00 11.00USD/BRL 2.28 2.35 2.40 2.40 2.40USD/MXN 13.22 12.75 12.50 12.50 12.00USD/CLP 593.49 600 590 580 570EUR/PLN 4.21 4.25 4.20 4.15 4.10EUR/CZK 27.70 27.50 27.50 27.25 27.00EUR/HUF 316.87 315 310 305 300Source: ABN AMRO Group Economics
Quarterly Outlook Q4 2014 1312 September 2014
Forecasts
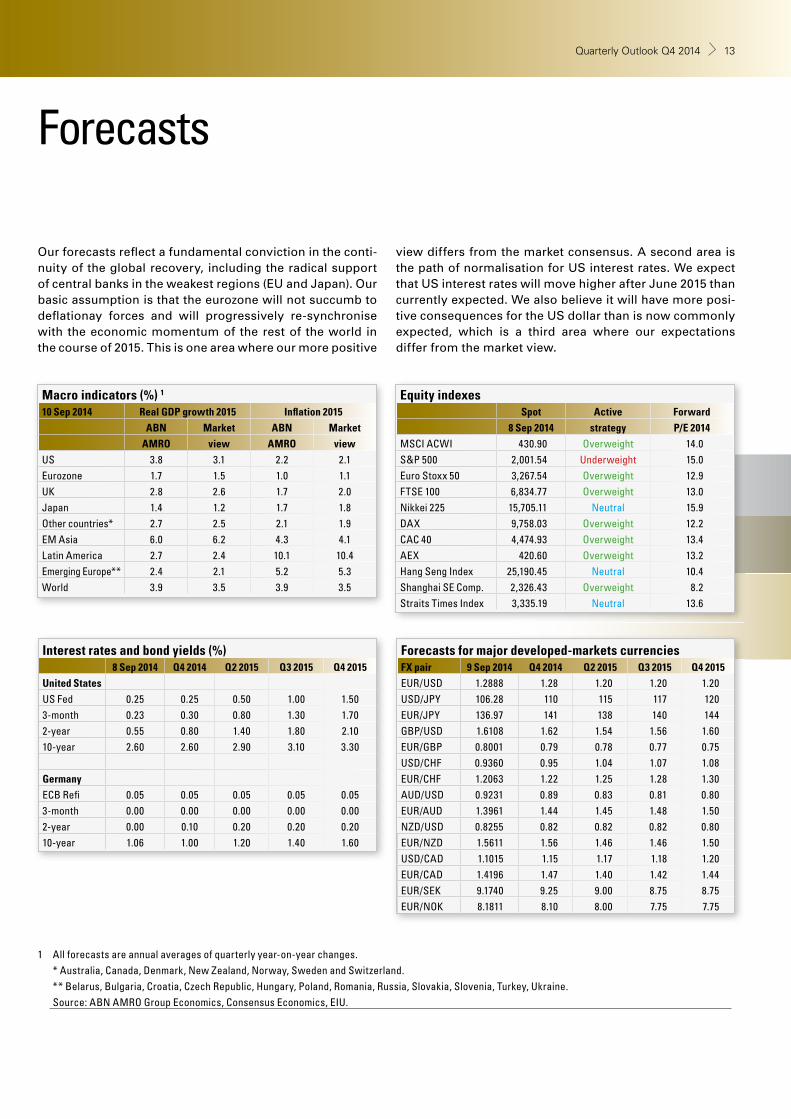
Our forecasts reflect a fundamental conviction in the conti-nuity of the global recovery, including the radical support of central banks in the weakest regions (EU and Japan). Our basic assumption is that the eurozone will not succumb to deflationay forces and will progressively re-synchronise with the economic momentum of the rest of the world in the course of 2015. This is one area where our more positive
view differs from the market consensus. A second area is the path of normalisation for US interest rates. We expect that US interest rates will move higher after June 2015 than currently expected. We also believe it will have more posi-tive consequences for the US dollar than is now commonly expected, which is a third area where our expectations differ from the market view.
Macro indicators (%) 1
10 Sep 2014 Real GDP growth 2015 Inflation 2015
ABN Market ABN Market
AMRO view AMRO view
US 3.8 3.1 2.2 2.1Eurozone 1.7 1.5 1.0 1.1UK 2.8 2.6 1.7 2.0Japan 1.4 1.2 1.7 1.8Other countries* 2.7 2.5 2.1 1.9EM Asia 6.0 6.2 4.3 4.1Latin America 2.7 2.4 10.1 10.4Emerging Europe** 2.4 2.1 5.2 5.3World 3.9 3.5 3.9 3.5
Equity indexesSpot Active Forward
8 Sep 2014 strategy P/E 2014
MSCI ACWI 430.90 Overweight 14.0S&P 500 2,001.54 Underweight 15.0Euro Stoxx 50 3,267.54 Overweight 12.9FTSE 100 6,834.77 Overweight 13.0Nikkei 225 15,705.11 Neutral 15.9DAX 9,758.03 Overweight 12.2CAC 40 4,474.93 Overweight 13.4AEX 420.60 Overweight 13.2Hang Seng Index 25,190.45 Neutral 10.4Shanghai SE Comp. 2,326.43 Overweight 8.2Straits Times Index 3,335.19 Neutral 13.6
Interest rates and bond yields (%)8 Sep 2014 Q4 2014 Q2 2015 Q3 2015 Q4 2015
United States
US Fed 0.25 0.25 0.50 1.00 1.503-month 0.23 0.30 0.80 1.30 1.702-year 0.55 0.80 1.40 1.80 2.1010-year 2.60 2.60 2.90 3.10 3.30
Germany
ECB Refi 0.05 0.05 0.05 0.05 0.053-month 0.00 0.00 0.00 0.00 0.002-year 0.00 0.10 0.20 0.20 0.2010-year 1.06 1.00 1.20 1.40 1.60
1 All forecasts are annual averages of quarterly year-on-year changes. * Australia, Canada, Denmark, New Zealand, Norway, Sweden and Switzerland. ** Belarus, Bulgaria, Croatia, Czech Republic, Hungary, Poland, Romania, Russia, Slovakia, Slovenia, Turkey, Ukraine. Source: ABN AMRO Group Economics, Consensus Economics, EIU.
Forecasts for major developed-markets currenciesFX pair 9 Sep 2014 Q4 2014 Q2 2015 Q3 2015 Q4 2015
EUR/USD 1.2888 1.28 1.20 1.20 1.20USD/JPY 106.28 110 115 117 120EUR/JPY 136.97 141 138 140 144GBP/USD 1.6108 1.62 1.54 1.56 1.60EUR/GBP 0.8001 0.79 0.78 0.77 0.75USD/CHF 0.9360 0.95 1.04 1.07 1.08EUR/CHF 1.2063 1.22 1.25 1.28 1.30AUD/USD 0.9231 0.89 0.83 0.81 0.80EUR/AUD 1.3961 1.44 1.45 1.48 1.50NZD/USD 0.8255 0.82 0.82 0.82 0.80EUR/NZD 1.5611 1.56 1.46 1.46 1.50USD/CAD 1.1015 1.15 1.17 1.18 1.20EUR/CAD 1.4196 1.47 1.40 1.42 1.44EUR/SEK 9.1740 9.25 9.00 8.75 8.75EUR/NOK 8.1811 8.10 8.00 7.75 7.75
Quarterly Outlook Q4 2014 1312 September 2014
100
105
110
115
120
125
130
135
140
145
150
Sep-04 Sep-06 Sep-08 Sep-10 Sep-12 Sep-14
Equities key to allocation
Expectations of a global recovery in growth, earnings momen-tum and restrained systemic risk are underpinning our posi-tioning in risky assets. We continue to prefer European equities versus US equities, despite the geopolitical conflict in Ukraine. Our belief in European equities is based on the eventual resyn-chronisation of the eurozone economic recovery with the rest of the world. European equity valuations are also more attrac-tive than US valuations. We also continue to have a strong preference for emerging-markets equities, based on improved relative momentum as well as encouraging data from China.
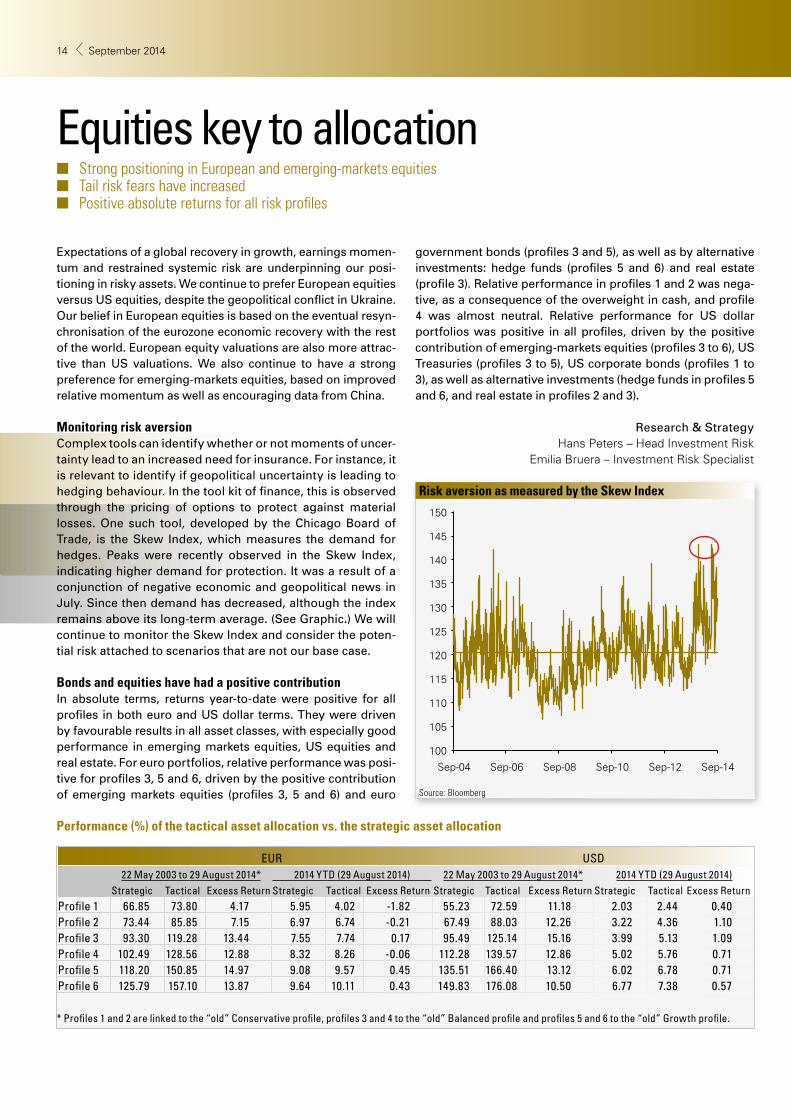
Monitoring risk aversion Complex tools can identify whether or not moments of uncer-tainty lead to an increased need for insurance. For instance, it is relevant to identify if geopolitical uncertainty is leading to hedging behaviour. In the tool kit of finance, this is observed through the pricing of options to protect against material losses. One such tool, developed by the Chicago Board of Trade, is the Skew Index, which measures the demand for hedges. Peaks were recently observed in the Skew Index, indicating higher demand for protection. It was a result of a conjunction of negative economic and geopolitical news in July. Since then demand has decreased, although the index remains above its long-term average. (See Graphic.) We will continue to monitor the Skew Index and consider the poten-tial risk attached to scenarios that are not our base case.
Bonds and equities have had a positive contributionIn absolute terms, returns year-to-date were positive for all profiles in both euro and US dollar terms. They were driven by favourable results in all asset classes, with especially good performance in emerging markets equities, US equities and real estate. For euro portfolios, relative performance was posi-tive for profiles 3, 5 and 6, driven by the positive contribution of emerging markets equities (profiles 3, 5 and 6) and euro
government bonds (profiles 3 and 5), as well as by alternative investments: hedge funds (profiles 5 and 6) and real estate (profile 3). Relative performance in profiles 1 and 2 was nega-tive, as a consequence of the overweight in cash, and profile 4 was almost neutral. Relative performance for US dollar portfolios was positive in all profiles, driven by the positive contribution of emerging-markets equities (profiles 3 to 6), US Treasuries (profiles 3 to 5), US corporate bonds (profiles 1 to 3), as well as alternative investments (hedge funds in profiles 5 and 6, and real estate in profiles 2 and 3).
Research & Strategy Hans Peters – Head Investment Risk
Emilia Bruera – Investment Risk Specialist
Risk aversion as measured by the Skew Index
EUR USD22 May 2003 to 29 August 2014* 2014 YTD (29 August 2014) 22 May 2003 to 29 August 2014* 2014 YTD (29 August 2014)
Strategic Tactical Excess Return Strategic Tactical Excess Return Strategic Tactical Excess Return Strategic Tactical Excess ReturnProfile 1 66.85 73.80 4.17 5.95 4.02 -1.82 55.23 72.59 11.18 2.03 2.44 0.40Profile 2 73.44 85.85 7.15 6.97 6.74 -0.21 67.49 88.03 12.26 3.22 4.36 1.10Profile 3 93.30 119.28 13.44 7.55 7.74 0.17 95.49 125.14 15.16 3.99 5.13 1.09Profile 4 102.49 128.56 12.88 8.32 8.26 -0.06 112.28 139.57 12.86 5.02 5.76 0.71Profile 5 118.20 150.85 14.97 9.08 9.57 0.45 135.51 166.40 13.12 6.02 6.78 0.71Profile 6 125.79 157.10 13.87 9.64 10.11 0.43 149.83 176.08 10.50 6.77 7.38 0.57
* Profiles 1 and 2 are linked to the “old” Conservative profile, profiles 3 and 4 to the “old” Balanced profile and profiles 5 and 6 to the “old” Growth profile.
Source: Bloomberg
Performance (%) of the tactical asset allocation vs. the strategic asset allocation
■ Strong positioning in European and emerging-markets equities ■ Tail risk fears have increased ■ Positive absolute returns for all risk profiles
Quarterly Outlook Q4 2014 1514 September 2014
Asset allocation
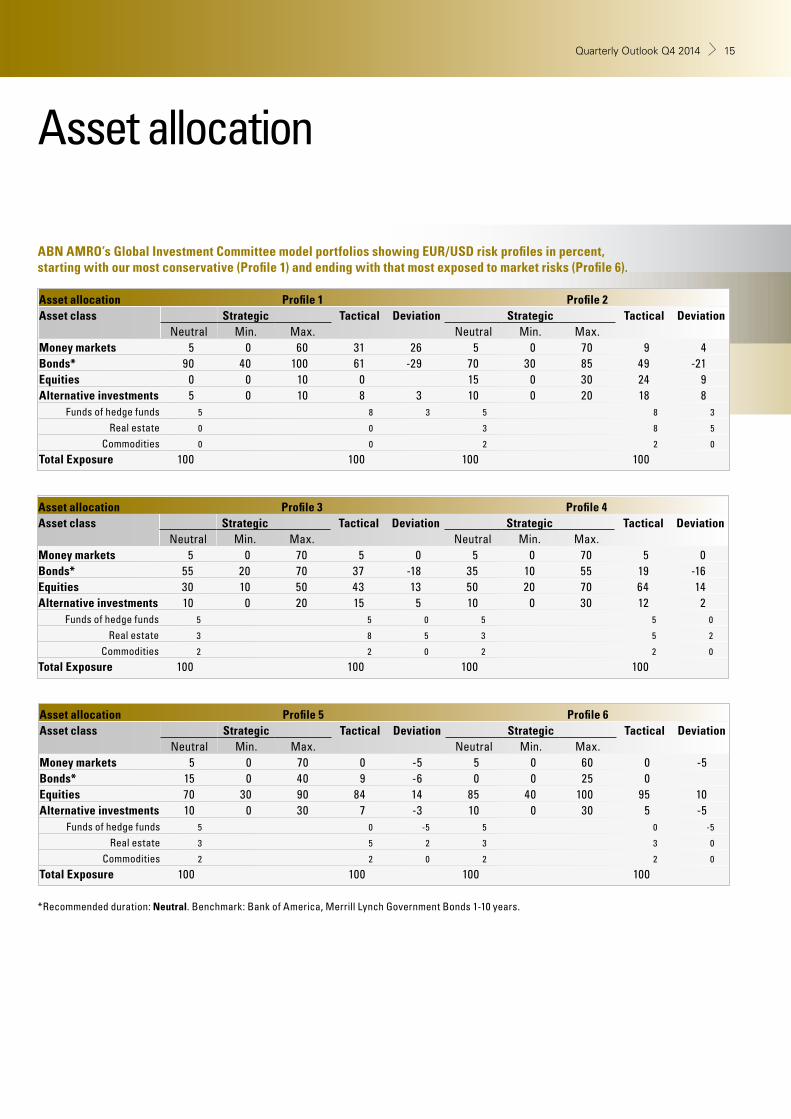
ABN AMRO’s Global Investment Committee model portfolios showing EUR/USD risk profiles in percent, starting with our most conservative (Profile 1) and ending with that most exposed to market risks (Profile 6).
*Recommended duration: Neutral. Benchmark: Bank of America, Merrill Lynch Government Bonds 1-10 years.
Asset allocation Profile 3 Profile 4Asset class Strategic Tactical Deviation Strategic Tactical Deviation
Neutral Min. Max. Neutral Min. Max.Money markets 5 0 70 5 0 5 0 70 5 0Bonds* 55 20 70 37 -18 35 10 55 19 -16Equities 30 10 50 43 13 50 20 70 64 14Alternative investments 10 0 20 15 5 10 0 30 12 2
Funds of hedge funds 5 5 0 5 5 0
Real estate 3 8 5 3 5 2
Commodities 2 2 0 2 2 0
Total Exposure 100 100 100 100
Asset allocation Profile 1 Profile 2Asset class Strategic Tactical Deviation Strategic Tactical Deviation
Neutral Min. Max. Neutral Min. Max.Money markets 5 0 60 31 26 5 0 70 9 4Bonds* 90 40 100 61 -29 70 30 85 49 -21Equities 0 0 10 0 15 0 30 24 9Alternative investments 5 0 10 8 3 10 0 20 18 8
Funds of hedge funds 5 8 3 5 8 3
Real estate 0 0 3 8 5
Commodities 0 0 2 2 0
Total Exposure 100 100 100 100
Asset allocation Profile 5 Profile 6Asset class Strategic Tactical Deviation Strategic Tactical Deviation
Neutral Min. Max. Neutral Min. Max.Money markets 5 0 70 0 -5 5 0 60 0 -5Bonds* 15 0 40 9 -6 0 0 25 0Equities 70 30 90 84 14 85 40 100 95 10Alternative investments 10 0 30 7 -3 10 0 30 5 -5
Funds of hedge funds 5 0 -5 5 0 -5
Real estate 3 5 2 3 3 0
Commodities 2 2 0 2 2 0
Total Exposure 100 100 100 100
Quarterly Outlook Q4 2014 1514 September 2014

Members of the ABN AMRO Bank Global Investment Committee
Didier Duret [email protected] Chief Investment Officer Private BankingGerben Jorritsma [email protected] Global Head Discretionary Portfolio Management Han de Jong [email protected] Chief EconomistArnaud de Dumast [email protected] Head Investments Private Clients Neuflize OBCWim Fonteine [email protected] Senior Investment Specialist and Advisory DelegateBernhard Ebert [email protected] Head Discretionary Portfolio Management Bethmann Bank
Group Economics
Nick Kounis [email protected] Head Macro ResearchGeorgette Boele [email protected] Coordinator FX and Commodity Strategy Hans van Cleef [email protected] Energy Economist
Bond Research & Strategy Team
Stephen Evans [email protected] Global Head of Bonds Roel Barnhoorn [email protected] Head Bond Theme ResearchHenk Wiersma [email protected] Senior Credit Analyst Jeroen van Herwaarden [email protected] Credit AnalystCarman Wong [email protected] Head Emerging Markets BondsGrace M.K. Lim [email protected] Emerging Market Bond Analyst
Equity Research & Strategy Team
Sybren Brouwer [email protected] Global Head Equity Research and Head Research Netherlands Daphne Roth [email protected] Head Asia Equity Research, Australia, EM Asia, Latin America Edith Thouin [email protected] Head Equity Theme Research, Materials, Healthcare, UtilitiesRalph Wessels [email protected] Equity Expert Financials, IndustrialsMaurits Heldring [email protected] Equity Expert Consumer Discretionary, IT, Telecoms
Sustainable Development
Solange Rouschop [email protected] Sustainability Manager
Alternative Investments
Olivier Couvreur [email protected] CIO Multimanager, Hedge FundsMarc de Kloe [email protected] Head of Alternatives and FundsOlivier Palasi [email protected] Head Private EquityManuel Hernandez Fernandez [email protected] Property Specialist
Quantitative Analysis and Risk Management
Hans Peters [email protected] Head Investment RiskEmilia Bruera [email protected] Quantitative and Risk AnalystPaul Groenewoud [email protected] Quantitative and Risk Analyst
Investment CommunicationsThis publication is produced by the Global Investment Communications team. If you have questions or comments, contact the team at [email protected].
Contributors
16 September 2014
Disclaimers© Copyright 2014 ABN AMRO Bank N.V. and affiliated companies (“ABN AMRO”), Gustav Mahlerlaan 10, 1082 PP Amsterdam / P.O. box 283, 1000 EA Amsterdam, The Netherlands. All rights reserved. This material was prepared by the Investment Advisory Centre (IAC) of ABN AMRO. It is provided for informational purposes only and does not constitute an offer to sell or a solicitation to buy any security or other financial instrument. While based on information believed to be reliable, no guarantee is given that it is accurate or complete. While we endeavour to update on a reasonable basis the information and opinions contained herein, there may be regulatory, compliance or other reasons that prevent us from doing so. The opinions, forecasts, assumptions, estimates, derived valuations and target price(s) contained in this material are as of the date indicated and are subject to change at any time without prior notice. The investments referred to in this material may not be appropriate or suitable for the specific investment objectives, financial situation, knowledge, experience, or individual needs of recipients and should not be relied upon in substitution for the exercise of independent judgement. ABN AMRO or its officers, directors, employee benefit programs or co-workers, including persons which were involved in preparing or issuing this material, may from time to time hold long- or short-positions in securities, warrants, futures, options, derivatives or other financial instruments referred to in this material. ABN AMRO may offer and render at any time investment banking-, commercial banking-, credit-, advice-, and other services to the issuer of any security referred to in this material. Pursuant to offering and rendering such services, ABN AMRO may come into possession of information not included in this material and ABN AMRO may prior or immediately after publication thereof have acted based on such information. In the past year, ABN AMRO may have acted as lead manager or co-lead manager with regard to a public offering of securities from issuers as mentioned in this material. The stated price of any securities mentioned herein is as of the date indicated and is not a representation that any transaction can be effected at this price. Neither ABN AMRO nor other persons shall be liable for any direct, indirect, special, incidental, consequential, punitive or exemplary damages, including lost profits arising in any way from the information contained in this material. This material is for the use of intended recipients only and the contents may not be reproduced, redistributed, or copied in whole or in part for any purpose without ABN AMRO’s prior express consent. This document is solely intended for dissemination amongst private/retail customers in a PC country. Distribution to private/retail customers in any jurisdiction that would require registration or licensing of the distributor which the distributor does not currently have, is not permitted. Material means all research information contained in any form including but not limited to hard copy, electronic form, presentations, e-mail, SMS or WAP.
US Securities Law ABN AMRO Bank N.V. is not a registered broker-dealer under the U.S. Securities Exchange Act of 1934, as amended (the “1934 Act”) and under applicable state laws in the United States. In addition, ABN AMRO Bank N.V. is not a registered investment adviser under the U.S. Investment Advisers Act of 1940, as amended (the “Advisers Act” and together with the 1934 Act, the “Acts), and under applicable state laws in the United States. Accordingly, absent specific exemption under the Acts, any brokerage and investment advisory services provided by ABN AMRO Bank N.V., including (without limitation) the products and services described herein are not intended for U.S. persons. Neither this document, nor any copy thereof may be sent to or taken into the United States or distributed in the United States or to a US person.
Other jurisdictionsWithout limiting the generality of the foregoing, the offering, sale and/or distribution of the products or services described herein is not intended in any jurisdiction to any person to whom it is unlawful to make such an offer, sale and/or distribution. Persons into whose possession this docu-ment or any copy thereof may come, must inform themselves about, and observe, any legal restrictions on the distribution of this document and the offering, sale and/or distribution of the products and services described herein. ABN AMRO can not be held responsible for any damages or losses that occur from transactions and/or services in defiance with the restrictions aforementioned.
Sustainability Indicator Disclaimer ABN AMRO Bank N.V. has taken all reasonable care to ensure the indicators are reliable, however, the information is unaudited and subject to amendment. ABN AMRO Bank is not liable for any damage that constitute from the (direct or indirect) use of the indicators. The indicators alone do not constitute a recommendation in relation to a specific company or an offer to buy or sell investments. It should be noted that the indicators represent an opinion at a specific period of time considering a number of different sustainability considerations. The sustainability indicator is only an indication regarding the sustainability of a company within its own sector.
Company disclosures ABN AMRO may beneficially hold a major shareholding or a significant financial interest of the debt of this company. ABN AMRO currently main-tains a market in the security of this company and otherwise purchases and sells securities of this company as principal. ABN AMRO has received compensation for investment banking services from this company, its subsidiaries or affiliates during the previous 12 months. All disclosures made herein refer to ABN AMRO and its affiliates, including ABN AMRO Incorporated, which is regulated in the United States by the NYSE, NASD and SIPC.
Personal disclosures The information in this opinion is not intended as individual investment advice or as a recommendation to invest in certain investments products. The opinion is based on investment research of ABN AMRO IAC. The analysts have no personal interest in the companies included in this publi-cation’. Their remuneration for this work is not, was not and will not be related directly or indirectly to the specific recommendations or views expressed in this opinion.
16 September 2014
EuropeABN AMRO MeesPiersonAmsterdamRico [email protected]
ABN AMRO Private Banking Antwerpen - BerchemTom Van [email protected]
ABN AMRO Private Banking LuxembourgNicolas [email protected]
Bethmann Bank AGFrankfurtBernhard [email protected]
Banque Neuflize OBC S.A.ParisWilfrid [email protected]
ABN AMRO Private Banking JerseyStephan [email protected]
ABN AMRO Private BankingGuernseyAndrew [email protected]
Middle EastABN AMRO Private Banking Dubai (DIFC)Saaish [email protected]
AsiaABN AMRO Private Banking Hong KongWilliam [email protected]
ABN AMRO Private Banking SingaporePeter [email protected]
Investment Advisory Centres
The Investment Advisory Centres are built around the work of investment specialists who provide financial advice and support for your key invest-ment decisions. These specialists are assisted by a dedicated team of research & strategy analysts who provide in-depth coverage of the major financial markets and investment categories – currencies, equities, bonds and alternative investments. For all enquiries, please contact one of the branches above. If you are interested in our Private Banking iPad Research app, please send an email to [email protected].
www.abnamroprivatebanking.com