what motivates marketing innovation and whether … · what motivates marketing innovation and...
TRANSCRIPT
What Motivates Marketing Innovation and
Whether Marketing Innovation Varies across Industry Sectors
Shu Wang
Thesis submitted to the Faculty of Graduate and
Postdoctoral Studies in partial fulfillment of the
requirements for the master degree in Master of Science in Management
Telfer School of Management
University of Ottawa
© Shu Wang, Ottawa, Canada, 2015
ii
Abstract
Innovativeness is one of the fundamental instruments of growth strategies that provide companies with a
competitive edge. Only a few recent studies have examined marketing innovation and the factors that
might encourage its adoption. This study investigates the factors that motivate marketing innovation and
examines whether the occurrence of marketing innovation varies across industry sectors. This study uses
data from surveys and a nationwide census conducted by Statistics Canada. They include: the Survey of
Innovation and Business Strategies (SIBS) 2009, the Survey of Innovation and Business Strategies (SIBS)
2012, the Business Registry (BR) and the General Index of Financial Information (GIFI). Multilevel
(random-intercept) logistic regression modelling is employed. The results show that if a firm has a
strategic focus on new marketing practices, maintains marketing within its enterprise, acquires or expands
marketing capacity, has competitor and customer orientations, and adopts advanced technology then it is
more likely to carry out marketing innovation. However, breadth of long-term strategic objectives and
competitive intensity do not have significant impacts on marketing innovation. In addition, product
innovation and organizational innovation occur simultaneously with marketing innovation, but process
innovation may not. Lastly, the occurrence of marketing innovation is found to vary across industry
sectors. The theoretical and empirical implications of the results are discussed within this study.
iii
Table of Contents
1. Introduction ............................................................................................................................................... 1
2. Literature review ....................................................................................................................................... 2
2.1. Marketing innovation ....................................................................................................................... 11
2.2. Competition, customer and competitor orientations and innovation ............................................... 16
2.3. Market orientation and innovation in global economic crises ......................................................... 18
2.4. Business strategy, technology adoption, innovation and marketing capabilities ............................. 20
2.5. Innovation and marketing in a value chain ...................................................................................... 21
2.6. Interrelation of marketing innovation and other innovations ........................................................... 23
2.7. Industry distinctions in marketing.................................................................................................... 24
3. Theoretical framework and hypotheses .................................................................................................. 25
3.1 Theoretical framework ...................................................................................................................... 25
3.2. Hypotheses ....................................................................................................................................... 26
4. Data source and methodology ................................................................................................................. 31
4.1. Data sources ..................................................................................................................................... 31
4.2. Multilevel (random intercept) logistic regression ............................................................................ 32
5. Variable description ................................................................................................................................ 34
5.1. Dependent variable .......................................................................................................................... 34
5.2. Independent variables ...................................................................................................................... 35
5.3. Control variables .............................................................................................................................. 37
5.4. Second-level variable ....................................................................................................................... 37
6. Results ..................................................................................................................................................... 46
6.1. Assumptions ..................................................................................................................................... 46
6.2. Regression results ............................................................................................................................ 49
7. Discussion ............................................................................................................................................... 52
8. Contribution to scholarship ..................................................................................................................... 55
9. Applied implications ............................................................................................................................... 58
10. Limitations and future research directions ............................................................................................ 60
Reference .................................................................................................................................................... 62
Appendix ..................................................................................................................................................... 69
1
1. Introduction
Innovativeness is one of the fundamental instruments of growth strategies that provide companies with a
competitive edge (Gunday, Ulusoy, Kilic, & Alpkan, 2011). A firm’s innovativeness can be described in
terms of product, process, organizational, and marketing innovation upon Oslo Manual (OECD, 2005).
Among innovation studies that evolved around these four themes, most of them have focused primarily
on product, process and organizational innovation (e.g. Cleff & Rennings, 1999; Danneels, 2002;
Damanpour, 1991; Kimberly & Evanisko, 1981; Subramanian & Nilakanta, 1996), but only a few recent
studies have examined marketing innovation and have shown its relevance to firms’ performance,
strategies, and competitiveness (e.g. Aghion, Bloom, Blundell, Griffith, & Howitt, 2002; Cahill, 1998;
Camisón & Villar-López, 2011; Ettlie, Bridges, & O'keefe, 1984; Halpern, 2010; Nickell, 1996). One
possible explanation for this lack of research on marketing innovation may be linked to the fact that it was
not part of the original definition of innovative activities articulated in earlier versions of the OSLO
Manual, which is highly regarded by researchers and policy makers and is widely used to guide data
collection across countries. Only in 2005 was marketing innovation included in the OSLO manual’s
definition of innovation and this has precipitated data collection on marketing innovation in Europe,
Canada and elsewhere.
On the other hand, innovation has been given little attention in the dialogue of strategic marketing (Day &
Wensley, 1983). However, marketing capability is one of the contributors of the commercial success of
the products and services marketed by firms (Day, 1994; Dutta, Narasimhan, & Rajiv, 1999; Hooley et
al., 1999; O'Driscoll, 2000), and plays an active role in understanding the environment by collecting,
disseminating, analyzing and storing information (Sinkula, 1994). Innovation, marketing capabilities and
firms’ competitive advantage are found to be strongly interrelated (Weerawardena, 2003). While
marketing plays a key role in the competitive advantage process (Weerawardena, 2003), innovation is the
primary role of marketing within the domain of competitive strategy (Kerin, 1992). Marketing capability
not only influences the innovation development stage, but also facilitates the market success of
innovations (Weerawardena, 2003).
Since marketing innovation was officially included in the OSLO manual, data collection regarding
marketing innovation has been undertaken by many national statistical agencies, and researchers have
begun to examine the role of marketing innovation on various aspects of firms. However, given the
limited available data, it is not surprising that the academic studies on this particular issue are relatively
new and sparse. In addition, most of the present empirical studies of marketing innovation have been
2
conducted using data from European and Asian countries. Based on our literature search and discussion
with Canadian policy makers, academic research on marketing innovation in Canada and even the United
States is virtually nonexistent. An obvious gap exists in both of the theoretical and empirical literature
which needs to be filled.
The goal of this thesis is to initiate research on this very important dimension of corporate innovation
among Canadian firms. The study investigates the factors that motivate marketing innovation in Canadian
firms, and examines whether the occurrence of marketing innovation varies across industry sectors. In this
paper, a theoretical model of the relationship between marketing innovation and its driving factors is
proposed. The data to test this model is from Statistics Canada. Specific issues that will be addressed in
this study pertain to the following questions: (1) What factors motivate the introduction of marketing
innovation? (2) Does the introduction of marketing innovations vary across Canadian industry sectors?
The results will provide a portrait of the nature and extent of marketing innovations undertaken by
Canadian enterprises and highlight the factors that motivate the enterprises to carry out marketing
innovation. The results will also demonstrate whether the occurrence of marketing innovation varies
across different industry sectors.
This study will contribute to the emerging literature on marketing innovation in three ways. Firstly, it
extends the existing literature to Canadian data, investigating the profile of Canadian companies
conducting marketing innovation and the factors that drive marketing innovation. Secondly, the
theoretical framework proposed by this study provides new perspectives (i.e. orientations, strategies and
value chain) to investigate marketing innovation. Thirdly, this study takes the initiatives to examine
whether the occurrence of marketing innovation could be different upon industry level using a multilevel
logistic regression model. This study thereby will enhance theoretical understanding of adoption of
marketing innovation and its variance across Canadian industry sectors, and provide practical results that
could guide government policies and firm strategies.
2. Literature review
Early in 1960, Levitt (1960) raised the issue that “while so many of exciting product innovations come
from the laboratories of giant corporations, the same companies produce so little marketing innovation”,
and most marketing innovations “have been unsolicited, unplanned, accidental, and have originated from
outside the central core of the industries in which they have ultimately prospered”. To call attention to
innovation in marketing, Levitt (1960) pointed out that when a company becomes more successful in
3
producing new and more efficient things, it gets increasingly important to think more creatively and
imaginatively about new marketing methods, since “if marketing lags seriously, the profit produced by
new things could be dissipated by the inefficiency of old marketing methods”. Clemmer (1998) also
posited that marketing innovation should be taken as the key success for organization in business
environment, particularly in strategic planning for future growth and for developing new products and
services (Clemmer, 1998).
In spite of the light shed by early research, a construct of marketing innovation that can receive
worldwide acceptance was not developed until 2005 by The Organization for Economic Co-operation and
Development (OECD). Before the edition of the 2005 Oslo Manual, though marketing innovation had
already been a concept familiar to firms in some countries and was included in some innovation surveys,
its definition was generally not as well established as those for products and processes innovations
(OECD, 2005). Not only being a missing topic in the innovation literature, marketing innovation is barely
discussed by marketing theorists either, except that Hanvanich, Dröge, and Calantone (2003) constructed
marketing innovation as the firm’s ability to discover existing but hidden demand or to create totally new
demand through the three core marketing processes, which refers to product development management,
customer relationship management and supply chain management, a concept yet not widely accepted by
later researchers. Besides, Chen (2006) made an attempt to examine marketing innovation from an
economist’s perspective, measuring marketing innovation as either γ , a new marketing program or
technology that allows a firm to acquire consumer information (target consumers) more effectively and to
charge individualized prices, or σ, a new trading method that reduces consumer transaction costs, as a
dynamic duopoly model.
OECD (2005) defines marketing innovation as “the application of a new marketing method for a product
or service accounting for significant alterations to any of the following elements: product design or
packaging, placement, promotion or price establishing criteria”, a definition in line with the widely-
accepted marketing mix of 4P - Product, Price, Promotion, and Place (McCarthy & Perreault, 1993).
The 2005 Oslo Manual describes the goal of marketing innovations as “aimed at better addressing
customer needs, opening up new markets, or newly positioning a firm’s product on the market, with the
objective of increasing the firm’s sales” (OECD, 2005). “The distinguishing feature of a marketing
innovation compared to other changes in a firm’s marketing instruments is the implementation of a
marketing method not previously used by the firm. It must be part of a new marketing concept or strategy
that represents a significant departure from the firm’s existing marketing methods” (OECD, 2005). The
2005 Oslo Manual further explains the four dimensions of marketing innovation as followings:
4
“Marketing innovations include significant changes in product design that are part of a new
marketing concept. Product design changes here refer to changes in product form and appearance
that do not alter the product’s functional or user characteristics. They also include changes in the
packaging of products such as foods, beverages and detergents, where packaging is the main
determinant of the product’s appearance. An example of a marketing innovation in product design
is the implementation of a significant change in the design of a furniture line to give it a new look
and broaden its appeal. Innovations in product design can also include the introduction of
significant changes in the form, appearance or taste of food or beverage products, such as the
introduction of new flavours for a food product in order to target a new customer segment. An
example of a marketing innovation in packaging is the use of a fundamentally new bottle design
for a body lotion, which is intended to give the product a distinctive look and appeal to a new
market segment” (OECD, 2005).
“New marketing methods in product placement primarily involve the introduction of new sales
channels. Sales channels here refer to the methods used to sell goods and services to customers,
and not logistics methods (transport, storing and handling of products) which deal mainly with
efficiency. Examples of marketing innovations in product placement are the introduction for the
first time of a franchising system, of direct selling or exclusive retailing, and of product licensing.
Innovations in product placement can also involve the use of new concepts for the presentation of
products. An example is the introduction of salesrooms for furniture that are redesigned according
to themes, allowing customers to view products in fully decorated rooms” (OECD, 2005).
“New marketing methods in product promotion involve the use of new concepts for promoting a
firm’s goods and services. For example, the first use of a significantly different media or
technique – such as product placement in movies or television programmes, or the use of
celebrity endorsements – is a marketing innovation. Another example is branding, such as the
development and introduction of a fundamentally new brand symbol (as distinguished from a
regular update of the brand’s appearance) which is intended to position the firm’s product on a
new market or give the product a new image. The introduction of a personalised information
system, e.g. obtained from loyalty cards, to tailor the presentation of products to the specific
needs of individual customers can also be considered a marketing innovation” (OECD, 2005).
5
“Innovations in pricing involve the use of new pricing strategies to market the firm’s goods or
services. Examples are the first use of a new method for varying the price of a good or service
according to demand (e.g. when demand is low, the price is low) or the introduction of a new
method which allows customers to choose desired product specifications on the firm’s Web site
and then see the price for the specified product. New pricing methods whose sole purpose is to
differentiate prices by customer segments are not considered innovations” (OECD, 2005).
“Seasonal, regular and other routine changes in marketing instruments are generally not
marketing innovations. For such changes to be marketing innovations, they must involve
marketing methods not previously used by the firm. For example, a significant change in a
product’s design or packaging that is based on a marketing concept that has already been used by
the firm for other products is not a marketing innovation, nor is the use of existing marketing
methods to target a new geographical market or a new market segment (e.g. socio-demographic
group of clients). Why introduce is important to know 2005 background” (OECD, 2005).
Three main streams of marketing innovation studies are found in the extant literature to be consistent with
this definition. One stream examines the relationship between marketing innovation and firms’
performance (Camisón & Villar-López, 2011; Kijek, 2013; Naidoo, 2010); the other attempts to
understand the characteristics and features of firms that adopted marketing innovation (Kijek, 2013;
Liqin, Guangya, & Koos, 2010; Medrano-Sáez & Olarte-Pascual, 2012); and the third stream examines
the relationship between marketing innovation and other innovations (Kijek, 2013; Schubert, 2010). The
literature search turned up ten papers on marketing innovation that represent the key studies of marketing
innovation stream under the OECD (2005) definition. Among them, only one paper adopted a qualitative
approach to examine the relationship between marketing innovation and sustainable competitive
advantage (SCA) through a case study of the Huawei Technologies Co. Ltd in China, and concluded that
“marketing innovation had the strong potential to lead quickly to SCA” (Liqin et al., 2010). The
remaining nine papers have empirically examined marketing innovation in regard to its antecedents, effect
on performance and interaction with other types of innovations respectively using data from European
countries (e.g. Germany, Spain, Chile and Portugal), China and India. Details of these empirically studies
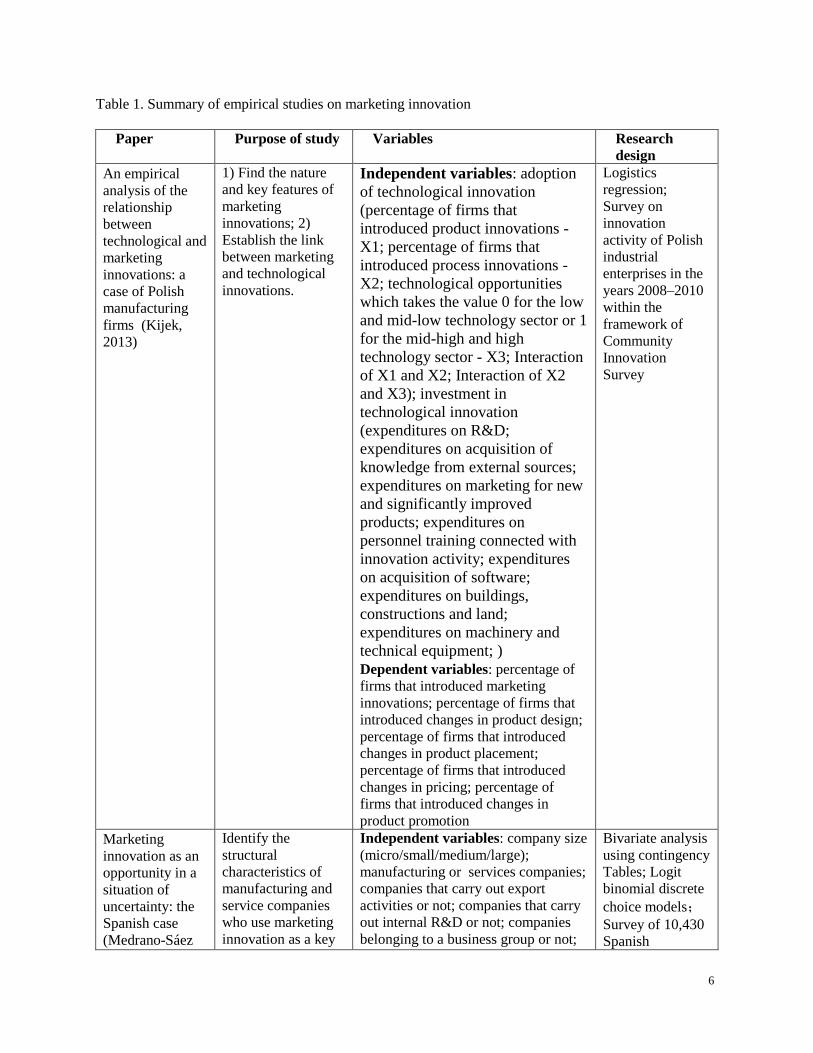
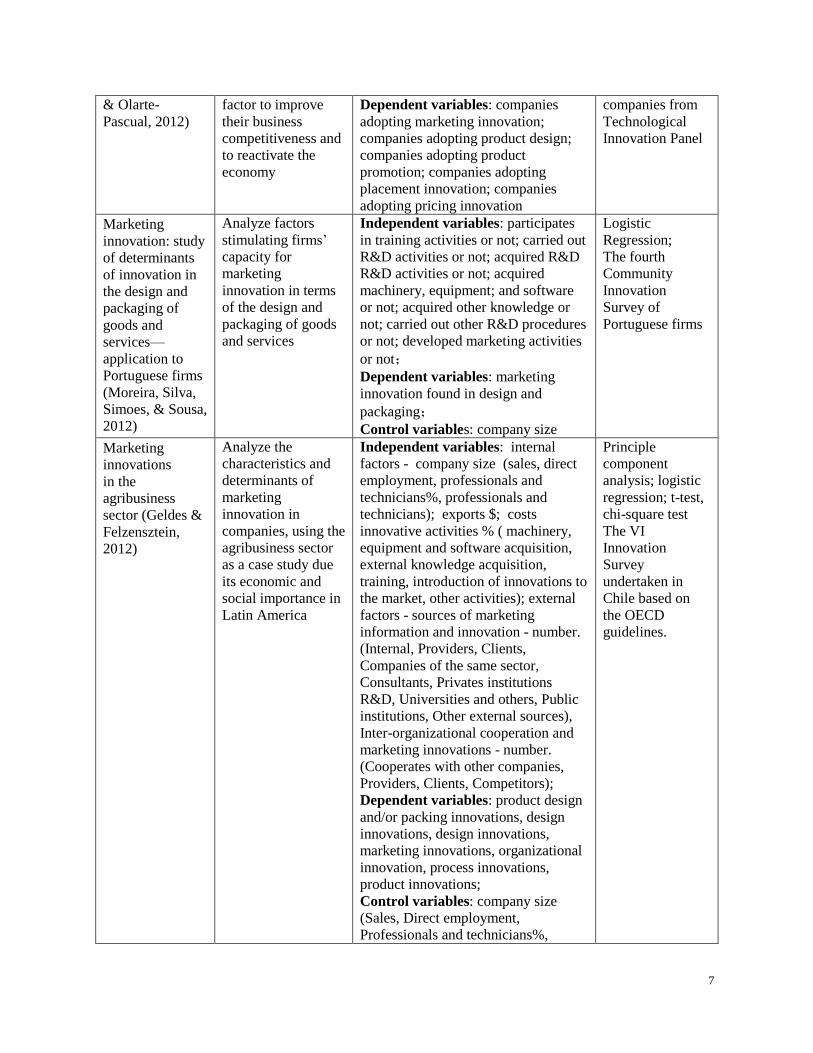
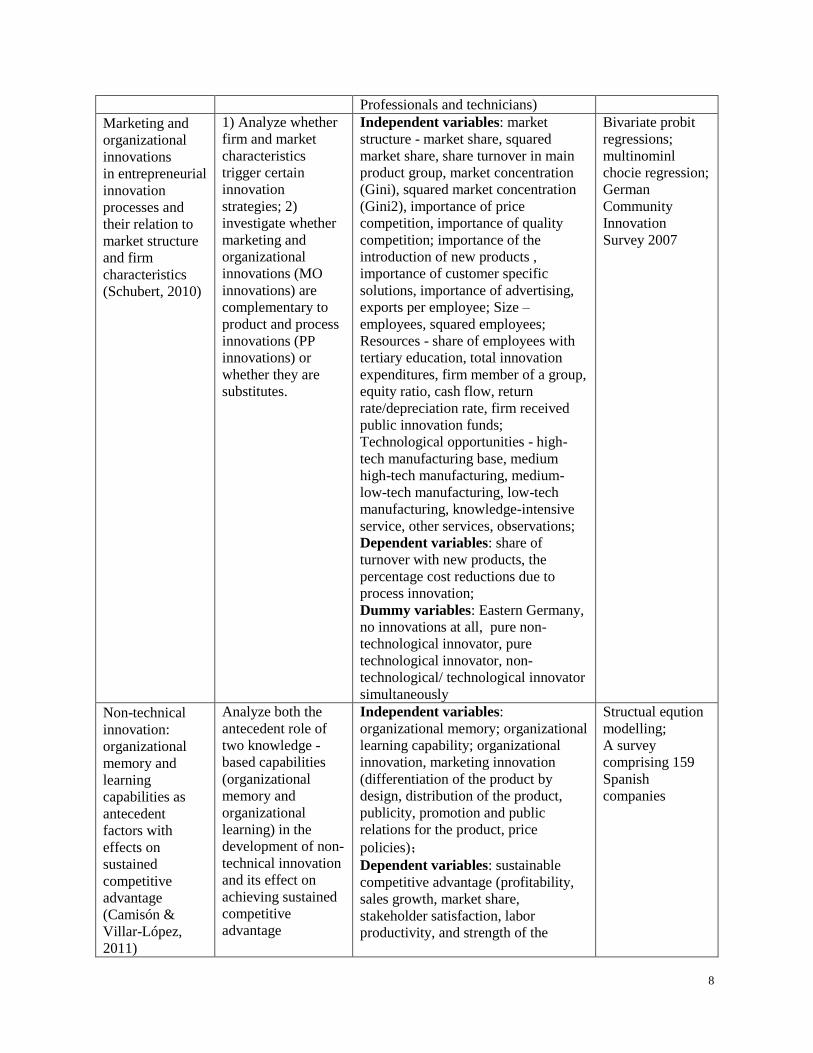
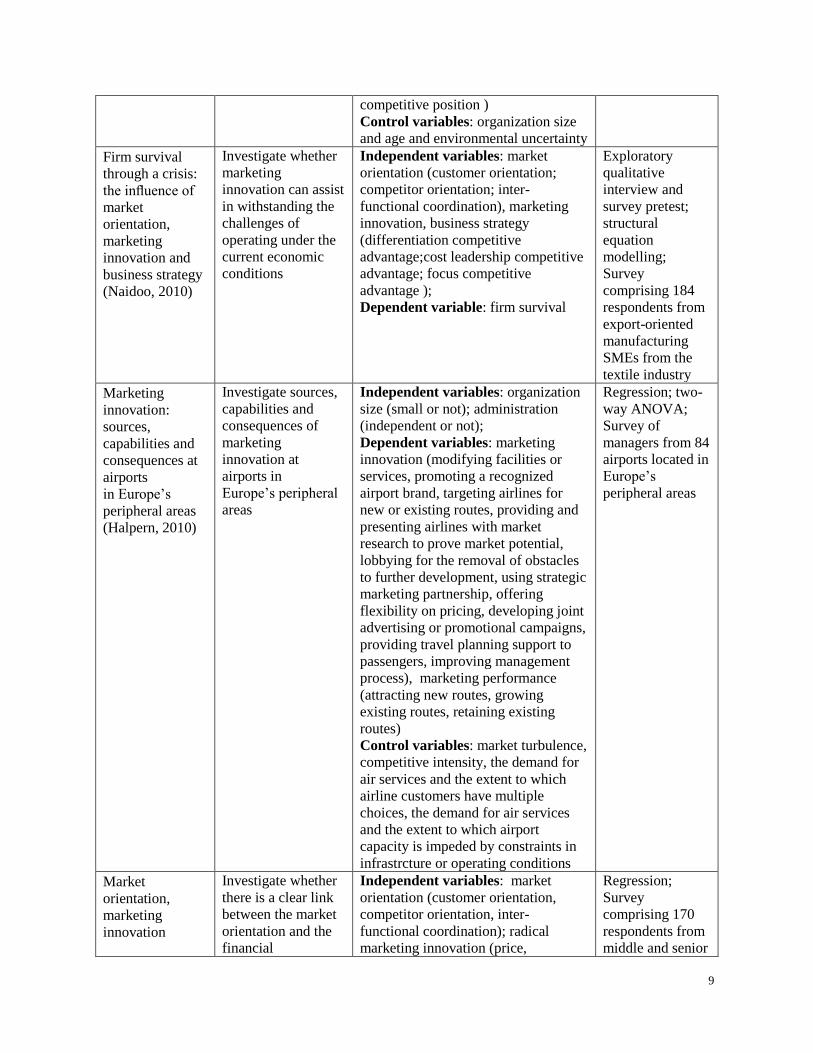
are summarized in the Tables below. Table 1 provides a general overview of key marketing innovation
studies by outlining the research purpose, variables used and research design of each study. Table 2 offers
a more detailed discussion of the findings of the key studies. The synthesis of this stream of research will
also provide the building block for the conceptual model and analytical techniques used in this proposal.
6
Table 1. Summary of empirical studies on marketing innovation
Paper Purpose of study Variables Research
design
An empirical
analysis of the
relationship
between
technological and
marketing
innovations: a
case of Polish
manufacturing
firms (Kijek,
2013)
1) Find the nature
and key features of
marketing
innovations; 2)
Establish the link
between marketing
and technological
innovations.
Independent variables: adoption
of technological innovation
(percentage of firms that
introduced product innovations -
X1; percentage of firms that
introduced process innovations -
X2; technological opportunities
which takes the value 0 for the low
and mid-low technology sector or 1
for the mid-high and high
technology sector - X3; Interaction
of X1 and X2; Interaction of X2
and X3); investment in
technological innovation
(expenditures on R&D;
expenditures on acquisition of
knowledge from external sources;
expenditures on marketing for new
and significantly improved
products; expenditures on
personnel training connected with
innovation activity; expenditures
on acquisition of software;
expenditures on buildings,
constructions and land;
expenditures on machinery and
technical equipment; )
Dependent variables: percentage of
firms that introduced marketing
innovations; percentage of firms that
introduced changes in product design;
percentage of firms that introduced
changes in product placement;
percentage of firms that introduced
changes in pricing; percentage of
firms that introduced changes in
product promotion
Logistics
regression;
Survey on
innovation
activity of Polish
industrial
enterprises in the
years 2008–2010
within the
framework of
Community
Innovation
Survey
Marketing
innovation as an
opportunity in a
situation of
uncertainty: the
Spanish case
(Medrano-Sáez
Identify the
structural
characteristics of
manufacturing and
service companies
who use marketing
innovation as a key
Independent variables: company size
(micro/small/medium/large);
manufacturing or services companies;
companies that carry out export
activities or not; companies that carry
out internal R&D or not; companies
belonging to a business group or not;
Bivariate analysis
using contingency
Tables; Logit
binomial discrete
choice models;
Survey of 10,430
Spanish
7
& Olarte-
Pascual, 2012)
factor to improve
their business
competitiveness and
to reactivate the
economy
Dependent variables: companies
adopting marketing innovation;
companies adopting product design;
companies adopting product
promotion; companies adopting
placement innovation; companies
adopting pricing innovation
companies from
Technological
Innovation Panel
Marketing
innovation: study
of determinants
of innovation in
the design and
packaging of
goods and
services—
application to
Portuguese firms
(Moreira, Silva,
Simoes, & Sousa,
2012)
Analyze factors
stimulating firms’
capacity for
marketing
innovation in terms
of the design and
packaging of goods
and services
Independent variables: participates
in training activities or not; carried out
R&D activities or not; acquired R&D
R&D activities or not; acquired
machinery, equipment; and software
or not; acquired other knowledge or
not; carried out other R&D procedures
or not; developed marketing activities
or not;
Dependent variables: marketing
innovation found in design and
packaging;
Control variables: company size
Logistic
Regression;
The fourth
Community
Innovation
Survey of
Portuguese firms
Marketing
innovations
in the
agribusiness
sector (Geldes &
Felzensztein,
2012)
Analyze the
characteristics and
determinants of
marketing
innovation in
companies, using the
agribusiness sector
as a case study due
its economic and
social importance in
Latin America
Independent variables: internal
factors - company size (sales, direct
employment, professionals and
technicians%, professionals and
technicians); exports $; costs
innovative activities % ( machinery,
equipment and software acquisition,
external knowledge acquisition,
training, introduction of innovations to
the market, other activities); external
factors - sources of marketing
information and innovation - number.
(Internal, Providers, Clients,
Companies of the same sector,
Consultants, Privates institutions
R&D, Universities and others, Public
institutions, Other external sources),
Inter-organizational cooperation and
marketing innovations - number.
(Cooperates with other companies,
Providers, Clients, Competitors);
Dependent variables: product design
and/or packing innovations, design
innovations, design innovations,
marketing innovations, organizational
innovation, process innovations,
product innovations;
Control variables: company size
(Sales, Direct employment,
Professionals and technicians%,
Principle
component
analysis; logistic
regression; t-test,
chi-square test
The VI
Innovation
Survey
undertaken in
Chile based on
the OECD
guidelines.
8
Professionals and technicians)
Marketing and
organizational
innovations
in entrepreneurial
innovation
processes and
their relation to
market structure
and firm
characteristics
(Schubert, 2010)
1) Analyze whether
firm and market
characteristics
trigger certain
innovation
strategies; 2)
investigate whether
marketing and
organizational
innovations (MO
innovations) are
complementary to
product and process
innovations (PP
innovations) or
whether they are
substitutes.
Independent variables: market
structure - market share, squared
market share, share turnover in main
product group, market concentration
(Gini), squared market concentration
(Gini2), importance of price
competition, importance of quality
competition; importance of the
introduction of new products ,
importance of customer specific
solutions, importance of advertising,
exports per employee; Size –
employees, squared employees;
Resources - share of employees with
tertiary education, total innovation
expenditures, firm member of a group,
equity ratio, cash flow, return
rate/depreciation rate, firm received
public innovation funds;
Technological opportunities - high-
tech manufacturing base, medium
high-tech manufacturing, medium-
low-tech manufacturing, low-tech
manufacturing, knowledge-intensive
service, other services, observations;
Dependent variables: share of
turnover with new products, the
percentage cost reductions due to
process innovation;
Dummy variables: Eastern Germany,
no innovations at all, pure non-
technological innovator, pure
technological innovator, non-
technological/ technological innovator
simultaneously
Bivariate probit
regressions;
multinominl
chocie regression;
German
Community
Innovation
Survey 2007
Non-technical
innovation:
organizational
memory and
learning
capabilities as
antecedent
factors with
effects on
sustained
competitive
advantage
(Camisón &
Villar-López,
2011)
Analyze both the
antecedent role of
two knowledge -
based capabilities
(organizational
memory and
organizational
learning) in the
development of non-
technical innovation
and its effect on
achieving sustained
competitive
advantage
Independent variables:
organizational memory; organizational
learning capability; organizational
innovation, marketing innovation
(differentiation of the product by
design, distribution of the product,
publicity, promotion and public
relations for the product, price
policies);
Dependent variables: sustainable
competitive advantage (profitability,
sales growth, market share,
stakeholder satisfaction, labor
productivity, and strength of the
Structual eqution
modelling;
A survey
comprising 159
Spanish
companies
9
competitive position )
Control variables: organization size
and age and environmental uncertainty
Firm survival
through a crisis:
the influence of
market
orientation,
marketing
innovation and
business strategy
(Naidoo, 2010)
Investigate whether
marketing
innovation can assist
in withstanding the
challenges of
operating under the
current economic
conditions
Independent variables: market
orientation (customer orientation;
competitor orientation; inter-
functional coordination), marketing
innovation, business strategy
(differentiation competitive
advantage;cost leadership competitive
advantage; focus competitive
advantage );
Dependent variable: firm survival
Exploratory
qualitative
interview and
survey pretest;
structural
equation
modelling;
Survey
comprising 184
respondents from
export-oriented
manufacturing
SMEs from the
textile industry
Marketing
innovation:
sources,
capabilities and
consequences at
airports
in Europe’s
peripheral areas
(Halpern, 2010)
Investigate sources,
capabilities and
consequences of
marketing
innovation at
airports in
Europe’s peripheral
areas
Independent variables: organization
size (small or not); administration
(independent or not);
Dependent variables: marketing
innovation (modifying facilities or
services, promoting a recognized
airport brand, targeting airlines for
new or existing routes, providing and
presenting airlines with market
research to prove market potential,
lobbying for the removal of obstacles
to further development, using strategic
marketing partnership, offering
flexibility on pricing, developing joint
advertising or promotional campaigns,
providing travel planning support to
passengers, improving management
process), marketing performance
(attracting new routes, growing
existing routes, retaining existing
routes)
Control variables: market turbulence,
competitive intensity, the demand for
air services and the extent to which
airline customers have multiple
choices, the demand for air services
and the extent to which airport
capacity is impeded by constraints in
infrastrcture or operating conditions
Regression; two-
way ANOVA;
Survey of
managers from 84
airports located in
Europe’s
peripheral areas
Market
orientation,
marketing
innovation
Investigate whether
there is a clear link
between the market
orientation and the
financial
Independent variables: market
orientation (customer orientation,
competitor orientation, inter-
functional coordination); radical
marketing innovation (price,
Regression;
Survey
comprising 170
respondents from
middle and senior
10
as performance
drivers:
extending the
paradigm
(Shergill &
Nargundkar,
2005)
performance of
Indian companies
promotion, place, product);
Dependent variables: performance of
firms (market Share, profit, sales
growth);
Control variables: firm-specific
performance (industry type, listing
status, age of company, ownership
status )
executives from
Indian companies
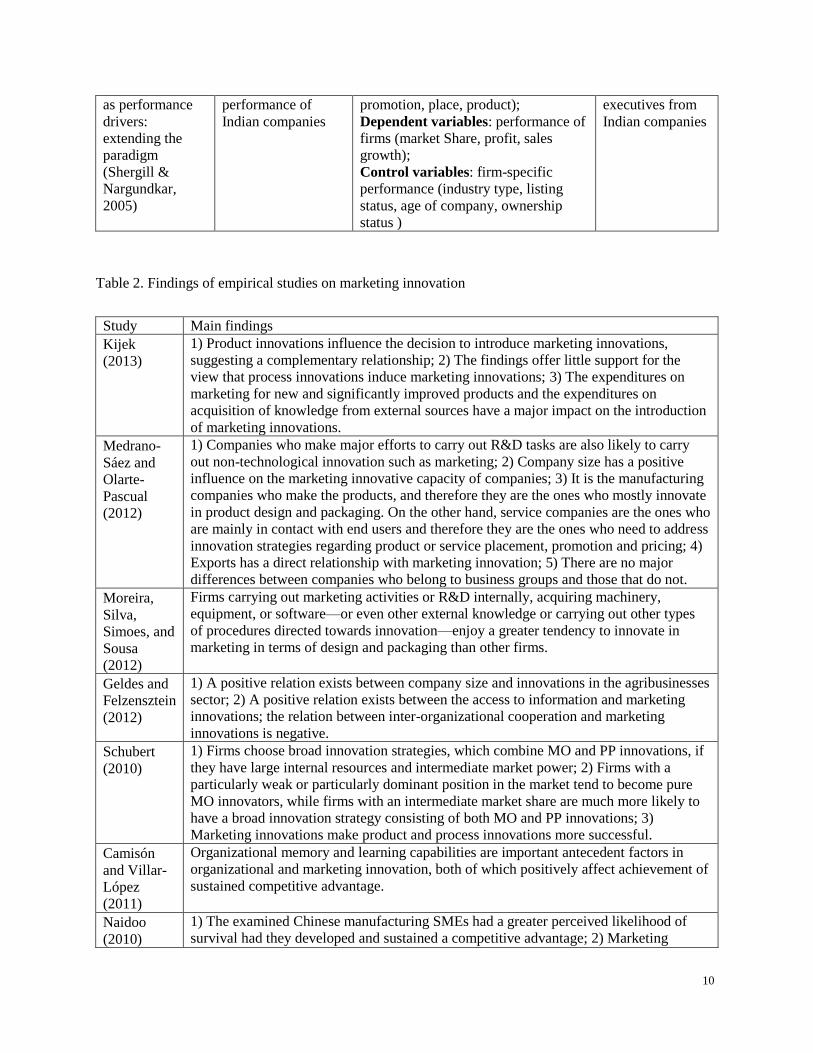
Table 2. Findings of empirical studies on marketing innovation
Study Main findings
Kijek
(2013)
1) Product innovations influence the decision to introduce marketing innovations,
suggesting a complementary relationship; 2) The findings offer little support for the
view that process innovations induce marketing innovations; 3) The expenditures on
marketing for new and significantly improved products and the expenditures on
acquisition of knowledge from external sources have a major impact on the introduction
of marketing innovations.
Medrano-
Sáez and
Olarte-
Pascual
(2012)
1) Companies who make major efforts to carry out R&D tasks are also likely to carry
out non-technological innovation such as marketing; 2) Company size has a positive
influence on the marketing innovative capacity of companies; 3) It is the manufacturing
companies who make the products, and therefore they are the ones who mostly innovate
in product design and packaging. On the other hand, service companies are the ones who
are mainly in contact with end users and therefore they are the ones who need to address
innovation strategies regarding product or service placement, promotion and pricing; 4)
Exports has a direct relationship with marketing innovation; 5) There are no major
differences between companies who belong to business groups and those that do not.
Moreira,
Silva,
Simoes, and
Sousa
(2012)
Firms carrying out marketing activities or R&D internally, acquiring machinery,
equipment, or software—or even other external knowledge or carrying out other types
of procedures directed towards innovation—enjoy a greater tendency to innovate in
marketing in terms of design and packaging than other firms.
Geldes and
Felzensztein
(2012)
1) A positive relation exists between company size and innovations in the agribusinesses
sector; 2) A positive relation exists between the access to information and marketing
innovations; the relation between inter-organizational cooperation and marketing
innovations is negative.
Schubert
(2010)
1) Firms choose broad innovation strategies, which combine MO and PP innovations, if
they have large internal resources and intermediate market power; 2) Firms with a
particularly weak or particularly dominant position in the market tend to become pure
MO innovators, while firms with an intermediate market share are much more likely to
have a broad innovation strategy consisting of both MO and PP innovations; 3)
Marketing innovations make product and process innovations more successful.
Camisón
and Villar-
López
(2011)
Organizational memory and learning capabilities are important antecedent factors in
organizational and marketing innovation, both of which positively affect achievement of
sustained competitive advantage.
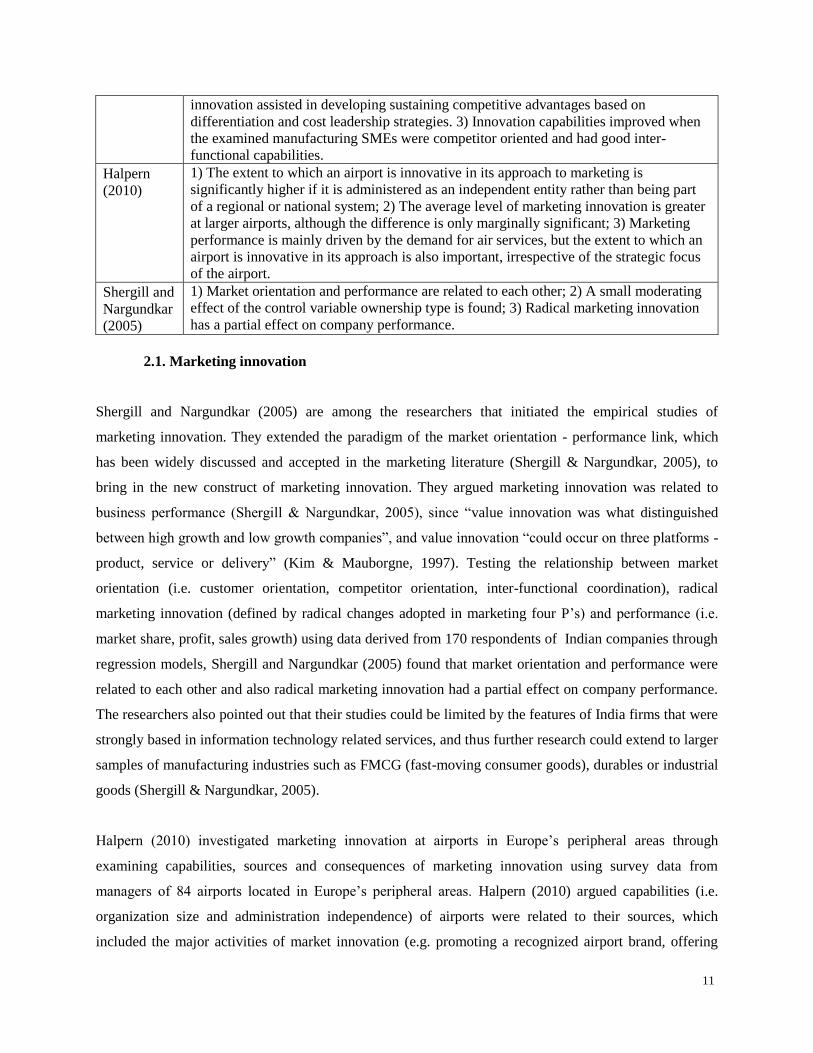
Naidoo
(2010)
1) The examined Chinese manufacturing SMEs had a greater perceived likelihood of
survival had they developed and sustained a competitive advantage; 2) Marketing
11
innovation assisted in developing sustaining competitive advantages based on
differentiation and cost leadership strategies. 3) Innovation capabilities improved when
the examined manufacturing SMEs were competitor oriented and had good inter-
functional capabilities.
Halpern
(2010)
1) The extent to which an airport is innovative in its approach to marketing is
significantly higher if it is administered as an independent entity rather than being part
of a regional or national system; 2) The average level of marketing innovation is greater
at larger airports, although the difference is only marginally significant; 3) Marketing
performance is mainly driven by the demand for air services, but the extent to which an
airport is innovative in its approach is also important, irrespective of the strategic focus
of the airport.
Shergill and
Nargundkar
(2005)
1) Market orientation and performance are related to each other; 2) A small moderating
effect of the control variable ownership type is found; 3) Radical marketing innovation
has a partial effect on company performance.
2.1. Marketing innovation
Shergill and Nargundkar (2005) are among the researchers that initiated the empirical studies of
marketing innovation. They extended the paradigm of the market orientation - performance link, which
has been widely discussed and accepted in the marketing literature (Shergill & Nargundkar, 2005), to
bring in the new construct of marketing innovation. They argued marketing innovation was related to
business performance (Shergill & Nargundkar, 2005), since “value innovation was what distinguished
between high growth and low growth companies”, and value innovation “could occur on three platforms -
product, service or delivery” (Kim & Mauborgne, 1997). Testing the relationship between market
orientation (i.e. customer orientation, competitor orientation, inter-functional coordination), radical
marketing innovation (defined by radical changes adopted in marketing four P’s) and performance (i.e.
market share, profit, sales growth) using data derived from 170 respondents of Indian companies through
regression models, Shergill and Nargundkar (2005) found that market orientation and performance were
related to each other and also radical marketing innovation had a partial effect on company performance.
The researchers also pointed out that their studies could be limited by the features of India firms that were
strongly based in information technology related services, and thus further research could extend to larger
samples of manufacturing industries such as FMCG (fast-moving consumer goods), durables or industrial
goods (Shergill & Nargundkar, 2005).
Halpern (2010) investigated marketing innovation at airports in Europe’s peripheral areas through
examining capabilities, sources and consequences of marketing innovation using survey data from
managers of 84 airports located in Europe’s peripheral areas. Halpern (2010) argued capabilities (i.e.
organization size and administration independence) of airports were related to their sources, which
included the major activities of market innovation (e.g. promoting a recognized airport brand, offering
12
flexibility on pricing, developing joint advertising or promotional campaign), and having these sources
could enhance market performance (e.g. attracting new routes, growing existing routes, retaining existing
routes) of airports as the consequences of marketing innovation activities (Halpern, 2010). Deploying
regression and ANOVA analysis, Halpern (2010) found that airport administering as an independent
entity rather than being part of a regional or national system and larger organization size of ariport could
be the factors associated with higher marketing innovation. Moreover, ten sources, including targeting
specific airlines, modifying facilities or services, developing strategic marketing partnership, offering
flexibility in pricing, lobbying for the removal of obstacles to future development and promoting a
recognized brand, were found important to increase performance (Halpern, 2010). Halpern (2010) also
pointed out that “market performance was mainly driven by the demand for air services (which served as
a control variable in the research)”, but “the extent to which an airport is innovative in its approach was
also important”.
Naidoo (2010) examined whether marketing innovation could help Chinese manufacturing small and
medium enterprises (SMEs) withstand the challenges of operating under the recent global economic crisis
(i.e. late 2007 and the second quarter of 2009). In this research, Naidoo (2010) argued that market
orientation might stimulate the adoption of marketing innovation, which in turn would enhance firms’
competitive advantage, and thus help firms survive the economic crisis. To test the relevant hypotheses,
Naidoo (2010) developed a conceptual model linking market orientation (i.e. customer orientation,
competitor orientation and inter-functional coordination) to marketing innovation, competitive advantage
(i.e. differentiation, cost leadership and focus) and firm survival (i.e. business performance). Deploying
exploratory qualitative interview and structural equation modelling on the survey data derived from 184
respondents from export-oriented manufacturing SMEs in the Chinese textile industry, Naidoo (2010)
found competitor orientation and inter-functional coordination (but not customer orientation) led to
marketing innovation, and marketing innovation could develop and sustain competitive advantage based
on differentiation and cost leadership strategies. Naidoo (2010) thus concluded that marketing innovation
was able to help firms survive the economic crisis.
Camisón and Villar-López (2011) investigated the antecedent role of two knowledge-based capabilities
(organizational memory and organizational learning) in the development of non-technical innovation, (i.e.
organizational and marketing innovation), and the effect of non-technical innovation on achieving
sustained competitive advantage (SCA) from a capabilities-based view (CBV), which provides the
theoretical framework building a relationships between capabilities, innovation and SCA (Mol &
Birkinshaw, 2009). Organizational memory and learning capabilities were examined as key factors to
13
innovations in this study since they are core knowledge-based capabilities according to CBV (Nelson &
Winter, 2009). Camisón and Villar-López (2011) argued organizational memory and learning capabilities
could lead to organizational and marketing innovation, and thereby enhance firms’ sustained competitive
advantage, which was measured by economic performance (e.g. economic profitability, financial
profitability, sales profitability, market share gain) and customer satisfaction (e.g. labor productivity,
customer satisfaction, strength of competitive position) in the study. Analyzing the survey data from 159
Spanish companies through structural equation models, Camisón and Villar-López (2011) concluded that
organizational memory and learning capabilities were important antecedent factors to organizational and
marketing innovation, and both innovations positively affected the development of sustained competitive
advantage. They also pointed out further research could focus on the role of other organizational
capabilities that might drive non-technical innovation.
Using data from the German Community Innovation Survey 2007, Schubert (2010) investigated whether
non-technological innovations, referred to as marketing and organizational innovations (MO innovations)
were complementary to technological innovations, referred to as product and process innovations (PP
innovations), or whether they were substitutes. To test the relationship, Schubert (2010) regressed
variables of PP innovation success (i.e. share of turnover with new products and cost reductions) on MO
innovations (i.e. organizational innovations introduced and marketing innovation introduced). They found
an insignificant result on the organizational innovation variable, but the coefficients of the marketing
innovation variable was positive, suggesting a complementary relationship between marketing innovation
and PP innovations. Schubert (2010) thus concluded that marketing innovations “increased success with
technological product and process innovations” while “organizational innovations did not significantly
affect the innovation success”.
Geldes and Felzensztein (2012) investigated the characteristics and determinants of marketing innovation
in Chile’s agribusiness sector using data from the Innovation Survey undertaken in Chile in 2010, a
survey based on the OECD guidelines. Geldes and Felzensztein (2012) argued that company size
(measured by e.g. sales, direct employment, professionals and technicians percentage, exports), the access
to information source (measured by e.g. internal providers, clients, consultants) and inter-organizational
cooperation (measured by e.g. cooperation with other companies, proviers, clients, competitors) could be
positively related to marketing innovation. The first two factors had already been tested in literature and
found positively connected to innovation activities, while the last factor was newly proposed since
clusters were found to promote innovations in the agribusiness probably through a higher access to
information (Geldes & Felzensztein, 2012). Deploying a variety of statistical analysis including t-test,
14
regression and factor analysis, they found that a positive relationship existed between company size (i.e.
number of hired staff and the company’s number of establishment) and marketing innovations in the
agribusinesses sector, and also a positive relationship between the access to information and marketing
innovations; but the relationship between inter-organizational cooperation and marketing innovation was
negative (Geldes & Felzensztein, 2012).
Moreover, Silva, Simoes, and Sousa (2012) examined the factors that could stimulate marketing
innovation in terms of the design and packaging of goods and services using data from the 4th Community
Innovation Survey in Portugal. The researchers focused on three factors - technological capacity (i.e.
training), R&D activities (e.g. internal R&D activities, external acquisiton of R&D, acquition of
machinery, equipement and software) and marketing activities, since technological capacity and R&D
activities led to innovation activities in general, and marketing activities were inseparable with design and
packaging of products and services (Moreira et al., 2012). Analyzing data through logistic regressions,
Moreira et al. (2012) reported that “firms carrying out marketing activities or R&D internally, acquiring
machinery, equipment, or software – or even other external knowledge or carrying out other types of
procedures directed towards innovation – enjoy a greater tendency to innovate in marketing in terms of
design and packaging than other firms”.
Medrano-Sáez and Olarte-Pascual (2012) attempted to identify the characteristics of manufacturing and
service firms that adopted marketing innovation using data from the 2008 Technological Innovation Panel
in Spain. They have examined four features – size, business activity (i.e. belonging to a business group),
export tasks and internal R&D – of firms in the research, factors that had been linked to innovation
activities in literature (Medrano-Sáez & Olarte-Pascual, 2012). The research findings showed only 27.2%
of Spanish companies carried out marketing innovation, with alterations to product design and packaging
being the most frequently employed methods (Medrano-Sáez & Olarte-Pascual, 2012). Processing logit
binomial discrete choice models on the data collected, Medrano-Sáez and Olarte-Pascual (2012) further
pointed out that the adoption of internal R&D, company size (i.e. turnover) and exports are positively
directed to all kinds of marketing innovation. Also, manufacturing companies were found to mosly
innovate in product design and packaging, and service companies were found to be more engaged in
marketing innovation regarding product or service placement, promotion and pricing, but there was no
major differences between companies who belonged to business groups and those that did not (Medrano-
Sáez & Olarte-Pascual, 2012). The researchers also pointed out that further work could be extended to
measure the relationship between marketing innovation and firm performance.
15
Kijek (2013) examined the relationship between marketing innovation and technological innovation.
Technological innovation was referred to as product and process innovation, and measured by firms’
propensity to adopt technological innovations and firms’ investment in technological innovation activities
(e.g. expenditures on R&D, expenditures on acquisition of knowledge from external sources, expenditures
on marketing for new and significantly improved products). Using data from the survey of innovation
activities in Polish manufacturing enterprises from 2008 to 2010, the research showed a positive impact of
product innovation on marketing innovation, and moreover, expenditures on acquisition of knowledge
from external sources and expenditures on marketing for new and significantly improved products could
stimulate the adoption of marketing innovation. Kijek (2013) concluded that “product innovations
influence the decision to introduce marketing innovations, suggesting a complementary relationship”,
while “the findings offer little support that process innovations induce marketing innovations”, and this
could indicate that “process innovations introducing in isolation to product innovations may be regarded
as substitutes for some forms of marketing innovation”. Kijek (2013) also pointed out this research was
restricted by data aggregated at the sector level and didn’t analyze the opposite direction of the
relationship, and future study could consider to investigate the opposite direction using longitudinal
micro-data.
To briefly summarize the key findings from the empirical studies described above, a positive relationship
between marketing innovation and firms’ performance has been supported by all studies that sought to
test such relationship (Camisón & Villar-López, 2011; Halpern, 2010; Naidoo, 2010; Shergill &
Nargundkar, 2005). This correlation was found to help firms survive the global economic crisis since
marketing innovation assisted in developing sustainable competitive advantages strategy, which in turn
enhanced the likelihood of firms’ survival in the economic crisis (Naidoo, 2010).
A variety of characteristics has been detected from the firms that adopted marketing innovation, most of
which had been discussed in innovation literature as drivers to innovation and R&D related activities. For
example, Camisón and Villar-López (2011) found that organizational memory and learning capabilities
were important antecedent factors in organizational and marketing innovation after studying Spanish
companies. Geldes and Felzensztein (2012) showed that a positive relation existed between the access to
information and marketing innovations in Chile. Silva, Simoes and Sousa (2012) argued that firms
carrying out marketing activities or R&D internally, acquiring machinery, equipment, or software, or
carrying out other types of procedures directed towards innovation were more likely to adopt marketing
innovation in design and packaging. Medrano-Sáez and Olarte-Pascual (2012) pointed out that company
size, internal R&D and exports had a positive influence on the marketing innovative capacity, and
16
manufacturing companies mostly innovated in product design and packaging, whereas service companies
put an emphasis on innovation strategies regarding product or service placement, promotion and pricing.
In regard to the studies of relationship between innovations, Schubert (2010) concluded marketing
innovation made both of product and process innovation more successful in German companies, while
Kijek (2013) found that although product innovation influenced the introduction of marketing
innovations, process innovation barely incited marketing innovation in Polish manufacturing firms.
2.2. Competition, customer and competitor orientations and innovation
Nickell (1996) investigated the relationship between competition and corporate performance. He took an
industry to be more competitive if there were fewer monopoly rents, and argued that there was theoretical
basis, though not strong, for the belief that competition drove productivity performance because
competition might sharpen incentives, lead to less slack, and raise managerial effort and thus enhance
business performance (Nickell, 1996). Measuring competition by increased numbers of competitors or by
lower levels of rents, Nickell (1996) empirically examined the relationship between competition,
productivity and productivity growth using panel data on U.K. manufacturing sector companies, and
pointed out that higher competition was associated with higher rates of total factor productivity growth,
though market power, as “captured by market share”, reduced levels of productivity.
Aghion, Bloom, Blundell, Griffith, and Howitt (2002) investigated the relationship between product
market competition (PMC) and innovation, and found that their relationship followed an inverted U-
shape. Based on a Schumpeterian growth model that was developed in which “ firms innovate ‘step-by-
step’ and where both technological leaders and their followers engage in R&D activities, and laggard firm
must firstly catch up with the technological leader before becoming a leader itself”, the researchers
predicted that the relationship between PMC and innovations was an inverted U-shape, and this prediction
was supported by their empirical test based on a panel of UK companies (Aghion, Bloom, Blundell,
Griffith, & Howitt, 2002). The inverted U-shape model indicates that the escape-competition effect
dominates for low initial levels of competition, meaning when competition gets intense firms increase the
investments in R&D or innovations to “escape competition”; whereas the Schumpeterian effect
dominates at higher levels of competition, meaning competition reduced innovations as the laggard’s
reward to catching up with the technological leader might fall (Aghion et al., 2002).
Narver and Slater (1990) laid the foundation of the concept and series studies of market orientation.
Market orientation is composed of three main components: a customer orientation, through which a firm
17
strives to understand its target customers; a competitor orientation, through which a firm strives to
understand what its competitors are doing; and inter-functional coordination, the organizational culture
that orients employees in all departments of a business unit toward understanding the firm’s market in
terms of both customers and competitors (Narver & Slater, 1990). Firms must create a sustainable
competitive advantage (SCA) to achieve market performance, and to create and sustain a SCA, a market-
orientation culture is effective since it would continuously examine the sources of SCA in order to create
“additional benefits” for customers and types of reductions in the customers’ total purchase costs (Narver
& Slater, 1990). By doing this, sustainable “superior value” is created for customers and thus firms
acquire SCA (Narver & Slater, 1990). Given the purpose of market orientation, three behaviour –
customer orientation, competitor orientations and inter-functional coordination – are involved (Narver &
Slater, 1990), since customer orientation and competitor orientation could engage most of the activities
necessary to acquire information about the customers and competitors in the target market and inter-
functional coordination helps to disseminate and coordinate these information across an organization
(Narver & Slater, 1990).
Narver and Slater (1990) empirically tested this concept using data from 140 strategic business units of a
major western corporation and found a positive relationship between market orientation and the
profitability of businesses. Following their research, the construct of market orientation has received
widespread acceptance and are found positively related to “continuous superior performance” (Narver &
Slater, 1990), profits, sales, market share, customer loyalty and satisfaction, innovativeness of firms
(Jaworski & Kohli, 1993), and new product success (Slater & Narver, 1994). In a similar vein, Nwokah
(2009) found that customer focus and competitor focus could work together to lead to performance (e.g.
financial performance, innovativeness, market share, customer loyalty, customer satisfaction).
Agarwal, Krishna Erramilli, and Dev (2003) found that marketing orientation could spur innovation,
particularly in the service industry. The reason could be that a market-oriented firm may have superior
marketing-sensing and customer-linking capabilities, and thus in a position to innovate to provide
superior value for its target customers (Narver & Slater, 1990). Innovation is thought particularly
important to service firms since their products are difficult to protect through patents and copyrights
(Agarwal et al., 2003). Atuahene-Gima (1996) found that market orientation has significant relationships
with several innovation characteristics such as innovation-marketing fit, product advantage, and inter-
functional teamwork from an empirical study of 158 manufacturing and 117 services firms in Australia.
Han, Kim, and Srivastava (1998) found that innovation is the missing link between market orientation and
firms’ performance, and pointed out market orientation affects the innovativeness of firms en route to
18
affecting firms’ performance. Lado and Maydeu-Olivares (2001) showed there is a positive impact of
market orientation on insurance firms’ innovation degree and innovation performance in both the U.S.
and European markets.
Zhou, Yim, and Tse (2005) pointed out that a market orientation facilitates innovations that use advanced
technology and thus offers greater benefits to mainstream customers (i.e. technology-based innovations)
but inhibits innovations that target emerging market segments (i.e. market-based innovations). In addition,
competitive intensity, the degree of competition that a firm faces within its industry, could positively
influence market-based innovation (Zhou et al., 2005). Grinstein (2008) showed that the relationship
between market orientation and innovation consequences is stronger in highly competitive environments
but weaker in technology turbulent ones, and stronger in large firms and service companies than in SMEs
and manufacturing companies.
2.3. Market orientation and innovation in global economic crises
Organizations frequently must cope with anomalous events, e.g. economic crises, which create high levels
of uncertainty and are potential threats to the viability of an organization (Grewal & Tansuhaj, 2001).
Economic crises are inexorably linked to the concept of business cycles (Mattick & Mattick, 1981), but
not all periods of contraction (or through in a cycle) are classified as crises (Grewal & Tansuhaj, 2001).
Crises refer to contractions in which real output decreases, not to periods of slow growth (Grewal &
Tansuhaj, 2001). Therefore, it comes as no surprises that predicting and gauging the influence of these
economic crises is a challenging task (Grewal & Tansuhaj, 2001).
Scholars have asserted that the environmental context interacts with organizational capabilities to
influence firm performance (Houston, 1986; Lusch & Laczniak, 1987). Marketing orientation is found to
be one of these capabilities that firms can use to manage uncertainties, e.g. economic crisis (Day, 1994;
Grewal & Tansuhaj, 2001). Economic crises change demand pattern, but market orientation could enable
firms to gather information on the current and future customer needs (Grewal & Tansuhaj, 2001).
Research on organizational crises (D'Aveni & MacMillan, 1990) shows that surviving firms after
economic crises, in comparison with failing firms, emphasize both external and internal environments,
which is a critical feature of marketing orientation (Kohli & Jaworski, 1990). Scholars also argued that
when customer orientation (one of the three components of market orientation) was excessive, it might
not benefit firms, since firms could listen too much to their customers (Bennett & Cooper, 1979; Frosch,
1996; Macdonald, 1995). It was market orientation (including customer orientation, competitor
19
orientation and inter-functional coordination) but not customer orientation that might help firms to
survive an economic crisis, since market-oriented firms “scan the market broadly, have a longer term
focus, and are more likely to be generative learners” (Connor, 1999; Slater & Narver, 1998, 1999), and
market orientation is both market driven and market driving (Jaworski, Kohli, & Sahay, 2000). The focus
of market orientation is on both expressed and latent customer needs, unlike customer orientation, which
focuses only on expressed customer needs (Slater & Narver, 1998). Moreover, market orientation also
drives learning from competitors’ capabilities and plans, but customer orientation will not be able to
achieve this (Grewal & Tansuhaj, 2001).
In spite of the arguments above, Grewal and Tansuhaj (2001) hypothesized that market orientation might
only work for the non-crisis situations but not crisis situations, because firms did not encounter crises
frequently and could not learn about them in advance (Grewal & Tansuhaj, 2001), or because a high level
of market orientation might cause firms to “lock into a standard mode of cognition and response, thereby
building inertia instead of the creative thinking needed to manage crises” (Day, 1994; Scott, 1987).
Analyzing survey data from 120 respondents from Thai SMEs, Grewal and Tansuhaj (2001) revealed a
negative link between market orientation and firm performance after the economic crisis. The reason
could be, as discussed above, that the inertia created by market orientation hampered learning towards the
changes in the environment after a crisis. They further pointed out that market orientation should not be
emphasized when competitive intensity is high, since when firms have an emphasis on market orientation,
they get locked into “institutionalized thinking about competitors” (Grewal & Tansuhaj, 2001), though
market orientation might be useful under conditions of high demand uncertainty or high technological
uncertainty (Grewal & Tansuhaj, 2001).
Examining the role of innovation in economic crises is pivotal as well, as economic cycles could be the
“consequence of innovation”, and innovative activities and innovative organizations are “reshaped by
economic crises” (Rosenberg & Schumpeter, 1939). Scholars have examined the changing pattern of
innovation investment in economic crises. In general, economic crises might substantially reduce the
innovation expenditure of the firm during crises and make the innovation expenditure more concentrated:
fewer firms could be responsible for an increased share of innovation expenditure (Archibugi, Filippetti,
& Frenz, 2013). Employing a panel dataset spanning the period 2004–2008, Archibugi, Filippetti and
Frenz (2013) found two categories of firms were actually responsible for a larger share of innovation
expenditure in 2008 compared to 2006. They were the great innovators in 2004 and fast growing new
firms that gained momentum during the crisis by increasing innovation expenditures (Archibugi et al.,
2013). This finding suggests that “being a great innovator does not predict the increase in innovation
20
investment before the crisis, but does during the crisis” (Archibugi et al., 2013). However, it does not
necessarily mean the crisis aggravates the innovation in a few firms, given the rising of the new firms
found in the research (Archibugi et al., 2013).
2.4. Business strategy, technology adoption, innovation and marketing capabilities
Business strategy, defined as the long-term plan of action a company may seek to achieve its goals (Zahra
& Covin, 1993), is another factor critical to attain “superior” firm performance (Galbraith & Kazanjian,
1986; Walker Jr & Ruekert, 1987), and a variety of strategic choices, including but not limited to cost
leadership, market segmentation, a focus to maintain or intensify existing practices or to introduce new or
significantly improved practices, could be equally effective in the pursuit of the performance goals
(Gresov & Drazin, 1997; Hrebiniak & Joyce, 1985; Venkatraman, 1989). Moreover, innovation and
strategy could be “intertwined in efforts” to create sustainable competitive advantage for companies
(Cahill, 1998; Ettlie, Bridges, & O'keefe, 1984; Ireland, Hitt, Camp, & Sexton, 2001; Knott, 2003;
O'brien, 2003). Li and Atuahene-Gima (2001) advocated that innovation should be systematic. Firms
should promote innovation within organizations through establishing clear incentives, setting clear
objectives and metrics for developing and sustaining innovation (Li & Atuahene-Gima, 2001).
Strategic decision of technology adoption could also influence business performance and innovation.
There is a growing recognition of the critical role of technology in determining market success
(Competitiveness, 1991; Fusfeld, 1989; Mitchell, 1990). As a result of this recognition, companies have
increased their adoption of advanced technologies and their introduction of technologically sophisticated
products (Zahra & Covin, 1993), and developed technology policies that are consistent with or ‘fit’
business strategy (Clark & Hayes, 1985; Collier, 1985). This fit brings the successful deployment of a
company’s technological resources in pursuit of the goals of business strategy (Zahra & Covin, 1993),
and the effective deployment of technological resources helps to build a sustainable competitive
advantage that enhances a company’s financial performance (Porter, 1985). Furthermore, using advanced
technology has been found to have a positive impact on producing new products (Li & Atuahene-Gima,
2001). Innovative products in the financial sector could satisfy client needs through the adoption of new
technology (Hanvanich et al., 2003), and continuous improvements in technology have already resulted in
saved time and effort and, in turn, positively influenced the perceived images and reputations of the firms
(Haddad & Algadeer, 2004).
21
From a strategic marketing perspective, business strategy was also found to have a positive impact on
marketing capabilities development (Vorhies, 1998). Marketing capability is defined as: “integrative
processes designed to apply the collective knowledge, skills, and resources of the firm to the market-
related needs of the business, enabling the business to add value to its goods and services and meet
competitive demands” (Day, 1994). Innovation, marketing capabilities and firms’ competitive advantage
are found to be strongly interrelated (Weerawardena, 2003). Entrepreneurial firms that have excellent
marketing skills are more likely to develop radical changes to products, processes, and marketing methods
(Weerawardena, 2003). Marketing capability is important to innovation since it not only influences the
innovation development stage, but also facilitates the market success of innovations (Weerawardena,
2003).
2.5. Innovation and marketing in a value chain
A value chain can be defined as the “full range of activities that firms and workers do to bring a product
from its conception to its end use and beyond” (Gereffi & Fernandez-Stark, 2011). A typical value chain
should include the following activities: design, production, marketing, distribution and support to the final
consumer (De Backer & Miroudot, 2014). World trade and production activities are forming the “global
value chains” (GVCs) and activities in a GVC can be performed within the same firm or divided among
different firms within the same country or distributed globally (De Backer & Miroudot, 2014). Also,
global value chain emphasizes business functions - the activities along the supply chain, such as R&D,
procurement, operations, marketing, customer services (De Backer & Miroudot, 2014). This means the
global value chain is defined by product and firm strategies and could involve more than one industry (De
Backer & Miroudot, 2014). For instance, services industries such as financial services or transport
services are usually part of almost all value chains, whereas extractive and raw material industries are
more likely to be at the beginning of most manufacturing GVCs (De Backer & Miroudot, 2014).
The value-chain perspective shifts the focus from production alone to the whole range of activities from
design to marketing (Gereffi, Humphrey, & Kaplinsky, 2001). As Shin, Kraemer and Dedrick (2009)
stressed in their study, “in the past, large electronics firms designed and developed their own products,
often using their internal supply chains. Today, leading firms, which are mostly brand-name
manufacturers, focus on core competencies such as product innovation, marketing and other activities
related to brand development, while using specialized suppliers for non-core functions as manufacturing
(Gereffi, Humphrey, & Sturgeon, 2005; Sturgeon, 2002; Yeung, 2007).” While leading firms in a value
chain can enjoy the benefits of brand names, firms in the middle often strive to shift functions away from
22
the more tangible aspects of production and to get control over the more profitable functions of branding
and marketing (Gereffi et al., 2001).
The capacity to innovate is critical to realize sustainable income growth and to “upgrade” in a GVC
(Gereffi et al., 2001). Upgrading may involve changes in the nature and mix of activities (for example,
taking responsibility for, or outsourcing accounting, logistics and quality functions), both within each link
in the chain, and in the distribution of intra-chain activities (Gereffi et al., 2001). On the other hand,
investment in innovation could also be a critical factor to drive GVCs, since participation and upgrading
within value chains requires investment in innovation and knowledge-based capital, such as R&D,
intellectual property, software, and data, as well as economic competencies such as organizational know-
how and branding (GVC report, 2014). New concept development, R&D or the manufacturing of key
parts and components are often found to be in the upstream activities in a GVC, and marketing, branding
or customer service in the downstream, both of them contributing to the highest proportion of value
creation of GVCs (GVC report, 2014).
From a strategic marketing perspective, Webster Jr (1992) pointed out that the global competition resulted
in increasingly better product performance at lower cost to the customer, while “rapid advances in
telecommunication, transportation and information processing broadened the choice set of both industrial
buyers and consumers to the point that a product's country of origin was relatively unimportant and
geographic distance was barely a barrier”, and “a new conception of marketing should focus on
positioning the firm between vendors and customers in the value chain with the aim of delivering superior
value to customers.” In response to this trend, marketing strategies should be devised upon three levels –
marketing at the corporate level should pay attention to market structure analysis, customer orientation
and advocacy, and positioning the firm in the value chain; marketing at the business level should focus on
market segmentation and targeting, positioning the product, and deciding when and how to partner;
marketing at the operating level should go back to marketing mix – products, promotion, distribution and
pricing as well as managing customer and reseller relationship (Webster Jr., 1992).
To the point of when and how to partner for marketing in a value chain, Webster Jr. (1992) raised the
point that marketing managers at the business unit level had a responsibility to decide which marketing
functions and activities are to be purchased in the market, which are to be performed by strategic partners,
and which are to be performed internally, and such responsibility could apply to the whole range of
professional services (marketing research, telemarketing, advertising, sales promotion, package design,
etc.) as well as to suppliers of raw materials, components, and subassemblies and to resellers. This was a
23
point which was initially considered as a make-or-buy (vertically integrate or contract) decision in
marketing studies (Anderson &Weitz , 1986). However, Webster Jr. (1992) did not elaborate on which
factors should be considered to make such a decision.
2.6. Interrelation of marketing innovation and other innovations
In regard to interactions among the innovation types, though innovation literature has not yet reached an
agreement on whether a specific innovation type is likely to have more or less of an impact on business
performance, innovation activities are thought to “influence each other and need to be implemented in
conjunction” (Walker, 2004). For example, administrative innovations could lead to technical innovations
in public libraries and the pharmaceutical industry (Damanpour, Staropoli, 1998); organizational
structural characteristics might be important predictors of process innovation in the logistics sector
(Germain, 1996); organizational, marketing and service (or product) innovations were found interrelated
in public organizations (Walker, 2008); process innovation and product innovations were found
significantly correlated to each other in Chinese firms (Walker, 2008); and also a positive relationship
was shown between organizational innovation and process innovation, organizational innovation and
marketing innovation, process innovation and product innovation, and marketing innovation and product
innovation among Turkey manufacturing firms (Gunday et al., 2011).
Early studies of innovation types had a pair-wise focus such as product/process, administrative/technical
and radical/incremental (Rowley, Baregheh, & Sambrook, 2011). Other innovation types proposed by
scholars include product innovation, service innovation, hybrid innovation, management innovation,
business system and commercial innovation (Gunday et al., 2011; Rowley et al., 2011). In the OECD
Oslo Manual (2005), four different innovation types are introduced as product innovation, process
innovation, marketing innovation and organizational innovation (OECD, 2005). Product and process
innovations are closely related to the concept of technological developments (Gunday et al., 2011). The
definition of production innovation, process innovation and organizational innovation can be found as the
following:
“A product innovation is the introduction of a good service that is new or significantly improved
regarding its characteristics or intended uses, including significant improvements in technical
specifications, components and materials, incorporated software, user friendliness or other functional
characteristics” (OECD, 2005). “A process innovation is the implementation of a new or significantly
improved production or delivery method. This includes significant changes in techniques, equipment
24
and/or software” (OECD, 2005). “An organizational innovation is the implementation of a new
organizational method in the firm’s business practices, workplace organization or external relations”
(OECD, 2005).
Industry Canada (2014) has particularly examined the relationships among innovation types in Canadian
enterprises. It pointed out that complementarity relationship existed between organizational and product
innovations, while substitution existed between process and organizational innovations and process and
marketing innovations, but “the complementarity between organizational and product innovations and the
substitution relationship between process and marketing innovations should however be considered as
less robust than the process and organization innovations substitution, as they are sensitive to the choice
of the empirical specification” (Industry Canada, 2014).
2.7. Industry distinctions in marketing
Industry effects on firm conduct have long been suggested by industrial economists (Hitt & Ireland,
1985). There are strong effects of industry on the selection of business level strategies (Porter, 2008).
Industry effects exist at the corporate level. For firms which are not diversified extensively, such effects
will be a product of the firm's dominant industry. However, even highly diversified firms often have
multiple products in similar industries or those with similar characteristics. In addition, chief executives'
actions may be guided by the core industry in which they have experience (Hitt & Ireland, 1985). To
examine corporate level industry effects and the call for use of typologies in theory building required the
use of an industry typology (Hambrick, 1983).
Hunt (1976) has stressed the usefulness of classification schemes in marketing. Various attempts have
been made by marketing theorists to classify goods into different categories (Lovelock, 1983). For
instance, one of the most famous and enduring is Copeland (1923) classification of convenience,
shopping and specialty goods. Another major classification has been between durable and nondurable
goods (Lovelock, 1983). Yet another classification is consumer goods versus industrial good (Lovelock,
1983). Recognition of these distinctions by marketers has led to different types of marketing strategy that
is directed at each of these groups (Lovelock, 1983). Emphasized by Lovelock (1983), classification of
marketing is of great value to marketing studies. Through these classifications, the application of
marketing management tools and strategies has become a professional skill that transcends industry
divisions (Lovelock, 1983).From the customer perspective, microsegmentation within each broad
segment provides incremental insights into customer customer expectations relative to service levels
25
(Boyt & Harvey, 1997). The disaggregation of the industrial market into homogeneous submarkets is a
prerequisite to an accurate customer-demand analysis, both to target market selection and to the
deveopment of product and service characterisitcs demanded by each market segment (Mahin, 1991).
On the other hand, a sectoral system perspective has been developed in the innovation studies. Sectoral
patterns of innovations have been initially reognized in the innovation studies using data from U.K and
U.S.A (Pavitt, 1984). A clear difference in the use of innovation has been found between manufacturing
and the other sectors of the economy (i.e. agriculture, mining, service industries, private and public
services), while manufacturing itself was found to be far from homogeneous in patterns of use of
innovations (Pavitt, 1984). Sectoral differences in the types of innovation has been recognized and
discussed from a sectoral system perspective in the later innovation studies as well (Malerba, 2002).
Some scholars have taken industry distinctions into consideration when conducting their studies. For
example, Sin, Tse, Yau, Chow, and Lee (2005) found that there is a moderating effect of industry type on
the link among market orientation, relationship marketing orientation and business performance (Sin et
al., 2005). Atuahene-Gima (1996) found that the impact that market orientation has on service innovation
performance is different from that on product innovation performance. Grinstein (2008) concluded market
orientation and innovation consequences are different between service companies and manufacturing
companies (Grinstein, 2008).
3. Theoretical framework and hypotheses
3.1 Theoretical framework
The preceding literature review suggests that innovation is related to competitive intensity (e.g. Aghion et
al., 2002; Nickell, 1996), customer and competitor orientations (e.g. Aaker, 1989; Day & Wensley, 1988;
Porter, 1980, 1985), business strategy (e.g. Collier, 1985; Zahra & Covin, 1993; Zott & Amit, 2007,
2008), and marketing capabilities (e.g. Weerawardena, 2003). The marketing function very often deals
with decisions in relation to maintaining and acquiring marketing capacity in the pursuit of competitive
advantage (e.g. Gereffi et al., 2001; Shin, Kraemer and Dedrick, 2009; Webster Jr, 1992). A global value
chain (GVC) perspective stresses the importance for organizations to invest in innovation and marketing
(GVC report, 2014). Studies of innovation have revealed interrelation among different types of
innovations – product and service innovation, process innovation and organizational innovation
(Damanpour, Walker, & Avellaneda, 2009; Gunday et al., 2011; Rowley et al., 2011; Walker, 2008).
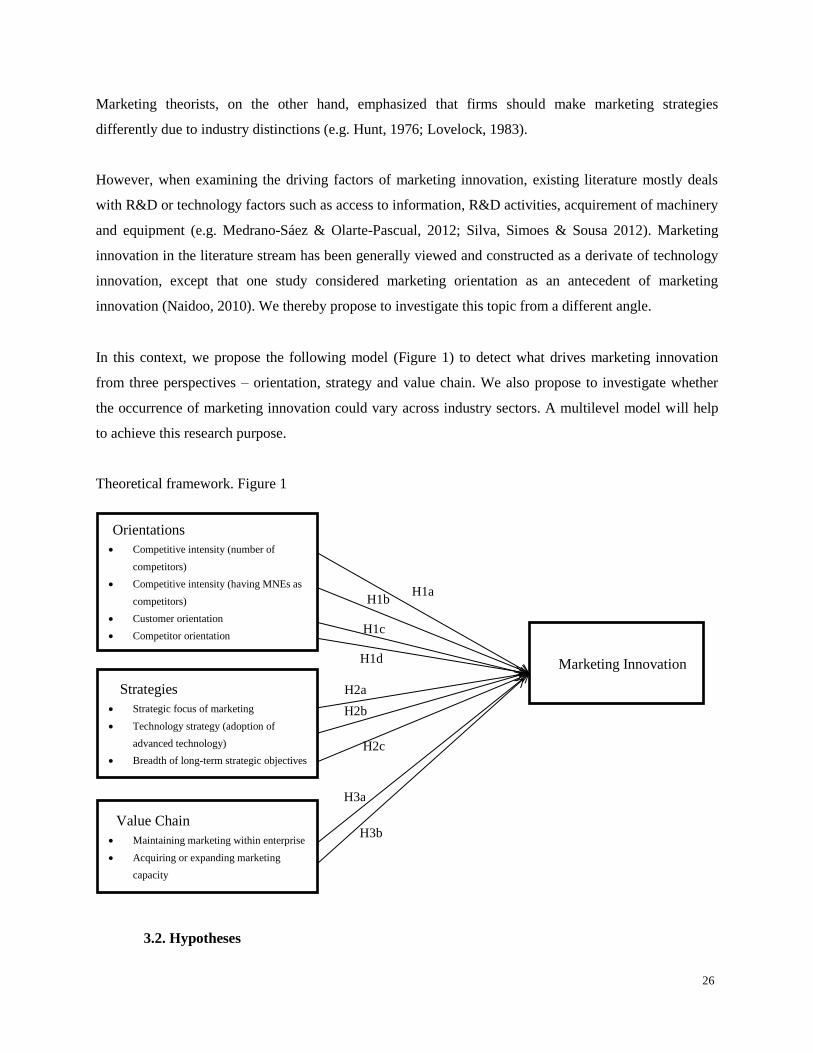
26
Marketing theorists, on the other hand, emphasized that firms should make marketing strategies
differently due to industry distinctions (e.g. Hunt, 1976; Lovelock, 1983).
However, when examining the driving factors of marketing innovation, existing literature mostly deals
with R&D or technology factors such as access to information, R&D activities, acquirement of machinery
and equipment (e.g. Medrano-Sáez & Olarte-Pascual, 2012; Silva, Simoes & Sousa 2012). Marketing
innovation in the literature stream has been generally viewed and constructed as a derivate of technology
innovation, except that one study considered marketing orientation as an antecedent of marketing
innovation (Naidoo, 2010). We thereby propose to investigate this topic from a different angle.
In this context, we propose the following model (Figure 1) to detect what drives marketing innovation
from three perspectives – orientation, strategy and value chain. We also propose to investigate whether
the occurrence of marketing innovation could vary across industry sectors. A multilevel model will help
to achieve this research purpose.
Theoretical framework. Figure 1
3.2. Hypotheses
H2b
H3a
H2c
H1c
H1d Marketing Innovation
Orientations
Competitive intensity (number of
competitors)
Competitive intensity (having MNEs as
competitors)
Customer orientation
Competitor orientation
Strategies
Strategic focus of marketing
Technology strategy (adoption of
advanced technology)
Breadth of long-term strategic objectives
Value Chain
Maintaining marketing within enterprise
Acquiring or expanding marketing
capacity
H1a
H3b
H1b
H2a
27
3.2.1. Orientation: competitive intensity, competitor and customer orientations
Competition is measured by increased numbers of competitors or by lower levels of rents in a market, and
an industry becomes more competitive if there are fewer monopoly rents (Nickell, 1996). Competition is
related to innovation as product market competition has been found to link to innovation following an
inverted U-shape (Aghion et al., 2002). The inverted U-shape model indicates that when competition gets
intense, firms increase the investments in R&D or innovations to “escape competition, whereas
competition reduces innovations as the laggard’s reward to catching up with the technological leader
might fall (Aghion et al., 2002). Despite the direct link between competition and innovation, competitive
intensity, described as the degree of competition that a firm faces within its industry, is mostly and merely
regarded as an environmental factor in the innovation and marketing literature (e.g. Grewal & Tansuhaj,
2001; Grinstein, 2008). Whether there is a relationship between competitive intensity and marketing
innovation is yet to be examined. Moreover, the measurement of competitive intensity usually focuses on
the number of competitors but ignores the very fact that the participation of multinational enterprises
(MNEs) would intensify the competition of a market (Aggarwal, 2002; Blomström, Kokko, & Zejan,
1994). More importantly, it matters whether competitors are national or multinational since the presence
of MNEs could enforce great impact on the local market and even change the whole landscape of an
industry (Levitt, 2002).
Market orientation is another factor that is vital to innovation. To survive and sustain in a competitive
environment, firms must create a sustainable competitive advantage (SCA) that can achieve market
performance (Narver & Slater, 1990). To create and sustain a SCA, a market-orientation culture is
effective since it would continuously examine the sources of SCA in order to create “additional benefits”
for customers and types of reductions in the customers’ total purchase costs (Narver & Slater, 1990).
Given the purpose of market orientation, customer and competitor orientations are involved together as
they could engage most of the activities necessary to acquire information about the customers and
competitors in the target market, and thereby satisfy customer needs better than their competitors (Narver
& Slater, 1990). Market orientation might spur innovation for the reason that a market-oriented firm may
have superior marketing-sensing and customer-linking capabilities, and thus be in a position to innovate
to provide superior value for its target customers (Agarwal et al., 2003; Narver & Slater, 1990), though
such relationship is also subject to the types of innovation (e.g. Zhou et al., 2005), industy distinctions
(e.g. Agarwal et al., 2003) and innovation characteristics that a firm possesses (e.g. Atuahene-Gima,
1996).
28
Competitive intensity in this study is measured by two facets of a competing market – the number of
competitors and whether having MNEs as competitors, respectively. Competitor and customer
orientations, which traditionally have a relative emphasis on collecting and processing information
pertaining to customer preferences and competitor capabilities (Narver & Slater, 1990), hereby are
measured by the actions that companies take to respond to the information of competitors and customers,
respectively (Kohli & Jaworski, 1990).
Hypothesis 1a: Competitive intensity (number of competitors) is positively related to marketing
innovation.
Hypothesis 1b: Competitive intensity (having MNEs as competitors) is positively related to marketing
innovation.
Hypothesis 1c: Customer orientation is positively related to marketing innovation.
Hypothesis 1d: Competitor orientation is positively related to marketing innovation.
3.2.2. Strategies: strategic focus, technology adoption and breadth of long-term
strategic objectives
Innovation and business strategy are thought to be intertwined in efforts to create sustainable competitive
advantage (Cahill, 1998; Ettlie et al., 1984; Ireland et al., 2001; O'brien, 2003). Business strategy, defined
as the long-term plan of action a company may seek to achieve its goals (Zahra & Covin, 1993), is critical
to attain “superior” firm performance (Galbraith & Kazanjian, 1986; Walker Jr & Ruekert, 1987). A
variety of strategic choices could be equally effective in pursuit of the performance goals within a similar
environment (Gresov & Drazin, 1997; Hrebiniak & Joyce, 1985; Venkatraman, 1989). Because of this
“equifinality”, one key to successful strategic management is an organization’s ability to achieve fit or
coherence among a set of competitive factors (Blumentritt & Danis, 2006). Some firms could be
particularly adept at developing new business practices, whereas others excel at delivering existing
practices in more efficient and cost effective way (Blumentritt & Danis, 2006). Different strategic
approaches could represent equally viable means of establishing competitive advantage in a given
industry, and thus how firms develop distinctive sets of capabilities that provide sources of sustained
competitive advantage becomes vital to achieve high performance (Blumentritt & Danis, 2006). Likewise,
the role of innovation and the targeting of innovative efforts should be somehow linked to the distinctive
strategic focus of a firm. Strategic focus could be a powerful factor that accounts for important
differences in innovation management; for instance, the types of projects pursued, the targets of
29
innovative activities, and the gathering of information for innovation (Blumentritt & Danis, 2006).
However, few studies have explored how firms with different strategic focus differ with regard to specific
innovation practices (Blumentritt & Danis, 2006). In this context, this research takes the initiative to
investigate whether a strategic focus on introducing new marketing practices (rather than maintain or
intensify the current ones) could motivate marketing innovation.
Moreover, technology adoption is also critical to innovation as an important part of strategy. Companies
have increased their adoption of advanced technologies and their introduction of technologically
sophisticated products (Zahra & Covin, 1993) as they started to recognize the pivotal role of technology
in determining market success (Competitiveness, 1991; Fusfeld, 1989; Mitchell, 1990). Technology
adoption should be consistent with or fit business strategy (Clark & Hayes, 1985; Collier, 1985). This fit
brings the successful deployment of a company’s technological capabilities and resources in pursuit of the
goals of business strategy (Zahra & Covin, 1993), and the effective deployment of technological
resources helps to build a sustainable competitive advantage that enhances a company’s financial
performance (Porter, 1985). Innovation and business strategy work together to create sustainable
competitive advantage (Cahill, 1998; Ettlie et al., 1984; Ireland et al., 2001; O'brien, 2003). However,
most existing literature links technology adoption to either product innovation or process innovation (e.g.
Bartel, Ichniowski, & Shaw, 2005; Haddad & Algadeer, 2004; Hanvanich et al., 2003; Li & Atuahene-
Gima, 2001; Peres, Muller, & Mahajan, 2010). In this context, we propose to examine whether a strategic
decision of technology adoption could stimulate innovativeness in marketing.
Furthermore, clear targets and metrics should be established by firms to develop and sustain innovation
(Li & Atuahene-Gima, 2001). Pursing a greater number of innovation objectives is thought to increase the
probability that at least one of them will have a valuable innovation outcome (Leiponen & Helfat, 2010).
As organizations face uncertainty about the ultimate payoff when deciding whether to pursue a particular
objective, the payoff to innovation could increase with the number of objectives, because the “likelihood
of obtaining a favorable draw (a fruitful objective) from a distribution of payoffs increases as the number
of draws increases” (Leiponen & Helfat, 2010). This is called the benefits of breadth in innovation
objectives. Given the interrelation between business strategy and innovation (Cahill, 1998; Ettlie et al.,
1984; Ireland et al., 2001; O'brien, 2003), we would like to examine whether or not breadth in strategic
objectives could benefit innovation outcomes in the same way. In this context, the following hypotheses
are thus proposed:
Hypothesis 2a: A strategic focus on introducing new marketing practices is positively related to marketing
30
innovation.
Hypothesis 2b: Adoption of advanced technology is positively related to marketing innovation.
Hypothesis 2c: Breadth of long-term strategic objectives is positively related to marketing innovation.
3.2.3. Value chain: maintaining marketing within enterprise and acquiring or
expanding marketing capacity
A value chain can be defined as the “full range of activities that firms and workers do to bring a product
from its conception to its end use and beyond” (Gereffi & Fernandez-Stark, 2011). A typical value chain
should include the following activities: design, production, marketing, distribution and support to the final
consumer (De Backer & Miroudot, 2014). World trade and production activities are forming the “global
value chains” (GVCs). Activities in a GVC can be performed within the same firm or divided among
different firms within the same country or distributed globally (De Backer & Miroudot, 2014)
The value chain perspective shifts the focus from production alone to the whole range of activities from
design to marketing (Gereffi et al., 2001). A GVC view highlights that for many industries “access to
international markets is not achieved merely through designing, making and marketing new products”;
rather, it involves “gaining entry into international design, production and marketing networks consisting
of many different firms” (Gereffi et al., 2001). Leading firms (mostly from Western developed countries)
in a GVC are always those with brand names, while firms in the middle of a GVC could strive to shift
functions away from the more tangible aspects of production and to get control over the more profitable
functions of branding and marketing (Gereffi et al., 2001).
It’s important to understand the activities that can drive innovation in a value chain, since the capacity to
innovate is critical to “upgrade” in a GVC (Gereffi et al., 2001). Upgrading involves changes in the nature
and mix of activities (for example, taking responsibility for, or outsourcing accounting, logistics and
quality functions), both within each link in the chain, and in the distribution of intra-chain activities
(Gereffi et al., 2001). In a same logic, business decisions or changes in marketing activities, for instance
performing marketing within enterprises or outsourcing marketing, acquiring new marketing capacity or
maintaining current marketing capacity, might be related to innovation propensity in marketing as well,
regardless the position in the value chain. Moreover, participation in globalization enables organizations
to gain access to skills and knowledge which they did not have before (GVC report, 2014; Reddy, 1997).
As a result, the new skills and knowledge acquired would likely diffuse among organizations and inspire
new concept development and R&D, as well as drive changes in marketing, customer service and
31
management practices (GVC report, 2014; Reddy, 1997). Based on the argument above, the following
hypotheses are thus proposed:
Hypothesis 3a: Maintaining marketing within enterprise is positively related to marketing innovation.
Hypothesis 3b: Acquiring or expanding marketing capacity is positively related to marketing innovation.
4. Data source and methodology
4.1. Data sources
Data in this research draws on the surveys and nationwide census conducted by Statistics Canada. They
include the Survey of Innovation and Business Strategies (SIBS) 2009, the Survey of Innovation and
Business Strategies (SIBS) 2012, the Business Registry (BR) and the General Index of Financial
Information (GIFI).
The SIBS data covers many relevant questions that affect marketing innovations discussed in the
literature above, and allows for comparisons between firms of different sizes and industries. The SIBS
2009 and SIBS 2012 could facilitate comparisons between the periods of the financial crisis (i.e. late 2007
and the second quarter of 2009). The SIBS 2009 is a joint project by Industry Canada, Foreign Affairs
and International Trade Canada and Statistics Canada, initiated in 2007–2008 to better understand the
market and policy factors that encourage or discourage the adoption of entrepreneurial and innovation-
oriented business strategies. Between January and April 2010, a sample of 6233 enterprises in Canada
with more than 20 employees and spanning 67 industries were surveyed for SIBS 2009. Questionnaires,
which integrated various innovative features from other business surveys around the world, were sent to
the CEOs or senior managers of these enterprises. The survey response rate was 70 percent (Industry
Canada, 2011). The SIBS 2012 replicated the 2009 survey, as the same questionnaire was used. The
targeted population – enterprises in Canada with more than 20 employees and revenues of at
least $250,000 – also remained unchanged. Compared to the SIBS 2009, the sample size of the
SIBS 2012 was increased from 6,233 to 7,818 enterprises (Industry Canada, 2014). Both of the surveys
investigated business activities in the last three years (i.e. 2007-2009 for the SIBS 2009; 2010-2012 for
the SIBS 2012). Given the features above, a comparison of the two data sets is reasonable and expected to
drive deeper understanding of the research topics.
The Business Registry (BR) is the central repository of information on businesses in Canada. The BR is
32
used as the principal frame for the economic statistics program of Statistics Canada. The Business
Register's role is to provide Statistics Canada with a comprehensive quality frame in terms of coverage
and a set of stratification variables such as industrial classification, revenue, number of employees and
total assets. The BR maintains a complete, up to date and unduplicated list on all active businesses in
Canada that have a corporate income tax (T2) account, are an employer or have a GST account (Statistics
Canada, 2015).
The General Index of Financial Information (GIFI) collects enterprises’ financial information. It is a
standard list of codes corporations use to prepare their financial statements. All corporations (except for
insurance corporations) are required to prepare their financial statement information using the GIFI codes
and file it with their T2 returns. Non-resident corporations are also required to use the GIFI codes when
they are reporting in unconsolidated Canadian funds (Canada Revenue Agency, 2015).
4.2. Multilevel (random intercept) logistic regression
Regression methods are concerned with describing the relationship between a response variable and one
or more explanatory variables. The goal of an analysis using logistic regression, which is different from a
linear regression in using binary or dichotomous response, is the same as that of any other model-building
techniques: to find the best fitting and most parsimonious, yet reasonable model to describe the
relationship between an response variable and a set of explanatory variables (Hosmer Jr & Lemeshow,
2004). One of the fundamental assumptions of regression analyses is the independence of observations. If
individual observations are note independent of each other, for example due the existence of clusters
within which observations are more similar to each other than to other clusters, simple regression analyses
do not deliver reliable results. When the clustering structure in the data is ignored and the independence
assumption is violated, standard errors might be underestimated (Guo & Zhao, 2000). Ignoring the
clustering structure could also result in biases in parameter estimates, and thus draw false inferences from
the data (Guo & Zhao, 2000).
Multilevel regression analysis has become a standard analysis tool in such situations, as it accounts for
heterogeneity due to individual observations being clustered within higher level units. Social science and
health studies have started to use multilevel regression methods in the recent years, since their data are
frequently structured hierarchically. For example, data may consist of patients clustered within
physicians, who in turn may be clustered in hospitals or geographic regions.
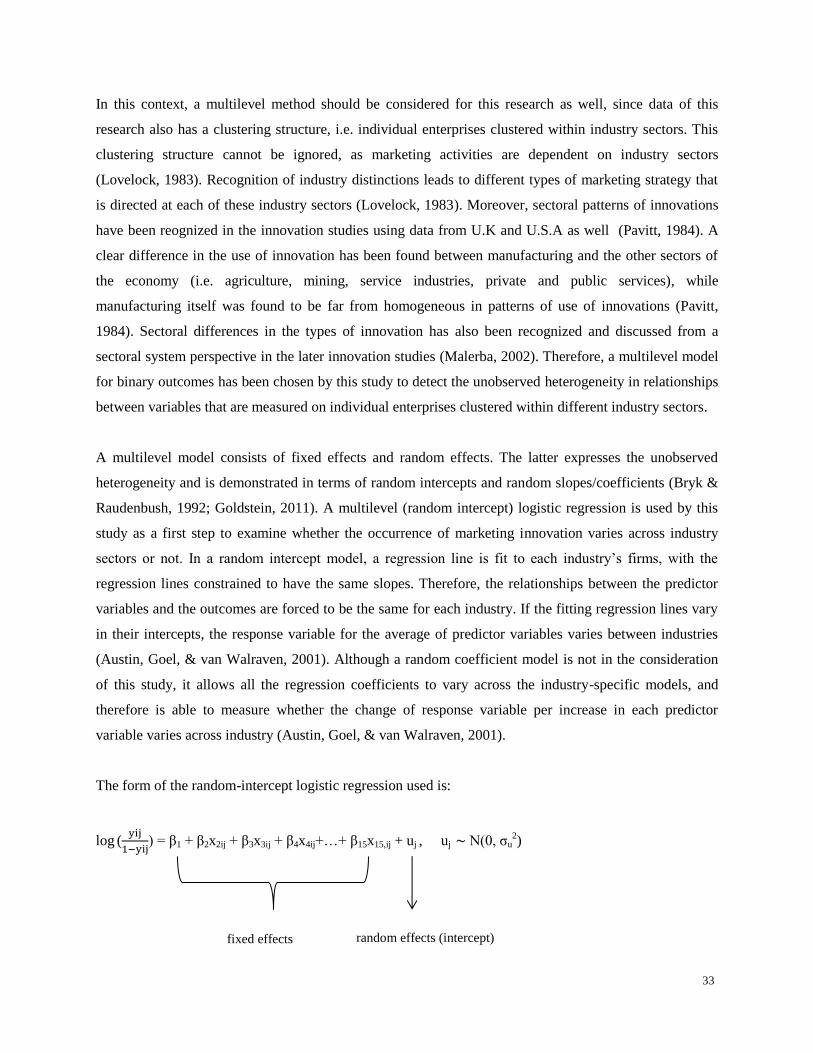
33
In this context, a multilevel method should be considered for this research as well, since data of this
research also has a clustering structure, i.e. individual enterprises clustered within industry sectors. This
clustering structure cannot be ignored, as marketing activities are dependent on industry sectors
(Lovelock, 1983). Recognition of industry distinctions leads to different types of marketing strategy that
is directed at each of these industry sectors (Lovelock, 1983). Moreover, sectoral patterns of innovations
have been reognized in the innovation studies using data from U.K and U.S.A as well (Pavitt, 1984). A
clear difference in the use of innovation has been found between manufacturing and the other sectors of
the economy (i.e. agriculture, mining, service industries, private and public services), while
manufacturing itself was found to be far from homogeneous in patterns of use of innovations (Pavitt,
1984). Sectoral differences in the types of innovation has also been recognized and discussed from a
sectoral system perspective in the later innovation studies (Malerba, 2002). Therefore, a multilevel model
for binary outcomes has been chosen by this study to detect the unobserved heterogeneity in relationships
between variables that are measured on individual enterprises clustered within different industry sectors.
A multilevel model consists of fixed effects and random effects. The latter expresses the unobserved
heterogeneity and is demonstrated in terms of random intercepts and random slopes/coefficients (Bryk &
Raudenbush, 1992; Goldstein, 2011). A multilevel (random intercept) logistic regression is used by this
study as a first step to examine whether the occurrence of marketing innovation varies across industry
sectors or not. In a random intercept model, a regression line is fit to each industry’s firms, with the
regression lines constrained to have the same slopes. Therefore, the relationships between the predictor
variables and the outcomes are forced to be the same for each industry. If the fitting regression lines vary
in their intercepts, the response variable for the average of predictor variables varies between industries
(Austin, Goel, & van Walraven, 2001). Although a random coefficient model is not in the consideration
of this study, it allows all the regression coefficients to vary across the industry-specific models, and
therefore is able to measure whether the change of response variable per increase in each predictor
variable varies across industry (Austin, Goel, & van Walraven, 2001).
The form of the random-intercept logistic regression used is:
log (yij
1−yij) = β1 + β2x2ij + β3x3ij + β4x4ij+…+ β15x15,ij + uj , uj ∼ N(0, σu
2)
fixed effects random effects (intercept)
34
n: total number of individual firms (level 1 units)
j: number of industry groups (level 2 units)
nj: number of individual firms in group j
xij: individual predictors
uj: random effect
σu2 : level 2 (residual) variance
yij: response probability for individual firm i in group j
In the equation, yij is the probability of firms that carry out marketing innovation. β1 is the intercept of
level 1 model. Xij’s represent 14 control and independent variables, which are sales, age, good/service
innovation, process innovation, organizational innovation, competitive intensity A (No. of competitors),
competitive intensity B (presence of MNE competitors), customer orientation, competitor orientation, a
strategic focus on new marketing practices, adoption of advanced technology, breadth of long-term
strategic objectives, maintaining marketing with enterprise, and acquiring or expanding marketing
capacity. β2 to β15 are parameter estimates. uj represents the random intercept effect of the level 2 variable
- industry. The model is measured for overall fit, statistical significance of the parameter estimates, their
direction and magnitude, and more importantly, whether the outcomes are statistically different across
level 2, i.e. industry sectors.
Under this context, the independent variable and control variables described above altogether form the
first-level variables, while industry is considered as the second-level variable, and marketing innovation is
the response variable. More details of all the variables are discussed below.
5. Variable description
The following is an overview of variables required from each database; the specific measures are
described in more detail in the following section.
5.1. Dependent variable
The dependent variables for this study are marketing innovation, which are derived from SIBS.
Innovation activities in the “4Ps” of marketing – design/packing, promotion, placement, and pricing –
were examined to measure activities in marketing innovation. Firms were asked to rate Yes or No for
each of the four dimensions. Marketing innovation has been coded as a binary variable. If a firm indicates
35
that it has adopted marketing innovation in any of the four dimensions, 1 is assigned, otherwise 0. [Please
refer to Table 3 for details.]
5.2. Independent variables
Competitive intensity is measured by a) the number of competitors and b) the presence of multinational
competitors, respectively. Both have been made as binary variables. To measure competitive intensity A,
if a firm indicates that its competitor’s number equals or above four, 1 is assigned, otherwise 0. In detail,
respondents were given seven choices in the survey to rate the competitive intensity their enterprises are
faced up. The competitive intensity was measured by having competitors from “1”, “2”, “3”, “4-5”, “6-
10”, “11-20” to “more than 20”. The median choice “4-5” was chosen as a cut-off to compose the binary
variable. To measure competitive intensity B, if a firm indicates that it has multinational enterprises
among its competitors in its main competing market, 1 is assigned, otherwise 0. [Please refer to Table 3
for details.]
Competitor orientation is measured by whether firms did a) change the quality of your good or service, b)
adopt a new technology or process, c) change marketing expenditures, d) introduce a new good or service,
e) speed up the introduction of a new good or service, and f) change the price of your good or service.
Each question is answered by Yes or No and coded as 1 and 0 accordingly. This variable is computed as
the sum of these six items. By doing so, all the items were assumed to be equally important and useful to
the variable of competitor orientation. [Please refer to Table 3 for details.]
Customer orientation is measured by whether firms carried out substantial or significant changes to
respond to specific customer requirements that include a) implemented specific cost reductions, b)
improved good or service quality, c) accepted greater risk sharing (i.e. accepted consignment-based
payments), d) incurred greater up-front or non-recurring costs (e.g. investments in new technology,
design), e) entered into a new geographic region or expanded existing operations, f) undertook a new
business activity or expanded existing business activities, g) extended business hours to accommodate
employees, customers or suppliers in other time zones. Each question is answered by Yes or No and
coded as 1 and 0 accordingly. This variable is computed as the sum of these seven items. By doing so, all
the items were assumed to be equally important and useful to the variable of customer orientation. [Please
refer to Table 3 for details.]
A strategic focus on new marketing practices or methods is defined by whether firms seek to introduce
36
new or significantly improved marketing practices or methods, or mainly seek to maintain or intensify
current marketing practices or methods. Respondents are asked to check only one from the two options,
and the choice of the former is coded as 1. To differentiate this variable from marketing innovation, a
strategic focus measures enterprises’ goal or intention to bring in new marketing practices, whereas
marketing innovation measures whether enterprises did carry out marketing innovation or not. [Please
refer to Table 3 for details.]
Technology strategy is defined by the adoption of advanced technologies, which are the new technologies
(equipment or software) that perform a new function or improve some function significantly better than
commonly used technologies in the industry or by competitors. This variable is composed of nine
measures: a) advanced computerized design and engineering, b) advanced computerized processing,
fabrication, and assembly technologies , c) advanced computerized inspection technologies, d) advanced
communication technologies, e) advanced automated material handling technologies, f) advanced
information integration and control technologies, g) advanced biotechnologies/by-products, h) advanced
nanotechnologies and i) advanced green technologies. Each measure is answered by Yes or No and coded
as 1 or 0 accordingly. This variable is computed as the sum of all above measures. By doing so, all the
items were assumed to be equally important and useful to the variable of technology adoption. [Please
refer to Table 3 for details.]
Breadth of long term strategic objectives is measured by seven indictors from the questionnaire, which
are a) gross margin/operating margin growth, b) sales/income growth, c) shareholder dividends growth, d)
market/customer share growth, e) increased customer satisfaction, f) increased sale of new products and
g) improved delivery time. Respondents are required to check all that apply and each indictor is coded as
1. This variable is computed by the sum of all indicators checked. [Please refer to Table 3 for details.]
Maintaining marketing within enterprise is the variable used to measure whether firms carry out
marketing activities within enterprises, regardless the locations of their business (inside Canada or outside
Canada). This variable is measured upon two items: a) marketing implemented in Canada within
enterprise, and b) marketing implemented outside of Canada within enterprise. It is computed as a binary
variable and 1 stands for firms’ choices of a or b. [Please refer to Table 3 for details.]
Acquiring or expanding marketing capacity is measured upon a) marketing capacity obtained by merger
and acquisition in Canada, inside Canada or outside Canada; and b) capacity expanded or acquired
through newly opened facility, inside Canada or outside Canada. It is computed as a binary variable and 1
37
stands for firms’ choices of a or b. [Please refer to Table 3 for details.]
5.3. Control variables
Firm Characteristics is measured by two characteristics of firms, including past sales volume and age, as
marketing performance (e.g. sales) and firm age is found to have an impact on a new product life cycle
time and innovation capability (Aydin, Cetin, & Ozer, 2007; Calantone, Cavusgil, & Zhao, 2002). Data
for these measures is obtained from the GIFI and the BR, and used after the natural logarithmic
transformation. [Please refer to Table 3 for details.]
Process innovation is measured by whether firms introduced a) new or significantly improved methods of
manufacturing or producing goods or services, b) new or significantly improved logistics, delivery or
distribution methods for your inputs, goods or services and c) new or significantly improved supporting
activities for your processes, such as maintenance systems or operations for purchasing, accounting, or
computing. Firms are asked to choose Yes or No for each activity. If a firm indicates that it has adopted
process innovation in any of the above dimensions, 1 is assigned, otherwise 0. [Please refer to Table 3 for
details.]
Product or service innovations is measured by whether firms introduced a) new or significantly improved
goods? (excluding the simple resale of new goods purchased from other enterprises and changes of a
solely aesthetic nature), b) new or significantly improved services. Firms are asked to choose Yes or No
for each activity. If a firm indicates that it has adopted product innovation in any of the above dimensions,
1 is assigned, otherwise 0. [Please refer to Table 3 for details.]
Organizational innovation is measured by whether firms introduced a) new business practices for
organizing procedures, b) new methods of organizing work responsibilities and decision making and c)
new methods of organizing external relations with other firms or public institutions. Firms are asked to
choose Yes or No for each activity. If a firm indicates that it has adopted organizational innovation in any
of the above dimensions, 1 is assigned, otherwise 0. [Please refer to Table 3 for details].
5.4. Second-level variable
Distinctions of industry types lead to different marketing strategies and practices (Lovelock, 1983). To
examine whether outcomes of this research are different across industry sectors, this research has used

38
industry as a second-level variable. The variable is constructed based on 3-digit North American Industry
Classification System (NAICS) Canada codes. To ensure individual firms are evenly distributed across
industries, 18 sectors have been grouped to describe the variable of industry after considering the business
nature of each industry cluster. [Please refer to Table 3 for details.]
Table 3 provides the description of variables, including definitions and sources of data. Table 4 and Table
5 present the sample descriptive of all the variables constructed upon the SIBS 2009 and the SIBS 2012
data sets. The regression model from the SIBS 2009 data consists of 3802 observations, while the model
from the SIBS 2012 data consists of 4060 observations. [Please refer to Table 4 and 5 for details.]
Table 3. Description of variables
Dependent variable
Marketing innovation = 1 if a/b/c/d = 1, otherwise 0
a. Significant changes to the aesthetic design or packaging of a good or service (exclude changes
that alter the product’s functional or user characteristics – these are product innovations)?
[Code Yes as 1/No as 0]
b. New media or techniques for good or service promotion (i.e. the first time use of a new
advertising media, a new brand image, introduction of loyalty cards, etc.)? [Code Yes as 1/No
as 0]
c. New methods for good or service placement or sales channels (i.e. first time use of
franchising or distribution licenses, direct selling, exclusive retailing, new concepts for good or
service presentation, etc.)? [Code Yes as 1/No as 0]
d. New methods of pricing goods or services (i.e. first time use of variable pricing by demand,
discount systems, etc.)? [Code Yes as 1/No as 0]
Source: SIBS (2009; 2012)
Independent variables
Orientations; strategies, value chain,
Orientations
A. Customer orientation = (a+b)/2+c+d+e+f+g+h+i
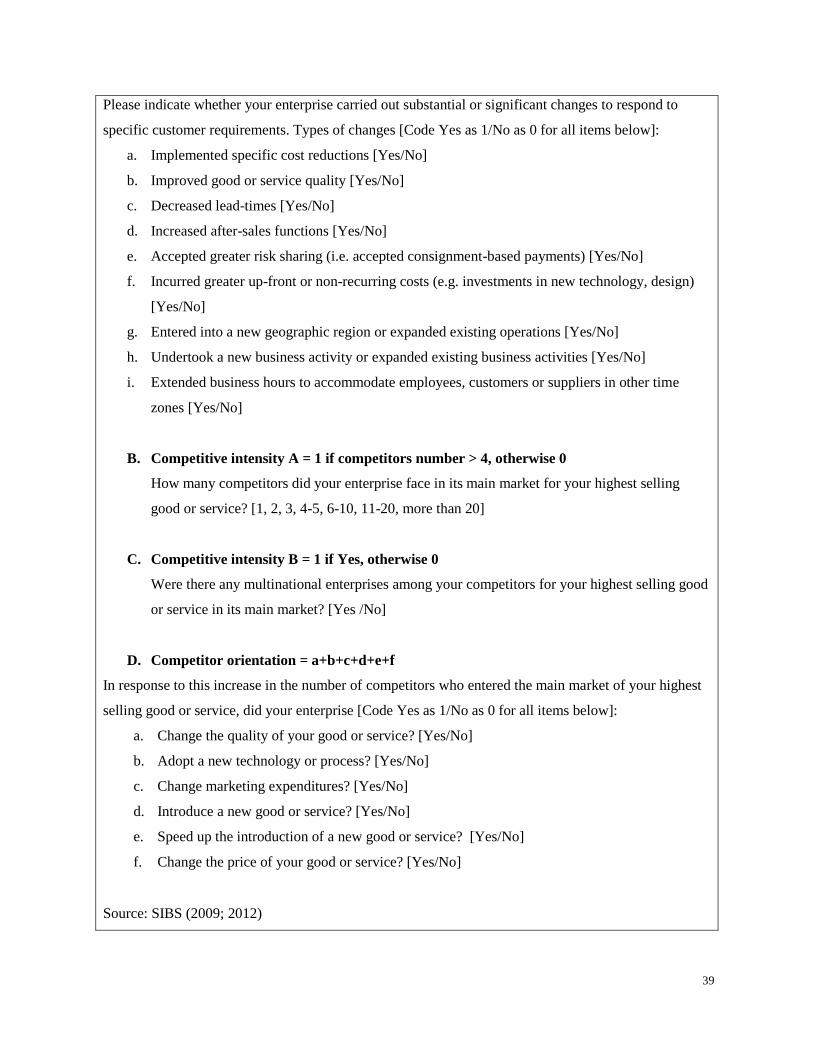
39
Please indicate whether your enterprise carried out substantial or significant changes to respond to
specific customer requirements. Types of changes [Code Yes as 1/No as 0 for all items below]:
a. Implemented specific cost reductions [Yes/No]
b. Improved good or service quality [Yes/No]
c. Decreased lead-times [Yes/No]
d. Increased after-sales functions [Yes/No]
e. Accepted greater risk sharing (i.e. accepted consignment-based payments) [Yes/No]
f. Incurred greater up-front or non-recurring costs (e.g. investments in new technology, design)
[Yes/No]
g. Entered into a new geographic region or expanded existing operations [Yes/No]
h. Undertook a new business activity or expanded existing business activities [Yes/No]
i. Extended business hours to accommodate employees, customers or suppliers in other time
zones [Yes/No]
B. Competitive intensity A = 1 if competitors number > 4, otherwise 0
How many competitors did your enterprise face in its main market for your highest selling
good or service? [1, 2, 3, 4-5, 6-10, 11-20, more than 20]
C. Competitive intensity B = 1 if Yes, otherwise 0
Were there any multinational enterprises among your competitors for your highest selling good
or service in its main market? [Yes /No]
D. Competitor orientation = a+b+c+d+e+f
E. In response to this increase in the number of competitors who entered the main market of your highest
selling good or service, did your enterprise [Code Yes as 1/No as 0 for all items below]:
a. Change the quality of your good or service? [Yes/No]
b. Adopt a new technology or process? [Yes/No]
c. Change marketing expenditures? [Yes/No]
d. Introduce a new good or service? [Yes/No]
e. Speed up the introduction of a new good or service? [Yes/No]
f. Change the price of your good or service? [Yes/No]
Source: SIBS (2009; 2012)
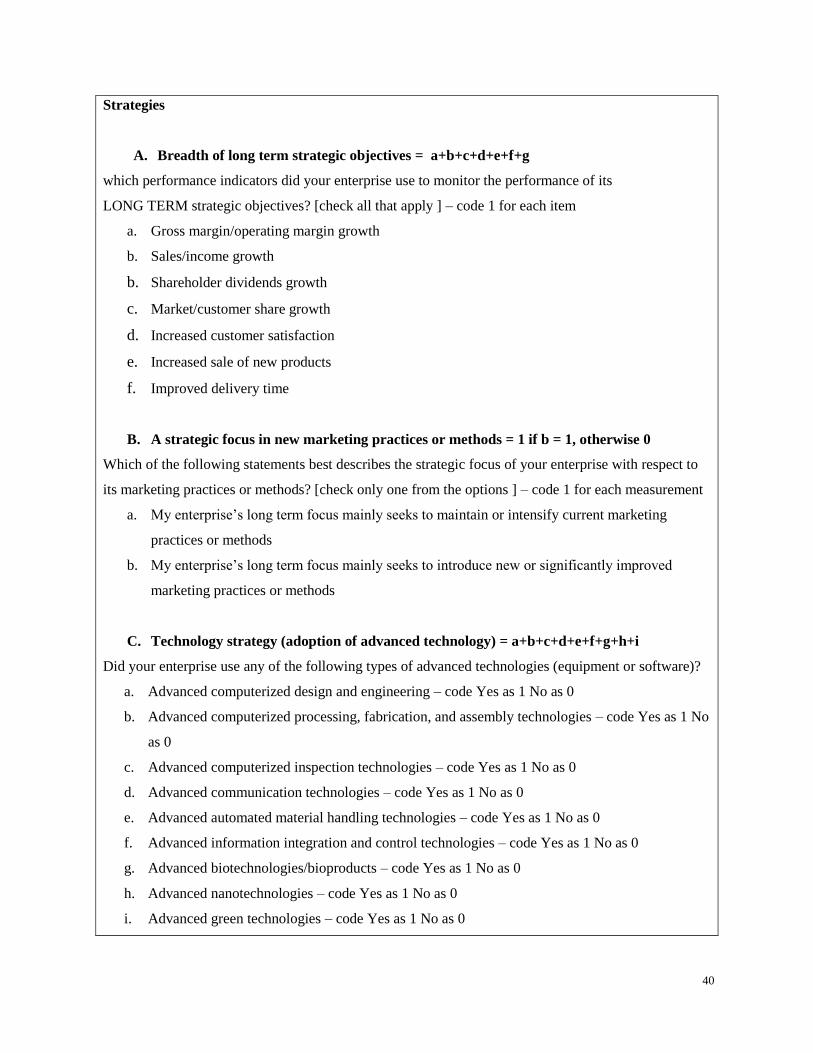
40
Strategies
A. Breadth of long term strategic objectives = a+b+c+d+e+f+g
which performance indicators did your enterprise use to monitor the performance of its
LONG TERM strategic objectives? [check all that apply ] – code 1 for each item
a. Gross margin/operating margin growth
b. Sales/income growth
b. Shareholder dividends growth
c. Market/customer share growth
d. Increased customer satisfaction
e. Increased sale of new products
f. Improved delivery time
B. A strategic focus in new marketing practices or methods = 1 if b = 1, otherwise 0
Which of the following statements best describes the strategic focus of your enterprise with respect to
its marketing practices or methods? [check only one from the options ] – code 1 for each measurement
a. My enterprise’s long term focus mainly seeks to maintain or intensify current marketing
practices or methods
b. My enterprise’s long term focus mainly seeks to introduce new or significantly improved
marketing practices or methods
C. Technology strategy (adoption of advanced technology) = a+b+c+d+e+f+g+h+i
Did your enterprise use any of the following types of advanced technologies (equipment or software)?
a. Advanced computerized design and engineering – code Yes as 1 No as 0
b. Advanced computerized processing, fabrication, and assembly technologies – code Yes as 1 No
as 0
c. Advanced computerized inspection technologies – code Yes as 1 No as 0
d. Advanced communication technologies – code Yes as 1 No as 0
e. Advanced automated material handling technologies – code Yes as 1 No as 0
f. Advanced information integration and control technologies – code Yes as 1 No as 0
g. Advanced biotechnologies/bioproducts – code Yes as 1 No as 0
h. Advanced nanotechnologies – code Yes as 1 No as 0
i. Advanced green technologies – code Yes as 1 No as 0
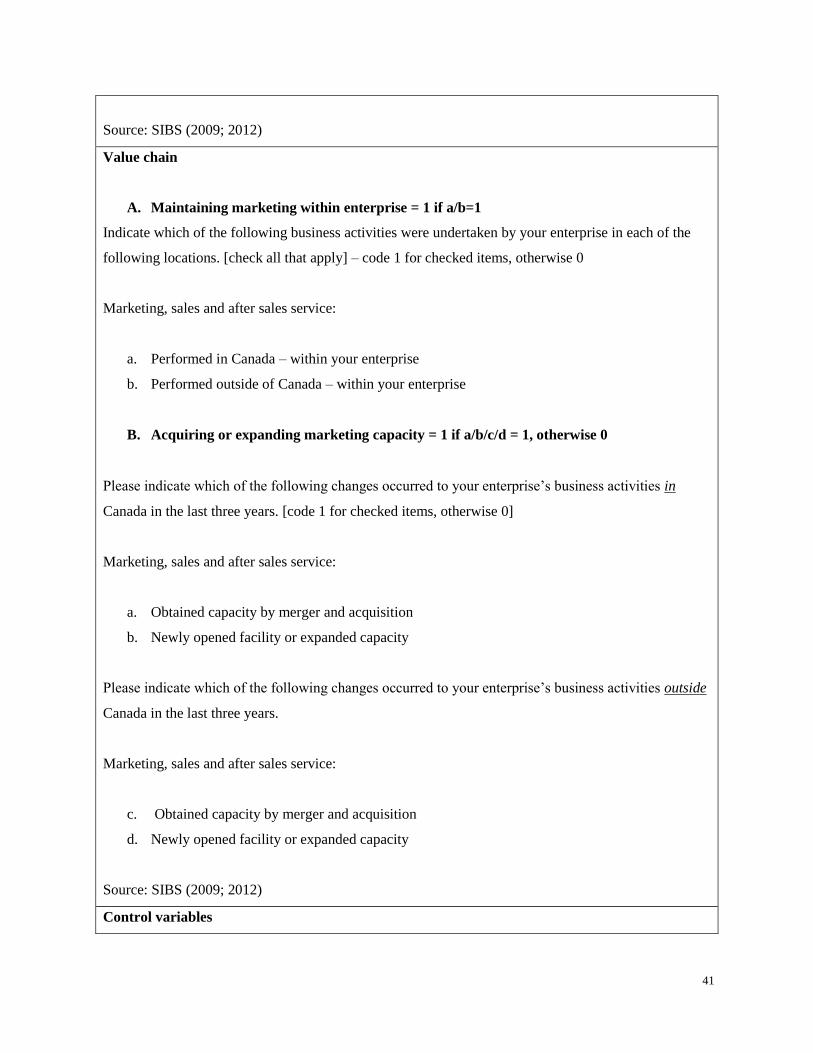
41
Source: SIBS (2009; 2012)
Value chain
A. Maintaining marketing within enterprise = 1 if a/b=1
Indicate which of the following business activities were undertaken by your enterprise in each of the
following locations. [check all that apply] – code 1 for checked items, otherwise 0
Marketing, sales and after sales service:
a. Performed in Canada – within your enterprise
b. Performed outside of Canada – within your enterprise
B. Acquiring or expanding marketing capacity = 1 if a/b/c/d = 1, otherwise 0
Please indicate which of the following changes occurred to your enterprise’s business activities in
Canada in the last three years. [code 1 for checked items, otherwise 0]
Marketing, sales and after sales service:
a. Obtained capacity by merger and acquisition
b. Newly opened facility or expanded capacity
Please indicate which of the following changes occurred to your enterprise’s business activities outside
Canada in the last three years.
Marketing, sales and after sales service:
c. Obtained capacity by merger and acquisition
d. Newly opened facility or expanded capacity
Source: SIBS (2009; 2012)
Control variables
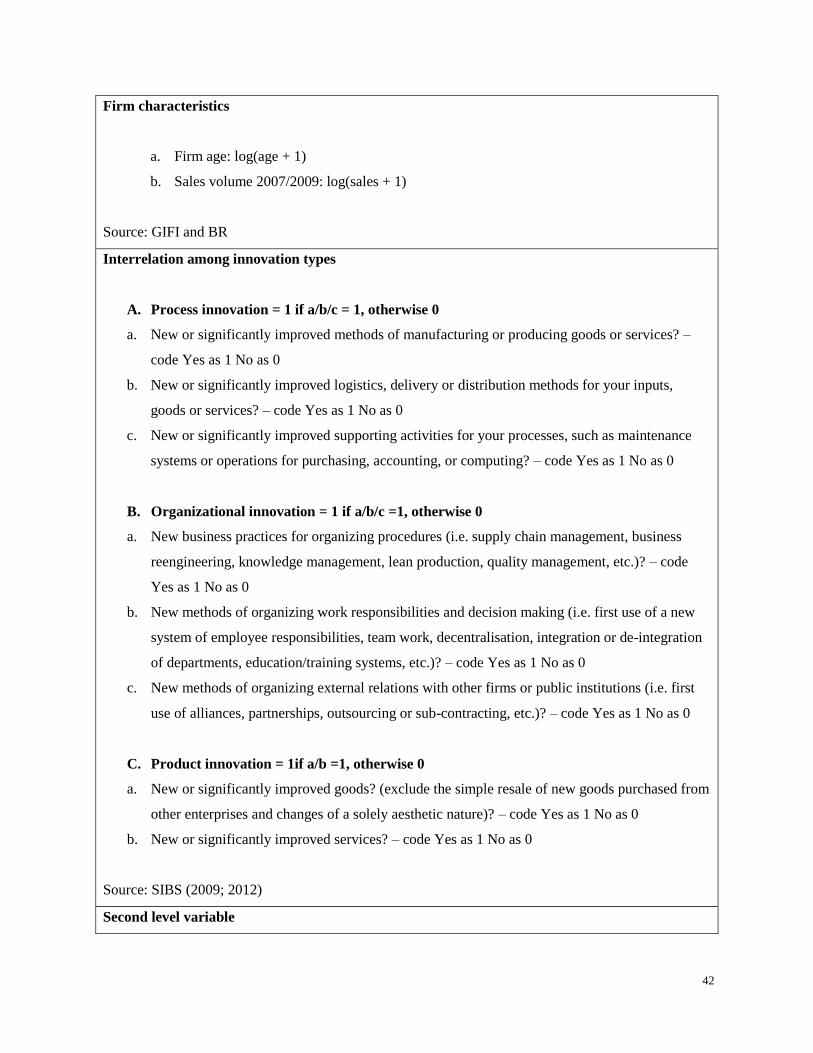
42
Firm characteristics
a. Firm age: log(age + 1)
b. Sales volume 2007/2009: log(sales + 1)
Source: GIFI and BR
Interrelation among innovation types
A. Process innovation = 1 if a/b/c = 1, otherwise 0
a. New or significantly improved methods of manufacturing or producing goods or services? –
code Yes as 1 No as 0
b. New or significantly improved logistics, delivery or distribution methods for your inputs,
goods or services? – code Yes as 1 No as 0
c. New or significantly improved supporting activities for your processes, such as maintenance
systems or operations for purchasing, accounting, or computing? – code Yes as 1 No as 0
B. Organizational innovation = 1 if a/b/c =1, otherwise 0
a. New business practices for organizing procedures (i.e. supply chain management, business
reengineering, knowledge management, lean production, quality management, etc.)? – code
Yes as 1 No as 0
b. New methods of organizing work responsibilities and decision making (i.e. first use of a new
system of employee responsibilities, team work, decentralisation, integration or de-integration
of departments, education/training systems, etc.)? – code Yes as 1 No as 0
c. New methods of organizing external relations with other firms or public institutions (i.e. first
use of alliances, partnerships, outsourcing or sub-contracting, etc.)? – code Yes as 1 No as 0
C. Product innovation = 1if a/b =1, otherwise 0
a. New or significantly improved goods? (exclude the simple resale of new goods purchased from
other enterprises and changes of a solely aesthetic nature)? – code Yes as 1 No as 0
b. New or significantly improved services? – code Yes as 1 No as 0
Source: SIBS (2009; 2012)
Second level variable
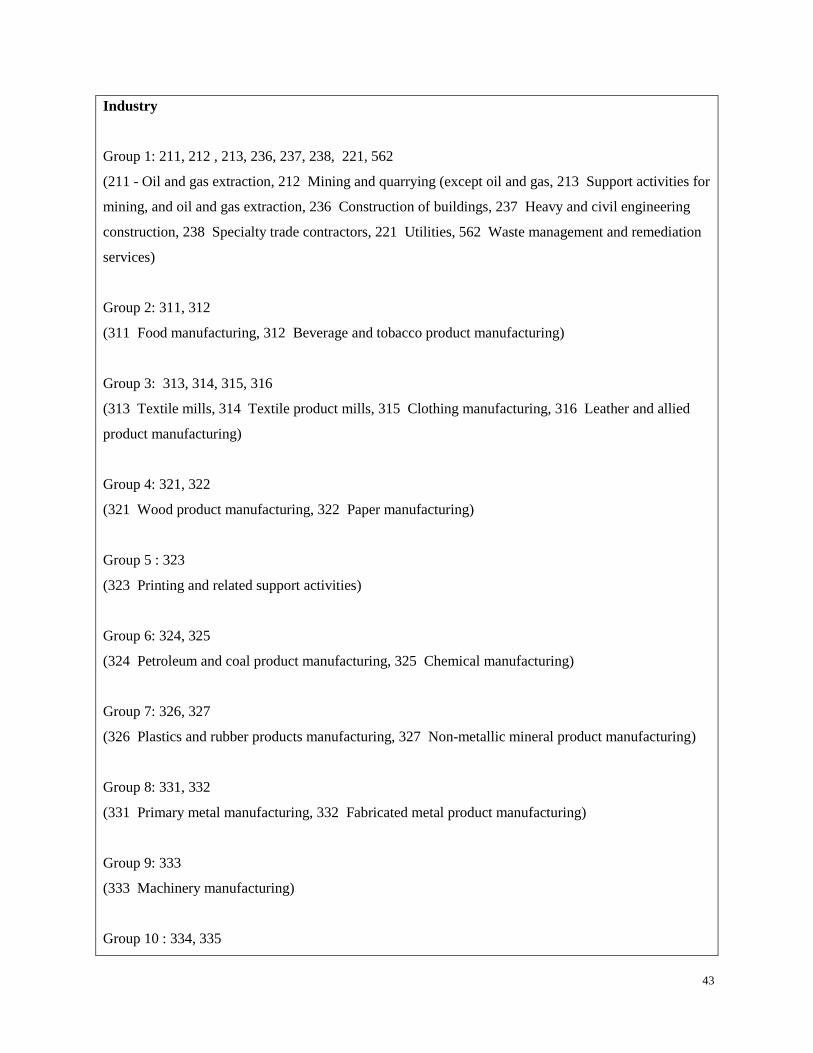
43
Industry
Group 1: 211, 212 , 213, 236, 237, 238, 221, 562
(211 - Oil and gas extraction, 212 Mining and quarrying (except oil and gas, 213 Support activities for
mining, and oil and gas extraction, 236 Construction of buildings, 237 Heavy and civil engineering
construction, 238 Specialty trade contractors, 221 Utilities, 562 Waste management and remediation
services)
Group 2: 311, 312
(311 Food manufacturing, 312 Beverage and tobacco product manufacturing)
Group 3: 313, 314, 315, 316
(313 Textile mills, 314 Textile product mills, 315 Clothing manufacturing, 316 Leather and allied
product manufacturing)
Group 4: 321, 322
(321 Wood product manufacturing, 322 Paper manufacturing)
Group 5 : 323
(323 Printing and related support activities)
Group 6: 324, 325
(324 Petroleum and coal product manufacturing, 325 Chemical manufacturing)
Group 7: 326, 327
(326 Plastics and rubber products manufacturing, 327 Non-metallic mineral product manufacturing)
Group 8: 331, 332
(331 Primary metal manufacturing, 332 Fabricated metal product manufacturing)
Group 9: 333
(333 Machinery manufacturing)
Group 10 : 334, 335
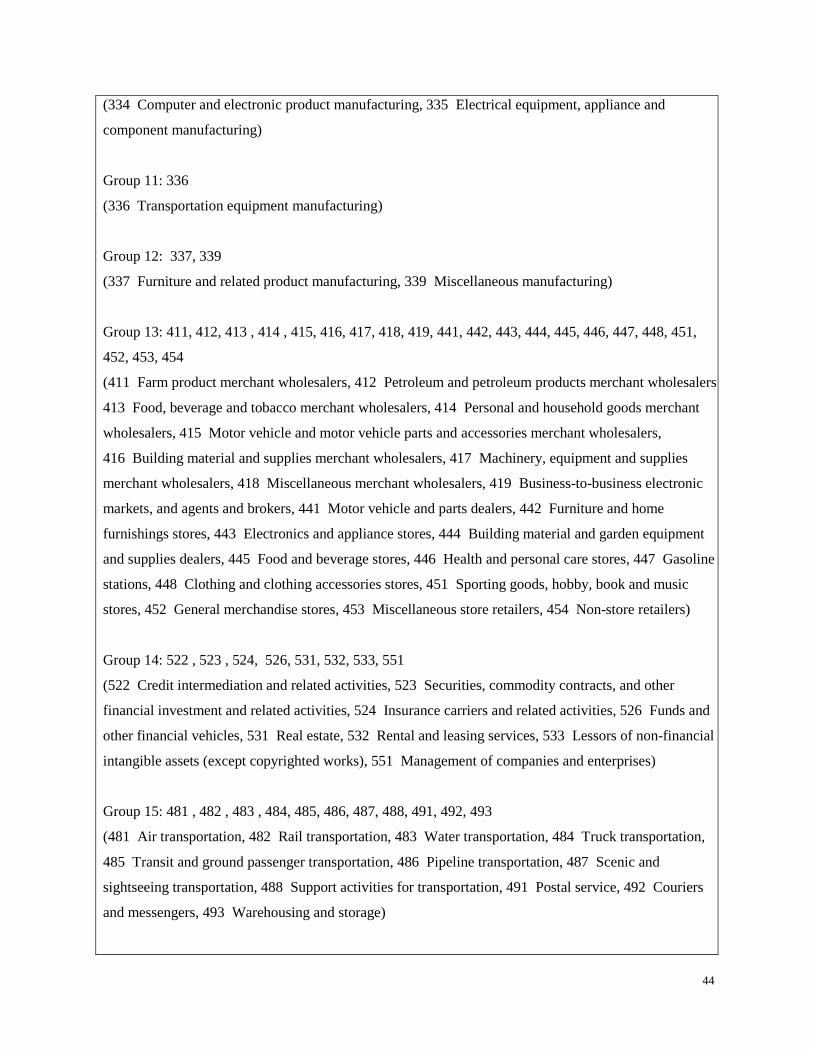
44
(334 Computer and electronic product manufacturing, 335 Electrical equipment, appliance and
component manufacturing)
Group 11: 336
(336 Transportation equipment manufacturing)
Group 12: 337, 339
(337 Furniture and related product manufacturing, 339 Miscellaneous manufacturing)
Group 13: 411, 412, 413 , 414 , 415, 416, 417, 418, 419, 441, 442, 443, 444, 445, 446, 447, 448, 451,
452, 453, 454
(411 Farm product merchant wholesalers, 412 Petroleum and petroleum products merchant wholesalers,
413 Food, beverage and tobacco merchant wholesalers, 414 Personal and household goods merchant
wholesalers, 415 Motor vehicle and motor vehicle parts and accessories merchant wholesalers,
416 Building material and supplies merchant wholesalers, 417 Machinery, equipment and supplies
merchant wholesalers, 418 Miscellaneous merchant wholesalers, 419 Business-to-business electronic
markets, and agents and brokers, 441 Motor vehicle and parts dealers, 442 Furniture and home
furnishings stores, 443 Electronics and appliance stores, 444 Building material and garden equipment
and supplies dealers, 445 Food and beverage stores, 446 Health and personal care stores, 447 Gasoline
stations, 448 Clothing and clothing accessories stores, 451 Sporting goods, hobby, book and music
stores, 452 General merchandise stores, 453 Miscellaneous store retailers, 454 Non-store retailers)
Group 14: 522 , 523 , 524, 526, 531, 532, 533, 551
(522 Credit intermediation and related activities, 523 Securities, commodity contracts, and other
financial investment and related activities, 524 Insurance carriers and related activities, 526 Funds and
other financial vehicles, 531 Real estate, 532 Rental and leasing services, 533 Lessors of non-financial
intangible assets (except copyrighted works), 551 Management of companies and enterprises)
Group 15: 481 , 482 , 483 , 484, 485, 486, 487, 488, 491, 492, 493
(481 Air transportation, 482 Rail transportation, 483 Water transportation, 484 Truck transportation,
485 Transit and ground passenger transportation, 486 Pipeline transportation, 487 Scenic and
sightseeing transportation, 488 Support activities for transportation, 491 Postal service, 492 Couriers
and messengers, 493 Warehousing and storage)
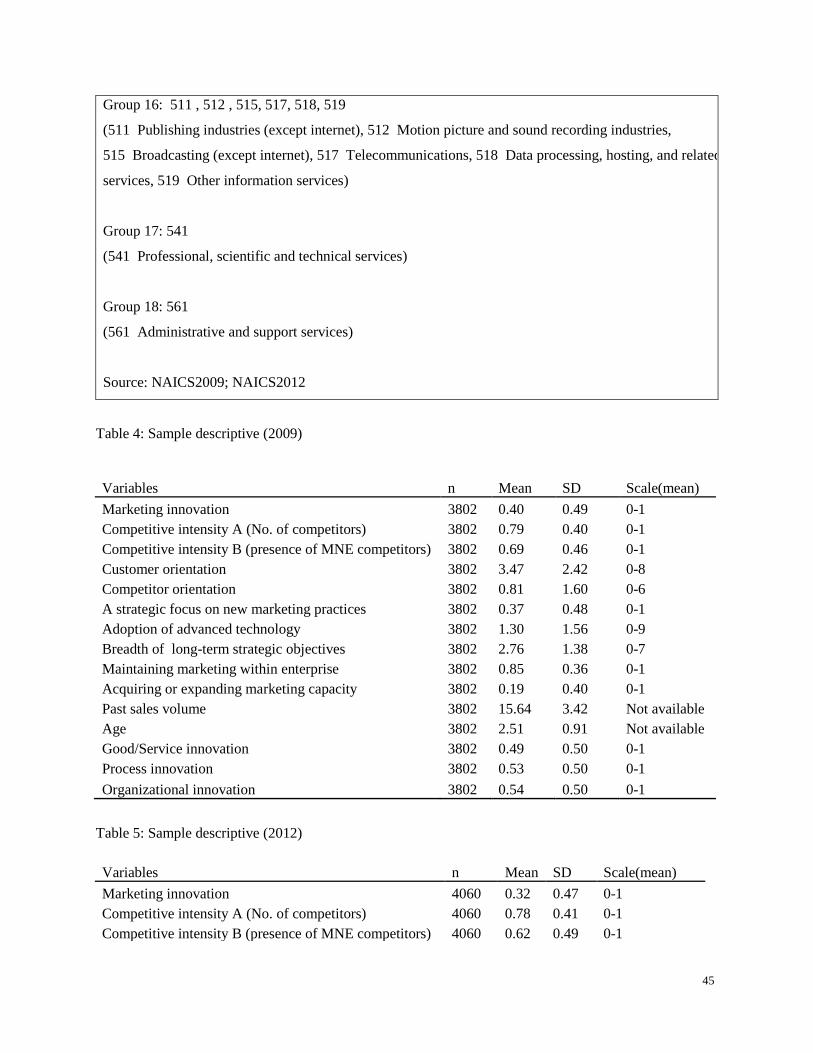
45
Group 16: 511 , 512 , 515, 517, 518, 519
(511 Publishing industries (except internet), 512 Motion picture and sound recording industries,
515 Broadcasting (except internet), 517 Telecommunications, 518 Data processing, hosting, and related
services, 519 Other information services)
Group 17: 541
(541 Professional, scientific and technical services)
Group 18: 561
(561 Administrative and support services)
Source: NAICS2009; NAICS2012
Table 4: Sample descriptive (2009)
Variables n Mean SD Scale(mean)
Marketing innovation 3802 0.40 0.49 0-1
Competitive intensity A (No. of competitors) 3802 0.79 0.40 0-1
Competitive intensity B (presence of MNE competitors) 3802 0.69 0.46 0-1
Customer orientation 3802 3.47 2.42 0-8
Competitor orientation 3802 0.81 1.60 0-6
A strategic focus on new marketing practices 3802 0.37 0.48 0-1
Adoption of advanced technology 3802 1.30 1.56 0-9
Breadth of long-term strategic objectives 3802 2.76 1.38 0-7
Maintaining marketing within enterprise 3802 0.85 0.36 0-1
Acquiring or expanding marketing capacity 3802 0.19 0.40 0-1
Past sales volume 3802 15.64 3.42 Not available
Age 3802 2.51 0.91 Not available
Good/Service innovation 3802 0.49 0.50 0-1
Process innovation 3802 0.53 0.50 0-1
Organizational innovation 3802 0.54 0.50 0-1
Table 5: Sample descriptive (2012)
Variables n Mean SD Scale(mean)
Marketing innovation 4060 0.32 0.47 0-1
Competitive intensity A (No. of competitors) 4060 0.78 0.41 0-1
Competitive intensity B (presence of MNE competitors) 4060 0.62 0.49 0-1
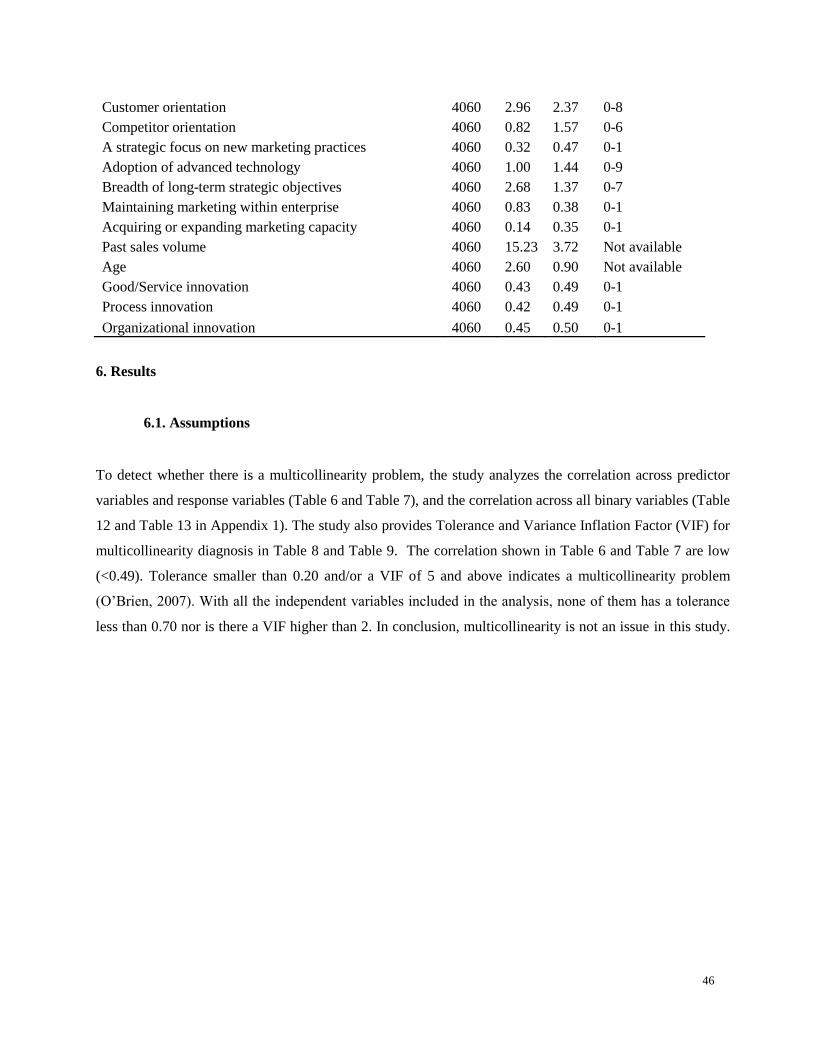
46
Customer orientation 4060 2.96 2.37 0-8
Competitor orientation 4060 0.82 1.57 0-6
A strategic focus on new marketing practices 4060 0.32 0.47 0-1
Adoption of advanced technology 4060 1.00 1.44 0-9
Breadth of long-term strategic objectives 4060 2.68 1.37 0-7
Maintaining marketing within enterprise 4060 0.83 0.38 0-1
Acquiring or expanding marketing capacity 4060 0.14 0.35 0-1
Past sales volume 4060 15.23 3.72 Not available
Age 4060 2.60 0.90 Not available
Good/Service innovation 4060 0.43 0.49 0-1
Process innovation 4060 0.42 0.49 0-1
Organizational innovation 4060 0.45 0.50 0-1
6. Results
6.1. Assumptions
To detect whether there is a multicollinearity problem, the study analyzes the correlation across predictor
variables and response variables (Table 6 and Table 7), and the correlation across all binary variables (Table
12 and Table 13 in Appendix 1). The study also provides Tolerance and Variance Inflation Factor (VIF) for
multicollinearity diagnosis in Table 8 and Table 9. The correlation shown in Table 6 and Table 7 are low
(<0.49). Tolerance smaller than 0.20 and/or a VIF of 5 and above indicates a multicollinearity problem
(O’Brien, 2007). With all the independent variables included in the analysis, none of them has a tolerance
less than 0.70 nor is there a VIF higher than 2. In conclusion, multicollinearity is not an issue in this study.
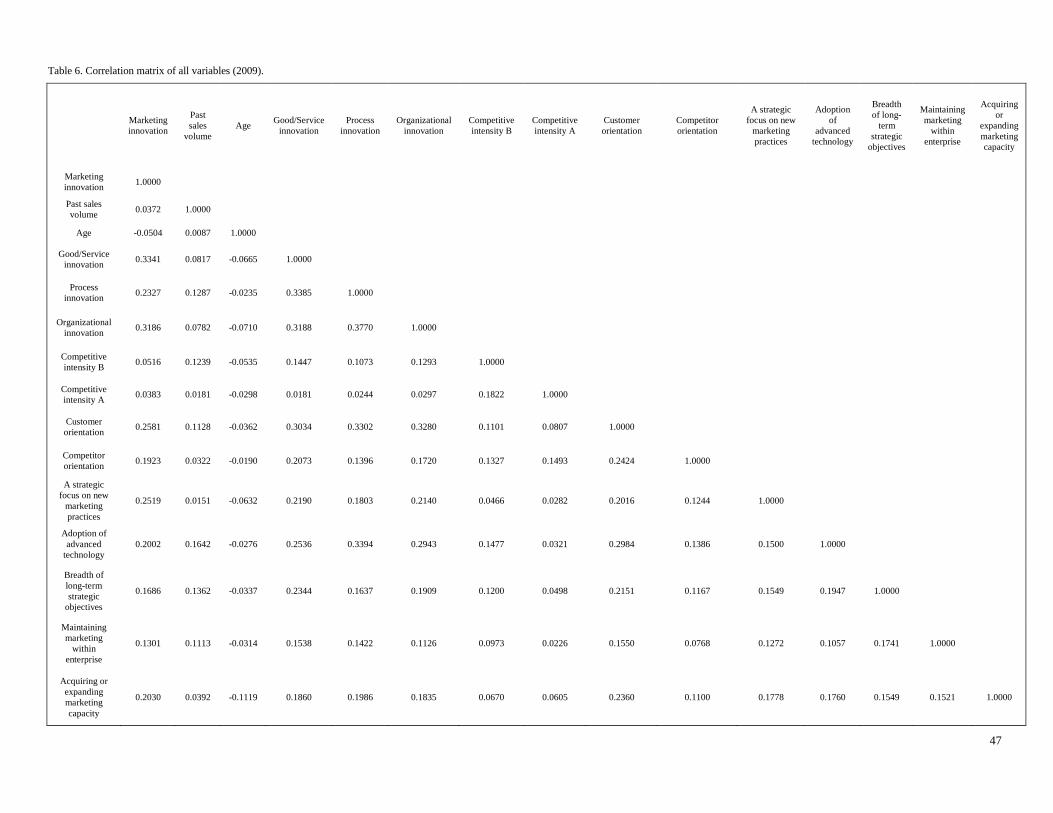
47
Table 6. Correlation matrix of all variables (2009).
Marketing
innovation
Past
sales
volume
Age Good/Service
innovation
Process
innovation
Organizational
innovation
Competitive
intensity B
Competitive
intensity A
Customer
orientation
Competitor
orientation
A strategic
focus on new
marketing
practices
Adoption
of
advanced
technology
Breadth
of long-
term
strategic
objectives
Maintaining
marketing
within
enterprise
Acquiring
or
expanding
marketing
capacity
Marketing
innovation 1.0000
Past sales
volume 0.0372 1.0000
Age -0.0504 0.0087 1.0000
Good/Service
innovation 0.3341 0.0817 -0.0665 1.0000
Process
innovation 0.2327 0.1287 -0.0235 0.3385 1.0000
Organizational
innovation 0.3186 0.0782 -0.0710 0.3188 0.3770 1.0000
Competitive
intensity B 0.0516 0.1239 -0.0535 0.1447 0.1073 0.1293 1.0000
Competitive
intensity A 0.0383 0.0181 -0.0298 0.0181 0.0244 0.0297 0.1822 1.0000
Customer
orientation 0.2581 0.1128 -0.0362 0.3034 0.3302 0.3280 0.1101 0.0807 1.0000
Competitor
orientation 0.1923 0.0322 -0.0190 0.2073 0.1396 0.1720 0.1327 0.1493 0.2424 1.0000
A strategic
focus on new
marketing
practices
0.2519 0.0151 -0.0632 0.2190 0.1803 0.2140 0.0466 0.0282 0.2016 0.1244 1.0000
Adoption of
advanced
technology
0.2002 0.1642 -0.0276 0.2536 0.3394 0.2943 0.1477 0.0321 0.2984 0.1386 0.1500 1.0000
Breadth of
long-term
strategic
objectives
0.1686 0.1362 -0.0337 0.2344 0.1637 0.1909 0.1200 0.0498 0.2151 0.1167 0.1549 0.1947 1.0000
Maintaining
marketing
within
enterprise
0.1301 0.1113 -0.0314 0.1538 0.1422 0.1126 0.0973 0.0226 0.1550 0.0768 0.1272 0.1057 0.1741 1.0000
Acquiring or
expanding
marketing
capacity
0.2030 0.0392 -0.1119 0.1860 0.1986 0.1835 0.0670 0.0605 0.2360 0.1100 0.1778 0.1760 0.1549 0.1521 1.0000
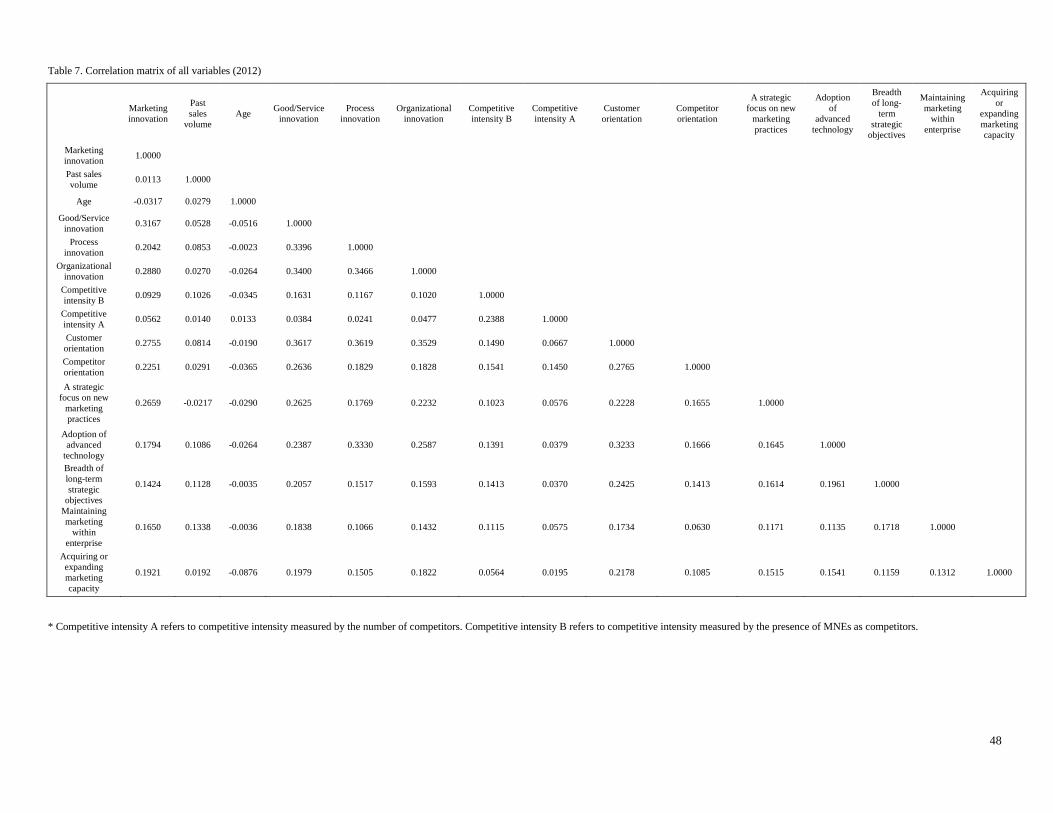
48
Table 7. Correlation matrix of all variables (2012)
Marketing
innovation
Past
sales
volume
Age Good/Service
innovation
Process
innovation
Organizational
innovation
Competitive
intensity B
Competitive
intensity A
Customer
orientation
Competitor
orientation
A strategic
focus on new
marketing
practices
Adoption
of
advanced
technology
Breadth
of long-
term
strategic
objectives
Maintaining
marketing
within
enterprise
Acquiring
or
expanding
marketing
capacity
Marketing
innovation 1.0000
Past sales
volume 0.0113 1.0000
Age -0.0317 0.0279 1.0000
Good/Service
innovation 0.3167 0.0528 -0.0516 1.0000
Process
innovation 0.2042 0.0853 -0.0023 0.3396 1.0000
Organizational
innovation 0.2880 0.0270 -0.0264 0.3400 0.3466 1.0000
Competitive
intensity B 0.0929 0.1026 -0.0345 0.1631 0.1167 0.1020 1.0000
Competitive
intensity A 0.0562 0.0140 0.0133 0.0384 0.0241 0.0477 0.2388 1.0000
Customer
orientation 0.2755 0.0814 -0.0190 0.3617 0.3619 0.3529 0.1490 0.0667 1.0000
Competitor
orientation 0.2251 0.0291 -0.0365 0.2636 0.1829 0.1828 0.1541 0.1450 0.2765 1.0000
A strategic
focus on new
marketing
practices
0.2659 -0.0217 -0.0290 0.2625 0.1769 0.2232 0.1023 0.0576 0.2228 0.1655 1.0000
Adoption of
advanced
technology
0.1794 0.1086 -0.0264 0.2387 0.3330 0.2587 0.1391 0.0379 0.3233 0.1666 0.1645 1.0000
Breadth of
long-term
strategic
objectives
0.1424 0.1128 -0.0035 0.2057 0.1517 0.1593 0.1413 0.0370 0.2425 0.1413 0.1614 0.1961 1.0000
Maintaining
marketing
within
enterprise
0.1650 0.1338 -0.0036 0.1838 0.1066 0.1432 0.1115 0.0575 0.1734 0.0630 0.1171 0.1135 0.1718 1.0000
Acquiring or
expanding
marketing
capacity
0.1921 0.0192 -0.0876 0.1979 0.1505 0.1822 0.0564 0.0195 0.2178 0.1085 0.1515 0.1541 0.1159 0.1312 1.0000
* Competitive intensity A refers to competitive intensity measured by the number of competitors. Competitive intensity B refers to competitive intensity measured by the presence of MNEs as competitors.
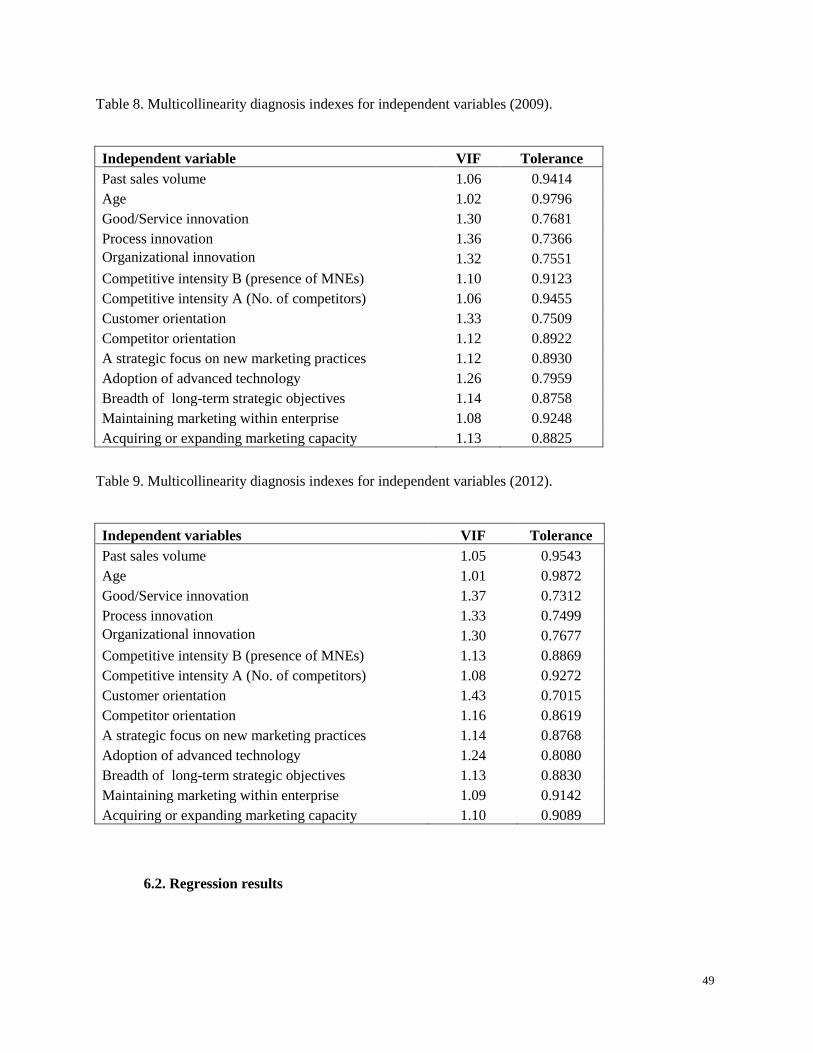
49
Table 8. Multicollinearity diagnosis indexes for independent variables (2009).
Independent variable VIF Tolerance
Past sales volume 1.06 0.9414
Age 1.02 0.9796
Good/Service innovation 1.30 0.7681
Process innovation 1.36 0.7366
Organizational innovation 1.32 0.7551
Competitive intensity B (presence of MNEs) 1.10 0.9123
Competitive intensity A (No. of competitors) 1.06 0.9455
Customer orientation 1.33 0.7509
Competitor orientation 1.12 0.8922
A strategic focus on new marketing practices 1.12 0.8930
Adoption of advanced technology 1.26 0.7959
Breadth of long-term strategic objectives 1.14 0.8758
Maintaining marketing within enterprise 1.08 0.9248
Acquiring or expanding marketing capacity 1.13 0.8825
Table 9. Multicollinearity diagnosis indexes for independent variables (2012).
Independent variables VIF Tolerance
Past sales volume 1.05 0.9543
Age 1.01 0.9872
Good/Service innovation 1.37 0.7312
Process innovation 1.33 0.7499
Organizational innovation 1.30 0.7677
Competitive intensity B (presence of MNEs) 1.13 0.8869
Competitive intensity A (No. of competitors) 1.08 0.9272
Customer orientation 1.43 0.7015
Competitor orientation 1.16 0.8619
A strategic focus on new marketing practices 1.14 0.8768
Adoption of advanced technology 1.24 0.8080
Breadth of long-term strategic objectives 1.13 0.8830
Maintaining marketing within enterprise 1.09 0.9142
Acquiring or expanding marketing capacity 1.10 0.9089
6.2. Regression results
50
Four multilevel logistic regression models have been employed in this study. Model 1 includes only
control variables, which are sales, age, product or service innovations, process innovation and
organizational innovation. Model 2 adds four variables that are used to measure competitive intensity,
customer orientation and competitor orientation. Model 3 adds three variables that are used to measure a
strategic focus on new marketing practices, adoption of advanced technology and breadth of long-term
strategic objectives. Model 4 adds another two variables – maintaining marketing with enterprise and
acquiring or expanding marketing capacity. Table 10 and Table 11 present the regression results including
unstandardized coefficients, standard errors and significant level for 2009 and 2012 respectively. Other
regression outputs can be found in Appendix 2.
In STATA, by default a conservative likelihood-ratio test is used to compare the multilevel model to the
ordinary logistic regression model (H0: σu2
= 0). Results from both the 2009 and 2012 models turn up
highly significant P-values (2012: P = 0.0000; 2009: P = 0.0007), which implies that the multilevel
logistic regression model is statistically different from the ordinary logistic regression model (StataCorp,
2013). In regard to the random effects at the industry level, results from 2009 show the estimate of σu2 is
0.05 with standard error 0.02; results from 2012 showing the estimate of σu2
is 0.06 with standard error
0.03.
Results from the 2009 model (Table 10) show that 1) marketing innovation is significantly related to
predictor variables such as competitive intensity (having MNEs as competitors) (B = -0.19, P = 0.024),
customer orientation (B = 0.07, P = 0.000), competitor orientation (B = 0.11, P = 0.000), a strategic focus
on new marketing practices (B = 0.60, p = 0.000), adoption of advanced technology (B = 0.06, p = 0.034),
breadth of long-term strategic objectives (B = 0.06, p = 0.041), maintaining marketing within enterprise
(B = 0.28, p = 0.016) and acquiring or expanding marketing capacity (B = 0.41, p = 0.000); 2) among all
the significant variables, competitive intensity (having MNEs as competitors) gives a negative coefficient
(B = -0.19); 3) product/service innovation (B = 0.85, p = 0.000), process innovation (B = 0.15, p = 0.090)
and organizational innovation (B = 0.79, p = 0.000) appear to coexist with marketing innovation as
control variables, albeit process innovation contributing to a lesser extent to the whole model (B = 0.15) ;
4) past sales volume (B = -0.01, p = 0.255), firm age (B = -0.02, p = 0.579) and competitive intensity
which is measured by number of competitors (B = 0.07, p = 0.476) do not correlate to marketing
innovation significantly.
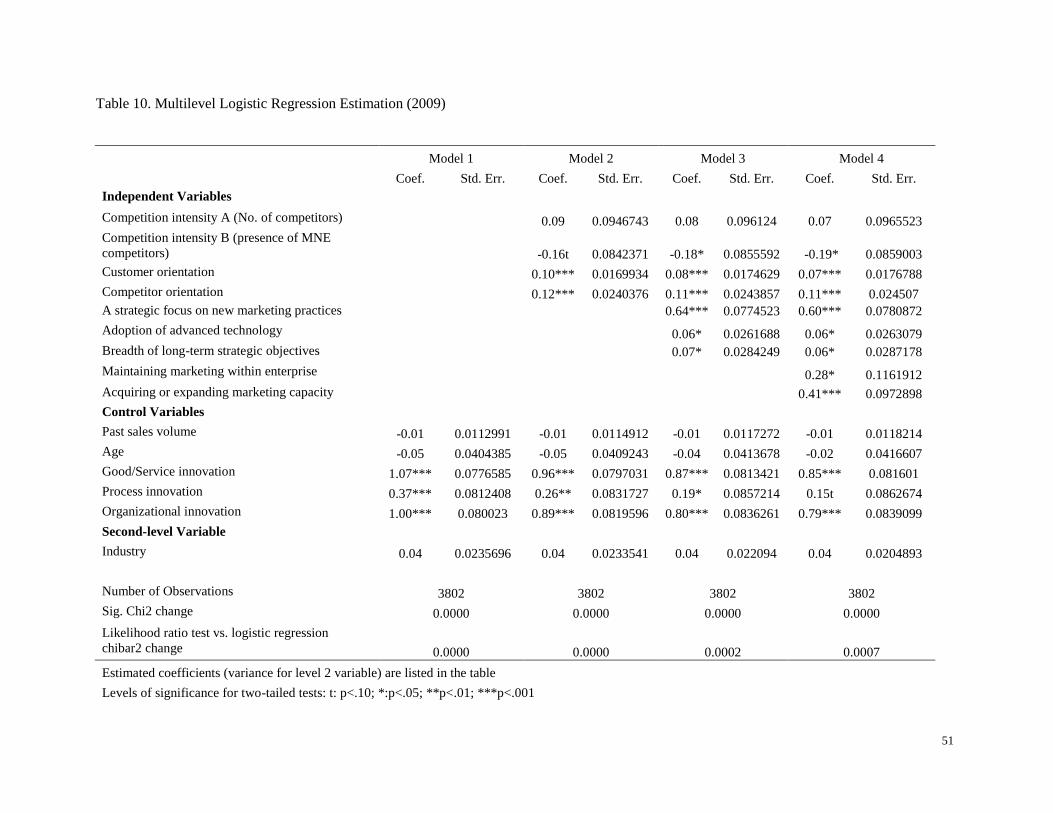
51
Table 10. Multilevel Logistic Regression Estimation (2009)
Model 1 Model 2 Model 3 Model 4
Coef. Std. Err. Coef. Std. Err. Coef. Std. Err. Coef. Std. Err.
Independent Variables
Competition intensity A (No. of competitors)
0.09 0.0946743 0.08 0.096124 0.07 0.0965523
Competition intensity B (presence of MNE
competitors)
-0.16t 0.0842371 -0.18* 0.0855592 -0.19* 0.0859003
Customer orientation
0.10*** 0.0169934 0.08*** 0.0174629 0.07*** 0.0176788
Competitor orientation
0.12*** 0.0240376 0.11*** 0.0243857 0.11*** 0.024507
A strategic focus on new marketing practices
0.64*** 0.0774523 0.60*** 0.0780872
Adoption of advanced technology
0.06* 0.0261688 0.06* 0.0263079
Breadth of long-term strategic objectives
0.07* 0.0284249 0.06* 0.0287178
Maintaining marketing within enterprise
0.28* 0.1161912
Acquiring or expanding marketing capacity
0.41*** 0.0972898
Control Variables
Past sales volume -0.01 0.0112991 -0.01 0.0114912 -0.01 0.0117272 -0.01 0.0118214
Age -0.05 0.0404385 -0.05 0.0409243 -0.04 0.0413678 -0.02 0.0416607
Good/Service innovation 1.07*** 0.0776585 0.96*** 0.0797031 0.87*** 0.0813421 0.85*** 0.081601
Process innovation 0.37*** 0.0812408 0.26** 0.0831727 0.19* 0.0857214 0.15t 0.0862674
Organizational innovation 1.00*** 0.080023 0.89*** 0.0819596 0.80*** 0.0836261 0.79*** 0.0839099
Second-level Variable
Industry 0.04 0.0235696 0.04 0.0233541 0.04 0.022094 0.04 0.0204893
Number of Observations 3802 3802 3802 3802
Sig. Chi2 change 0.0000 0.0000 0.0000 0.0000
Likelihood ratio test vs. logistic regression
chibar2 change 0.0000 0.0000 0.0002 0.0007
Estimated coefficients (variance for level 2 variable) are listed in the table
Levels of significance for two-tailed tests: t: p<.10; *:p<.05; **p<.01; ***p<.001
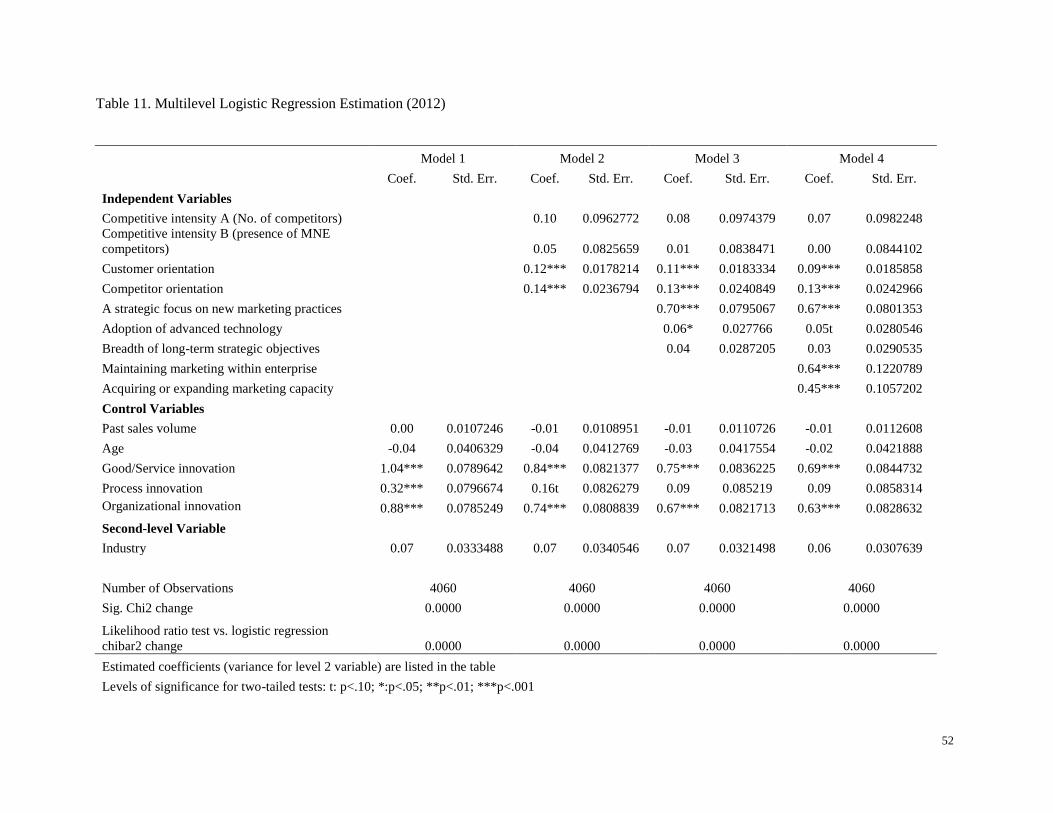
52
Table 11. Multilevel Logistic Regression Estimation (2012)
Model 1 Model 2 Model 3 Model 4
Coef. Std. Err. Coef. Std. Err. Coef. Std. Err. Coef. Std. Err.
Independent Variables
Competitive intensity A (No. of competitors)
0.10 0.0962772 0.08 0.0974379 0.07 0.0982248
Competitive intensity B (presence of MNE
competitors)
0.05 0.0825659 0.01 0.0838471 0.00 0.0844102
Customer orientation
0.12*** 0.0178214 0.11*** 0.0183334 0.09*** 0.0185858
Competitor orientation
0.14*** 0.0236794 0.13*** 0.0240849 0.13*** 0.0242966
A strategic focus on new marketing practices
0.70*** 0.0795067 0.67*** 0.0801353
Adoption of advanced technology
0.06* 0.027766 0.05t 0.0280546
Breadth of long-term strategic objectives
0.04 0.0287205 0.03 0.0290535
Maintaining marketing within enterprise
0.64*** 0.1220789
Acquiring or expanding marketing capacity
0.45*** 0.1057202
Control Variables
Past sales volume 0.00 0.0107246 -0.01 0.0108951 -0.01 0.0110726 -0.01 0.0112608
Age -0.04 0.0406329 -0.04 0.0412769 -0.03 0.0417554 -0.02 0.0421888
Good/Service innovation 1.04*** 0.0789642 0.84*** 0.0821377 0.75*** 0.0836225 0.69*** 0.0844732
Process innovation 0.32*** 0.0796674 0.16t 0.0826279 0.09 0.085219 0.09 0.0858314
Organizational innovation 0.88*** 0.0785249 0.74*** 0.0808839 0.67*** 0.0821713 0.63*** 0.0828632
Second-level Variable
Industry 0.07 0.0333488 0.07 0.0340546 0.07 0.0321498 0.06 0.0307639
Number of Observations 4060 4060 4060 4060
Sig. Chi2 change 0.0000 0.0000 0.0000 0.0000
Likelihood ratio test vs. logistic regression
chibar2 change 0.0000 0.0000 0.0000 0.0000
Estimated coefficients (variance for level 2 variable) are listed in the table
Levels of significance for two-tailed tests: t: p<.10; *:p<.05; **p<.01; ***p<.001
53
Results from the 2012 model (Table 11) demonstrate a similar pattern compared to the 2009 results, albeit
with less significant predictors. Results from the 2012 model show that 1) marketing innovation is
significantly related to predictor variables such as customer orientation (B = 0.09, p = 0.000), competitor
orientations (B = 0.13, p = 0.000), a strategic focus on new marketing practices (B = 0.67, p = 0.000),
adoption of advanced technology (B = 0.05, P = 0.099), maintaining marketing within enterprise (B =
0.64, p = 0.000) and acquiring or expanding marketing capacity (B = 0.45, p = 0.000); 2) two predictor
variables - competitive intensity (having MNEs as competitors) (B = 0.00, p = 0.991) and breadth of long-
term strategic objectives (B = 0.03, p = 0.357) which are significant in 2009 model - are no longer
significant in 2012 model; 2) product/service innovation (B = 0.69, P = 0.000) and organizational
innovation (B = 0.63, p = 0.000) appear to coexist with marketing innovation as control variables, while
process innovation (B = 0.09, p = 0.297) is not significant; 3) past sales volume (B = -0.01, p = 0.378),
firm age (B = -0.02, p = 0.691) and competitive intensity which is measured by number of competitors (B
= 0.07, p = 0.482) do not correlate to marketing innovation significantly either.
7. Discussion
This research aims to examine the occurrence of marketing innovation from three perspectives –
orientations, strategies and value chain, and further investigates whether such occurrence varies across
industry sectors. In this study of more than 4000 Canadian enterprises, factors in relation to competitor
and customer orientations, a strategic focus on new marketing practices, adoption of advanced
technology, maintaining marketing within enterprise, and acquiring or expanding marketing capacity are
found to be positively and significantly related to marketing innovation as predictor variables. Product or
service innovations and organizational innovation are found to be positively and significantly correlated
to marketing innovation as control variables. Moreover, a firm’s propensity to introduce marketing
innovation is found to be contingent upon industry distinctions. A multilevel (random-intercept) logistic
regression has examined the relationship between the predictor and response variables, as well as whether
the regression model varies across industry clusters. Since data used by this study is from the 2009 SIBS
survey and 2012 SIBS survey respectively, analyses and conclusions are drawn based on two sets of
regression outputs and a comparison of these two outputs is also feasible.
Both the 2009 and 2012 results show that marketing innovation is positively related to factors such as
competitor and customer orientations, a strategic focus on new marketing practices, adoption of advanced
technology, maintaining marketing within enterprise, and acquiring or expanding marketing capacity
respectively. These relationships are also statistically significant. Therefore hypotheses 1c, 1d, 2a, 2b, 3a
54
and 3b are supported. Competitive intensity (having MNEs as competitors) is negatively and significantly
related to marketing innovation with a coefficient of -0.19 from 2009 results. Breadth of long-term
strategic objectives is positively and significantly related to marketing innovation with a coefficient of
0.06 from the 2009 results. However, these two variables are not significant in the 2012 results.
Discrepancy in these results could be due to the fluctuations in the business environment (i.e. economic
crisis from late 2007 to the second quarter of 2009). Considering the small coefficient of (0.06) breadth of
long-term strategic objectives, we choose to be conservative about this significant result from 2009, and
thus we reject hypothesis 2c. As competitive intensity (having MNEs as competitors) is negatively related
to marketing innovation from the 2009 result, and not significantly related to marketing innovation from
the 2012 results, we reject 1b as well. The relationship between competitive intensity (number of
competitors) and marketing innovation is not significant in both results, and therefore hypothesis 1a is
rejected. In addition, both the 2009 and 2012 results show that product or service innovations and
organizational innovation are positively related to marketing innovation as control variables, whereas
process innovation positively correlates with marketing innovation only from the 2009 results, with the
coefficient being much less than those of product or service innovations and organizational innovation.
Also, there is no significant relationship found between firm characteristics variables (past sales volume
and firm age) and marketing innovation. Furthermore, a conservative likelihood-ratio test is used by
default in STATA to compare the multilevel model to the ordinary logistic regression model. A highly
significant P-value from each regression output suggests that the multilevel logistic regression model is
statistically different from the ordinary regression model. This result also implies that choosing whether
to use industry as a second-level variable or not does make a difference to the examination of marketing
innovation. Therefore, we conclude that, for the purpose of this research, a multilevel logistic regression
model should be chosen over an ordinary logistic regression model. We also conclude that the occurrence
of marketing innovation does vary across industry sectors. Table 12 below provides a quick review of
whether proposed hypotheses are accepted or rejected based on the 2009 and 2012 results, respectively,
and shows our final decisions to accept or reject each hypothesis.
Table 12. Hypotheses accepted (√)/rejected (×)
Hypotheses 2009 results 2012 results Decision
1a - Competitive intensity
(No. of competitors) × × ×
1b - Competitive intensity
(presence of MNEs) × × ×
1c - Customer orientation √ √ √
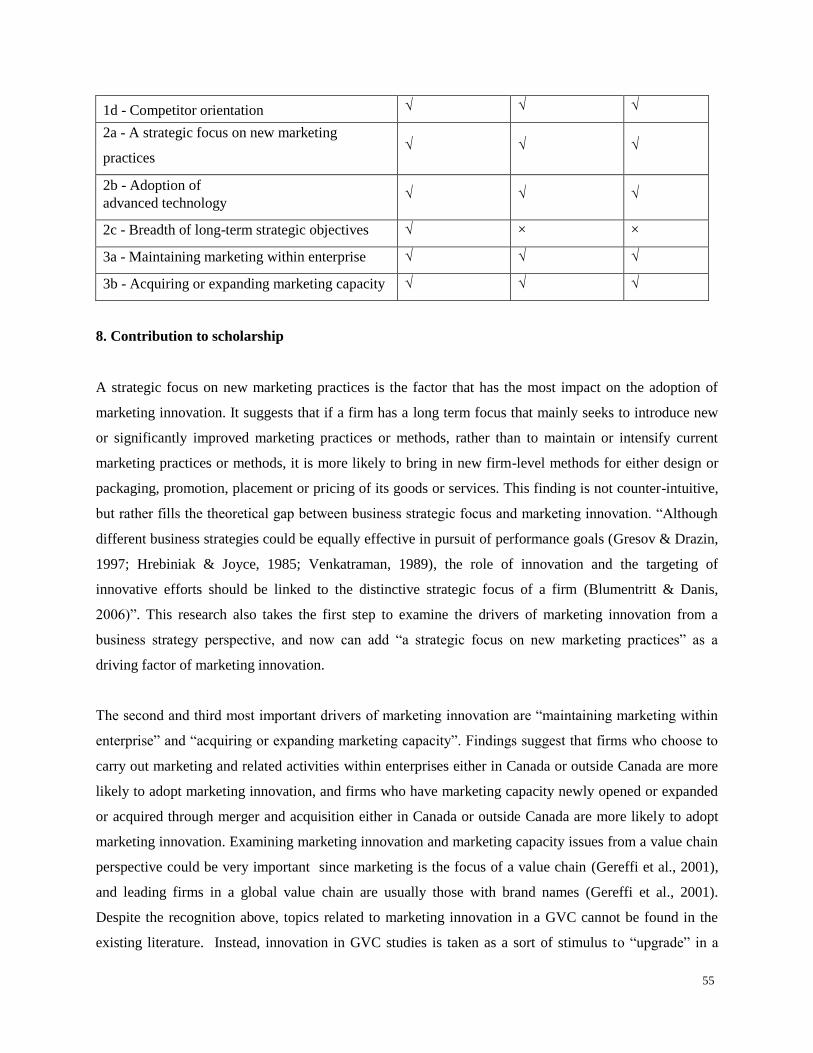
55
1d - Competitor orientation √ √ √
2a - A strategic focus on new marketing
practices √ √ √
2b - Adoption of
advanced technology √ √ √
2c - Breadth of long-term strategic objectives √ × ×
3a - Maintaining marketing within enterprise √ √ √
3b - Acquiring or expanding marketing capacity √ √ √
8. Contribution to scholarship
A strategic focus on new marketing practices is the factor that has the most impact on the adoption of
marketing innovation. It suggests that if a firm has a long term focus that mainly seeks to introduce new
or significantly improved marketing practices or methods, rather than to maintain or intensify current
marketing practices or methods, it is more likely to bring in new firm-level methods for either design or
packaging, promotion, placement or pricing of its goods or services. This finding is not counter-intuitive,
but rather fills the theoretical gap between business strategic focus and marketing innovation. “Although
different business strategies could be equally effective in pursuit of performance goals (Gresov & Drazin,
1997; Hrebiniak & Joyce, 1985; Venkatraman, 1989), the role of innovation and the targeting of
innovative efforts should be linked to the distinctive strategic focus of a firm (Blumentritt & Danis,
2006)”. This research also takes the first step to examine the drivers of marketing innovation from a
business strategy perspective, and now can add “a strategic focus on new marketing practices” as a
driving factor of marketing innovation.
The second and third most important drivers of marketing innovation are “maintaining marketing within
enterprise” and “acquiring or expanding marketing capacity”. Findings suggest that firms who choose to
carry out marketing and related activities within enterprises either in Canada or outside Canada are more
likely to adopt marketing innovation, and firms who have marketing capacity newly opened or expanded
or acquired through merger and acquisition either in Canada or outside Canada are more likely to adopt
marketing innovation. Examining marketing innovation and marketing capacity issues from a value chain
perspective could be very important since marketing is the focus of a value chain (Gereffi et al., 2001),
and leading firms in a global value chain are usually those with brand names (Gereffi et al., 2001).
Despite the recognition above, topics related to marketing innovation in a GVC cannot be found in the
existing literature. Instead, innovation in GVC studies is taken as a sort of stimulus to “upgrade” in a
56
value chain, whereas changes in the nature and the mix of activities are thought to drive such “upgrade”
(Gereffi et al., 2001). Nevertheless, GVC is a very complex issue which encompasses a variety of sub-
topics and streams. However, our focus is rather on the marketing nature and activities in the context of a
GVC and how these factors could stimulate innovation in marketing. We therefore have taken the
initiative to investigate what marketing nature or activities in the value chain could lead to marketing
innovation. As a result, two factors - marketing capacity being newly acquired or expanded (as compared
to no changes) and marketing being performed within enterprises, regardless the location of firms’
business (i.e. inside Canada or outside Canada) – are found to have positive impact on the introduction of
marketing innovation.
Competitor and customer orientations take fourth and fifth places in importance and have positive impact
on the introduction of marketing innovation as well. Market orientation, composed of competitor and
customer orientations and inter-functional coordination, has already been recognized by many scholars
for its ability to create and sustain a sustainable competitive advantage for organizations. Market
orientation could spur innovation (Narver & Slater, 1990; Agarwal et al., 2003), though the effect is
subject to factors such as the types of innovation (e.g. Zhou et al., 2005), industy distinctions (e.g.
Agarwal et al., 2003) and innovation characteristics that a firm possesses (e.g. Atuahene-Gima, 1996).
Measured as the actions (e.g. Kohli & Jaworski, 1990) that firms take to respond to customer needs and
competitor increase, competitor and customer orientations are found to encourage marketing innovation
respectively in this study. In addition, we assume a firm must firstly collect and process competitor and
customer information in order to properly respond to the competitor and customer information. In this
sense, though empirically we are not able to measure whether these firms did collect customer and
competitor information, we conclude that firms who do not only monitor customer and competitor
information but also respond to this information are more likely to adopt marketing innovation.
Adoption of advanced technology is another factor that has a positive effect on the introduction of
marketing innovation. Previous studies have already stressed the impact of technology adoption on
product and process innovation. As technology adoption should be consistent with or fit business strategy
(Clark & Hayes, 1985; Collier, 1985) to bring the successful deployment of a company’s technological
capabilities and resources in pursuit of the goals of business strategy (Zahra & Covin, 1993), we have
examined the adoption of technology as a part of business strategy, and investigated whether the link
found between advance technology adoption and innovation (i.e. product and process innovation) applies
to marketing innovation as well. Our analyses suggest such relationship does exist.
57
We use other innovation types – product and service innovations, process innovation and organizational
innovation – as control variables, since they might appear concurrently with marketing innovation but not
necessarily drive marketing innovation. Both the product (or service) and organizational innovations are
found to be positively related to marketing innovation. Analyses from the 2009 SIBS survey show that the
relationship between process innovation and marketing innovation is positive and significant, while
analyses from the 2012 SIBS survey indicate a non-significant relationship between these two innovation
types. The results are somehow in line with the finding from the research of Polish manufacturing firms
(Kijek, 2013). The finding suggests that product innovations influence the decision to introduce
marketing innovations but process innovations barely induce marketing innovations (Kijek, 2013). The
results are also consistent with the finding from a study of Turkey manufacturing firms, which indicates
positive relationship between organizational innovation and marketing innovation and product innovation
and marketing innovation but not between process innovation and marketing innovation (Gunday et al.,
2011). Moreover, although Industry Canada (2014) pointed out a substitution relationship between
process and marketing innovations, it also stressed “the substitution relationship between process and
marketing innovations should however be considered as less robust than the process and organization
innovations substitution, as they are sensitive to the choice of the empirical specification” (Industry
Canada, 2014). Therefore we conclude marketing innovation coexists and increases with product or
service innovations and organizational innovation but not process innovation.
We have also used the logarithm past sales volume and logarithm firm age as control variables in the
models. However, no significant relationship could be found between these variables and marketing
innovation. It appears neither past sales performance or firm age could have impact on the introduction of
marketing innovation. Although sales performance is often used to measure marketing success, and firm
age is usually linked to firm performance (Aydin, Cetin, & Ozer, 2007; Calantone, Cavusgil, & Zhao,
2002), they are not found related to marketing innovation in this study.
The 2009 survey shows that breadth of long-term strategic objectives has a positive impact on marketing
innovation. The relationship, though statistically significant, is weak given the small coefficient (0.06).
Moreover, the two variables are no longer significantly related from the 2012 survey. In spite of the
difference in the significance level, analyses from both surveys actually follow the same pattern and
indicate a weak relationship between the two variables. Therefore we cannot conclude that the breadth of
long-term strategic objectives is a driving factor of marketing innovation. To explain the discrepancy
between our finding and hypothesis, we think the reason is that the empirical measurement of innovation
is different in literature. Our hypothesis was developed based on the logic, that breadth of innovation
58
objectives benefits innovation (Leiponen & Helfat, 2010), and, since business strategy and innovation
often interrelate and work cooperatively in organizations (Cahill, 1998; Ettlie et al., 1984; Ireland et al.,
2001; O'brien, 2003), breadth of business objectives might benefit innovation as well. However, in these
studies, innovation is mostly measured by technological innovation, which might connect to business
objectives in a different way than marketing innovation.
On the other hand, we conclude that the relationship between competitive intensity and marketing
innovation is not evident. To explain this finding, Chen (2006)’s research might be able to shed some
lights. Defining marketing as : γ, a new marketing program or technology that allows a firm to acquire
consumer information (target consumers) more effectively and to charge individualized prices; and σ, a
new trading method that reduces consumer transaction costs, Chen (2006) found increased competitive
intensity reduced the value of γ but increased the value of σ. As stated by Chen (2006) , “competition on
innovation incentives depends so dramatically on the nature of the marketing innovation”. Marketing
innovation in this study is defined as new marketing methods on four dimensions – product, price,
placement and promotion, whereas each dimension still covers a wide range of activities. For instance,
new methods for placement could refer to first time use of franchising or distribution licenses, direct
selling, exclusive retailing, new concepts for good or service presentation, etc. As marketing innovation
in this study is constructed as a binary variable and firms are differentiated only between doing marketing
innovation and not doing marketing innovation, an examination of any specific type of marketing
innovation is not allowed. Considering the argument from Chen (2006), we wonder how marketing
innovation is measured might affect the statistical results of its relationship with competitive intensity,
which might in turn explain the weak relationship found between marketing innovation and competitive
intensity in this study.
Last but not the least, as the regression outcomes are found to be statistically different on the second-level
variable, industry, we are able to conclude that the occurrence of marketing innovation varies across 18
industry sectors that we have grouped based on NAICS 3-digit codes. The importance and usefulness of
industry distinctions and classification has already been stressed by many marketing theorists (e.g. Hunt,
1976; Lovelock, 1983). As a matter of fact, marketing strategies and practices are dependent upon
industry sectors and types of business. However, research of marketing innovation is yet to put this issue
into consideration. We therefore have taken the very first step investigating whether such difference does
exist across industry sectors, and now we are convinced it does.
9. Applied implications
59
Results of this study show that firms who carry out marketing innovation also perform product or service
innovations and organizational innovation. They have a long-term strategic focus on introducing new
marketing practices rather than maintaining the current ones. They adopt advanced technology. They
choose to maintain marketing within enterprises, no matter whether business is in Canada or overseas.
Along with the occurrence of marketing innovation is firms’ marketing capacity being either newly
acquired or expanded. In addition, these firms do not only collect and monitor information from customers
and competitors, but also respond with actions.
We will not simply suggest that firms adopt the characteristics described above in order to encourage
marketing innovation. We would rather assume innovation is a culture and from top managerial decision
in those organizations. If we can make a profile of the firms with marketing innovation propensity, we
would describe them as all having an innovative mind that can be reflected by strategies (e.g. a strategic
focus on the new practices, technology strategy), capabilities to actualize and coordinate innovation
among core functions (e.g. product/service, marketing and human resource), strong market sense and
agility to respond in-time (e.g. responsiveness to customer needs and competitor increase), and right
decisions to maintain core competence within enterprise but also utilize external force (e.g. maintain
marketing within enterprise, acquire or expand marketing capacity).
To further elaborate on the last point, we posit that innovation should be a resolution from within an
organization, but to realize innovation sometimes requires external force. Results from our study suggest
that firms should perform marketing actitivies within enterprises to drive marketing innovation, while
marketing innovation also happens when new marketing capacity is brought in or the current one is
expanded. To explain this phenomenon, we think that the decision whether or not to maintain a function
within enterprises is relevant to whether it is regarded as a core competence of the organization. If we can
infer that marketing is regarded as a core competence by those who choose to maintain it within
enterprise, we would like to think maintaining marketing capacity within enterprises as a core competence
is the antecedent of marketing innovation. On the other hand, it happens that albeit a strategic decision
and resolution to innovate, firms find they are not able to push changes to happen with the existing
capacity. Such capacity can be personnel, system, practices, knowledge, etc. Whatever it is, acquiring
new capacity or expanding the current one could be a solution to overcome the the limitation of the
existing capacity. In short, we think that if firms want to carry out marketing innovation, it is imporant
firstly that they value marketing and have such capacity within enterprises, and secondly they might need
to bring in external force to change or upgrade the existing marketing capacity.
60
From a value chain perspective, the above arguments might reinforce the importance of marketing as a
strategic functional unit of organizations. However, we will not argue that all Canadian companies should
acquire or expand marketing capacity and build in-house marketing function right away to drive
marketing innovation. Given that the Canadian business section is feactured by large manufacturing
enterprises as well as many small companies, strategic decision of marketing is contingent upon how
companies position themselves in a (global) value chain. Understandably, small companies might
completely outsource marketing because they do not have adequate capacity to build marketing functions
internally, or marketing is not vital to their business yet. However, as the global competition is getting
intense, many companies start to feel they have to adjust their positions in the value chain as well as
“upgrade” in the value chain. Small companies need to understand how marketing works in a value chain
and what decisions they can make to drive marketing innovation in a value chain.
10. Limitations and future research directions
Limitations of this study lie in three aspects. The first one is in relation to the measurement of customer
and competitor orientations. Customer and competitor orientations are traditionally regarded as a series of
activities that companies carry out by collecting and processing customers’ and competitors’ information
and then responding to this information. Focus of the orientations is more on the information-monitoring
and -processing of customer needs and competitor capability. However, as questions from SIBS surveys
only allow us to examine whether and how firms respond to such information, we are not able to measure
the information-collecting and -processing activities or make them as components of the orientation
variables, though we assume firms have these procedures. Therefore we have to recognize that there is a
gap between the dimensions this research uses and that which literature traditionally takes to measure
competitor and customer orientations. In addition, the SIBS survey only investigates whether and how
firms respond to the increase in the number of competitors, while the competitor orientation definition
points out that firms should collect information of their competitors’ capability, which goes beyond the
number of competitors. In short, the design of relevant SIBS questions limits the understanding of
competitor orientation that can be drawn from this research.
Another limitation is that firms are provided with only two choices in the SIBS survey to describe their
marketing activities in a value chain – carried within enterprise or outsourced. From a strategic marketing
perspective, this is as actually a “make or buy” decision. A “make or buy” decision should deal with
which marketing functions and activities are to be purchased in the market, which are to be performed by
61
strategic partners, and which are to be performed internally, and these decisions involve the whole range
of professional services of marketing (marketing research, telemarketing, advertising, sales promotion,
package design, etc.) (Webster Jr, 1992). However, the challenging part of a “make or buy” decision,
rather than in “how” to perform marketing (in-house, purchased, outsourced, partnered, etc.), is more
about “which” part of marketing should be performed by what means (in-house, purchase, outsourced,
etc.). In this sense, knowing which marketing functions are performed within enterprises and which are
outsourced might be more helpful to understand a firm’s introduction of marketing innovation. However,
this question cannot be answered using SIBS survey data.
The third limitation is in the computation of variables of customer orientation, competitor orientation,
adoption of advanced technology and competitive intensity. In this study, the dimensions that are used to
describe the variables of customer orientation, competitor orientation, and adoption of advanced
technology are assumed to be equally important and useful to the variable related, and have been summed
up as a total score to measure the relevant variables. Examination of whether one dimension carries more
weights than the others and whether all dimensions actually contribute to their relevant variables is not
included in this study. In addition, to compute competitive intensity (No. of competitors) as a binary
variable, a cut-off of “4-5” is chosen out of the empirical experience but without strong theoretical
support. This limitation should be recognized as well.
As for future research, a multilevel (random coefficient) logistic regression could be considered to gain a
deeper insight into the occurrence of marketing innovation. As this research has already examined
whether the occurrence of marketing innovation varies across industry sectors using a multilevel (random
intercept) logistic regression and has shown the difference exists, a multilevel (random coefficient)
logistic regression could be used next to investigate the extent to which such differences exist per each
industry sector.
We hope that this research would help stimulate intellectual curiosity of the topics related to marketing
innovation and serve as a “stepping stone” for future research projects. A better understanding of
innovation has always been an objective for researchers, policy-makers and managers. It is our humble
hope that our research has contributed to achieving this objective.
-End-
62
Reference
Aaker, D. A. (1989). Managing assets and skills: the key to a sustainable competitive advantage, in
“Management Review”, California, 1989.
Agarwal, S., Krishna Erramilli, M., & Dev, C. S. (2003). Market orientation and performance in service
firms: role of innovation. Journal of Services Marketing, 17(1), 68-82.
Aggarwal, A. (2002). Liberalisation, multinational enterprises and export performance: evidence from
Indian manufacturing. Journal of Development Studies, 38(3), 119-137.
Aghion, P., Bloom, N., Blundell, R., Griffith, R., & Howitt, P. (2002). Competition and innovation: An
inverted U relationship: National Bureau of Economic Research.
Anderson, E., & Weitz, B. A. (1986). Make-or-buy decisions: vertical integration and marketing
productivity. Sloan Management Review (1986-1998), 27(3), 3.
Appiah-Adu, K., & Singh, S. (1998). Customer orientation and performance: a study of SMEs.
Management Decision, 36(6), 385-394.
Archibugi, D., Filippetti, A., & Frenz, M. (2013). Economic crisis and innovation: Is destruction
prevailing over accumulation? Research Policy, 42(2), 303-314.
Armstrong, J. S., & Collopy, F. (1996). Competitor orientation: Effects of objectives and information on
managerial decisions and profitability. Journal of Marketing Research, 188-199.
Atuahene-Gima, K. (1996). Market orientation and innovation. Journal of Business Research, 35(2), 93-
103.
Auh, S., & Menguc, B. (2005). Balancing exploration and exploitation: The moderating role of
competitive intensity. Journal of Business Research, 58(12), 1652-1661.
Austin, P. C., Goel, V., & van Walraven, C. (2001). An introduction to multilevel regression models.
Canadian Journal of Public Health, 92(2), 150.
Aydin, S., Cetin, A. T., & Ozer, G. (2007). The relationship between marketing and product development
process and their effects on firm performance. Academy of Marketing Studies Journal, 11(1), 53-
68.
Bartel, A. P., Ichniowski, C., & Shaw, K. L. (2005). How does information technology really affect
productivity? Plant-level comparisons of product innovation, process improvement and worker
skills: National Bureau of Economic Research.
Bennett, R. C., & Cooper, R. G. (1979). Beyond the marketing concept. Business Horizons, 22(3), 76-83.
Blomström, M., Kokko, A., & Zejan, M. (1994). Host country competition, labor skills, and technology
transfer by multinationals. Weltwirtschaftliches Archiv, 130(3), 521-533.
Blumentritt, T., & Danis, W. M. (2006). Business strategy types and innovative practices. Journal of
Managerial Issues, 274-291.
Bonanno, G., & Haworth, B. (1998). Intensity of competition and the choice between product and process
innovation. International Journal of Industrial Organization, 16(4), 495-510.
Bourgeois, L. J. (1980). Strategy and environment: A conceptual integration. Academy of Management
Review, 5(1), 25-39.
Boyt, T., & Harvey, M. (1997). Classification of industrial services: A model with strategic implications.
Industrial marketing management, 26(4), 291-300.
Brian Arthur, W., Ermoliev, Y. M., & Kaniovski, Y. M. (1987). Path-dependent processes and the
emergence of macro-structure. European Journal of Operational Research, 30(3), 294-303.
Brouillette, D. (2015). Drivers of Innovation, Complementarity of Innovation, and Performance of
Enterprises in Canada. Retrieved March 2015, from https://www.ic.gc.ca/eic/site/eas-
aes.nsf/eng/ra02239.html#complementarity.
Bryk, A. S., & Raudenbush, S. W. (1992). Hierarchical linear models: applications and data analysis
methods: Sage Publications, Inc.
Canada Revenue Agency. (2015). General Index of Financial Information (GIFI). Retrieved August 2015,
from http://www.cra-arc.gc.ca/tx/bsnss/tpcs/crprtns/rtrn/wht/gifi-ogrf/menu-eng.html
63
Cahill, D. J. (1998). Organizational decline and innovation: are entrepreneurs a special case? Academy of
Management Review, 23(3), 387-388.
Calantone, R. J., Cavusgil, S. T., & Zhao, Y. (2002). Learning orientation, firm innovation capability, and
firm performance. Industrial Marketing Management, 31(6), 515-524.
Camisón, C., & Villar-López, A. (2011). Non-technical innovation: organizational memory and learning
capabilities as antecedent factors with effects on sustained competitive advantage. Industrial
Marketing Management, 40(8), 1294-1304.
Clark, K. B., & Hayes, R. H. (1985). Exploring factors affecting innovation and productivity growth
within the business unit. The Uneasy Alliance: Managing the Productivity-Technology Dilemma,
425-458.
Cleff, T., & Rennings, K. (1999). Determinants of environmental product and process innovation.
European Environment, 9(5), 191-201.
Clemmer, J. (1998). Path to innovation: Spend at least 25 percent of your time with customers. Executive
Excellence, 15, 10-10.
Collier, D. W. (1985). Linking business and technology strategy. Strategy & Leadership, 13(5), 28-44.
Competitiveness, C. o. (1991). Gaining new ground: technology priorities for America's future (Vol. 38):
Council on Competitiveness.
Connor, T. (1999). Customer‐led and market‐oriented: a matter of balance. Strategic Management
Journal, 20(12), 1157-1163.
Copeland, M. T. (1923). Relation of consumers' buying habits to marketing methods. Harvard Business
Review, 1(3), 282-289.
Covin, J. G., & Slevin, D. P. (1989). Strategic management of small firms in hostile and benign
environments. Strategic Management Journal, 10(1), 75-87.
D'Aveni, R. A., & MacMillan, I. C. (1990). Crisis and the content of managerial communications: A
study of the focus of attention of top managers in surviving and failing firms. Administrative
Science Quarterly, 634-657.
Damanpour, F., Szabat, K. A., & Evan, W. M. (1989). The relationship between types of innovation and
organizational performance. Journal of Management Studies, 26(6), 587-602.
Damanpour, F. (1991). Organizational innovation: A meta-analysis of effects of determinants and
moderators. Academy of Management Journal, 34(3), 555-590.
Damanpour, F., Walker, R. M., & Avellaneda, C. N. (2009). Combinative effects of innovation types and
organizational performance: a longitudinal study of service organizations. Journal of
Management Studies, 46(4), 650-675.
Danneels, E. (2002). The dynamics of product innovation and firm competences. Strategic Management
Journal, 23(12), 1095-1121.
Day, G. S., & Wensley, R. (1983). Marketing theory with a strategic orientation. The Journal of
Marketing, 79-89.
Day, G. S., & Wensley, R. (1988). Assessing advantage: a framework for diagnosing competitive
superiority. The Journal of Marketing, 1-20.
Day, G. S. (1994). The capabilities of market-driven organizations. The Journal of Marketing, 37-52.
De Backer, K., & Miroudot, S. (2014). Mapping global value chains: OECD Publishing Paris.
Deshpandé, R., Farley, J. U., & Webster Jr, F. E. (1993). Corporate culture, customer orientation, and
innovativeness in Japanese firms: a quadrad analysis. The Journal of Marketing, 23-37.
Dutta, S., Narasimhan, O., & Rajiv, S. (1999). Success in high-technology markets: Is marketing
capability critical? Marketing Science, 18(4), 547-568.
Ettlie, J. E., Bridges, W. P., & O'keefe, R. D. (1984). Organization strategy and structural differences for
radical versus incremental innovation. Management Science, 30(6), 682-695.
Erramilli, M. K., Agarwal, S., & Kim, S.-S. (1997). Are firm-specific advantages location-specific too?
Journal of International Business Studies, 735-757.
Frosch, R. A. (1996). The customer for R&D is always wrong! Research-Technology Management, 39(6),
22.
64
Fusfeld, A. R. (1989). Formulating technology strategies to meet the global challenges of the 1990s.
International Journal of Technology Management, 4(6), 601-612.
Galbraith, J. R., & Kazanjian, R. K. (1986). Strategy implementation: Structure, systems, and process
(Vol. 1): West Publishing Company New York, NY.
Geldes, C., & Felzensztein, C. (2012). Marketing innovations in the agribusiness sector Innovacio “n en
marketing en el sector de agronegocios. Academia Revista Latinoamericana de Administración,
26(1), 108-138.
Gereffi, G., & Fernandez-Stark, K. (2011). Global value chain analysis: A primer. Center on
Globalization, Governance, Competitiveness (CGGC), Duke University.
Gereffi, G., Humphrey, J., & Sturgeon, T. (2005). The governance of global value chains. Review of
International Political Economy, 12(1), 78-104.
Gereffi, G., Humphrey, J., & Kaplinsky, R. (2001). Introduction: Globalisation, value chains and
development. IDS Bulletin, 32(3), 1-8.
Germain, R. (1996). The role of context and structure in radical and incremental logistics innovation
adoption. Journal of Business Research, 35(2), 117-127.
Goldstein, H. (2011). Multilevel statistical models (Vol. 922): John Wiley & Sons.
Gonenc, H., & Aybar, C. B. (2006). Financial crisis and firm performance: empirical evidence from
Turkey. Corporate Governance: An International Review, 14(4), 297-311.
Grinstein, A. (2008). The effect of market orientation and its components on innovation consequences: a
meta-analysis. Journal of the Academy of Marketing Science, 36(2), 166-173.
Gresov, C., & Drazin, R. (1997). Equifinality: Functional equivalence in organization design. Academy of
Management Review, 22(2), 403-428.
Grewal, R., & Tansuhaj, P. (2001). Building organizational capabilities for managing economic crisis: the
role of market orientation and strategic flexibility. Journal of Marketing, 65(2), 67-80.
Gunday, G., Ulusoy, G., Kilic, K., & Alpkan, L. (2011). Effects of innovation types on firm performance.
International Journal of Production Economics, 133(2), 662-676.
Guo, G., & Zhao, H. (2000). Multilevel modeling for binary data. Annual Review of Sociology, 441-462.
Haddad, S., & Algadeer, H. (2004). An empirical investigation on the impact of innovation within
organizations on marketing innovation. Jordan. Journal of Applied Science, 7, 77-95.
Halpern, N. (2010). Marketing innovation: Sources, capabilities and consequences at airports in Europe's
peripheral areas. Journal of Air Transport Management, 16(2), 52-58.
Hambrick, D. C. (1983). An empirical typology of mature industrial-product environments. Academy of
management journal, 26(2), 213-230.
Han, J. K., Kim, N., & Srivastava, R. K. (1998). Market orientation and organizational performance: is
innovation a missing link? The Journal of Marketing, 30-45.
Hanvanich, S., Dröge, C., & Calantone, R. (2003). Reconceptualizing the meaning and domain of
marketing knowledge. Journal of Knowledge Management, 7(4), 124-135.
Hitt, M. A., & Ireland, R. D. (1985). Corporate distinctive competence, strategy, industry and
performance. Strategic management journal, 6(3), 273-293.
Hooley, G., Fahy, J., Cox, T., Beracs, J., Fonfara, K., & Snoj, B. (1999). Marketing capabilities and firm
performance: a hierarchical model. Journal of Market-Focused Management, 4(3), 259-278.
Houston, F. S. (1986). The marketing concept: what it is and what it is not. The Journal of Marketing, 81-
87.
Hosmer Jr, D. W., & Lemeshow, S. (2004). Applied logistic regression: John Wiley & Sons.
Hrebiniak, L. G., & Joyce, W. F. (1985). Organizational adaptation: Strategic choice and environmental
determinism. Administrative Science Quarterly, 336-349.
Hunt, S. D. (1976). Marketing theory: Conceptual foundations of research in marketing.
Hambrick, D. C. (1983). An empirical typology of mature industrial-product environments. Academy of
management journal, 26(2), 213-230.
Hitt, M. A., & Ireland, R. D. (1985). Corporate distinctive competence, strategy, industry and
performance. Strategic management journal, 6(3), 273-293.
65
Porter, M. E. (2008). Competitive strategy: Techniques for analyzing industries and competitors: Simon
and Schuster.
IndustryCanada. (2011). Survey of Innovation and Business Strategy (SIBS) 2009. Retrieved August
2015, from http://www.ic.gc.ca/eic/site/eas-aes.nsf/eng/h_ra02092.html
IndustryCanada. (2012). Survey of Innovation and Business Strategy (SIBS) 2012. Retrieved August
2015, from http://www.ic.gc.ca/eic/site/eas-aes.nsf/eng/h_ra02301.html
IndustryCanada. (2015). Drivers of Innovation, Complementarity of Innovation, and Performance of
Enterprises in Canada. Retrieved March 2015, from https://www.ic.gc.ca/eic/site/eas-
aes.nsf/eng/ra02239.html#complementarity
Ireland, R. D., Hitt, M. A., Camp, S. M., & Sexton, D. L. (2001). Integrating entrepreneurship and
strategic management actions to create firm wealth. The Academy of Management Executive,
15(1), 49-63.
Jaworski, B., Kohli, A. K., & Sahay, A. (2000). Market-driven versus driving markets. Journal of the
Academy of Marketing Science, 28(1), 45-54.
Jaworski, B. J., & Kohli, A. K. (1993). Market orientation: antecedents and consequences. The Journal of
Marketing, 53-70.
Kerin, R. A. (1992). Marketing’s contribution to the strategy dialogue revisited. Journal of the Academy
of Marketing Science, 20(4), 331-334.
Khan, H. R., & Shaw, E. (2011). Multilevel logistic regression analysis applied to binary contraceptive
prevalence data. Journal of Data Science, 9, 93-110.
Kijek, T. (2013). An empirical analysis of the relationship between technological and marketing
innovations: a case of Polish manufacturing firms. Acta Scientiarum Polonorum. Oeconomia,
12(2).
Kim, W. C., & Mauborgne, R. (1997). Value innovation: The strategic logic of high growth: Harvard
Business School Pub.
Kimberly, J. R., & Evanisko, M. J. (1981). Organizational innovation: The influence of individual,
organizational, and contextual factors on hospital adoption of technological and administrative
innovations. Academy of Management Journal, 24(4), 689-713.
Knott, A. M. (2003). Persistent heterogeneity and sustainable innovation. Strategic Management Journal,
24(8), 687-705.
Kohli, A. K., & Jaworski, B. J. (1990). Market orientation: the construct, research propositions, and
managerial implications. The Journal of Marketing, 1-18.
Krstov, L., & Sinkovec, U. (2007). Relations between Business Strategy, Business Models and e-Business
Applications. Paper presented at the Information and Intelligent Systems Conference.
Kuran, T. (1988). The tenacious past: Theories of personal and collective conservatism. Journal of
Economic Behavior & Organization, 10(2), 143-171.
Lado, N., & Maydeu-Olivares, A. (2001). Exploring the link between market orientation and innovation
in the European and US insurance markets. International Marketing Review, 18(2), 130-145.
Levitt, T. (1960). Growth and profits through planned marketing innovation. The Journal of Marketing, 1-
8.
Leiponen, A., & Helfat, C. E. (2010). Innovation objectives, knowledge sources, and the benefits of
breadth. Strategic Management Journal, 31(2), 224-236.
Linden, G., Kraemer, K. L., & Dedrick, J. (2007). Who captures value in a global innovation system? The
case of Apple's ipod. Personal Computing Industry Center.
Li, H., & Atuahene-Gima, K. (2001). Product innovation strategy and the performance of new technology
ventures in China. Academy of Management Journal, 44(6), 1123-1134.
Levitt, K. (2002). Silent surrender: The multinational corporation in Canada (Vol. 196): McGill-Queen's
Press-MQUP.
Lovelock, C. H. (1983). Classifying services to gain strategic marketing insights. The Journal of
Marketing, 9-20.
66
Lusch, R. F., & Laczniak, G. R. (1987). The evolving marketing concept, competitive intensity and
organizational performance. Journal of the Academy of Marketing Science, 15(3), 1-11.
Macdonald, S. (1995). Too close for comfort: The strategic implications of getting close to the customer.
California Management Review, 37(4), 8-27.
Mahin, P. W. (1991). Business-to-business marketing. Needham Heights, Boston, West Virginia
University, Ed. Allyn and Bacon.
Malerba, F. (2002). Sectoral systems of innovation and production. Research policy, 31(2), 247-264.
Mattick, P., & Mattick, P. (1981). Economic crisis and crisis theory: Merlin Press London.
McCarthy, E. J., & Perreault, W. D. (1993). Basic marketing: a global-managerial approach: Irwin
Homewood, IL.
Medrano-Sáez, N., & Olarte-Pascual, M. C. (2012). Marketing innovation as an opportunity in a situation
of uncertainty: the Spanish case. Soft Computing in Management and Business Economics (pp.
327-341): Springer.
Mitchell, G. R. (1990). Alternative frameworks for technology strategy. European Journal of Operational
Research, 47(2), 153-161.
Mol, M. J., & Birkinshaw, J. (2009). The sources of management innovation: When firms introduce new
management practices. Journal of Business Research, 62(12), 1269-1280.
Moreira, J., Silva, M. J., Simoes, J., & Sousa, G. (2012). Marketing Innovation: Study of Determinants of
Innovation in the Design and Packaging of Goods and Services—Application to Portuguese
Firms. Contemporary Management Research, 8(2).
Naidoo, V. (2010). Firm survival through a crisis: The influence of market orientation, marketing
innovation and business strategy. Industrial Marketing Management, 39(8), 1311-1320.
Narver, J. C., & Slater, S. F. (1990). The effect of a market orientation on business profitability. The
Journal of Marketing, 20-35.
Nelson, R. R., & Winter, S. G. (2009). An evolutionary theory of economic change: Harvard University
Press.
Nickell, S. J. (1996). Competition and corporate performance. Journal of Political Economy, 724-746.
Nwokah, N. G. (2009). Customer-focus, competitor-focus and marketing performance. Measuring
Business Excellence, 13(3), 20-28.
O'Brien, J. P. (2003). The capital structure implications of pursuing a strategy of innovation. Strategic
Management Journal, 24(5), 415-431.
O’Brien, R. (2007) ‘A Caution Regarding Rules of Thumb for Variance Inflation Factors’. Quality and
Quantity 41(5): 673–90.
O'Driscoll, A., Carson, D., & Gilmore, A. (2000). Developing marketing competence and managing in
networks: a strategic perspective. Journal of Strategic Marketing, 8(2), 183-196.
OECD. (2005). Oslo Manual. Proposed Guidelines for Collecting and Interpreting Innovation Data, 3rd
Edition. Paris.
OECD. (2014). Global value chains: challenges, opportunities, and implications for policy. Retrieved
from http://www.oecd.org/tad/gvc_report_g20_july_2014.pdf
Pavitt, K. (1984). Sectoral patterns of technical change: towards a taxonomy and a theory. Research
policy, 13(6), 343-373.
Pelham, A. M., & Wilson, D. T. (1995). A longitudinal study of the impact of market structure, firm
structure, strategy, and market orientation culture on dimensions of small-firm performance.
Journal of the Academy of Marketing Science, 24(1), 27-43.
Peres, R., Muller, E., & Mahajan, V. (2010). Innovation diffusion and new product growth models: A
critical review and research directions. International Journal of Research in Marketing, 27(2),
91-106.
Porter, M. E. (1980). Competitive strategy: Techniques foranalyzing industries and competitors:
FreePress, New York.
Porter, M. E. (1985). Competitive strategy: Creating and sustaining superior performance: FreePress,
New York.
67
Porter, M. E. (2008). Competitive strategy: Techniques for analyzing industries and competitors: Simon
and Schuster.
Reddy, P. (1997). New trends in globalization of corporate R&D and implications for innovation
capability in host countries: a survey from India. World Development, 25(11), 1821-1837.
Rosenberg, H., & Schumpeter, J. (1939). Business Cycles: A Theoretical, Historical, and Statistical
Analysis of the Capitalist Process: McGraw-Hill, New York.
Rosenkranz, S. (1996). Simultaneous choice of process and product innovation: CEPR Discussion Papers.
Rowley, J., Baregheh, A., & Sambrook, S. (2011). Towards an innovation-type mapping tool.
Management Decision, 49(1), 73-86.
Schendel, D., & Hofer, C. W. (1979). Strategic management: A new view of business policy and planning:
Little, Brown.
Schubert, T. (2010). Marketing and organisational innovations in entrepreneurial innovation processes
and their relation to market structure and firm characteristics. Review of Industrial Organization,
36(2), 189-212.
Scott, W. R. (1987). The adolescence of institutional theory. Administrative Science Quarterly, 493-511.
Seddon, P. B., Lewis, G. P., Freeman, P., & Shanks, G. (2004). The case for viewing business models as
abstractions of strategy. Communications of The Association for Information Systems, 13.
Shergill, G. S., & Nargundkar, R. (2005). Market orientation, marketing innovation as performance
drivers: extending the paradigm. Journal of Global Marketing, 19(1), 27-47.
Shin, N., Kraemer, K. L., & Dedrick, J. (2009). R&D, value chain location and firm performance in the
global electronics industry. Industry and Innovation, 16(3), 315-330.
Sinkula, J. M. (1994). Market information processing and organizational learning. The Journal of
Marketing, 35-45.
Sin, L. Y., Tse, A. C., Yau, O. H., Chow, R. P., & Lee, J. S. (2005). Market orientation, relationship
marketing orientation, and business performance: The moderating effects of economic ideology
and industry type. Journal of International Marketing, 13(1), 36-57.
Slater, S. F., & Narver, J. C. (1994). Market orientation, customer value, and superior performance.
Business Horizons, 37(2), 22-28.
Slater, S. F., & Narver, J. C. (1998). Research notes and communications customer-led and market-
oriented: Let’s not confuse the two. Strategic Management Journal, 19(10), 1001-1006.
Slater, S. F., & Narver, J. C. (1999). Market‐oriented is more than being customer‐led. Strategic
Management Journal, 20(12), 1165-1168.
Staropoli, C. (1998). Cooperation in R&D in the pharmaceutical industry—the network as an
organizational innovation governing technological innovation. Technovation, 18(1), 13-23.
Sturgeon, T. J. (2002). Modular production networks: a new American model of industrial organization.
Industrial and Corporate Change, 11(3), 451-496.
StatisticsCanada. (2015). Business Register (BR). Retrieved August 2015, from
http://www23.statcan.gc.ca/imdb/p2SV.pl?Function=getSurvey&SDDS=1105
StataCorp, L. (2013). Stata multilevel Mixed-effects Reference Manual. Retrieved from
http://www.stata.com/manuals13/me.pdf
Subramanian, A., & Nilakanta, S. (1996). Organizational innovativeness: exploring the relationship
between organizational determinants of innovation, types of innovations, and measures of
organizational performance. Omega, 24(6), 631-647.
Venkatraman, N. (1989). The concept of fit in strategy research: toward verbal and statistical
correspondence. Academy of Management Review, 14(3), 423-444.
Vorhies, D. W. (1998). An investigation of the factors leading to the development of marketing
capabilities and organizational effectiveness. Journal of Strategic Marketing, 6(1), 3-23.
Walker Jr, O. C., & Ruekert, R. W. (1987). Marketing's role in the implementation of business strategies:
a critical review and conceptual framework. The Journal of Marketing, 15-33.
Walker, R. M. (2004). Innovation and Organisational performance: evidence and a research agenda.
Advanced Institute of Management Research Paper(002).
68
Walker, R. M. (2008). An empirical evaluation of innovation types and organizational and environmental
characteristics: towards a configuration framework. Journal of Public Administration Research
and Theory, 18(4), 591-615.
Webster Jr, F. E. (1992). The changing role of marketing in the corporation. The Journal of Marketing, 1-
17.
Weerawardena, J. (2003). The role of marketing capability in innovation-based competitive strategy.
Journal of Strategic Marketing, 11(1), 15-35.
Yeung, H. W. C. (2007). From followers to market leaders: Asian electronics firms in the global economy.
Asia Pacific Viewpoint, 48(1), 1-25.
Zahra, S. A., & Covin, J. G. (1993). Business strategy, technology policy and firm performance. Strategic
Management Journal, 14(6), 451-478.
Zhou, K. Z., Yim, C. K., & Tse, D. K. (2005). The effects of strategic orientations on technology-and
market-based breakthrough innovations. Journal of Marketing, 69(2), 42-60.
Zott, C., & Amit, R. (2007). Business model design and the performance of entrepreneurial firms.
Organization Science, 18(2), 181-199.
Zott, C., & Amit, R. (2008). The fit between product market strategy and business model: implications for
firm performance. Strategic Management Journal, 29(1), 1-26.
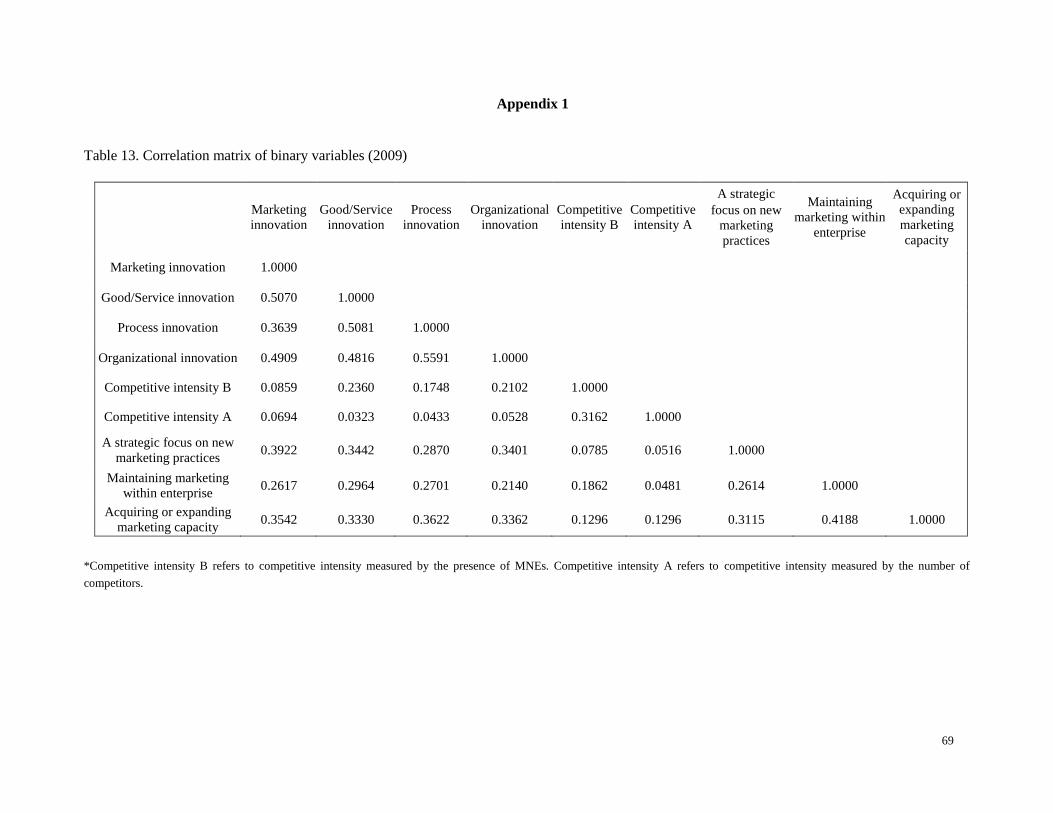
69
Appendix 1
Table 13. Correlation matrix of binary variables (2009)
Marketing
innovation
Good/Service
innovation
Process
innovation
Organizational
innovation
Competitive
intensity B
Competitive
intensity A
A strategic
focus on new
marketing
practices
Maintaining
marketing within
enterprise
Acquiring or
expanding
marketing
capacity
Marketing innovation 1.0000
Good/Service innovation 0.5070 1.0000
Process innovation 0.3639 0.5081 1.0000
Organizational innovation 0.4909 0.4816 0.5591 1.0000
Competitive intensity B 0.0859 0.2360 0.1748 0.2102 1.0000
Competitive intensity A 0.0694 0.0323 0.0433 0.0528 0.3162 1.0000
A strategic focus on new
marketing practices 0.3922 0.3442 0.2870 0.3401 0.0785 0.0516 1.0000
Maintaining marketing
within enterprise 0.2617 0.2964 0.2701 0.2140 0.1862 0.0481 0.2614 1.0000
Acquiring or expanding
marketing capacity 0.3542 0.3330 0.3622 0.3362 0.1296 0.1296 0.3115 0.4188 1.0000
*Competitive intensity B refers to competitive intensity measured by the presence of MNEs. Competitive intensity A refers to competitive intensity measured by the number of
competitors.
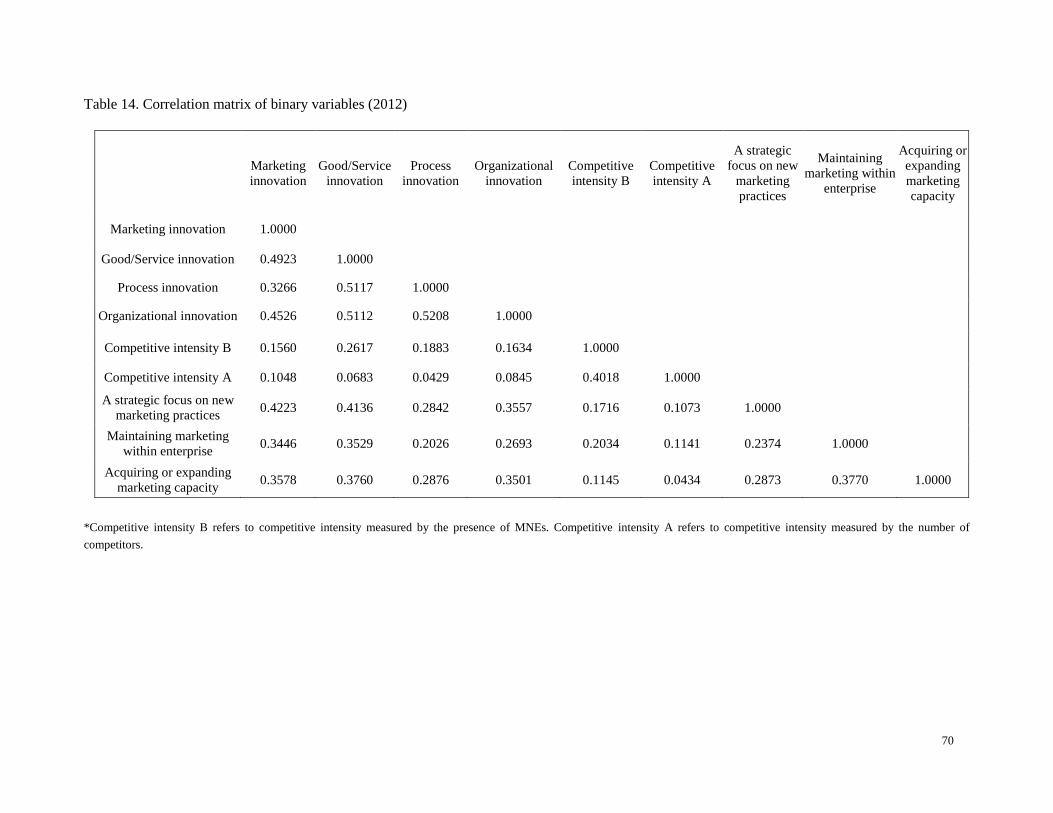
70
Table 14. Correlation matrix of binary variables (2012)
Marketing
innovation
Good/Service
innovation
Process
innovation
Organizational
innovation
Competitive
intensity B
Competitive
intensity A
A strategic
focus on new
marketing
practices
Maintaining
marketing within
enterprise
Acquiring or
expanding
marketing
capacity
Marketing innovation 1.0000
Good/Service innovation 0.4923 1.0000
Process innovation 0.3266 0.5117 1.0000
Organizational innovation 0.4526 0.5112 0.5208 1.0000
Competitive intensity B 0.1560 0.2617 0.1883 0.1634 1.0000
Competitive intensity A 0.1048 0.0683 0.0429 0.0845 0.4018 1.0000
A strategic focus on new
marketing practices 0.4223 0.4136 0.2842 0.3557 0.1716 0.1073 1.0000
Maintaining marketing
within enterprise 0.3446 0.3529 0.2026 0.2693 0.2034 0.1141 0.2374 1.0000
Acquiring or expanding
marketing capacity 0.3578 0.3760 0.2876 0.3501 0.1145 0.0434 0.2873 0.3770 1.0000
*Competitive intensity B refers to competitive intensity measured by the presence of MNEs. Competitive intensity A refers to competitive intensity measured by the number of
competitors.
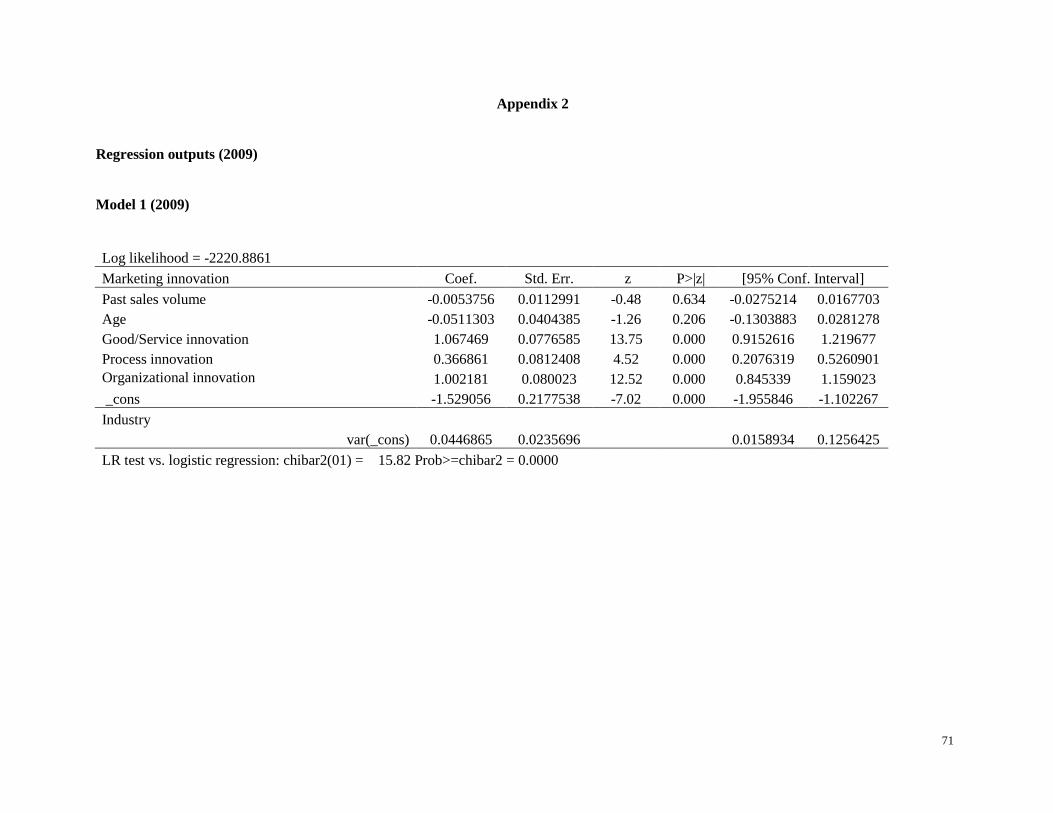
71
Appendix 2
Regression outputs (2009)
Model 1 (2009)
Log likelihood = -2220.8861 Marketing innovation Coef. Std. Err. z P>|z| [95% Conf. Interval]
Past sales volume -0.0053756 0.0112991 -0.48 0.634 -0.0275214 0.0167703
Age -0.0511303 0.0404385 -1.26 0.206 -0.1303883 0.0281278
Good/Service innovation 1.067469 0.0776585 13.75 0.000 0.9152616 1.219677
Process innovation 0.366861 0.0812408 4.52 0.000 0.2076319 0.5260901
Organizational innovation 1.002181 0.080023 12.52 0.000 0.845339 1.159023
_cons -1.529056 0.2177538 -7.02 0.000 -1.955846 -1.102267
Industry var(_cons) 0.0446865 0.0235696 0.0158934 0.1256425
LR test vs. logistic regression: chibar2(01) = 15.82 Prob>=chibar2 = 0.0000
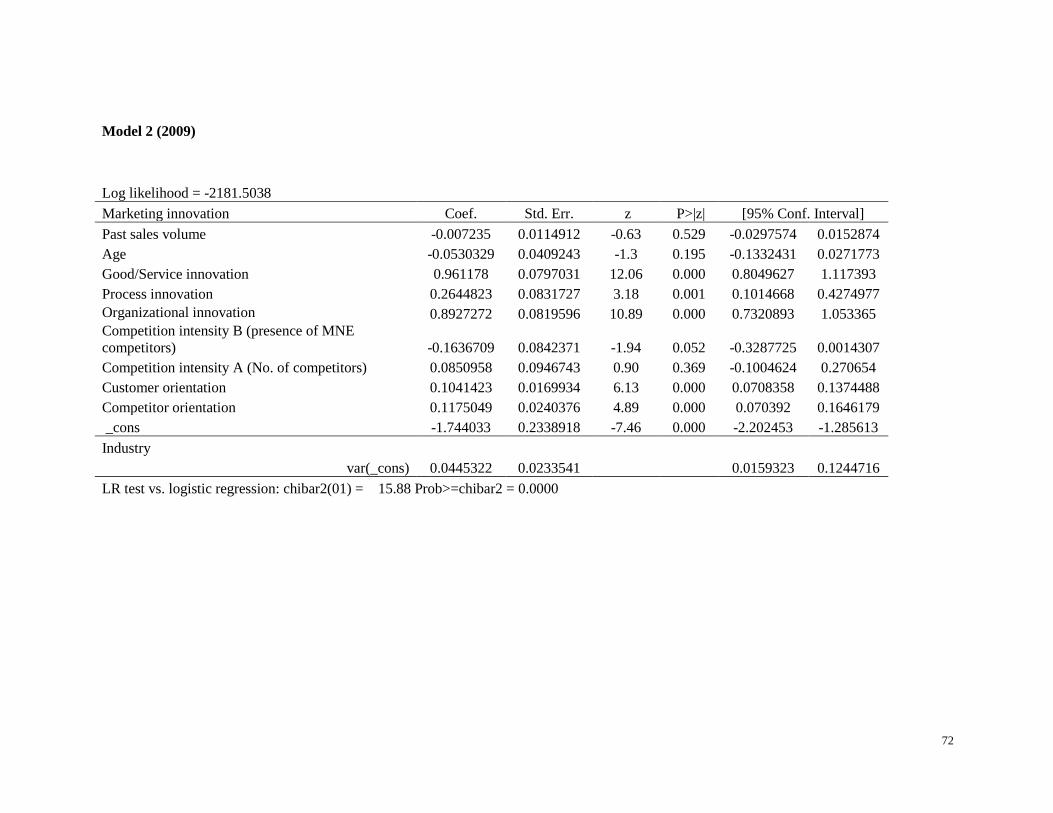
72
Model 2 (2009)
Log likelihood = -2181.5038
Marketing innovation Coef. Std. Err. z P>|z| [95% Conf. Interval]
Past sales volume -0.007235 0.0114912 -0.63 0.529 -0.0297574 0.0152874
Age -0.0530329 0.0409243 -1.3 0.195 -0.1332431 0.0271773
Good/Service innovation 0.961178 0.0797031 12.06 0.000 0.8049627 1.117393
Process innovation 0.2644823 0.0831727 3.18 0.001 0.1014668 0.4274977
Organizational innovation 0.8927272 0.0819596 10.89 0.000 0.7320893 1.053365 Competition intensity B (presence of MNE
competitors) -0.1636709 0.0842371 -1.94 0.052 -0.3287725 0.0014307
Competition intensity A (No. of competitors) 0.0850958 0.0946743 0.90 0.369 -0.1004624 0.270654
Customer orientation 0.1041423 0.0169934 6.13 0.000 0.0708358 0.1374488
Competitor orientation 0.1175049 0.0240376 4.89 0.000 0.070392 0.1646179
_cons -1.744033 0.2338918 -7.46 0.000 -2.202453 -1.285613
Industry var(_cons) 0.0445322 0.0233541 0.0159323 0.1244716
LR test vs. logistic regression: chibar2(01) = 15.88 Prob>=chibar2 = 0.0000
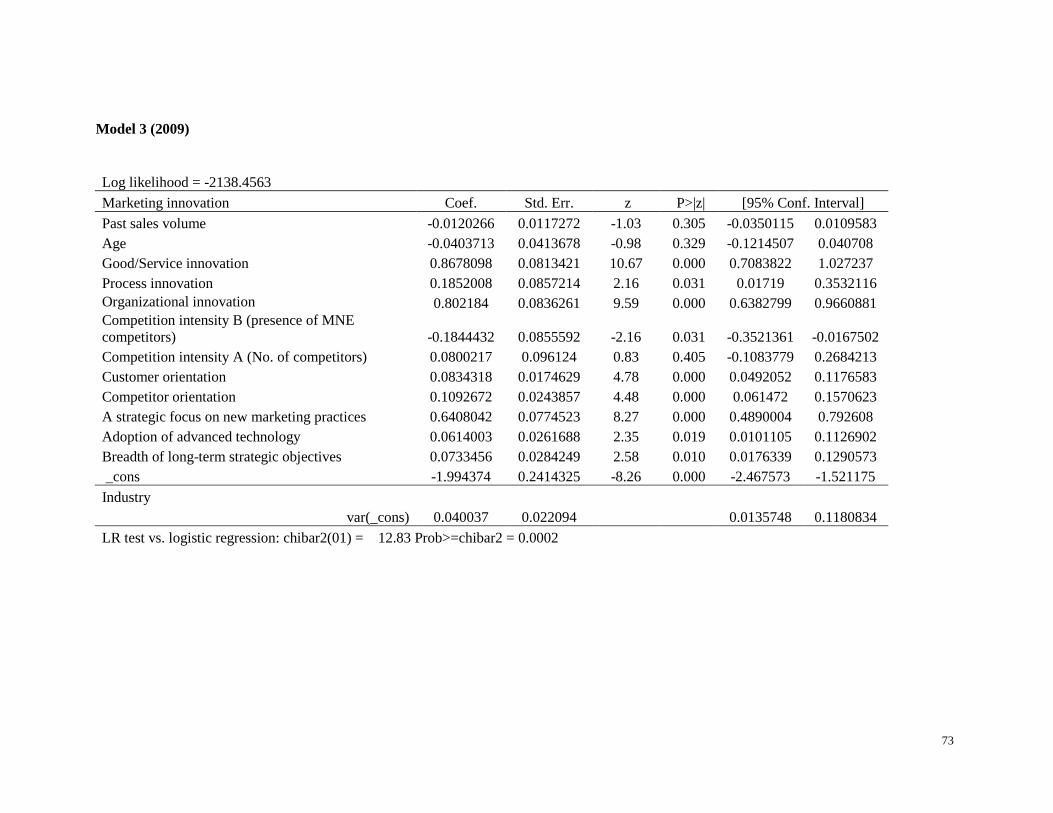
73
Model 3 (2009)
Log likelihood = -2138.4563 Marketing innovation Coef. Std. Err. z P>|z| [95% Conf. Interval]
Past sales volume -0.0120266 0.0117272 -1.03 0.305 -0.0350115 0.0109583
Age -0.0403713 0.0413678 -0.98 0.329 -0.1214507 0.040708
Good/Service innovation 0.8678098 0.0813421 10.67 0.000 0.7083822 1.027237
Process innovation 0.1852008 0.0857214 2.16 0.031 0.01719 0.3532116
Organizational innovation 0.802184 0.0836261 9.59 0.000 0.6382799 0.9660881 Competition intensity B (presence of MNE
competitors) -0.1844432 0.0855592 -2.16 0.031 -0.3521361 -0.0167502
Competition intensity A (No. of competitors) 0.0800217 0.096124 0.83 0.405 -0.1083779 0.2684213
Customer orientation 0.0834318 0.0174629 4.78 0.000 0.0492052 0.1176583
Competitor orientation 0.1092672 0.0243857 4.48 0.000 0.061472 0.1570623
A strategic focus on new marketing practices 0.6408042 0.0774523 8.27 0.000 0.4890004 0.792608
Adoption of advanced technology 0.0614003 0.0261688 2.35 0.019 0.0101105 0.1126902
Breadth of long-term strategic objectives 0.0733456 0.0284249 2.58 0.010 0.0176339 0.1290573
_cons -1.994374 0.2414325 -8.26 0.000 -2.467573 -1.521175
Industry var(_cons) 0.040037 0.022094 0.0135748 0.1180834
LR test vs. logistic regression: chibar2(01) = 12.83 Prob>=chibar2 = 0.0002
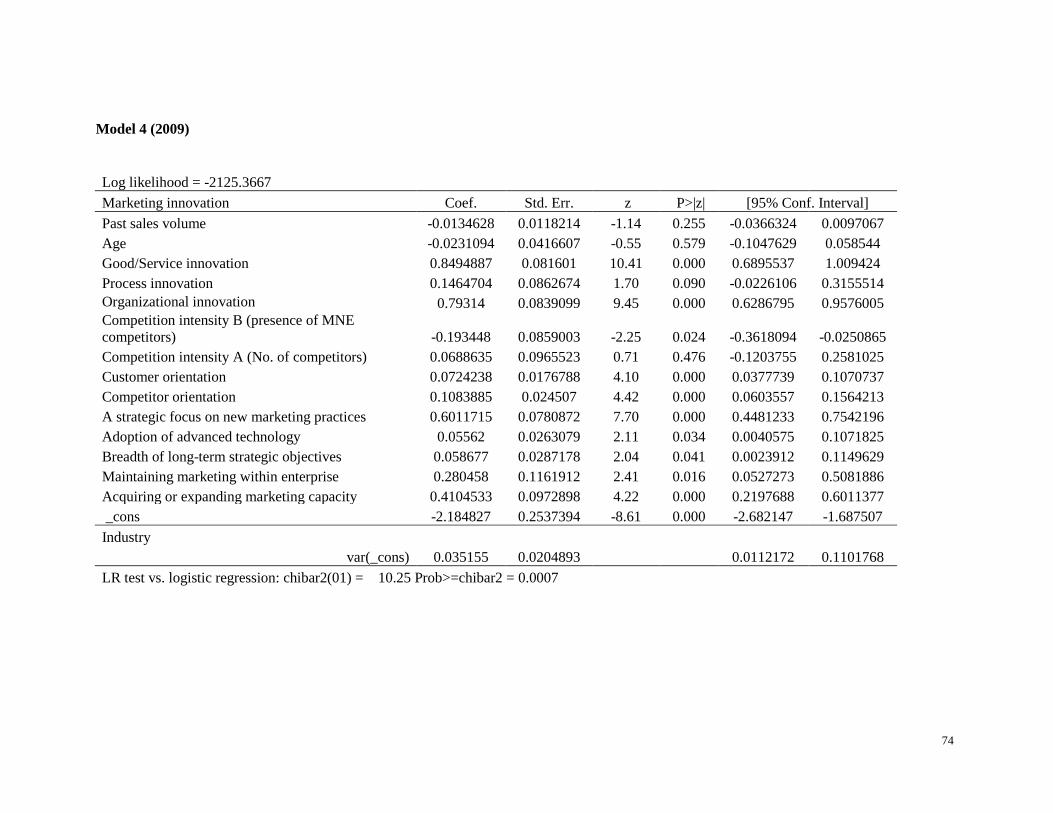
74
Model 4 (2009)
Log likelihood = -2125.3667 Marketing innovation Coef. Std. Err. z P>|z| [95% Conf. Interval]
Past sales volume -0.0134628 0.0118214 -1.14 0.255 -0.0366324 0.0097067
Age -0.0231094 0.0416607 -0.55 0.579 -0.1047629 0.058544
Good/Service innovation 0.8494887 0.081601 10.41 0.000 0.6895537 1.009424
Process innovation 0.1464704 0.0862674 1.70 0.090 -0.0226106 0.3155514
Organizational innovation 0.79314 0.0839099 9.45 0.000 0.6286795 0.9576005 Competition intensity B (presence of MNE
competitors) -0.193448 0.0859003 -2.25 0.024 -0.3618094 -0.0250865
Competition intensity A (No. of competitors) 0.0688635 0.0965523 0.71 0.476 -0.1203755 0.2581025
Customer orientation 0.0724238 0.0176788 4.10 0.000 0.0377739 0.1070737
Competitor orientation 0.1083885 0.024507 4.42 0.000 0.0603557 0.1564213
A strategic focus on new marketing practices 0.6011715 0.0780872 7.70 0.000 0.4481233 0.7542196
Adoption of advanced technology 0.05562 0.0263079 2.11 0.034 0.0040575 0.1071825
Breadth of long-term strategic objectives 0.058677 0.0287178 2.04 0.041 0.0023912 0.1149629
Maintaining marketing within enterprise 0.280458 0.1161912 2.41 0.016 0.0527273 0.5081886
Acquiring or expanding marketing capacity 0.4104533 0.0972898 4.22 0.000 0.2197688 0.6011377
_cons -2.184827 0.2537394 -8.61 0.000 -2.682147 -1.687507
Industry var(_cons) 0.035155 0.0204893 0.0112172 0.1101768
LR test vs. logistic regression: chibar2(01) = 10.25 Prob>=chibar2 = 0.0007
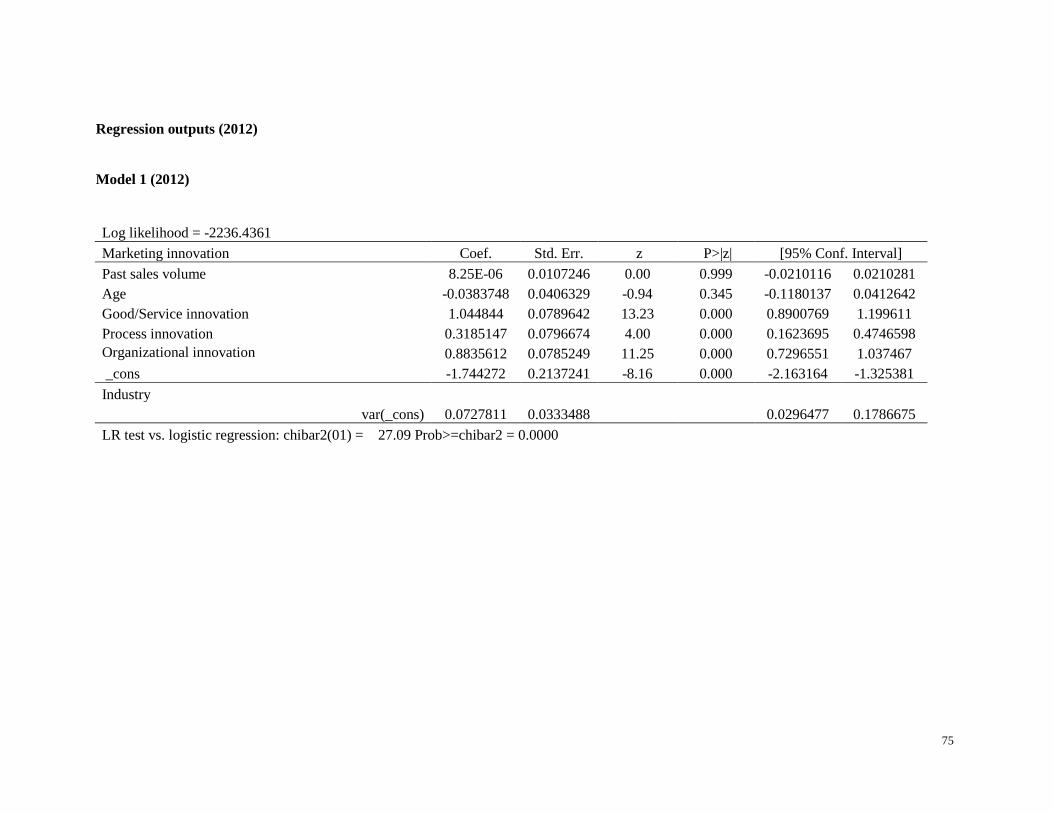
75
Regression outputs (2012)
Model 1 (2012)
Log likelihood = -2236.4361 Marketing innovation Coef. Std. Err. z P>|z| [95% Conf. Interval]
Past sales volume 8.25E-06 0.0107246 0.00 0.999 -0.0210116 0.0210281
Age -0.0383748 0.0406329 -0.94 0.345 -0.1180137 0.0412642
Good/Service innovation 1.044844 0.0789642 13.23 0.000 0.8900769 1.199611
Process innovation 0.3185147 0.0796674 4.00 0.000 0.1623695 0.4746598
Organizational innovation 0.8835612 0.0785249 11.25 0.000 0.7296551 1.037467
_cons -1.744272 0.2137241 -8.16 0.000 -2.163164 -1.325381
Industry var(_cons) 0.0727811 0.0333488 0.0296477 0.1786675
LR test vs. logistic regression: chibar2(01) = 27.09 Prob>=chibar2 = 0.0000
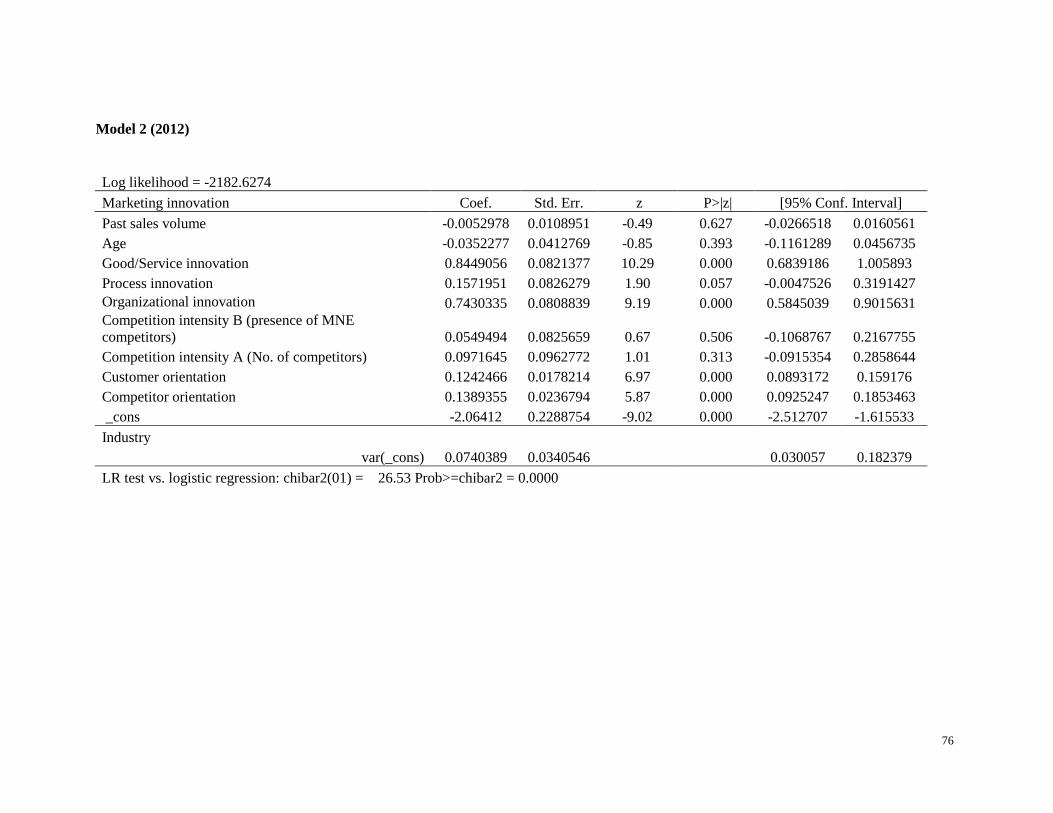
76
Model 2 (2012)
Log likelihood = -2182.6274 Marketing innovation Coef. Std. Err. z P>|z| [95% Conf. Interval]
Past sales volume -0.0052978 0.0108951 -0.49 0.627 -0.0266518 0.0160561
Age -0.0352277 0.0412769 -0.85 0.393 -0.1161289 0.0456735
Good/Service innovation 0.8449056 0.0821377 10.29 0.000 0.6839186 1.005893
Process innovation 0.1571951 0.0826279 1.90 0.057 -0.0047526 0.3191427
Organizational innovation 0.7430335 0.0808839 9.19 0.000 0.5845039 0.9015631 Competition intensity B (presence of MNE
competitors) 0.0549494 0.0825659 0.67 0.506 -0.1068767 0.2167755
Competition intensity A (No. of competitors) 0.0971645 0.0962772 1.01 0.313 -0.0915354 0.2858644
Customer orientation 0.1242466 0.0178214 6.97 0.000 0.0893172 0.159176
Competitor orientation 0.1389355 0.0236794 5.87 0.000 0.0925247 0.1853463
_cons -2.06412 0.2288754 -9.02 0.000 -2.512707 -1.615533
Industry var(_cons) 0.0740389 0.0340546 0.030057 0.182379
LR test vs. logistic regression: chibar2(01) = 26.53 Prob>=chibar2 = 0.0000
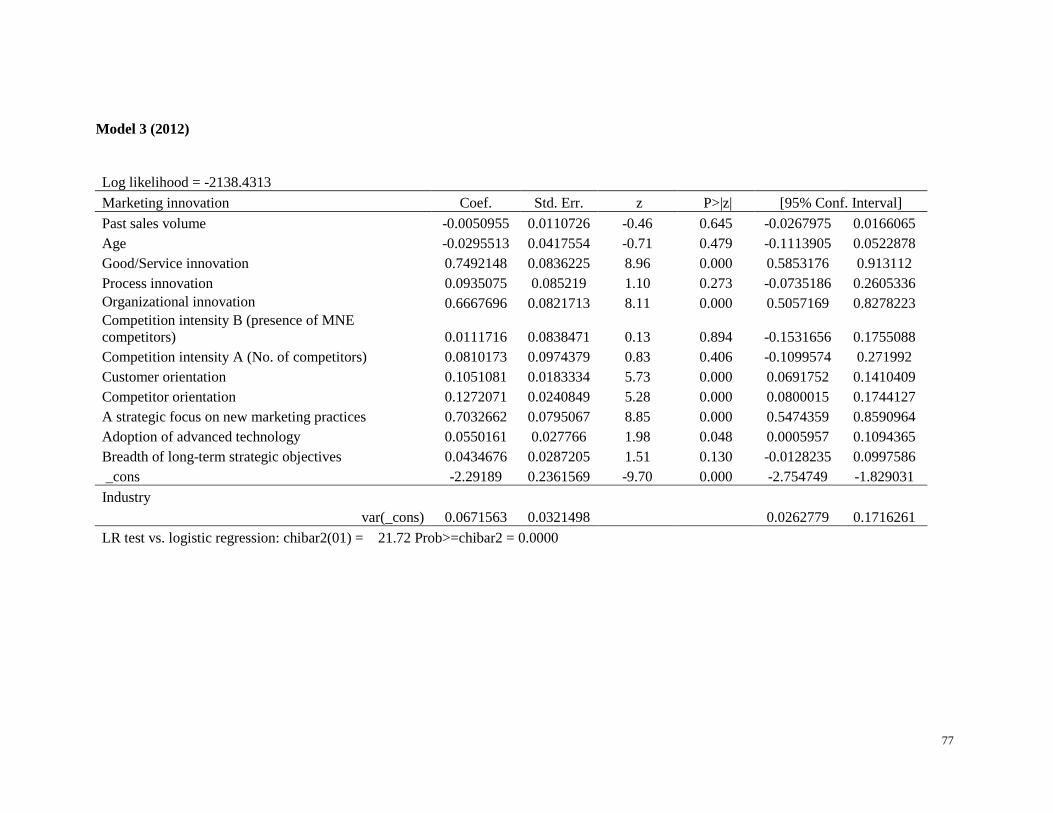
77
Model 3 (2012)
Log likelihood = -2138.4313 Marketing innovation Coef. Std. Err. z P>|z| [95% Conf. Interval]
Past sales volume -0.0050955 0.0110726 -0.46 0.645 -0.0267975 0.0166065
Age -0.0295513 0.0417554 -0.71 0.479 -0.1113905 0.0522878
Good/Service innovation 0.7492148 0.0836225 8.96 0.000 0.5853176 0.913112
Process innovation 0.0935075 0.085219 1.10 0.273 -0.0735186 0.2605336
Organizational innovation 0.6667696 0.0821713 8.11 0.000 0.5057169 0.8278223 Competition intensity B (presence of MNE
competitors) 0.0111716 0.0838471 0.13 0.894 -0.1531656 0.1755088
Competition intensity A (No. of competitors) 0.0810173 0.0974379 0.83 0.406 -0.1099574 0.271992
Customer orientation 0.1051081 0.0183334 5.73 0.000 0.0691752 0.1410409
Competitor orientation 0.1272071 0.0240849 5.28 0.000 0.0800015 0.1744127
A strategic focus on new marketing practices 0.7032662 0.0795067 8.85 0.000 0.5474359 0.8590964
Adoption of advanced technology 0.0550161 0.027766 1.98 0.048 0.0005957 0.1094365
Breadth of long-term strategic objectives 0.0434676 0.0287205 1.51 0.130 -0.0128235 0.0997586
_cons -2.29189 0.2361569 -9.70 0.000 -2.754749 -1.829031
Industry var(_cons) 0.0671563 0.0321498 0.0262779 0.1716261
LR test vs. logistic regression: chibar2(01) = 21.72 Prob>=chibar2 = 0.0000
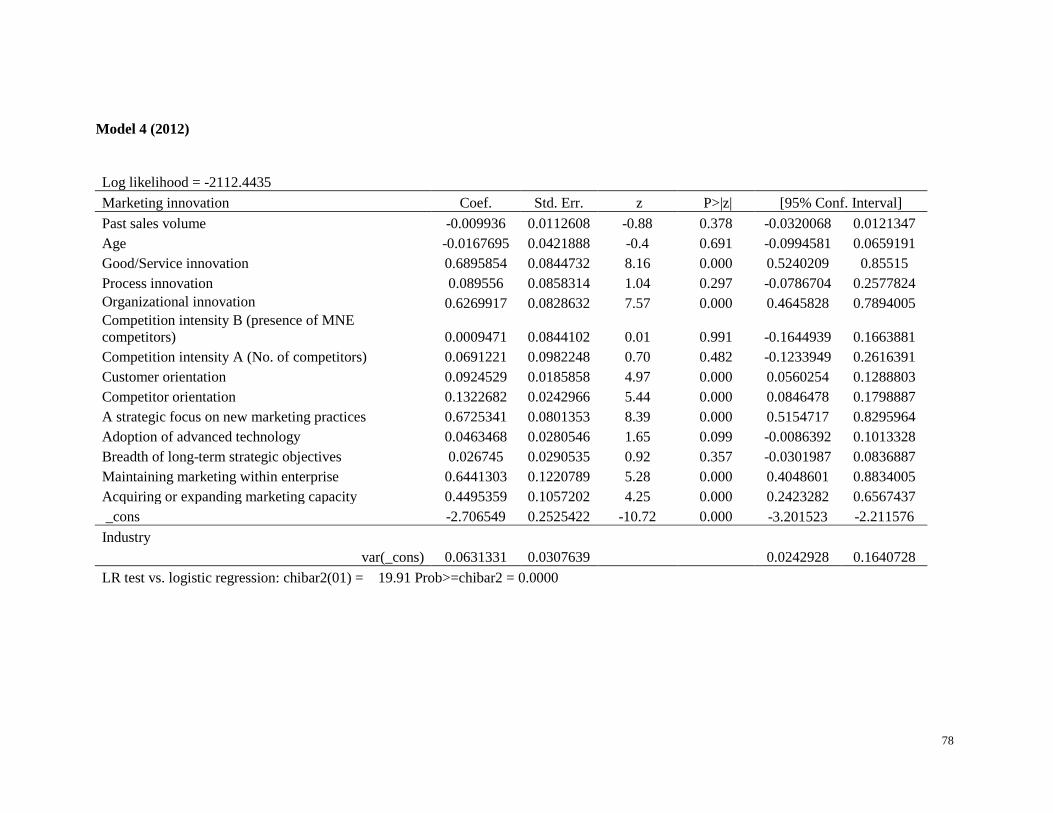
78
Model 4 (2012)
Log likelihood = -2112.4435 Marketing innovation Coef. Std. Err. z P>|z| [95% Conf. Interval]
Past sales volume -0.009936 0.0112608 -0.88 0.378 -0.0320068 0.0121347
Age -0.0167695 0.0421888 -0.4 0.691 -0.0994581 0.0659191
Good/Service innovation 0.6895854 0.0844732 8.16 0.000 0.5240209 0.85515
Process innovation 0.089556 0.0858314 1.04 0.297 -0.0786704 0.2577824
Organizational innovation 0.6269917 0.0828632 7.57 0.000 0.4645828 0.7894005 Competition intensity B (presence of MNE
competitors) 0.0009471 0.0844102 0.01 0.991 -0.1644939 0.1663881
Competition intensity A (No. of competitors) 0.0691221 0.0982248 0.70 0.482 -0.1233949 0.2616391
Customer orientation 0.0924529 0.0185858 4.97 0.000 0.0560254 0.1288803
Competitor orientation 0.1322682 0.0242966 5.44 0.000 0.0846478 0.1798887
A strategic focus on new marketing practices 0.6725341 0.0801353 8.39 0.000 0.5154717 0.8295964
Adoption of advanced technology 0.0463468 0.0280546 1.65 0.099 -0.0086392 0.1013328
Breadth of long-term strategic objectives 0.026745 0.0290535 0.92 0.357 -0.0301987 0.0836887
Maintaining marketing within enterprise 0.6441303 0.1220789 5.28 0.000 0.4048601 0.8834005
Acquiring or expanding marketing capacity 0.4495359 0.1057202 4.25 0.000 0.2423282 0.6567437
_cons -2.706549 0.2525422 -10.72 0.000 -3.201523 -2.211576
Industry var(_cons) 0.0631331 0.0307639 0.0242928 0.1640728
LR test vs. logistic regression: chibar2(01) = 19.91 Prob>=chibar2 = 0.0000