what makes an investigation difficult?
TRANSCRIPT
JMB JOURNAL OF MATHEMATICAL BEHAVIOR, 17 (3), 328-353 ISSN 0384-0213. Copyright Q 1998 Ablex Publishing Corp. All rights of reproduction in any form reserved.
What Makes an Investigation Difficult?
DYLAN WILIAM King’s College, London
The national school-leaving examination in mathematics in England and Wales includes both for- mal timed written examinations, and a school-based component. Although originally conceived in quite broad terms, the school-based component has been operationalised in terms of quite a narrOw range of problems, typically combinatoric in nature, and generally called ‘investigations’. The marking guides given to teachers for the assessment of these problems are generic, in that they are meant to apply to all such problems. In this article it is argued that generic marking guides are unlikely to be successful, and that teachers engaged in assessing school-based work need to take into account features of the specific activity in which the student engages. A corpus of 20,000 stu- dent responses to 80 investigative tasks were analyzed to produce a framework of task-factors. The framework characterises tasks in terms of seven factors arranged in four categories. The first cat- egory involves the match between the task metaphor and the intended task and the extent to which the task metaphor is likely to be shared by students. The second category concerns the complexity of the task structure, both in terms of the search-space of the task and the relationship between the dependent and independent variables. The third category involves the complexity of the generali- sation, both as a rerm-to-term and as a posirion-ro-rerrn rule. The fourth category is related to whether the kinds of proof required (or possible) are inductive or deductive.
While there appears to be a general move towards the assessment of authentic mathemati- cal performance and higher-order skills in the U.S. and elsewhere (Kulm, 1990; Lesh & Lamon, 1992), in many other countries, such assessment has been the norm for many years (Eckstein & Noah, 1993, pp. 262-272). In England and Wales (as in France and Germany), although timed written examinations have been the most common way of assessing the mathematical performance of students of school-leaving age for most of this century, such examinations have often included a heavy emphasis on higher-order thinking, and authen- tic assessment of performance has been used extensively for many years.
For example, a 1966 school leaving examination placed approximately 50% weight on one examination paper (out of three) in which candidates had four hours to answer just one question from a choice of five:
1. Discuss the relevance of matrices to networks. Illustrate by suitable examples. 2. Discuss “Relations” with special references to their representations. Illustrate by suit-
able examples. 3. Discuss the applications of sets to linear programming.
Direct all correspondence to: Dylan Wiliam, Dean and Head of School, School of Education, King’s College London, Cornwall House, Waterloo Road, London SE1 8WA, England.
329

330 WILIAM
4. After a definition and an example of a simple continued fraction] Investigate simple continued fractions.
5. Investigate either: Quadrilaterals: classification by symmetry, or: Triangles and their associated circles (Associated Examining Board, 1966).
However, the guidance given to those involved in grading these examination papers was generally ad hoc, and often highly idiosyncratic--the reliability of the assessments depended on those involved in grading being able to meet regularly to discuss the standards being applied. Towards the end of the 198Os, when the Government mandated a new national public examination system for school leavers, which was to include performance assessment, it was clear that it would be impossible to guarantee comparability of stan- dards without more sophisticated arrangements for standardisation.
The next section of this paper outlines how the mandated requirement for school-based assessment resulted in an emphasis on particular kinds of combinatoric task, and suggests some of the reasons that the guidance produced for those involved in grading these tasks was generic (rather than task-dependent). Some of the effects of reliance on generic mark schemes are then reviewed and the need for marking schemes to take account of the spe- cific tasks attempted by students is argued.
A complete classification of the factors affecting the difficulty of a performance task is likely to be impossible. Nevertheless, some guidance as to the relative difficulty of differ- ent investigative tasks is likely to be useful for those involved in grading students’ work. The main section of this paper presents the results of a qualitative analysis of the attempts of over 5000 students at over thirty different investigative tasks. The analysis identifies four dimensions of task variability: activity setting, activity structure, generalising and convincing, the first three of which are each sub-divided in two, and variation along each dimension is represented categorically.
1. BACKGROUND
From 1962 until 1988 there were two complementary systems of school-leaving examina- tions taken by students in England and Wales at age 16. One, the Ordinary level of the General Certificate of Education (GCE), was aimed at the highest attaining 25% of the population, while the other, the Certificate of Secondary Education (CSE), was aimed at the next 35% of the population. No provision was made for the lowest attaining 40% of the cohort.
In 1984, the British Government announced that from 1988 on, these two systems would be merged into a single examination, to be called the General Certificate of Second- ary Education (GCSE), and which would be administered by five regional groups. For the twenty most common school subjects national criteria would be laid down which would govern the construction of syllabuses and examinations for each subject, although each regional group had flexibility to determine its own syllabuses within the terms laid down. The national criteria would also give detailed descriptions of the typical performance asso- ciated with different grades awarded on the examination (grade criteria), so that users of examinations results would have some idea of the levels of performance they could expect

WHAT MAKES AN INVESTIGATION DIFFICULT? 331
of candidates awarded particular grades (Secretary of State for Education and Science, 1984).
The criteria were published in 1985 (Department of Education and Science & Welsh Office, 1985), and required that in each subject the student’s grade should include a mea- sure of school-based assessment: in mathematics the weight of the school-based compo- nent had to be between 20% and 50%.
In most other subjects, the need to incorporate a measure of school-based assessment presented few major problems, since there had been a strong tradition of school-based assessment in both the CSE and the GCE. However, while there had been some experience with school-based assessment of mathematics in the CSE, there was none among the GCE groups. The mandated introduction of school-based assessment in mathematics in 1988 therefore presented the five regional examining groups with a severe challenge: standards were to be carried forward from the old examination to the new, while at the same time devolving a significant proportion of the marking of students’ work to school teachers not previously trained for this kind of assessment.
The national criteria listed 17 assessment objectives for the school leaving examination, two of which were extremely difficult to assess in the context of a timed written examina- tion:
#16 Respond orally to questions about mathematics, discuss mathematical ideas and carry out mental operations; #17 Carry out practical and investigational work and undertake extended pieces of work.
There was no requirement that the school-based component should assess only these two objectives, but, perhaps for ease of administration, when each of the five examining groups published its proposals, the assessment of the first 15 objectives was to be done in the formal timed written examination and the school-based component assessed only the last two. However, the form that the school-based assessment should take was still largely undetermined.
School based assessments were not well defined, and despite the requirement to assess both practical and investigational work in mathematics, two influences combined to direct school-based assessment almost entirely away from practical applications. One was based on the ideal of introducing more authentic mathematical activity into classrooms, and the other, more prosaically, was concerned with the difficulty of assessing the more practical applications of mathematics reliably. These are discussed in turn below.
1.1. Authentic Mathematics
During the early 1960s a number of teacher-training establishments in England had become very unhappy with the mathematics education given to teachers to be. They pro- posed that a much greater concentration on the nature of mathematics was necessary for future generations of mathematics teachers (Sturgess, 1967). As well as equipping teach- ers-in-training with pedagogical skills for the exposition of standard results and techniques, there was an increasing focus on the student-teacher being involved in the creation of her or his own mathematics (Sturgess, 1967, p. 15).

332 WILIAM
The emphasis for this creative strand of mathematical activity was on giving students some experience of what mathematicians do, and although such mathematics could be in a practical or applied setting, the primary vehicles for this creative side of mathematics were investigations. ’ These were more-or-less loosely defined, open-ended mathematical situa- tions which the student-teachers were to explore, either individually or collaboratively with other students (the examples given in the introduction are typical; for other examples see Sturgess, 1967, pp. 14-26; Brookes, 1966, pp. 3640).
Throughout the 1970s and 1980s the use of investigations in secondary school mathe- matics increased steadily and their formal assessment was incorporated into many of the school-based components of the CSE. Accordingly, when the regional examining groups were required to incorporate school-based assessments of investigative and practical math- ematics into the school leaving examinations, the readily available experience of assessing investigations was quickly pressed into service (Wiliam, 1993).
These processes can be conceptualised in terms of Samuel Messick’s framework for validity enquiry (Messick, 1980), shown in Figure 1. For many in the mathematics educa- tion community any assessment that ignored investigation would underrepresent the con- struct of mathematics. In other words, without investigations, mathematics would be too thin. On the other hand, the use of real contexts appeared to introduce an unacceptable degree of construct-irrelevant variance (being heavily dependent on the individual’s expe- rience rather than their mathematical ability), which would lead to mathematics “straying beyond its brief.” Both of these aspects of construct validity relate to the upper left-hand cell of Figure 1.
For others, the use of investigative tasks, because of their greater similarity with more advanced studies in mathematics, would improve the extent to which assessments at age 16 would predict future performance (top right-hand cell of Figure l), although there was little empirical evidence to support this belief. These reasons relate to the evidential basis of validity. However, it is clear from policy documents circulating during this period that the consequential basis was at least as important. Omitting investigative tasks from a school-
result interpretation result use
evidential basis construct validity construct validity and
relevance/utility
consequential basis value implicationa social consequences
FIGURE 1. Messick’s framework for the consideration of the validity of assessments

WHAT MAKES AN INVESTIGATION DIFFICULT? 333
leaving examination in mathematics would send the message that investigations weren’t really an important part of mathematics (value implications), with the result that teachers would not pay very much attention to this aspect of mathematics (social consequences). For many in the mathematics community, therefore, the current focus on investigations is driven primarily by concerns of validity.
1.2. Reliability
The other influence on the way that school-based assessment was conceptualized in England and Wales was the problems that were encountered in getting teachers in schools to grade reliably their own students’ work on more practical and applied mathematical modelling tasks. In line with the publication of grade criteria in the National Criteria, the marking schemes given to teachers for the grading of school-based components consisted of illustrations of typical performance associated with particular grades in open-ended work. These domain-general performance descriptions are problematic enough when applied to pure (i.e., de-contextualised) investigations (see Wiliam, 1994, pp. 50-54), but appear to have been even less robust when used for the assessment of mathematical skills applied in real contexts.
The preponderance of investigative (i.e., pure) tasks over practical or modelling tasks in national assessment in England and Wales is therefore attributable to both epistemic and pragmatic imperatives. Practical applications of mathematics can, to an extent, be assessed in formal timed written examinations, whereas the need to provide students with opportu- nities to create their own mathematics cannot. On the other hand, there can be little doubt that the difficulty of assessing practical work reliably with domain-general performance descriptions has been an important factor in preventing the widespread adoption of such activities in high-stakes school-based assessment.
However, as Wells (1986) hti pointiid out, the kinds of tasks currently in use represent only a small subset of all such ‘ifiLesiiga&e’ tasks. He argues that most of the open-ended pure activities used in schools in the united Kingdon (and in many other English-speaking countries) can be characterized as data-pattern-generalisation (DPG) tasks in which stu- dents are expected to generate data, spot patterns, and then make a generalization based on the pattern. Although often located in geometrical as well as numerical contexts, almost all the tasks in widespread use result in problems that are essentially combinatoric in nature. Some work has been done in identifying the strategies that students use in tackling such tasks-see for example, English (1992, 1993)-but there has not yet been any systematic classification of all such tasks.
2. WHAT KINDS OF TASKS?
The empirical base for the work reported here is the archive of around 20,000 pieces of stu- dents’ work on approximately 80 investigative tasks collected during the school trials for the Graded Assessment in Mathematics (GAIM) Project between 1984 and 1989, although many of the tasks were also used in other curriculum schemes, notably the Secondary Mathematics Individualised Learning Experiment (SMILE). Eventually, 40 of these inves- tigative tasks were published commercially (Graded Assessment in Mathematics, 1992).

334 WILIAM
As part of its development work, the GAIM project had examined between 300 and 1000 pieces of students’ work for each of the 50 or so tasks that had reached the final stages of development, identifying the extent of progress (Wiliam, 1994, p. 5 1) made by individ- uals. For each task, a hierarchy of typical responses was developed jointly with the teachers involved in grading the students’ work, and each level of the hierarchy thus derived was identified with one of the 15 levels used to report overall student achievement within the GAIM assessment scheme (Graded Assessment in Mathematics, 1992).
The intention had then been to abstract from the individual task hierarchies a genera- lised hierarchy that could be used as a generic marking scheme for all investigations, thus avoiding the need to create a separate marking scheme for each new task.
However, it quickly became apparent that the same extent of progress on different tasks could represent very different levels of achievement-a situation comparable to Piaget’s horizontal decalages (Piaget & Inhelder, 1941), where students’ responses show “hetero- geneity, where only homogeneity might have been expected” (Flavell, 1963 emphasis in original). In other words, the assumption that all tasks were in some way equivalent for the purpose of the assessment was not tenable, and as well as the extent of progress through the task, it was required to take some account of the degree of difficulty (Wiliam, 1994 p. 51) of the task.
In order to investigate the task-related factors that might influence the responses of stu- dents, the tasks and the students’ responses were treated as qualitative data, and analysed using techniques of open coding (Strauss, 1987). The coding frame that emerged consisted of 7 concepts grouped into 4 categories, three of which-activity structure, generalizing and convincing-might be regarded as task-related. The other category--activity genera- tion (involving 2 concepts)-involved both student- and task-related factors. The coding is regarded as saturated (Strauss, 1987) in that all tasks that have been encountered that were not used in generating the original coding can be coded within the frame developed.
Each of the categories in the coding frame is discussed in turn below adopting a genetic approach, beginning with activity generation, and then discussing activity structure, gener- alizing and convincing. In order to make the presentation of the framework clearer, the dis- cussion below presents the framework by a series of examples, using particular tasks. However, the classification itself appears to be quite general.
2.1. Activity Generation
Let us suppose that a teacher wants a student to undertake an exploration of a particular mathematical situation:
Task 1 On a square lattice (i.e., on square centimetre dotty paper), for a given rectangular area, what is the minimum number of lattice points we must mark with a cross so that no lattice point is more than 1 unit from a cross?
Now the problem might be phrased exactly in this way, and given to students. In this case, there will be some students who can understand what the problem is asking and get to work straight away. However, there will be others, who would be able to engage in the intended activity but for the fact that they don’t understand what is required. For some of

WHAT MAKES AN INVESTIGATION DIFFICULT? 335
these students, the problem will become more accessible if it is located in a familiar con- text, using a task metaphor which capitalises on scripts (Schank & Abelson, 1977) that the student possesses. For example, we might frame the task as follows:
Task 2 This problem concerns a strange chess piece-a disabled rook-moving over a rectangular chessboard. It can move in the same way as a rook, (i.e., left and right, forwards and back- wards, but not diagonally) except that it can only move one square in each direction. For a given rectangular chessboard, how many rooks do you need to make sure that each square of the board is attacked (or occupied!).
The mathematical problem at the core of this task is the same as before, but it is pre- sented in a metaphorical form. For students familiar with chess, this metaphor will be more accessible. However, if the student has no knowledge of chess, this implementation is attempting to capitalise on scripts that the student doesn’t have, and is in fact is likely to hinder more than help. In other words, the metaphor being used is not sufuziently com- monly shared to be useful. Other variations, such as the following task called “Watch Out!” may be more successful.
Watch Out! Imagine a city whose streets form a square grid, the side of each square being 1OOm. A police- man stands at a street-comer. He can spot a suspicious person at lOOm, so he can watch 400m of street. A single block needs 2 policemen to watch it. 2 blocks will need 3 policemen. What about 3 blocks in a row? 4 blocks in a row? and so on.. .(Secondary Mathematics Independent Learning Experience, 1990b task 0436).
This implementation gives a task that is more accessible in that the scripts necessary to engage with this formulation are more widely shared, but, unfortunately, quite apart from the sexist language, the metaphor is not a good one. There are interpretations consistent with the real-world situation depicted that are not isomorphic to the intended activity. For many students, the idea that someone can see exactly 100 metres, but not 110 metres is plainly absurd. Accordingly, they produce optimal arrangements that accord more with their common sense than with the teacher’s intention. In particular, this kind of response may be more prevalent in female than male students (Boaler, 1994; Brown, 1984; Gilligan, 1982).
The fit between the core mathematical activity intended and the possible interpretations within the “Watch Out!” task is not good. There are many features in the task description which students are expected to suppress. The expectation of students is similar to those made by Zoltan Dienes when he proposed the use of different sized “base apparatus” for the teaching of place value (Dienes, 1964). It was intended that students should abstract the important features (that within a base system the ratio between different sized pieces is a power of the radix) while other features (such as being made of plastic, as opposed to, say, wood) would be suppressed.
In general, certain attributes of the task metaphor will map onto corresponding attributes within the target activity, while others will not, and the salience of the undesired features will have a significant impact on the process whereby the tusk intended by the teacher leads to activity on the part of the student (Christiansen & Walther, 1986).

336 WILIAM
For many students, the following presentation of the task may lead to greater conver- gence on the intended activity.
Fire hydrants , Imagine a city whose streets form a square grid, the size of each square being IOOm. The Fire Department has hoses &at are 100 metres long, so a single block needs 2 hydrants to protect it. 2 blocks will need 3 hydrants. What about 3 blocks in a row? 4 blocks in a row? and so on. Investigate further (Graded Assessment in Mathematics, 1992, task 113).
The process of generating activity (in the mind of a learner) from a task (presented by a teacher) is clearly influenced by many cognitive and affective factors which are beyond the scope of this paper. What is highlighted here is that there are two features that influence the kind of activity generated: the match between the task metaphor and the intended activity, and the extent to which the metaphors are shared.
The degrees of match between the task metaphor and the intended core activity can be classified as:
A perfect match Different in only insignificant details Different in significant details No match
The task metaphor itself can be classified as:
Universally shared Commonly shared Not commonly shared
2.2. Activity Structure
As noted above, the factors that influence the process by which the task presented by the teacher gives rise to an activity on the part of the student are not task variables, but are rather the result of interactions between the task and the student. We cannot say that a par- ticular presentation will be more or less accessible, but only that it will be more or less accessible for particular students, given their knowledge and experience. However, once the student has engaged in a particular activity (whether it bears any resemblatlce to the one intended by the teacher or not) there is a sense in which we can say that one activity is more or less difficult than another, even if only by reference to a normative population. In other words, one activity is more difficult than another if the proportion of students who are able to reach a particular level of success on the first task is less than for the second.
However, activities are difficult to describe since, by definition, they exist only in the minds of students, rather than in the pages of curriculum schemes. For the sake of conve- nience, therefore, in what follows, activities are denoted by the tasks that would give rise to that activity if the student engaged in the activity as the teacher intended. I would like to clarify, however, that I am not assuming that even a single student would actually engage
WHAT MAKES AN INVESTIGATION DIFFICULT? 337
in the intended activity when presented with a task-the equation of task with activity is an entirely nominal relationship used for the description of activities.
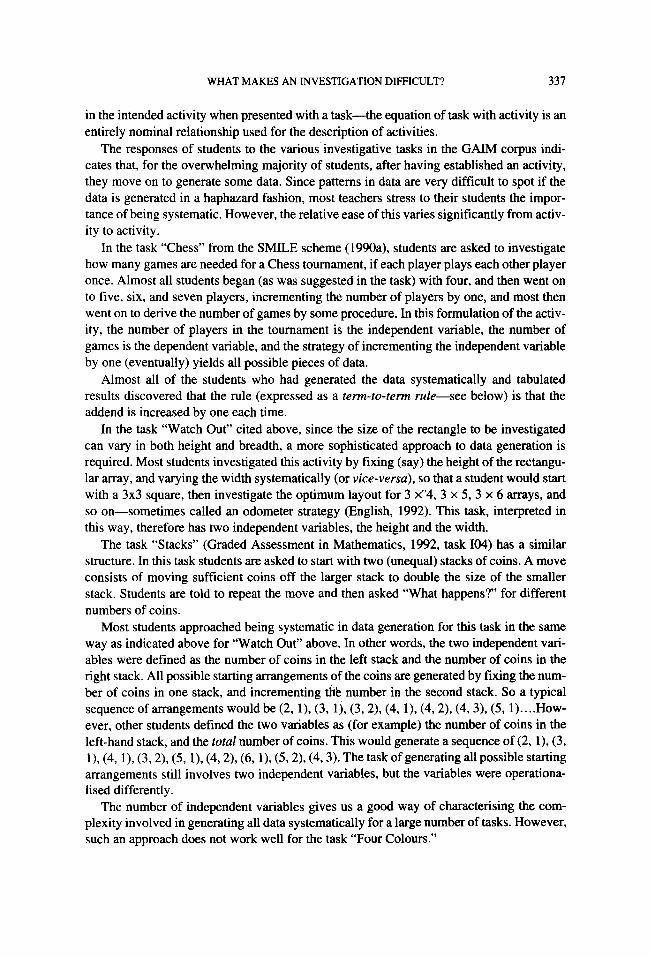
The responses of students to the various investigative tasks in the GAIM corpus indi- cates that, for the overwhelming majority of students, after having established an activity, they move on to generate some data. Since patterns in data are very difficult to spot if the data is generated in a haphazard fashion, most teachers stress to their students the impor- tance of being systematic. However, the relative ease of this varies significantly from activ- ity to activity.
In the task “Chess” from the SMILE scheme (1990a), students are asked to investigate how many games are needed for a Chess tournament, if each player plays each other player once. Almost all students began (as was suggested in the task) with four, and then went on to five, six, and seven players, incrementing the number of players by one, and most then went on to derive the number of games by some procedure. In this formulation of the activ- ity, the number of players in the tournament is the independent variable, the number of games is the dependent variable, and the strategy of incrementing the independent variable by one (eventually) yields all possible pieces of data.
Almost all of the students who had generated the data systematically and tabulated results discovered that the rule (expressed as a term-to-term rule-see below) is that the addend is increased by one each time.
In the task “Watch Out” cited above, since the size of the rectangle to be investigated can vary in both height and breadth, a more sophisticated approach to data generation is required. Most students investigated this activity by fixing (say) the height of the rectangu- lar array, and varying the width systematically (or vice-versa), so that a student would start with a 3x3 square, then investigate the optimum layout for 3 ~“4, 3 x 5, 3 x 6 arrays, and so on-sometimes called an odometer strategy (English, 1992). This task, interpreted in this way, therefore has two independent variables, the height and the width.
The task “Stacks” (Graded Assessment in Mathematics, 1992, task 104) has a similar structure. In this task students are asked to start with two (unequal) stacks of coins. A move consists of moving sufficient coins off the larger stack to double the size of the smaller stack. Students are told to repeat the move and then asked “What happens?’ for different numbers of coins.
Most students approached being systematic in data generation for this task in the same way as indicated above for “Watch Out” above. In other words, the two independent vari- ables were defined as the number of coins in the left stack and the number of coins in the right stack. All possible starting arrangements of the coins are generated by fixing the num- ber of coins in one stack, and incrementing the number in the second stack. So a typical sequence of arrangements would be (2, l), (3, l), (3,2), (4, l), (4,2), (4,3), (5, l).. ..How- ever, other students defined the two variables as (for example) the number of coins in the left-hand stack, and the total number of coins. This would generate a sequence of (2, l), (3, l), (4, l), (3,2), (5, l), (4,2), (6, l), (5,2), (4,3). The task of generating all possible starting arrangements still involves two independent variables, but the variables were operationa- lised differently.
The number of independent variables gives us a good way of characterising the com- plexity involved in generating all data systematically for a large number of tasks. However, such an approach does not work well for the task “Four Colours.”

338 WILIAM
??FIGURE 2. Diagram for ‘Four Colours’
In this task, students were asked to find how many different ways there are to colour the diagram shown in Figure 2 with four colours, using all four colours (which therefore pre- cludes using the same colour twice). Most 12, 13 and 14 year olds students could not immediately see that the number of alternatives (counting rotations and reflections as dif- ferent) was 4x3~2, and therefore began to attempt to generate the alternatives.
One strategy would be to treat the color allocated to each of the four squares as an inde- pendent variable, and an extension of the odometer strategy would generate all the ele- ments of the search space, but only at the expense of a considerable number of disallowed combinations-232 out of 256 (!).
However, not a single one of over 1000 student responses to this task in the GAIM cor- pus displays this strategy. Instead, all students attempted more or less successfully to develop strategies that generated only allowable configurations, and most managed to gen- erate all the possible configurations without repeating any of them. The strategies used by students varied widely, but they had a commonality of structure and were all, to a certain extent, recursive.
For example, one of the most common approaches was to begin with a particular color in the top left hand square, put a different colour in the top right hand square, a third color in the bottom left-hand square, leaving no choice for the fourth color. The next variant was then generated by moving back up the decision path taken to reach the first variant, back to the last point where there was a choice, and to make a different choice. So, if we use R, G, Y and B to represent red, green, yellow and blue, the first choice would be RGYB, and the second would be RGBY. This exhausts the choices that can be made with RG as the first two colors, so that the student pops back and explores the other choices stacked up at the second node. This particular approach, like all the other approaches used by the students can be represented by a symmetric tree-like structure-a representation of the strategy described above is shown in Figure 3.
A different task, which gives rise to an asymmetric tree structure is the task “Change” again, taken from the GAIM materials (task 123). Using the standard British coinage of 1, 2, 5, 10, 20 and 50 pence coins students were asked to investigate how many ways there were of giving somebody 7 pence, 8 pence and so on.
What is remarkable about this task is how almost all those who attempted this task sys- tematically (whether adult or child) ended up producing the same tree structure. The tree is generated either by beginning with the smallest value coins, and aggregating, or the largest value coins, and progressively disaggregating, disaggregating the smallest coins first.

WHAT MAKES AN INVESTIGATION DIFFICULT? 339
FIGURE ,3. Search-space for ‘Four Colours’
So, when asked to find all the ways of giving 10 pence, a typical response was as shown in Figure 4, which can be represented by the tree structure shown in Figure 5.
Clearly the structure of this task cannot be represented in terms of numbers of indepen- dent variables. A more general notion, which subsumes both the independent variables structure of Watch Out and Chess and the tree structures generated by activities like Four Colours and Change is provided by the notion of a search space.
For a given task, generating data systematically consists first of all of locating all possi- ble starting arrangements. Then there may be a requirement to perform a straightforward procedure (such as counting the number of games in Chess, finding out what happens to the piles of coins in Stacks), to optimise some feature (such as finding the minimum number of policemen in Watch Out) or simply to count the number of arrangements (as in Four Colours). The search space is the set of all such starting arrangements. It is important to

340
10
5
5
5
5
2
2
2
2
2
1
FIGURE 4.
5
2 2 1
2 1 1
1 1 1
2 2 2
2 2 2
2 2 1
2 1 1
1 1 1
1 1 1
Typical results for ‘Change’
WILIAM
1
1
2
1 1
1 1 1
1 1 1 1
1 1 1 1 1
1 1 1 1 1 1
note that the search space envisaged here is not the same as the problem-space often referred to in the problem-solving literature. A problem-space is the set of all possible problem-solving states and therefore the goal is to find the one state that represents the goal state. Here, instead, the object is to locate all the points in the space.
Since the search space is simply a set of nodes, it cannot be said to have any actual struc- ture of its own. Accordingly, the complexity of the search space is characterized by the nature of various strategies that can be used to exhaust or organise the search space. These are discussed in turn below.
2.2.1. Effective ad Efiient Searches. All the tasks discussed so far have search spaces with the property that there exist search strategies that locate all elements of the search space, without duplication. Although the strategies developed by many students for (for example) Change or Four Colours do duplicate elements of the search space, and miss out other elements, nevertheless, there do exist strategies that are effective (in that they produce all the elements of the search space) and efficient (in that these elements are pro- duced without duplication).
The search spaces of tasks for which there exist efficient and effective search strategies can be classified as either orthogonal or tree-like, and those with orthogonal search spaces can be further classified as linear (e.g., Chess), rectangular (e.g., Stacks or Watch Out), and

WHAT MAKES AN INVESTIGATION DIFFICULT? 341
11111111
11111111 FIGURE 5. A tree structure for the search space of ‘Change’
so on. However, there are tasks which give rise to search spaces for which no efficient search strategy exists, although there may be effective strategies.
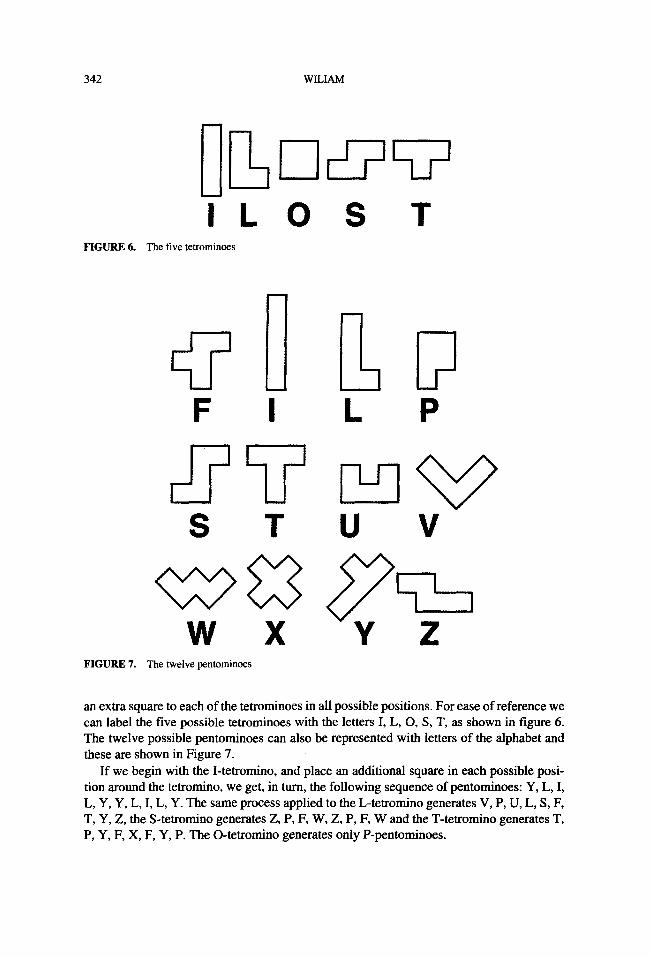
2.2.2. Effective But Ineffiient Searches. In the task “Polyominoes” (Graded Assessment in Mathematics, 1992 task IO@, students are asked to investigate how many different arrangements they can make with a given number of squares, provided that the squares must join edge to edge, and assuming that rotations and reflections are not to be counted as different.
No efficient strategy is known that generates all the pentominoes (five squares) without duplication although it is not inconceivable that one will be discovered in the future. Since this is often the case, the description no efficient strategy will be used to mean no known strategy, and no implication about the proof of the non-existence of such a strategy should be inferred.
An effective, but inefficient, strategy, which relies on recursion, is to assume that we have all the tetrominoes (four squares), and then to generate all the pentominoes by adding
342 WILIAM
FIGURE 6. The five tetrominoes
OS T
FIGURE 7. The twelve pentominoes
a a L P
an extra square to each of the tetrominoes in all possible positions. For ease of reference we can label the five possible tetrominoes with the letters I, L, 0, S, T, as shown in figure 6. The twelve possible pentominoes can also be represented with letters of the alphabet and these are shown in Figure 7.
If we begin with the I-tetromino, and place au additional square in each possible posi- tion around the tetromino, we get, in turn, the following sequence of pentominoes: Y, L, I, L, Y, Y, L, I, L, Y. The same process applied to the L-tetromino generates V, P, U, L, S, F, T, Y, Z, the S-tetromino generates Z, P, F, W, Z, P, F, Wand the T-tetromino generates T, P, Y, F, X, F, Y, P. The 0-tetromino generates only P-pentominoes.

WHAT MAKES AN INVESTIGATION DIFFICULT? 343
a) I-tetromino
V
Z P U
Y-L- I T
\II F S
X
:)S-tetromino
V
Z-P U
I I Y L T
WC-) F S
X
J) -0
Z /“I
P-U \ 1 ‘-T L I
/ 4 W F-S
X
I)T-t&omino
V
Z P
/z
U
Y L I T
W F S
t
X
FIGURE 8. The search space for ‘Pentominoes’
The sequence in which pentominoes (apart from the P-pentomino) are generated from each of the tetrominoes can be illustrated by a representation of the search-space for this activity such as that in Figure 8.
2.3. Generating the Data
Once the student has developed a strategy for locating as many as possible of the elements within the search space, the next question is, for a particular element of the search space, “what does the student have to do in order to generate a value for the dependent variable?’ As suggested earlier, there are three levels of complexity generally encountered.
At the simplest level, the student is simply required to count the elements of the search space, as in Change and Four Colours. A task is likely to be more difficult if the student has to carry out some specified (but clearly understood) procedure for each element of the search space, as in Chess or Stacks. More complicated still are tasks where, for each ele-

344 wILL4M
ment of the search space, students are expected to find an optimum value of the dependent variable, as in Watch Out. Because any errors in working at this stage can make finding any generalizable pattern almost impossible, the extra potential for error involved in having to optimize, rather than simply carrying out a routine procedure, appears to have a significant impact on the difficulty of a task.
Generally, tasks that have more complex search spaces tend to have easier requirements in terms of generating the data (otherwise the whole task would be too hard for secondary school students). However, examples of tasks with complex search spaces where students are required to do more than simply enumerate elements of the search space do exist. For example, if we asked students to find all pentominoes that had a line of mirror symmetry, after they had developed an effective strategy in order to be sure to locate all the pentomi- noes, they could then apply a straightforward procedure for eliminating the six pentomi- noes that do not have a line of symmetry. Alternatively, of course, a student could go more directly to the solution by developing a search strategy that eliminates asymmetrical pen- tominoes before they are generated, although this would appear to be much more difficult.
2.4. Deriving Relationships
Having derived the data, the next stage through which most students go is to look for pat- terns within that data, and where possible, to hypothesize relationships. How successful the pupil is at this will obviously depend on the nature of the relationship.
For example, one task which can be used with very young students, or low-attaining stu- dents of any age, is that of investigating the relationship between the number of fence-posts and the number of fence panels when one is building a wall. Provided suitable manipula- tive material is available, even very low-attaining students can derive a table that such as that shown in Table 1.
Most students who have reached this stage can also then determine that the ‘rule’ is that the number of posts is always one more than the number of fences, which constitutes a gen- eralization, and can deduce that if there were a hundred fences then you would need a hun- dred and one posts.
Some students can go further and explain that this is true because each fence panel can be matched with the post on (say) its left, leaving one extra post. This constitutes a deduc- tive proof of the generalization, and will earn the highest available score in most schemes for the assessment of mathematical processes, even though reaching the same level of achievement in (say) Chess is clearly much harder.
TABLE 1 Fences and Posts
Fences POtit.9
1 2 2 3 3 4 4 5 5 6 6 I

WHAT MAKES AN INVESTIGATION DIFFICULT? 345
Another aspect of the complexity of the mathematical relationship between variables is the way that students choose to express the patterns that they discover. For example, in Chess almost all students begin by expressing the patterns they find in the data as a term- to-term rule. In other words, they write down their generalization in terms of the relation- ship between successive values of the dependent variable.
In Chess, for example, the most common generalisation from students was expressed as “the number you add on goes up by one each time.”
This is in contrast to a position-to-term rule in which the values of the dependent vari- able are given in terms of the values of the independent variables, if there are any, or in terms of the variables that are used to define a particular element within a search space. Couched in the terms of the language of recurrence relations, a term-to-term rule is of the form U, =f(u, - 1) while a position-to-term rule is of the form u, of.
Whether a generalization is expressed as a term-to-term rule or a position-to-term rule is not, however, part of the structure of the problem, but is rather a feature of how the stu- dent chooses to represent the solution and may be considered to have more to do with ‘extent of progress’ approaches rather than the degree of difficulty of the task. However, it is raised here because in order to know how difficult the task will be for a student we need to know the relationship between the independent and dependent variables, and how the student is likely to try and represent this relationship. Of course, for most tasks, both term- to-term and position-to term rules exist. For Chess the term to term rule is linear, while the position-to-term rule is quadratic, which illustrates a very general feature of the relation- ship between term-to-term and position-to-term rules for the same mathematical relation- ship. Due to fundamental properties of recurrence relations, the position-to-term rule is always more complex (in terms of involving higher-order expressions) than the term-to- term rule. Indeed, for many problems, no position-to-term rule is known, but there is a term-to-term rule. A good example of this is the Josephus problem (Engel, 1985, p. 185). which concerns the best place to stand if n people are to be arranged in a circle, and every mth person is to be “removed’ repeatedly until only one person remains. There is a well known recursive or recurrent solution, but no position-to-term rule is known.
Therefore we have two parallel classifications, according to whether the generalisation is expressed as a term-to-term rule or as a position-to-term rule.
The following list is offered as a tentative hierarchy, although it is not particularly robust as very large numbers, for, say, an additive mapping are likely to be harder than small numbers with a linear relationship.
constant additive multiplicative linear quadratic cubic polynomial exponential non-analytic (e.g., int, hcf, gcd) none (i.e., none known)

346 WILIAM
It is worth noting in passing that the exact form of the relationship between the indepen- dent variables and the dependent variables can be very sensitive to small changes in the activity. For example, the SMILE task Triangles From Straws (1990) asks students to explore how many different integer sided triangles can be made with a longest side n (where, of course, n is also an integer).
The number of integer sided triangles that can be made with longest side n is given by the following (quadratic) expression:
n(n + 2) -
4 for n even, and
(n+ 1)2 - forn odd
4
However, if students re-interpret the task as requiring them to find the number of trian- gles with total perimeter n, then the number of such triangles is:
il+l
n2+6n-1+6(-l) 2 48
for odd n not divisible by 3,
and
n-3 -
n2 + 6n + 15 + 6(-l) 6 48 for odd n divisible by 3,
with values for even n the same as for (odd) n-3-a rather more difficult generalization. Yet both activities could arise naturally out of the same task of asking students to investi- gate integer-sided triangles.
3. CONVINCING
Having derived a general expression, the next stage-ften ignored by students and their teachers-is that of proof. The French mathematician Hadamard once said that the only purpose of proof is to legitimate the conquests of the intuition, and, for this reason, when considering proof in school mathematics, it is certainly appropriate to include more infor- mal ways of becoming certain than formal mathematical proof. Indeed, as many philoso- phers of mathematics have argued, it is very difficult to defend any position on the philosophy of mathematics that is not, essentially, fallibilist (Kitcher, 1984; Lakatos, 1976).
In a study of the proof-explanations given by students in mathematical situations, Bell (1976) classified proof strategies as belonging to one of two parallel strands-empirical or deductive-with each strand being made up of a sequence of successively more complete

WHAT MAKES AN INVESTIGATION DIFFICULT? 347
explanations. In Bell’s work, it was acknowledged that individual students’ scripts may contain both kinds of work, but they were coded in terms of the single category which best fitted their work overall (Bell, 1976, p. 29). However, it is also possible to view the hierar- chy within each level as a developmental sequence of levels of proof-explanation for the individual. Although many students’ entire attempt at explanations can tit comfortably in one category, for other students, it is possible that the different levels represent the devel- opment of the solution for the individual over time. For some tasks, this would necessitate shifting between strands. For example, the highest level in the empirical strand is a check of full finite set of cases (p. 28). Such an approach is obviously not appropriate where stu- dents are investigating potentially infinite sets, and so, with such tasks, a complete expla- nation would, at some point, have to switch to a deductive approach.
As Wells (1986) pointed out, many of the justifications offered in support of generalisa- tions derived in DPG tasks are essentially inductive. The verification of these inductive generalizations is limited to the test of a crucial experiment (Balacheff, 1988). For exam- ple, in the activity Chess a student may have derived an inductive rule, such as the “number you add on goes up by one each time,“or a deductive rule such as “you times the number of people by the number one less than it and then you half it.” These rules will then be val- idated by testing them on some appropriately difficult case, certainly one outside the range of the existing data, and if the actual value is the same as the value generated by the rule, then the rule will be considered (by the student, if not also by the teacher) to be validated.
This is often described as an inductive approach to proof in mathematics, but this is, in fact a misnomer, and highlights the differences between philosophies of mathematics and philosophies of science. It corresponds, roughly, to the philosophy of science as naive inductionism (Chalmers, 1978). In this view, each piece of evidence that agrees with the prediction of the rule is regarded as strengthening the theory, provided no disconfirming examples are found. This is in stark contrast to mathematical induction, which is a quite legitimate method of proof within the logico-deductive framework. The distinction can be illustrated by reference to the Chess activity.
As noted above, a naive inductionist approach to proof, would make isolated crucial experiments’, and providing that a sufficient number (whatever that might mean in prac- tice) were found to agree with the rule without generating disconfirming instances, the rule would be regarded as proved. In contrast, a mathematical inductive approach would start that by observing that if we already have n players, then the addition of any extra player would add a further it games. This leads to a formal logico-deductive mathematical proof by induction on n, the number of players, and is quite different from the naive inductivist approach exemplified by the crucial experiments approach.
An example of a direct mathematical proof is provided by the handshaking approach, in which a student might argue that if there are n people, each person must play each one of the other n-l people, which would suggest a total of n(n-1) games. However, this has
n(n- 1) counted each game twice, so the actual number of games is -
2
The tasks characterised as DPG (data-pattern-generalisation) tasks by Wells usually lead themselves most readily to a naive inductivist approach to validation. Although a con- vincing ‘causal narrative’ for the legitimation of the same rule in terms of mathematical

348 WILIAM
FIGURE 9. How many rectangles?
induction can be produced for Chess, this will not always be the case, and a restructuring of the task may be necessary before such an approach can be used.
The difference between the naive inductive approach and the direct deductive approach is well illustrated by the following incident.
A class was working on the task “How Many Rectangles” in which students were asked to investigate the number of different rectangles that could be found in a rectangular grid of horizontal and vertical lines such as is shown in Figure 9.
Most of the class, (and me, their teacher), had derived a general expression by the stan- dard approach when confronted by a problem with two independent variables: that of fix- ing one variable while systematically incrementing the other (i.e., the odometer strategy).
Accordingly, the number of rectangles were derived for two horizontal and 2 vertical lines, 2 x 3,2 x 4,2 x 5,2 x n, and then moving on to 3 x 2,3 x 3, 3 x 4,4 x 5,3 x n. After finding expressions for 4 x it and 5 x n, a generalization of generalizations was derived giv- ing the number of triangles for an m x it grid, where m and n are the number of horizontal and vertical lines. At this stage, this solution represents a naive inductivist approach. How- ever, it would be possible to make the approach more rigorous-using mathematical induc- tion-by giving a chain of reasoning as to explain the increase in the number of rectangles caused by the addition of an extra line.
However, one student adopted a different approach. He had thought quietly for a while, and then, without showing any working out, wrote down
m(m- 1) n(n- 1) .- 2 2
I asked him where was his working out. He replied “What working out?’ Patiently, he explained to me that he hadn’t needed to do any working out because, if you looked at it the right way, the answer was obvious. He reasoned as follows:
Each rectangle in the figure is defined by one choice of a pair of vertical lines and by an inde- pendent choice of one pair of horizontal lines. If there are m horizontal lines then there are m choices for the fmt horizontal line and m - 1 choices for the second, giving m(m - 1)choices
m(m- 1) in all, although we are counting each line twice, giving 2 choices for the horizontal

WHAT MAKES AN INVESTIGATION DIFFICULT? 349
n(n- 1) pair. There are similarly 2 choices in the vertical pair, and the horizontal and vertical
selections are independent of each other giving a total of m(m - ’ I’(’ - ’ ) choices in all. 4
Although it would be too crude to assert that it is a one-to-one relationship, there is a tendency in practice for position-to-term rules to be justified or proved directly while term- to-term rules are justified inductively. Certainly if the expectation from the teacher is only for a naive inductivist proof,2 then this would make a given task easier, in the sense of being more accessible to a larger number of students. If, on the other hand a rigorous indi- rect proof, by mathematical induction, or a direct one, by logical argument, is required, then this would certainly tend to make a given task more difficult. However, as the example from “How Many Rectangles” shows, the accessibility of deductive explanations depends critically on the student’s experience, and further analysis of the nature of the processes is likely to be extraordinarily difficult.
4. SUMMARY
The investigative mathematical tasks that have been discussed in this paper are only a sub- set of all investigative tasks, which are themselves only a subset of all possible open-ended mathematical tasks. Nevertheless for a combination of historical, epistemological and practical reasons, these tasks have assumed a significant importance in teaching and assessing mathematics in many countries, and in particular in the United Kingdom, Can- ada, Australia and New Zealand.
These tasks have a potential for encouraging students to see mathematics as an open, cre- ative discipline, but this will only happen if students are given some responsibility for for- mulating the activity and making decisions on how to proceed. This inevitably means that the activity in which the student engages will often differ from that intended by the teacher.
However, the use of such tasks in high-stakes assessments (representing concerns for value implications and social consequences), necessitate a satisfactory level of inter-rater agreement for grading, and as a result, many task-specific markings schemes have been developed. Unfortunately, such marking schemes are of little use if the activity in which the student engages has not been foreseen by those responsible for constructing the schemes. In order to minimize the stereotyping associated with task-specific markschemes (Wiliam. 1994), an attempt was made during the development of the Graded Assessment in Mathe- matics project to construct a generic mark scheme, but it quickly became apparent that such a markscheme would need to take account of the degree of difficulty of the task itself.
A complete analysis of factors affecting the ‘degree of difficulty’ of the task is almost certainly impossible, but a start has been made here on identifying critical variables affect- ing the accessibility and difficulty of some investigative tasks. The framework developed by the qualitative analysis of a very large corpus of students’ work suggest 7 factors arranged in four categories:
1. Task Setting

350 WLIAM
2.
1.1. How good is the match between the task metaphor and the intended mathemat- ical task?
??perfect match ??only insignificant details differ ??differences in significant details ??no match 1.2. What kind of task metaphor has been employed? ??universally shared ??commonly shared ??not commonly shared Activity Structure 2.1. What kind of search-space does the activity have? ??effective and efficient searches ??effective but inefftcient searches ??ineffective and inefficient searches 2.2. What do you have to do to get the value of the dependent variable from the inde-
pendent variables? ??count the elements of the search space ??carry out a procedure for each element in the search space ??optimise for each element in the search space
3. Generalising 3.1. What is the relationship as a term-to-term rule? ??constant ??additive ??multiplicative ?? linear ??quadratic ??polynomial ??exponential ??non-analytic (e.g., hcf, gcd, int) ??none (i.e., none known) 3.2. What is the Relationship as a position-to-term rule? ??constant ??additive ??multiplicative ??linear ??quadratic ??polynomial ??exponential ??non-analytic (e.g., hcf, gcd, int) ??none (i.e., none known)
4. Convincing 4.1. What kind of proof is required (or possible)? ??inductive ??deductive

WHAT MAKES AN INVESTIGATION DIFFICULT? 351
As it stands, this framework does not give definitive indications of the difficulty of tasks and activities, but it does provide a structure that teachers can use to select tasks matched to their students’ capabilities.
Without such careful matching of task difficulty, there is a tendency for differentiation (both curricular differentiation and differentiation in assessment) to take place entirely by the extent of progress through the task. The highest-attaining students do then come to see investigations as a chance to explore a mathematical situation, generate data, make and test hypotheses, formulate inductive and deductive explanations for their findings, and extend their work in different directions. However, low-attainers, because they are attempting the same activity, often make little progress beyond generating data. Indeed, many mark- schemes are predicated on the assumption that the lowest attainers should not progress beyond this point in order to provide the necessary discrimination. There are therefore qualitative differences in the experiences of different students. For the ablest, investigative work in mathematics is a creative exciting topic, while for the others, it can be little differ- ent from a page of sums.
To address this, and to give all students the experience of mathematics as a creative dis- cipline, it is necessary to select investigative tasks where the level of content is adjusted to the capabilities of the individual. Investigative tasks can be made much more accessible by ensuring that contexts used in their presentation are widely shared, and yet match the intended task closely. Where the structure of a search space is relatively simple, almost all students are likely to be able to generate data systematically, and the more direct the pro- cedure for deriving the value of the dependent variable, the more accurate their results are likely to be. Pattern-spotting is made easier by ensuring that relationships are simple, espe- cially when they are given as term-to-term rules.
Of course most students will not need to have all aspects of task difficulty minimized in this way. Indeed, students can only gain a representative view of the nature of mathematics if they encounter significant challenges in each of these aspects, but the challenges need not arise in all aspects in the same task. In particular, the much neglected area of deductive proof will only be a reasonable goal for lower-attaining students if other aspects of the task are easier.
There are likely to be very few tasks that are suitable for all students, irrespective of their attainment, and teachers will need to select the tasks with care. The facets of task dif- ficulty presented here are tentative, but do seem to describe significant aspects of the rela- tive suitability of different investigative tasks, and it is hoped that the framework presented here is of some help in assisting teachers to select appropriate investigative tasks for their students.
NOTES
1. The term “investigation” for such activities was proposed by Stewart Gartside, who at that time was at the Nottingham College of Education (Alan W. Bell, personal communication, 1993).
2. This should not be taken as condoning such a position by teachers, but simply as a recognition of the fact that many teachers do appear to hold such a view of the nature of mathematics proof (see Hewitt, 1992; Wiliam, 1993).

352 WILIAM
REFERENCES
Associated Examining Board. (1966). Mathematics syllabus Cpaper II. (Vol. 324/2/32:91). London, UK: Associated Examining Board.
Balacheff, Nicholas. (1988). Aspects of proof in pupils’ practice of school mathematics. In D. Pimm (Ed.), Mathematics, teachers and children (pp. 216-230). London, UK: Hodder & Stoughton.
Bell, Alan W. (1976). A study of pupils’ proof explanations in mathematics. Educational Studies in Mathematics, 7,23-40.
Boaler, Jo. (1994). When do girls prefer football to fashion? An analysis of female underachievement in relation to ‘realistic’ mathematics contexts. British Educational Research Journal, 20(5), 55 l-564.
Brookes, William M. (Ed.). (1966). The development of mathematical activity in children: The place of the problem in this development. Nelson, UK: Association of Teachers of Mathematics.
Brown, Stephen I. (1984). The logic of problem-generation: From morality and solving to de-posing and rebellion, For the Learning of Mathematics, 4(l), 9-19.
Chalmers, Alan F. (1978). What is this thing called science? Milton Keynes, UK: Open university Press.
Christiansen, Bengt, & Walther, Gerd. (1986). Task and activity. In A. Bengt Christiansen, Geoffrey Howson & Michael Otte (Eds.), Perspectives on mathematics education (pp. 243-307). Dor- drecht, Netherlands: Reidel.
Department of Education and Science, & Welsh Office. (1985). General Certtjicate of Secondary Education: the national criteria. London, UK: Her Majesty’s Stationery Office.
Dienes, Zoltan P. (1964). Mathematics in primary school. London, UK: Macmillan. Eckstein, Max A., & Noah, Harold J. (1993). Secondary school examinations. New Haven, CT: Yale
University Press. Engel, Arthur. (1985). Elementary mathematics from an algorithmic standpoint (F. R. Watson,
Trans.). Keele, UK: Keele Mathematical Education Publications. English, Lyn D. (1992). Children’s use of domain-specific knowledge and domaingeneral strategies
in novel problem solving. British Journal of Educational Psychology, 62,203-216. English, Lyn D. (1993). Children’s strategies for solving two- and three-dimensional combinatorial
problems. Journal for Research in Mathematics Education, 24(3), 255-273. Flavell, John H. (1963). The developmental psychology of Jean Piaget. Princeton, NJ: Van Nostrand. Gilligan, Carol. (1982). In a difherent voice. Cambridge, MA: Harvard University Press. Graded Assessment in Mathematics. (1992). Complete pack. Walton-on-Thames, UK: Thomas Nel-
son. Hewitt, Dave. (1992). Train spotters’ paradise. Mathematics Teaching, 140,6-8. Kitcher, Paul. (1984). The nature of mathematical knowledge. New York, NY: Oxford University
Press. Kulm, Gerald. (Ed.). (1990). Assessing higher order thinking in mathematics. Washington, DC:
American Association for the Advancement of Science. Lakatos, Imre. (1976). Proofs and refutations. Cambridge, UK: Cambridge University Press. Lesh, Richard, & Lamon, Susan J. (Eds.). (1992). Assessment of authentic performance in school
mathematics. Washington, DC: American Association for the Advancement of Science. Messick, Samuel. (1980). Test validity and the ethics of assessment. American Psychologist, 3.5( 1 l),
1012-1027. Piaget, Jean, & Inhelder, Barbel. (1941). Lc developpement des quantites chez l’enfant. Neuchgtel,
France: Delachaux et Niestle. Schank, Roger C., & Abelson, Robert P. (1977). Scripts, plans, goals and understanding: an enquiry
into human knowledge structures. Hillsdale, NJ: Erlbaum.

._1 Z.‘i :.
WHAT MAKES AN INVESTIGATION DIFFICULT? 353
&,- . . Secondary Mathematics Independent Leaming Experience. (1990a). Chess. London, UK: SMILE
Centte. ” Secondary Mathematics Independent Learning Experience. (1990b). Watch out. (Vol. 468). London,
UK: SMILE Centre. 0: : Secretary of State for Education and Science. (1984). Speech to the North of England Conference. In
Secondary Examinations Council (Pd.), Annual report 1983-84 (pp. 60-68). London, UK: Secondary Examinations Council.
Strauss, Anselm L. (1987). Qualitative analysisfor social scientists. Cambridge: Cambridge Univer- sity Press.
Sturgess, David A. (Ed.). (1967). Teaching muthemutics: muin courses in colleges of education. Lon- don, UK: Association of Teachers in Colleges and Departments of Education.
Wells, David G. (1986). Problem solving and investigations. Westbury-on-Trym, UK: Rain Publica- tions.
Wiliam, Dylan. (1993). Paradise postponed? Muthemutics teaching, 144,20-23. Wiliam, Dylan. (1994). Assessing authentic tasks: Alternatives to mark-schemes. Nordic Studies in
Mathematics Education, 2(l), 48-68.