‘what makes a good investment strategy?’ continuous asset ... · making the difference employee...
TRANSCRIPT

Making the DifferenceEmployee Conference 2008
‘What makes a goodinvestment strategy?’
Continuous Asset Improvement
Mark Johnson, Director of Property Services,
Nottingham City Homes

£1.1bn30 Year
InvestmentProgramme
£25.8m
Decent Homes
£10.3m
Major Capital Wks
£5.3m
Healthier Nottm
£11.4m
Green&Sust Nottm
£3.5m
Safer Nottm
£1m
Neb Nottm
Asset Management
£2.4mBudget
60 staff
Managed Programmes
£57m
NCH Asset Management
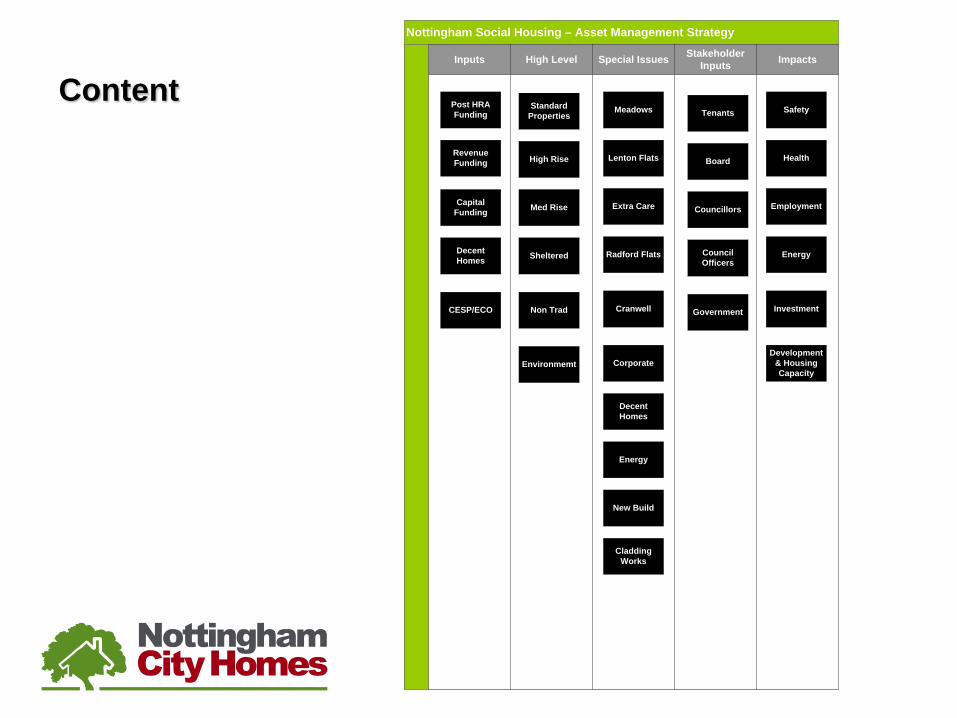
Nottingham Social Housing – Asset Management Strategy
ImpactsStakeholder InputsSpecial IssuesHigh LevelInputs
High Rise
Extra Care
Decent Homes
Non Trad
Corporate
Energy
EnvironmemtDevelopment
& Housing Capacity
Meadows
Lenton Flats
Sheltered Radford Flats
Cranwell
Standard Properties
Med Rise
Safety
Health
Employment
Energy
Investment
Post HRA Funding
Decent Homes
CESP/ECO
Revenue Funding
Capital Funding
Board
Tenants
Government
Councillors
Council Officers
New Build
Cladding Works
Content

Decent
Homes
Secure
Warm Modern
Crimee.g. burglaries
Healthe.g. respiratory
illness
Energy Efficiencye.g. SAP ratings
Fuel poverty
Healthe.g. accidents
Local employmente.g. Apprenticeships
Wellbeinge.g. place satisfaction
Social impact

NCC Housing Strategy
NCC Social Housing Stock AMS
NCH Board/PSComCouncil NCC ResidentNCH
Raw Housing
Data
Outline Policy Approach
Draft AMS
NCC Consultation
Draft AMS
Draft AMS
Resident Consultation
Options Appraisal
Stock/Funding gaps
Final Draft AMS NCC
ConsultationResident
Consultation
AMS Report and Approvals
Finalise Policy
Approach
Board Consultation
Board Consultation
Final AMS Report
Governance

Understanding the HRA Reform
Opportunities and Threats

HRA Reform Need to manage business via 30 year business
plan LA to keep all the rents. RTB rules stays the same. Keep all non RTB capital receipts. Rent convergence by 2015/2016 assumed
INCOME MUST SUPPORT OPERATIONALCOSTS AND FINANCE ALL INVESTMENT.

Key points
Introduced through the Localism Bill. Using 30 year business model to understand
viability of each local authority stock. Data used based on CLG prescribed
methodology. Housing Debt reallocated using Net Present
Value.

Investment Need v Financing Available - Long Term
0
10
20
30
40
50
60
70
80
90
1 2 3 4 5 6 7 8 9 10 11 12 13 14 15 16 17 18 19 20 21 22 23 24 25 26 27 28 29
£m
Investment need Financing available
(175m gap)

Repair Element 2011 2012 2013 2014 2015 Total Bathroom 9,722,995.65 659,724.77 500,977.48 689,997.40 759,383.69 12,333,078.99 Chimneys & Flashings 1,853,335.95 425,202.45 756,192.89 1,200,444.32 1,523,829.46 5,759,005.07 Communal Facilities 1,116,206.18 236,305.98 178,318.23 120,700.06 227,432.07 1,878,962.52 Doors 4,393,641.21 484,210.54 279,851.53 441,757.67 361,381.09 5,960,842.04 Electricals 5,352,356.11 1,033,026.21 265,484.33 598,849.74 914,234.16 8,163,950.55 Externals 15,570,192.66 1,769,365.97 1,897,021.39 5,998,712.72 4,861,750.21 30,097,042.95 Garages 478,374.42 27,302.79 100,440.24 208,887.05 264,340.31 1,079,344.81 Heating 9,823,245.29 1,981,641.77 796,956.86 1,457,087.09 5,249,953.71 19,308,884.72 Kitchen 21,154,305.31 1,305,076.07 2,327,190.14 1,774,141.36 2,782,559.15 29,343,272.03 Outbuildings 1,430,723.09 372,442.64 405,364.08 1,051,133.92 1,155,162.86 4,414,826.59 Plumbing 1,911,146.20 24,139.17 29,572.22 97,259.08 220,139.12 2,282,255.79 Roof 5,033,345.04 643,361.28 883,747.27 2,937,075.03 7,709,960.76 17,207,489.38 Safety & Security 12,158,822.65 4,426.39 3,185.12 55,818.62 16,977.94 12,239,230.72 Walls 13,352,275.07 484,753.36 525,876.52 4,103,735.04 3,044,835.79 21,511,475.78 Windows 5,213,260.01 111,545.20 6,933.31 5,842.28 16,939.57 5,354,520.37
Grand Total 108,564,224.84 9,562,524.59 8,957,111.61 20,741,441.38 29,108,879.89 176,934,182.31
Total elemental replacement costs can be reported by year over 10 or 30 year periods ( shown in red).

Repair Element 2011 2012 2013 2014 2015 Total Bathroom 2,466,615.80 2,466,615.80 2,466,615.80 2,466,615.80 2,466,615.80 12,333,078.99 Chimneys & Flashings 1,151,801.01 1,151,801.01 1,151,801.01 1,151,801.01 1,151,801.01 5,759,005.07 Communal Facilities 375,792.50 375,792.50 375,792.50 375,792.50 375,792.50 1,878,962.52 Doors 1,192,168.41 1,192,168.41 1,192,168.41 1,192,168.41 1,192,168.41 5,960,842.04 Electricals 1,632,790.11 1,632,790.11 1,632,790.11 1,632,790.11 1,632,790.11 8,163,950.55 Externals 6,019,408.59 6,019,408.59 6,019,408.59 6,019,408.59 6,019,408.59 30,097,042.95 Garages 215,868.96 215,868.96 215,868.96 215,868.96 215,868.96 1,079,344.81 Heating 3,861,776.94 3,861,776.94 3,861,776.94 3,861,776.94 3,861,776.94 19,308,884.72 Kitchen 5,868,654.41 5,868,654.41 5,868,654.41 5,868,654.41 5,868,654.41 29,343,272.03 Outbuildings 882,965.32 882,965.32 882,965.32 882,965.32 882,965.32 4,414,826.59 Plumbing 456,451.16 456,451.16 456,451.16 456,451.16 456,451.16 2,282,255.79 Roof 3,441,497.88 3,441,497.88 3,441,497.88 3,441,497.88 3,441,497.88 17,207,489.38 Safety & Security 2,447,846.14 2,447,846.14 2,447,846.14 2,447,846.14 2,447,846.14 12,239,230.72 Walls 4,302,295.16 4,302,295.16 4,302,295.16 4,302,295.16 4,302,295.16 21,511,475.78 Windows 1,070,904.07 1,070,904.07 1,070,904.07 1,070,904.07 1,070,904.07 5,354,520.37
Grand Total 35,386,836.46 35,386,836.46 35,386,836.46 35,386,836.46 35,386,836.46 176,934,182.31
These costs can then be smoothed (Red) over a period typically 5 years to produce a replacement programme to meet investment requirements which maintains the total investment cost (green).

Threats from HRA Self Financing
Resources to finance capital expenditure will largely be generated through rent income and HRA Capital Receipts.
Higher interest rate on Housing debt than applies under current rules
Vulnerability to interest rate changes going forward Increase in Working balance required to cope with
additional risks – risk assessment required Assumes rents increase at RPI + ½% + £2 up to 2015/16 Self Financing model assumes that rents increase at RPI
+ 0.5% after rent convergence will be achieved.
OpportunitiesReducing Poor & Costly Stock
Reduction in 1000 properties will reduce the level of opening HRA debt by £9.8m. Saving in running costs and future major
investment, of poorly performing properties. Option of saving in interest charges, or the
incurring of fresh borrowing to finance new capital expenditure.

Keystone Sustainability Model
Citywide By Estate 17/05/2011 Criteria Criteria
Net Present Value (NPV) Rental income less investment costs less management costs less maintenance costs all depreciated over 30 years
Stock Turnover Information for void homes over the last 5 years, used within the model to show average annual stock turnover for estate
Tenancy Duration Information in average weeks for homes occupied within an estate based on 5 year information
Housing Management Assessment Housing management assessment carried out based on scoring each estate on difficultly to manage
Neighbourhood Satisfaction Provided by the 09/10 Status Survey. Used to calculate desirablity of estates
Home Satisfaction Provided by the 09/10 Status Survey. Used to calculate desirablity of estates
Deprivation Assessment (National Rankings by Super Output Areas Census 2010)
Used as part of the diresirablity of estates calculation
SAP 2005 Score used within the overall sustainablity model
Overall Stock Performance Stock Performance score based on all info above execept NPV
Overall Assessment (NPV & Stock) Combines the stock and financial performance to give one score for comparision with other estates.
Score Value NPV Score Value SAP Score Value STOCK 9 10 <-12k 10 <=50 10
8 <-8k 9 8 >50 9 8 7 <-4k 7 6 >54 7 6
5 6 <1 5 4 >62 5 4 3 4 >1 3 2 >69 3 2 1 2 >8k 1 >81 1
Score Combined
Stock & NPV >32
>22<32
NCH NPV/Stock Performance Assessment

Stock Performance
• Stock Performance data on : • Stock Turnover - Northgate• Tenancy Duration - Northgate• Housing Management Assessment – Housing
Managers Scored – On the ground intelligence• Tenant Neighbourhood Satisfaction - Status• Tenant Home Satisfaction – VMS/Status• Income Deprivation Rankings (Census 2007)
NPV - Calculus
• NPV’s (Net Present Values) Calculated using:
• Rents • Void Costs • Property Investment Costs • Repairs & Maintenance Costs • Housing Management Costs• Keystone - Future modelling

Estate Properties NPV
Stock (Incl.
SAP 1-3)
Combined Stock & NPV
SAP (1-10)
Abbey Bridge 123 -2,582.41 12 20 5
Ainsley 37 -7,170.10 12 20 4
Arboretum 84 -2,731.48 17 21 8
Arboretum HIMOs 106 -13,475.02 17 25 8
Arboretum Sheltered Selhurst Court 29 1,794.70 12 16 3
Ashwell Gardens 43 660.40 12 16 5
Aspley 1,409 -2,673.88 13 21 6
Aspley Sheltered Keverne Clos 49 2,400.97 12 16 2
Austin Street 102 7,140.55 11 15 3
Bakersfield 150 4,217.30 11 15 7
Bakersfield Sheltered Woodview Court 25 10,395.37 10 14 3
Basford 313 1,393.10 11 15 5
Basford Sheltered Clover Green 36 5,927.32 11 15 4
Basford Sheltered Fenton Court 33 6,528.94 10 14 4
Basford Sheltered Kersall Court 40 4,947.99 12 16 2
Basford Sheltered Kibworth Close 36 -1,801.19 11 19 3
Basford Sheltered Rona Court 33 2,340.61 12 16 3
Beechdale 466 -2,711.97 13 21 5
Beechdale Bungalows 508 3,789.62 13 17 5
NCH NPV/Stock Performance Assessment

NCH Investment ApproachNPV Range by Estate Value
General Themes
-£12,000,000
-£10,000,000
-£8,000,000
-£6,000,000
-£4,000,000
-£2,000,000
£-
£2,000,000
£4,000,000
£6,000,000
£8,000,000
1 5 9 13 17 21 25 29 33 37 41 45 49 53 57 61 65 69 73 77 81 85 89 93 97 101
Individual Estates
£ Estate Values
High Tariff Stock;
Options Appraisal
Improvement Plan
Invest and optimise
Positive Value Stock
Negative Value Stock
Investment by Estate

NCH NPV/Stock Matrix

Neg
ativ
e
High
posi
tive
Low
Action
Review
Review
Maintain
Stock Performance
NPV
Arboretum
Cranwell
Lenton Flats
Kingsthorpe
Bilborough
Radford Clifford/High Hurst
Woodlands
xxxx
xxxx
xxxx
xxxx xxxx
xxxx
xxxx
xxxx
xxxx
xxxx
xxxx
xxxx
NCH NPV/Stock Matrix

Decommissioning proposal
Scheme No of props
NPV£m
Debt Reduction
Lenton High Rise 384 -4.407 -4.041
Highurst & Clifford 90 -1.211 -0.947
Cranwell Estate (part) 138 -3.070 -1.452
Meadows – Hobart/Pitcairn 79 -2.987 -0.831
Meadows – ‘q’ blocks 144 -2.220 -1.515
Stepney Court 29 -0.467 -0.305
Robin Hood Chase 10 -0.095 -0.105
Meadows – 2 x sheltered 61 0.401 -0.642
TOTAL 935 -14.056 -9.838

Continuous Asset Improvement -Summary• Tenant consultation on properties – 71%
in favour of demolition • Saves £23m on HRA – Opening debt and
reduced spending • Council agree to NCH building 500
properties from debt headroom and savings
• Better stock for our tenants

Thank You!