what makes a difference in achieving higher labor ... · what makes a difference in achieving...
TRANSCRIPT

Institute for Advanced Development Studies
Development Research Working Paper Series
No. 04/2005
What Makes a Difference in Achieving Higher Labor Productivity?
The Case of Low-Income Countries in Latin America
by:
Osvaldo Nina
December 2005 The views expressed in the Development Research Working Paper Series are those of the authors and do not necessarily reflect those of the Institute for Advanced Development Studies. Copyrights belong to the authors. Papers may be downloaded for personal use only.

WHAT MAKES A DIFFERENCE IN ACHIEVING
HIGHER LABOR PRODUCTIVITY? The Case of Low-Income Countries in Latin America*
by
Osvaldo Nina [email protected]
Grupo Integral La Paz – Bolivia
December 2005
Abstract:
This paper uses firm level surveys from Ecuador, Guatemala, Honduras and Nicaragua to estimate the determinants of labor productivity. This study started out with the hypothesis that the adverse external business conditions that firms in poor Latin American countries face, may be an important explication of the generally low levels of productivity. However, the empirical results, based on the survey of more than 1300 businesses, do not confirm this hypothesis. Compared to all the variables that are under the firms control, such as capital intensity, energy use, and worker skills, the external business environment (macroeconomic instability and labor regulations) has very little impact on productivity.
* This paper was financed by the Andean Development Corporation (CAF) through one of their annual research competitions. The author is grateful for the excellent research assistance provided by Ximena Flores and Stephanie Laffert and for the comments and suggestions received from Lykke Andersen.
1
1. INTRODUCTION
During the last few years, economists, business analysts, and policymakers have all
focused considerable attention on Latin American productivity growth because,
unfortunately, even after 15 years of market-oriented policies and reforms, productivity is
still not growing.
According to some studies, the evidence seems to indicate that insufficient education
may have played a role in the lack of productivity growth. However, other evidence
suggests that lack of capital investment has limited the growth in productivity. Still other
authors have suggested that the low quality of the microeconomic business environment has
been holding back the productivity. Certainly, there is no consensus about what factors
could be limiting the growth of productivity in the region.
Considering that productivity varies enormously around the region, the objective of
the present study is to analyze the role played by external factors on labor productivity in
low-income Latin American countries: Ecuador, Guatemala, Honduras and Nicaragua.
Since labor productivity is the output per hour worked and we are interested in the role
played by external factors, the other input factors are treated as causal factors at the
production process level (capital intensity, vintage and technology).
Since this study is interested in fostering productivity in the manufacturing sectors in
low-income countries in Latin America, the main objective is to know what makes a
difference in achieving higher labor productivity and, equally importantly, what does not.
This includes determining what factors of the microeconomic business environment can
best explain the labor productivity difference. These factors may affect and/or work
through market conditions (demand factors, relative input prices/factor availability and
other industries); policy and regulation (import barriers, competition and concentration
roles, state ownership, labor roles, unionism, and other types of regulation); and corruption
and governance.

2
The paper has five main sections following this introduction. The first provides a brief
overview of the relationship between labor productivity and the quality of the
microeconomic business environment. Section III presents a descriptive analysis of
manufacturing labor productivity, firm characteristics and microeconomic business
constraints. Section IV presents the results of the labor productivity decomposition analyses
based on regression. Section V concludes, discussing some possible policy implications.
2. FOSTERING LABOR PRODUCTIVITY: THE QUALITY OF THE MICROECONOMIC BUSINESS ENVIRONMENTS
The poor economic performance of the market-oriented reforms in Latin America
shows that sound macroeconomics policies and a stable political and legal context, while
necessary to ensure a prosperous economy, are not sufficient. Recently, several studies
have been finding that economic growth, productivity and competitiveness also depend on
improving the microeconomic foundations. For example, the paper by Cole, Ohanian,
Riascos and Schmitz (2004) evaluate why Latin America has not replicated Western
economic success and find that this failure is primarily due to TFP that is not accounted for
by human capital differences, but rather reflects inefficient production: Latin America has
many more international and domestic competitive barriers than do Western and successful
East Asian countries.
According to Batos and Nasir (2004), the persistence of productivity differences
among countries can be largely explained by differences in the investment climate and by
microeconomic environments: the policy, institutional, and regulatory environment in
which businesses must operate. These findings suggest that progress in the quality of
microeconomic business environment should yield real improvements in enterprise
performance and immediate productivity in Latin America, especially by creating the right
incentives (Easterly, 2001), promoting competition, and protecting consumer rights (Lewis,
2004).

3
3. MANUFACTURING LABOR PRODUCTIVITY
3.1. The Data
The data used in this study is from the Investment Climate Surveys carried out by the
World Bank Group during 2000-2003. These surveys report on the investment climate and
economic decisions of more than 14,000 firms in over 30 countries. The sampling frame
was constructed to be broadly representative of enterprises within each country in terms of
sector, size and geographic location. The countries used for this study are: Ecuador (2003),
Guatemala (2003), Honduras (2003) and Nicaragua (2003). These are the only poor Latin
American countries for which there are comparable data. Bolivia and Peru were excluded
because many questions in the questionnaire were different, and because there were too
many missing observations.
The main variables available from the survey at the establishment level are the
following: general information about the firm; sales and supplies; investment climate
constraints; infrastructure and services; financing; labor relations; business-government
relations; capacity, innovation, and learning; and productivity information. Table 1 presents
the differences between manufacturing sector structure of the countries used for this study.
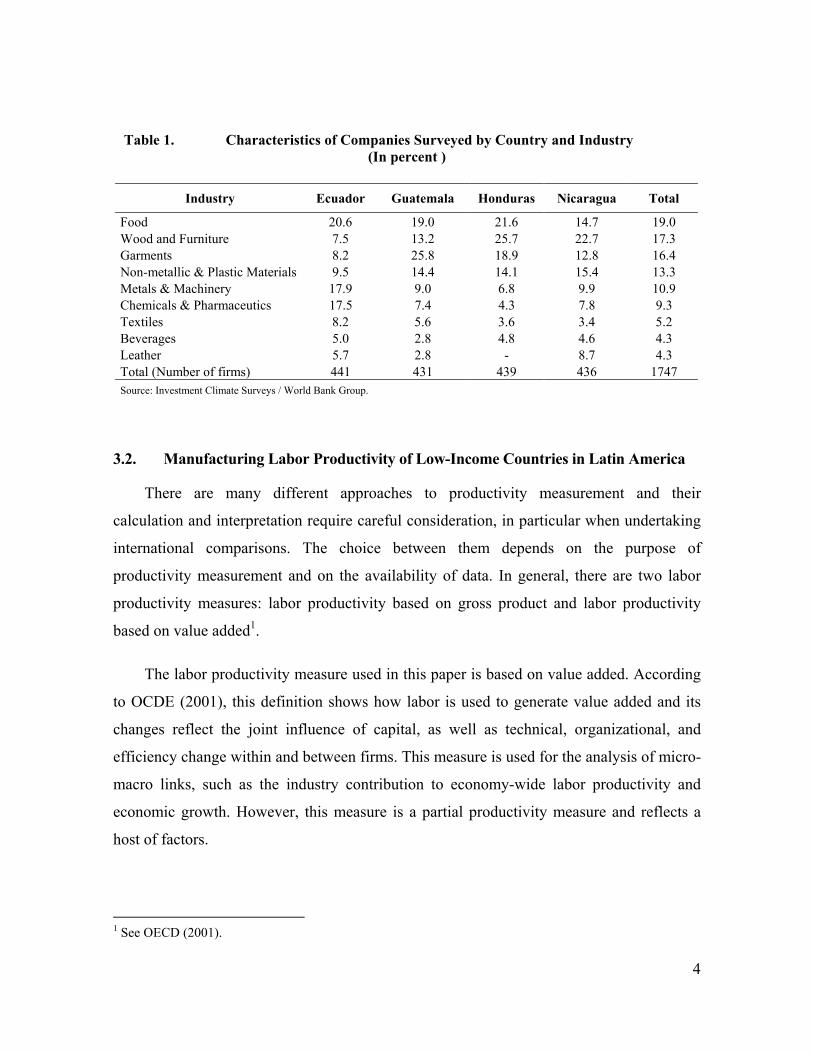
In general, the main industries are food, wood and furniture and garments. In Ecuador, most
firms belong to the food industry, whereas, in Guatemala, most firms are concentrated in
the garments industry. In Honduras and Nicaragua, most of the firms surveyed were from
the wood and furniture industry.
4
Table 1. Characteristics of Companies Surveyed by Country and Industry
(In percent )
Industry Ecuador Guatemala Honduras Nicaragua Total
Food 20.6 19.0 21.6 14.7 19.0 Wood and Furniture 7.5 13.2 25.7 22.7 17.3 Garments 8.2 25.8 18.9 12.8 16.4 Non-metallic & Plastic Materials 9.5 14.4 14.1 15.4 13.3 Metals & Machinery 17.9 9.0 6.8 9.9 10.9 Chemicals & Pharmaceutics 17.5 7.4 4.3 7.8 9.3 Textiles 8.2 5.6 3.6 3.4 5.2 Beverages 5.0 2.8 4.8 4.6 4.3 Leather 5.7 2.8 - 8.7 4.3 Total (Number of firms) 441 431 439 436 1747 Source: Investment Climate Surveys / World Bank Group.
3.2. Manufacturing Labor Productivity of Low-Income Countries in Latin America
There are many different approaches to productivity measurement and their
calculation and interpretation require careful consideration, in particular when undertaking
international comparisons. The choice between them depends on the purpose of
productivity measurement and on the availability of data. In general, there are two labor
productivity measures: labor productivity based on gross product and labor productivity
based on value added1.
The labor productivity measure used in this paper is based on value added. According
to OCDE (2001), this definition shows how labor is used to generate value added and its
changes reflect the joint influence of capital, as well as technical, organizational, and
efficiency change within and between firms. This measure is used for the analysis of micro-
macro links, such as the industry contribution to economy-wide labor productivity and
economic growth. However, this measure is a partial productivity measure and reflects a
host of factors.
1 See OECD (2001).
5
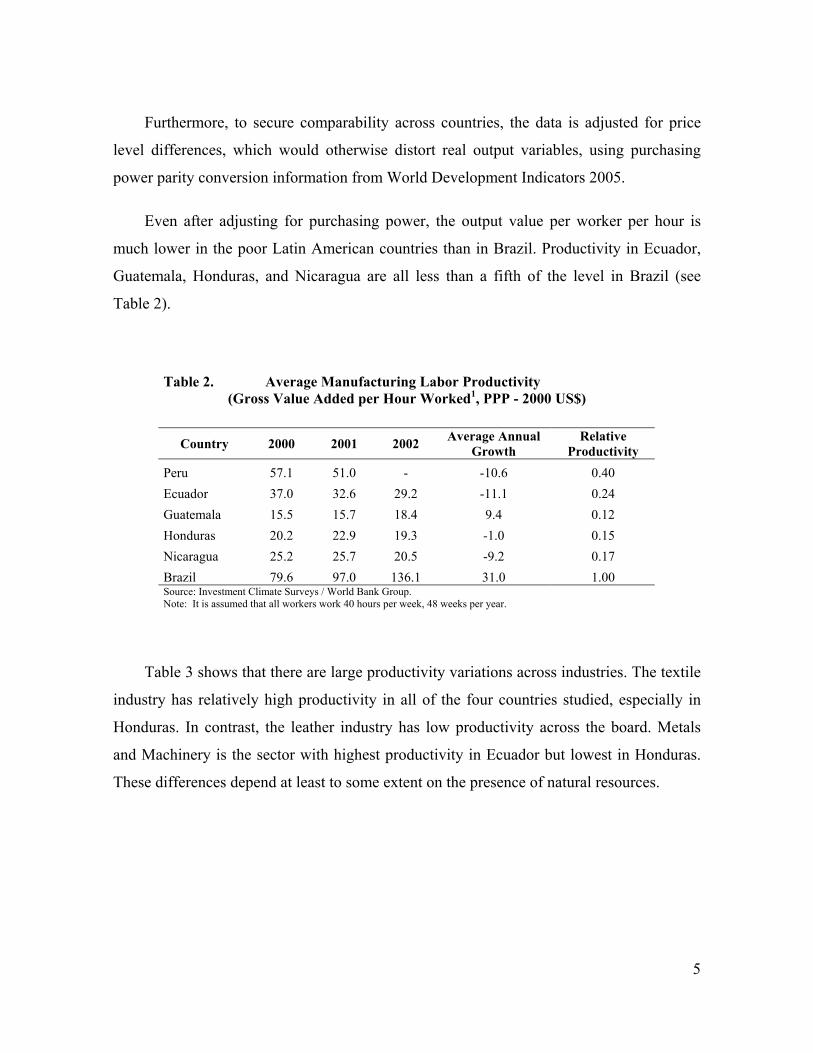
Furthermore, to secure comparability across countries, the data is adjusted for price
level differences, which would otherwise distort real output variables, using purchasing
power parity conversion information from World Development Indicators 2005.
Even after adjusting for purchasing power, the output value per worker per hour is
much lower in the poor Latin American countries than in Brazil. Productivity in Ecuador,
Guatemala, Honduras, and Nicaragua are all less than a fifth of the level in Brazil (see
Table 2).
Table 2. Average Manufacturing Labor Productivity (Gross Value Added per Hour Worked1, PPP - 2000 US$)
Country 2000 2001 2002 Average Annual
Growth Relative
Productivity Peru 57.1 51.0 - -10.6 0.40 Ecuador 37.0 32.6 29.2 -11.1 0.24 Guatemala 15.5 15.7 18.4 9.4 0.12 Honduras 20.2 22.9 19.3 -1.0 0.15 Nicaragua 25.2 25.7 20.5 -9.2 0.17 Brazil 79.6 97.0 136.1 31.0 1.00 Source: Investment Climate Surveys / World Bank Group. Note: It is assumed that all workers work 40 hours per week, 48 weeks per year.
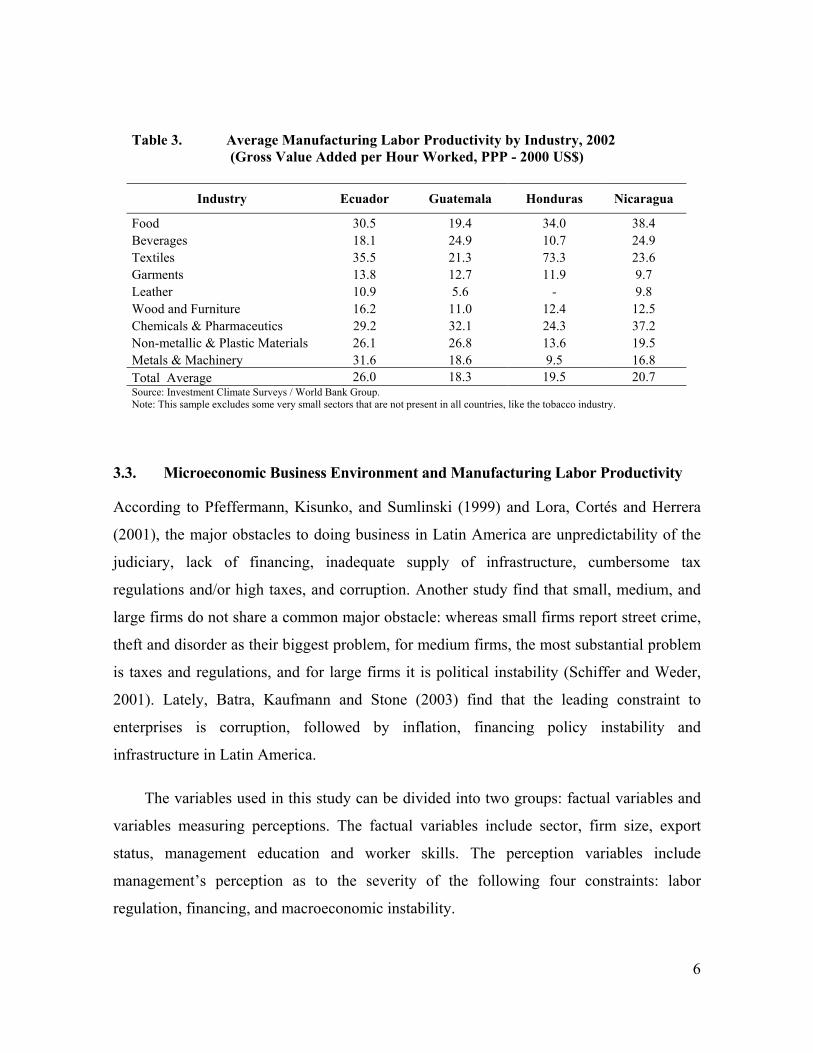
Table 3 shows that there are large productivity variations across industries. The textile
industry has relatively high productivity in all of the four countries studied, especially in
Honduras. In contrast, the leather industry has low productivity across the board. Metals
and Machinery is the sector with highest productivity in Ecuador but lowest in Honduras.
These differences depend at least to some extent on the presence of natural resources.
6
Table 3. Average Manufacturing Labor Productivity by Industry, 2002
(Gross Value Added per Hour Worked, PPP - 2000 US$)
Industry Ecuador Guatemala Honduras Nicaragua
Food 30.5 19.4 34.0 38.4 Beverages 18.1 24.9 10.7 24.9 Textiles 35.5 21.3 73.3 23.6 Garments 13.8 12.7 11.9 9.7 Leather 10.9 5.6 - 9.8 Wood and Furniture 16.2 11.0 12.4 12.5 Chemicals & Pharmaceutics 29.2 32.1 24.3 37.2 Non-metallic & Plastic Materials 26.1 26.8 13.6 19.5 Metals & Machinery 31.6 18.6 9.5 16.8 Total Average 26.0 18.3 19.5 20.7 Source: Investment Climate Surveys / World Bank Group. Note: This sample excludes some very small sectors that are not present in all countries, like the tobacco industry.
3.3. Microeconomic Business Environment and Manufacturing Labor Productivity
According to Pfeffermann, Kisunko, and Sumlinski (1999) and Lora, Cortés and Herrera
(2001), the major obstacles to doing business in Latin America are unpredictability of the
judiciary, lack of financing, inadequate supply of infrastructure, cumbersome tax
regulations and/or high taxes, and corruption. Another study find that small, medium, and
large firms do not share a common major obstacle: whereas small firms report street crime,
theft and disorder as their biggest problem, for medium firms, the most substantial problem
is taxes and regulations, and for large firms it is political instability (Schiffer and Weder,
2001). Lately, Batra, Kaufmann and Stone (2003) find that the leading constraint to
enterprises is corruption, followed by inflation, financing policy instability and
infrastructure in Latin America.
The variables used in this study can be divided into two groups: factual variables and
variables measuring perceptions. The factual variables include sector, firm size, export
status, management education and worker skills. The perception variables include
management’s perception as to the severity of the following four constraints: labor
regulation, financing, and macroeconomic instability.

7
Firm Characteristics
Table 4 shows the difference in labor productivity by size of firm. On average, the large
firms are the most productive and the microenterprises the least. In particular, large firms
are 3.2 times more productive than microenterprises, 1.8 times more than small firms and
only 0.6 times more than medium firms. However, there are differences across countries.
For instance, medium sized firms have higher labor productivity than large firms in
Honduras and the small firms are more productive than medium sized firms in Ecuador and
Guatemala.
Table 4. Manufacturing Labor Productivity by Size of Firm1
(Gross Value Added per Hour Worked)
Size of Firm Ecuador Guatemala Honduras Nicaragua Total
Labor Productivity (Average, PPP, 2000 US$) Micro 16.4 9.3 8.2 11.9 10.9 Small 23.6 21.0 13.2 17.0 18.7 Medium 18.6 17.9 34.0 22.3 22.1 Large 38.5 24.0 29.9 57.4 34.4 Total Average 26.0 18.3 19.5 20.7 21.0 Composition (% of firms) Micro 15.2 24.9 30.1 38.8 27.8 Small 26.4 29.4 27.1 32.6 29.1 Medium 26.4 18.1 16.4 16.7 19.2 Large 32.0 27.6 26.4 12.0 23.9 Total Firms 303 381 292 384 1360 Source: Investment Climate Surveys / World Bank Group. Note: 1 Definition by number of employees: Micro (Up to 10); Small (Up to 25); Medium (Up to 60); and Large (Over 60).
In general, the low-income countries presents low labor productivity because more
than half percent of the enterprises are small and micro firms. This situation is more intense
in Nicaragua and Honduras than Guatemala and Ecuador.
On the other hand, there are studies which suggest that export oriented firms are more
productive because they operate in more competitive industries. According to Table 5, the

8
exporting firms are indeed 1.7 times more labor productive than non-exporting firms. In
terms of composition, these firms only represent 31% of the total.
Table 5. Manufacturing Labor Productivity by Exporter
(Gross Value Added per Hour Worked)
Exporter Ecuador Guatemala Honduras Nicaragua Total
Labor Productivity (Average, PPP, 2000 US$) No Export 21.8 14.4 12.6 18.6 17.1 Export 36.4 24.8 33.5 27.5 29.8 Total Average 26.0 18.3 19.5 20.7 21.0 Composition (% of firms) No Export 71.6 62.2 67.1 76.3 69.3 Export 28.4 37.8 32.9 23.7 30.7 Total Firms 303 381 292 384 1360 Source: Investment Climate Surveys / World Bank Group.
Considering both variables simultaneously, we generally find that the most productive
firms are the large exporting firms. For example, 68 percent of large firms export. In
contrast, the less productive firms are non-exporting microenterprises. In consequence,
productivity enhancing policies might focus on helping small and micro enterprises gain
access to export markets.
Human Resources
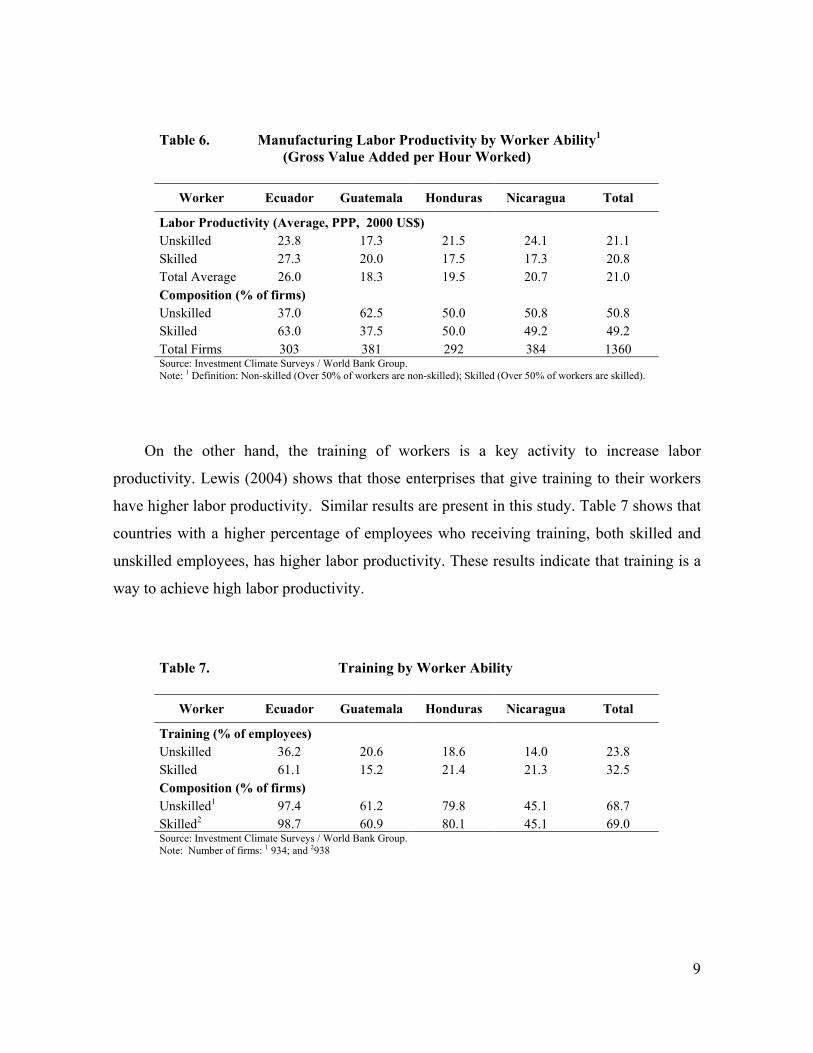
According to Table 6, on average there is no significant difference in labor productivity
between the mostly skilled and the mostly unskilled firms in low-income countries. The
non-skill firms are only two percent more labor productive than skill firms. Indeed, in
Honduras and Nicaragua, the firms employing mainly unskilled labor have higher labor
productivity than those that employ mainly skilled labor.
9
Table 6. Manufacturing Labor Productivity by Worker Ability1
(Gross Value Added per Hour Worked)
Worker Ecuador Guatemala Honduras Nicaragua Total
Labor Productivity (Average, PPP, 2000 US$) Unskilled 23.8 17.3 21.5 24.1 21.1 Skilled 27.3 20.0 17.5 17.3 20.8 Total Average 26.0 18.3 19.5 20.7 21.0 Composition (% of firms) Unskilled 37.0 62.5 50.0 50.8 50.8 Skilled 63.0 37.5 50.0 49.2 49.2 Total Firms 303 381 292 384 1360 Source: Investment Climate Surveys / World Bank Group. Note: 1 Definition: Non-skilled (Over 50% of workers are non-skilled); Skilled (Over 50% of workers are skilled).
On the other hand, the training of workers is a key activity to increase labor
productivity. Lewis (2004) shows that those enterprises that give training to their workers
have higher labor productivity. Similar results are present in this study. Table 7 shows that
countries with a higher percentage of employees who receiving training, both skilled and
unskilled employees, has higher labor productivity. These results indicate that training is a
way to achieve high labor productivity.
Table 7. Training by Worker Ability
Worker Ecuador Guatemala Honduras Nicaragua Total
Training (% of employees) Unskilled 36.2 20.6 18.6 14.0 23.8 Skilled 61.1 15.2 21.4 21.3 32.5 Composition (% of firms) Unskilled1 97.4 61.2 79.8 45.1 68.7 Skilled2 98.7 60.9 80.1 45.1 69.0 Source: Investment Climate Surveys / World Bank Group. Note: Number of firms: 1 934; and 2938

10
The education of managers is also a key to explain productivity at the firm level.
Table 8 shows that the education level of the top manager has a strong impact on average
labor productivity in the firm. The most significant differences are present when comparing
the firms with graduate and postgraduate manager with the rest; the difference is more than
80 percent.
Table 8. Manufacturing Labor Productivity by Education of Manager
(Gross Value Added per Hour Worked)
Education Level Ecuador Guatemala Honduras Nicaragua Total
Labor Productivity (Average, PPP, 2000 US$) Primary 9.9 9.1 5.9 9.6 8.5 Secondary 12.9 15.8 12.9 11.3 13.3 Vocational 17.0 9.6 8.5 12.2 11.3 University Training 23.2 11.1 10.5 9.7 12.3 Graduate 23.5 19.3 24.9 22.2 22.5 Postgraduate 35.8 33.9 38.1 41.6 37.4 Total Average 26.1 18.3 19.5 20.7 21.0 Composition (% of firms) Primary 1.3 9.2 14.7 20.8 11.9 Secondary 2.7 8.7 13.4 8.6 8.3 Vocational 4.3 7.6 5.8 8.1 6.6 University Training 7.6 19.4 12.0 9.9 12.5 Graduate 56.5 37.3 41.4 31.3 40.7 Postgraduate 27.6 17.8 12.7 21.4 19.9 Total Firms 301 381 292 384 1358 Source: Investment Climate Surveys / World Bank Group.
In general, education and training are very important variables to explain the labor
productivity. The skilled and unskilled workers appear to have similar contributions to
labor productivity in the production process, but training activities make a difference. The
most important impact, however, seem to arise from the education of the top manager, who
is responsible for the introduction of new technology and modern management techniques.

11
Labor Regulations
Labor regulation is another factor that may potentially affect labor productivity. However,
according to Table 9, which presents the responses to the question: “Please tell if labor
regulations are a problem for the operations and growth of your business,” this does not
seem to be the case for our four countries. The majority of firms responded that labor
regulations are only a minor obstacle, and productivity does not seem to differ depending
on the answer.
Table 9. Manufacturing Labor Productivity by Labor Regulations (Gross Value Added per Hour Worked)
Obstacle Ecuador Guatemala Honduras Nicaragua Total
Labor Productivity (Average, PPP, 2000 US$) Minor1 26.1 20.1 14.5 19.1 20.1 Moderate 23.3 18.1 27.7 33.4 24.2 Major2 27.2 12.7 33.0 23.0 22.3 Total Average 26.0 18.3 19.5 20.8 21.0 Composition (% of firms) Minor 77.9 60.1 67.8 83.8 72.4 Moderate 9.9 22.3 17.8 10.2 15.2 Major 12.2 17.6 14.4 6.0 12.4 Total Firms 303 381 292 383 1359 Source: Investment Climate Surveys / World Bank Group. Note: 1Include the scale no obstacle and minor obstacle; 2 Include the scale major obstacle and very severe obstacle
According to another question in the survey, the optimal level of employment is
generally lower than the current level, mainly because labor regulations makes it very
expensive to lay off excess workers.
Competition
According to the economic literature, competition is one of the main factors explaining
labor productivity. Presumably, if a firm has a market share of more than 90%, it is a
monopoly, and thus experiences little competition. If it has a market share between 40 and
12
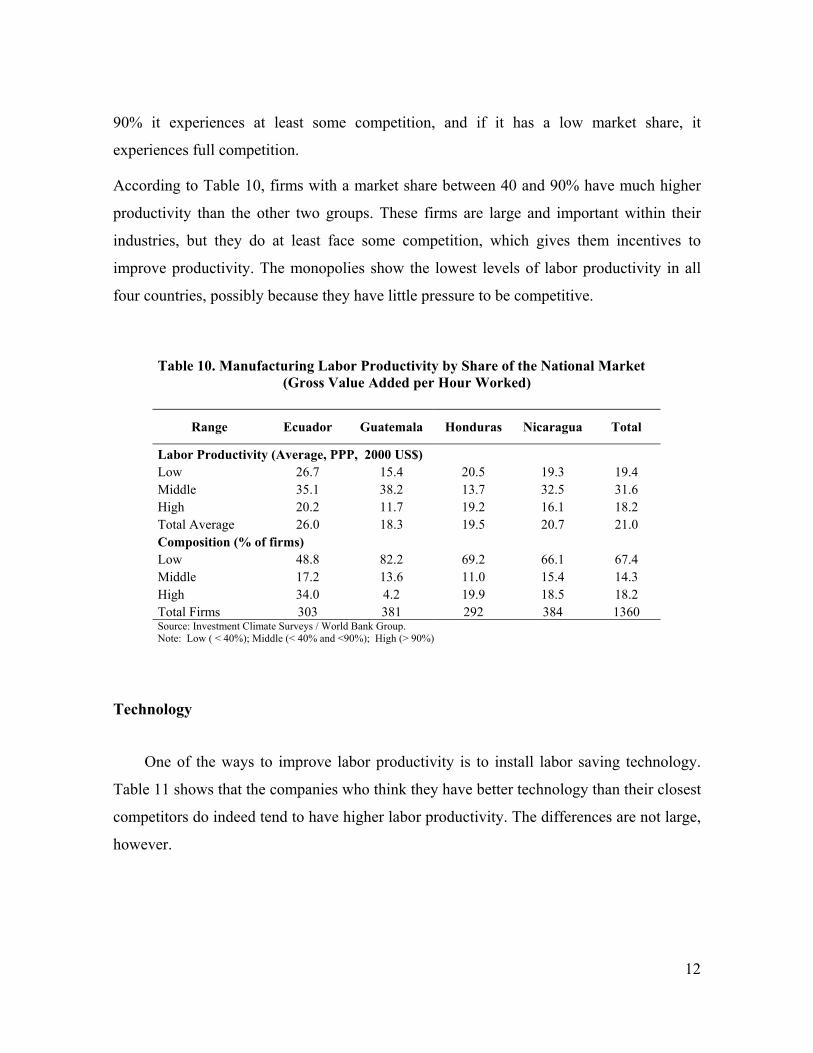
90% it experiences at least some competition, and if it has a low market share, it
experiences full competition.
According to Table 10, firms with a market share between 40 and 90% have much higher
productivity than the other two groups. These firms are large and important within their
industries, but they do at least face some competition, which gives them incentives to
improve productivity. The monopolies show the lowest levels of labor productivity in all
four countries, possibly because they have little pressure to be competitive.
Table 10. Manufacturing Labor Productivity by Share of the National Market (Gross Value Added per Hour Worked)
Range Ecuador Guatemala Honduras Nicaragua Total
Labor Productivity (Average, PPP, 2000 US$) Low 26.7 15.4 20.5 19.3 19.4 Middle 35.1 38.2 13.7 32.5 31.6 High 20.2 11.7 19.2 16.1 18.2 Total Average 26.0 18.3 19.5 20.7 21.0 Composition (% of firms) Low 48.8 82.2 69.2 66.1 67.4 Middle 17.2 13.6 11.0 15.4 14.3 High 34.0 4.2 19.9 18.5 18.2 Total Firms 303 381 292 384 1360 Source: Investment Climate Surveys / World Bank Group. Note: Low ( < 40%); Middle (< 40% and <90%); High (> 90%)
Technology
One of the ways to improve labor productivity is to install labor saving technology.
Table 11 shows that the companies who think they have better technology than their closest
competitors do indeed tend to have higher labor productivity. The differences are not large,
however.

13
In general, approximately half of the firms believe their technology is about the same
as the competition, one quarter that it is less advanced, and one quarter that it is more
advanced.
Table 11. Manufacturing Labor Productivity by Technology1 (Gross Value Added per Hour Worked)
Technology Ecuador Guatemala Honduras Nicaragua Total
Labor Productivity (Average, PPP, 2000 US$) Less advanced 23.7 18.2 14.4 23.9 20.3 About the same 24.5 17.6 21.1 18.0 20.0 More advanced 32.4 20.5 19.8 25.1 24.0 Total Average 25.9 18.4 19.5 21.1 21.0 Composition (% of firms) Less advanced 26.0 28.4 17.9 19.1 23.0 About the same 53.0 51.8 50.9 53.2 52.3 More advanced 20.9 19.7 31.3 27.7 24.7 Total Firms 296 380 291 376 1343 Source: Investment Climate Surveys / World Bank Group. Note: 1The production process compared with the closest competitor.
Financing Constraints
There are several studies that show that financing constitutes a bottleneck for many
firms in low-income countries. According to Batra, Kaufman and Stone (2003), in Latin
America, more than 60 percent of firms identified financing to be a major constraint for the
operation and growth of business. Table 12 shows similar results, around 50 percent of the
firms identified access to financing as a major constraint.

14
Table 12. Manufacturing Labor Productivity by Access to Financing
(Gross Value Added per Hour Worked)
Obstacle Ecuador Guatemala Honduras Nicaragua Total
Labor Productivity (Average, PPP, 2000 US$) Minor1 28.0 21.4 23.9 20.1 23.3 Moderate 25.8 12.3 27.8 26.7 21.5 Major2 23.6 16.9 14.9 19.6 18.6 Total Average 26.0 18.3 19.1 20.7 20.9 Composition (% of firms) Minor 49.8 49.1 32.5 30.7 40.5 Moderate 8.6 16.0 9.7 13.8 12.4 Major 41.6 34.9 57.8 55.5 47.1 Total Firms 303 381 289 384 1357 Source: Investment Climate Surveys / World Bank Group. Note: 1Include the scale no obstacle and minor obstacle; 2 Include the scale major obstacle and very severe obstacle
On average, the firms that identified access to financing as minor and moderate
obstacle are the more productive. This may suggest a virtuous circle, where access to
financing allows the introduction of better technology, which improves productivity, which
in turn improves the access to financing.
Table 13, relating financing costs to productivity, shows the same picture. The firms
who say that financing constraints are a minor problem have higher productivity than firms
who have major financing constraints. Still, the differences are not large. And still, more
than half of the firms interviewed face major financing constraints.

15
Table 13. Manufacturing Labor Productivity by Cost of Financing
(Gross Value Added per Hour Worked)
Obstacle Ecuador Guatemala Honduras Nicaragua Total
Labor Productivity (Average, PPP, 2000 US$) Minor1 30.7 21.3 26.4 18.6 23.7 Moderate 25.2 21.3 23.9 20.2 22.2 Major2 23.2 14.4 15.4 21.8 18.9 Total Average 26.0 18.3 19.1 20.7 20.9 Composition (% of firms) Minor 34.0 44.1 25.6 26.1 32.8 Moderate 9.2 12.9 10.4 12.3 11.4 Major 56.8 43.0 64.0 61.6 55.8 Total Firms 303 381 289 383 1356 Source: Investment Climate Surveys / World Bank Group. Note: 1Include the scale no obstacle and minor obstacle; 2 Include the scale major obstacle and very severe obstacle
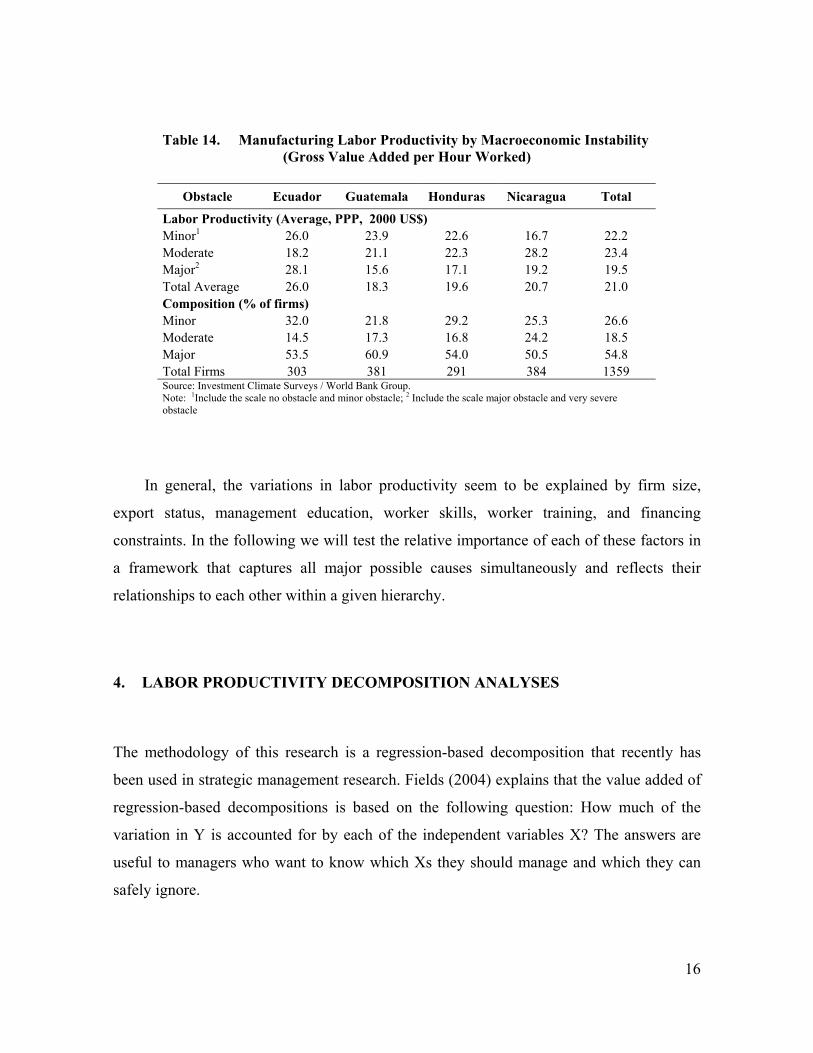
Macroeconomic Instability
Recently, several studies showed that the macroeconomic instability is a main
economic constraint to business. According to Table 14, more than half of the firms in all
four countries identified macroeconomic instability as a major obstacle to business. The
perception about the importance of macroeconomic instability does not seem to be related
to labor productivity, however.
16
Table 14. Manufacturing Labor Productivity by Macroeconomic Instability
(Gross Value Added per Hour Worked)
Obstacle Ecuador Guatemala Honduras Nicaragua Total
Labor Productivity (Average, PPP, 2000 US$) Minor1 26.0 23.9 22.6 16.7 22.2 Moderate 18.2 21.1 22.3 28.2 23.4 Major2 28.1 15.6 17.1 19.2 19.5 Total Average 26.0 18.3 19.6 20.7 21.0 Composition (% of firms) Minor 32.0 21.8 29.2 25.3 26.6 Moderate 14.5 17.3 16.8 24.2 18.5 Major 53.5 60.9 54.0 50.5 54.8 Total Firms 303 381 291 384 1359 Source: Investment Climate Surveys / World Bank Group. Note: 1Include the scale no obstacle and minor obstacle; 2 Include the scale major obstacle and very severe obstacle
In general, the variations in labor productivity seem to be explained by firm size,
export status, management education, worker skills, worker training, and financing
constraints. In the following we will test the relative importance of each of these factors in
a framework that captures all major possible causes simultaneously and reflects their
relationships to each other within a given hierarchy.
4. LABOR PRODUCTIVITY DECOMPOSITION ANALYSES
The methodology of this research is a regression-based decomposition that recently has
been used in strategic management research. Fields (2004) explains that the value added of
regression-based decompositions is based on the following question: How much of the
variation in Y is accounted for by each of the independent variables X? The answers are
useful to managers who want to know which Xs they should manage and which they can
safely ignore.

17
In general, the methodology uses a multivariate decomposition model and the weights
from the decomposition are constructed to sum to the total percentage of variance explained
( 2R ). These weights, derived axiomatically, are given by the following formula:
kY
kk
kkk YXcor
YVarYX
s βσσβ
),()(
),cov(== (1)
where ks is the share of variation in the dependent variable attributed to the k’th explanatory variable, kβ is that variable’s regression coefficient, kσ is the standard deviation of the k’th explanatory variable, ),( YXcor k is the correlation between the k’th explanatory variable and the dependent variable Y, and Yσ is the standard deviation of the dependent variable. The normalized weights kp are obtained by dividing each ks by 2R , so that each weight is expressed as a fraction of the total percentage of variance explained and the weights sum to 100%:
2Rsp k
k = (2)
Table 15 presents the outcome of several estimations and the weights given in
Equation 1. The control variables are: country dummies, industry dummies and energy and
capital2. These variables are all very important to explain labor productivity.
In general, the regression results confirm all the partial correlations that we found in
the previous section. The negative coefficients on the three country dummies indicate that
the productivity levels in Guatemala, Honduras, and Nicaragua are smaller than in Ecuador
(the excluded category). This is also what we saw in Table 3.
The significantly positive coefficients on the four sectors: Food, Chemicals &
Pharmaceutics, Non-metallic and Plastics, and Metals and Machinery indicates that
productivity is generally higher in these sectors compared to the remaining sectors, when
controlling for other factors.
Medium and Large firms were found to have higher productivity than small firms, as
expected, and the same was found for exporting firms compared to non-exporting firms. In
addition, the manager’s education level was found to have a significantly positive effect on 2 The consumption of energy includes
18
productivity. When controlling for other factors, workers skill level was also found to be
significantly positive.
Two control variables, that have not been discussed above, also proved to be very
important for productivity. One is capital intensity (capital stock per hour worked) and the
other is energy intensity (energy expenditure per hour worked). Both have a strong positive
effect on labor productivity.
The variables measuring perception also yielded the expected results. Labor
regulations and macroeconomic instability both have a significantly adverse effect on labor
productivity, while the effect of financing constraints was found to be insignificant.

19
Table 14. Dependent variable: Labor Productivity in each firm1
Model 1 Model 2 Model 3 Model 4 Variable
kβ ks kβ ks kβ ks kβ ks
0.513 ** 0.667 * 0.670 * 0.700 * Constant (0.234) (0.199) (0.199) (0.199) 1.034 * -0.027 1.047 * -0.027 1.010 * -0.026 1.056 * -0.028Guatemala
(0.236) (0.236) (0.238) (0.240) 1.021 * -0.030 1.034 * -0.030 1.002 * -0.029 1.013 * -0.030Honduras
(0.244) (0.245) (0.246) (0.249) 1.256 * 0.011 1.255 * 0.011 1.228 * 0.011 1.250 * 0.011 Nicaragua
(0.220) (0.220) (0.222) (0.224) 0.256 ** 0.006 0.265 ** 0.006 0.288 ** 0.007 0.294 * 0.007 Food
(0.108) (0.108) (0.109) (0.109) 0.538 * 0.013 0.554 * 0.014 0.563 * 0.014 0.574 * 0.014 Chemical &
Pharmaceutics (0.138) (0.138) (0.138) (0.138) 0.200 ** 0.003 0.207 ** 0.003 0.219 ** 0.003 0.221 ** 0.003 Non-metallic &
Plastic Materials (0.097) (0.096) (0.096) (0.097) 0.327 0.004 0.337 * 0.004 0.354 * 0.004 0.359 * 0.004 Metals &
Machines (0.092) (0.093) (0.093) (0.093) 0.247 * 0.006 0.249 * 0.006 0.218 ** 0.006 0.214 ** 0.006 Medium Firm
(0.090) (0.090) (0.093) (0.093) 0.265 ** 0.012 0.277 ** 0.013 0.198 ** 0.009 0.184 *** 0.008 Large Firm
(0.112) (0.110) (0.120) (0.120) 0.210 * 0.085 0.211 * 0.085 0.212 * 0.086 0.218 * 0.089 ln(Capital2)
(0.030) (0.030) (0.030) (0.030) 0.221 * 0.159 0.221 * 0.159 0.219 * 0.157 0.224 * 0.162 ln(Energy3)
(0.031) (0.031) (0.031) (0.031) 0.050 ** 0.014 0.047 ** 0.014 0.044 ** 0.013 0.042 ** 0.012 Manager
Education (0.025) (0.024) (0.024) (0.024) 0.432 ** 0.002 0.447 ** 0.002 0.449 ** 0.002 0.436 ** 0.002 Worker
Ability (0.203) (0.208) (0.206) (0.209) 0.075 *** 0.001 Worker
Education (0.047) -0.064 ** 0.002 -0.064 ** 0.002 -0.058 *** 0.002 Labor
Regulations (0.034) (0.034) (0.035) 0.152 ** 0.005 0.147 *** 0.005 Exporter (0.091) (0.091) 0.037 -0.001Financing
Access (0.040) -0.073 ** 0.002 Macroeconomic
Instability (0.043) R2 0.259 0.260 0.262 0.268 Observations 1189 1189 1189 1185 Note: 1In natural logarithm; 2Machinery and Equipment per hour worked; 3 Consumption of Energy per hour worked. Significant at: 1%, (*); 5% (**) and 12% (***).
20
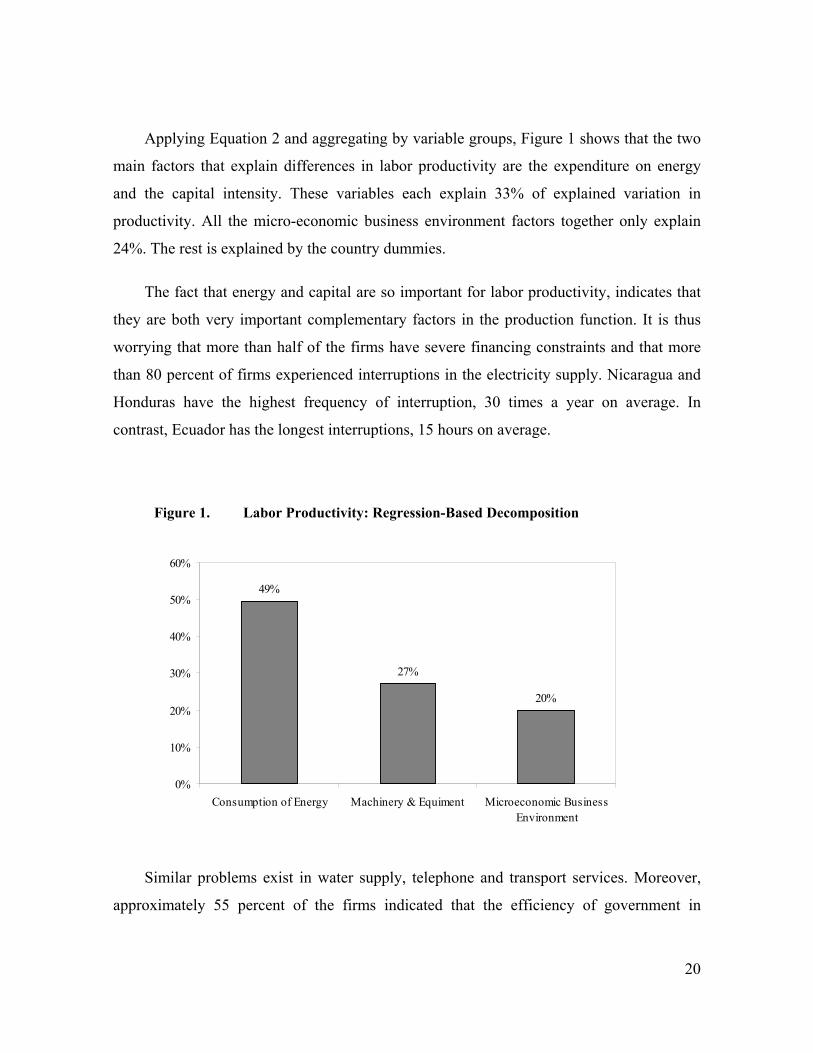
Applying Equation 2 and aggregating by variable groups, Figure 1 shows that the two
main factors that explain differences in labor productivity are the expenditure on energy
and the capital intensity. These variables each explain 33% of explained variation in
productivity. All the micro-economic business environment factors together only explain
24%. The rest is explained by the country dummies.
The fact that energy and capital are so important for labor productivity, indicates that
they are both very important complementary factors in the production function. It is thus
worrying that more than half of the firms have severe financing constraints and that more
than 80 percent of firms experienced interruptions in the electricity supply. Nicaragua and
Honduras have the highest frequency of interruption, 30 times a year on average. In
contrast, Ecuador has the longest interruptions, 15 hours on average.
Similar problems exist in water supply, telephone and transport services. Moreover,
approximately 55 percent of the firms indicated that the efficiency of government in
Figure 1. Labor Productivity: Regression-Based Decomposition
49%
27%
20%
0%
10%
20%
30%
40%
50%
60%
Consumption of Energy Machinery & Equiment Microeconomic BusinessEnvironment

21
delivering services, such as public utilities, public transportation, security, is very
inefficient or inefficient. Therefore, improving the delivery of services could improve the
labor productivity in the short run.
Some studies found that the quality of microeconomic business environment should
yield real improvements in enterprise performance and immediate productivity in Latin
America. However, Figure 1 shows that its share is the lowest in explaining the labor
productivity differences in low-income countries of the region.
Taking into account the individual components included in the microeconomic
business environment, Figure 2 shows that labor productivity differences are mainly due to
the firm’s characteristics: industry, manager’s education, training, size and export
orientation. Only 5% is explained by external factors, such as macroeconomic instability
and labor regulations.
Figure 2. Microeconomic Determinants: Regression-Based Decomposition
8%
21%22%
44%
3% 2%
0%
10%
20%
30%
40%
50%
Industry Education Size of Firm Exporter MacroeconomicInstability
LaborRegulations
22
5. CONCLUSIONS
This study started out with the hypothesis that the adverse external business conditions that
firms in poor Latin American countries face, may be an important explication of the
generally low levels of productivity. However, the empirical results, based on the survey of
more than 1300 business in Ecuador, Guatemala, Honduras and Nicaragua, do not confirm
this hypothesis. Compared to all the variables that are under the firms control, such as
capital intensity, energy use, and worker skills, the external business environment
(macroeconomic instability and labor regulations) has very little impact on productivity.
Obviously, the firms’ perception on the importance of the latter two constraints may not be
a perfect measure of the external business environment, but even with substantially
improved measures, it is unlikely to become as important as the firms’ own choices.

23
REFERENCES Batra, Geeta, Daniel Kaufmann and Andrew Stone. 2003. Investment Climate Around the World: Voices of the Firms from the World Business Environment Survey. Washington, DC: The International Bank for Reconstruction and Development /The World Bank. Cole, Harold, Lee Ohanian, Alvaro Riascos and James Schmitz. 2004. “Latin America in the Rearview Mirror”. NBER Working Paper No. 11008. National Bureau of Economic Research, Cambrige: MA. Easterly, William. 2001. The Elusive Quest for Growth. Cambridge, MA: The MIT Press. Fields, Gary S. 1997. “Accounting for Income Inequality and Its Change”, Paper presented at the annual meetings of the American Economic Association, New Orleans. ----------. 2004. “Regression-Based Decompositions: A New Tool for Managerial Decision-Making”. Working Paper, Department of Labor Economics, Cornell University, Ithaca, NY. Heston, Alan, Robert Summers and Bettina Aten. 2002. Penn World Table Version 6.1, Center for International Comparisons at the University of Pennsylvania. October. Lewis, William. 2004. The Power of Productivity. Chicago, USA: The University of Chicago Press. Lora, Eduardo, Patricia Cortés and Ana María Herrera. 2001. “Los obstáculos al desarrollo empresarial y el tamaño de las firmas en América Latina” Working Paper No. 447. Research Department, Inter American Development Bank. Washington, DC. Pfeffermann, Guy, Gregory Kisunko, and Mariusz Sumlinski. 1999. “Trend in Private Investment in Developing Countries and Perceived Obstacles to Doing Business—Statistics for 1970-1997”. Discussion Paper No. 37, 10th Edition. International Financial Corporation. Washington, DC. Schiffer, Mirjam and Beatrice Weder. 2001. “Firm Size and the Business Enviroment: Worldwide Survey Results”. Discussion Paper No. 43. International Financial Corporation.Washington, DC.
24
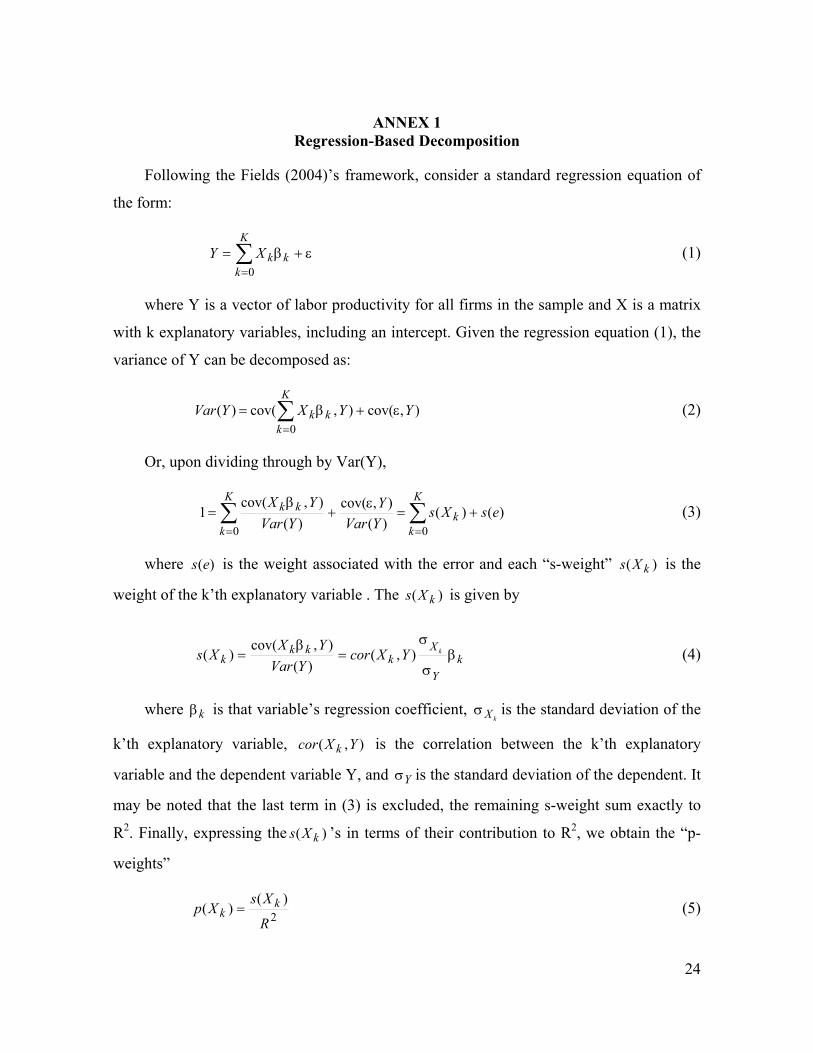
ANNEX 1 Regression-Based Decomposition
Following the Fields (2004)’s framework, consider a standard regression equation of
the form:
ε+β= ∑=
K
kkkXY
0 (1)
where Y is a vector of labor productivity for all firms in the sample and X is a matrix
with k explanatory variables, including an intercept. Given the regression equation (1), the
variance of Y can be decomposed as:
),cov(),cov()(0
YYXYVarK
kkk ε+β= ∑
= (2)
Or, upon dividing through by Var(Y),
∑∑==
+=ε
+β
=K
kk
K
k
kk esXsYVarY
YVarYX
00)()(
)(),cov(
)(),cov(
1 (3)
where )(es is the weight associated with the error and each “s-weight” )( kXs is the
weight of the k’th explanatory variable . The )( kXs is given by
kY
Xk
kkk
kYXcorYVarYX
Xs βσ
σ=
β= ),(
)(),cov(
)( (4)
where kβ is that variable’s regression coefficient, kXσ is the standard deviation of the
k’th explanatory variable, ),( YXcor k is the correlation between the k’th explanatory
variable and the dependent variable Y, and Yσ is the standard deviation of the dependent. It
may be noted that the last term in (3) is excluded, the remaining s-weight sum exactly to
R2. Finally, expressing the )( kXs ’s in terms of their contribution to R2, we obtain the “p-
weights”
2)(
)(R
XsXp kk = (5)

25
such that the )( kXp ’s sum to 1. The results given in (1)-(5) provide a full
decomposition of the variance.