what jobs require:
TRANSCRIPT

What Jobs Require:Literacy, Education, and Training, 1940–2006
POLICY INFORMATION CENTERResearch Division
Educational Testing ServicePrinceton, New Jersey 08541-0001
1
CONTENTS
Preface . . . . . . . . . . . . . . . . . . . . . . . . . . . . . . . . . . . . . . . . 2
Acknowledgments . . . . . . . . . . . . . . . . . . . . . . . . . . . . . . . . 2
Introduction . . . . . . . . . . . . . . . . . . . . . . . . . . . . . . . . . . . . 3
Section 1: Measuring Literacy . . . . . . . . . . . . . . . . . . . . . . . 6
Section 2: Literacy and Occupations . . . . . . . . . . . . . . . . . . 14
Section 3: Education, Training, and Occupations . . . . . . . . . 20
Section 4: Looking Backward . . . . . . . . . . . . . . . . . . . . . . . . 28
Section 5: Putting it in Context . . . . . . . . . . . . . . . . . . . . . . 32
Section 6: The Bottom Line . . . . . . . . . . . . . . . . . . . . . . . . . 37
Appendix A . . . . . . . . . . . . . . . . . . . . . . . . . . . . . . . . . . . . . 39
Appendix B . . . . . . . . . . . . . . . . . . . . . . . . . . . . . . . . . . . . . 59
This report was written by:
Paul E. BartonEducational Testing Service
The views expressed in this reportare those of the author and do notnecessarily reflect the views of theofficers and trustees of EducationalTesting Service.
Additional copies of this report can beordered for $10.50 (prepaid) from:
Policy Information CenterMail Stop 04-REducational Testing ServiceRosedale RoadPrinceton, NJ 08541-0001(609) 734-5694Internet - [email protected]
Copies can also be downloaded fromwww.ets.org/research/pic
Copyright © 1999 by Educational TestingService. All rights reserved. EducationalTesting Service is an Affirmative Action/Equal Opportunity Employer. The ETSlogo is a registered trademark of Educa-tional Testing Service. The modernized ETSlogo is a trademark of Educational TestingService.
January 2000
2
PREFACE
Many statements are made abouttoday’s changing job requirementsin terms of education and trainingrequirements. A precise andaccurate statement about past,present, and future education andtraining needs, is elusive, even withthe best effort, and using the bestresearch that is available, andtrying to remain objective in doingso. The result is a somewhat densetext, following the dictate attrib-uted to Albert Einstein, that thingsshould be made as simple aspossible, but no simpler.
ACKNOWLEDGMENTS
We thank the following people atETS who reviewed the manuscriptand made many corrections andsuggestions: Donna Desrochers,Andrew Latham, Irwin Kirsch,Garlie Forehand, and RichardColey. We also received assistancefrom Richard Fry and Steven Rose,also of ETS. All reviewers do notnecessarily agree with all conclu-sions reached in this report.
Fred Cline of ETS merged thedata on literacy from the NationalAdult Literacy Study, the PositionAnalysis Questionnaire, and theBureau of Labor Statistics employ-ment projections, drawing on theprior research of Don Rock andAndrew Latham, of ETS.
Carla Cooper provided thedesktop publishing, AmandaMcBride provided editing, JamesWert provided cover and layoutdesign, and Ken Caputo was theproduction coordinator.
3
INTRODUCTION
The purpose of this report is toassemble the best informationavailable on past and future trendsin employment and in the educa-tion requirements of jobs in thepost-World War II period. Specifi-cally, we look first at data for 1986and 1996, and at projections to2006. This is no easy task, andthere will be no precise answers.But it is possible to make someuseful estimates, as well as reason-able projections into the nextcentury, by analyzing and compar-ing several sources of information,including studies completed byETS. Then, we look backwardsto what was happening from 1940up to the 1980s.
All of the efforts of the past,and those we have made for thisreport, deal with changing require-ments that result from structuralchanges that change the distribu-tion of occupations. No one hasbeen able to examine each occupa-tion to see how requirements mayhave changed within an occupa-tion; we discuss this in some detailin the report.
Which fields are growing?Which are stable? And which aredeclining? How much educationalpreparation do they require toenter? How is the mix of occupa-tions changing, and will it changein the future? How much capabil-ity with the printed word, andwith computations, do today’sjobs—and the jobs of the
future—require? Do the occupa-tions that are growing requiremore or less preparation orcapability than those that arestable or declining?
The U.S. Bureau of LaborStatistics (BLS) has long reportedemployment by occupation, andhas projected occupational trendsinto the future. Since World WarII, the BLS has issued the Occupa-tional Outlook Handbook, a valu-able tool for counselors and forindividuals choosing careers. Muchof the information we report here,but not all, comes from analysis ofBLS data.
Historically, the occupationalclassification system has beenderived from rankings that reflectsocial and economic standing. Theranking began with the professionsand worked down to laborers.They told more about the job’ssocial status than the skills andeducation needed for that job. Thisproblem with classifying jobs basedon social status rather than skillrequirements is an old one. AdamSmith observed it in The Wealthof Nations, saying that “…manyinferior branches of country labourrequire much more skill andexperience than the greater partof mechanic trades.” He pointsout the uniformity of the work onbrass and iron, but “the man whoploughs the ground with a teamof horses or oxen, works withinstruments of which the health,
strength, and temperaments arevery different upon differentoccasions, requiring judgmentand discretion. The commonploughman, though generallyregarded as the pattern of stupidityand ignorance, is seldom defectivein this judgment and discretion.”
Over the years, Census group-ings have been refined. And theU.S. Department of Labor hasproduced another useful sourceof job-related information, theDictionary of Occupational Titles(DOT), which describes jobs ata very detailed level for use byEmployment Service Counselorsand to facilitate job placement.Decades ago a “crosswalk”1 wasconstructed that permitted transla-tion of job characteristics providedby the DOT into the classificationused by the BLS and the U.S.Bureau of the Census. This meld-ing of information represented abreakthrough, providing a meansfor making general statementsabout the nature and directionof occupational change.
Work has also been doneoutside the government to regroupthe official BLS/Census classifica-tions to shed more light on howjobs and employment patterns arechanging. At ETS, for example,Anthony Carnevale and StevenRose2 have reclassified jobs intocategories based on where peopleactually work. This work showsthat the greatest job growth has
1 Each Census classification has its equivalent in the DOT classification, enabling the user to move from one to the other.
2 Anthony P. Carnevale and Steven J. Rose, Education for What? The New Office Economy, Educational Testing Service, 1998.
4
been in office jobs, which is wherethe vast majority of people withadvanced educations are employed.Jobs in hospitals and classroomsare also increasing, while “counter”jobs have been stable and factoryand farm jobs have been declining.
Here, we are interested specifi-cally in the literacy, education, andtraining requirements of jobs. Thefirst section of this report explainswhat we know from the 1992National Adult Literacy Study,carried out by Educational TestingService under contract with theNational Center for EducationStatistics. That large assessmentsurveyed more than 26,000 indi-viduals, measuring prose, docu-ment, and quantitative literacy.Section 1 describes that study anddiscusses what the different levelson the proficiency scales mean, interms of what adults can do inreal-life situations that require useof print materials. This is back-ground for understanding thesecond section of this report.
Section 2, “Literacy andOccupations,” presents employ-ment trends in 1986, 1996, andprojected to 2006, in terms of theliteracy requirements of jobs. Itlooks at the most rapidly growingand declining occupations, theoccupations with the highest andlowest literacy requirements, andthe average for all employment inthose years. Three components arebrought together in this effort. The
first cites the BLS/Census statisticson employment by occupation, aswell as projections to 2006.3 Thesecond component consists of theNational Adult Literacy Study(NALS), which reports on theliteracy levels of employed people.And the third references thePosition Analysis Questionnaire(PAQ), a job analysis approach tooccupational requirements. At thispoint it is necessary to introducethe PAQ, for it is the basis forexpanding the NALS proficiencyscores to all the occupations thatthe BLS reports on, as well asconverting them to actual jobrequirements rather than scoresof the people who hold the jobs.
The PAQ is a job analysisprogram that has been performedfor 2,200 jobs. It is a structuredquestionnaire that is used toanalyze jobs on the basis of 187job elements that describe generichuman work behaviors. Theseelements are organized intosix dimensions:
1. Information Input (Where andhow does the worker get theinformation that is used inperforming the job?)
2. Mental Processes (What reason-ing, decision-making, planning,and information processingactivities are involved in per-forming the job?)
3. Work Output (What physicalactivities does the workerperform, and what tools ordevices are used?)
4. Relationships with OtherPersons (What relationshipswith other people are requiredin performing the job?)
5. Job Context (In what physicaland social context is thework performed?)
6. Other Job Characteristics(What activities, conditions,or characteristics other thanthose described above arerelevant to the job?)
A complete description of thePAQ and the PAQ database isprovided in the Technical Manualfor the Position Analysis Question-naire, by E. J. McCormick, R. C.Mecham, and P. R. Jeanneret,published by the ConsultingPsychologists Press in 1989.4
This report translates PAQresults into the NALS prose,document, and quantitativeproficiencies, a process that wasmade possible by a study carriedout in 1996 by Don Rock andAndy Latham at ETS, and P. R.Jeanneret of Jeanneret and Associ-ates, under a contract with theU.S. Department of Labor. Thetitle of the study describes its
3 The source is the U.S. Department of Labor, Bureau of Labor Statistics, “Occupational Projections and Training Data, 1998-1999 Edition,”Bulletin 2501. All data in the report are available at the BLS Web site, http://www.stats.bls.gov.
4 They have also written The Job Analysis Handbook for business, industry, and government, 1988, and Position Analysis Questionnaire,5th printing, 1993.
5
purpose: Estimating Prose, Docu-ment, and Quantitative LiteracyScores from Position AnalysisQuestionnaire Dimensions: AnEmpirical Linkage Between AdultLiteracy Skills and Job AnalysisInformation. The correlationsbetween NALS and PAQ werefound to be sufficiently high topermit such estimation, and thiswas carried out for 522 jobs.
To produce this report, how-ever, these NALS scores had to belinked to the BLS employmentdata by occupation, and thenprojected to 2006. The requireddata for 1996 and 2006 werepublished in the November 1996Monthly Labor Review in an articleby George T. Silvester.5 The 1986data was not as detailed as the1996 data. BLS supplied data forthe 1986 occupational trends thatmore nearly matched the pub-lished 1996 data. However, theBLS data was still not as detailedas the 1996 data, so there are someindividual 1986 occupations forwhich we do not have comparabledata for 1996 and 2006.
The marrying of these esti-mated NALS scores to the BLSemployment statistics was carriedout by Fred Cline in the ETSResearch Division. An intermedi-ate step was needed, since theestimated scores for these 522occupations were in the classifica-tion system of the Dictionary ofOccupational Titles. The conversionhad to be made manually using the
“crosswalk” developed by theDepartment of Labor, referred toabove. The methodology used byCline is summarized in AppendixB. All the data produced for thisreport on literacy is included inAppendix A. Summary tables areprovided in Section 2.
The presentation of data inSection 3, “Employment/TrainingRequirements and Occupations,”is more straightforward. As statedabove, BLS compiles, in tabularform, the key data used in itsEmployment Outlook Handbook,which is available in a publicationcalled Occupational Projections andTraining Data. The 1998-1999edition was published by theBureau of Labor Statistics asBulletin 2501. All the data isavailable at the BLS Web site,http://www.stats.bls.gov, andcan be downloaded in differentarrangements, such as by educa-tion/training requirement, or thepercent increase in employmentby occupation, for example. Tocompile this report, we need totabulate employment and jobopening data by education/training requirement categories,such as “all occupations thatrequire a B.A. degree.”
Since the BLS data is readilyavailable on the Web, we have notincluded the detailed tables, whichprovide information for more than500 occupations. In Section 3, wepresent our tabulations.
The principle purpose of thisreport is to generalize the literacy,education, and training require-ments of the workforce, as well asto project these requirements intothe near future. However, the datafor individual occupations will bevaluable for many purposes, so wehave included the literacy tablesfor such uses. This is also true ofthe education/training requirementdata, available at the BLS Web site.The uses of NALS data are many,and ETS has published a numberof studies using this importantdatabase. A recent one was GettingDown to Business: Matching WelfareRecipients to Jobs That Train, byAnthony Carnevale and DonnaDesrochers, which used NALSdata to analyze jobs and trainingneeds for persons leaving thewelfare rolls. Carnevale andDesrochers also have in process areport that takes a broader look atskills and the economy as a whole.
Sections 2 and 3 present thetwo analyses described above. Thefourth section is titled “LookingBackward.” It traces trends fromthe post-World War II period tothe 1980s. A substantial amountof information is available, comingmost importantly from the workof James Scoville. The last sectionis “Putting it in Context,” whichtries to explain what this informa-tion means, and does not mean, inthe broader context of the opera-tion of the labor market.
5 Also at the BLS Employment Projections Web site, http://www.stats.bls.gov/emphome.htm, under “Most Requested Tables.”
6
SECTION 1:
MEASURING LITERACY
This section of the report describesNALS and its definition of literacy.NALS provides the most detailedportrait that has ever been avail-able on the conditions of literacyin the United States—and onthe unrealized potential of thenation’s citizens.6
For the 1992 survey, trainedstaff interviewed nearly 13,600individuals age 16 and older, whowere randomly selected to representthe U.S. adult population; statesamples and a sample of federaland state prison inmates pushedthe final number of individualssurveyed to more than 26,000.Each participant was asked to spendabout an hour responding to a seriesof diverse literacy tasks, as well as toquestions about his or her demo-graphic characteristics, educationalbackground, reading practices, andother areas related to literacy.
To analyze the literacy skills ofany group, it is first necessary todefine what is meant by “literacy.”The term is often used as theopposite of “illiteracy,” which istypically interpreted to mean notbeing able to read at all, decode theprinted word, or comprehend whatis written. But literacy has a muchricher and deeper meaning thanthat. Its dictionary definitionsrange from being able to read andwrite; to being a well-informed,
educated person; to being familiarwith literature.
NALS was guided by thefollowing definition of literacy,adopted by a broadly representa-tive group of experts:
Using printed and writteninformation to function insociety, to achieve one’s goals,and to develop one’s knowledgeand potential.
NALS focused on three areasof literacy proficiency—prose,document, and quantitative.
Prose literacy - the knowledgeand skills needed to understandand use information from textsthat include editorials, newsstories, poems, and fiction; forexample, finding a piece of infor-mation in a newspaper article,interpreting instructions for awarranty, inferring a theme froma poem, or contrasting viewsexpressed in an editorial.
Document literacy - the knowl-edge and skills required to locateand use information contained ineveryday materials such as jobapplications, payroll forms, trans-portation schedules, maps, tables,and graphs; for example, locatinga particular intersection on a streetmap, using a schedule to choose theappropriate bus, or entering infor-mation on an application form.
Quantitative literacy - the knowl-edge and skills required to applyarithmetic operations, either aloneor sequentially, using numbersembedded in printed materials;for example, balancing a check-book, figuring out a tip, complet-ing an order form, or determiningan amount of interest from aloan advertisement.
Based on their performance onthe literacy tasks, respondents wereassigned scores on the three profi-ciency scales, each ranging from 0to 500. While most previousstudies of literacy have attemptedto identify the number of “illiter-ates,” the goal of NALS wasdifferent—to profile the nation’sliteracy skills. Thus, there is nosingle point on the literacy scalethat separates illiterates fromliterates, per se. Rather, each scaleis divided into five levels of profi-ciency, each encompassing a rangeof scores.
Level 1 - scores from 0 to 225
Level 2 - scores from 226 to 275
Level 3 - scores from 276 to 325
Level 4 - scores from 326 to 375
Level 5 - scores from 376 to 500
6 NALS was funded by the U.S. Department of Education and administered by Educational Testing Service, in collaboration with Westat Inc. Thefirst volume in the series offers an overview of the results. See Irwin S. Kirsch, Ann Jungeblut, Lynn Jenkins, and Andrew Kolstad, Adult Literacy inAmerica: A First Look at the Results of the National Adult Literacy Survey, prepared by Educational Testing Service for the National Center forEducation Statistics, U.S. Department of Education, September 1993. Additional NALS reports offer a more detailed look at particular issues,including literacy in the workforce, literacy and education, literacy among older adults, literacy in the prison population, literacy and culturaldiversity, and literacy practices.

7
Individuals scoring withinone of these scale levels have ahigh probability of performing thetasks at that level successfully.7
Those who performed at Level 1demonstrated the lowest literacyproficiencies, while those at Level5 displayed the highest profi-ciencies. Similarly, the tasks thatcharacterized Level 1 were the leastchallenging in the assessment, whilethose associated with Level 5 werethe most difficult.
Sample tasks are provided hereto illustrate the types of literacy
7 A high probability is defined as at least 80 percent of the time. Individuals would have a small chance of performing tasks at a higher level.
8 See the original NALS report cited in footnote 5. A summary is also provided in Paul E. Barton, Becoming Literate About Literacy, Policy Informa-tion Report, ETS Policy Information Center, 1994.
skills exhibited by those whoperformed at each level. To avoidexcessive detail, we have onlyprovided example tasks for proseliteracy. Readers who would liketo know more about the tasks orsee additional examples shouldrefer to other NALS reports.8
LEVEL 1Prose. What does it mean to
score at Level 1? Some individualsscoring at this level on the prosescale demonstrate the ability toread relatively short pieces of text,
such as a brief newspaper article, tofind a piece of information that isidentical to or synonymous withinformation given in a directive.Typically, little or no distractinginformation (information thatseems plausible but is incorrect) ispresent in such tasks. Individualswho perform at Level 1 maysucceed in prose tasks that askthem to:
� identify a country mentioned ina short article (score of 149)
Underline the sentence that tells what Ms. Chanin ate during the swim.
EXAMPLE TASK FOR PROSE LITERACY, LEVEL 1
8
� locate a piece of information ina sports article (score of 210)
� underline a sentence explainingthe action stated in a shortarticle (score of 225)
Document. Some individualswho score at Level 1 are able tolocate a piece of information basedon a literal match between thedirective and the document, aslong as little, if any, distractinginformation is present. Someadults at this level also display theability to enter basic information
about themselves onto an applica-tion form or other type of docu-ment. Specifically, individuals atLevel 1 may be able to:
� sign their name on a brief form(score of 60)
� locate a meeting time on a form(score of 180)
� use a pie chart to locate a type ofvehicle that had a given numberof sales (score of 214)
Quantitative. Some individualswho score at Level 1 demonstrate
the ability to perform single,relatively simple arithmetic opera-tions, such as addition. Thenumbers to be used in such tasksare provided, and the operation tobe performed is specified. Thosescoring at the lowest level on thequantitative scale may be able to:
� total a bank deposit entry(score of 191)
LEVEL 2Prose. Individuals scoring at
this level on the prose scale dem-onstrate the ability to locate a pieceof information in a piece of text
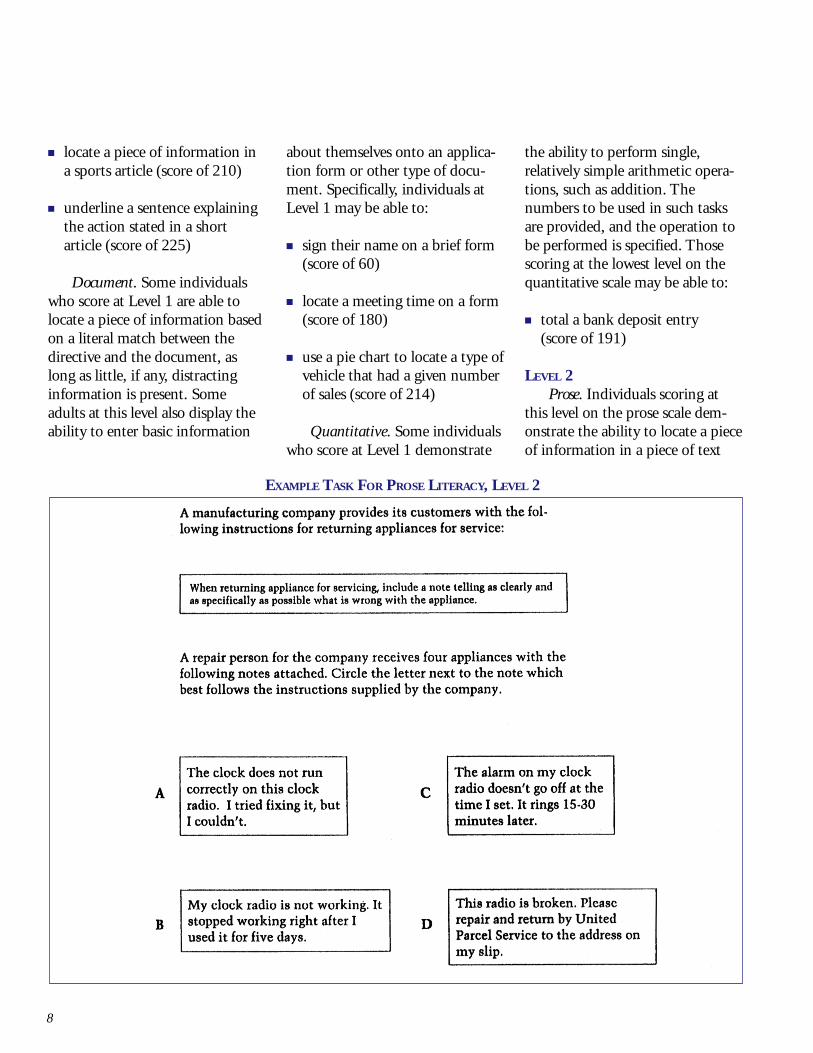
EXAMPLE TASK FOR PROSE LITERACY, LEVEL 2
9
even when distracting informationis present. They also appear to havelittle difficulty integrating, com-paring, and contrasting two ormore pieces of information foundin printed material. Individuals atthis level are likely to be successfulon literacy tasks that ask them to:
� underline the meaning of a termin a brochure on governmentbenefits (score of 226)
� locate two types of informationin a sports article (score of 250)
� interpret instructions froman appliance warranty (scoreof 275)
Document. Those scoring atLevel 2 on the document scaledisplay skill at matching a piece ofinformation in a form or othertype of document with informa-tion in a directive, even whendistracting information is present.Low-level inferences are sometimesrequired in performing such tasks.In addition, individuals at Level 2are likely able to:
� locate an intersection on astreet map (score of 230)
� locate eligibility informationin a table of employee benefits(score of 246)
� identify and enter backgroundinformation on a Social Securitycard application (score of 259)
Quantitative. Individuals atLevel 2 display the ability to
perform a single arithmeticoperation using numbers that aregiven to them or that can easily belocated in printed material. Adultsat this level are likely able to:
� calculate postage and fees forcertified mail (score of 238)
� determine the difference in pricebetween tickets for two shows(score of 246)
� calculate the total cost ofpurchases from an orderform (score of 270)
LEVEL 3Prose. Individuals scoring at
Level 3 on the prose scale demon-strate the ability to match informa-tion in a piece of printed materialwith information in a directivewhen low-level inferences arerequired. They also display skill atintegrating information fromdense or lengthy text. Level 3scorers are likely to succeed atliteracy tasks asking them to:
� write a brief letter explaininga billing error (score of 288)
� find a sentence in a news articlethat interprets a situation (scoreof 304)
� read a lengthy article to identifybehaviors that meet a statedcondition (score of 316)
Document. Individuals per-forming at Level 3 appear to havelittle difficulty integrating severalpieces of information from one or
more documents. They also displayskill at using and interpreting rathercomplex tables and graphs contain-ing information that is eitherirrelevant or inappropriate to thetask. Adults at this level can:
� identify information in a barchart showing energy sourcesfor various years (score of 277)
� enter information into anautomobile maintenancerecord form (score of 323)
Quantitative. Individuals atLevel 3 demonstrate skill at per-forming tasks in which two or morenumbers must be found in a pieceof printed material to solve anarithmetic problem. The math-ematical operation(s) to be per-formed can be determined fromthe terms used in the directive.Some of the tasks in this levelinvolve the use of a calculator.Adults at Level 3 are likely able to:
� calculate the difference betweenthe regular and sale prices of anitem in an advertisement (scoreof 278)
� determine the discount from anoil bill if paid within 10 days(score of 308)
� calculate miles per gallon usinginformation from a mileagerecord chart (score of 321)
LEVEL 4Prose. Individuals scoring at this
level display the ability to matchmultiple pieces of information in
10
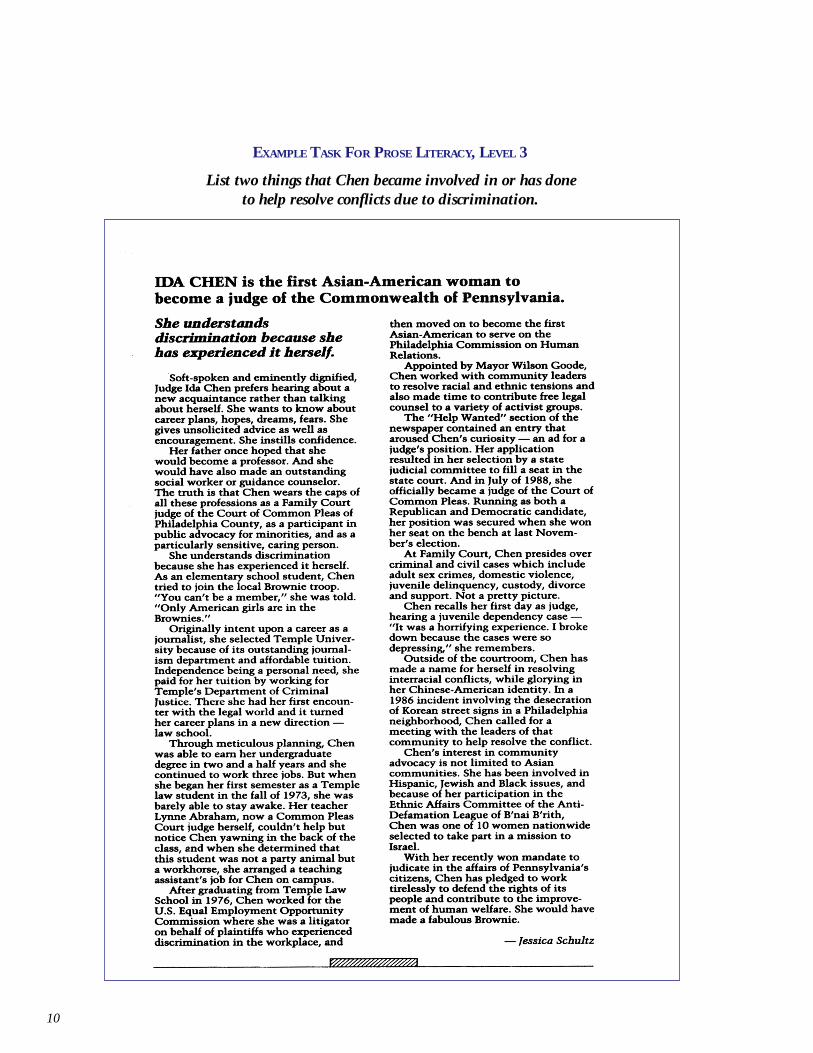
List two things that Chen became involved in or has doneto help resolve conflicts due to discrimination.
EXAMPLE TASK FOR PROSE LITERACY, LEVEL 3

11
a piece of writing. Further, theyappear to be able to integrate orsynthesize information from com-plex or lengthy pieces of text and tomake complex inferences aboutwhat they read. They are likely tosucceed at tasks that ask them to:
� state in writing an argumentmade in a lengthy newspaperarticle (score of 328)
Contrast Dewey’s and Hanna’s views about the existence of technologies that can be used to produce morefuel-efficient cars while maintaining the size of the car.
EXAMPLE TASK FOR PROSE LITERACY, LEVEL 4
� contrast views expressed in twoeditorials on fuel-efficient cars(score of 359)
� compare two metaphors usedin a poem (score of 374)
Document. Individuals at Level4 are able to make high-levelinferences to interpret various types
of documents. They also appear tohave little difficulty performingtasks that involve the use ofconditional information. Theyare likely able to:
� use a table to identify thepercentage of cases that meetspecified conditions (scoreof 342)
12
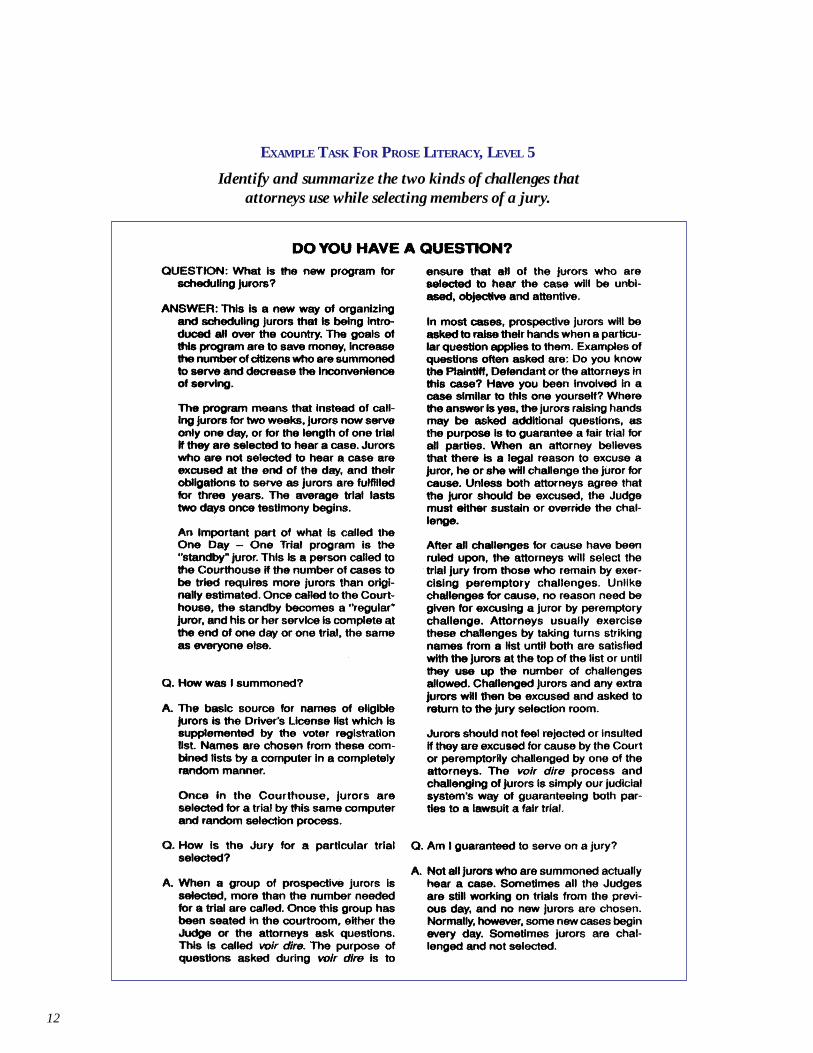
Identify and summarize the two kinds of challenges thatattorneys use while selecting members of a jury.
EXAMPLE TASK FOR PROSE LITERACY, LEVEL 5
13
� use a schedule to determinewhich bus to take in a givensituation (score of 352)
� use a table to identify a patternof oil exports over time (scoreof 352)
Quantitative. Individuals atthis level have little difficultyperforming two or more arithmeticoperations in a sequence. They canalso perform single arithmeticoperations in which the quantitiesare found in different types ofdisplays, or in which the opera-tions must be inferred from theinformation given or from priorknowledge. These individuals arelikely to succeed when asked to:
� use information in a news articleto calculate how much moneyshould go to raising a child(score of 350)
� use an eligibility pamphlet tocalculate how much money acouple would receive for basicsupplemental security income inone year (score of 368)
LEVEL 5Prose. Individuals at this level
have little difficulty finding infor-mation in dense text that containsa considerable amount of distract-ing information. They can alsomake high-level inferences and usespecialized background knowledgeto help them understand what theyread. Level 5 scorers can succeed attasks asking them to:
� compare the approaches statedin a narrative on growing up(score of 382)
� summarize two ways in whichlawyers may challenge prospec-tive jurors (score of 410)
� interpret a brief phrase froma lengthy news article (scoreof 423)
Document. These individualshave the ability to search throughcomplex displays that containseveral pieces of distractinginformation. They also have littledifficulty making high-levelinferences and using specializedbackground knowledge to interpretinformation in documents. Theyare likely able to:
� use information in a table tocomplete a graph, includinglabeling the axes (score of 378)
� use a table to compare creditcards, identify two categories ofcomparison, and write about thedifferences (score of 387)
� use information from a table towrite a paragraph about a schoolsurvey (score of 395)
Quantitative. Individuals atthis level can perform multiplearithmetic operations sequentially.They are also able to find thefeatures of problems in a pieceof printed material and to usetheir background knowledge to
determine the quantities or opera-tions needed. People at this literacylevel are likely to succeed withtasks that ask them to:
� use an order form to calculatethe shipping costs and totalcosts of items (score of 382)
� use information from a newsarticle to calculate the differencein times for completing a race(score of 405)
� use a calculator to figure thetotal cost of carpet for a room(score of 421)
14
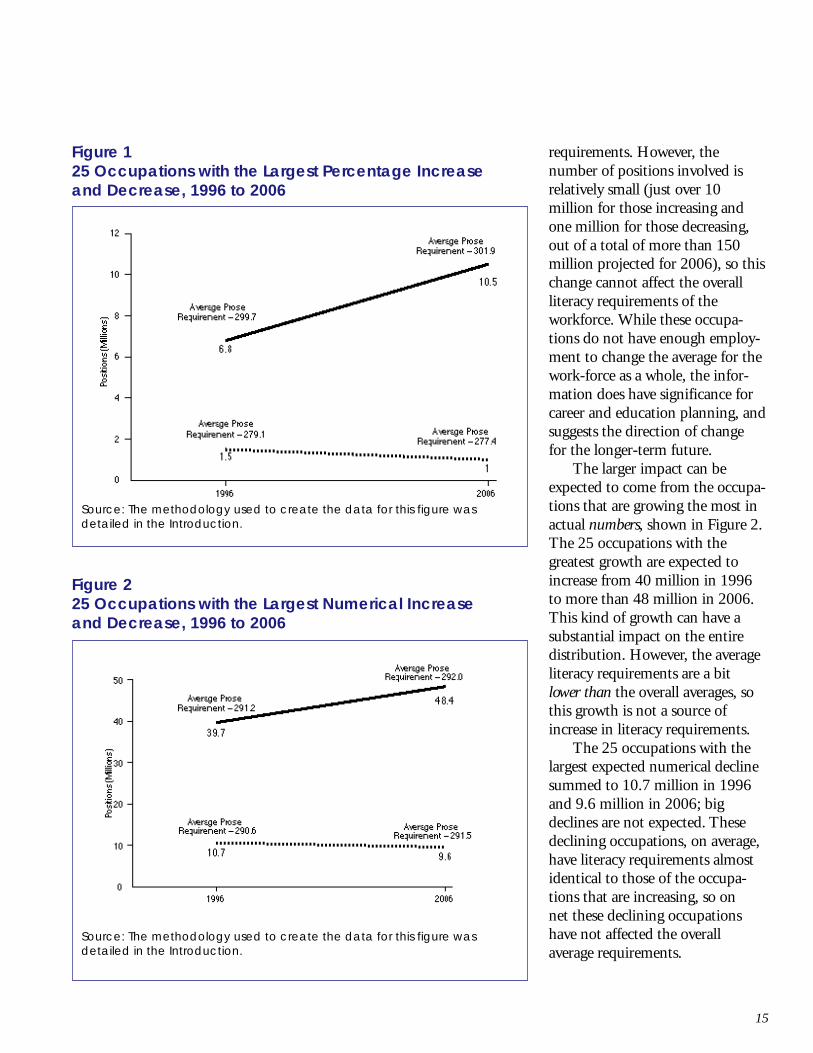
Articles about past and futureworkforce trends frequently renderconclusions about the direction ormagnitude of change in educationor skill requirements. The mostfrequently reported aspect is of thefastest growing occupations, oftenshown in terms of those occupa-tions with the highest percentageincrease. The projections for the25 occupations with the highestpercentage increase can be seen inFigure 1. These 25 occupationscombined are expected to growfrom 6.8 million in 1996 to 10.5million in 2006, an increase of 69percent. For these 25 occupationsthe combined average proserequirement was 300 in 1996,rising to 302 in 2006. This con-trasts to an average score of 291 forall occupations in 1996. These 25fastest growing occupations have aconsiderably higher prose, docu-ment, and quantitative literacyrequirement than the average forall occupations.
Figure 1 also shows the 25occupations with the largestpercentage decrease, dropping from1.5 million to 1.0 million between1996 and 2006. For these jobs, theaverage prose requirement is belowthe national average. Jobs that areincreasing have substantially higherprose/literacy requirements thanjobs that are declining, with a neteffect of raising average literacy
9 For a recent analysis of the historical record on the accuracy of these projections, see “The Quality of BLS Projections: A Historical Account,” NealH. Rosenthal, The Monthly Labor Review, Volume 122, Number 5, May 1999.
SECTION 2:
LITERACY AND
OCCUPATIONS
In this section we will answer thefollowing questions: (1) Howmuch have the overall literacyrequirements of jobs in Americachanged, on average, from 1986 to1996, and (2) How much are theyexpected to change from 1996 to2006? More specifically, we willexamine in detail the expectedchanges from 1996 to 2006,focusing on the fastest and slowestgrowing occupations as well as theoccupations with the highest andlowest literacy requirements.
The occupational employmentdata for past years, as well as theprojections for 2006, are theproduct of the U.S. Bureau ofLabor Statistics (BLS), which hasbeen making such projectionssince about World War II. Theyhave been correct in the directionof change, but often miss the markin the amount of change in anindividual occupation.9
The estimates of literacyrequirements we will marry tothese BLS data and projectionswere explained in the precedingsection. What we will be discussingis the change in literacy require-ments in the workforce that resultfrom the changing distributionof employment among the
occupations. For example, averageliteracy requirements in the entireworkforce will be affected by alarge increase in the number oftruck drivers (who have averageprose literacy requirements of268), growing from 2.2 million in1986 to 2.7 million in 1996, andprojected to reach 3.1 million by2006. We can also measure theeffect of this change on the largesubgroup of occupations thatinclude truck drivers—“operators,fabricators, and laborers.”
However, we have no measureof whether the literacy requirementto be a truck driver, for example,was different in 1986 than in1996, or will change from 1996 to2006, an issue we discuss in thesection, “Putting it in Context.”When changes in the contentof jobs are very large, perhapsbecause of changes in technology,the result is frequently the creationof an occupation with a new title,rather than a large change withinthe previously existing occupa-tion—although that may happenalso. Occupations are being createdand discarded, although large-scale changes of this kind do notlikely happen within short-termtime frames, such as the 20-yearperiod being examined here.For example, farriers have beenaround for a long time, but in everdwindling numbers.
15
requirements. However, thenumber of positions involved isrelatively small (just over 10million for those increasing andone million for those decreasing,out of a total of more than 150million projected for 2006), so thischange cannot affect the overallliteracy requirements of theworkforce. While these occupa-tions do not have enough employ-ment to change the average for thework-force as a whole, the infor-mation does have significance forcareer and education planning, andsuggests the direction of changefor the longer-term future.
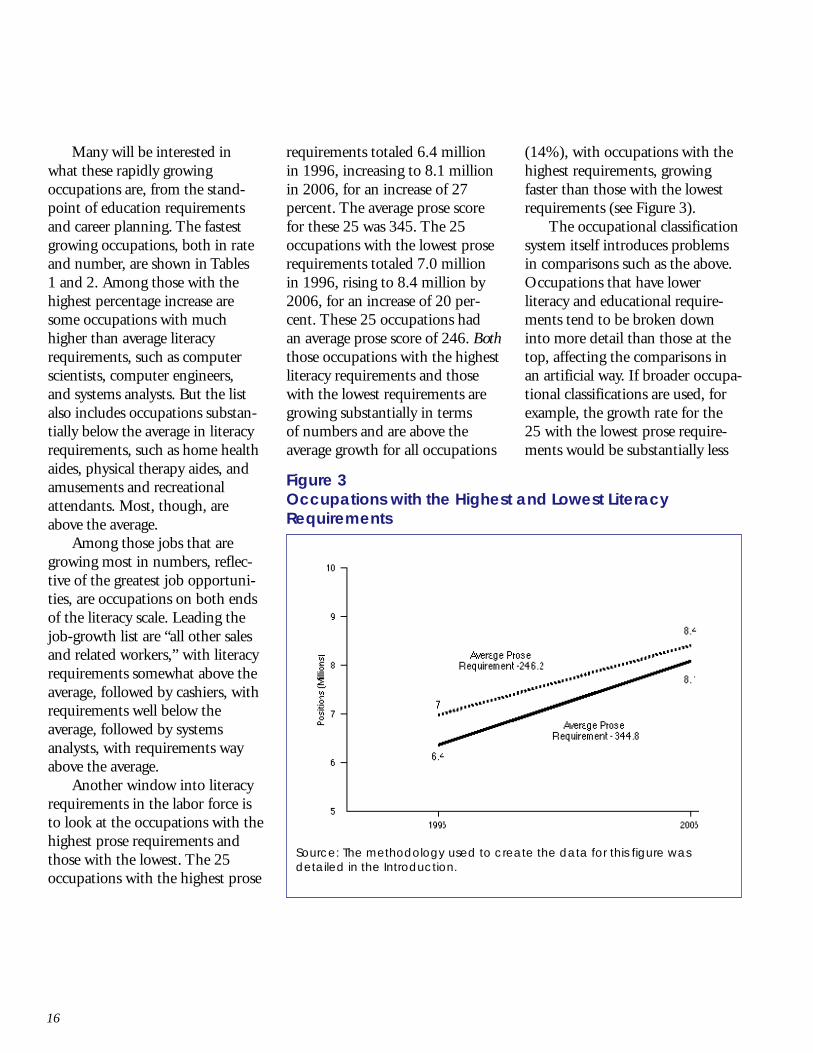
The larger impact can beexpected to come from the occupa-tions that are growing the most inactual numbers, shown in Figure 2.The 25 occupations with thegreatest growth are expected toincrease from 40 million in 1996to more than 48 million in 2006.This kind of growth can have asubstantial impact on the entiredistribution. However, the averageliteracy requirements are a bitlower than the overall averages, sothis growth is not a source ofincrease in literacy requirements.
The 25 occupations with thelargest expected numerical declinesummed to 10.7 million in 1996and 9.6 million in 2006; bigdeclines are not expected. Thesedeclining occupations, on average,have literacy requirements almostidentical to those of the occupa-tions that are increasing, so onnet these declining occupationshave not affected the overallaverage requirements.
Figure 125 Occupations with the Largest Percentage Increaseand Decrease, 1996 to 2006
Figure 225 Occupations with the Largest Numerical Increaseand Decrease, 1996 to 2006
Source: The methodology used to create the data for this figure wasdetailed in the Introduction.
Source: The methodology used to create the data for this figure wasdetailed in the Introduction.
16
Many will be interested inwhat these rapidly growingoccupations are, from the stand-point of education requirementsand career planning. The fastestgrowing occupations, both in rateand number, are shown in Tables1 and 2. Among those with thehighest percentage increase aresome occupations with muchhigher than average literacyrequirements, such as computerscientists, computer engineers,and systems analysts. But the listalso includes occupations substan-tially below the average in literacyrequirements, such as home healthaides, physical therapy aides, andamusements and recreationalattendants. Most, though, areabove the average.
Among those jobs that aregrowing most in numbers, reflec-tive of the greatest job opportuni-ties, are occupations on both endsof the literacy scale. Leading thejob-growth list are “all other salesand related workers,” with literacyrequirements somewhat above theaverage, followed by cashiers, withrequirements well below theaverage, followed by systemsanalysts, with requirements wayabove the average.
Another window into literacyrequirements in the labor force isto look at the occupations with thehighest prose requirements andthose with the lowest. The 25occupations with the highest prose
requirements totaled 6.4 millionin 1996, increasing to 8.1 millionin 2006, for an increase of 27percent. The average prose scorefor these 25 was 345. The 25occupations with the lowest proserequirements totaled 7.0 millionin 1996, rising to 8.4 million by2006, for an increase of 20 per-cent. These 25 occupations hadan average prose score of 246. Boththose occupations with the highestliteracy requirements and thosewith the lowest requirements aregrowing substantially in termsof numbers and are above theaverage growth for all occupations
(14%), with occupations with thehighest requirements, growingfaster than those with the lowestrequirements (see Figure 3).
The occupational classificationsystem itself introduces problemsin comparisons such as the above.Occupations that have lowerliteracy and educational require-ments tend to be broken downinto more detail than those at thetop, affecting the comparisons inan artificial way. If broader occupa-tional classifications are used, forexample, the growth rate for the25 with the lowest prose require-ments would be substantially less
Figure 3Occupations with the Highest and Lowest LiteracyRequirements
Source: The methodology used to create the data for this figure wasdetailed in the Introduction.

Table 1 Top 25 Occupations With the Largest Percent Increase in Jobs, 1996 to 2006 (in thousands)
Occupation - Largest Percent Increase Percent Prose Document Quant 1996 2006 Increase
Database admin, support specialists, and computer scientists 351.0 362.0 354.0 212 461 117.45%Computer engineers 333.0 327.0 338.0 216 451 108.80%Systems analysts 352.0 347.0 352.0 506 1,025 102.57%Physical and corrective therapy assistants and aides 266.0 268.0 264.0 85 151 77.65%Home health aides 244.0 232.0 234.0 498 873 75.30%Medical assistants 290.0 286.0 281.0 225 391 73.78%Occupational therapists 320.0 314.0 315.0 57 95 66.67%Occupational therapy assistants and aides 338.0 333.0 339.0 16 26 62.50%Teachers, special education 325.0 316.0 324.0 407 648 59.21%Medical records technicians 300.0 295.0 297.0 87 132 51.72%Data processing equipment repairers 316.0 312.0 314.0 80 121 51.25%Dental hygienists 325.0 309.0 313.0 133 197 48.12%Amusement and recreation attendants 289.0 275.0 286.0 288 426 47.92%Adjustment clerks 295.0 294.0 293.0 401 584 45.64%Respiratory therapists 315.0 306.0 292.0 82 119 45.12%Emergency medical technicians 333.0 326.0 308.0 150 217 44.67%Bill and account collectors 299.0 294.0 304.0 269 381 41.64%Residential counselors 334.0 325.0 337.0 180 254 41.11%Instructors and coaches, sports and physical training 316.0 309.0 296.0 303 427 40.92%Securities and financial services sales workers 328.0 316.5 329.0 263 363 38.02%Teacher aides and educational assistants 284.0 271.0 276.0 981 1,352 37.82%Dental assistants 276.0 268.0 263.0 202 278 37.62%Flight attendants 321.0 315.0 311.0 130 178 36.92%Child care workers 264.0 250.0 255.0 830 1,129 36.02%Customer service representatives, utilities 294.0 289.0 294.0 152 206 35.53%
1996 299.7 291.3 294.0 6,753 10,485 55.26%2006 301.9 293.9 296.6
Note: There were a few occupations among the fastest growing 25 for which
we do not have estimated prose literacy requirements, due to the small numbers in the occupation. These are the top 25 for which literacy scores are available.
Average Literacy Requirements Number ofPositions
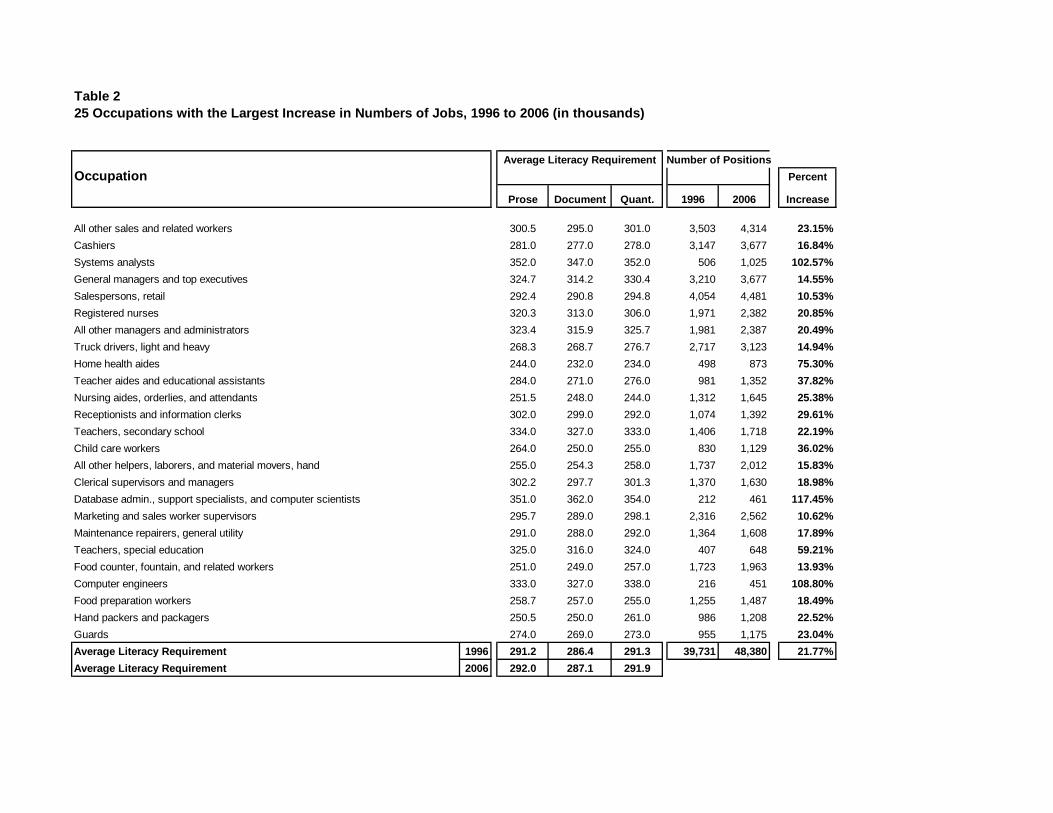
Table 2 25 Occupations with the Largest Increase in Numbers of Jobs, 1996 to 2006 (in thousands)
Average Literacy Requirement Number of PositionsOccupation Percent
Prose Document Quant. 1996 2006 Increase
All other sales and related workers 300.5 295.0 301.0 3,503 4,314 23.15%Cashiers 281.0 277.0 278.0 3,147 3,677 16.84%Systems analysts 352.0 347.0 352.0 506 1,025 102.57%General managers and top executives 324.7 314.2 330.4 3,210 3,677 14.55%Salespersons, retail 292.4 290.8 294.8 4,054 4,481 10.53%Registered nurses 320.3 313.0 306.0 1,971 2,382 20.85%All other managers and administrators 323.4 315.9 325.7 1,981 2,387 20.49%Truck drivers, light and heavy 268.3 268.7 276.7 2,717 3,123 14.94%Home health aides 244.0 232.0 234.0 498 873 75.30%Teacher aides and educational assistants 284.0 271.0 276.0 981 1,352 37.82%Nursing aides, orderlies, and attendants 251.5 248.0 244.0 1,312 1,645 25.38%Receptionists and information clerks 302.0 299.0 292.0 1,074 1,392 29.61%Teachers, secondary school 334.0 327.0 333.0 1,406 1,718 22.19%Child care workers 264.0 250.0 255.0 830 1,129 36.02%All other helpers, laborers, and material movers, hand 255.0 254.3 258.0 1,737 2,012 15.83%Clerical supervisors and managers 302.2 297.7 301.3 1,370 1,630 18.98%Database admin., support specialists, and computer scientists 351.0 362.0 354.0 212 461 117.45%Marketing and sales worker supervisors 295.7 289.0 298.1 2,316 2,562 10.62%Maintenance repairers, general utility 291.0 288.0 292.0 1,364 1,608 17.89%Teachers, special education 325.0 316.0 324.0 407 648 59.21%Food counter, fountain, and related workers 251.0 249.0 257.0 1,723 1,963 13.93%Computer engineers 333.0 327.0 338.0 216 451 108.80%Food preparation workers 258.7 257.0 255.0 1,255 1,487 18.49%Hand packers and packagers 250.5 250.0 261.0 986 1,208 22.52%Guards 274.0 269.0 273.0 955 1,175 23.04%Average Literacy Requirement 1996 291.2 286.4 291.3 39,731 48,380 21.77%Average Literacy Requirement 2006 292.0 287.1 291.9
19
than what is reported here, whereno such aggregation is employed.
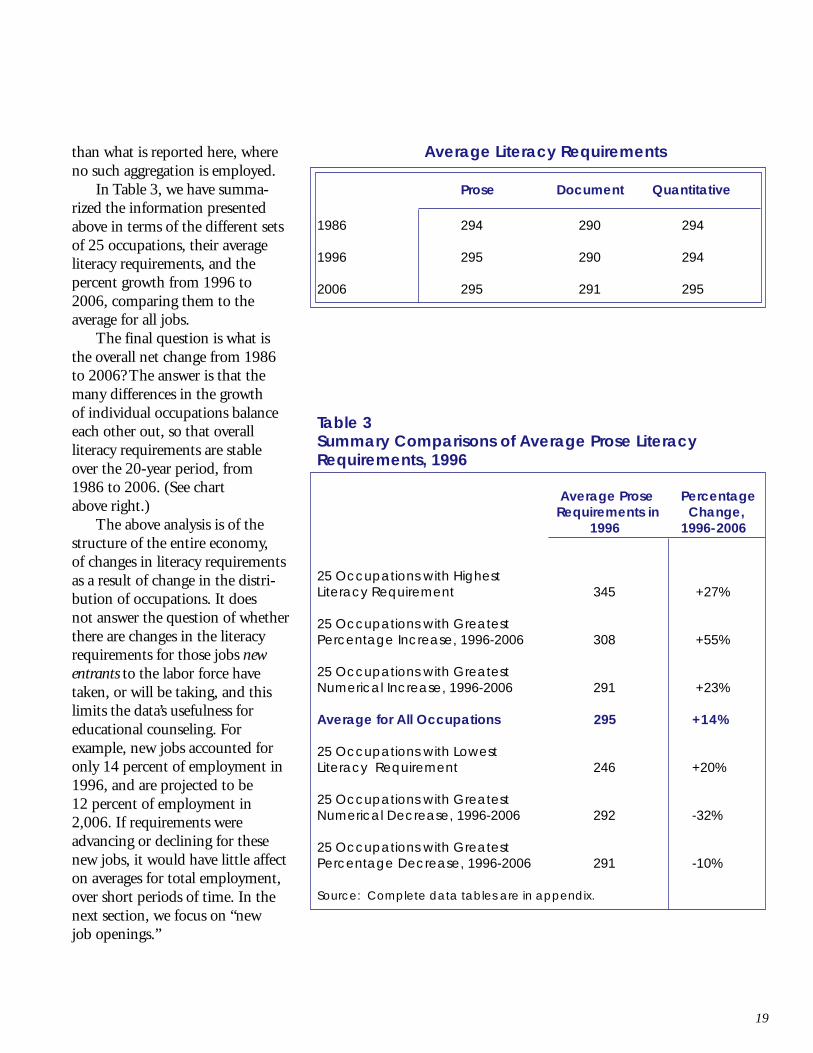
In Table 3, we have summa-rized the information presentedabove in terms of the different setsof 25 occupations, their averageliteracy requirements, and thepercent growth from 1996 to2006, comparing them to theaverage for all jobs.
The final question is what isthe overall net change from 1986to 2006? The answer is that themany differences in the growthof individual occupations balanceeach other out, so that overallliteracy requirements are stableover the 20-year period, from1986 to 2006. (See chartabove right.)
The above analysis is of thestructure of the entire economy,of changes in literacy requirementsas a result of change in the distri-bution of occupations. It doesnot answer the question of whetherthere are changes in the literacyrequirements for those jobs newentrants to the labor force havetaken, or will be taking, and thislimits the data’s usefulness foreducational counseling. Forexample, new jobs accounted foronly 14 percent of employment in1996, and are projected to be12 percent of employment in2,006. If requirements wereadvancing or declining for thesenew jobs, it would have little affecton averages for total employment,over short periods of time. In thenext section, we focus on “newjob openings.”
Average Literacy Requirements
Prose Document Quantitative
1986 294 290 294
1996 295 290 294
2006 295 291 295
Table 3Summary Comparisons of Average Prose LiteracyRequirements, 1996
Average Prose PercentageRequirements in Change, 1996 1996-2006
25 Occupations with HighestLiteracy Requirement 345 +27%
25 Occupations with GreatestPercentage Increase, 1996-2006 308 +55%
25 Occupations with GreatestNumerical Increase, 1996-2006 291 +23%
Average for All Occupations 295 +14%
25 Occupations with LowestLiteracy Requirement 246 +20%
25 Occupations with GreatestNumerical Decrease, 1996-2006 292 -32%
25 Occupations with GreatestPercentage Decrease, 1996-2006 291 -10%
Source: Complete data tables are in appendix.
20
SECTION 3:
EDUCATION,
TRAINING, AND
OCCUPATIONS
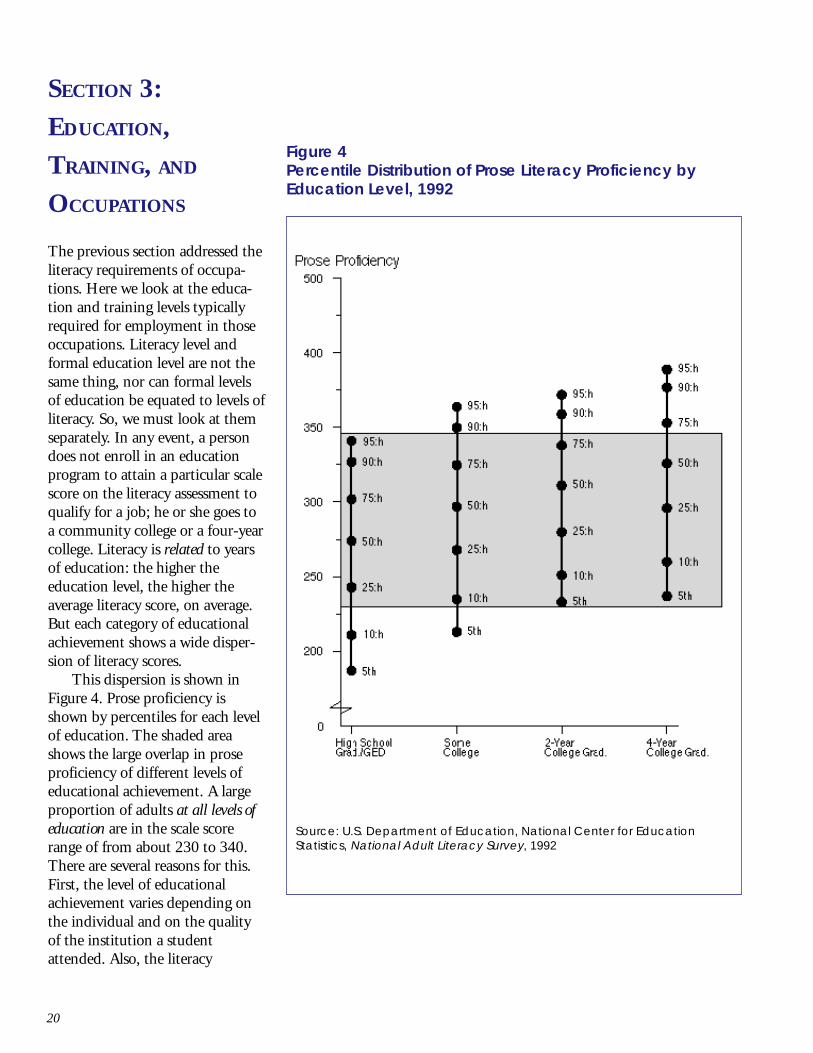
The previous section addressed theliteracy requirements of occupa-tions. Here we look at the educa-tion and training levels typicallyrequired for employment in thoseoccupations. Literacy level andformal education level are not thesame thing, nor can formal levelsof education be equated to levels ofliteracy. So, we must look at themseparately. In any event, a persondoes not enroll in an educationprogram to attain a particular scalescore on the literacy assessment toqualify for a job; he or she goes toa community college or a four-yearcollege. Literacy is related to yearsof education: the higher theeducation level, the higher theaverage literacy score, on average.But each category of educationalachievement shows a wide disper-sion of literacy scores.
This dispersion is shown inFigure 4. Prose proficiency isshown by percentiles for each levelof education. The shaded areashows the large overlap in proseproficiency of different levels ofeducational achievement. A largeproportion of adults at all levels ofeducation are in the scale scorerange of from about 230 to 340.There are several reasons for this.First, the level of educationalachievement varies depending onthe individual and on the qualityof the institution a studentattended. Also, the literacy
Figure 4Percentile Distribution of Prose Literacy Proficiency byEducation Level, 1992
Source: U.S. Department of Education, National Center for EducationStatistics, National Adult Literacy Survey, 1992
21
assessment measures proficiency inperforming day-to-day real-worldtasks, not proficiency with subject-matter material taught in schools.And different school subject areaswill produce different proficiencieson the prose, document, andquantitative literacy scales. Forexample, a person with a degree inmathematics is likely to do betteron the quantitative scale thanwould a student with a degree inart appreciation.
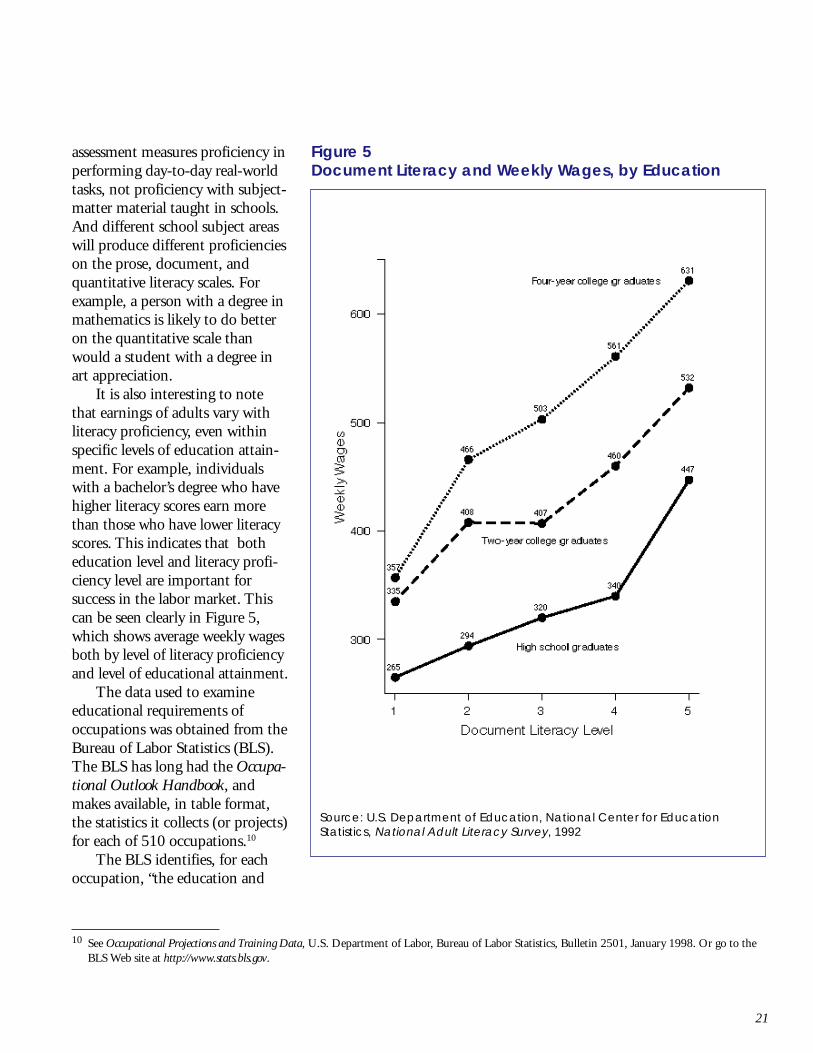
It is also interesting to notethat earnings of adults vary withliteracy proficiency, even withinspecific levels of education attain-ment. For example, individualswith a bachelor’s degree who havehigher literacy scores earn morethan those who have lower literacyscores. This indicates that botheducation level and literacy profi-ciency level are important forsuccess in the labor market. Thiscan be seen clearly in Figure 5,which shows average weekly wagesboth by level of literacy proficiencyand level of educational attainment.
The data used to examineeducational requirements ofoccupations was obtained from theBureau of Labor Statistics (BLS).The BLS has long had the Occupa-tional Outlook Handbook, andmakes available, in table format,the statistics it collects (or projects)for each of 510 occupations.10
The BLS identifies, for eachoccupation, “the education and
Figure 5Document Literacy and Weekly Wages, by Education
Source: U.S. Department of Education, National Center for EducationStatistics, National Adult Literacy Survey, 1992
10 See Occupational Projections and Training Data, U.S. Department of Labor, Bureau of Labor Statistics, Bulletin 2501, January 1998. Or go to theBLS Web site at http://www.stats.bls.gov.
22
training needed by most workersto become fully qualified.” Itshows the employment in thatoccupation in 1996, and projects itto 2006. Importantly, it also showsthe annual average job openings“due to growth plus total replace-ment needs,” as well as openingsdue to growth plus net replace-ment needs. According to the BLS,the first measure provides “thebroadest measure of opportunitiesand identifies the total number ofemployees needed annually toenter an occupation.” The analysesthis author has seen, of growth andeducational requirements, have allbeen of the average change in theemployment level, or “net newjobs,” rather than of job openingsthat come about from growth,turnover, and retirements. As wewill see, these are quite different,and it is the openings that areimportant—no one gets hired for a“net new job.”
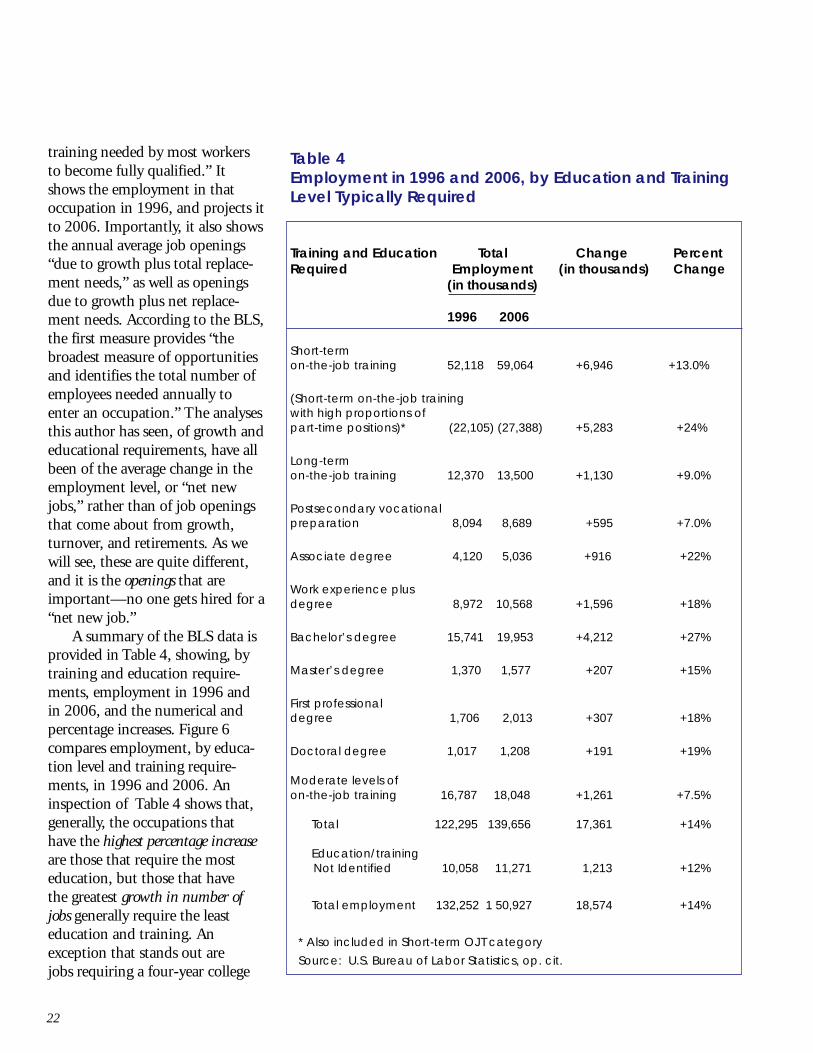
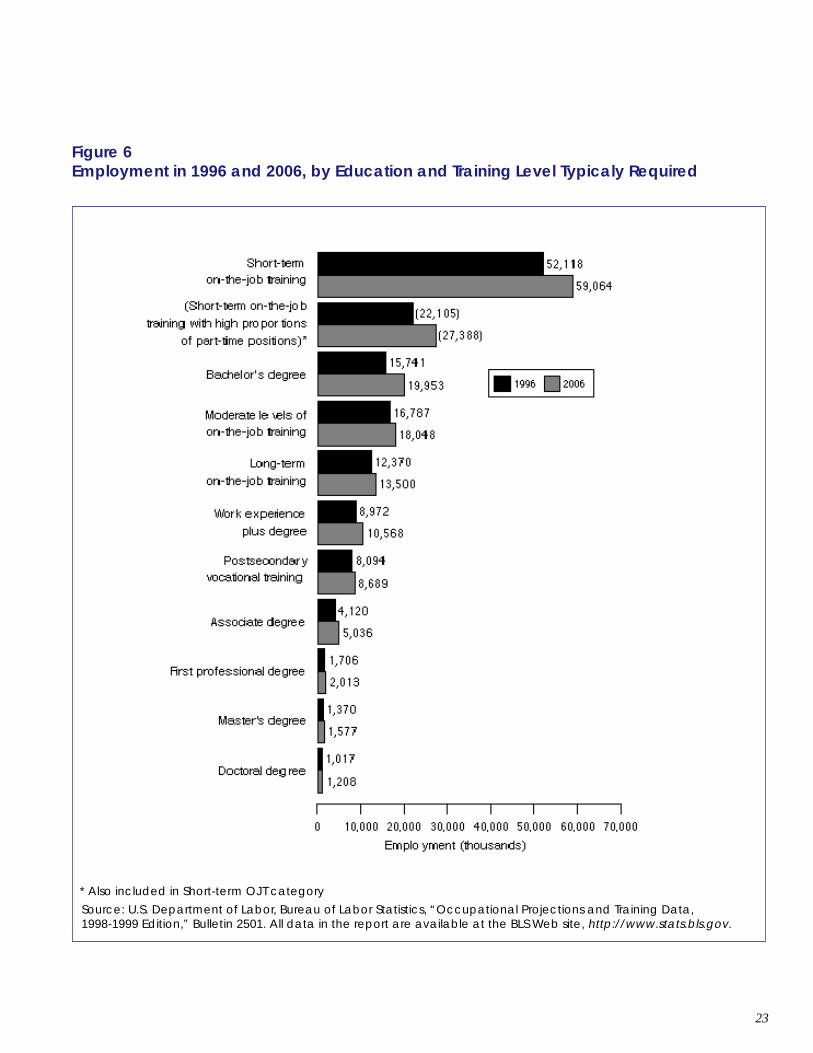
A summary of the BLS data isprovided in Table 4, showing, bytraining and education require-ments, employment in 1996 andin 2006, and the numerical andpercentage increases. Figure 6compares employment, by educa-tion level and training require-ments, in 1996 and 2006. Aninspection of Table 4 shows that,generally, the occupations thathave the highest percentage increaseare those that require the mosteducation, but those that havethe greatest growth in number ofjobs generally require the leasteducation and training. Anexception that stands out arejobs requiring a four-year college
Table 4Employment in 1996 and 2006, by Education and TrainingLevel Typically Required
Training and Education Total Change PercentRequired Employment (in thousands) Change
(in thousands)
1996 2006
Short-termon-the-job training 52,118 59,064 +6,946 +13.0%
(Short-term on-the-job trainingwith high proportions ofpart-time positions)* (22,105) (27,388) +5,283 +24%
Long-termon-the-job training 12,370 13,500 +1,130 +9.0%
Postsecondary vocationalpreparation 8,094 8,689 +595 +7.0%
Associate degree 4,120 5,036 +916 +22%
Work experience plusdegree 8,972 10,568 +1,596 +18%
Bachelor’s degree 15,741 19,953 +4,212 +27%
Master’s degree 1,370 1,577 +207 +15%
First professionaldegree 1,706 2,013 +307 +18%
Doctoral degree 1,017 1,208 +191 +19%
Moderate levels ofon-the-job training 16,787 18,048 +1,261 +7.5%
Total 122,295 139,656 17,361 +14%
Education/training Not Identified 10,058 11,271 1,213 +12%
Total employment 132,252 1 50,927 18,574 +14%
* Also included in Short-term OJT category
Source: U.S. Bureau of Labor Statistics, op. cit.
23
Figure 6Employment in 1996 and 2006, by Education and Training Level Typicaly Required
* Also included in Short-term OJT category
Source: U.S. Department of Labor, Bureau of Labor Statistics, “Occupational Projections and Training Data,1998-1999 Edition,” Bulletin 2501. All data in the report are available at the BLS Web site, http://www.stats.bls.gov.
24
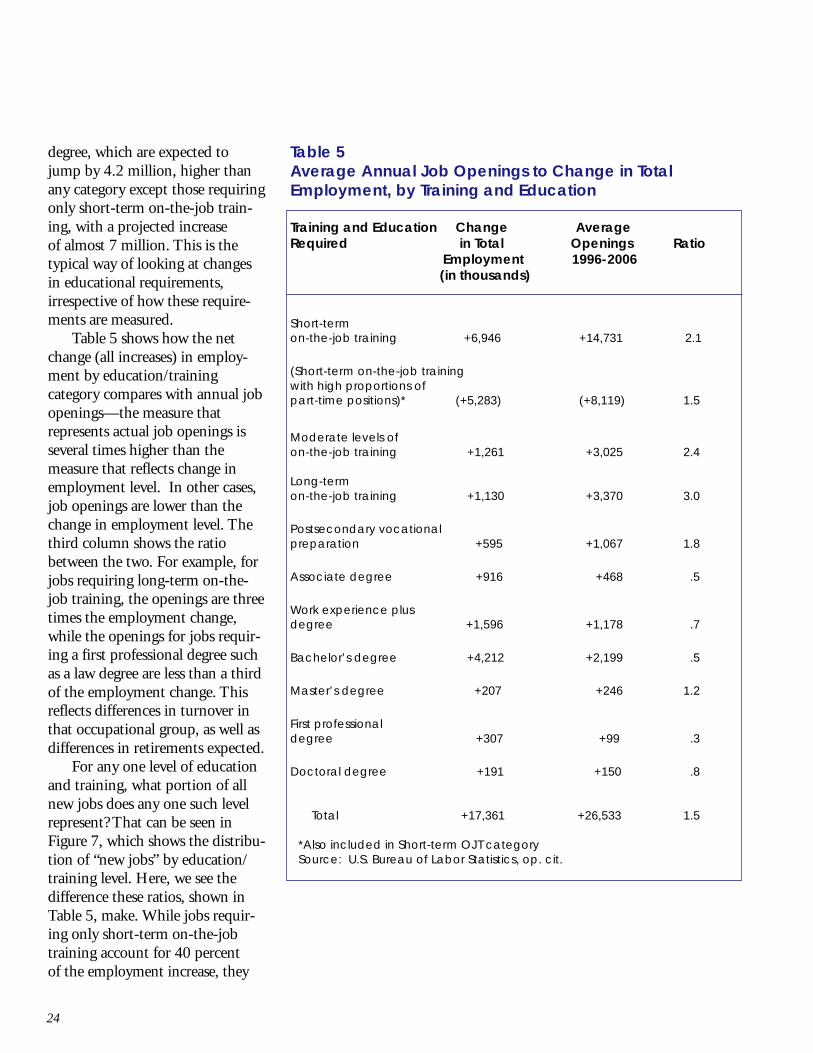
degree, which are expected tojump by 4.2 million, higher thanany category except those requiringonly short-term on-the-job train-ing, with a projected increaseof almost 7 million. This is thetypical way of looking at changesin educational requirements,irrespective of how these require-ments are measured.
Table 5 shows how the netchange (all increases) in employ-ment by education/trainingcategory compares with annual jobopenings—the measure thatrepresents actual job openings isseveral times higher than themeasure that reflects change inemployment level. In other cases,job openings are lower than thechange in employment level. Thethird column shows the ratiobetween the two. For example, forjobs requiring long-term on-the-job training, the openings are threetimes the employment change,while the openings for jobs requir-ing a first professional degree suchas a law degree are less than a thirdof the employment change. Thisreflects differences in turnover inthat occupational group, as well asdifferences in retirements expected.
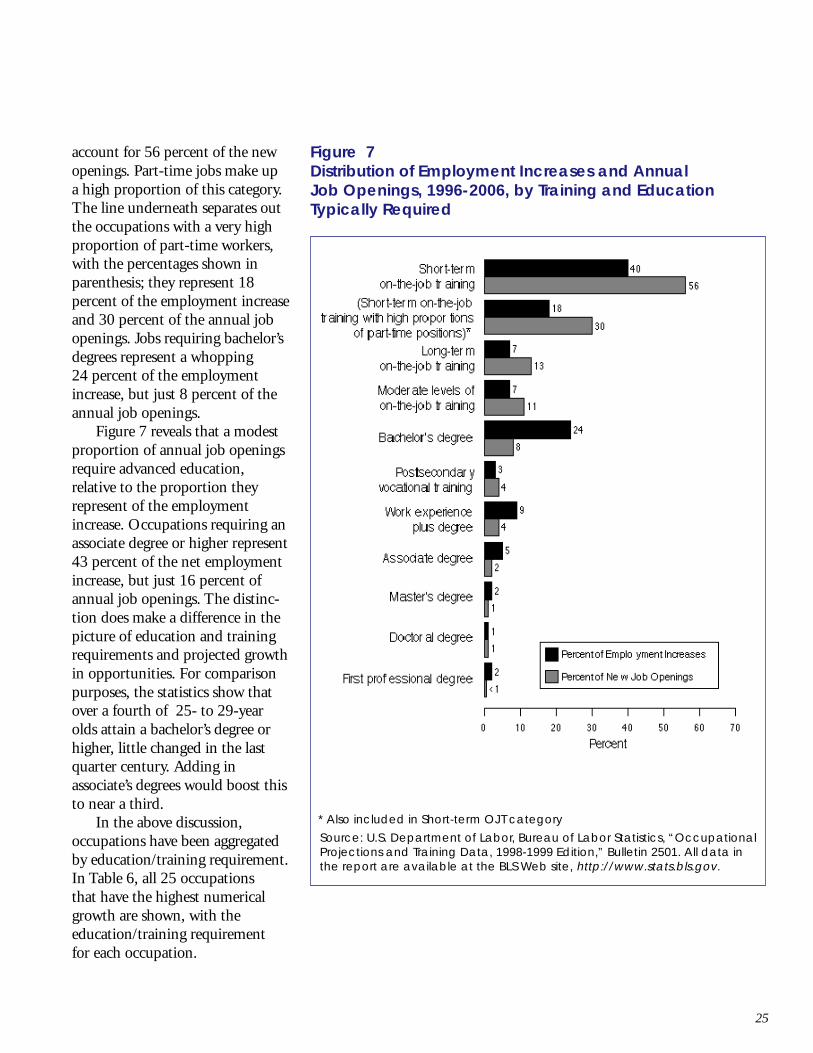
For any one level of educationand training, what portion of allnew jobs does any one such levelrepresent? That can be seen inFigure 7, which shows the distribu-tion of “new jobs” by education/training level. Here, we see thedifference these ratios, shown inTable 5, make. While jobs requir-ing only short-term on-the-jobtraining account for 40 percentof the employment increase, they
Table 5Average Annual Job Openings to Change in TotalEmployment, by Training and Education
Training and Education Change AverageRequired in Total Openings Ratio Employment 1996-2006
(in thousands)
Short-termon-the-job training +6,946 +14,731 2.1
(Short-term on-the-job trainingwith high proportions ofpart-time positions)* (+5,283) (+8,119) 1.5
Moderate levels ofon-the-job training +1,261 +3,025 2.4
Long-termon-the-job training +1,130 +3,370 3.0
Postsecondary vocationalpreparation +595 +1,067 1.8
Associate degree +916 +468 .5
Work experience plusdegree +1,596 +1,178 .7
Bachelor’s degree +4,212 +2,199 .5
Master’s degree +207 +246 1.2
First professionaldegree +307 +99 .3
Doctoral degree +191 +150 .8
Total +17,361 +26,533 1.5
*Also included in Short-term OJT categorySource: U.S. Bureau of Labor Statistics, op. cit.
25
account for 56 percent of the newopenings. Part-time jobs make upa high proportion of this category.The line underneath separates outthe occupations with a very highproportion of part-time workers,with the percentages shown inparenthesis; they represent 18percent of the employment increaseand 30 percent of the annual jobopenings. Jobs requiring bachelor’sdegrees represent a whopping24 percent of the employmentincrease, but just 8 percent of theannual job openings.
Figure 7 reveals that a modestproportion of annual job openingsrequire advanced education,relative to the proportion theyrepresent of the employmentincrease. Occupations requiring anassociate degree or higher represent43 percent of the net employmentincrease, but just 16 percent ofannual job openings. The distinc-tion does make a difference in thepicture of education and trainingrequirements and projected growthin opportunities. For comparisonpurposes, the statistics show thatover a fourth of 25- to 29-yearolds attain a bachelor’s degree orhigher, little changed in the lastquarter century. Adding inassociate’s degrees would boost thisto near a third.
In the above discussion,occupations have been aggregatedby education/training requirement.In Table 6, all 25 occupationsthat have the highest numericalgrowth are shown, with theeducation/training requirementfor each occupation.
* Also included in Short-term OJT category
Source: U.S. Department of Labor, Bureau of Labor Statistics, “OccupationalProjections and Training Data, 1998-1999 Edition,” Bulletin 2501. All data inthe report are available at the BLS Web site, http://www.stats.bls.gov.
Figure 7Distribution of Employment Increases and AnnualJob Openings, 1996-2006, by Training and EducationTypically Required
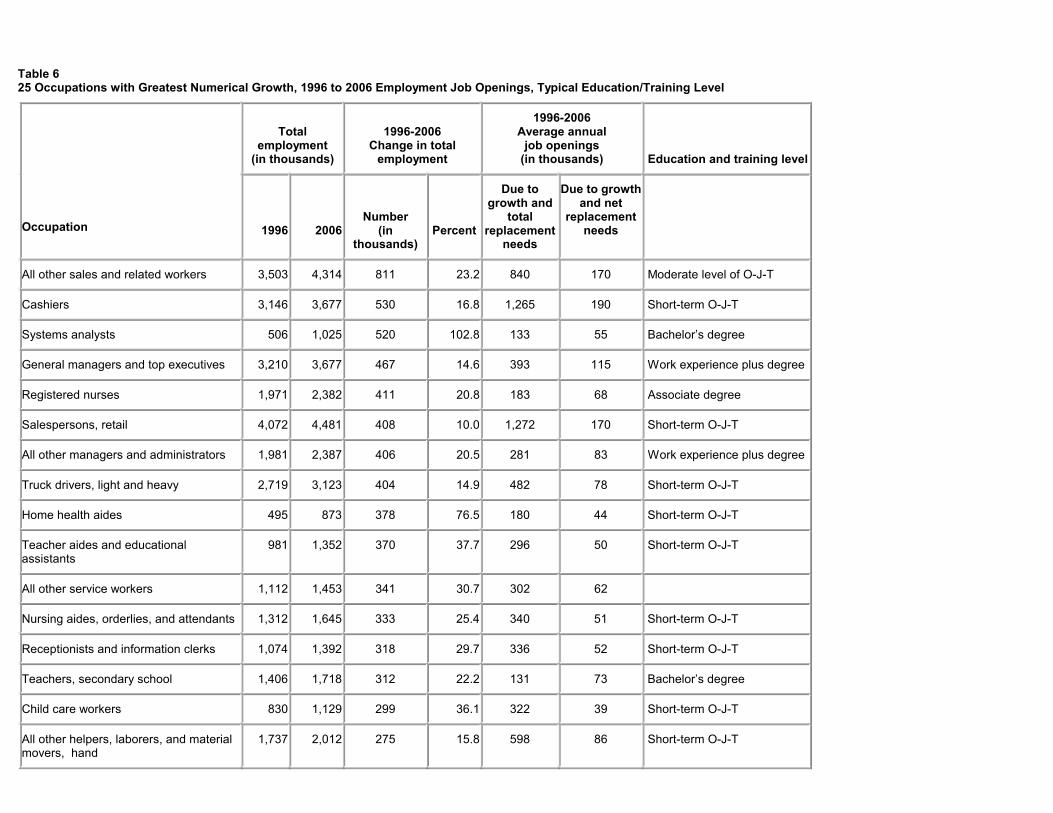
Table 6 25 Occupations with Greatest Numerical Growth, 1996 to 2006 Employment Job Openings, Typical Education/Training Level
Total
employment (in thousands)
1996-2006
Change in total employment
1996-2006 Average annual
job openings (in thousands)
Education and training level
Occupation
1996 2006
Number (in
thousands)
Percent
Due to growth and
total replacement
needs
Due to growth and net
replacement needs
All other sales and related workers 3,503 4,314 811 23.2 840 170 Moderate level of O-J-T
Cashiers 3,146 3,677 530 16.8 1,265 190 Short-term O-J-T
Systems analysts 506 1,025 520 102.8 133 55 Bachelor’s degree
General managers and top executives 3,210 3,677 467 14.6 393 115 Work experience plus degree
Registered nurses 1,971 2,382 411 20.8 183 68 Associate degree
Salespersons, retail 4,072 4,481 408 10.0 1,272 170 Short-term O-J-T
All other managers and administrators 1,981 2,387 406 20.5 281 83 Work experience plus degree
Truck drivers, light and heavy 2,719 3,123 404 14.9 482 78 Short-term O-J-T
Home health aides 495 873 378 76.5 180 44 Short-term O-J-T
Teacher aides and educational assistants
981 1,352 370 37.7 296 50 Short-term O-J-T
All other service workers 1,112 1,453 341 30.7 302 62
Nursing aides, orderlies, and attendants 1,312 1,645 333 25.4 340 51 Short-term O-J-T
Receptionists and information clerks 1,074 1,392 318 29.7 336 52 Short-term O-J-T
Teachers, secondary school 1,406 1,718 312 22.2 131 73 Bachelor’s degree
Child care workers 830 1,129 299 36.1 322 39 Short-term O-J-T
All other helpers, laborers, and material movers, hand
1,737 2,012 275 15.8 598 86 Short-term O-J-T
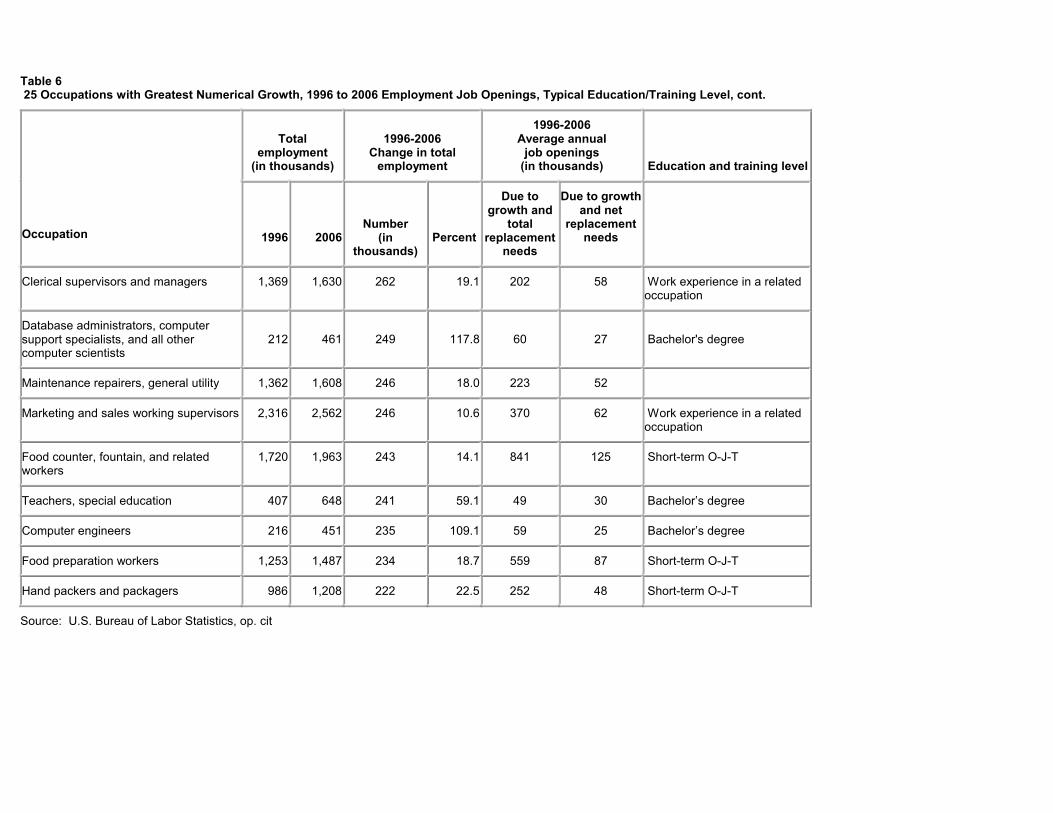
Table 6 25 Occupations with Greatest Numerical Growth, 1996 to 2006 Employment Job Openings, Typical Education/Training Level, cont.
Total
employment (in thousands)
1996-2006
Change in total employment
1996-2006 Average annual
job openings (in thousands)
Education and training level
Occupation
1996 2006
Number (in
thousands)
Percent
Due to growth and
total replacement
needs
Due to growth and net
replacement needs
Clerical supervisors and managers 1,369 1,630 262 19.1 202 58 Work experience in a related occupation
Database administrators, computer support specialists, and all other computer scientists
212 461
249 117.8
60
27
Bachelor's degree
Maintenance repairers, general utility 1,362 1,608 246 18.0 223 52
Marketing and sales working supervisors 2,316 2,562 246 10.6 370 62 Work experience in a related occupation
Food counter, fountain, and related workers
1,720 1,963 243 14.1 841 125 Short-term O-J-T
Teachers, special education 407 648 241 59.1 49 30 Bachelor’s degree
Computer engineers 216 451 235 109.1 59 25 Bachelor’s degree
Food preparation workers 1,253 1,487 234 18.7 559 87 Short-term O-J-T
Hand packers and packagers 986 1,208 222 22.5 252 48 Short-term O-J-T
Source: U.S. Bureau of Labor Statistics, op. cit
28
SECTION 4 :
LOOKING BACKWARD
The previous two sections addressthe present, the recent past, andthe future. What were the trendsbefore this? How have skill andeducation levels changed since, say,the World War II period? There arereasonably good answers to thosequestions, within the limitationsof the data sources available foranalysis. While in many respectsthe data available for that timeperiod is less adequate than recentdata, the sophistication of theanalysis at that time was moreadvanced than anything done since.
The principal work with whichwe will begin originated in adoctoral thesis by a student atHarvard, James G. Scoville, underthe supervision of his adviser, JohnT. Dunlop, who is known (amongmany other things) for his work onthe structure of jobs in firms andthe U.S. economy. Scoville setsout to develop a methodology foranalyzing the economy’s jobcontent,11 and begins with adefinition of job families andclusters formulated by Dunlop,for application at the factory level:
[It] is a stable group of job classifi-cations or work assignments withina firm ... which are so linkedtogether (a) by technology, (b) bythe administrative organization ofthe productive process, includingpolicies of transfer and promotions,or (c) by social custom that they
have common wage-makingcharacteristics.12
Scoville applies his methodol-ogy to the available data, althoughhis aim is to stimulate better datacollection and classification by theCensus Bureau that would be morereflective of job content.
Scoville started with a differentand expanded set of job familiesthan was used by the Census,trying to achieve more homoge-neous groupings. He arrived at thefollowing 15:
TOOLS
a. specializedb. non-specialized
MACHINES AND EQUIPMENT
a. specializedb. non-specialized
INSPECTION
VEHICLE OPERATION
FARMING
SALES
a. considerable knowledge of productb. little knowledge of product
CLERICAL
PERSONAL SERVICES
ENTERTAINMENT
PROTECTION
EDUCATION AND TRAINING
HEALTH SERVICES
WELFARE SERVICES
ADMINISTRATION AND
ORGANIZATION
RESEARCH AND DESIGN
Having done this, Scovilleasked the next question: “Cancontent levels be defined within[these] job families which are insome way comparable so they canbe summed across job families?”To do so, he would have todevelop a description of jobrequirements. And the only useful/available source for this informa-tion was an ambitious undertakingof the United States EmploymentService in its analysis of jobs drawnfrom its Dictionary of Occupa-tional Titles (DOT), and entitledEstimates of Worker Traits Charac-teristics for 4,000 Jobs, published in1956. The jobs were rated for anumber of characteristics, includ-ing aptitude, interests, tempera-ments, training time required(general and specific), as well aslevel of general education develop-ment. The 11 aptitudes referencedin this study included generalintelligence, verbal ability, numeri-cal ability, and spatial perception.
Scoville put these 4,000 jobsinto his revised classification ofCensus jobs. These characteristics,he thought, should be related to“the sorts of training, abilities,skills, and responsibilities forwhich wages are presumably thereward,” and he proceeded toestimate the market value for each
11 James G. Scoville, The Job Content of the U.S. Economy, 1940-1970, A Wertheim Committee publication, McGraw-Hill Book Company, 1969.
12 John T. Dunlop, “The task of contemporary theory,” in John T. Dunlop (ed.), The Theory of Wage Termination, London, Macmillan Co., 1957.
29
characteristic through a regressionof such requirements on 1960median occupational earnings.
The resulting analysis yieldedan explanation of 33 percent of thevariation in wages, and when otherrequirements were added (such asage—as proxy for experience—desired by employers, for example)the model explained about 60percent of the variation. This, then,became the basis for differentiatingjob content within job families,and permitted regrouping acrossjob families on the basis of esti-mated content levels. Scovilleregrouped the jobs into five levels.13
Further, Scoville applied hisestimating process to the occupa-tional projections for 1970, usingthose of the National PlanningAssociation. The following sum-mary table results.
13 Occupations with regression estimates more than three standard deviations above the mean were placed in Level I, and those more than threestandard deviations below were placed in Level V. Those between were divided roughly into three equal parts.
14 Richard S. Eckaus, “Economic criteria for education and training,” Review of Economics and Statistics, May 1964.
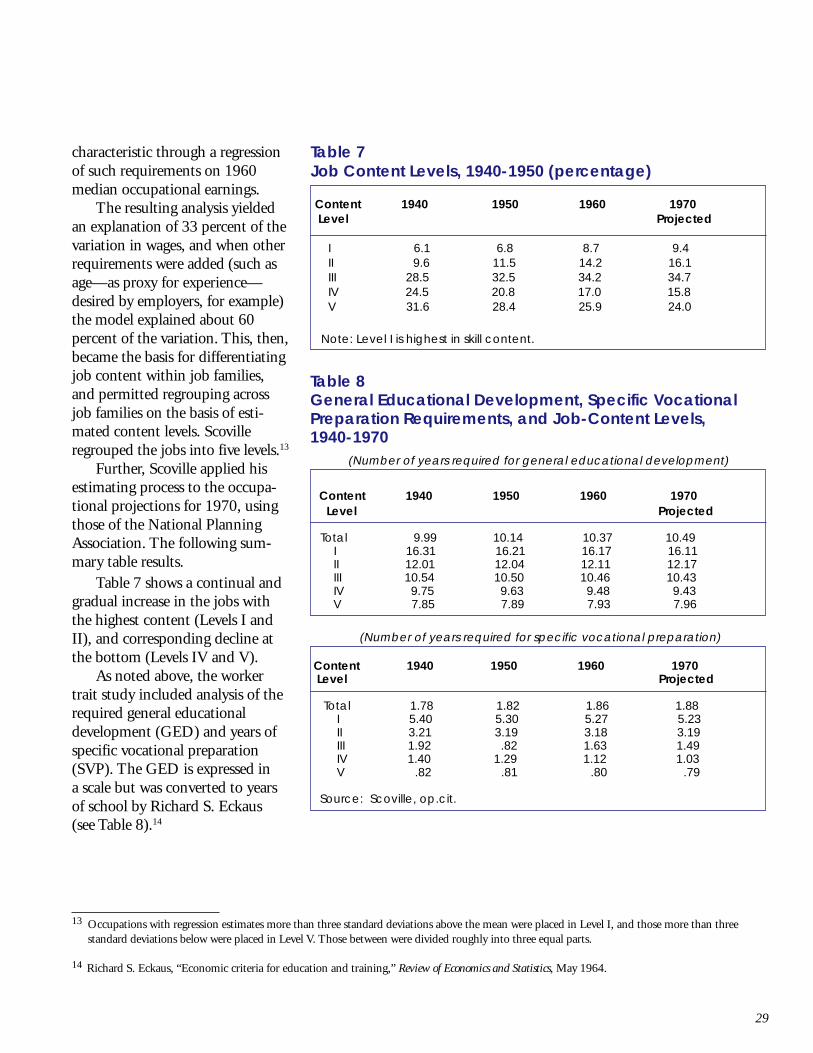
Table 7Job Content Levels, 1940-1950 (percentage)
Content 1940 1950 1960 1970 Level Projected
I 6.1 6.8 8.7 9.4 II 9.6 11.5 14.2 16.1 III 28.5 32.5 34.2 34.7 IV 24.5 20.8 17.0 15.8 V 31.6 28.4 25.9 24.0
Note: Level I is highest in skill content.
Table 7 shows a continual andgradual increase in the jobs withthe highest content (Levels I andII), and corresponding decline atthe bottom (Levels IV and V).
As noted above, the workertrait study included analysis of therequired general educationaldevelopment (GED) and years ofspecific vocational preparation(SVP). The GED is expressed ina scale but was converted to yearsof school by Richard S. Eckaus(see Table 8).14
Table 8General Educational Development, Specific VocationalPreparation Requirements, and Job-Content Levels,1940-1970
Content 1940 1950 1960 1970 Level Projected
Total 9.99 10.14 10.37 10.49 I 16.31 16.21 16.17 16.11 II 12.01 12.04 12.11 12.17 III 10.54 10.50 10.46 10.43 IV 9.75 9.63 9.48 9.43 V 7.85 7.89 7.93 7.96
Content 1940 1950 1960 1970 Level Projected
Total 1.78 1.82 1.86 1.88 I 5.40 5.30 5.27 5.23 II 3.21 3.19 3.18 3.19 III 1.92 .82 1.63 1.49 IV 1.40 1.29 1.12 1.03 V .82 .81 .80 .79
Source: Scoville, op.cit.
(Number of years required for specific vocational preparation)
(Number of years required for general educational development)
30
Again, we see a gradual rise inthe average education and trainingrequired for total employment,although there were generallydecreases within the five levels.The greater growth in the highercontent levels accounts for the risein the average, while a changingcomposition within the levelsaccounts for changes in averagesfor each level. Scoville-Eckausestimate an increase from 10 yearsof education required, on average,in 1940, to 10.5 years in 1970—a very modest rise. During thatgeneral period, the mean educa-tional attainment of men rosefrom 8.6 years to 12.0 years,and for women from 9.8 yearsto 12.1 years.
In the recent past, the mostwidely quoted study of changingeducational requirements of jobswas the 1987 report Workforce2000, by William B. Johnston andArnold H. Packer.15 Johnston andPacker performed an analysis usingthe GED scale used in the U.S.Department of Labor’s Dictionaryof Occupational Titles (DOT),marrying that information tooccupational data and projectionsprovided by the U.S. Bureau ofLabor Statistics. As is frequentlythe case in such presentations, theanalysis presented in the text ofWorkforce 2000 was of the mostrapidly growing (in percentageterms) and most rapidly decliningoccupations. In this respect, the
findings were similar to those inthis report that use the data fromthe National Adult Literacy Surveyand the Position Analysis Ques-tionnaire—that the fastest growingoccupations had higher require-ments than the declining ones.Workforce 2000 summed it up thisway: “Ranking of all jobs accordingto the skills required on a scale of 1to 6, with 6 being the highest levelof skill, indicated that the fastest-growing jobs require much highermath, language, and reasoningcapabilities than current jobs, whileslowly growing jobs require less.”
This author had looked closelyat the Workforce 2000 analysiswhen writing Workplace Competen-cies: The Need to Improve Literacyand Employment Readiness, withIrwin Kirsch.16 This work wascommissioned and publishedby the U.S. Department ofEducation’s Office of EducationalResearch and Improvement. Whilethe detailed results of the Workforce2000 analysis were not publishedin the report, they were available,and I requested and received them.The question was this: Was thisdifference in these fast-growingand fast-declining occupations, asmall percentage of total employ-ment, enough to make any sub-stantial difference in the totalpicture for all employment in theperiod from 1984 to 2000 (theperiod used in the Workforce 2000projections)? On a scale of 1 to 6
for educational developmentrequirements, the average for alljobs in 1984 was 3.0; for the year2000 it was projected to be 3.1,a difference so small as to be wellwithin the margin of error in theprojections, and in the measuresof educational requirements. Whilethis Hudson Institute report hasbeen frequently cited as sayingeducation requirements wereadvancing rapidly, the analysisitself was very consistent with thatperformed for this report; but noone seems to have looked at theunderlying analysis. The informa-tion provided about those fast-growing jobs is useful to have, evenif their numbers are relativelysmall, but it is important to havethe full picture.
In September 1988, theEmployment Standards Adminis-tration of the U.S. Department ofLabor issued a report titled Oppor-tunity 2000: Creative AffirmativeAction Strategies for a ChangingWorkforce, prepared for thedepartment by the Hudson Insti-tute. It states (p. 14) that “whilemost new jobs—especially those inthe fastest growing categories—willdemand much higher language,math and reasoning skills thanmany current jobs, the opposite istrue for slower-than-average-growth job categories.” Again, nomention of the overall employ-ment picture is made, noris there any mention that these
15 William B. Johnston and Arnold H. Packer, Workforce 2000, Indianapolis, Hudson Institute, 1987.
16 Workplace Competencies: The Need to Improve Literacy and Employment Readiness, Paul E. Barton and Irwin S. Kirsch, Office of EducationalResearch and Improvement, U.S. Department of Education, 1990.
31
requirements were estimated toremain unchanged. The citation isfrom the Workforce 2000 report.
The Workforce 2000 analysishas another characteristic thatmakes such a conclusion problem-atic. It looks at net changes inaverage employment, the differ-ence between the job growth andthe job decline. But no one gets a“net new job.” Job openings are afunction of turnover—of jobchangers, of those enteringthe labor force, and of thoseretiring from it. To look at jobopportunities one has to look atthe annual job openings becomingavailable, and then at the require-ments for these openings. This isthe approach in the BLS analysisof job preparation requirementsdescribed in the section above,titled, “Education, Training,and Occupations.”
In 1997, the Hudson Instituteupdated Workforce 2000 withWorkforce 2020.17 A similar analy-sis was performed, and concluded,“In short, shrinking occupationsoverwhelmingly require modestskills, but high skills are called forby a significant component of theexpanding occupations. The wordsof Workforce 2000 still ring true ...”No information was provided forthe entire workforce for this periodof time.
Russell W. Rumberger andHenry M. Levin have several timesexamined educational require-ments of jobs. In 1989, in School-ing for the Modern Workplace, theirprincipal conclusion was:
The average educational requirementof future jobs will not be significantlydifferent than current jobs, as bothhigh-skilled and low-skilled jobswill continue to exist in the futureeconomy.18
At various times over the past25 years, this author has examinedthe studies available, and con-cluded that a very gradual shiftwas likely taking place towardhigher requirements, but nothingdrastic. Comparison of these shiftsto the increasing educational-levelschooling of the populationsuggested no reason why adjust-ment would not be smooth, inthese terms, at least.19
17 Richard W. Judy and Carol D’Amico, Workforce 2020: Work and Workers in the 21st Century, Indianapolis, IN, Hudson Institute, 1997.
18 Schooling for the Modern Workplace, Russell W. Rumberger and Henry M. Levin, prepared for the U.S. Department of Labor, Commission onWorkplace Quality and Labor Market Efficiency, Washington, D.C., 1989.
19 Paul E. Barton, “Human Resources: The Changing Labor Market, and Undergraduate Education,” Liberal Education, May 1975. (Papers from the61st Annual Meeting of the Association of American Colleges.)

32
20 Laurie J. Bassi, “Are employers’ recruitment strategies changing?: Competence over credentials,” in Competence Without Credentials, Nevzer G.Stacey, Project Manager, U.S. Department of Education, March 1999.
SECTION: 5
PUTTING IT IN CONTEXT
One of the largest limitations of allthe studies presented or cited inthis report is that they are dealingwith the effect of compositionalshifts among occupations. As wasdiscussed in Section 2, these shiftsdo not affect changes in literacyrequirements within an occupationover time. Similarly, examinationsof small sectors of the workforcecannot disclose what is happeningin the entire workforce. Observingthese trends over the years, onegets the impression that some jobschange to require more knowledgeand skills, some change to requireless, and some change their require-ments very little. And for someworkforce sectors, work taskswithin an occupation may get morecomplex, while others get simpler.
For example, a clerk in a drugstore in the 1940s would havefound the items for a customer,added their prices by hand, andcomputed the tax and the change.The money that paid for the salemay have to gone into differentdrawers in the cash register. Thisauthor, when a clerk in such a drugstore, also checked in the dailyorder from the wholesaler and putthe retail price on the item. Themarkup was “one-third of theselling price,” which the clerk (thisauthor) was expected to calculate.These exercises, particularly thelast one, would be fairly high onthe quantitative literacy scale. In
the 1990s, the customer finds themerchandise, the scanner auto-matically inventories the item andregisters its price, and the cashregister computes the change. At aMcDonald’s the counter personpushes buttons on the cash registerthat have pictures of the items. AtJewell food market in Illinois, thecash register (not the clerk) says,“Thank you, have a nice day.”
Secretaries now have to knowhow to use a personal computerand understand word-processingsoftware, and are expected to learnever-changing versions of softwarepackages, or to learn differentword-processing programs. But thecomputer does the spell checking,and more bosses are entering theirown drafts into the computerrather than dictating to a secretary.Maintenance repairers are likelydealing with much more complexequipment—a touchy copyingmachine or an appliance full ofcomputer chips—and with tech-nology that is constantly changing.Conversely, one of the occupationswith the highest growth in num-bers, truck drivers, probably takesno more time to learn today thanit did 20 years ago.
Further, it is one thing toanalyze an occupation throughtraditional job analysis techniques.It is another to determine whatemployers are actually looking for.An example is Laurie Bassi’s pointthat “it is not clear whetheremployers are increasingly relying
on education credentials as amethod of screening for the skillsthey need, or whether these cre-dentials are merely a proxy forincreasing importance for somenecessary skill (perhaps the abilityto learn quickly).”20
A lot of attention has beengiven to the trend of constantlyrising skill requirements. It is arefrain heard over and over again.But since the industrial revolution,there has also been a trend ofde-skilling jobs. The computerchip is likely skilling some jobsand de-skilling others. I see littleevidence that one of these trendshas predominated over the pastseveral decades.
Of course, when job require-ments change drastically as a resultof technological or other changes,the name of the occupation itselfoften changes. Some occupationsdisappear while others are created.All in all, it is not at all a simplematter to track the education andtraining requirements for entryinto the U.S. workforce. We doknow that in the past severaldecades there have been largeincreases in the total number ofbachelor’s degrees conferred, morethan doubling since 1965, andrising by almost a fourth since1975. In the same period, awardsof associate degrees advancedfivefold, from more than 100thousand to more than 500thousand. Since 1975, the propor-tion of all adults with four years of
33
21 John K. Folger and Charles B. Nam, “Trends in education in relation to occupational structure,” Sociology of Education, Fall 1964, p.p. 19-33.
22 Douglas Adkins, “The American educated labor force: An empirical look at theories of its formulation and composition,” Higher Education and theLabor Market, Margaret Gordon, ed. Carnegie Commission on Higher Education.
23 Daniel E. Hecker, “Reconciling conflicting data on jobs for college graduates,” Monthly Labor Review, July 1992.
24 John Tyler, Richard J. Murname, and Frank Levy, “Are more college graduates really taking ‘high school’ jobs?” Monthly Labor Review, December1995.
25 A commentary by Daniel Hecker, Monthly Labor Review, December 1995.
high school or more has risen from63 percent to over 80 percent.The economy has absorbed theincreases. While we will make noattempt here to match educationalattainment and job requirementsover this long period in any preciseway—a task fraught with difficul-ties and pitfalls—we will makesome observations.
In this process of absorption,what has been happening, decadeby decade, is that more people withhigher levels of education are inoccupations that in the priordecade were occupied by thosewith less education. So collegegraduates are in occupationsformerly occupied by high schoolgraduates, and high school gradu-ates are in jobs formerly occupiedby people without a high schooldiploma. This trend was observedby demographers John Folger andCharles Nam in 1964.21 A decadelater, Douglas Adkins found that“if we take the 1940 level ofeducational attainment in indi-vidual occupations and (roughly)calculate the proportion of thetotal number of male collegegraduates in 1969 that would beneeded to meet 1940 educationalattainment standards for occupa-tions, we will account for only
45% of the stock of male collegegraduates in 1969.”22
It is relatively simple to lookat occupational titles and see thatpeople in those occupations inprior years had less educationalattainment than those in lateryears. But we don’t know whetherskill requirements for some ofthose jobs rose, or whether themore highly educated workerswere more productive and there-fore paid more. In the mid-1990san attempt was made by Daniel E.Hecker, of the U.S. Bureau ofLabor Statistics, to examine suchtrends, from 1970 to 1990. Hepointed out, “It is not possible toprecisely identify and measure thenumber of jobs that require acollege degree.” To make hisestimates, he used surveys thatasked workers what level of educa-tion they needed to qualify fortheir current jobs. In his analysis,he concluded that the percent ofcollege graduates who were eitherin jobs that “do not require acollege degree or are unemployed”rose from 11.7 percent in 1967 to19.9 percent in 1990. He asks, “Ifas some analysts contend, therising relative wages of collegegraduates in the 1980s suggest ashortage of these workers, why did
one-fifth of them accept jobs thattraditionally don’t require a degreefor entry?”23
In 1995, John Tyler, RichardMurname, and Frank Levyresponded with an analysis thatincluded a re-analysis of the dataHeckman had used. They con-tested his claim that the demandfor college graduates was weak inthe 1980s, finding that the increasein taking jobs with less thancollege requirements had mostlyoccurred in the 1970s, when theeconomy was absorbing collegegraduates of the baby boom.From this and analysis of incomechanges, they concluded that “thelabor market of the 1980s success-fully absorbed new college gradu-ates, even as the overall collegelabor supply rose by 60 percent.”24
In his reply, Hecker pointed outsome problems he had with thedata Tyler, et al. used, but notedthat they had agreed that about 25percent of young college graduateswere taking such jobs, and asked,“given the high and rising relativeearnings of college graduates, whydo so many end up taking lowerlevel jobs?”25
Not only has the economyabsorbed the increasing numberof college graduates, these college
34
26 Lawrence Mishel, Jared Bernstein, and John Schmidt, The State of Working America 1996-97, Armonk, M.E. Sharpe, Inc., 1997 (reproduced inLaurie J. Bassi, 1999, op cit).
27 Donna Desrochers, personal correspondence, September 24, 1999 (using March CPA data in the U.S. Census Bureau Historical Income Table).
28 Laurie J. Bassi, op. cit.
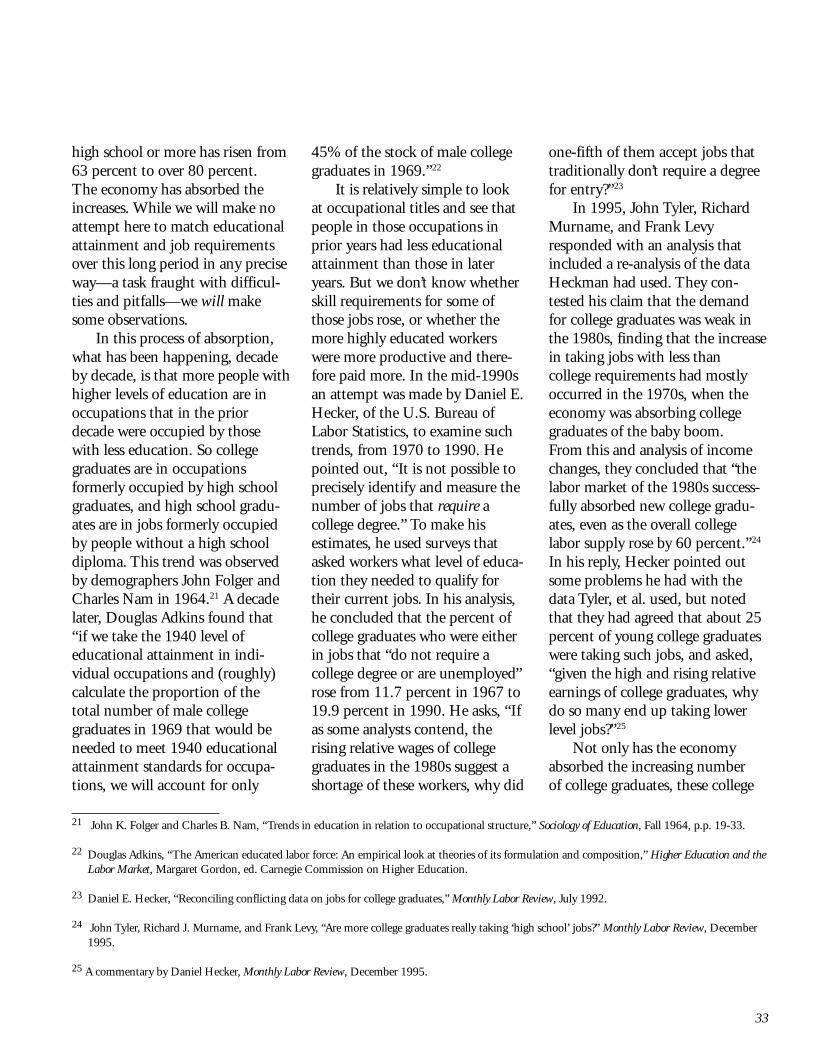
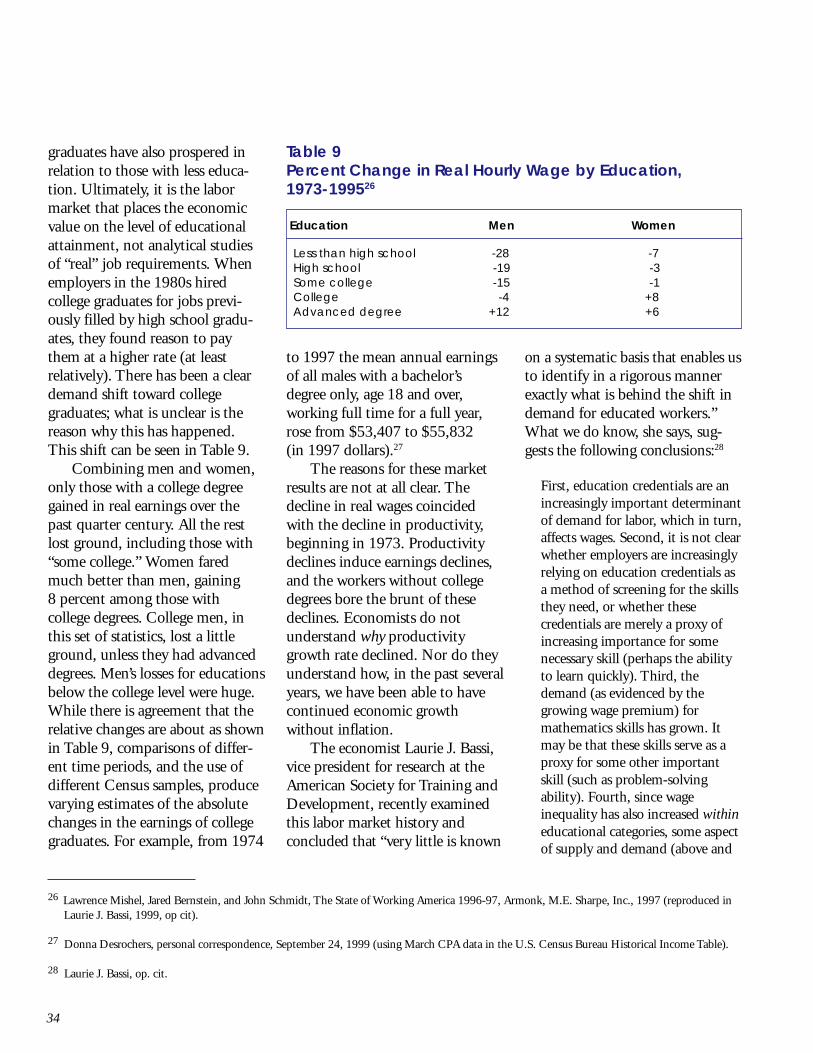
Table 9Percent Change in Real Hourly Wage by Education,1973-199526
Education Men Women
Less than high school -28 -7High school -19 -3Some college -15 -1College -4 +8Advanced degree +12 +6
graduates have also prospered inrelation to those with less educa-tion. Ultimately, it is the labormarket that places the economicvalue on the level of educationalattainment, not analytical studiesof “real” job requirements. Whenemployers in the 1980s hiredcollege graduates for jobs previ-ously filled by high school gradu-ates, they found reason to paythem at a higher rate (at leastrelatively). There has been a cleardemand shift toward collegegraduates; what is unclear is thereason why this has happened.This shift can be seen in Table 9.
Combining men and women,only those with a college degreegained in real earnings over thepast quarter century. All the restlost ground, including those with“some college.” Women faredmuch better than men, gaining8 percent among those withcollege degrees. College men, inthis set of statistics, lost a littleground, unless they had advanceddegrees. Men’s losses for educationsbelow the college level were huge.While there is agreement that therelative changes are about as shownin Table 9, comparisons of differ-ent time periods, and the use ofdifferent Census samples, producevarying estimates of the absolutechanges in the earnings of collegegraduates. For example, from 1974
to 1997 the mean annual earningsof all males with a bachelor’sdegree only, age 18 and over,working full time for a full year,rose from $53,407 to $55,832(in 1997 dollars).27
The reasons for these marketresults are not at all clear. Thedecline in real wages coincidedwith the decline in productivity,beginning in 1973. Productivitydeclines induce earnings declines,and the workers without collegedegrees bore the brunt of thesedeclines. Economists do notunderstand why productivitygrowth rate declined. Nor do theyunderstand how, in the past severalyears, we have been able to havecontinued economic growthwithout inflation.
The economist Laurie J. Bassi,vice president for research at theAmerican Society for Training andDevelopment, recently examinedthis labor market history andconcluded that “very little is known
on a systematic basis that enables usto identify in a rigorous mannerexactly what is behind the shift indemand for educated workers.”What we do know, she says, sug-gests the following conclusions:28
First, education credentials are anincreasingly important determinantof demand for labor, which in turn,affects wages. Second, it is not clearwhether employers are increasinglyrelying on education credentials asa method of screening for the skillsthey need, or whether thesecredentials are merely a proxy ofincreasing importance for somenecessary skill (perhaps the abilityto learn quickly). Third, thedemand (as evidenced by thegrowing wage premium) formathematics skills has grown. Itmay be that these skills serve as aproxy for some other importantskill (such as problem-solvingability). Fourth, since wageinequality has also increased withineducational categories, some aspectof supply and demand (above and
35
beyond educational credentials) isat work in the labor market. Thiscould be some unmeasured compe-tencies. Or it could be luck. Or itcould be something else. Fifth, theuse of computers is likely to be animportant part of the “somethingelse.” Finally, it is simultaneouslytrue that both educational creden-tials and something beyondeducational credentials havebecome increasingly important indetermining employers” demandfor workers, and therefore, thewages that workers earn. It is likelythat both competence and creden-tials are increasingly in demandby employers.
To add to the puzzlement, thefavorable treatment of those with acollege degree has not resulted in ahigher proportion of young peoplegetting one. There may have beena shift in demand, but it is hard tosee that demand, overall, has beenrising. After all, we are doing littlemore than maintaining realwages for college graduates, notincreasing them, which would beexpected if there was a growingdemand. True, more young peoplehave been enrolling in college, butmore have not been completingcollege, at least until the pastcouple of years. This can be seenin Figure 8. For the past quartercentury, the figures for thosegetting a four-year college degreeor better have remained stable.Around a quarter of 20- to 29-year-olds have been getting four-year degrees, or better, after asustained period of increase.(However, there has been a slightincrease recently, from 25 percent
in 1995 to 27 percent in 1996 andto 28 percent in 1997, suggestingsome responses to earlier increasesin relative earnings.) Moreover, theproportion of those getting at leasta high school education has alsobeen stable for this period of time,after rising throughout our history.In the 1990s, the high schoolcompletion rate, in terms ofgetting a diploma in four years atage 17 or 18, has actually fallen.With so little understanding ofwhy the demand for education isbehaving as it is, and with nodiscernable shift toward occupa-tions that require higher literacyor education, we need to becautious about predicting thefuture. About all we can say is thatin the recent past earnings ofcollege graduates have exceededearning of those with less educa-tion by wider margins.
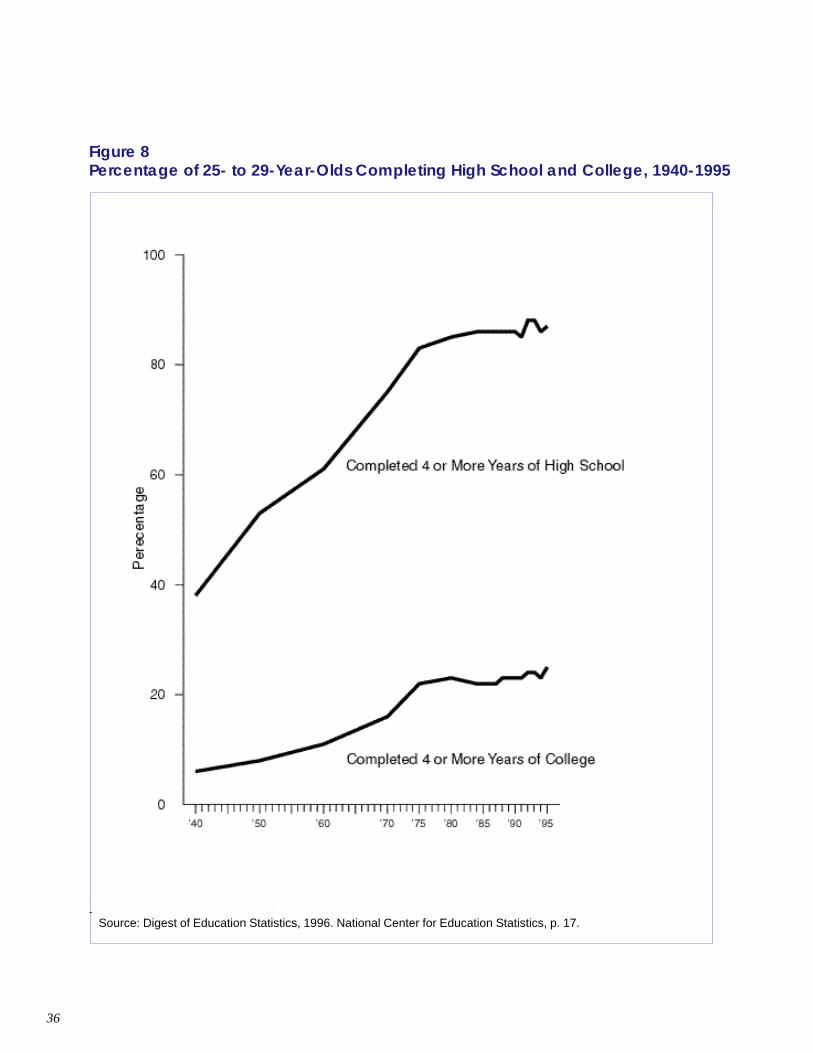
36
Source: Digest of Education Statistics, 1996. National Center for Education Statistics, p. 17.
Figure 8Percentage of 25- to 29-Year-Olds Completing High School and College, 1940-1995

37
SECTION 6:
THE BOTTOM LINE
Literacy, 1986 to 2006
� While the fastest-growing jobs, interms of percentage increases,have higher literacy requirementsthan those decreasing, thenumbers are relatively small.However, it is in these growingareas that new opportunities arebeing created for young labormarket entrants.
� The largest growth in termsof numbers of jobs is in occupa-tions with slightly lower averageliteracy requirements than for all“occupations.” Literacy require-ments for these 25 growingoccupations is about the same asthe 25 with the greatest declinein numbers.
� Those occupations with thehighest literacy requirementsand those with the lowest areboth growing at rates well abovethe average, resulting in littlenet effect on overall literacyrequirements.
� Averaging all occupations, theliteracy requirements in 1986,1996, and 2006 were the same.This reflects taking into accountchanges in the distribution ofoccupations, due to differencesin their relative growth. How-ever, with the fastest-growingoccupations having literacyrequirements higher than thosedeclining, the bias, over longperiods of time, is likely towardincreasing skill requirements.
� Literacy requirements areexamined from the standpointof changes resulting fromdifferent growth patterns amongoccupations. Information aboutthe net effect of changes withinoccupations is not available.
Education and Training,1984 to 2006
� Estimates were published in1988 showing that averageGeneral Education Develop-ment, on a scale of 1 to 6,would be 3.0 in 1984 and 3.1in 2000, basically unchanged.However, as was found inliteracy, the occupations with
the highest growth, in percent-age terms, had higher thanaverage education requirements.
� While past studies have looked atprojections of average employ-ment, the more useful approachis using annual job openings,taking into account growth,turnover, and retirements.
� The distribution of the increasein annual job openings, from1996 to 2006, by the levelof preparation required (asjudged by the Bureau of LaborStatistics) is detailed in thechart below:
Level of education required Percentage of increase in job openings, 1996-2006
Short-term on-the-job training 56%
Long-term on-the-job training 13%
Moderate-term on-the-job training 11%
Bachelor’s degree 8%
Postsecondary vocational training 4%
Work experience plus degree 4%
Associate degree 2%
Master’s degree 1%
Doctoral degree 1%
First professional degree <1%
Total 100%
(According to Bureau of Labor Statistics)
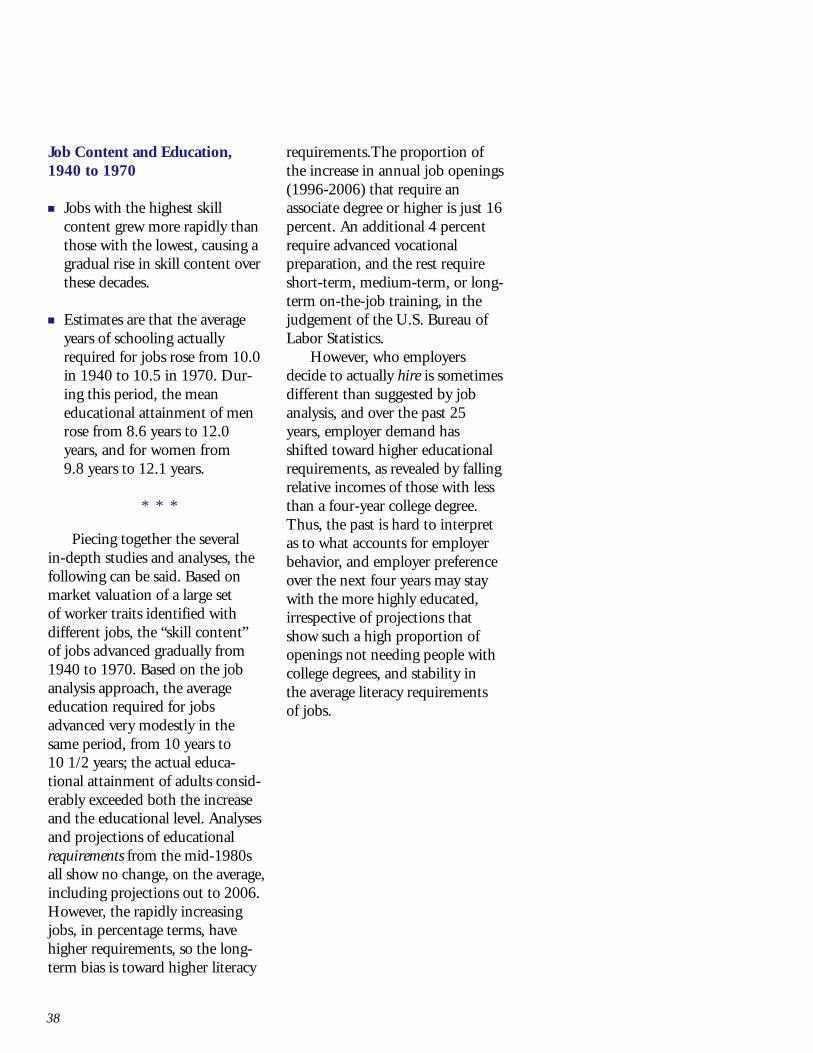
38
Job Content and Education,1940 to 1970
� Jobs with the highest skillcontent grew more rapidly thanthose with the lowest, causing agradual rise in skill content overthese decades.
� Estimates are that the averageyears of schooling actuallyrequired for jobs rose from 10.0in 1940 to 10.5 in 1970. Dur-ing this period, the meaneducational attainment of menrose from 8.6 years to 12.0years, and for women from9.8 years to 12.1 years.
* * *
Piecing together the severalin-depth studies and analyses, thefollowing can be said. Based onmarket valuation of a large setof worker traits identified withdifferent jobs, the “skill content”of jobs advanced gradually from1940 to 1970. Based on the jobanalysis approach, the averageeducation required for jobsadvanced very modestly in thesame period, from 10 years to10 1/2 years; the actual educa-tional attainment of adults consid-erably exceeded both the increaseand the educational level. Analysesand projections of educationalrequirements from the mid-1980sall show no change, on the average,including projections out to 2006.However, the rapidly increasingjobs, in percentage terms, havehigher requirements, so the long-term bias is toward higher literacy
requirements.The proportion ofthe increase in annual job openings(1996-2006) that require anassociate degree or higher is just 16percent. An additional 4 percentrequire advanced vocationalpreparation, and the rest requireshort-term, medium-term, or long-term on-the-job training, in thejudgement of the U.S. Bureau ofLabor Statistics.
However, who employersdecide to actually hire is sometimesdifferent than suggested by jobanalysis, and over the past 25years, employer demand hasshifted toward higher educationalrequirements, as revealed by fallingrelative incomes of those with lessthan a four-year college degree.Thus, the past is hard to interpretas to what accounts for employerbehavior, and employer preferenceover the next four years may staywith the more highly educated,irrespective of projections thatshow such a high proportion ofopenings not needing people withcollege degrees, and stability inthe average literacy requirementsof jobs.

39
APPENDIX A:
DETAILED TABLE SHOWING PROSE,
DOCUMENT, AND QUANTITATIVE
LITERACY BY OCCUPATION FOR,
1986, 1999, AND PROJECTED
TO 2006
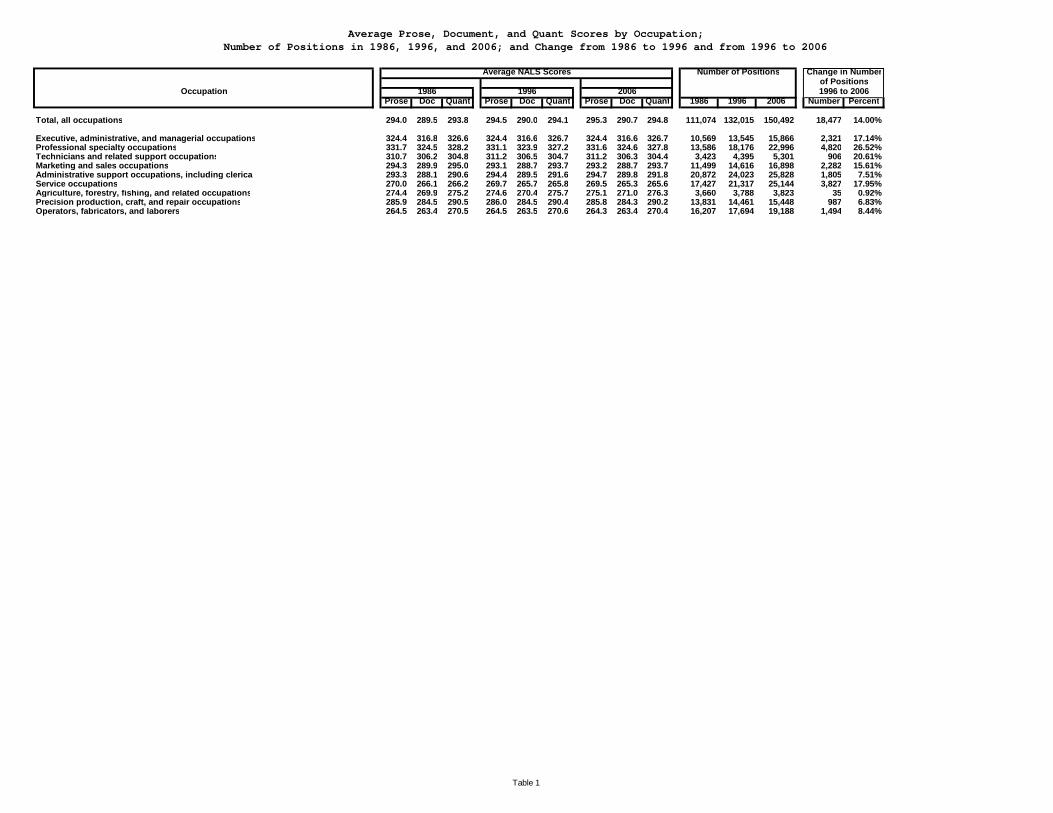
Average Prose, Document, and Quant Scores by Occupation;Number of Positions in 1986, 1996, and 2006; and Change from 1986 to 1996 and from 1996 to 2006
Average NALS Scores Number of Positions Change in Numberof Positions
Occupation 1986 1996 2006 1996 to 2006Prose Doc Quant Prose Doc Quant Prose Doc Quant 1986 1996 2006 Number Percent
Total, all occupations 294.0 289.5 293.8 294.5 290.0 294.1 295.3 290.7 294.8 111,074 132,015 150,492 18,477 14.00%
Executive, administrative, and managerial occupations 324.4 316.8 326.6 324.4 316.6 326.7 324.4 316.6 326.7 10,569 13,545 15,866 2,321 17.14%Professional specialty occupations 331.7 324.5 328.2 331.1 323.9 327.2 331.6 324.6 327.8 13,586 18,176 22,996 4,820 26.52%Technicians and related support occupations 310.7 306.2 304.8 311.2 306.5 304.7 311.2 306.3 304.4 3,423 4,395 5,301 906 20.61%Marketing and sales occupations 294.3 289.9 295.0 293.1 288.7 293.7 293.2 288.7 293.7 11,499 14,616 16,898 2,282 15.61%Administrative support occupations, including clerical 293.3 288.1 290.6 294.4 289.5 291.6 294.7 289.8 291.8 20,872 24,023 25,828 1,805 7.51%Service occupations 270.0 266.1 266.2 269.7 265.7 265.8 269.5 265.3 265.6 17,427 21,317 25,144 3,827 17.95%Agriculture, forestry, fishing, and related occupations 274.4 269.9 275.2 274.6 270.4 275.7 275.1 271.0 276.3 3,660 3,788 3,823 35 0.92%Precision production, craft, and repair occupations 285.9 284.5 290.5 286.0 284.5 290.4 285.8 284.3 290.2 13,831 14,461 15,448 987 6.83%Operators, fabricators, and laborers 264.5 263.4 270.5 264.5 263.5 270.6 264.3 263.4 270.4 16,207 17,694 19,188 1,494 8.44%
Table 1

Average Prose, Document, and Quant Scores by Occupation;Number of Positions in 1986, 1996, and 2006; and Change from 1986 to 1996 and from 1996 to 2006
Average NALS Scores Number of Positions Change in Numberof Positions
Occupation 1986 1996 2006 1996 to 2006Prose Doc Quant Prose Doc Quant Prose Doc Quant 1986 1996 2006 Number Percent
Executive, administrative, and managerial occupations 324.4 316.8 326.6 324.4 316.6 326.7 324.4 316.6 326.7 10,569 13,545 15,866 2,321 17.14%Managerial and administrative occupations 324.0 315.0 327.3 324.2 315.1 327.5 324.3 315.2 327.5 7,374 9,541 11,262 1,721 18.04%Management support occupations 325.2 320.5 325.0 324.7 319.9 324.9 324.6 319.7 324.8 3,195 4,004 4,604 600 14.99%
Professional specialty occupations 331.7 324.5 328.2 331.1 323.9 327.2 331.6 324.6 327.8 13,586 18,176 22,996 4,820 26.52%Engineers 340.6 335.0 353.3 340.6 335.0 353.2 340.8 335.1 353.4 1,378 1384 1633 249 17.99%Architects and surveyors 335.5 325.0 339.9 335.9 325.4 340.2 336.1 325.1 340.1 191 212 232 20 9.43%Life scientists 368.5 364.0 359.5 368.5 364.0 359.5 368.5 364.0 359.5 155 180 220 40 22.22%Computer, mathematical, and operations research occupations 347.0 345.4 348.9 347.6 345.6 349.3 347.5 345.8 349.3 ~ 1,030 2,038 1,008 97.86%Physical scientists 315.1 311.7 319.7 314.7 311.3 319.1 314.5 311.1 318.7 192 207 242 35 16.91%Social scientists 335.2 328.6 335.1 335.3 328.7 335.3 335.2 328.6 335.2 ~ 264 288 24 9.09%Social, recreational, and religious workers 322.6 315.0 320.6 322.5 314.8 320.2 322.8 315.1 320.5 ~ 1,469 1,939 470 31.99%Lawyers and judicial workers 347.0 340.5 347.5 347.0 340.5 347.5 347.0 340.5 347.5 ~ 700 820 120 17.14%Teachers, librarians, and counselors 330.7 321.8 323.8 330.4 321.5 323.8 330.1 321.2 323.5 4,949 6,566 7,914 1,348 20.53%Health diagnosing occupations 349.0 341.0 348.0 349.0 341.0 348.0 349.0 341.0 348.0 ~ 876 1037 161 18.38%Health assessment and treating occupations 321.8 315.1 308.3 321.6 314.7 307.9 321.5 314.6 307.7 1,819 2,684 3,392 708 26.38%Writers, artists, and entertainers 326.8 321.5 327.3 326.2 320.9 326.4 326.2 320.8 326.3 ~ 1,724 2,137 413 23.96%All other professional workers 320.3 312.3 313.3 320.3 312.3 313.3 320.3 312.3 313.3 ~ 880 1,104 224 25.45%
Technicians and related support occupations 310.7 306.2 304.8 311.2 306.5 304.7 311.2 306.3 304.4 3,423 4,395 5,301 906 20.61%Health technicians and technologists 303.4 294.6 290.9 304.9 296.1 292.3 305.4 296.6 292.8 1,598 2,300 2,872 572 24.87%Engineering and science technicians and technologists 311.5 309.7 311.4 310.9 309.1 310.7 310.8 309.0 310.6 1,037 1,007 1,085 78 7.75%Technicians, except health and engineering and science 325.2 325.9 324.1 325.5 326.0 324.3 325.3 326.0 324.1 788 1,088 1,344 256 23.53%
Marketing and sales occupations 294.3 289.9 295.0 293.1 288.7 293.7 293.2 288.7 293.7 11,499 14,616 16,898 2,282 15.61%
Administrative support occupations, including clerical 293.3 288.1 290.6 294.4 289.5 291.6 294.7 289.8 291.8 20,872 24,023 25,828 1,805 7.51%Adjusters, investigators, and collectors 306.6 305.5 308.2 304.1 302.4 305.3 303.1 301.1 304.4 735 1,284 1,607 323 25.16%Communications equipment operators 285.4 278.6 279.0 285.8 278.7 279.3 285.1 278.4 278.8 361 327 296 -31 -9.48%Computer operators 285.9 286.3 287.7 285.7 286.2 287.6 285.5 286.2 287.4 306 291 198 -93 -31.96%Information clerks 301.6 297.9 294.7 301.9 298.4 294.4 301.8 298.4 294.0 1,111 1,591 1,958 367 23.07%Mail clerks and messengers 273.1 271.1 284.1 273.6 271.6 284.6 273.6 271.6 284.6 236 268 291 23 8.58%Postal clerks and mail carriers 291.0 285.5 291.5 291.0 285.5 291.5 291.0 285.5 291.5 639 403 443 40 9.93%Material recording, scheduling, dispatching, and distributing 278.6 277.6 279.8 278.6 277.7 279.9 278.9 278.0 280.3 ~ 3,857 4,084 227 5.89%Records processing occupations 296.6 291.3 297.4 296.6 291.3 297.2 296.3 291.0 296.7 3,336 3,869 3,888 19 0.49%Secretaries, stenographers, and typists 295.5 287.0 291.9 298.7 291.0 295.2 299.8 292.1 296.1 ~ 4,159 4,080 -79 -1.90%Other clerical and administrative support workers 297.9 291.9 293.2 297.7 291.5 293.0 297.4 291.0 292.7 ~ 7,974 8,983 1,009 12.65%
Service occupations 270.0 266.1 266.2 269.7 265.7 265.8 269.5 265.3 265.6 17,427 21,317 25,144 3,827 17.95%Cleaning and building service occupations, except private household 266.2 261.7 256.9 266.2 261.7 256.9 266.2 261.8 256.9 3,052 3,555 3,713 158 4.44%Food preparation and service occupations 263.4 261.0 262.0 263.4 261.0 261.9 263.1 260.8 261.8 ~ 8,406 9,571 1,165 13.86%Health service occupations 258.0 254.0 250.3 260.1 256.2 252.4 261.8 257.9 254.1 1,542 2,168 2,872 704 32.47%Personal service occupations 279.4 269.2 272.0 273.7 263.0 265.8 271.1 260.0 263.1 1,524 2,750 3,875 1,125 40.91%Private household workers 247.5 244.0 237.5 247.5 244.0 237.5 247.5 244.0 237.5 982 802 681 -121 -15.09%Protective service occupations 297.8 295.0 298.8 296.8 294.3 298.0 295.6 293.2 296.8 ~ 2,524 2,979 455 18.03%All other service workers 276.0 272.0 274.5 276.0 272.0 274.5 276.0 272.0 274.5 ~ 1,112 1,453 341 30.67%
Agriculture, forestry, fishing, and related occupations 274.4 269.9 275.2 274.6 270.4 275.7 275.1 271.0 276.3 3,660 3,788 3,823 35 0.92%
Table 2

Average Prose, Document, and Quant Scores by Occupation;Number of Positions in 1986, 1996, and 2006; and Change from 1986 to 1996 and from 1996 to 2006
Average NALS Scores Number of Positions Change in Numberof Positions
Occupation 1986 1996 2006 1996 to 2006Prose Doc Quant Prose Doc Quant Prose Doc Quant 1986 1996 2006 Number Percent
Precision production, craft, and repair occupations 285.9 284.5 290.5 286.0 284.5 290.4 285.8 284.3 290.2 13,831 14,461 15,448 987 6.83%Blue collar worker supervisors 297.7 299.3 309.1 297.7 299.3 309.1 297.7 299.3 309.1 1,818 1,902 1,947 45 2.37%Construction trades 277.1 277.4 283.3 277.1 277.3 283.0 276.9 277.2 283.0 3,703 3,713 4,014 301 8.11%Extractive and related workers, including blasters 244.0 247.0 253.0 244.0 247.0 253.0 244.0 247.0 253.0 245 219 219 0 0.00%Communications equipment mechanics, installers, and repairers 322.2 310.9 309.5 322.3 311.2 309.2 322.6 311.3 309.2 90 116 120 4 3.45%Electrical and electronic equipment mechanics, installers, and repairers 306.1 294.2 306.2 306.6 294.6 306.6 307.6 295.2 306.8 ~ 563 628 65 11.55%Machinery and related mechanics, installers, and repairers 291.1 287.7 289.7 291.1 287.8 290.0 291.1 287.8 290.1 ~ 1,901 2,173 272 14.31%Vehicle and mobile equipment mechanics and repairers 275.7 276.1 283.2 275.3 275.8 283.0 275.2 275.6 283.0 1,469 1,640 1,814 174 10.61%Other mechanics, installers, and repairers 288.1 285.9 288.8 287.0 284.9 288.0 286.3 284.2 287.4 ~ 1,059 1,206 147 13.88%Assemblers, precision 271.4 271.0 281.2 271.2 270.8 281.2 271.0 270.6 281.1 348 380 382 2 0.53%Food workers, precision 278.1 279.4 282.7 278.1 279.4 282.7 278.0 278.9 282.4 ~ 299 301 2 0.67%Inspectors, testers, and graders, precision NA NA NA NA NA NA NA NA NA 694 636 610 -26 -4.09%Metal workers, precision 274.9 270.6 277.6 274.7 270.3 277.2 274.5 270.1 276.9 946 935 922 -13 -1.39%Printing workers, precision 292.2 290.8 294.5 292.2 290.8 294.5 285.6 284.0 287.9 ~ 139 125 -14 -10.07%Textile, apparel, and furnishings workers, precision 292.9 289.7 288.5 293.7 290.6 289.7 294.8 291.6 290.6 ~ 228 212 -16 -7.02%Woodworkers, precision 278.9 278.2 282.8 279.9 279.1 283.3 279.4 278.7 283.1 205 229 248 19 8.30%Other precision workers 290.2 287.3 290.6 290.2 287.3 290.6 290.1 287.1 290.4 ~ 206 214 8 3.88%Plant and system occupations 292.7 289.2 298.1 291.4 287.9 296.5 290.6 287.0 295.5 289 329 362 33 10.03%
Operators, fabricators, and laborers 264.5 263.4 270.5 264.5 263.5 270.6 264.3 263.4 270.4 16,207 17,694 19,188 1,494 8.44%Machine tool cut and form setters, operators, and tenders 265.4 262.7 267.5 265.1 262.0 267.2 264.8 261.5 266.9 822 723 677 -46 -6.36%Metal fabricating machine setters, operators, and related workers 260.3 259.4 271.1 260.3 259.4 271.1 260.6 259.7 271.4 ~ 157 162 5 3.18%Metal and plastic processing machine setters and operators 266.5 265.1 276.3 267.1 265.6 276.8 267.5 266.1 277.3 389 466 528 62 13.30%Printing, binding, and related workers 279.0 277.2 281.5 279.0 277.2 281.5 277.4 275.8 280.6 ~ 383 393 10 2.61%Textile and related setters, operators, and related workers 256.1 253.4 261.2 255.7 253.0 260.6 255.3 252.7 259.9 ~ 935 776 -159 -17.01%Woodworking machine setters, operators, and other related workers 258.5 254.5 268.5 258.5 254.5 268.5 258.5 254.5 268.5 149 129 118 -11 -8.53%Other machine setters, set-up operators, operators, and tenders 268.5 266.8 273.6 268.4 266.7 273.4 267.9 266.2 272.8 ~ 1,919 2,068 149 7.76%Hand workers, including assemblers and fabricators 267.4 266.9 271.7 266.1 265.6 270.0 264.9 264.5 268.6 2,339 2,813 2,899 86 3.06%Motor vehicle operators 269.1 269.4 278.1 269.1 269.3 278.0 269.0 269.3 278.0 3,080 3,771 4,345 574 15.22%Rail transportation workers 279.3 280.8 294.3 276.1 278.9 294.0 277.8 281.6 296.0 117 82 79 -3 -3.66%Water transportation and related workers 255.0 254.0 261.0 255.0 254.0 261.0 255.0 254.0 261.0 ~ 52 48 -4 -7.69%Material moving equipment operators 273.3 271.0 279.1 273.3 271.0 278.8 273.1 270.9 278.8 1,173 1,099 1,211 112 10.19%All other transportation and material moving equipment operators NA NA NA NA NA NA NA NA NA ~ 151 173 22 14.57%Helpers, laborers, and material movers, hand 257.5 256.8 262.5 257.4 256.7 262.4 257.1 256.4 262.2 4,558 4,976 5,654 678 13.63%
Table 3
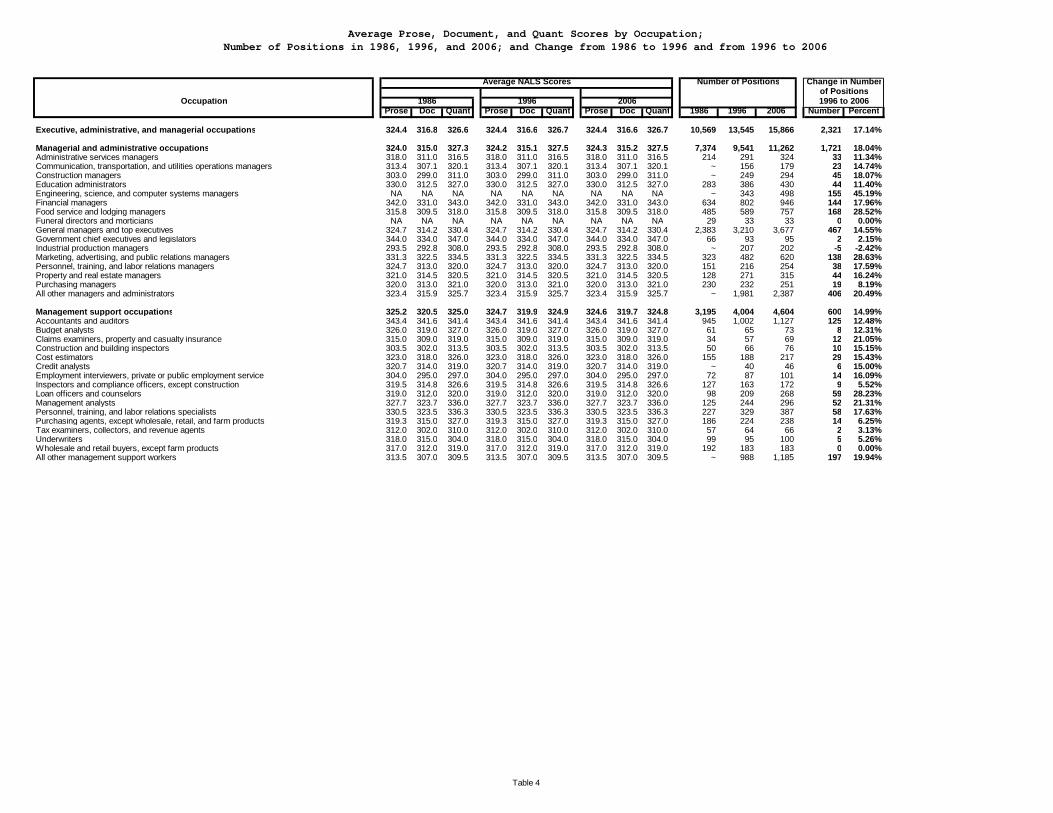
Average Prose, Document, and Quant Scores by Occupation;Number of Positions in 1986, 1996, and 2006; and Change from 1986 to 1996 and from 1996 to 2006
Average NALS Scores Number of Positions Change in Numberof Positions
Occupation 1986 1996 2006 1996 to 2006Prose Doc Quant Prose Doc Quant Prose Doc Quant 1986 1996 2006 Number Percent
Executive, administrative, and managerial occupations 324.4 316.8 326.6 324.4 316.6 326.7 324.4 316.6 326.7 10,569 13,545 15,866 2,321 17.14%
Managerial and administrative occupations 324.0 315.0 327.3 324.2 315.1 327.5 324.3 315.2 327.5 7,374 9,541 11,262 1,721 18.04%Administrative services managers 318.0 311.0 316.5 318.0 311.0 316.5 318.0 311.0 316.5 214 291 324 33 11.34%Communication, transportation, and utilities operations managers 313.4 307.1 320.1 313.4 307.1 320.1 313.4 307.1 320.1 ~ 156 179 23 14.74%Construction managers 303.0 299.0 311.0 303.0 299.0 311.0 303.0 299.0 311.0 ~ 249 294 45 18.07%Education administrators 330.0 312.5 327.0 330.0 312.5 327.0 330.0 312.5 327.0 283 386 430 44 11.40%Engineering, science, and computer systems managers NA NA NA NA NA NA NA NA NA ~ 343 498 155 45.19%Financial managers 342.0 331.0 343.0 342.0 331.0 343.0 342.0 331.0 343.0 634 802 946 144 17.96%Food service and lodging managers 315.8 309.5 318.0 315.8 309.5 318.0 315.8 309.5 318.0 485 589 757 168 28.52%Funeral directors and morticians NA NA NA NA NA NA NA NA NA 29 33 33 0 0.00%General managers and top executives 324.7 314.2 330.4 324.7 314.2 330.4 324.7 314.2 330.4 2,383 3,210 3,677 467 14.55%Government chief executives and legislators 344.0 334.0 347.0 344.0 334.0 347.0 344.0 334.0 347.0 66 93 95 2 2.15%Industrial production managers 293.5 292.8 308.0 293.5 292.8 308.0 293.5 292.8 308.0 ~ 207 202 -5 -2.42%Marketing, advertising, and public relations managers 331.3 322.5 334.5 331.3 322.5 334.5 331.3 322.5 334.5 323 482 620 138 28.63%Personnel, training, and labor relations managers 324.7 313.0 320.0 324.7 313.0 320.0 324.7 313.0 320.0 151 216 254 38 17.59%Property and real estate managers 321.0 314.5 320.5 321.0 314.5 320.5 321.0 314.5 320.5 128 271 315 44 16.24%Purchasing managers 320.0 313.0 321.0 320.0 313.0 321.0 320.0 313.0 321.0 230 232 251 19 8.19%All other managers and administrators 323.4 315.9 325.7 323.4 315.9 325.7 323.4 315.9 325.7 ~ 1,981 2,387 406 20.49%
Management support occupations 325.2 320.5 325.0 324.7 319.9 324.9 324.6 319.7 324.8 3,195 4,004 4,604 600 14.99%Accountants and auditors 343.4 341.6 341.4 343.4 341.6 341.4 343.4 341.6 341.4 945 1,002 1,127 125 12.48%Budget analysts 326.0 319.0 327.0 326.0 319.0 327.0 326.0 319.0 327.0 61 65 73 8 12.31%Claims examiners, property and casualty insurance 315.0 309.0 319.0 315.0 309.0 319.0 315.0 309.0 319.0 34 57 69 12 21.05%Construction and building inspectors 303.5 302.0 313.5 303.5 302.0 313.5 303.5 302.0 313.5 50 66 76 10 15.15%Cost estimators 323.0 318.0 326.0 323.0 318.0 326.0 323.0 318.0 326.0 155 188 217 29 15.43%Credit analysts 320.7 314.0 319.0 320.7 314.0 319.0 320.7 314.0 319.0 ~ 40 46 6 15.00%Employment interviewers, private or public employment service 304.0 295.0 297.0 304.0 295.0 297.0 304.0 295.0 297.0 72 87 101 14 16.09%Inspectors and compliance officers, except construction 319.5 314.8 326.6 319.5 314.8 326.6 319.5 314.8 326.6 127 163 172 9 5.52%Loan officers and counselors 319.0 312.0 320.0 319.0 312.0 320.0 319.0 312.0 320.0 98 209 268 59 28.23%Management analysts 327.7 323.7 336.0 327.7 323.7 336.0 327.7 323.7 336.0 125 244 296 52 21.31%Personnel, training, and labor relations specialists 330.5 323.5 336.3 330.5 323.5 336.3 330.5 323.5 336.3 227 329 387 58 17.63%Purchasing agents, except wholesale, retail, and farm products 319.3 315.0 327.0 319.3 315.0 327.0 319.3 315.0 327.0 186 224 238 14 6.25%Tax examiners, collectors, and revenue agents 312.0 302.0 310.0 312.0 302.0 310.0 312.0 302.0 310.0 57 64 66 2 3.13%Underwriters 318.0 315.0 304.0 318.0 315.0 304.0 318.0 315.0 304.0 99 95 100 5 5.26%Wholesale and retail buyers, except farm products 317.0 312.0 319.0 317.0 312.0 319.0 317.0 312.0 319.0 192 183 183 0 0.00%All other management support workers 313.5 307.0 309.5 313.5 307.0 309.5 313.5 307.0 309.5 ~ 988 1,185 197 19.94%
Table 4
Average Prose, Document, and Quant Scores by Occupation;Number of Positions in 1986, 1996, and 2006; and Change from 1986 to 1996 and from 1996 to 2006
Average NALS Scores Number of Positions Change in Numberof Positions
Occupation 1986 1996 2006 1996 to 2006Prose Doc Quant Prose Doc Quant Prose Doc Quant 1986 1996 2006 Number Percent
Professional specialty occupations 331.7 324.5 328.2 331.1 323.9 327.2 331.6 324.6 327.8 13,586 18,176 22,996 4,820 26.52%
Engineers 340.6 335.0 353.3 340.6 335.0 353.2 340.8 335.1 353.4 1,378 1384 1633 249 17.99%Aeronautical and astronautical engineers NA NA NA NA NA NA NA NA NA 53 53 57 4 7.55%Chemical engineers NA NA NA NA NA NA NA NA NA 52 49 57 8 16.33%Civil engineers, including traffic engineers 334.0 321.0 355.0 334.0 321.0 355.0 334.0 321.0 355.0 199 196 231 35 17.86%Electrical and electronics engineers 345.3 340.3 357.7 345.3 340.3 357.7 345.3 340.3 357.7 406 368 472 104 28.26%Industrial engineers, except safety engineers 324.0 321.0 337.0 324.0 321.0 337.0 324.0 321.0 337.0 117 115 131 16 13.91%Mechanical engineers 344.0 340.0 353.0 344.0 340.0 353.0 344.0 340.0 353.0 234 228 264 36 15.79%Metallurgists and metallurgical, ceramic, and materials engineers NA NA NA NA NA NA NA NA NA 18 18 20 2 11.11%Mining engineers, including mine safety engineers 337.0 333.0 347.0 337.0 333.0 347.0 337.0 333.0 347.0 5 3 3 0 0.00%Nuclear engineers 337.0 331.0 351.0 337.0 331.0 351.0 337.0 331.0 351.0 ~ 14 14 0 0.00%Petroleum engineers NA NA NA NA NA NA NA NA NA 21 14 11 -3 -21.43%All other engineers 343.0 339.0 353.0 343.0 339.0 353.0 343.0 339.0 353.0 ~ 326 373 47 14.42%
Architects and surveyors 335.5 325.0 339.9 335.9 325.4 340.2 336.1 325.1 340.1 191 212 232 20 9.43%Architects, except landscape and marine 333.0 315.0 334.0 333.0 315.0 334.0 333.0 315.0 334.0 84 94 113 19 20.21%Landscape architects 366.0 365.0 370.0 366.0 365.0 370.0 366.0 365.0 370.0 13 17 20 3 17.65%Surveyors 333.5 328.5 341.0 333.5 328.5 341.0 333.5 328.5 341.0 94 101 99 -2 -1.98%
Life scientists 368.5 364.0 359.5 368.5 364.0 359.5 368.5 364.0 359.5 155 180 220 40 22.22%Agricultural and food scientists NA NA NA NA NA NA NA NA NA 20 24 29 5 20.83%Biological scientists 368.5 364.0 359.5 368.5 364.0 359.5 368.5 364.0 359.5 58 83 103 20 24.10%Foresters and conservation scientists NA NA NA NA NA NA NA NA NA ~ 37 43 6 16.22%Medical scientists NA NA NA NA NA NA NA NA NA ~ 35 44 9 25.71%All other life scientists NA NA NA NA NA NA NA NA NA ~ 1 1 0 0.00%
Computer, mathematical, and operations research occupations 347.0 345.4 348.9 347.6 345.6 349.3 347.5 345.8 349.3 ~ 1,030 2,038 1,008 97.86%Actuaries 336.0 329.0 339.0 336.0 329.0 339.0 336.0 329.0 339.0 ~ 16 16 0 0.00%Statisticians 326.0 320.0 327.0 326.0 320.0 327.0 326.0 320.0 327.0 ~ 14 14 0 0.00%Mathematicians and all other mathematical scientists NA NA NA NA NA NA NA NA NA ~ 16 17Computer engineers 333.0 327.0 338.0 333.0 327.0 338.0 333.0 327.0 338.0 ~ 216 451 235 108.80%Database admin, support specialists, and computer scientists 351.0 362.0 354.0 351.0 362.0 354.0 351.0 362.0 354.0 ~ 212 461 249 117.45%Systems analysts 352.0 347.0 352.0 352.0 347.0 352.0 352.0 347.0 352.0 331 506 1,025 519 102.57%Operations research analysts 361.0 355.0 360.0 361.0 355.0 360.0 361.0 355.0 360.0 ~ 50 54 4 8.00%
Physical scientists 315.1 311.7 319.7 314.7 311.3 319.1 314.5 311.1 318.7 192 207 242 35 16.91%Chemists 319.0 316.0 327.0 319.0 316.0 327.0 319.0 316.0 327.0 86 91 108 17 18.68%Geologists, geophysicists, and oceanographers NA NA NA NA NA NA NA NA NA 43 48 54 6 12.50%Meteorologists NA NA NA NA NA NA NA NA NA ~ 7 8 1 14.29%Physicists and astronomers NA NA NA NA NA NA NA NA NA 23 18 17 -1 -5.56%All other physical scientists 305.7 301.3 302.3 305.7 301.3 302.3 305.7 301.3 302.3 ~ 43 55 12 27.91%
Social scientists 335.2 328.6 335.1 335.3 328.7 335.3 335.2 328.6 335.2 ~ 264 288 24 9.09%Economists 330.0 324.0 331.5 330.0 324.0 331.5 330.0 324.0 331.5 37 51 60 9 17.65%Psychologists 334.8 328.3 335.3 334.8 328.3 335.3 334.8 328.3 335.3 112 143 154 11 7.69%Urban and regional planners 348.0 340.0 348.0 348.0 340.0 348.0 348.0 340.0 348.0 20 29 31 2 6.90%All other social scientists 335.0 328.3 331.3 335.0 328.3 331.3 335.0 328.3 331.3 ~ 41 43 2 4.88%
Social, recreational, and religious workers 322.6 315.0 320.6 322.5 314.8 320.2 322.8 315.1 320.5 ~ 1,469 1,939 470 31.99%Clergy NA NA NA NA NA NA NA NA NA 295 208 236 28 13.46%Directors, religious activities and education 345.0 335.0 339.0 345.0 335.0 339.0 345.0 335.0 339.0 46 85 115 30 35.29%Human services workers NA NA NA NA NA NA NA NA NA ~ 178 276 98 55.06%Recreation workers 314.0 307.0 311.0 314.0 307.0 311.0 314.0 307.0 311.0 163 233 285 52 22.32%Residential counselors 334.0 325.0 337.0 334.0 325.0 337.0 334.0 325.0 337.0 ~ 180 254 74 41.11%Social workers 319.0 311.9 315.9 319.0 311.9 315.9 319.0 311.9 315.9 369 585 772 187 31.97%
Table 5
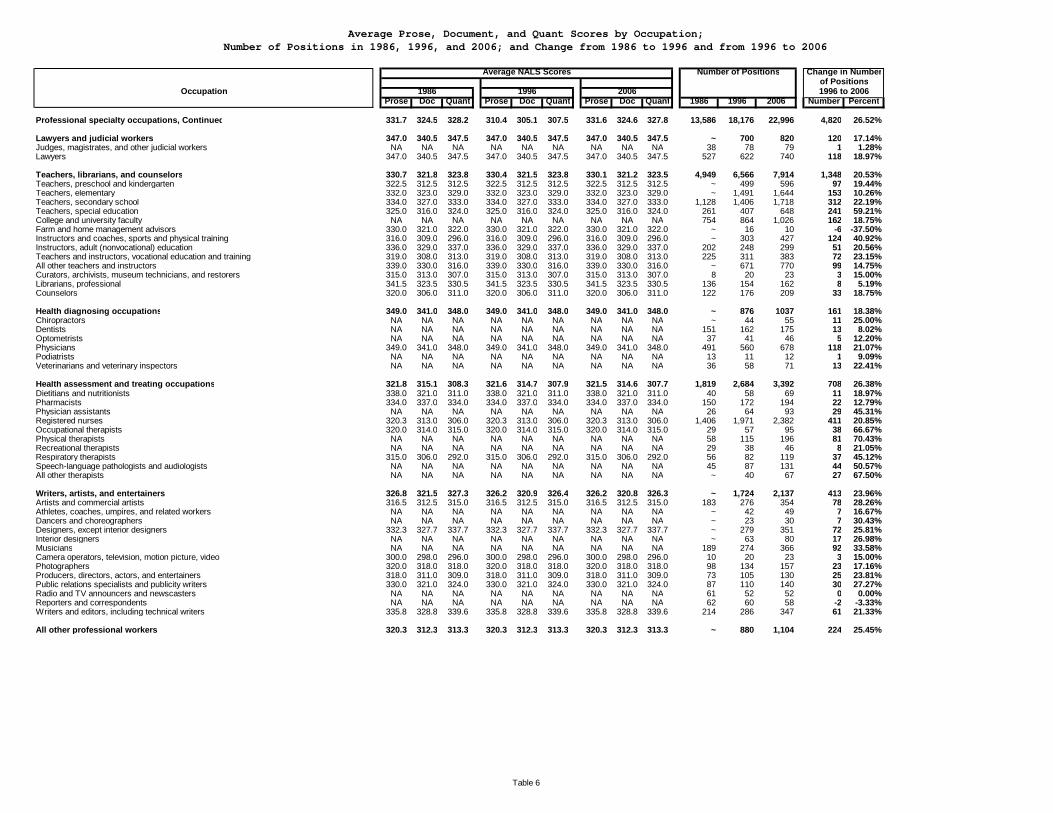
Average Prose, Document, and Quant Scores by Occupation;Number of Positions in 1986, 1996, and 2006; and Change from 1986 to 1996 and from 1996 to 2006
Average NALS Scores Number of Positions Change in Numberof Positions
Occupation 1986 1996 2006 1996 to 2006Prose Doc Quant Prose Doc Quant Prose Doc Quant 1986 1996 2006 Number Percent
Professional specialty occupations, Continued 331.7 324.5 328.2 310.4 305.1 307.5 331.6 324.6 327.8 13,586 18,176 22,996 4,820 26.52%
Lawyers and judicial workers 347.0 340.5 347.5 347.0 340.5 347.5 347.0 340.5 347.5 ~ 700 820 120 17.14%Judges, magistrates, and other judicial workers NA NA NA NA NA NA NA NA NA 38 78 79 1 1.28%Lawyers 347.0 340.5 347.5 347.0 340.5 347.5 347.0 340.5 347.5 527 622 740 118 18.97%
Teachers, librarians, and counselors 330.7 321.8 323.8 330.4 321.5 323.8 330.1 321.2 323.5 4,949 6,566 7,914 1,348 20.53%Teachers, preschool and kindergarten 322.5 312.5 312.5 322.5 312.5 312.5 322.5 312.5 312.5 ~ 499 596 97 19.44%Teachers, elementary 332.0 323.0 329.0 332.0 323.0 329.0 332.0 323.0 329.0 ~ 1,491 1,644 153 10.26%Teachers, secondary school 334.0 327.0 333.0 334.0 327.0 333.0 334.0 327.0 333.0 1,128 1,406 1,718 312 22.19%Teachers, special education 325.0 316.0 324.0 325.0 316.0 324.0 325.0 316.0 324.0 261 407 648 241 59.21%College and university faculty NA NA NA NA NA NA NA NA NA 754 864 1,026 162 18.75%Farm and home management advisors 330.0 321.0 322.0 330.0 321.0 322.0 330.0 321.0 322.0 ~ 16 10 -6 -37.50%Instructors and coaches, sports and physical training 316.0 309.0 296.0 316.0 309.0 296.0 316.0 309.0 296.0 ~ 303 427 124 40.92%Instructors, adult (nonvocational) education 336.0 329.0 337.0 336.0 329.0 337.0 336.0 329.0 337.0 202 248 299 51 20.56%Teachers and instructors, vocational education and training 319.0 308.0 313.0 319.0 308.0 313.0 319.0 308.0 313.0 225 311 383 72 23.15%All other teachers and instructors 339.0 330.0 316.0 339.0 330.0 316.0 339.0 330.0 316.0 ~ 671 770 99 14.75%Curators, archivists, museum technicians, and restorers 315.0 313.0 307.0 315.0 313.0 307.0 315.0 313.0 307.0 8 20 23 3 15.00%Librarians, professional 341.5 323.5 330.5 341.5 323.5 330.5 341.5 323.5 330.5 136 154 162 8 5.19%Counselors 320.0 306.0 311.0 320.0 306.0 311.0 320.0 306.0 311.0 122 176 209 33 18.75%
Health diagnosing occupations 349.0 341.0 348.0 349.0 341.0 348.0 349.0 341.0 348.0 ~ 876 1037 161 18.38%Chiropractors NA NA NA NA NA NA NA NA NA ~ 44 55 11 25.00%Dentists NA NA NA NA NA NA NA NA NA 151 162 175 13 8.02%Optometrists NA NA NA NA NA NA NA NA NA 37 41 46 5 12.20%Physicians 349.0 341.0 348.0 349.0 341.0 348.0 349.0 341.0 348.0 491 560 678 118 21.07%Podiatrists NA NA NA NA NA NA NA NA NA 13 11 12 1 9.09%Veterinarians and veterinary inspectors NA NA NA NA NA NA NA NA NA 36 58 71 13 22.41%
Health assessment and treating occupations 321.8 315.1 308.3 321.6 314.7 307.9 321.5 314.6 307.7 1,819 2,684 3,392 708 26.38%Dietitians and nutritionists 338.0 321.0 311.0 338.0 321.0 311.0 338.0 321.0 311.0 40 58 69 11 18.97%Pharmacists 334.0 337.0 334.0 334.0 337.0 334.0 334.0 337.0 334.0 150 172 194 22 12.79%Physician assistants NA NA NA NA NA NA NA NA NA 26 64 93 29 45.31%Registered nurses 320.3 313.0 306.0 320.3 313.0 306.0 320.3 313.0 306.0 1,406 1,971 2,382 411 20.85%Occupational therapists 320.0 314.0 315.0 320.0 314.0 315.0 320.0 314.0 315.0 29 57 95 38 66.67%Physical therapists NA NA NA NA NA NA NA NA NA 58 115 196 81 70.43%Recreational therapists NA NA NA NA NA NA NA NA NA 29 38 46 8 21.05%Respiratory therapists 315.0 306.0 292.0 315.0 306.0 292.0 315.0 306.0 292.0 56 82 119 37 45.12%Speech-language pathologists and audiologists NA NA NA NA NA NA NA NA NA 45 87 131 44 50.57%All other therapists NA NA NA NA NA NA NA NA NA ~ 40 67 27 67.50%
Writers, artists, and entertainers 326.8 321.5 327.3 326.2 320.9 326.4 326.2 320.8 326.3 ~ 1,724 2,137 413 23.96%Artists and commercial artists 316.5 312.5 315.0 316.5 312.5 315.0 316.5 312.5 315.0 183 276 354 78 28.26%Athletes, coaches, umpires, and related workers NA NA NA NA NA NA NA NA NA ~ 42 49 7 16.67%Dancers and choreographers NA NA NA NA NA NA NA NA NA ~ 23 30 7 30.43%Designers, except interior designers 332.3 327.7 337.7 332.3 327.7 337.7 332.3 327.7 337.7 ~ 279 351 72 25.81%Interior designers NA NA NA NA NA NA NA NA NA ~ 63 80 17 26.98%Musicians NA NA NA NA NA NA NA NA NA 189 274 366 92 33.58%Camera operators, television, motion picture, video 300.0 298.0 296.0 300.0 298.0 296.0 300.0 298.0 296.0 10 20 23 3 15.00%Photographers 320.0 318.0 318.0 320.0 318.0 318.0 320.0 318.0 318.0 98 134 157 23 17.16%Producers, directors, actors, and entertainers 318.0 311.0 309.0 318.0 311.0 309.0 318.0 311.0 309.0 73 105 130 25 23.81%Public relations specialists and publicity writers 330.0 321.0 324.0 330.0 321.0 324.0 330.0 321.0 324.0 87 110 140 30 27.27%Radio and TV announcers and newscasters NA NA NA NA NA NA NA NA NA 61 52 52 0 0.00%Reporters and correspondents NA NA NA NA NA NA NA NA NA 62 60 58 -2 -3.33%Writers and editors, including technical writers 335.8 328.8 339.6 335.8 328.8 339.6 335.8 328.8 339.6 214 286 347 61 21.33%
All other professional workers 320.3 312.3 313.3 320.3 312.3 313.3 320.3 312.3 313.3 ~ 880 1,104 224 25.45%
Table 6
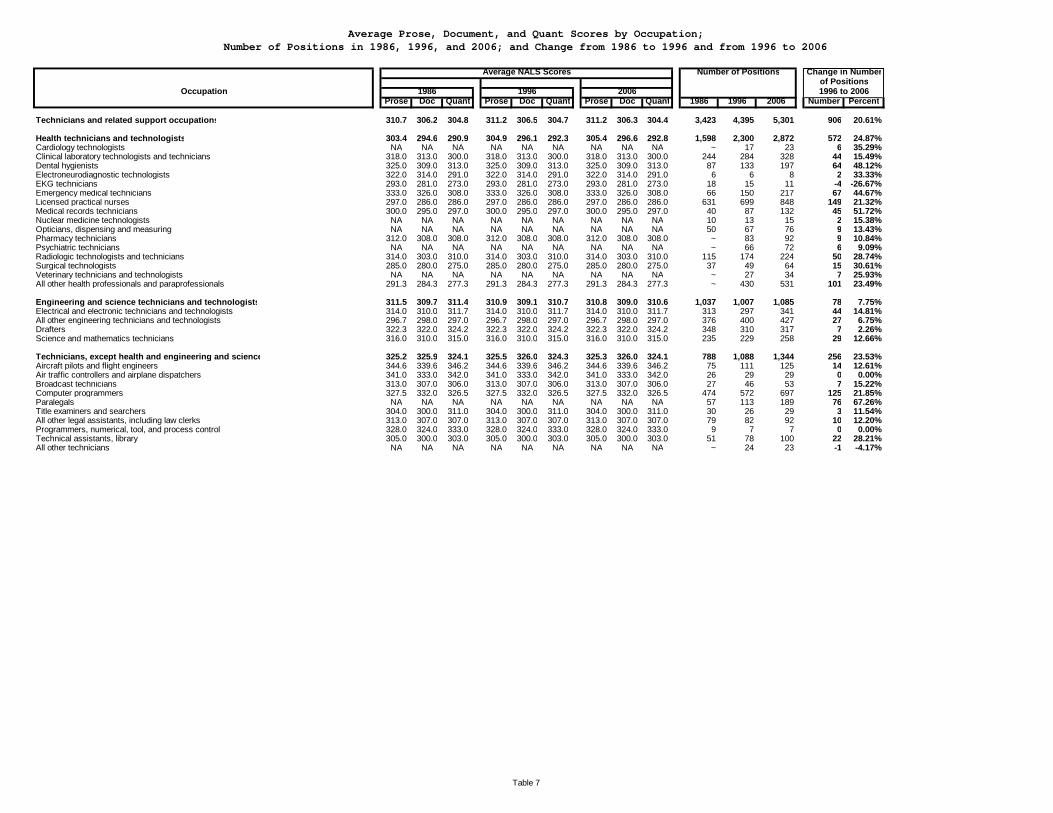
Average Prose, Document, and Quant Scores by Occupation;Number of Positions in 1986, 1996, and 2006; and Change from 1986 to 1996 and from 1996 to 2006
Average NALS Scores Number of Positions Change in Numberof Positions
Occupation 1986 1996 2006 1996 to 2006Prose Doc Quant Prose Doc Quant Prose Doc Quant 1986 1996 2006 Number Percent
Technicians and related support occupations 310.7 306.2 304.8 311.2 306.5 304.7 311.2 306.3 304.4 3,423 4,395 5,301 906 20.61%
Health technicians and technologists 303.4 294.6 290.9 304.9 296.1 292.3 305.4 296.6 292.8 1,598 2,300 2,872 572 24.87%Cardiology technologists NA NA NA NA NA NA NA NA NA ~ 17 23 6 35.29%Clinical laboratory technologists and technicians 318.0 313.0 300.0 318.0 313.0 300.0 318.0 313.0 300.0 244 284 328 44 15.49%Dental hygienists 325.0 309.0 313.0 325.0 309.0 313.0 325.0 309.0 313.0 87 133 197 64 48.12%Electroneurodiagnostic technologists 322.0 314.0 291.0 322.0 314.0 291.0 322.0 314.0 291.0 6 6 8 2 33.33%EKG technicians 293.0 281.0 273.0 293.0 281.0 273.0 293.0 281.0 273.0 18 15 11 -4 -26.67%Emergency medical technicians 333.0 326.0 308.0 333.0 326.0 308.0 333.0 326.0 308.0 66 150 217 67 44.67%Licensed practical nurses 297.0 286.0 286.0 297.0 286.0 286.0 297.0 286.0 286.0 631 699 848 149 21.32%Medical records technicians 300.0 295.0 297.0 300.0 295.0 297.0 300.0 295.0 297.0 40 87 132 45 51.72%Nuclear medicine technologists NA NA NA NA NA NA NA NA NA 10 13 15 2 15.38%Opticians, dispensing and measuring NA NA NA NA NA NA NA NA NA 50 67 76 9 13.43%Pharmacy technicians 312.0 308.0 308.0 312.0 308.0 308.0 312.0 308.0 308.0 ~ 83 92 9 10.84%Psychiatric technicians NA NA NA NA NA NA NA NA NA ~ 66 72 6 9.09%Radiologic technologists and technicians 314.0 303.0 310.0 314.0 303.0 310.0 314.0 303.0 310.0 115 174 224 50 28.74%Surgical technologists 285.0 280.0 275.0 285.0 280.0 275.0 285.0 280.0 275.0 37 49 64 15 30.61%Veterinary technicians and technologists NA NA NA NA NA NA NA NA NA ~ 27 34 7 25.93%All other health professionals and paraprofessionals 291.3 284.3 277.3 291.3 284.3 277.3 291.3 284.3 277.3 ~ 430 531 101 23.49%
Engineering and science technicians and technologists 311.5 309.7 311.4 310.9 309.1 310.7 310.8 309.0 310.6 1,037 1,007 1,085 78 7.75%Electrical and electronic technicians and technologists 314.0 310.0 311.7 314.0 310.0 311.7 314.0 310.0 311.7 313 297 341 44 14.81%All other engineering technicians and technologists 296.7 298.0 297.0 296.7 298.0 297.0 296.7 298.0 297.0 376 400 427 27 6.75%Drafters 322.3 322.0 324.2 322.3 322.0 324.2 322.3 322.0 324.2 348 310 317 7 2.26%Science and mathematics technicians 316.0 310.0 315.0 316.0 310.0 315.0 316.0 310.0 315.0 235 229 258 29 12.66%
Technicians, except health and engineering and science 325.2 325.9 324.1 325.5 326.0 324.3 325.3 326.0 324.1 788 1,088 1,344 256 23.53%Aircraft pilots and flight engineers 344.6 339.6 346.2 344.6 339.6 346.2 344.6 339.6 346.2 75 111 125 14 12.61%Air traffic controllers and airplane dispatchers 341.0 333.0 342.0 341.0 333.0 342.0 341.0 333.0 342.0 26 29 29 0 0.00%Broadcast technicians 313.0 307.0 306.0 313.0 307.0 306.0 313.0 307.0 306.0 27 46 53 7 15.22%Computer programmers 327.5 332.0 326.5 327.5 332.0 326.5 327.5 332.0 326.5 474 572 697 125 21.85%Paralegals NA NA NA NA NA NA NA NA NA 57 113 189 76 67.26%Title examiners and searchers 304.0 300.0 311.0 304.0 300.0 311.0 304.0 300.0 311.0 30 26 29 3 11.54%All other legal assistants, including law clerks 313.0 307.0 307.0 313.0 307.0 307.0 313.0 307.0 307.0 79 82 92 10 12.20%Programmers, numerical, tool, and process control 328.0 324.0 333.0 328.0 324.0 333.0 328.0 324.0 333.0 9 7 7 0 0.00%Technical assistants, library 305.0 300.0 303.0 305.0 300.0 303.0 305.0 300.0 303.0 51 78 100 22 28.21%All other technicians NA NA NA NA NA NA NA NA NA ~ 24 23 -1 -4.17%
Table 7
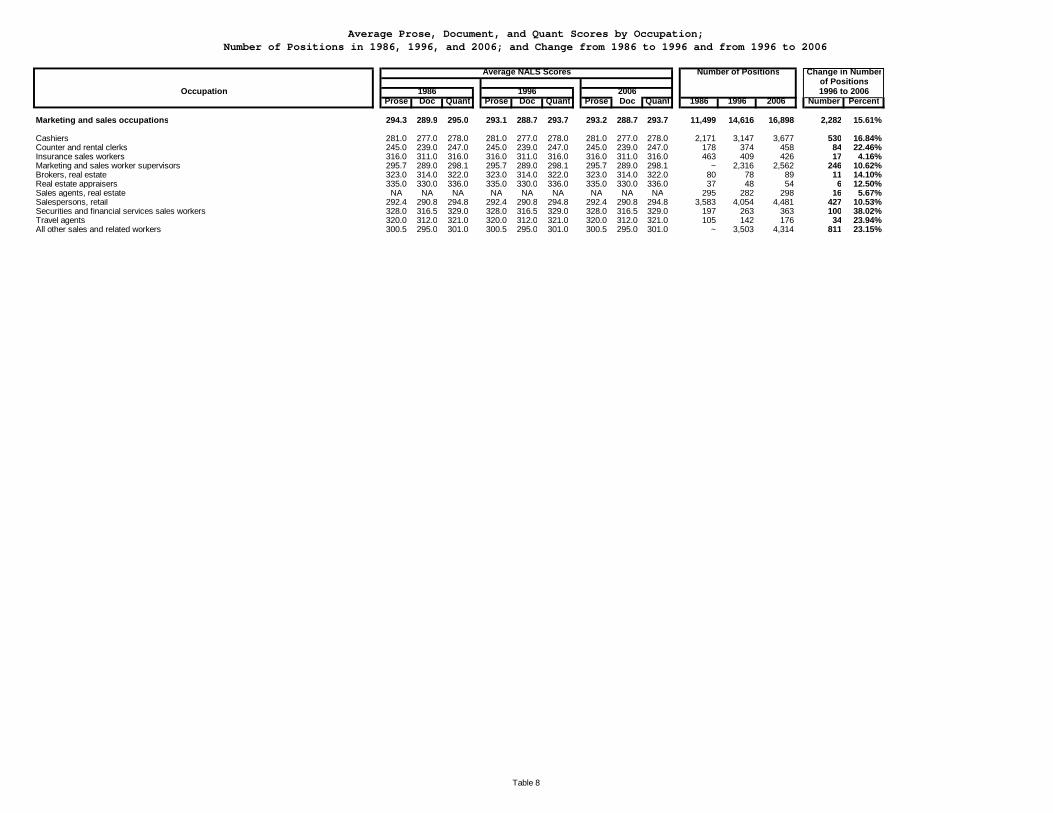
Average Prose, Document, and Quant Scores by Occupation;Number of Positions in 1986, 1996, and 2006; and Change from 1986 to 1996 and from 1996 to 2006
Average NALS Scores Number of Positions Change in Numberof Positions
Occupation 1986 1996 2006 1996 to 2006Prose Doc Quant Prose Doc Quant Prose Doc Quant 1986 1996 2006 Number Percent
Marketing and sales occupations 294.3 289.9 295.0 293.1 288.7 293.7 293.2 288.7 293.7 11,499 14,616 16,898 2,282 15.61%
Cashiers 281.0 277.0 278.0 281.0 277.0 278.0 281.0 277.0 278.0 2,171 3,147 3,677 530 16.84%Counter and rental clerks 245.0 239.0 247.0 245.0 239.0 247.0 245.0 239.0 247.0 178 374 458 84 22.46%Insurance sales workers 316.0 311.0 316.0 316.0 311.0 316.0 316.0 311.0 316.0 463 409 426 17 4.16%Marketing and sales worker supervisors 295.7 289.0 298.1 295.7 289.0 298.1 295.7 289.0 298.1 ~ 2,316 2,562 246 10.62%Brokers, real estate 323.0 314.0 322.0 323.0 314.0 322.0 323.0 314.0 322.0 80 78 89 11 14.10%Real estate appraisers 335.0 330.0 336.0 335.0 330.0 336.0 335.0 330.0 336.0 37 48 54 6 12.50%Sales agents, real estate NA NA NA NA NA NA NA NA NA 295 282 298 16 5.67%Salespersons, retail 292.4 290.8 294.8 292.4 290.8 294.8 292.4 290.8 294.8 3,583 4,054 4,481 427 10.53%Securities and financial services sales workers 328.0 316.5 329.0 328.0 316.5 329.0 328.0 316.5 329.0 197 263 363 100 38.02%Travel agents 320.0 312.0 321.0 320.0 312.0 321.0 320.0 312.0 321.0 105 142 176 34 23.94%All other sales and related workers 300.5 295.0 301.0 300.5 295.0 301.0 300.5 295.0 301.0 ~ 3,503 4,314 811 23.15%
Table 8
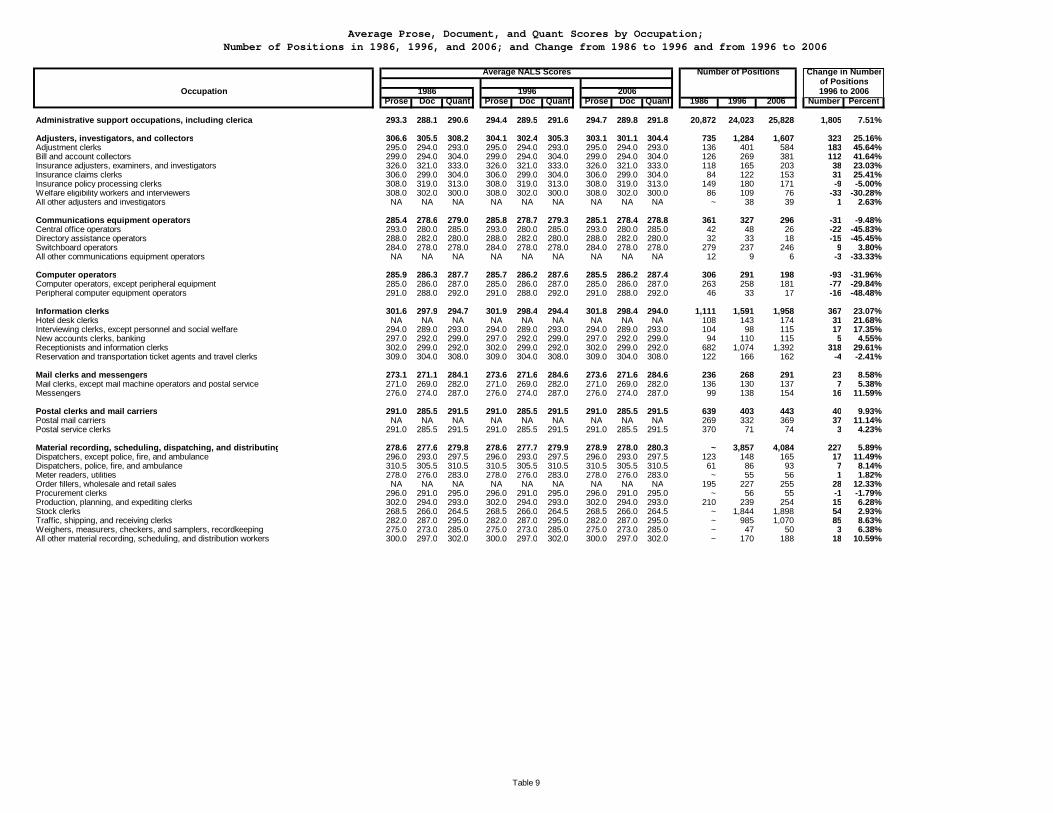
Average Prose, Document, and Quant Scores by Occupation;Number of Positions in 1986, 1996, and 2006; and Change from 1986 to 1996 and from 1996 to 2006
Average NALS Scores Number of Positions Change in Numberof Positions
Occupation 1986 1996 2006 1996 to 2006Prose Doc Quant Prose Doc Quant Prose Doc Quant 1986 1996 2006 Number Percent
Administrative support occupations, including clerical 293.3 288.1 290.6 294.4 289.5 291.6 294.7 289.8 291.8 20,872 24,023 25,828 1,805 7.51%
Adjusters, investigators, and collectors 306.6 305.5 308.2 304.1 302.4 305.3 303.1 301.1 304.4 735 1,284 1,607 323 25.16%Adjustment clerks 295.0 294.0 293.0 295.0 294.0 293.0 295.0 294.0 293.0 136 401 584 183 45.64%Bill and account collectors 299.0 294.0 304.0 299.0 294.0 304.0 299.0 294.0 304.0 126 269 381 112 41.64%Insurance adjusters, examiners, and investigators 326.0 321.0 333.0 326.0 321.0 333.0 326.0 321.0 333.0 118 165 203 38 23.03%Insurance claims clerks 306.0 299.0 304.0 306.0 299.0 304.0 306.0 299.0 304.0 84 122 153 31 25.41%Insurance policy processing clerks 308.0 319.0 313.0 308.0 319.0 313.0 308.0 319.0 313.0 149 180 171 -9 -5.00%Welfare eligibility workers and interviewers 308.0 302.0 300.0 308.0 302.0 300.0 308.0 302.0 300.0 86 109 76 -33 -30.28%All other adjusters and investigators NA NA NA NA NA NA NA NA NA ~ 38 39 1 2.63%
Communications equipment operators 285.4 278.6 279.0 285.8 278.7 279.3 285.1 278.4 278.8 361 327 296 -31 -9.48%Central office operators 293.0 280.0 285.0 293.0 280.0 285.0 293.0 280.0 285.0 42 48 26 -22 -45.83%Directory assistance operators 288.0 282.0 280.0 288.0 282.0 280.0 288.0 282.0 280.0 32 33 18 -15 -45.45%Switchboard operators 284.0 278.0 278.0 284.0 278.0 278.0 284.0 278.0 278.0 279 237 246 9 3.80%All other communications equipment operators NA NA NA NA NA NA NA NA NA 12 9 6 -3 -33.33%
Computer operators 285.9 286.3 287.7 285.7 286.2 287.6 285.5 286.2 287.4 306 291 198 -93 -31.96%Computer operators, except peripheral equipment 285.0 286.0 287.0 285.0 286.0 287.0 285.0 286.0 287.0 263 258 181 -77 -29.84%Peripheral computer equipment operators 291.0 288.0 292.0 291.0 288.0 292.0 291.0 288.0 292.0 46 33 17 -16 -48.48%
Information clerks 301.6 297.9 294.7 301.9 298.4 294.4 301.8 298.4 294.0 1,111 1,591 1,958 367 23.07%Hotel desk clerks NA NA NA NA NA NA NA NA NA 108 143 174 31 21.68%Interviewing clerks, except personnel and social welfare 294.0 289.0 293.0 294.0 289.0 293.0 294.0 289.0 293.0 104 98 115 17 17.35%New accounts clerks, banking 297.0 292.0 299.0 297.0 292.0 299.0 297.0 292.0 299.0 94 110 115 5 4.55%Receptionists and information clerks 302.0 299.0 292.0 302.0 299.0 292.0 302.0 299.0 292.0 682 1,074 1,392 318 29.61%Reservation and transportation ticket agents and travel clerks 309.0 304.0 308.0 309.0 304.0 308.0 309.0 304.0 308.0 122 166 162 -4 -2.41%
Mail clerks and messengers 273.1 271.1 284.1 273.6 271.6 284.6 273.6 271.6 284.6 236 268 291 23 8.58%Mail clerks, except mail machine operators and postal service 271.0 269.0 282.0 271.0 269.0 282.0 271.0 269.0 282.0 136 130 137 7 5.38%Messengers 276.0 274.0 287.0 276.0 274.0 287.0 276.0 274.0 287.0 99 138 154 16 11.59%
Postal clerks and mail carriers 291.0 285.5 291.5 291.0 285.5 291.5 291.0 285.5 291.5 639 403 443 40 9.93%Postal mail carriers NA NA NA NA NA NA NA NA NA 269 332 369 37 11.14%Postal service clerks 291.0 285.5 291.5 291.0 285.5 291.5 291.0 285.5 291.5 370 71 74 3 4.23%
Material recording, scheduling, dispatching, and distributing 278.6 277.6 279.8 278.6 277.7 279.9 278.9 278.0 280.3 ~ 3,857 4,084 227 5.89%Dispatchers, except police, fire, and ambulance 296.0 293.0 297.5 296.0 293.0 297.5 296.0 293.0 297.5 123 148 165 17 11.49%Dispatchers, police, fire, and ambulance 310.5 305.5 310.5 310.5 305.5 310.5 310.5 305.5 310.5 61 86 93 7 8.14%Meter readers, utilities 278.0 276.0 283.0 278.0 276.0 283.0 278.0 276.0 283.0 ~ 55 56 1 1.82%Order fillers, wholesale and retail sales NA NA NA NA NA NA NA NA NA 195 227 255 28 12.33%Procurement clerks 296.0 291.0 295.0 296.0 291.0 295.0 296.0 291.0 295.0 ~ 56 55 -1 -1.79%Production, planning, and expediting clerks 302.0 294.0 293.0 302.0 294.0 293.0 302.0 294.0 293.0 210 239 254 15 6.28%Stock clerks 268.5 266.0 264.5 268.5 266.0 264.5 268.5 266.0 264.5 ~ 1,844 1,898 54 2.93%Traffic, shipping, and receiving clerks 282.0 287.0 295.0 282.0 287.0 295.0 282.0 287.0 295.0 ~ 985 1,070 85 8.63%Weighers, measurers, checkers, and samplers, recordkeeping 275.0 273.0 285.0 275.0 273.0 285.0 275.0 273.0 285.0 ~ 47 50 3 6.38%All other material recording, scheduling, and distribution workers 300.0 297.0 302.0 300.0 297.0 302.0 300.0 297.0 302.0 ~ 170 188 18 10.59%
Table 9
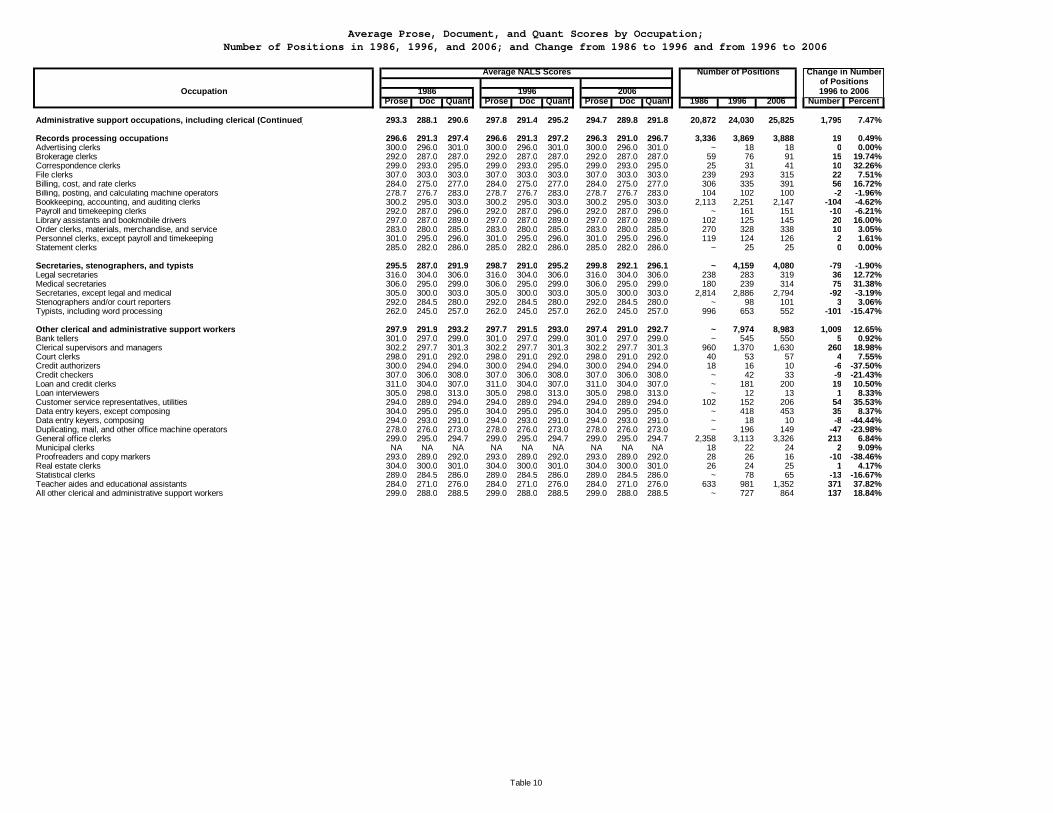
Average Prose, Document, and Quant Scores by Occupation;Number of Positions in 1986, 1996, and 2006; and Change from 1986 to 1996 and from 1996 to 2006
Average NALS Scores Number of Positions Change in Numberof Positions
Occupation 1986 1996 2006 1996 to 2006Prose Doc Quant Prose Doc Quant Prose Doc Quant 1986 1996 2006 Number Percent
Administrative support occupations, including clerical (Continued) 293.3 288.1 290.6 297.8 291.4 295.2 294.7 289.8 291.8 20,872 24,030 25,825 1,795 7.47%
Records processing occupations 296.6 291.3 297.4 296.6 291.3 297.2 296.3 291.0 296.7 3,336 3,869 3,888 19 0.49%Advertising clerks 300.0 296.0 301.0 300.0 296.0 301.0 300.0 296.0 301.0 ~ 18 18 0 0.00%Brokerage clerks 292.0 287.0 287.0 292.0 287.0 287.0 292.0 287.0 287.0 59 76 91 15 19.74%Correspondence clerks 299.0 293.0 295.0 299.0 293.0 295.0 299.0 293.0 295.0 25 31 41 10 32.26%File clerks 307.0 303.0 303.0 307.0 303.0 303.0 307.0 303.0 303.0 239 293 315 22 7.51%Billing, cost, and rate clerks 284.0 275.0 277.0 284.0 275.0 277.0 284.0 275.0 277.0 306 335 391 56 16.72%Billing, posting, and calculating machine operators 278.7 276.7 283.0 278.7 276.7 283.0 278.7 276.7 283.0 104 102 100 -2 -1.96%Bookkeeping, accounting, and auditing clerks 300.2 295.0 303.0 300.2 295.0 303.0 300.2 295.0 303.0 2,113 2,251 2,147 -104 -4.62%Payroll and timekeeping clerks 292.0 287.0 296.0 292.0 287.0 296.0 292.0 287.0 296.0 ~ 161 151 -10 -6.21%Library assistants and bookmobile drivers 297.0 287.0 289.0 297.0 287.0 289.0 297.0 287.0 289.0 102 125 145 20 16.00%Order clerks, materials, merchandise, and service 283.0 280.0 285.0 283.0 280.0 285.0 283.0 280.0 285.0 270 328 338 10 3.05%Personnel clerks, except payroll and timekeeping 301.0 295.0 296.0 301.0 295.0 296.0 301.0 295.0 296.0 119 124 126 2 1.61%Statement clerks 285.0 282.0 286.0 285.0 282.0 286.0 285.0 282.0 286.0 ~ 25 25 0 0.00%
Secretaries, stenographers, and typists 295.5 287.0 291.9 298.7 291.0 295.2 299.8 292.1 296.1 ~ 4,159 4,080 -79 -1.90%Legal secretaries 316.0 304.0 306.0 316.0 304.0 306.0 316.0 304.0 306.0 238 283 319 36 12.72%Medical secretaries 306.0 295.0 299.0 306.0 295.0 299.0 306.0 295.0 299.0 180 239 314 75 31.38%Secretaries, except legal and medical 305.0 300.0 303.0 305.0 300.0 303.0 305.0 300.0 303.0 2,814 2,886 2,794 -92 -3.19%Stenographers and/or court reporters 292.0 284.5 280.0 292.0 284.5 280.0 292.0 284.5 280.0 ~ 98 101 3 3.06%Typists, including word processing 262.0 245.0 257.0 262.0 245.0 257.0 262.0 245.0 257.0 996 653 552 -101 -15.47%
Other clerical and administrative support workers 297.9 291.9 293.2 297.7 291.5 293.0 297.4 291.0 292.7 ~ 7,974 8,983 1,009 12.65%Bank tellers 301.0 297.0 299.0 301.0 297.0 299.0 301.0 297.0 299.0 ~ 545 550 5 0.92%Clerical supervisors and managers 302.2 297.7 301.3 302.2 297.7 301.3 302.2 297.7 301.3 960 1,370 1,630 260 18.98%Court clerks 298.0 291.0 292.0 298.0 291.0 292.0 298.0 291.0 292.0 40 53 57 4 7.55%Credit authorizers 300.0 294.0 294.0 300.0 294.0 294.0 300.0 294.0 294.0 18 16 10 -6 -37.50%Credit checkers 307.0 306.0 308.0 307.0 306.0 308.0 307.0 306.0 308.0 ~ 42 33 -9 -21.43%Loan and credit clerks 311.0 304.0 307.0 311.0 304.0 307.0 311.0 304.0 307.0 ~ 181 200 19 10.50%Loan interviewers 305.0 298.0 313.0 305.0 298.0 313.0 305.0 298.0 313.0 ~ 12 13 1 8.33%Customer service representatives, utilities 294.0 289.0 294.0 294.0 289.0 294.0 294.0 289.0 294.0 102 152 206 54 35.53%Data entry keyers, except composing 304.0 295.0 295.0 304.0 295.0 295.0 304.0 295.0 295.0 ~ 418 453 35 8.37%Data entry keyers, composing 294.0 293.0 291.0 294.0 293.0 291.0 294.0 293.0 291.0 ~ 18 10 -8 -44.44%Duplicating, mail, and other office machine operators 278.0 276.0 273.0 278.0 276.0 273.0 278.0 276.0 273.0 ~ 196 149 -47 -23.98%General office clerks 299.0 295.0 294.7 299.0 295.0 294.7 299.0 295.0 294.7 2,358 3,113 3,326 213 6.84%Municipal clerks NA NA NA NA NA NA NA NA NA 18 22 24 2 9.09%Proofreaders and copy markers 293.0 289.0 292.0 293.0 289.0 292.0 293.0 289.0 292.0 28 26 16 -10 -38.46%Real estate clerks 304.0 300.0 301.0 304.0 300.0 301.0 304.0 300.0 301.0 26 24 25 1 4.17%Statistical clerks 289.0 284.5 286.0 289.0 284.5 286.0 289.0 284.5 286.0 ~ 78 65 -13 -16.67%Teacher aides and educational assistants 284.0 271.0 276.0 284.0 271.0 276.0 284.0 271.0 276.0 633 981 1,352 371 37.82%All other clerical and administrative support workers 299.0 288.0 288.5 299.0 288.0 288.5 299.0 288.0 288.5 ~ 727 864 137 18.84%
Table 10
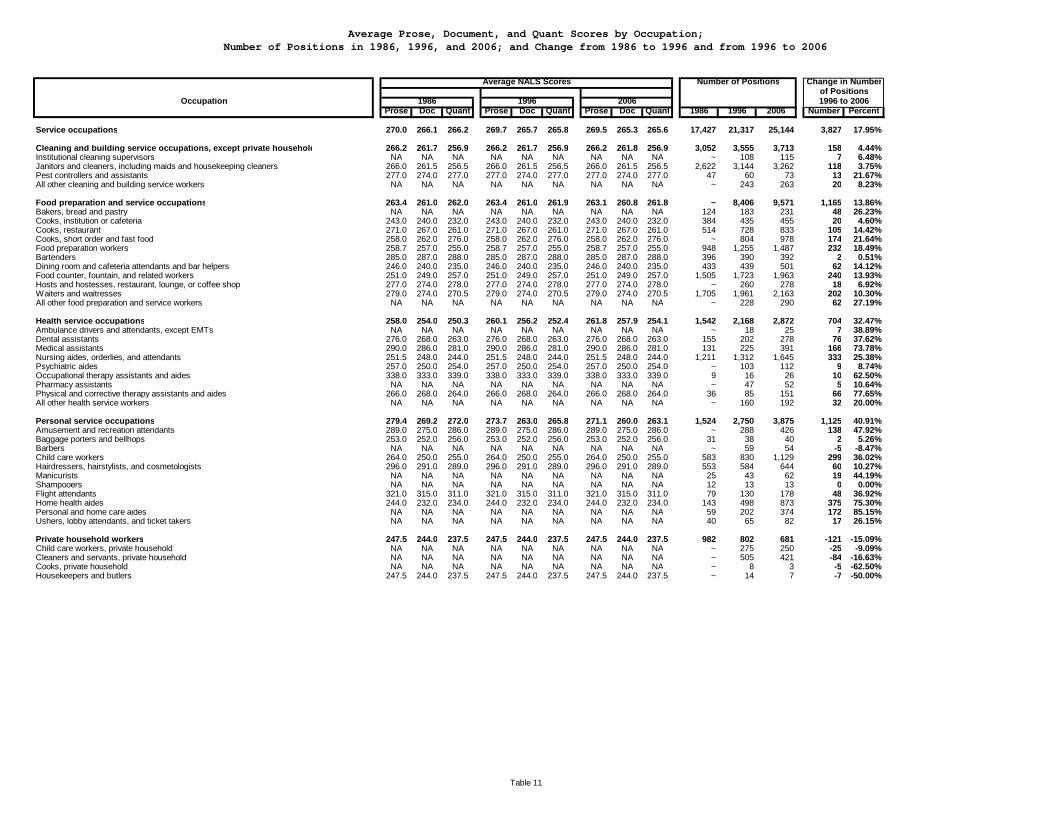
Average Prose, Document, and Quant Scores by Occupation;Number of Positions in 1986, 1996, and 2006; and Change from 1986 to 1996 and from 1996 to 2006
Average NALS Scores Number of Positions Change in Numberof Positions
Occupation 1986 1996 2006 1996 to 2006Prose Doc Quant Prose Doc Quant Prose Doc Quant 1986 1996 2006 Number Percent
Service occupations 270.0 266.1 266.2 269.7 265.7 265.8 269.5 265.3 265.6 17,427 21,317 25,144 3,827 17.95%
Cleaning and building service occupations, except private household 266.2 261.7 256.9 266.2 261.7 256.9 266.2 261.8 256.9 3,052 3,555 3,713 158 4.44%Institutional cleaning supervisors NA NA NA NA NA NA NA NA NA ~ 108 115 7 6.48%Janitors and cleaners, including maids and housekeeping cleaners 266.0 261.5 256.5 266.0 261.5 256.5 266.0 261.5 256.5 2,622 3,144 3,262 118 3.75%Pest controllers and assistants 277.0 274.0 277.0 277.0 274.0 277.0 277.0 274.0 277.0 47 60 73 13 21.67%All other cleaning and building service workers NA NA NA NA NA NA NA NA NA ~ 243 263 20 8.23%
Food preparation and service occupations 263.4 261.0 262.0 263.4 261.0 261.9 263.1 260.8 261.8 ~ 8,406 9,571 1,165 13.86%Bakers, bread and pastry NA NA NA NA NA NA NA NA NA 124 183 231 48 26.23%Cooks, institution or cafeteria 243.0 240.0 232.0 243.0 240.0 232.0 243.0 240.0 232.0 384 435 455 20 4.60%Cooks, restaurant 271.0 267.0 261.0 271.0 267.0 261.0 271.0 267.0 261.0 514 728 833 105 14.42%Cooks, short order and fast food 258.0 262.0 276.0 258.0 262.0 276.0 258.0 262.0 276.0 ~ 804 978 174 21.64%Food preparation workers 258.7 257.0 255.0 258.7 257.0 255.0 258.7 257.0 255.0 948 1,255 1,487 232 18.49%Bartenders 285.0 287.0 288.0 285.0 287.0 288.0 285.0 287.0 288.0 396 390 392 2 0.51%Dining room and cafeteria attendants and bar helpers 246.0 240.0 235.0 246.0 240.0 235.0 246.0 240.0 235.0 433 439 501 62 14.12%Food counter, fountain, and related workers 251.0 249.0 257.0 251.0 249.0 257.0 251.0 249.0 257.0 1,505 1,723 1,963 240 13.93%Hosts and hostesses, restaurant, lounge, or coffee shop 277.0 274.0 278.0 277.0 274.0 278.0 277.0 274.0 278.0 ~ 260 278 18 6.92%Waiters and waitresses 279.0 274.0 270.5 279.0 274.0 270.5 279.0 274.0 270.5 1,705 1,961 2,163 202 10.30%All other food preparation and service workers NA NA NA NA NA NA NA NA NA ~ 228 290 62 27.19%
Health service occupations 258.0 254.0 250.3 260.1 256.2 252.4 261.8 257.9 254.1 1,542 2,168 2,872 704 32.47%Ambulance drivers and attendants, except EMTs NA NA NA NA NA NA NA NA NA ~ 18 25 7 38.89%Dental assistants 276.0 268.0 263.0 276.0 268.0 263.0 276.0 268.0 263.0 155 202 278 76 37.62%Medical assistants 290.0 286.0 281.0 290.0 286.0 281.0 290.0 286.0 281.0 131 225 391 166 73.78%Nursing aides, orderlies, and attendants 251.5 248.0 244.0 251.5 248.0 244.0 251.5 248.0 244.0 1,211 1,312 1,645 333 25.38%Psychiatric aides 257.0 250.0 254.0 257.0 250.0 254.0 257.0 250.0 254.0 ~ 103 112 9 8.74%Occupational therapy assistants and aides 338.0 333.0 339.0 338.0 333.0 339.0 338.0 333.0 339.0 9 16 26 10 62.50%Pharmacy assistants NA NA NA NA NA NA NA NA NA ~ 47 52 5 10.64%Physical and corrective therapy assistants and aides 266.0 268.0 264.0 266.0 268.0 264.0 266.0 268.0 264.0 36 85 151 66 77.65%All other health service workers NA NA NA NA NA NA NA NA NA ~ 160 192 32 20.00%
Personal service occupations 279.4 269.2 272.0 273.7 263.0 265.8 271.1 260.0 263.1 1,524 2,750 3,875 1,125 40.91%Amusement and recreation attendants 289.0 275.0 286.0 289.0 275.0 286.0 289.0 275.0 286.0 ~ 288 426 138 47.92%Baggage porters and bellhops 253.0 252.0 256.0 253.0 252.0 256.0 253.0 252.0 256.0 31 38 40 2 5.26%Barbers NA NA NA NA NA NA NA NA NA ~ 59 54 -5 -8.47%Child care workers 264.0 250.0 255.0 264.0 250.0 255.0 264.0 250.0 255.0 583 830 1,129 299 36.02%Hairdressers, hairstylists, and cosmetologists 296.0 291.0 289.0 296.0 291.0 289.0 296.0 291.0 289.0 553 584 644 60 10.27%Manicurists NA NA NA NA NA NA NA NA NA 25 43 62 19 44.19%Shampooers NA NA NA NA NA NA NA NA NA 12 13 13 0 0.00%Flight attendants 321.0 315.0 311.0 321.0 315.0 311.0 321.0 315.0 311.0 79 130 178 48 36.92%Home health aides 244.0 232.0 234.0 244.0 232.0 234.0 244.0 232.0 234.0 143 498 873 375 75.30%Personal and home care aides NA NA NA NA NA NA NA NA NA 59 202 374 172 85.15%Ushers, lobby attendants, and ticket takers NA NA NA NA NA NA NA NA NA 40 65 82 17 26.15%
Private household workers 247.5 244.0 237.5 247.5 244.0 237.5 247.5 244.0 237.5 982 802 681 -121 -15.09%Child care workers, private household NA NA NA NA NA NA NA NA NA ~ 275 250 -25 -9.09%Cleaners and servants, private household NA NA NA NA NA NA NA NA NA ~ 505 421 -84 -16.63%Cooks, private household NA NA NA NA NA NA NA NA NA ~ 8 3 -5 -62.50%Housekeepers and butlers 247.5 244.0 237.5 247.5 244.0 237.5 247.5 244.0 237.5 ~ 14 7 -7 -50.00%
Table 11
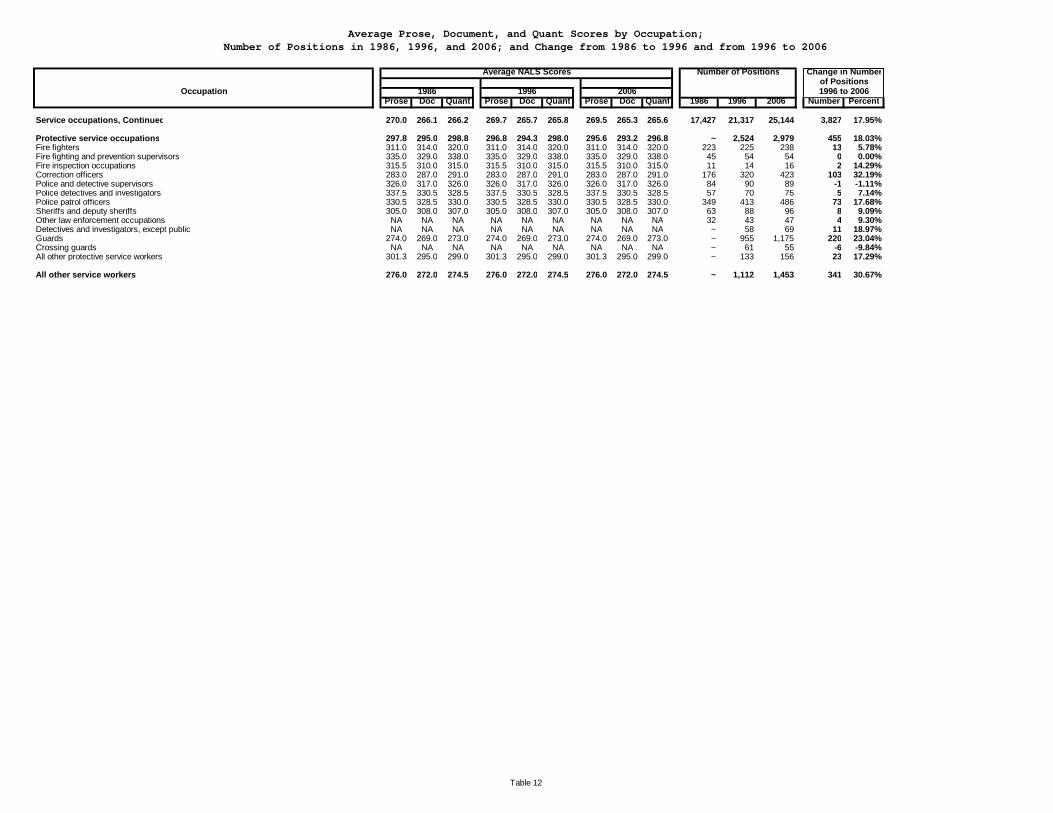
Average Prose, Document, and Quant Scores by Occupation;Number of Positions in 1986, 1996, and 2006; and Change from 1986 to 1996 and from 1996 to 2006
Average NALS Scores Number of Positions Change in Numberof Positions
Occupation 1986 1996 2006 1996 to 2006Prose Doc Quant Prose Doc Quant Prose Doc Quant 1986 1996 2006 Number Percent
Service occupations, Continued 270.0 266.1 266.2 269.7 265.7 265.8 269.5 265.3 265.6 17,427 21,317 25,144 3,827 17.95%
Protective service occupations 297.8 295.0 298.8 296.8 294.3 298.0 295.6 293.2 296.8 ~ 2,524 2,979 455 18.03%Fire fighters 311.0 314.0 320.0 311.0 314.0 320.0 311.0 314.0 320.0 223 225 238 13 5.78%Fire fighting and prevention supervisors 335.0 329.0 338.0 335.0 329.0 338.0 335.0 329.0 338.0 45 54 54 0 0.00%Fire inspection occupations 315.5 310.0 315.0 315.5 310.0 315.0 315.5 310.0 315.0 11 14 16 2 14.29%Correction officers 283.0 287.0 291.0 283.0 287.0 291.0 283.0 287.0 291.0 176 320 423 103 32.19%Police and detective supervisors 326.0 317.0 326.0 326.0 317.0 326.0 326.0 317.0 326.0 84 90 89 -1 -1.11%Police detectives and investigators 337.5 330.5 328.5 337.5 330.5 328.5 337.5 330.5 328.5 57 70 75 5 7.14%Police patrol officers 330.5 328.5 330.0 330.5 328.5 330.0 330.5 328.5 330.0 349 413 486 73 17.68%Sheriffs and deputy sheriffs 305.0 308.0 307.0 305.0 308.0 307.0 305.0 308.0 307.0 63 88 96 8 9.09%Other law enforcement occupations NA NA NA NA NA NA NA NA NA 32 43 47 4 9.30%Detectives and investigators, except public NA NA NA NA NA NA NA NA NA ~ 58 69 11 18.97%Guards 274.0 269.0 273.0 274.0 269.0 273.0 274.0 269.0 273.0 ~ 955 1,175 220 23.04%Crossing guards NA NA NA NA NA NA NA NA NA ~ 61 55 -6 -9.84%All other protective service workers 301.3 295.0 299.0 301.3 295.0 299.0 301.3 295.0 299.0 ~ 133 156 23 17.29%
All other service workers 276.0 272.0 274.5 276.0 272.0 274.5 276.0 272.0 274.5 ~ 1,112 1,453 341 30.67%
Table 12
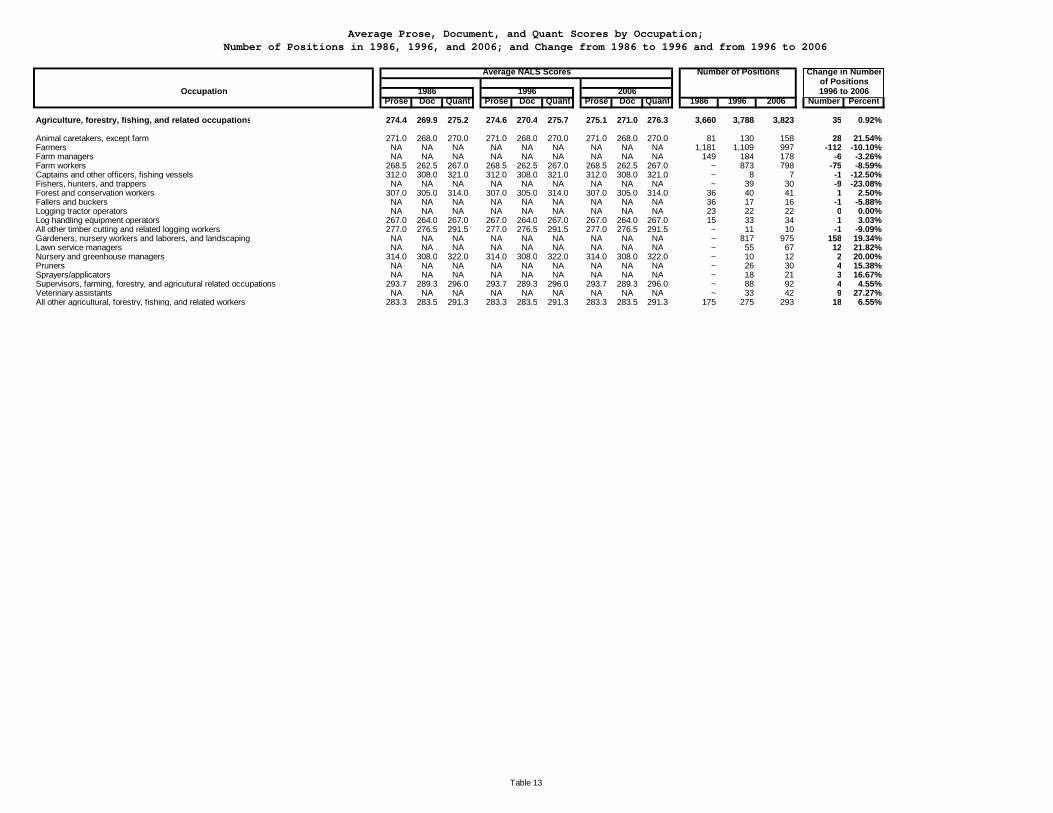
Average Prose, Document, and Quant Scores by Occupation;Number of Positions in 1986, 1996, and 2006; and Change from 1986 to 1996 and from 1996 to 2006
Average NALS Scores Number of Positions Change in Numberof Positions
Occupation 1986 1996 2006 1996 to 2006Prose Doc Quant Prose Doc Quant Prose Doc Quant 1986 1996 2006 Number Percent
Agriculture, forestry, fishing, and related occupations 274.4 269.9 275.2 274.6 270.4 275.7 275.1 271.0 276.3 3,660 3,788 3,823 35 0.92%
Animal caretakers, except farm 271.0 268.0 270.0 271.0 268.0 270.0 271.0 268.0 270.0 81 130 158 28 21.54%Farmers NA NA NA NA NA NA NA NA NA 1,181 1,109 997 -112 -10.10%Farm managers NA NA NA NA NA NA NA NA NA 149 184 178 -6 -3.26%Farm workers 268.5 262.5 267.0 268.5 262.5 267.0 268.5 262.5 267.0 ~ 873 798 -75 -8.59%Captains and other officers, fishing vessels 312.0 308.0 321.0 312.0 308.0 321.0 312.0 308.0 321.0 ~ 8 7 -1 -12.50%Fishers, hunters, and trappers NA NA NA NA NA NA NA NA NA ~ 39 30 -9 -23.08%Forest and conservation workers 307.0 305.0 314.0 307.0 305.0 314.0 307.0 305.0 314.0 36 40 41 1 2.50%Fallers and buckers NA NA NA NA NA NA NA NA NA 36 17 16 -1 -5.88%Logging tractor operators NA NA NA NA NA NA NA NA NA 23 22 22 0 0.00%Log handling equipment operators 267.0 264.0 267.0 267.0 264.0 267.0 267.0 264.0 267.0 15 33 34 1 3.03%All other timber cutting and related logging workers 277.0 276.5 291.5 277.0 276.5 291.5 277.0 276.5 291.5 ~ 11 10 -1 -9.09%Gardeners, nursery workers and laborers, and landscaping NA NA NA NA NA NA NA NA NA ~ 817 975 158 19.34%Lawn service managers NA NA NA NA NA NA NA NA NA ~ 55 67 12 21.82%Nursery and greenhouse managers 314.0 308.0 322.0 314.0 308.0 322.0 314.0 308.0 322.0 ~ 10 12 2 20.00%Pruners NA NA NA NA NA NA NA NA NA ~ 26 30 4 15.38%Sprayers/applicators NA NA NA NA NA NA NA NA NA ~ 18 21 3 16.67%Supervisors, farming, forestry, and agricutural related occupations 293.7 289.3 296.0 293.7 289.3 296.0 293.7 289.3 296.0 ~ 88 92 4 4.55%Veterinary assistants NA NA NA NA NA NA NA NA NA ~ 33 42 9 27.27%All other agricultural, forestry, fishing, and related workers 283.3 283.5 291.3 283.3 283.5 291.3 283.3 283.5 291.3 175 275 293 18 6.55%
Table 13
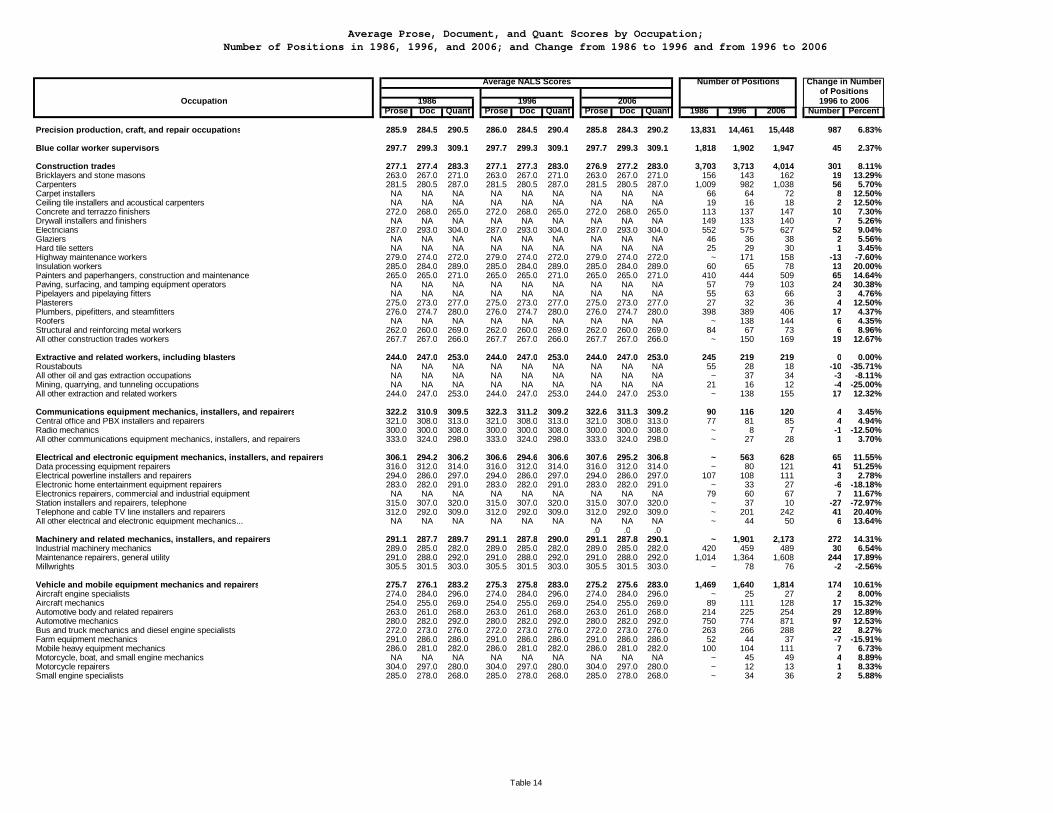
Average Prose, Document, and Quant Scores by Occupation;Number of Positions in 1986, 1996, and 2006; and Change from 1986 to 1996 and from 1996 to 2006
Average NALS Scores Number of Positions Change in Numberof Positions
Occupation 1986 1996 2006 1996 to 2006Prose Doc Quant Prose Doc Quant Prose Doc Quant 1986 1996 2006 Number Percent
Precision production, craft, and repair occupations 285.9 284.5 290.5 286.0 284.5 290.4 285.8 284.3 290.2 13,831 14,461 15,448 987 6.83%
Blue collar worker supervisors 297.7 299.3 309.1 297.7 299.3 309.1 297.7 299.3 309.1 1,818 1,902 1,947 45 2.37%
Construction trades 277.1 277.4 283.3 277.1 277.3 283.0 276.9 277.2 283.0 3,703 3,713 4,014 301 8.11%Bricklayers and stone masons 263.0 267.0 271.0 263.0 267.0 271.0 263.0 267.0 271.0 156 143 162 19 13.29%Carpenters 281.5 280.5 287.0 281.5 280.5 287.0 281.5 280.5 287.0 1,009 982 1,038 56 5.70%Carpet installers NA NA NA NA NA NA NA NA NA 66 64 72 8 12.50%Ceiling tile installers and acoustical carpenters NA NA NA NA NA NA NA NA NA 19 16 18 2 12.50%Concrete and terrazzo finishers 272.0 268.0 265.0 272.0 268.0 265.0 272.0 268.0 265.0 113 137 147 10 7.30%Drywall installers and finishers NA NA NA NA NA NA NA NA NA 149 133 140 7 5.26%Electricians 287.0 293.0 304.0 287.0 293.0 304.0 287.0 293.0 304.0 552 575 627 52 9.04%Glaziers NA NA NA NA NA NA NA NA NA 46 36 38 2 5.56%Hard tile setters NA NA NA NA NA NA NA NA NA 25 29 30 1 3.45%Highway maintenance workers 279.0 274.0 272.0 279.0 274.0 272.0 279.0 274.0 272.0 ~ 171 158 -13 -7.60%Insulation workers 285.0 284.0 289.0 285.0 284.0 289.0 285.0 284.0 289.0 60 65 78 13 20.00%Painters and paperhangers, construction and maintenance 265.0 265.0 271.0 265.0 265.0 271.0 265.0 265.0 271.0 410 444 509 65 14.64%Paving, surfacing, and tamping equipment operators NA NA NA NA NA NA NA NA NA 57 79 103 24 30.38%Pipelayers and pipelaying fitters NA NA NA NA NA NA NA NA NA 55 63 66 3 4.76%Plasterers 275.0 273.0 277.0 275.0 273.0 277.0 275.0 273.0 277.0 27 32 36 4 12.50%Plumbers, pipefitters, and steamfitters 276.0 274.7 280.0 276.0 274.7 280.0 276.0 274.7 280.0 398 389 406 17 4.37%Roofers NA NA NA NA NA NA NA NA NA ~ 138 144 6 4.35%Structural and reinforcing metal workers 262.0 260.0 269.0 262.0 260.0 269.0 262.0 260.0 269.0 84 67 73 6 8.96%All other construction trades workers 267.7 267.0 266.0 267.7 267.0 266.0 267.7 267.0 266.0 ~ 150 169 19 12.67%
Extractive and related workers, including blasters 244.0 247.0 253.0 244.0 247.0 253.0 244.0 247.0 253.0 245 219 219 0 0.00%Roustabouts NA NA NA NA NA NA NA NA NA 55 28 18 -10 -35.71%All other oil and gas extraction occupations NA NA NA NA NA NA NA NA NA ~ 37 34 -3 -8.11%Mining, quarrying, and tunneling occupations NA NA NA NA NA NA NA NA NA 21 16 12 -4 -25.00%All other extraction and related workers 244.0 247.0 253.0 244.0 247.0 253.0 244.0 247.0 253.0 ~ 138 155 17 12.32%
Communications equipment mechanics, installers, and repairers 322.2 310.9 309.5 322.3 311.2 309.2 322.6 311.3 309.2 90 116 120 4 3.45%Central office and PBX installers and repairers 321.0 308.0 313.0 321.0 308.0 313.0 321.0 308.0 313.0 77 81 85 4 4.94%Radio mechanics 300.0 300.0 308.0 300.0 300.0 308.0 300.0 300.0 308.0 ~ 8 7 -1 -12.50%All other communications equipment mechanics, installers, and repairers 333.0 324.0 298.0 333.0 324.0 298.0 333.0 324.0 298.0 ~ 27 28 1 3.70%
Electrical and electronic equipment mechanics, installers, and repairers 306.1 294.2 306.2 306.6 294.6 306.6 307.6 295.2 306.8 ~ 563 628 65 11.55%Data processing equipment repairers 316.0 312.0 314.0 316.0 312.0 314.0 316.0 312.0 314.0 ~ 80 121 41 51.25%Electrical powerline installers and repairers 294.0 286.0 297.0 294.0 286.0 297.0 294.0 286.0 297.0 107 108 111 3 2.78%Electronic home entertainment equipment repairers 283.0 282.0 291.0 283.0 282.0 291.0 283.0 282.0 291.0 ~ 33 27 -6 -18.18%Electronics repairers, commercial and industrial equipment NA NA NA NA NA NA NA NA NA 79 60 67 7 11.67%Station installers and repairers, telephone 315.0 307.0 320.0 315.0 307.0 320.0 315.0 307.0 320.0 ~ 37 10 -27 -72.97%Telephone and cable TV line installers and repairers 312.0 292.0 309.0 312.0 292.0 309.0 312.0 292.0 309.0 ~ 201 242 41 20.40%All other electrical and electronic equipment mechanics... NA NA NA NA NA NA NA NA NA ~ 44 50 6 13.64%
.0 .0 .0Machinery and related mechanics, installers, and repairers 291.1 287.7 289.7 291.1 287.8 290.0 291.1 287.8 290.1 ~ 1,901 2,173 272 14.31%Industrial machinery mechanics 289.0 285.0 282.0 289.0 285.0 282.0 289.0 285.0 282.0 420 459 489 30 6.54%Maintenance repairers, general utility 291.0 288.0 292.0 291.0 288.0 292.0 291.0 288.0 292.0 1,014 1,364 1,608 244 17.89%Millwrights 305.5 301.5 303.0 305.5 301.5 303.0 305.5 301.5 303.0 ~ 78 76 -2 -2.56%
Vehicle and mobile equipment mechanics and repairers 275.7 276.1 283.2 275.3 275.8 283.0 275.2 275.6 283.0 1,469 1,640 1,814 174 10.61%Aircraft engine specialists 274.0 284.0 296.0 274.0 284.0 296.0 274.0 284.0 296.0 ~ 25 27 2 8.00%Aircraft mechanics 254.0 255.0 269.0 254.0 255.0 269.0 254.0 255.0 269.0 89 111 128 17 15.32%Automotive body and related repairers 263.0 261.0 268.0 263.0 261.0 268.0 263.0 261.0 268.0 214 225 254 29 12.89%Automotive mechanics 280.0 282.0 292.0 280.0 282.0 292.0 280.0 282.0 292.0 750 774 871 97 12.53%Bus and truck mechanics and diesel engine specialists 272.0 273.0 276.0 272.0 273.0 276.0 272.0 273.0 276.0 263 266 288 22 8.27%Farm equipment mechanics 291.0 286.0 286.0 291.0 286.0 286.0 291.0 286.0 286.0 52 44 37 -7 -15.91%Mobile heavy equipment mechanics 286.0 281.0 282.0 286.0 281.0 282.0 286.0 281.0 282.0 100 104 111 7 6.73%Motorcycle, boat, and small engine mechanics NA NA NA NA NA NA NA NA NA ~ 45 49 4 8.89%Motorcycle repairers 304.0 297.0 280.0 304.0 297.0 280.0 304.0 297.0 280.0 ~ 12 13 1 8.33%Small engine specialists 285.0 278.0 268.0 285.0 278.0 268.0 285.0 278.0 268.0 ~ 34 36 2 5.88%
Table 14
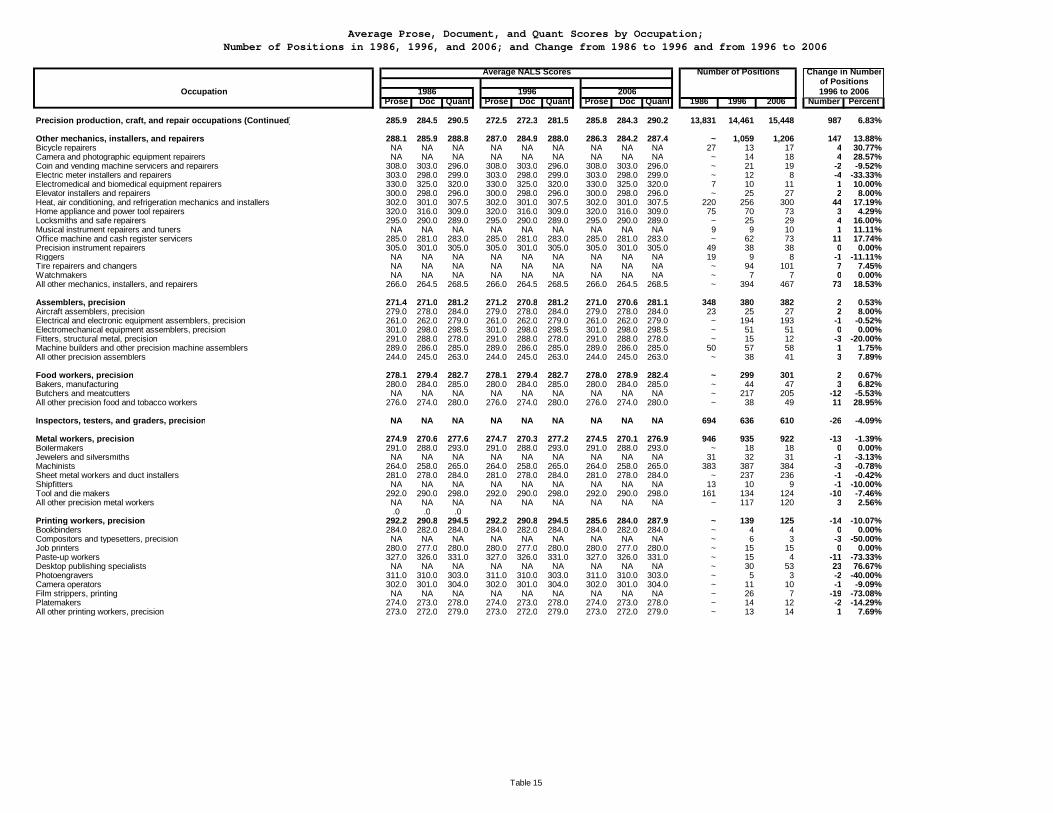
Average Prose, Document, and Quant Scores by Occupation;Number of Positions in 1986, 1996, and 2006; and Change from 1986 to 1996 and from 1996 to 2006
Average NALS Scores Number of Positions Change in Numberof Positions
Occupation 1986 1996 2006 1996 to 2006Prose Doc Quant Prose Doc Quant Prose Doc Quant 1986 1996 2006 Number Percent
Precision production, craft, and repair occupations (Continued) 285.9 284.5 290.5 272.5 272.3 281.5 285.8 284.3 290.2 13,831 14,461 15,448 987 6.83%
Other mechanics, installers, and repairers 288.1 285.9 288.8 287.0 284.9 288.0 286.3 284.2 287.4 ~ 1,059 1,206 147 13.88%Bicycle repairers NA NA NA NA NA NA NA NA NA 27 13 17 4 30.77%Camera and photographic equipment repairers NA NA NA NA NA NA NA NA NA ~ 14 18 4 28.57%Coin and vending machine servicers and repairers 308.0 303.0 296.0 308.0 303.0 296.0 308.0 303.0 296.0 ~ 21 19 -2 -9.52%Electric meter installers and repairers 303.0 298.0 299.0 303.0 298.0 299.0 303.0 298.0 299.0 ~ 12 8 -4 -33.33%Electromedical and biomedical equipment repairers 330.0 325.0 320.0 330.0 325.0 320.0 330.0 325.0 320.0 7 10 11 1 10.00%Elevator installers and repairers 300.0 298.0 296.0 300.0 298.0 296.0 300.0 298.0 296.0 ~ 25 27 2 8.00%Heat, air conditioning, and refrigeration mechanics and installers 302.0 301.0 307.5 302.0 301.0 307.5 302.0 301.0 307.5 220 256 300 44 17.19%Home appliance and power tool repairers 320.0 316.0 309.0 320.0 316.0 309.0 320.0 316.0 309.0 75 70 73 3 4.29%Locksmiths and safe repairers 295.0 290.0 289.0 295.0 290.0 289.0 295.0 290.0 289.0 ~ 25 29 4 16.00%Musical instrument repairers and tuners NA NA NA NA NA NA NA NA NA 9 9 10 1 11.11%Office machine and cash register servicers 285.0 281.0 283.0 285.0 281.0 283.0 285.0 281.0 283.0 ~ 62 73 11 17.74%Precision instrument repairers 305.0 301.0 305.0 305.0 301.0 305.0 305.0 301.0 305.0 49 38 38 0 0.00%Riggers NA NA NA NA NA NA NA NA NA 19 9 8 -1 -11.11%Tire repairers and changers NA NA NA NA NA NA NA NA NA ~ 94 101 7 7.45%Watchmakers NA NA NA NA NA NA NA NA NA ~ 7 7 0 0.00%All other mechanics, installers, and repairers 266.0 264.5 268.5 266.0 264.5 268.5 266.0 264.5 268.5 ~ 394 467 73 18.53%
Assemblers, precision 271.4 271.0 281.2 271.2 270.8 281.2 271.0 270.6 281.1 348 380 382 2 0.53%Aircraft assemblers, precision 279.0 278.0 284.0 279.0 278.0 284.0 279.0 278.0 284.0 23 25 27 2 8.00%Electrical and electronic equipment assemblers, precision 261.0 262.0 279.0 261.0 262.0 279.0 261.0 262.0 279.0 ~ 194 193 -1 -0.52%Electromechanical equipment assemblers, precision 301.0 298.0 298.5 301.0 298.0 298.5 301.0 298.0 298.5 ~ 51 51 0 0.00%Fitters, structural metal, precision 291.0 288.0 278.0 291.0 288.0 278.0 291.0 288.0 278.0 ~ 15 12 -3 -20.00%Machine builders and other precision machine assemblers 289.0 286.0 285.0 289.0 286.0 285.0 289.0 286.0 285.0 50 57 58 1 1.75%All other precision assemblers 244.0 245.0 263.0 244.0 245.0 263.0 244.0 245.0 263.0 ~ 38 41 3 7.89%
Food workers, precision 278.1 279.4 282.7 278.1 279.4 282.7 278.0 278.9 282.4 ~ 299 301 2 0.67%Bakers, manufacturing 280.0 284.0 285.0 280.0 284.0 285.0 280.0 284.0 285.0 ~ 44 47 3 6.82%Butchers and meatcutters NA NA NA NA NA NA NA NA NA ~ 217 205 -12 -5.53%All other precision food and tobacco workers 276.0 274.0 280.0 276.0 274.0 280.0 276.0 274.0 280.0 ~ 38 49 11 28.95%
Inspectors, testers, and graders, precision NA NA NA NA NA NA NA NA NA 694 636 610 -26 -4.09%
Metal workers, precision 274.9 270.6 277.6 274.7 270.3 277.2 274.5 270.1 276.9 946 935 922 -13 -1.39%Boilermakers 291.0 288.0 293.0 291.0 288.0 293.0 291.0 288.0 293.0 ~ 18 18 0 0.00%Jewelers and silversmiths NA NA NA NA NA NA NA NA NA 31 32 31 -1 -3.13%Machinists 264.0 258.0 265.0 264.0 258.0 265.0 264.0 258.0 265.0 383 387 384 -3 -0.78%Sheet metal workers and duct installers 281.0 278.0 284.0 281.0 278.0 284.0 281.0 278.0 284.0 ~ 237 236 -1 -0.42%Shipfitters NA NA NA NA NA NA NA NA NA 13 10 9 -1 -10.00%Tool and die makers 292.0 290.0 298.0 292.0 290.0 298.0 292.0 290.0 298.0 161 134 124 -10 -7.46%All other precision metal workers NA NA NA NA NA NA NA NA NA ~ 117 120 3 2.56%
.0 .0 .0Printing workers, precision 292.2 290.8 294.5 292.2 290.8 294.5 285.6 284.0 287.9 ~ 139 125 -14 -10.07%Bookbinders 284.0 282.0 284.0 284.0 282.0 284.0 284.0 282.0 284.0 ~ 4 4 0 0.00%Compositors and typesetters, precision NA NA NA NA NA NA NA NA NA ~ 6 3 -3 -50.00%Job printers 280.0 277.0 280.0 280.0 277.0 280.0 280.0 277.0 280.0 ~ 15 15 0 0.00%Paste-up workers 327.0 326.0 331.0 327.0 326.0 331.0 327.0 326.0 331.0 ~ 15 4 -11 -73.33%Desktop publishing specialists NA NA NA NA NA NA NA NA NA ~ 30 53 23 76.67%Photoengravers 311.0 310.0 303.0 311.0 310.0 303.0 311.0 310.0 303.0 ~ 5 3 -2 -40.00%Camera operators 302.0 301.0 304.0 302.0 301.0 304.0 302.0 301.0 304.0 ~ 11 10 -1 -9.09%Film strippers, printing NA NA NA NA NA NA NA NA NA ~ 26 7 -19 -73.08%Platemakers 274.0 273.0 278.0 274.0 273.0 278.0 274.0 273.0 278.0 ~ 14 12 -2 -14.29%All other printing workers, precision 273.0 272.0 279.0 273.0 272.0 279.0 273.0 272.0 279.0 ~ 13 14 1 7.69%
Table 15
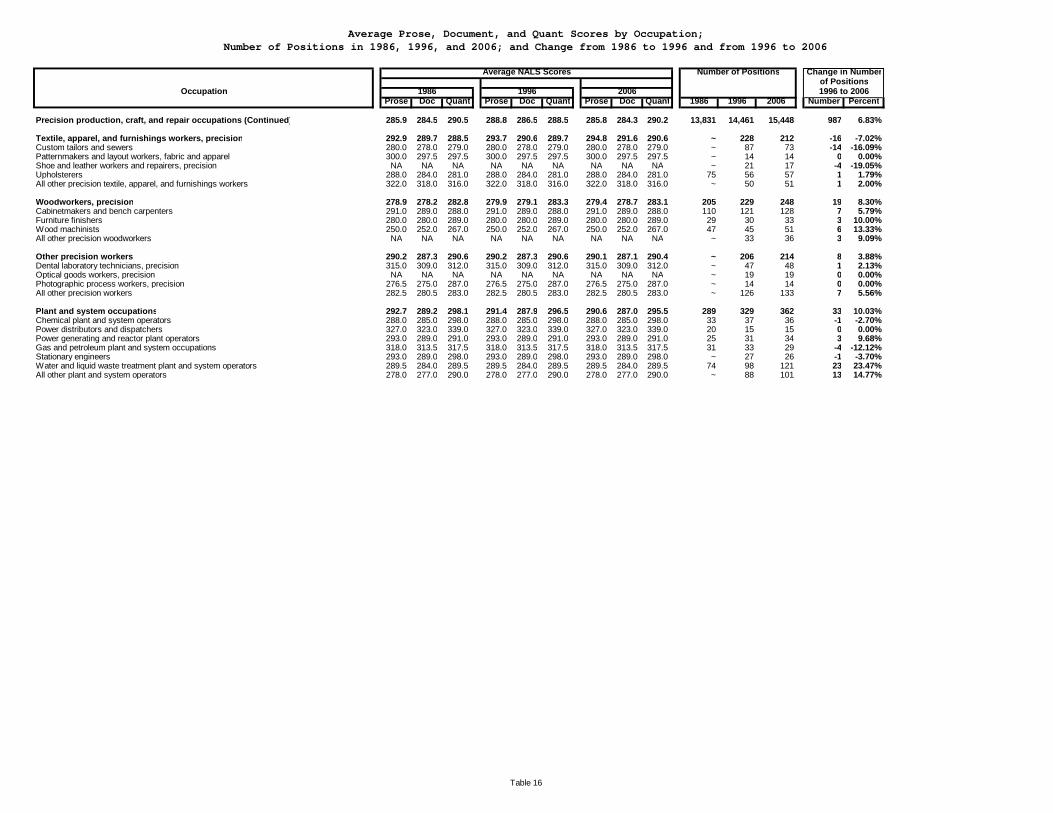
Average Prose, Document, and Quant Scores by Occupation;Number of Positions in 1986, 1996, and 2006; and Change from 1986 to 1996 and from 1996 to 2006
Average NALS Scores Number of Positions Change in Numberof Positions
Occupation 1986 1996 2006 1996 to 2006Prose Doc Quant Prose Doc Quant Prose Doc Quant 1986 1996 2006 Number Percent
Precision production, craft, and repair occupations (Continued) 285.9 284.5 290.5 288.8 286.5 288.5 285.8 284.3 290.2 13,831 14,461 15,448 987 6.83%
Textile, apparel, and furnishings workers, precision 292.9 289.7 288.5 293.7 290.6 289.7 294.8 291.6 290.6 ~ 228 212 -16 -7.02%Custom tailors and sewers 280.0 278.0 279.0 280.0 278.0 279.0 280.0 278.0 279.0 ~ 87 73 -14 -16.09%Patternmakers and layout workers, fabric and apparel 300.0 297.5 297.5 300.0 297.5 297.5 300.0 297.5 297.5 ~ 14 14 0 0.00%Shoe and leather workers and repairers, precision NA NA NA NA NA NA NA NA NA ~ 21 17 -4 -19.05%Upholsterers 288.0 284.0 281.0 288.0 284.0 281.0 288.0 284.0 281.0 75 56 57 1 1.79%All other precision textile, apparel, and furnishings workers 322.0 318.0 316.0 322.0 318.0 316.0 322.0 318.0 316.0 ~ 50 51 1 2.00%
Woodworkers, precision 278.9 278.2 282.8 279.9 279.1 283.3 279.4 278.7 283.1 205 229 248 19 8.30%Cabinetmakers and bench carpenters 291.0 289.0 288.0 291.0 289.0 288.0 291.0 289.0 288.0 110 121 128 7 5.79%Furniture finishers 280.0 280.0 289.0 280.0 280.0 289.0 280.0 280.0 289.0 29 30 33 3 10.00%Wood machinists 250.0 252.0 267.0 250.0 252.0 267.0 250.0 252.0 267.0 47 45 51 6 13.33%All other precision woodworkers NA NA NA NA NA NA NA NA NA ~ 33 36 3 9.09%
Other precision workers 290.2 287.3 290.6 290.2 287.3 290.6 290.1 287.1 290.4 ~ 206 214 8 3.88%Dental laboratory technicians, precision 315.0 309.0 312.0 315.0 309.0 312.0 315.0 309.0 312.0 ~ 47 48 1 2.13%Optical goods workers, precision NA NA NA NA NA NA NA NA NA ~ 19 19 0 0.00%Photographic process workers, precision 276.5 275.0 287.0 276.5 275.0 287.0 276.5 275.0 287.0 ~ 14 14 0 0.00%All other precision workers 282.5 280.5 283.0 282.5 280.5 283.0 282.5 280.5 283.0 ~ 126 133 7 5.56%
Plant and system occupations 292.7 289.2 298.1 291.4 287.9 296.5 290.6 287.0 295.5 289 329 362 33 10.03%Chemical plant and system operators 288.0 285.0 298.0 288.0 285.0 298.0 288.0 285.0 298.0 33 37 36 -1 -2.70%Power distributors and dispatchers 327.0 323.0 339.0 327.0 323.0 339.0 327.0 323.0 339.0 20 15 15 0 0.00%Power generating and reactor plant operators 293.0 289.0 291.0 293.0 289.0 291.0 293.0 289.0 291.0 25 31 34 3 9.68%Gas and petroleum plant and system occupations 318.0 313.5 317.5 318.0 313.5 317.5 318.0 313.5 317.5 31 33 29 -4 -12.12%Stationary engineers 293.0 289.0 298.0 293.0 289.0 298.0 293.0 289.0 298.0 ~ 27 26 -1 -3.70%Water and liquid waste treatment plant and system operators 289.5 284.0 289.5 289.5 284.0 289.5 289.5 284.0 289.5 74 98 121 23 23.47%All other plant and system operators 278.0 277.0 290.0 278.0 277.0 290.0 278.0 277.0 290.0 ~ 88 101 13 14.77%
Table 16
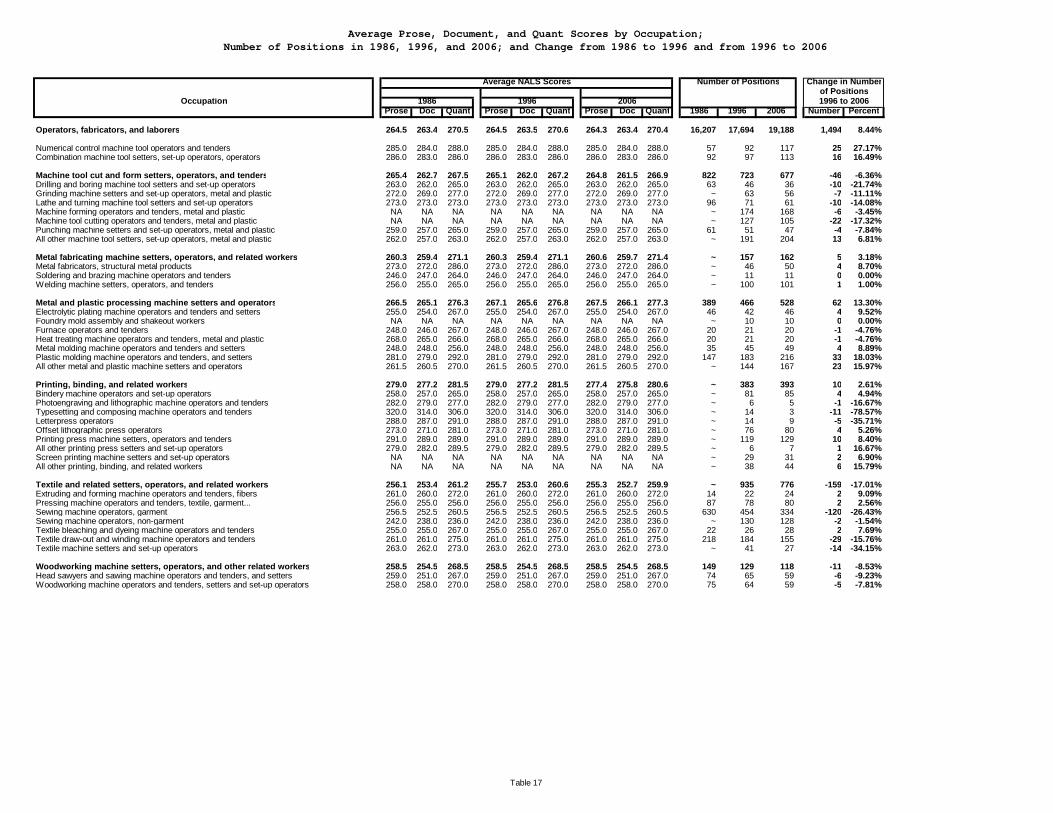
Average Prose, Document, and Quant Scores by Occupation;Number of Positions in 1986, 1996, and 2006; and Change from 1986 to 1996 and from 1996 to 2006
Average NALS Scores Number of Positions Change in Numberof Positions
Occupation 1986 1996 2006 1996 to 2006Prose Doc Quant Prose Doc Quant Prose Doc Quant 1986 1996 2006 Number Percent
Operators, fabricators, and laborers 264.5 263.4 270.5 264.5 263.5 270.6 264.3 263.4 270.4 16,207 17,694 19,188 1,494 8.44%
Numerical control machine tool operators and tenders 285.0 284.0 288.0 285.0 284.0 288.0 285.0 284.0 288.0 57 92 117 25 27.17%Combination machine tool setters, set-up operators, operators 286.0 283.0 286.0 286.0 283.0 286.0 286.0 283.0 286.0 92 97 113 16 16.49%
Machine tool cut and form setters, operators, and tenders 265.4 262.7 267.5 265.1 262.0 267.2 264.8 261.5 266.9 822 723 677 -46 -6.36%Drilling and boring machine tool setters and set-up operators 263.0 262.0 265.0 263.0 262.0 265.0 263.0 262.0 265.0 63 46 36 -10 -21.74%Grinding machine setters and set-up operators, metal and plastic 272.0 269.0 277.0 272.0 269.0 277.0 272.0 269.0 277.0 ~ 63 56 -7 -11.11%Lathe and turning machine tool setters and set-up operators 273.0 273.0 273.0 273.0 273.0 273.0 273.0 273.0 273.0 96 71 61 -10 -14.08%Machine forming operators and tenders, metal and plastic NA NA NA NA NA NA NA NA NA ~ 174 168 -6 -3.45%Machine tool cutting operators and tenders, metal and plastic NA NA NA NA NA NA NA NA NA ~ 127 105 -22 -17.32%Punching machine setters and set-up operators, metal and plastic 259.0 257.0 265.0 259.0 257.0 265.0 259.0 257.0 265.0 61 51 47 -4 -7.84%All other machine tool setters, set-up operators, metal and plastic 262.0 257.0 263.0 262.0 257.0 263.0 262.0 257.0 263.0 ~ 191 204 13 6.81%
Metal fabricating machine setters, operators, and related workers 260.3 259.4 271.1 260.3 259.4 271.1 260.6 259.7 271.4 ~ 157 162 5 3.18%Metal fabricators, structural metal products 273.0 272.0 286.0 273.0 272.0 286.0 273.0 272.0 286.0 ~ 46 50 4 8.70%Soldering and brazing machine operators and tenders 246.0 247.0 264.0 246.0 247.0 264.0 246.0 247.0 264.0 ~ 11 11 0 0.00%Welding machine setters, operators, and tenders 256.0 255.0 265.0 256.0 255.0 265.0 256.0 255.0 265.0 ~ 100 101 1 1.00%
Metal and plastic processing machine setters and operators 266.5 265.1 276.3 267.1 265.6 276.8 267.5 266.1 277.3 389 466 528 62 13.30%Electrolytic plating machine operators and tenders and setters 255.0 254.0 267.0 255.0 254.0 267.0 255.0 254.0 267.0 46 42 46 4 9.52%Foundry mold assembly and shakeout workers NA NA NA NA NA NA NA NA NA ~ 10 10 0 0.00%Furnace operators and tenders 248.0 246.0 267.0 248.0 246.0 267.0 248.0 246.0 267.0 20 21 20 -1 -4.76%Heat treating machine operators and tenders, metal and plastic 268.0 265.0 266.0 268.0 265.0 266.0 268.0 265.0 266.0 20 21 20 -1 -4.76%Metal molding machine operators and tenders and setters 248.0 248.0 256.0 248.0 248.0 256.0 248.0 248.0 256.0 35 45 49 4 8.89%Plastic molding machine operators and tenders, and setters 281.0 279.0 292.0 281.0 279.0 292.0 281.0 279.0 292.0 147 183 216 33 18.03%All other metal and plastic machine setters and operators 261.5 260.5 270.0 261.5 260.5 270.0 261.5 260.5 270.0 ~ 144 167 23 15.97%
Printing, binding, and related workers 279.0 277.2 281.5 279.0 277.2 281.5 277.4 275.8 280.6 ~ 383 393 10 2.61%Bindery machine operators and set-up operators 258.0 257.0 265.0 258.0 257.0 265.0 258.0 257.0 265.0 ~ 81 85 4 4.94%Photoengraving and lithographic machine operators and tenders 282.0 279.0 277.0 282.0 279.0 277.0 282.0 279.0 277.0 ~ 6 5 -1 -16.67%Typesetting and composing machine operators and tenders 320.0 314.0 306.0 320.0 314.0 306.0 320.0 314.0 306.0 ~ 14 3 -11 -78.57%Letterpress operators 288.0 287.0 291.0 288.0 287.0 291.0 288.0 287.0 291.0 ~ 14 9 -5 -35.71%Offset lithographic press operators 273.0 271.0 281.0 273.0 271.0 281.0 273.0 271.0 281.0 ~ 76 80 4 5.26%Printing press machine setters, operators and tenders 291.0 289.0 289.0 291.0 289.0 289.0 291.0 289.0 289.0 ~ 119 129 10 8.40%All other printing press setters and set-up operators 279.0 282.0 289.5 279.0 282.0 289.5 279.0 282.0 289.5 ~ 6 7 1 16.67%Screen printing machine setters and set-up operators NA NA NA NA NA NA NA NA NA ~ 29 31 2 6.90%All other printing, binding, and related workers NA NA NA NA NA NA NA NA NA ~ 38 44 6 15.79%
Textile and related setters, operators, and related workers 256.1 253.4 261.2 255.7 253.0 260.6 255.3 252.7 259.9 ~ 935 776 -159 -17.01%Extruding and forming machine operators and tenders, fibers 261.0 260.0 272.0 261.0 260.0 272.0 261.0 260.0 272.0 14 22 24 2 9.09%Pressing machine operators and tenders, textile, garment... 256.0 255.0 256.0 256.0 255.0 256.0 256.0 255.0 256.0 87 78 80 2 2.56%Sewing machine operators, garment 256.5 252.5 260.5 256.5 252.5 260.5 256.5 252.5 260.5 630 454 334 -120 -26.43%Sewing machine operators, non-garment 242.0 238.0 236.0 242.0 238.0 236.0 242.0 238.0 236.0 ~ 130 128 -2 -1.54%Textile bleaching and dyeing machine operators and tenders 255.0 255.0 267.0 255.0 255.0 267.0 255.0 255.0 267.0 22 26 28 2 7.69%Textile draw-out and winding machine operators and tenders 261.0 261.0 275.0 261.0 261.0 275.0 261.0 261.0 275.0 218 184 155 -29 -15.76%Textile machine setters and set-up operators 263.0 262.0 273.0 263.0 262.0 273.0 263.0 262.0 273.0 ~ 41 27 -14 -34.15%
Woodworking machine setters, operators, and other related workers 258.5 254.5 268.5 258.5 254.5 268.5 258.5 254.5 268.5 149 129 118 -11 -8.53%Head sawyers and sawing machine operators and tenders, and setters 259.0 251.0 267.0 259.0 251.0 267.0 259.0 251.0 267.0 74 65 59 -6 -9.23%Woodworking machine operators and tenders, setters and set-up operators 258.0 258.0 270.0 258.0 258.0 270.0 258.0 258.0 270.0 75 64 59 -5 -7.81%
Table 17
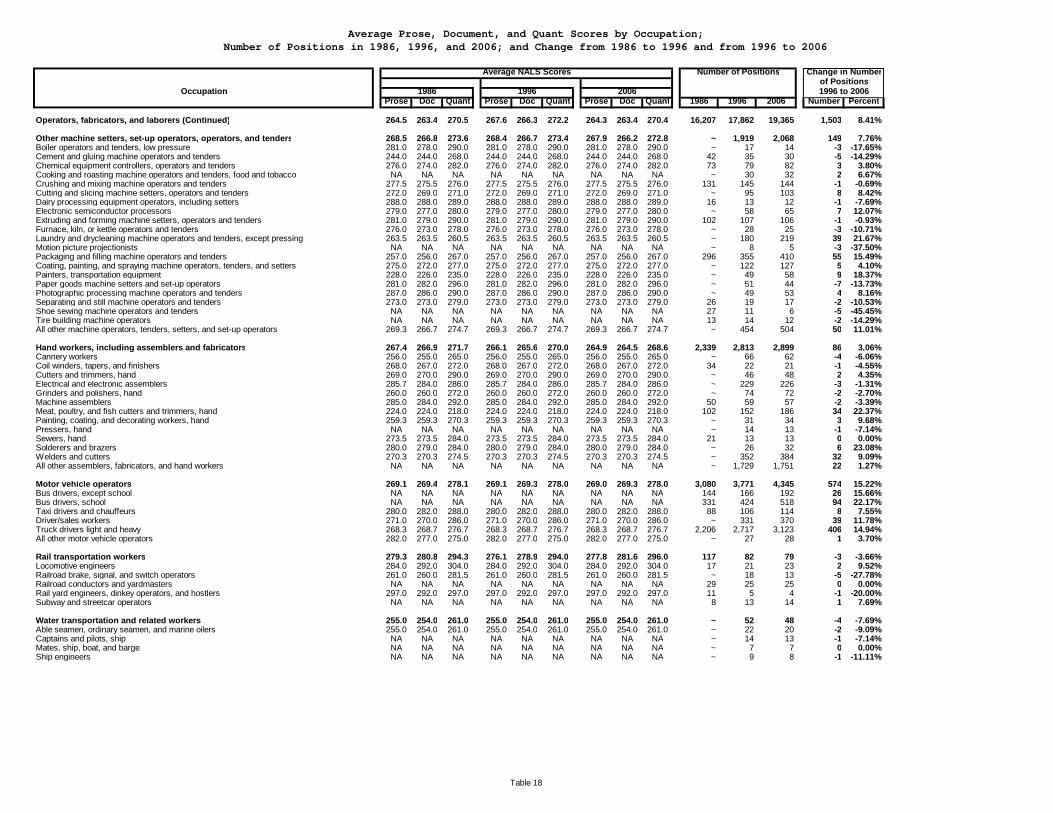
Average Prose, Document, and Quant Scores by Occupation;Number of Positions in 1986, 1996, and 2006; and Change from 1986 to 1996 and from 1996 to 2006
Average NALS Scores Number of Positions Change in Numberof Positions
Occupation 1986 1996 2006 1996 to 2006Prose Doc Quant Prose Doc Quant Prose Doc Quant 1986 1996 2006 Number Percent
Operators, fabricators, and laborers (Continued) 264.5 263.4 270.5 267.6 266.3 272.2 264.3 263.4 270.4 16,207 17,862 19,365 1,503 8.41%
Other machine setters, set-up operators, operators, and tenders 268.5 266.8 273.6 268.4 266.7 273.4 267.9 266.2 272.8 ~ 1,919 2,068 149 7.76%Boiler operators and tenders, low pressure 281.0 278.0 290.0 281.0 278.0 290.0 281.0 278.0 290.0 ~ 17 14 -3 -17.65%Cement and gluing machine operators and tenders 244.0 244.0 268.0 244.0 244.0 268.0 244.0 244.0 268.0 42 35 30 -5 -14.29%Chemical equipment controllers, operators and tenders 276.0 274.0 282.0 276.0 274.0 282.0 276.0 274.0 282.0 73 79 82 3 3.80%Cooking and roasting machine operators and tenders, food and tobacco NA NA NA NA NA NA NA NA NA ~ 30 32 2 6.67%Crushing and mixing machine operators and tenders 277.5 275.5 276.0 277.5 275.5 276.0 277.5 275.5 276.0 131 145 144 -1 -0.69%Cutting and slicing machine setters, operators and tenders 272.0 269.0 271.0 272.0 269.0 271.0 272.0 269.0 271.0 ~ 95 103 8 8.42%Dairy processing equipment operators, including setters 288.0 288.0 289.0 288.0 288.0 289.0 288.0 288.0 289.0 16 13 12 -1 -7.69%Electronic semiconductor processors 279.0 277.0 280.0 279.0 277.0 280.0 279.0 277.0 280.0 ~ 58 65 7 12.07%Extruding and forming machine setters, operators and tenders 281.0 279.0 290.0 281.0 279.0 290.0 281.0 279.0 290.0 102 107 106 -1 -0.93%Furnace, kiln, or kettle operators and tenders 276.0 273.0 278.0 276.0 273.0 278.0 276.0 273.0 278.0 ~ 28 25 -3 -10.71%Laundry and drycleaning machine operators and tenders, except pressing 263.5 263.5 260.5 263.5 263.5 260.5 263.5 263.5 260.5 ~ 180 219 39 21.67%Motion picture projectionists NA NA NA NA NA NA NA NA NA ~ 8 5 -3 -37.50%Packaging and filling machine operators and tenders 257.0 256.0 267.0 257.0 256.0 267.0 257.0 256.0 267.0 296 355 410 55 15.49%Coating, painting, and spraying machine operators, tenders, and setters 275.0 272.0 277.0 275.0 272.0 277.0 275.0 272.0 277.0 ~ 122 127 5 4.10%Painters, transportation equipment 228.0 226.0 235.0 228.0 226.0 235.0 228.0 226.0 235.0 ~ 49 58 9 18.37%Paper goods machine setters and set-up operators 281.0 282.0 296.0 281.0 282.0 296.0 281.0 282.0 296.0 ~ 51 44 -7 -13.73%Photographic processing machine operators and tenders 287.0 286.0 290.0 287.0 286.0 290.0 287.0 286.0 290.0 ~ 49 53 4 8.16%Separating and still machine operators and tenders 273.0 273.0 279.0 273.0 273.0 279.0 273.0 273.0 279.0 26 19 17 -2 -10.53%Shoe sewing machine operators and tenders NA NA NA NA NA NA NA NA NA 27 11 6 -5 -45.45%Tire building machine operators NA NA NA NA NA NA NA NA NA 13 14 12 -2 -14.29%All other machine operators, tenders, setters, and set-up operators 269.3 266.7 274.7 269.3 266.7 274.7 269.3 266.7 274.7 ~ 454 504 50 11.01%
Hand workers, including assemblers and fabricators 267.4 266.9 271.7 266.1 265.6 270.0 264.9 264.5 268.6 2,339 2,813 2,899 86 3.06%Cannery workers 256.0 255.0 265.0 256.0 255.0 265.0 256.0 255.0 265.0 ~ 66 62 -4 -6.06%Coil winders, tapers, and finishers 268.0 267.0 272.0 268.0 267.0 272.0 268.0 267.0 272.0 34 22 21 -1 -4.55%Cutters and trimmers, hand 269.0 270.0 290.0 269.0 270.0 290.0 269.0 270.0 290.0 ~ 46 48 2 4.35%Electrical and electronic assemblers 285.7 284.0 286.0 285.7 284.0 286.0 285.7 284.0 286.0 ~ 229 226 -3 -1.31%Grinders and polishers, hand 260.0 260.0 272.0 260.0 260.0 272.0 260.0 260.0 272.0 ~ 74 72 -2 -2.70%Machine assemblers 285.0 284.0 292.0 285.0 284.0 292.0 285.0 284.0 292.0 50 59 57 -2 -3.39%Meat, poultry, and fish cutters and trimmers, hand 224.0 224.0 218.0 224.0 224.0 218.0 224.0 224.0 218.0 102 152 186 34 22.37%Painting, coating, and decorating workers, hand 259.3 259.3 270.3 259.3 259.3 270.3 259.3 259.3 270.3 ~ 31 34 3 9.68%Pressers, hand NA NA NA NA NA NA NA NA NA ~ 14 13 -1 -7.14%Sewers, hand 273.5 273.5 284.0 273.5 273.5 284.0 273.5 273.5 284.0 21 13 13 0 0.00%Solderers and brazers 280.0 279.0 284.0 280.0 279.0 284.0 280.0 279.0 284.0 ~ 26 32 6 23.08%Welders and cutters 270.3 270.3 274.5 270.3 270.3 274.5 270.3 270.3 274.5 ~ 352 384 32 9.09%All other assemblers, fabricators, and hand workers NA NA NA NA NA NA NA NA NA ~ 1,729 1,751 22 1.27%
Motor vehicle operators 269.1 269.4 278.1 269.1 269.3 278.0 269.0 269.3 278.0 3,080 3,771 4,345 574 15.22%Bus drivers, except school NA NA NA NA NA NA NA NA NA 144 166 192 26 15.66%Bus drivers, school NA NA NA NA NA NA NA NA NA 331 424 518 94 22.17%Taxi drivers and chauffeurs 280.0 282.0 288.0 280.0 282.0 288.0 280.0 282.0 288.0 88 106 114 8 7.55%Driver/sales workers 271.0 270.0 286.0 271.0 270.0 286.0 271.0 270.0 286.0 ~ 331 370 39 11.78%Truck drivers light and heavy 268.3 268.7 276.7 268.3 268.7 276.7 268.3 268.7 276.7 2,206 2,717 3,123 406 14.94%All other motor vehicle operators 282.0 277.0 275.0 282.0 277.0 275.0 282.0 277.0 275.0 ~ 27 28 1 3.70%
Rail transportation workers 279.3 280.8 294.3 276.1 278.9 294.0 277.8 281.6 296.0 117 82 79 -3 -3.66%Locomotive engineers 284.0 292.0 304.0 284.0 292.0 304.0 284.0 292.0 304.0 17 21 23 2 9.52%Railroad brake, signal, and switch operators 261.0 260.0 281.5 261.0 260.0 281.5 261.0 260.0 281.5 ~ 18 13 -5 -27.78%Railroad conductors and yardmasters NA NA NA NA NA NA NA NA NA 29 25 25 0 0.00%Rail yard engineers, dinkey operators, and hostlers 297.0 292.0 297.0 297.0 292.0 297.0 297.0 292.0 297.0 11 5 4 -1 -20.00%Subway and streetcar operators NA NA NA NA NA NA NA NA NA 8 13 14 1 7.69%
Water transportation and related workers 255.0 254.0 261.0 255.0 254.0 261.0 255.0 254.0 261.0 ~ 52 48 -4 -7.69%Able seamen, ordinary seamen, and marine oilers 255.0 254.0 261.0 255.0 254.0 261.0 255.0 254.0 261.0 ~ 22 20 -2 -9.09%Captains and pilots, ship NA NA NA NA NA NA NA NA NA ~ 14 13 -1 -7.14%Mates, ship, boat, and barge NA NA NA NA NA NA NA NA NA ~ 7 7 0 0.00%Ship engineers NA NA NA NA NA NA NA NA NA ~ 9 8 -1 -11.11%
Table 18
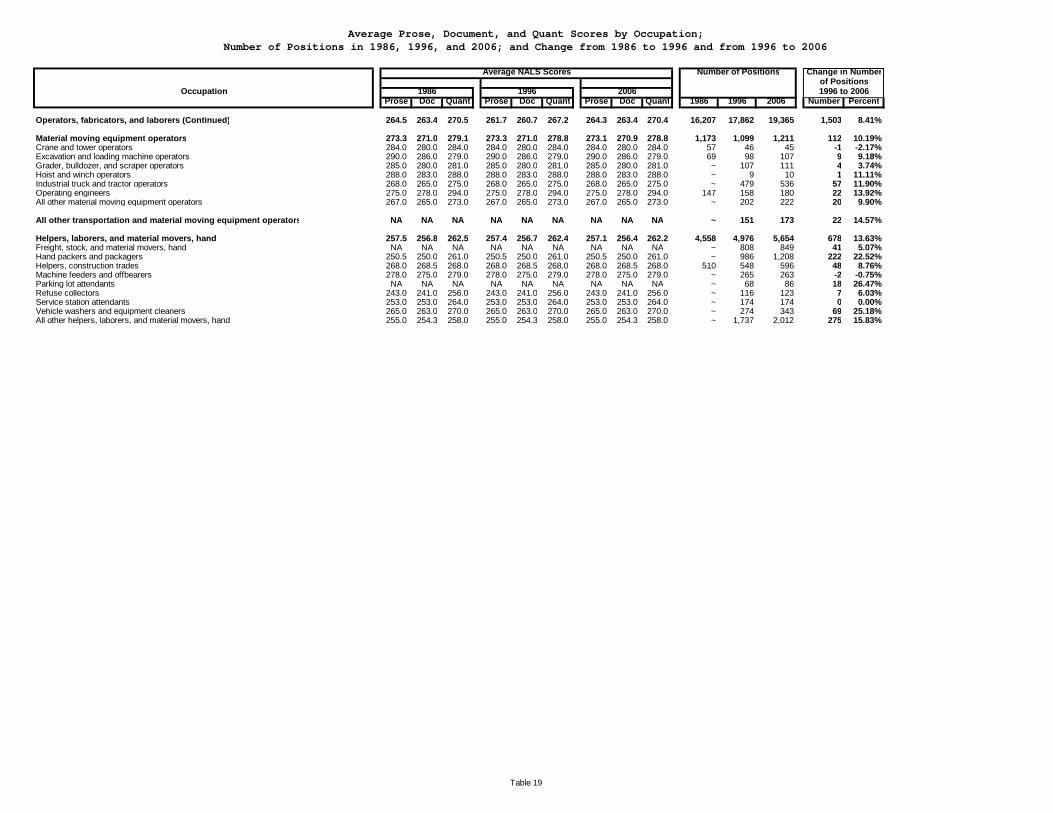
Average Prose, Document, and Quant Scores by Occupation;Number of Positions in 1986, 1996, and 2006; and Change from 1986 to 1996 and from 1996 to 2006
Average NALS Scores Number of Positions Change in Numberof Positions
Occupation 1986 1996 2006 1996 to 2006Prose Doc Quant Prose Doc Quant Prose Doc Quant 1986 1996 2006 Number Percent
Operators, fabricators, and laborers (Continued) 264.5 263.4 270.5 261.7 260.7 267.2 264.3 263.4 270.4 16,207 17,862 19,365 1,503 8.41%
Material moving equipment operators 273.3 271.0 279.1 273.3 271.0 278.8 273.1 270.9 278.8 1,173 1,099 1,211 112 10.19%Crane and tower operators 284.0 280.0 284.0 284.0 280.0 284.0 284.0 280.0 284.0 57 46 45 -1 -2.17%Excavation and loading machine operators 290.0 286.0 279.0 290.0 286.0 279.0 290.0 286.0 279.0 69 98 107 9 9.18%Grader, bulldozer, and scraper operators 285.0 280.0 281.0 285.0 280.0 281.0 285.0 280.0 281.0 ~ 107 111 4 3.74%Hoist and winch operators 288.0 283.0 288.0 288.0 283.0 288.0 288.0 283.0 288.0 ~ 9 10 1 11.11%Industrial truck and tractor operators 268.0 265.0 275.0 268.0 265.0 275.0 268.0 265.0 275.0 ~ 479 536 57 11.90%Operating engineers 275.0 278.0 294.0 275.0 278.0 294.0 275.0 278.0 294.0 147 158 180 22 13.92%All other material moving equipment operators 267.0 265.0 273.0 267.0 265.0 273.0 267.0 265.0 273.0 ~ 202 222 20 9.90%
All other transportation and material moving equipment operators NA NA NA NA NA NA NA NA NA ~ 151 173 22 14.57%
Helpers, laborers, and material movers, hand 257.5 256.8 262.5 257.4 256.7 262.4 257.1 256.4 262.2 4,558 4,976 5,654 678 13.63%Freight, stock, and material movers, hand NA NA NA NA NA NA NA NA NA ~ 808 849 41 5.07%Hand packers and packagers 250.5 250.0 261.0 250.5 250.0 261.0 250.5 250.0 261.0 ~ 986 1,208 222 22.52%Helpers, construction trades 268.0 268.5 268.0 268.0 268.5 268.0 268.0 268.5 268.0 510 548 596 48 8.76%Machine feeders and offbearers 278.0 275.0 279.0 278.0 275.0 279.0 278.0 275.0 279.0 ~ 265 263 -2 -0.75%Parking lot attendants NA NA NA NA NA NA NA NA NA ~ 68 86 18 26.47%Refuse collectors 243.0 241.0 256.0 243.0 241.0 256.0 243.0 241.0 256.0 ~ 116 123 7 6.03%Service station attendants 253.0 253.0 264.0 253.0 253.0 264.0 253.0 253.0 264.0 ~ 174 174 0 0.00%Vehicle washers and equipment cleaners 265.0 263.0 270.0 265.0 263.0 270.0 265.0 263.0 270.0 ~ 274 343 69 25.18%All other helpers, laborers, and material movers, hand 255.0 254.3 258.0 255.0 254.3 258.0 255.0 254.3 258.0 ~ 1,737 2,012 275 15.83%
Table 19
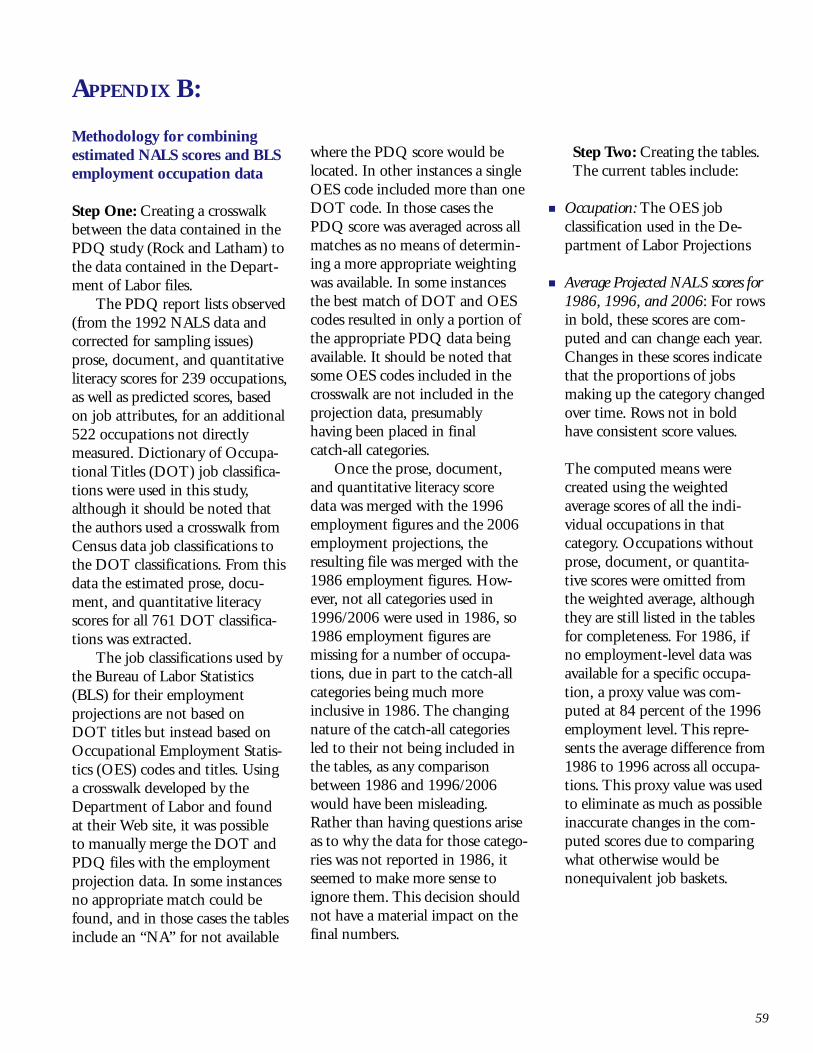
59
APPENDIX B:
Methodology for combiningestimated NALS scores and BLSemployment occupation data
Step One: Creating a crosswalkbetween the data contained in thePDQ study (Rock and Latham) tothe data contained in the Depart-ment of Labor files.
The PDQ report lists observed(from the 1992 NALS data andcorrected for sampling issues)prose, document, and quantitativeliteracy scores for 239 occupations,as well as predicted scores, basedon job attributes, for an additional522 occupations not directlymeasured. Dictionary of Occupa-tional Titles (DOT) job classifica-tions were used in this study,although it should be noted thatthe authors used a crosswalk fromCensus data job classifications tothe DOT classifications. From thisdata the estimated prose, docu-ment, and quantitative literacyscores for all 761 DOT classifica-tions was extracted.
The job classifications used bythe Bureau of Labor Statistics(BLS) for their employmentprojections are not based onDOT titles but instead based onOccupational Employment Statis-tics (OES) codes and titles. Usinga crosswalk developed by theDepartment of Labor and foundat their Web site, it was possibleto manually merge the DOT andPDQ files with the employmentprojection data. In some instancesno appropriate match could befound, and in those cases the tablesinclude an “NA” for not available
where the PDQ score would belocated. In other instances a singleOES code included more than oneDOT code. In those cases thePDQ score was averaged across allmatches as no means of determin-ing a more appropriate weightingwas available. In some instancesthe best match of DOT and OEScodes resulted in only a portion ofthe appropriate PDQ data beingavailable. It should be noted thatsome OES codes included in thecrosswalk are not included in theprojection data, presumablyhaving been placed in finalcatch-all categories.
Once the prose, document,and quantitative literacy scoredata was merged with the 1996employment figures and the 2006employment projections, theresulting file was merged with the1986 employment figures. How-ever, not all categories used in1996/2006 were used in 1986, so1986 employment figures aremissing for a number of occupa-tions, due in part to the catch-allcategories being much moreinclusive in 1986. The changingnature of the catch-all categoriesled to their not being included inthe tables, as any comparisonbetween 1986 and 1996/2006would have been misleading.Rather than having questions ariseas to why the data for those catego-ries was not reported in 1986, itseemed to make more sense toignore them. This decision shouldnot have a material impact on thefinal numbers.
Step Two: Creating the tables.The current tables include:
� Occupation: The OES jobclassification used in the De-partment of Labor Projections
� Average Projected NALS scores for1986, 1996, and 2006: For rowsin bold, these scores are com-puted and can change each year.Changes in these scores indicatethat the proportions of jobsmaking up the category changedover time. Rows not in boldhave consistent score values.
The computed means werecreated using the weightedaverage scores of all the indi-vidual occupations in thatcategory. Occupations withoutprose, document, or quantita-tive scores were omitted fromthe weighted average, althoughthey are still listed in the tablesfor completeness. For 1986, ifno employment-level data wasavailable for a specific occupa-tion, a proxy value was com-puted at 84 percent of the 1996employment level. This repre-sents the average difference from1986 to 1996 across all occupa-tions. This proxy value was usedto eliminate as much as possibleinaccurate changes in the com-puted scores due to comparingwhat otherwise would benonequivalent job baskets.
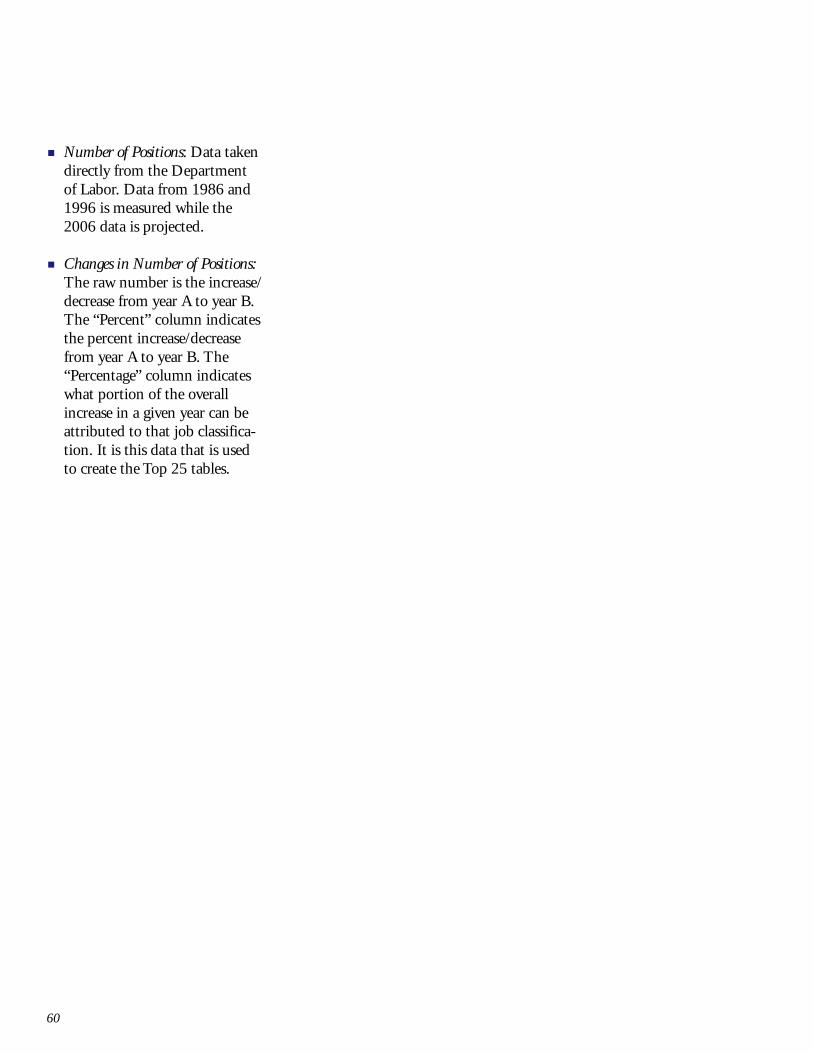
60
� Number of Positions: Data takendirectly from the Departmentof Labor. Data from 1986 and1996 is measured while the2006 data is projected.
� Changes in Number of Positions:The raw number is the increase/decrease from year A to year B.The “Percent” column indicatesthe percent increase/decreasefrom year A to year B. The“Percentage” column indicateswhat portion of the overallincrease in a given year can beattributed to that job classifica-tion. It is this data that is usedto create the Top 25 tables.