what items to make to stock and what to make to order (pre
TRANSCRIPT
Copyright - Art of Lean, Inc. 2005.
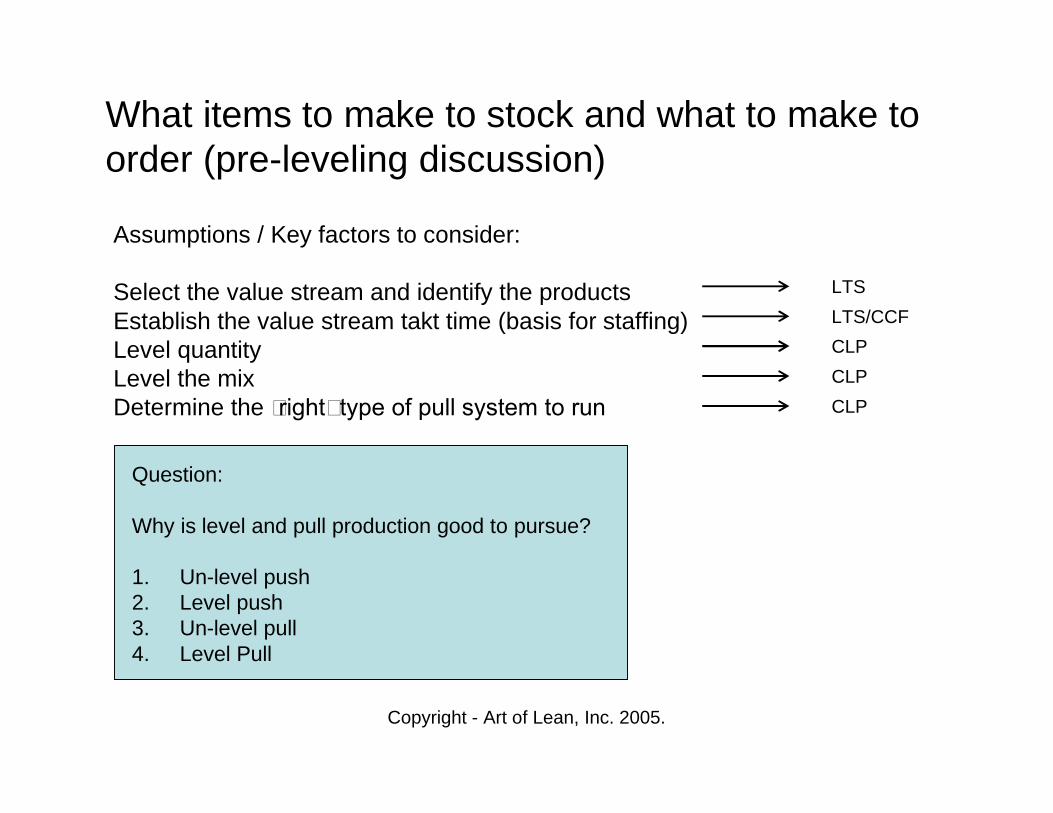
Assumptions / Key factors to consider:
Select the value stream and identify the productsEstablish the value stream takt time (basis for staffing)Level quantity Level the mix Determine the “right” type of pull system to run
What items to make to stock and what to make to order (pre-leveling discussion)
LTSLTS/CCFCLPCLPCLP
Question:
Why is level and pull production good to pursue?
1. Un-level push2. Level push3. Un-level pull4. Level Pull
Copyright - Art of Lean, Inc. 2005.
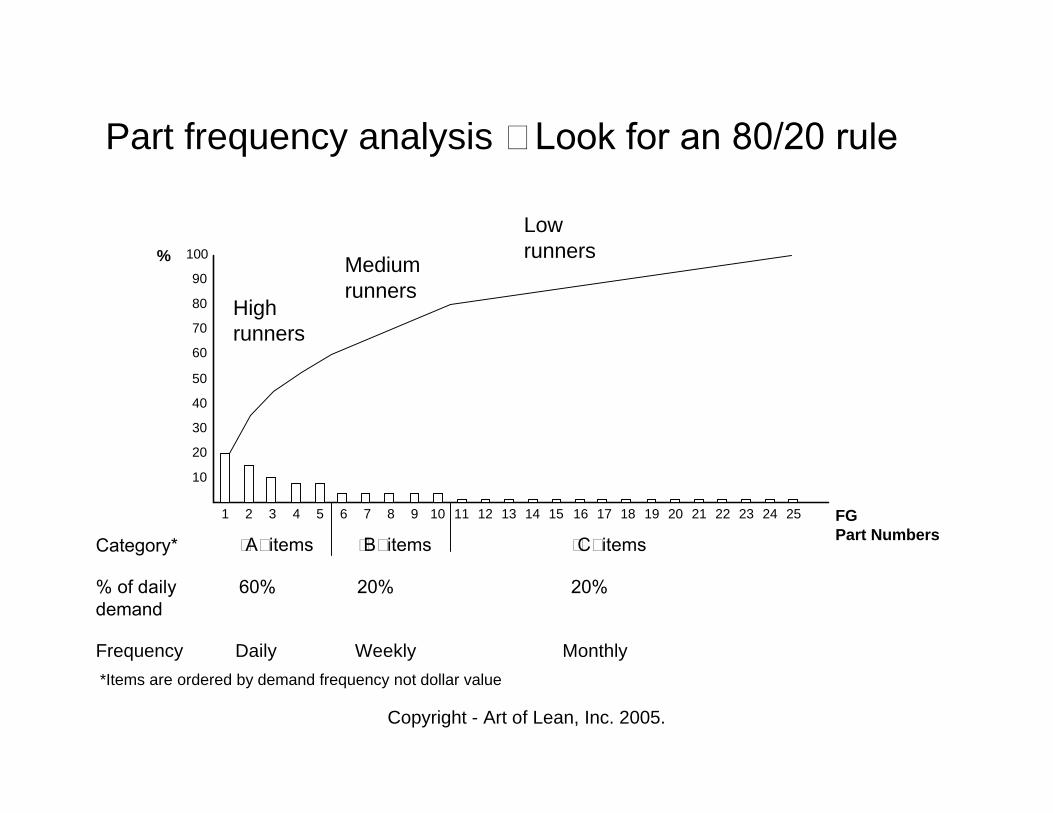
Part frequency analysis – Look for an 80/20 rule
High runners
Mediumrunners
Lowrunners%
FGPart Numbers
1 2 3 4 5 6 7 8 9 10 11 12 13 14 15 16 17 18 19 20 21 22 23 24 25
10
20
30
40
50
60
70
80
90
100
“A” items “B” items “C” items
60% 20% 20%% of dailydemand
Category*
*Items are ordered by demand frequency not dollar value
Daily Weekly MonthlyFrequency
Copyright - Art of Lean, Inc. 2005.
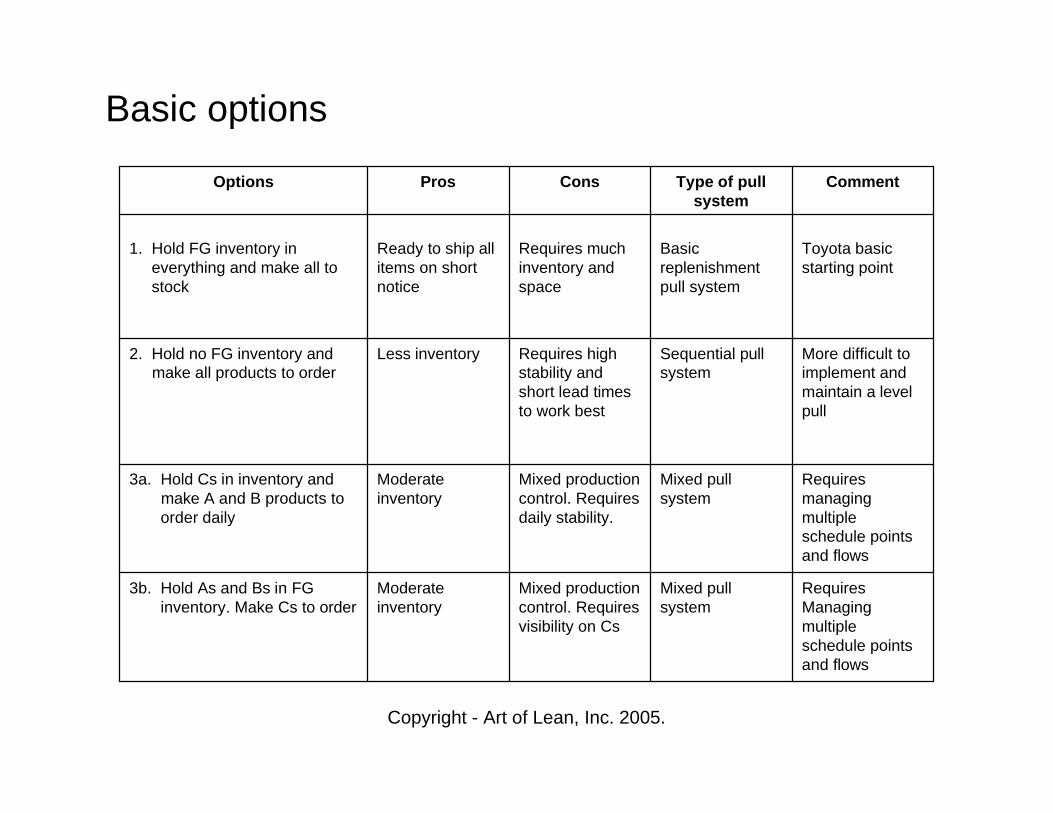
Basic options
Requires managing multiple schedule points and flows
Mixed pull system
Mixed production control. Requires daily stability.
Moderate inventory
3a. Hold Cs in inventory andmake A and B products to order daily
Requires Managingmultiple schedule points and flows
Mixed pull system
Mixed production control. Requires visibility on Cs
Moderate inventory
3b. Hold As and Bs in FG inventory. Make Cs to order
More difficult to implement and maintain a level pull
Sequential pull system
Requires high stability and short lead times to work best
Less inventory2. Hold no FG inventory and make all products to order
Toyota basic starting point
Basic replenishment pull system
Requires much inventory and space
Ready to ship all items on short notice
1. Hold FG inventory ineverything and make all tostock
CommentType of pull system
ConsProsOptions

Copyright - Art of Lean, Inc. 2005.
Basic inventory logic
Cycle stock
Buffer stock
Safety stock
Down time losses
Quality losses
Inventory required to fulfill average demand
Inventory to buffer against fluctuations in orders
Inventory to buffer against variability in internal mfg. processes
MarketInventory
Average demand x
Lead time to replenish
Standard deviation*x
1 (covers 67% of deviation)2 (covers 95% of deviation)3 (covers 99% of deviation)
+
+
+
= Market inventory level
*Assuming a normal distribution
Stocking markets based upon average demandalone often will lead to shortages!
Toyota’s basic inventory logic for dummies

Copyright - Art of Lean, Inc. 2005.
5S enables visual control (Inventory example)
No organization Lean ideal
– Good or bad?? Unclear– No standard or basis for
comparison
Type W Type X Type Y Type Z
Min = 1Max = 4
Min = 1Max = 3
Min = 1Max = 3
Min = 1Max = 2
– Normal vs. Abnormal clear– Standard basis for
comparison
Max.
Min.
Copyright - Art of Lean, Inc. 2005.
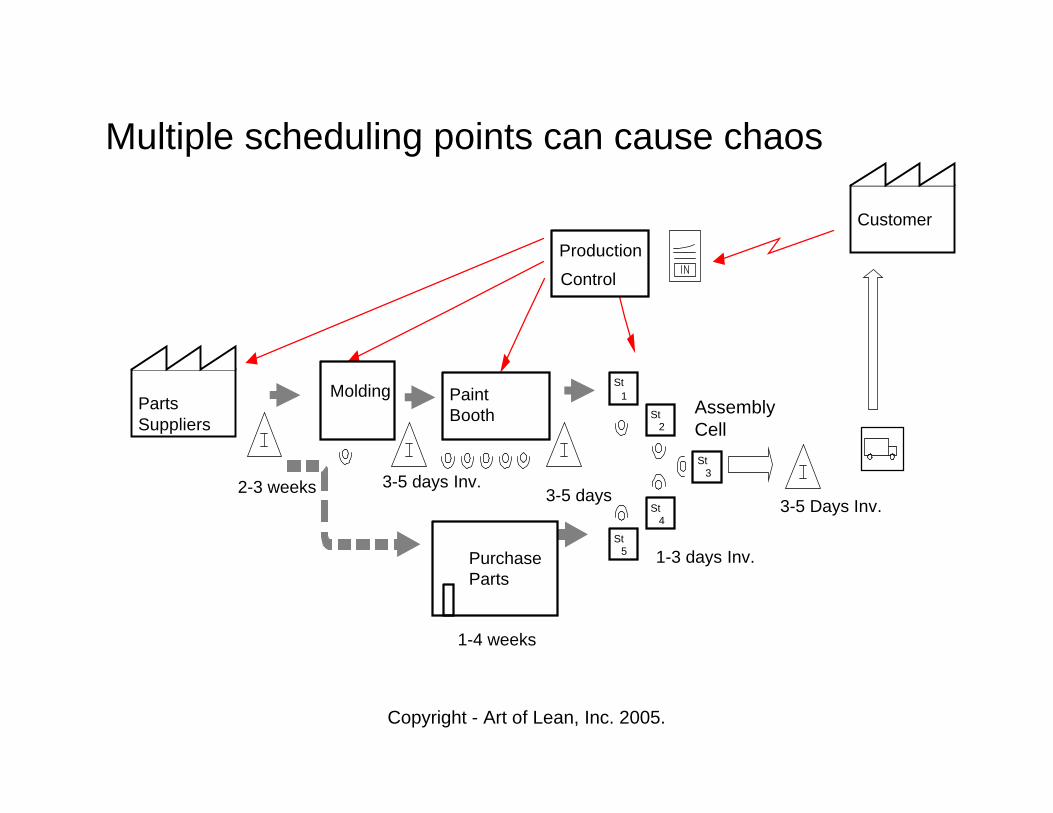
Molding Paint Booth
St1
St2
St3
St4
St5Purchase
Parts
Production
Control
2-3 weeks
1-4 weeks
3-5 days 3-5 Days Inv.
1-3 days Inv.
AssemblyCell
3-5 days Inv.
PartsSuppliers
Customer
Multiple scheduling points can cause chaos

Copyright - Art of Lean, Inc. 2005.
Level production mix concept and effect
Days 30
40 per lot
0 10 20 30
X Y Z
0 10 20 30
X ZY
0 10 20
X
Z
Y
400 per lot1,200 per lot
• 3 lots of 1,200• 3 changeovers• 10 day build
– 10 day avg. inventory– 10 to 21 day lead time
• 9 lots of 400• 9 changeovers• 3.3 day build
– 3.3 day avg. inventory– 3.3 to 6.6 day lead
time
• 90 lots of 40 • 90 changeovers• 3 items per day build (EPED)
– 1 day avg. inventory– 1 day lead time
"Large batch" "Medium batch" "Small batch"
Case - 1 Case - 2 Case - 3
Repeat schedule
Repeat schedule
Illustrative example
Copyright - Art of Lean, Inc. 2005.
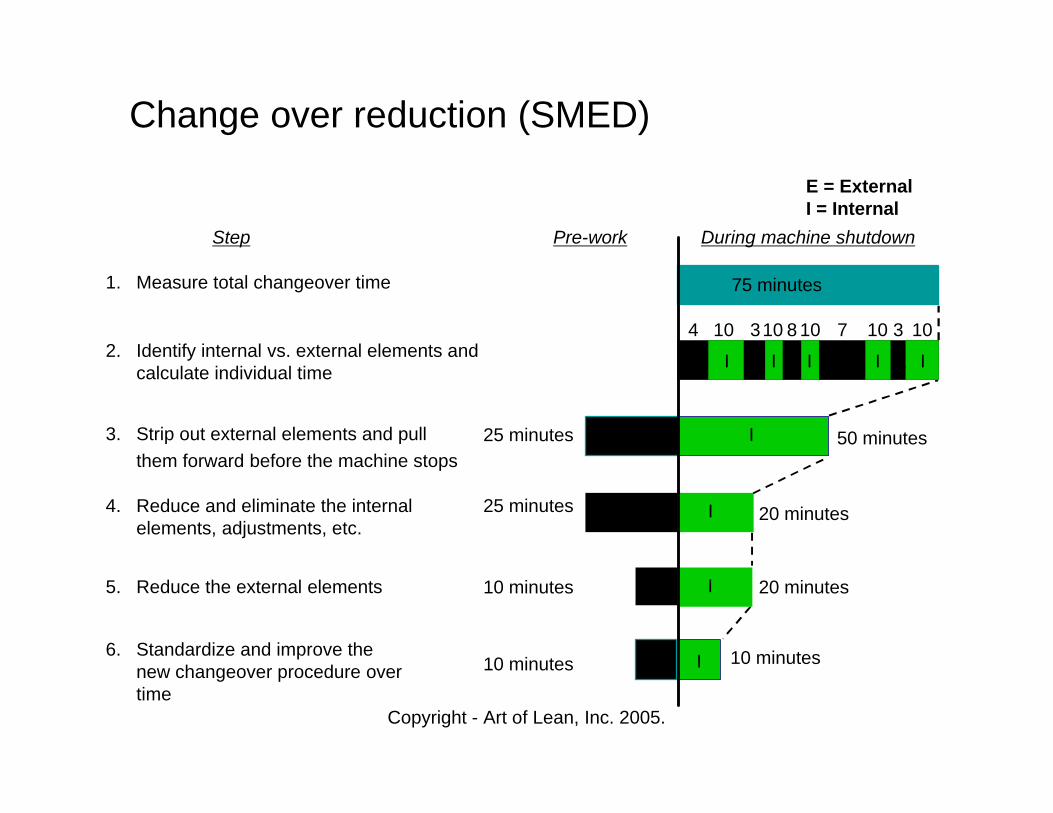
Change over reduction (SMED)
10 minutes6. Standardize and improve the
new changeover procedure over time
10 minutes5. Reduce the external elements
25 minutes4. Reduce and eliminate the internal elements, adjustments, etc.
25 minutes3. Strip out external elements and pullthem forward before the machine stops
2. Identify internal vs. external elements and calculate individual time
Step
1. Measure total changeover time
E = ExternalI = Internal
IE
IE
20 minutesIE
E I 50 minutes
E I E I E I E I IE
103107108103104
Pre-work During machine shutdown
20 minutes
10 minutes
75 minutes
Copyright - Art of Lean, Inc. 2005.
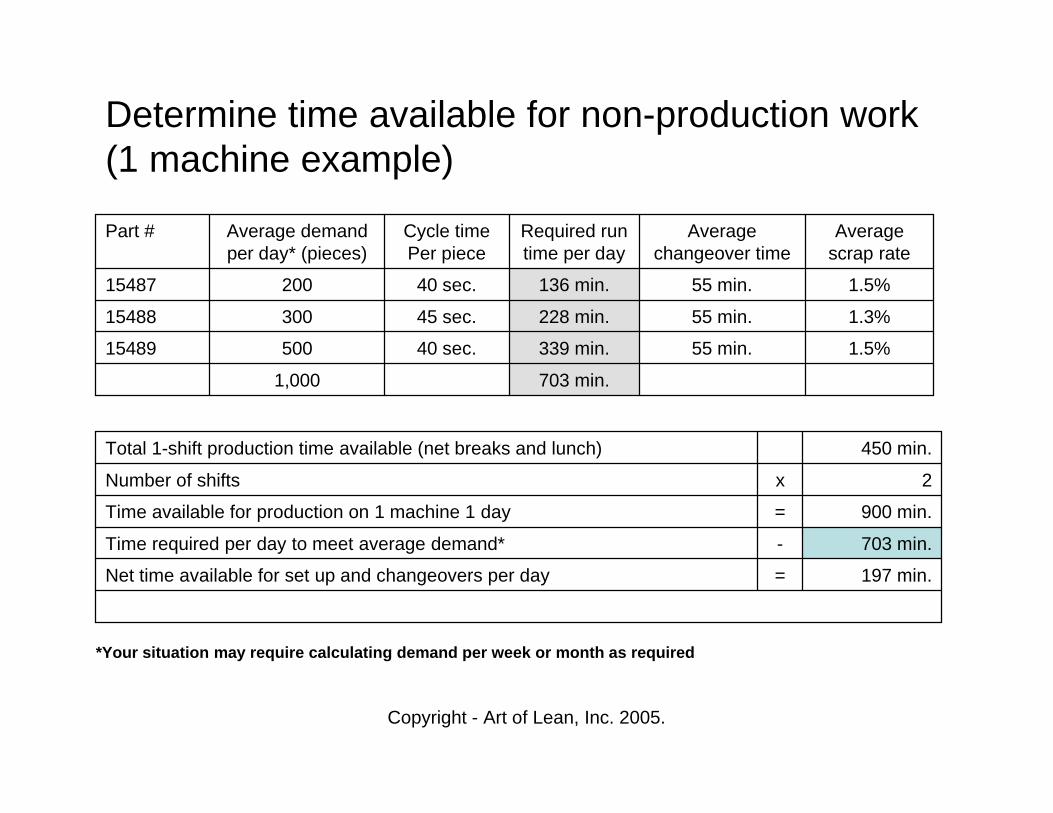
197 min.=Net time available for set up and changeovers per day
703 min.-Time required per day to meet average demand*
900 min.=Time available for production on 1 machine 1 day
2xNumber of shifts
450 min.Total 1-shift production time available (net breaks and lunch)
703 min.1,000
1.5%55 min.339 min.40 sec.50015489
1.3%55 min.228 min.45 sec.30015488
1.5%55 min.136 min.40 sec.200 15487
Average scrap rate
Averagechangeover time
Required run time per day
Cycle time Per piece
Average demand per day* (pieces)
Part #
*Your situation may require calculating demand per week or month as required
Determine time available for non-production work (1 machine example)
Copyright - Art of Lean, Inc. 2005.
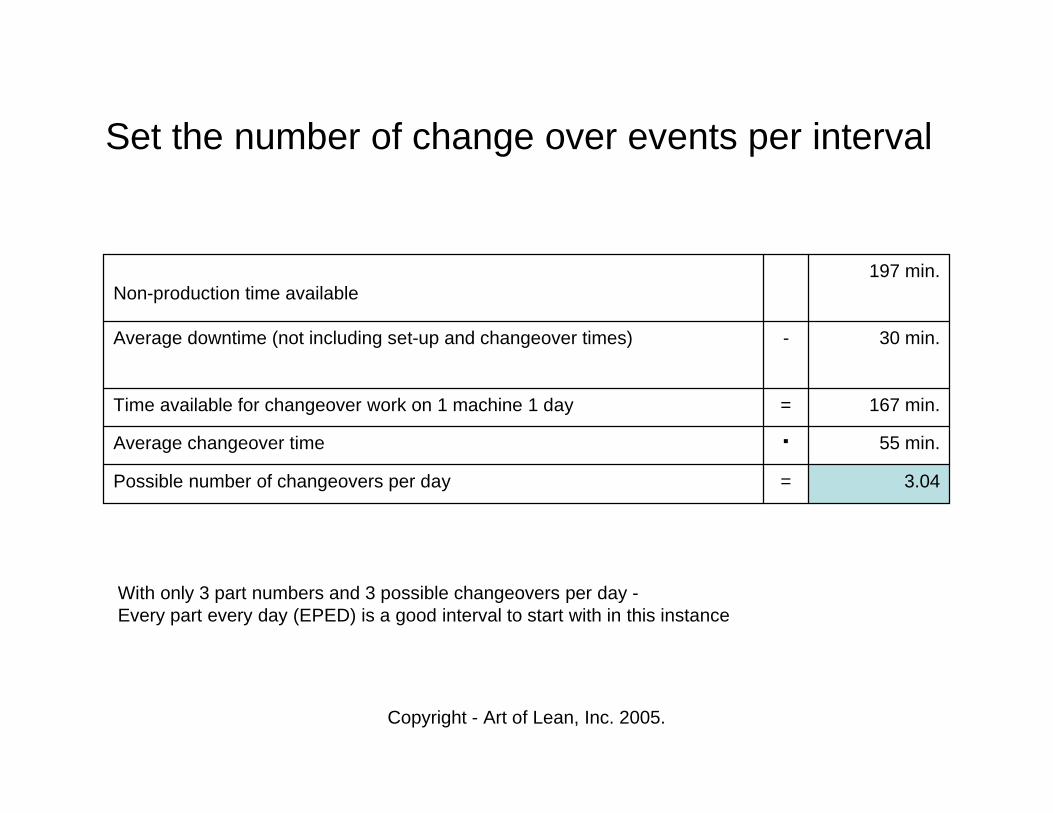
Set the number of change over events per interval
3.04 =Possible number of changeovers per day
55 min.÷Average changeover time
167 min.=Time available for changeover work on 1 machine 1 day
30 min.-Average downtime (not including set-up and changeover times)
197 min.Non-production time available
With only 3 part numbers and 3 possible changeovers per day -Every part every day (EPED) is a good interval to start with in this instance
Copyright - Art of Lean, Inc. 2005.
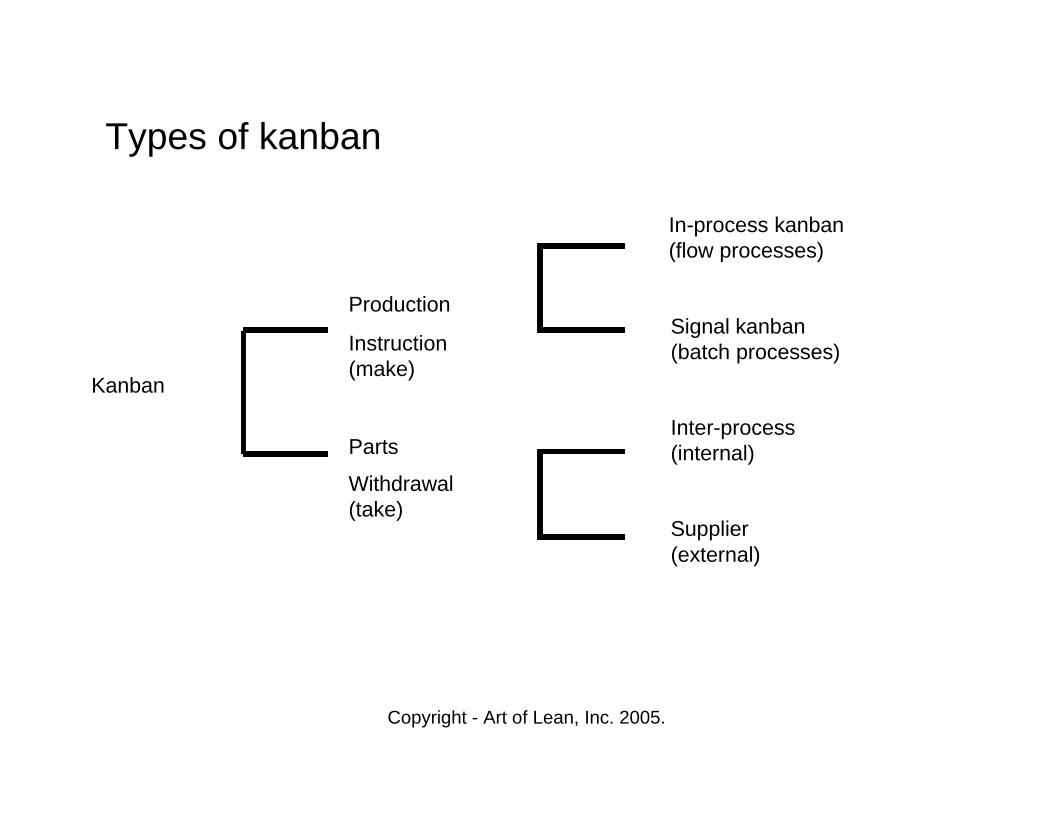
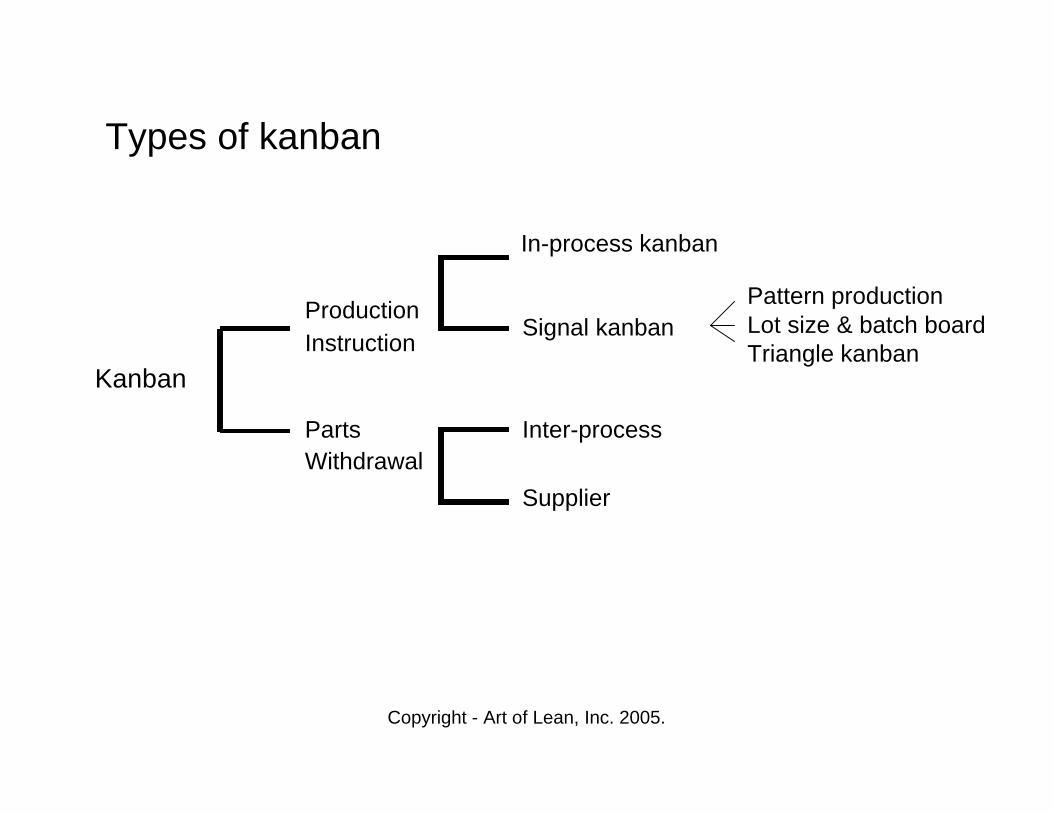
Types of kanban
Kanban
Production
Instruction(make)
Parts
Withdrawal(take)
In-process kanban(flow processes)
Signal kanban(batch processes)
Inter-process(internal)
Supplier(external)

Copyright - Art of Lean, Inc. 2005.
Production instruction kanban with Heijunka box
Assembly
FG Inventory
8:00 9:00 10:00
:15 :30 :45 :15 :30 :45 :15 :30 :45
Type X
Type Y
Type Z
Item Z
Item Y
Item X
Heijunka box1. FG inventory shipped kanban cards detached
2. Scheduling (or someone) organizes the Heijunka box with the items to be madein this case by pitch interval
X
3. On a timed interval the instruction kanban signal is sent to assembly to produce type X
4. Inventory returned to FG stores to complete the loop
Copyright - Art of Lean, Inc. 2005.
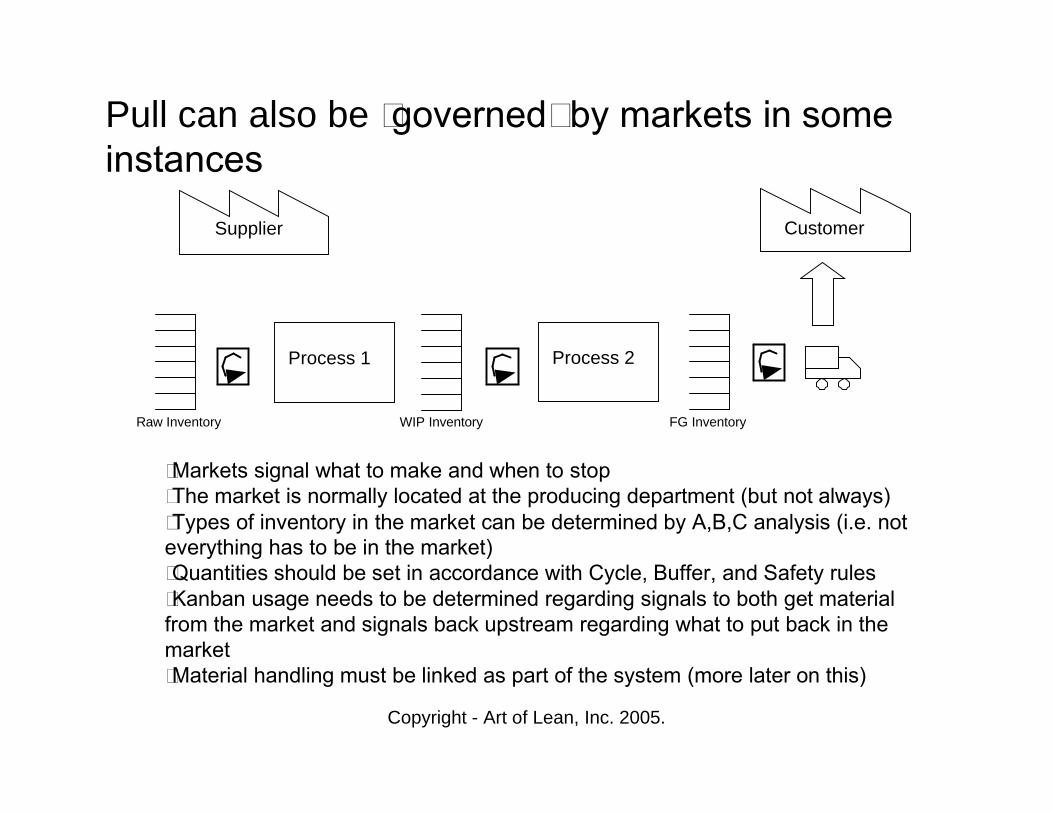
Pull can also be “governed” by markets in some instances
Process 1
Customer
•Markets signal what to make and when to stop•The market is normally located at the producing department (but not always)•Types of inventory in the market can be determined by A,B,C analysis (i.e. not everything has to be in the market)•Quantities should be set in accordance with Cycle, Buffer, and Safety rules•Kanban usage needs to be determined regarding signals to both get material from the market and signals back upstream regarding what to put back in the market•Material handling must be linked as part of the system (more later on this)
Process 2
FG InventoryWIP InventoryRaw Inventory
Supplier

Copyright - Art of Lean, Inc. 2005.
Pull can also be “governed” by FIFO lanes
Process 1A
Customer
Raw Inventory
Supplier
Process 2 Process 3
Schedule
FIFO FIFO
Order
•The FIFO lanes control the sequence of what to build•The pace and quantity of production is controlled by the release of the schedule to the pacemakers at the start of the line•Processes can not build without material being available•WIP should be limited and regulated by designated certain finite spaces on the floor (e.g. “up”, “on deck”, & “in the hole”)
Copyright - Art of Lean, Inc. 2005.
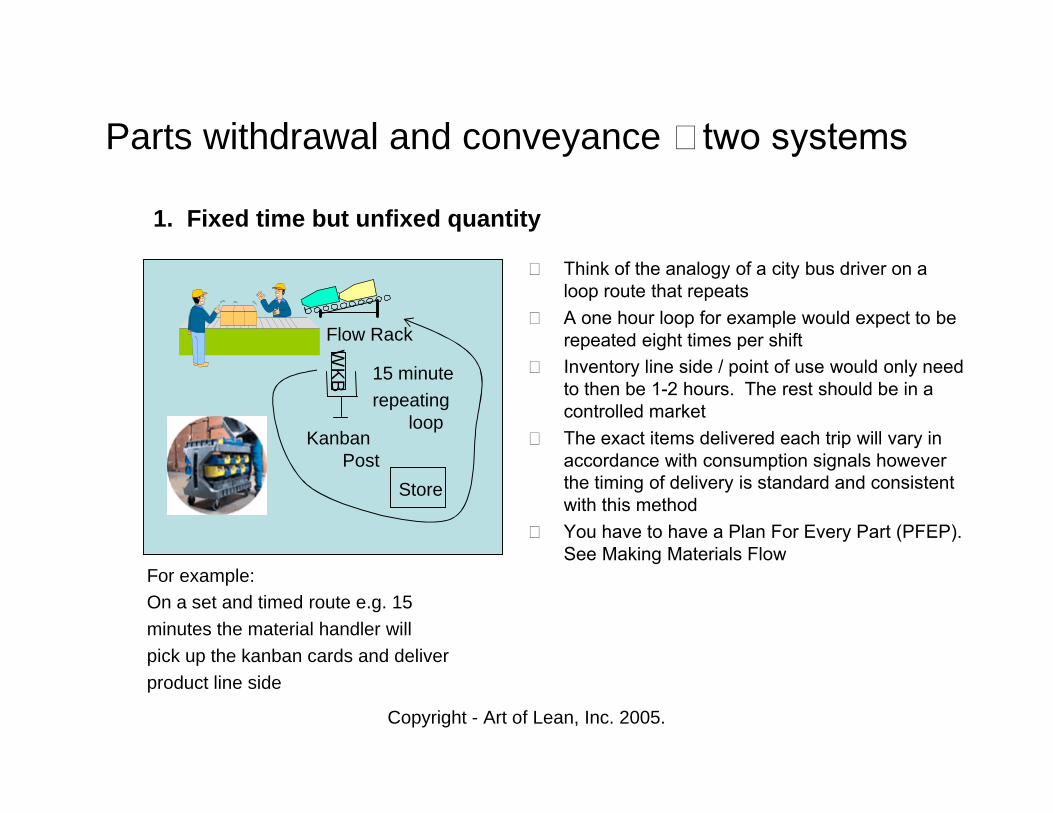
1. Fixed time but unfixed quantity
Flow Rack
Kanban Post
WKB
For example:On a set and timed route e.g. 15minutes the material handler will pick up the kanban cards and deliver product line side
15 minute repeating
loop
Store
Parts withdrawal and conveyance – two systems
• Think of the analogy of a city bus driver on a loop route that repeats
• A one hour loop for example would expect to be repeated eight times per shift
• Inventory line side / point of use would only need to then be 1-2 hours. The rest should be in a controlled market
• The exact items delivered each trip will vary in accordance with consumption signals however the timing of delivery is standard and consistent with this method
• You have to have a Plan For Every Part (PFEP). See Making Materials Flow
Copyright - Art of Lean, Inc. 2005.
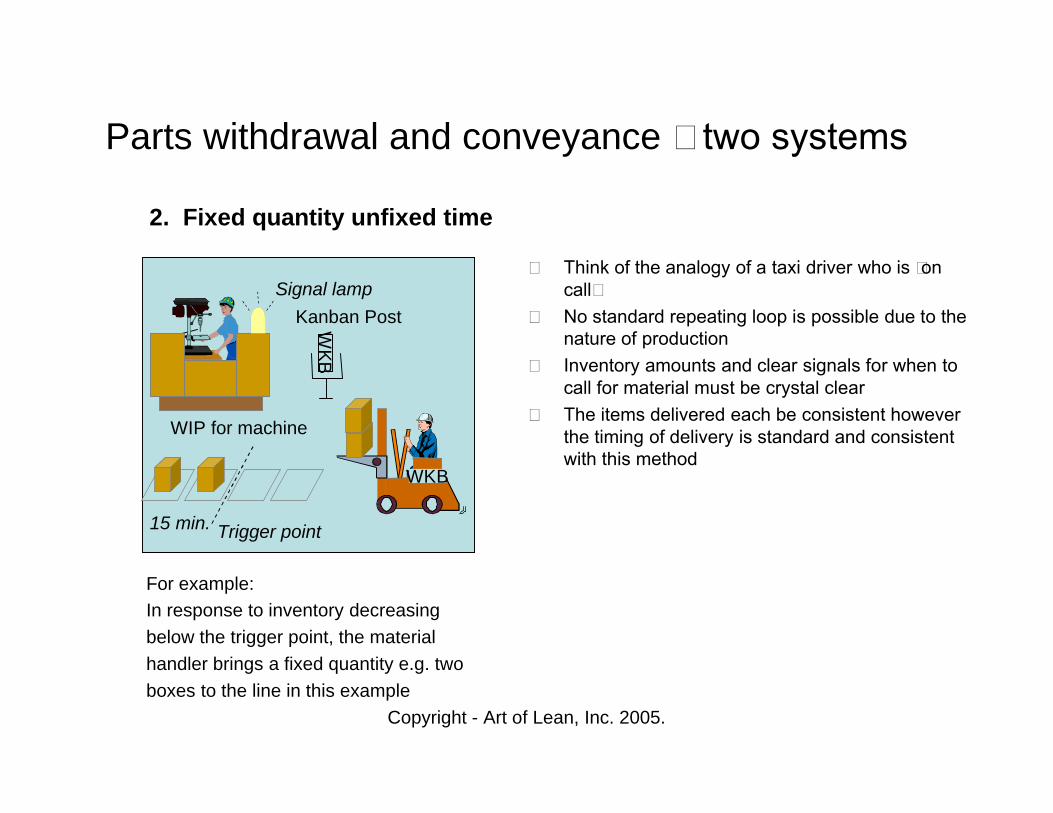
2. Fixed quantity unfixed time
Trigger point 15 min.
WIP for machine
Signal lamp Kanban PostW
KB
WKB
For example:In response to inventory decreasing below the trigger point, the material handler brings a fixed quantity e.g. two boxes to the line in this example
Parts withdrawal and conveyance – two systems
• Think of the analogy of a taxi driver who is “on call”
• No standard repeating loop is possible due to the nature of production
• Inventory amounts and clear signals for when to call for material must be crystal clear
• The items delivered each be consistent however the timing of delivery is standard and consistent with this method
Copyright - Art of Lean, Inc. 2005.
Types of kanban
Pattern productionLot size & batch boardTriangle kanban
Kanban
ProductionInstruction
PartsWithdrawal
In-process kanban
Signal kanban
Inter-process
Supplier
Copyright - Art of Lean, Inc. 2005.
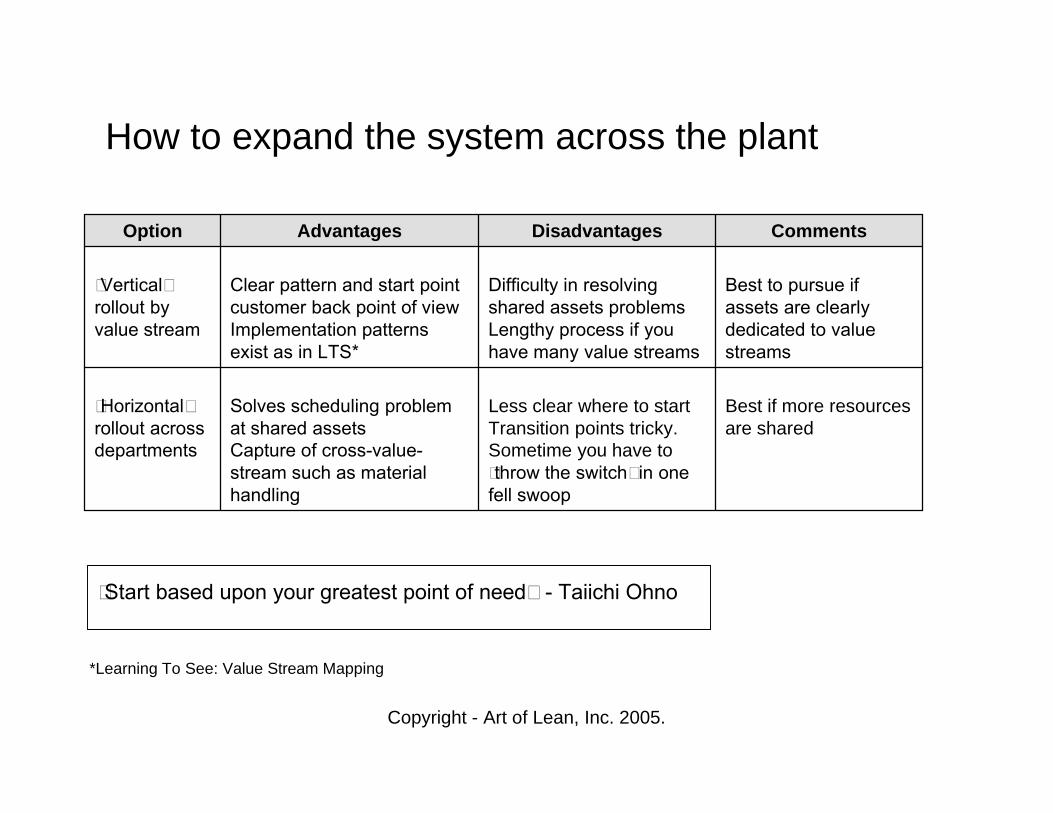
How to expand the system across the plant
Best if more resources are shared
Less clear where to startTransition points tricky. Sometime you have to “throw the switch” in one fell swoop
Solves scheduling problem at shared assetsCapture of cross-value-stream such as material handling
“Horizontal”rollout across departments
Best to pursue if assets are clearly dedicated to value streams
Difficulty in resolving shared assets problems Lengthy process if you have many value streams
Clear pattern and start point customer back point of viewImplementation patterns exist as in LTS*
“Vertical”rollout by value stream
CommentsDisadvantagesAdvantagesOption
*Learning To See: Value Stream Mapping
“Start based upon your greatest point of need” - Taiichi Ohno
Copyright - Art of Lean, Inc. 2005.
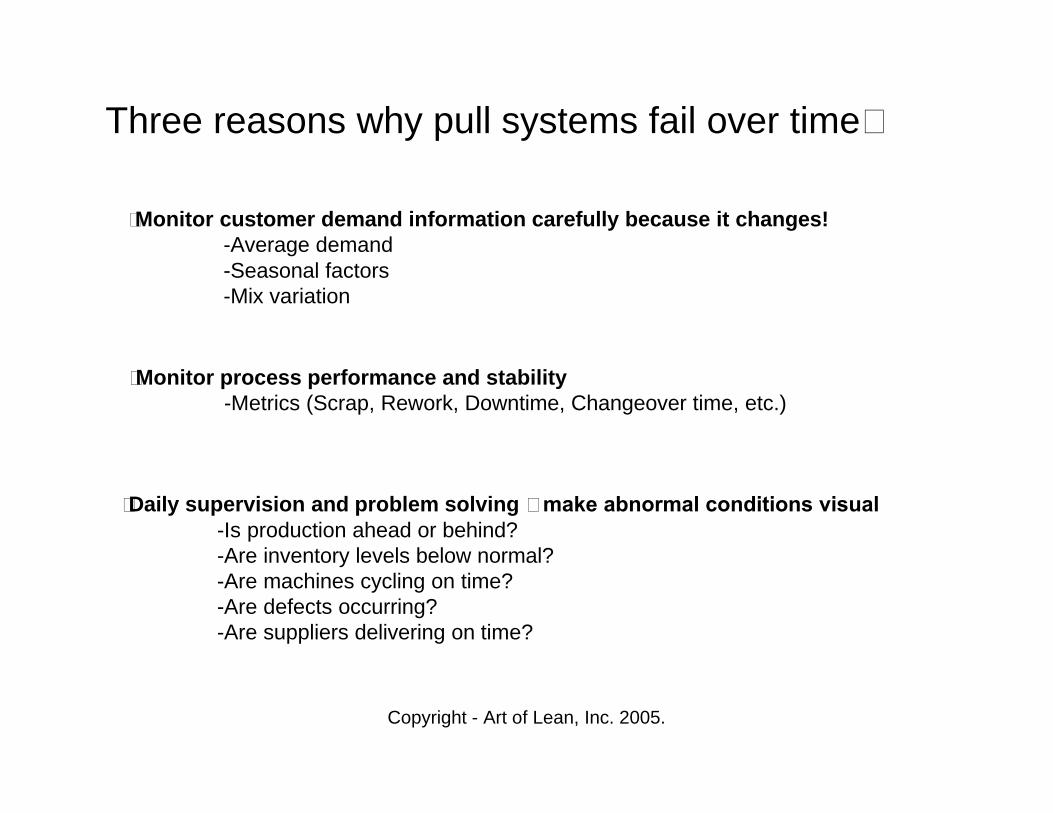
Three reasons why pull systems fail over time…
•Monitor customer demand information carefully because it changes!-Average demand-Seasonal factors-Mix variation
•Monitor process performance and stability -Metrics (Scrap, Rework, Downtime, Changeover time, etc.)
•Daily supervision and problem solving – make abnormal conditions visual -Is production ahead or behind?-Are inventory levels below normal?-Are machines cycling on time?-Are defects occurring?-Are suppliers delivering on time?
Copyright - Art of Lean, Inc. 2005.
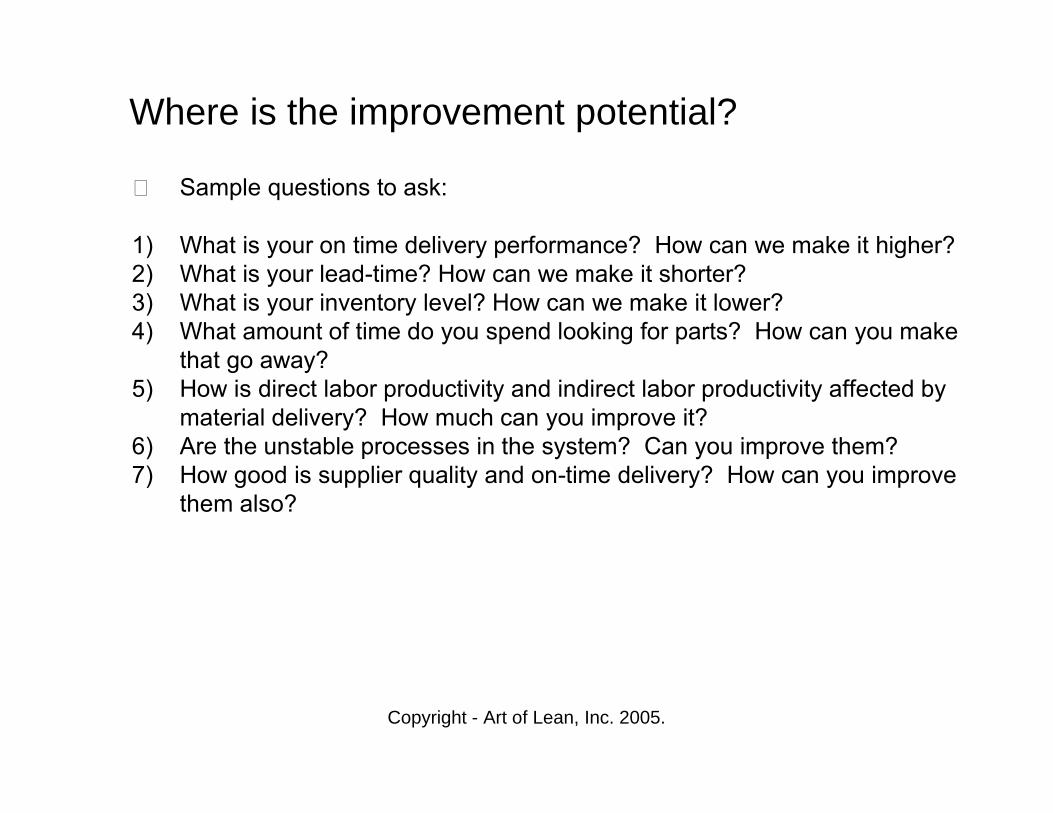
Where is the improvement potential?
• Sample questions to ask:
1) What is your on time delivery performance? How can we make it higher?2) What is your lead-time? How can we make it shorter?3) What is your inventory level? How can we make it lower?4) What amount of time do you spend looking for parts? How can you make
that go away?5) How is direct labor productivity and indirect labor productivity affected by
material delivery? How much can you improve it?6) Are the unstable processes in the system? Can you improve them?7) How good is supplier quality and on-time delivery? How can you improve
them also?

Copyright - Art of Lean, Inc. 2005.
Lead-time improvement lever – analysis by inventory driver
Key drivers
25
40
35
TotalPlantInventory
100%
FG
WIP
Raw
Cycle stock (80%)
Demand side buffer stock(15%)
Supply side safety stock (5%)
Average demand
Lead time to replenish
Demand volatility
Forecast/MPS errors
Down time losses
Quality losses
Inventory required to fulfill average demand
Inventory to buffer against fluctuations in customer orders
Inventory to buffer against variability in internal mfg. processes
FinishedGoodsInventory
Illustrative example
Copyright - Art of Lean, Inc. 2005.
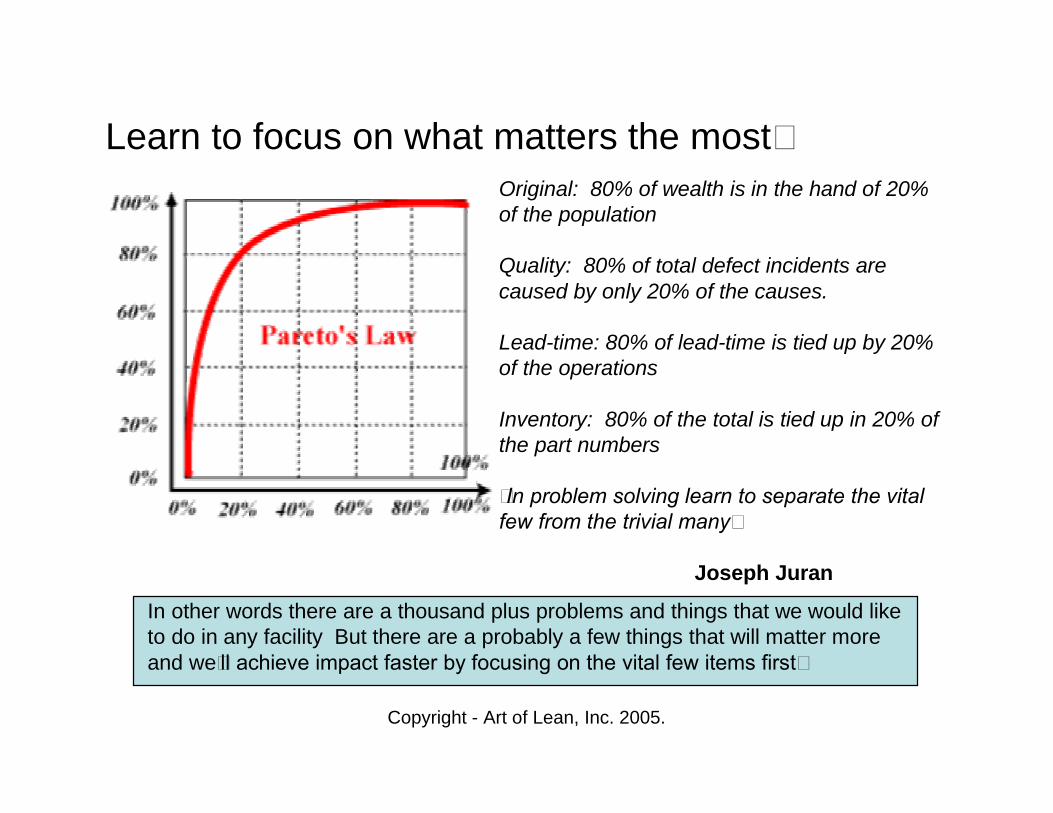
Original: 80% of wealth is in the hand of 20% of the population
Quality: 80% of total defect incidents are caused by only 20% of the causes.
Lead-time: 80% of lead-time is tied up by 20% of the operations
Inventory: 80% of the total is tied up in 20% of the part numbers
“In problem solving learn to separate the vital few from the trivial many”
Joseph Juran
In other words there are a thousand plus problems and things that we would like to do in any facility But there are a probably a few things that will matter more and we’ll achieve impact faster by focusing on the vital few items first…
Learn to focus on what matters the most…