what is the cost of integration? evidence from an
TRANSCRIPT
What is the cost of integration? Evidence from anintegrated health and agriculture project toimprove nutrition outcomes in Western KenyaCarol E Levin, University of WashingtonJulie L Self, Emory UniversityEllah Kedera, PathMoses Wamalwa, International Potato CenterJia Hu, University of TorontoFrederick Grant, International Potato CenterAmy Webb Girard, Emory UniversityDonald C Cole, University of TorontoJan W Low, International Potato Center
Journal Title: Health Policy and PlanningVolume: Volume 34, Number 9Publisher: Oxford University Press (OUP): Policy B - Oxford Open Option D |2019-11-01, Pages 646-655Type of Work: Article | Final Publisher PDFPublisher DOI: 10.1093/heapol/czz083Permanent URL: https://pid.emory.edu/ark:/25593/vdxbv
Final published version: http://dx.doi.org/10.1093/heapol/czz083
Copyright information:© 2019 The Author(s) 2019. Published by Oxford University Press inassociation with The London School of Hygiene and Tropical Medicine.This is an Open Access work distributed under the terms of the CreativeCommons Attribution 4.0 International License(https://creativecommons.org/licenses/by/4.0/).
Accessed March 26, 2022 2:14 AM EDT
What is the cost of integration? Evidence
from an integrated health and agriculture
project to improve nutrition outcomes in
Western Kenya
Carol E Levin 1,*, Julie L Self2, Ellah Kedera3, Moses Wamalwa4,
Jia Hu5, Frederick Grant6, Amy Webb Girard2, Donald C Cole5 and
Jan W Low6
1Department of Global Health, University of Washington, NJB Box #359931, 325 Ninth Avenue, Seattle, WA, USA,2Rollins School of Public Health, Emory University, 1518 Clifton Road, Atlanta, GA 30322, USA, 3Path, Bungoma,
Kenya, 4International Potato Center, Bungoma, Kenya, 5Dalla Lana School of Public Health, University of
Toronto, 155 College St Room 500, Toronto, ON M5T 3M7, Canada and 6International Potato Center, PO Box 25171,
Nairobi, Kenya
*Corresponding author. Department of Global Health, University of Washington, NJB Box #359931, 325 Ninth Avenue,
Seattle, WA 98104-2499, USA. E-mail: [email protected]
Accepted on 1 August 2019
Abstract
Integrated nutrition and agricultural interventions have the potential to improve the efficiency and
effectiveness of investments in food security and nutrition. This article aimed to estimate the costs
of an integrated agriculture and health intervention (Mama SASHA) focused on the promotion of
orange-fleshed sweet potato (OFSP) production and consumption in Western Kenya. Programme
activities included nutrition education and distribution of vouchers for OFSP vines during antenatal
care and postnatal care (PNC) visits. We used expenditures and activity-based costing to estimate
the financial costs during programme implementation (2011–13). Cost data were collected from
monthly expense reports and interviews with staff members from all implementing organizations.
Financial costs totalled US$507 809 for the project period. Recruiting and retaining women over the
duration of their pregnancy and postpartum period required significant resources. Mama SASHA
reached 3281 pregnant women at a cost of US$155 per beneficiary. Including both pregnant women
and infants who attended PNC services with their mothers, the cost was US$110 per beneficiary.
Joint planning, co-ordination and training across sectors drove 27% of programme costs. This study
found that the average cost per beneficiary to implement an integrated agriculture, health and nutri-
tion programme was substantial. Planning and implementing less intensive integrated interventions
may be possible, and economies of scale may reduce overall costs. Empirical estimates of costs by
components are critical for future planning and scaling up of integrated programmes.
Keywords: Agriculture, costs, food-based strategies, health, integration, nutrition
Background
Agricultural and nutrition-sensitive interventions can complement
health service and nutrition-specific interventions to improve child
outcomes (Hawkes and Ruel, 2006; World Bank, 2008; Ruel et al.,
2018). However, evidence of the cost of scale-up is largely limited to
nutrition-specific interventions (Horton et al., 2010; Bhutta et al.,
2013), such as behaviour change communication, micronutrient
supplementation, food fortification and integrated child health days
or child health weeks (Fiedler et al., 2007). There is little evidence
of the costs and benefits of integrating nutrition-specific and
VC The Author(s) 2019. Published by Oxford University Press in association with The London School of Hygiene and Tropical Medicine.
This is an Open Access article distributed under the terms of the Creative Commons Attribution License (http://creativecommons.org/licenses/by/4.0/), which permits
unrestricted reuse, distribution, and reproduction in any medium, provided the original work is properly cited. 646
Health Policy and Planning, 34, 2019, 646–655
doi: 10.1093/heapol/czz083
Advance Access Publication Date: 29 August 2019
Original Article
nutrition-sensitive interventions across multiple sectors (Ruel, 2001;
Girard et al., 2012; Masset et al., 2012; Black et al., 2015). Cost evi-
dence will be crucial to support investments to scale-up integrated
nutrition interventions (Hawkes et al., 2012; Ruel and Alderman,
2013; Ruel et al., 2018). Lessons from the health sector indicate that
there may be cost efficiency gains from integration, though integra-
tion may also lead to an increase in overall programme costs (Atun
et al., 2010; Sweeney et al., 2012; Siapka et al., 2014; Obure et al.,
2016).
The Mama SASHA project explicitly integrated agriculture and
nutrition interventions into existing Ministry of Health (MOH) ante-
natal care (ANC) services, with the aim of maximizing the benefits of
orange-fleshed sweet potato (OFSP) on the health status of mothers
and children <2 years of age. A comprehensive evaluation strategy
assessed impact, acceptability, feasibility and affordability of the inte-
grated approach (Machira, 2013; Cole et al., 2016). An impact assess-
ment demonstrated that the intervention package led to increased
ANC utilization, improved nutrition and health knowledge, greater
diet diversity and more frequent consumption of vitamin A-rich foods
(Levin et al., 2016). In addition, results from a nested cohort study
demonstrated that health service promotion of OFSP was a feasible
strategy to measurably improve nutrition knowledge, vitamin A
intakes and vitamin A status (Girard et al., 2017a,b).
Donors, governments and implementers need evidence on the
costs and benefits of integrated, multi-sector nutrition interventions
to assess value for money and affordability, and to make financial
projections for scaling up effective programmes. This article presents
our approach to cost documentation, analysis and evidence on the
costs and affordability of Mama SASHA. The specific objectives
were: (1) to estimate the total implementation costs and cost per
beneficiary of the Mama SASHA intervention and (2) to identify po-
tential efficiencies for scaling up the intervention to other locations
where OFSP holds promise.
Project overviewThe Sweetpotato Action for Security and Health in Africa (SASHA)
was a 5-year multi-partner project designed to improve the food se-
curity and livelihoods of poor families in sub-Saharan Africa by
exploiting the untapped potential of sweet potato.1 The agriculture-
health linkages Mama SASHA project in the Western Province of
Kenya was a component of the larger SASHA project. The Mama
SASHA project was integrated into the USAID/Kenya AIDS,
Population and Health Integrated Assistance Program (APHIA II
and APHIAplus) and bundled OFSP promotion and production sup-
port with ANC and enhanced nutrition and infant and young child
feeding education. The overall Mama SASHA project goal was to
improve the health status of pregnant women and the nutritional
status of children up to 2 years through an integrated OFSP and
health service delivery strategy in Bungoma and Busia counties,
Kenya.
Implementation activitiesThe Mama SASHA intervention was conducted through a combin-
ation of health facility and community-based strategies targeting
pregnant women. After an initial pilot in 2009, the implementation
start-up activities (planning and training) began in late 2010 and re-
current implementation activities ran from March 2011 to
December 2013. See Cole et al. (2016) for a description and timing
of pilot and intervention implementation activities. Vouchers for
OFSP vines were the pivotal design element, used to link community
health workers (CHWs), nurses, secondary vine multipliers (VMs)
and agriculture extension agents to work together to increase OFSP
production and consumption and increase health service utilization.
Vine vouchers were the driving incentive for mothers to attend ANC
clinics and a key integrating mechanism. At the community level,
CHWs recruited women into pregnant women clubs (PWCs),
informing women that they would receive a pair of vouchers for
OFSP vines upon attending ANC clinics serving their community. At
the facility, nurses issued vouchers and provided counselling on nu-
trition and healthy eating for pregnant women and infants. In agri-
cultural fields, VMs provided women with vines upon receipt of
each pair of vouchers. In addition, trained agriculture extension offi-
cers (AEOs) followed up with agronomic advice and home visits to
assess and discuss OFSP planting and crop management.
Mama SASHA implementing partners (nurses, CHWs, AEOs,
CHWs and VMs) received training to support the pregnant women
with nutrition counselling, accessing vines and offering OFSP pro-
duction support. Co-ordination and monitoring activities were crit-
ical for integrating the Mama SASHA project into existing ANC and
postnatal care (PNC) services and for ensuring a shared understand-
ing and coherent implementation of activities. Integration activities
included annual, quarterly and monthly feedback meetings, trans-
portation and per diems for all meeting participants, and NGO la-
bour to support integration.
Key Messages
• This is one of the few studies to address the challenge of capturing the costs of interventions that work across sectors
to improve health and nutrition.• The cost per beneficiary for the integrated agriculture-nutrition-health intervention was US$155, when considering
women only, and reduced to US$110, when also including infants who attended postnatal care services. These costs are
comparable with other community-based interventions.• The costliest component of the intervention was integration, which included monthly feedback meetings and other co-
ordination and monitoring activities by all partners and implementing agents (27%), followed by administration and
overhead (23%) and training (15%).• Scenarios for lowering costs through economies of scale and integration into routine services should be further
explored.
1 The project was led by the International Potato Center, with the
nutrition/health component led by the International Health
NGO PATH, together with to national NGOs focused on agri-
culture (CREADIS and ARDAP) and personnel from the MOH
and the MOA.
Health Policy and Planning, 2019, Vol. 34, No. 9 647
Methods
This cost analysis estimated incremental total financial and unit
costs for start-up and recurrent activities related to delivering the
Mama SASHA activities, described above, at health facilities already
supported by the USAID APHIAplus project. We used a mix of top-
down expenditure analysis and bottom-up activity-based costing to
understand resource use and financial costs. The analysis followed
existing methodological guidance for primary health care costing in
low- and middle-income countries (Creese and Parker, 1994;
Walker, 2001; Fiedler et al., 2008). We collected data on costs from
project documents, monthly expense reports and interviews with
key staff from the implementing organizations. Our approach
allowed us to consider three mutually exclusive ways to classify
costs: by activity, by input and by start-up vs recurrent
implementation.
Activity cost categoriesWe conducted activity-based costing and allocated the costs of the
Mama SASHA project to several broad categories: planning, train-
ing, materials development, or delivery of community, health and
agricultural support services. Most activities were comprised of
costs related to personnel, travel, per diem, supplies and equipment
depreciation. We created a separate activity category called ‘admin-
istration’ to capture overhead and indirect costs. We interviewed
staff across implementing organizations to understand the timing
and frequency of activities and personnel time allocated to specific
Mama SASHA activities.
This analysis recognized that the intervention built on existing
health and agriculture capacity and infrastructure. The activity cate-
gories reflect additional activities that were not part of existing
ANC and PNC services; therefore, the financial cost estimates do
not include the value of shared personnel costs from the MOH and
the Ministry of Agriculture (MOA), or the costs of community-
based activities by established cadres of CHWs already supported by
APHIA II and APHIAplus. For example, we included the costs asso-
ciated with new NGO activities like managing the receipt and re-
demption of vouchers, supporting PWC, or initiating and
supervising agricultural activities for establishing vine multiplication
of new varieties of OFSP. The current analysis adopted a provider
prospective, where the provider was a combination of the Kenyan
government and NGO services based in Kenya.
Input cost categoriesWe also classified costs based on input categories for personnel,
agriculture supplies, agriculture equipment, other consumable sup-
plies, other capital equipment, transportation, travel per diem,
allowances, mixed inputs, vouchers and other costs (Table 1). We
estimated indirect administrative (overhead) costs for both inter-
national non-profit partners based on standard percentages used by
each organization. For all agricultural and other equipment or cap-
ital goods, we included financial depreciation equal to the value of
the capital equipment divided by useful life years, where useful life
years was 10 years for the international non-profit project vehicles
and 5 years for all other capital equipment or vehicles procured by
the NGOs and used by project implementers, such as irrigation
equipment used by the VMs. All costs were collected in Kenyan local
currency and converted to 2013 US$ using an average exchange rate
of 84 Kenyan Shillings per US Dollar (Central Bank of Kenya,
2013).
Start-up and recurrent implementation costsStart-up costs included costs on activities for planning, education
and communication (IEC) materials development (December 2009
to December 2010), training programme development, establishing
secondary VM plots, and promotion and awareness-raising activities
(September 2010 to February 2011). Start-up costs were considered
a type of fixed or capital cost, where we estimated their useful life
years as 5 years (i.e. the life of the project). Recurrent costs were for
inputs associated with maintaining the supply and demand for vines,
supervision and support for health facilities, and integration activ-
ities, including any refresher training, occurring from March 2011
through December 2013.
Omitted costsAll research-related costs were excluded from this analysis. In add-
ition to implementing the Mama SASHA project described here,
some implementing organizations had additional research costs to
support the overarching SASHA project research objectives.
Personnel, transportation and travel costs were proportionately allo-
cated to research based on staff time spent between research and im-
plementation activities. Only personnel time spent on Mama
SASHA implementation was included.
Data management and analysisWe transcribed the international and local NGO project expense
reports into an excel template. All data were entered by organization
and assigned activity and input codes based on the cost categories
described above and in Table 1. The sum of the activity cost catego-
ries is comprehensive and includes all incremental financial costs to
implement the integrated interventions.
Project outputsThe cost analysis uses two main summary measures of overall inter-
vention service provision: (1) the number of beneficiaries reached
and (2) the total points of contacts with beneficiaries. We estimated
both using monthly data collected as part of routine Mama SASHA
monitoring (for details, see Cole et al., 2016). Health service deliv-
ery indicators included the number of PWCs and the number of
women per club session, ANC delivery tracking, PNC delivery
tracking, and ANC monthly reporting on women receiving vouch-
ers. On the agriculture side, indicators included voucher tracking,
frequency of home visits for OFSP production and monitoring AEO
visits. Monthly data were compiled and aggregated over the 3-year
project period, by health facility, to estimate the total number of sin-
gle-count women who received and redeemed vouchers, the number
of women participating in PWC, and the number of voucher pairs
issued during ANC and redeemed through VMs. See Supplementary
Appendix Table SA1 for more details.
The number of project beneficiaries reached was defined as: (1)
the total number of single-count women who received and redeemed
vouchers; and (2) 1þ the number of infants who attended a PNC
visit with their mother.2 The total number of contacts summarized
the total number of times beneficiaries came into contact with
implementing agents to promote the production and consumption of
OFSP. Beneficiaries could participate in monthly PWCs held at the
community level. They could interact with ANC or PNC health
2 We could only track the infants of Mama SASHA mother bene-
ficiaries if they attended a PNC visit where the mother received
a voucher for vines. This number underestimates the total num-
ber of infants born to the project’s beneficiaries.
648 Health Policy and Planning, 2019, Vol. 34, No. 9
workers up to five times throughout their pregnancy and the new-
born period. In addition, beneficiaries could receive at the ANC clin-
ic four pairs of vouchers, which they could subsequently redeem for
vines from participating VM farmers.
CostsWe aggregated incremental financial costs by year and by NGO or-
ganization for the implementation phase (2011–13). Unit costs were
estimated as incremental financial costs per service delivery output
described above (Supplementary Appendix Table SA1). The cost per
(direct) beneficiary was estimated as the total financial costs divided
by the number of single-count mothers who have received and
redeemed the voucher (or as total financial costs divided by the sin-
gle-count mothers plus infants). The cost per contact was estimated
as the total financial costs divided by the total number of contacts as
defined above. We also estimated unit costs for critical intermediate
outputs, such as the cost per pregnant woman’s club and the cost
per voucher pair issued (Supplementary Appendix Table SA2).
Lastly, we estimated resource allocation by activity and input, show-
ing the breakdown of these costs as a share of total costs.
Sensitivity and scenario analysisWe conducted sensitivity analysis to characterize uncertainty around
cost estimates. Given that it was difficult to allocate shared pro-
gramme costs for vehicles and transportation that supported concur-
rent implementation and research, we chose a high scenario estimate
assuming a 25% increase in international NGO transportation
costs. To estimate a more typical scenario for the intervention in the
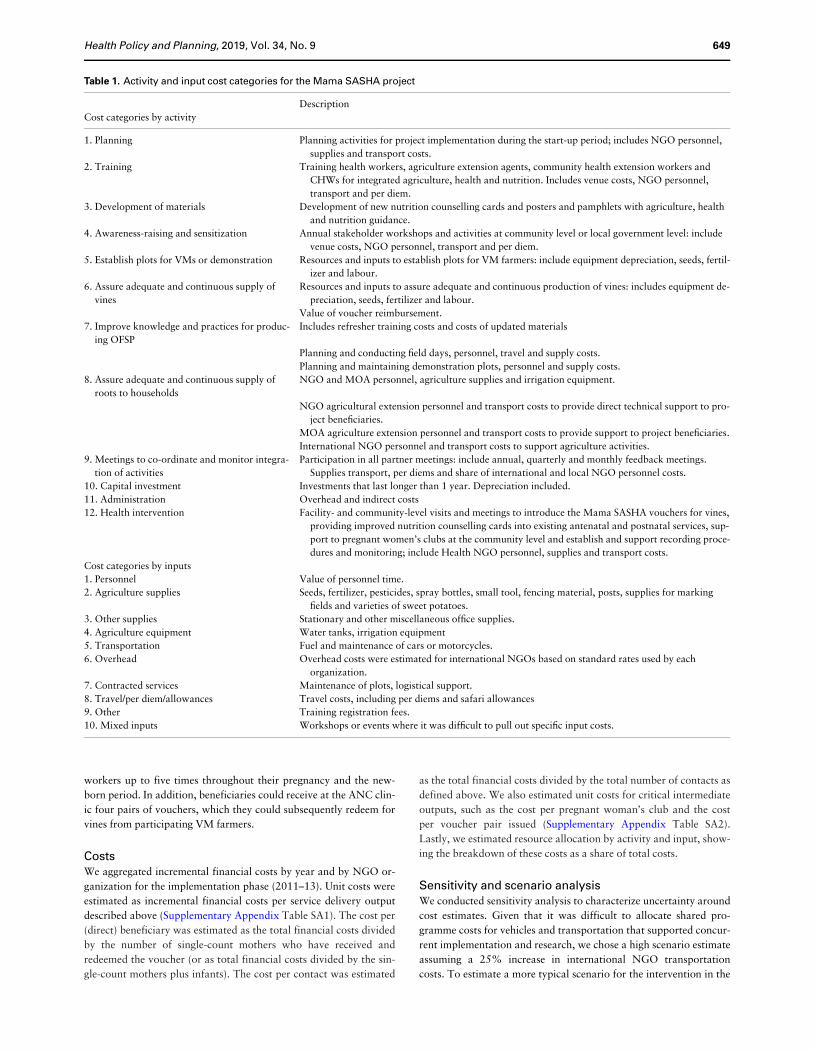
Table 1. Activity and input cost categories for the Mama SASHA project
Description
Cost categories by activity
1. Planning Planning activities for project implementation during the start-up period; includes NGO personnel,
supplies and transport costs.
2. Training Training health workers, agriculture extension agents, community health extension workers and
CHWs for integrated agriculture, health and nutrition. Includes venue costs, NGO personnel,
transport and per diem.
3. Development of materials Development of new nutrition counselling cards and posters and pamphlets with agriculture, health
and nutrition guidance.
4. Awareness-raising and sensitization Annual stakeholder workshops and activities at community level or local government level: include
venue costs, NGO personnel, transport and per diem.
5. Establish plots for VMs or demonstration Resources and inputs to establish plots for VM farmers: include equipment depreciation, seeds, fertil-
izer and labour.
6. Assure adequate and continuous supply of
vines
Resources and inputs to assure adequate and continuous production of vines: includes equipment de-
preciation, seeds, fertilizer and labour.
Value of voucher reimbursement.
7. Improve knowledge and practices for produc-
ing OFSP
Includes refresher training costs and costs of updated materials
Planning and conducting field days, personnel, travel and supply costs.
Planning and maintaining demonstration plots, personnel and supply costs.
8. Assure adequate and continuous supply of
roots to households
NGO and MOA personnel, agriculture supplies and irrigation equipment.
NGO agricultural extension personnel and transport costs to provide direct technical support to pro-
ject beneficiaries.
MOA agriculture extension personnel and transport costs to provide support to project beneficiaries.
International NGO personnel and transport costs to support agriculture activities.
9. Meetings to co-ordinate and monitor integra-
tion of activities
Participation in all partner meetings: include annual, quarterly and monthly feedback meetings.
Supplies transport, per diems and share of international and local NGO personnel costs.
10. Capital investment Investments that last longer than 1 year. Depreciation included.
11. Administration Overhead and indirect costs
12. Health intervention Facility- and community-level visits and meetings to introduce the Mama SASHA vouchers for vines,
providing improved nutrition counselling cards into existing antenatal and postnatal services, sup-
port to pregnant women’s clubs at the community level and establish and support recording proce-
dures and monitoring; include Health NGO personnel, supplies and transport costs.
Cost categories by inputs
1. Personnel Value of personnel time.
2. Agriculture supplies Seeds, fertilizer, pesticides, spray bottles, small tool, fencing material, posts, supplies for marking
fields and varieties of sweet potatoes.
3. Other supplies Stationary and other miscellaneous office supplies.
4. Agriculture equipment Water tanks, irrigation equipment
5. Transportation Fuel and maintenance of cars or motorcycles.
6. Overhead Overhead costs were estimated for international NGOs based on standard rates used by each
organization.
7. Contracted services Maintenance of plots, logistical support.
8. Travel/per diem/allowances Travel costs, including per diems and safari allowances
9. Other Training registration fees.
10. Mixed inputs Workshops or events where it was difficult to pull out specific input costs.
Health Policy and Planning, 2019, Vol. 34, No. 9 649
event that the MOH and MOA decided to continue supporting these
activities beyond the life of the Mama SASHA project, the low scen-
ario cost estimate applied a local staff salary to both the overall co-
ordination and supervision role and the local agronomist’s position,
as well as reduced indirect costs for international non-profit
organizations.
Results
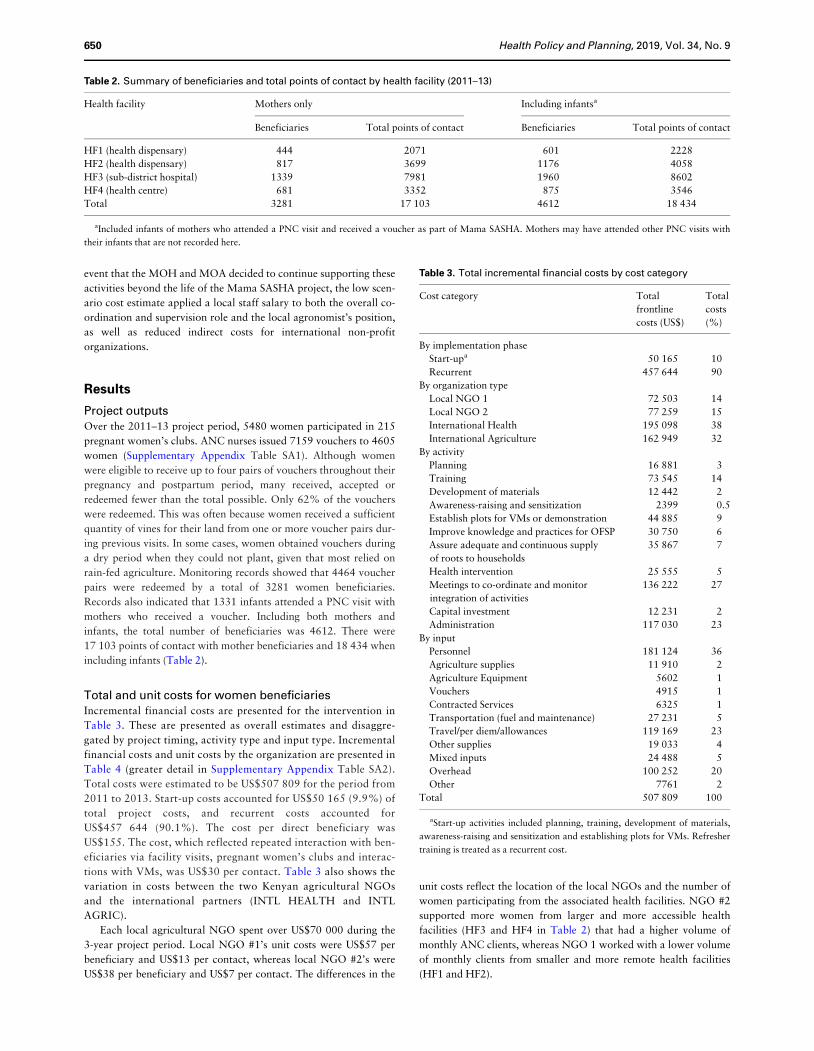
Project outputsOver the 2011–13 project period, 5480 women participated in 215
pregnant women’s clubs. ANC nurses issued 7159 vouchers to 4605
women (Supplementary Appendix Table SA1). Although women
were eligible to receive up to four pairs of vouchers throughout their
pregnancy and postpartum period, many received, accepted or
redeemed fewer than the total possible. Only 62% of the vouchers
were redeemed. This was often because women received a sufficient
quantity of vines for their land from one or more voucher pairs dur-
ing previous visits. In some cases, women obtained vouchers during
a dry period when they could not plant, given that most relied on
rain-fed agriculture. Monitoring records showed that 4464 voucher
pairs were redeemed by a total of 3281 women beneficiaries.
Records also indicated that 1331 infants attended a PNC visit with
mothers who received a voucher. Including both mothers and
infants, the total number of beneficiaries was 4612. There were
17 103 points of contact with mother beneficiaries and 18 434 when
including infants (Table 2).
Total and unit costs for women beneficiariesIncremental financial costs are presented for the intervention in
Table 3. These are presented as overall estimates and disaggre-
gated by project timing, activity type and input type. Incremental
financial costs and unit costs by the organization are presented in
Table 4 (greater detail in Supplementary Appendix Table SA2).
Total costs were estimated to be US$507 809 for the period from
2011 to 2013. Start-up costs accounted for US$50 165 (9.9%) of
total project costs, and recurrent costs accounted for
US$457 644 (90.1%). The cost per direct beneficiary was
US$155. The cost, which reflected repeated interaction with ben-
eficiaries via facility visits, pregnant women’s clubs and interac-
tions with VMs, was US$30 per contact. Table 3 also shows the
variation in costs between the two Kenyan agricultural NGOs
and the international partners (INTL HEALTH and INTL
AGRIC).
Each local agricultural NGO spent over US$70 000 during the
3-year project period. Local NGO #1’s unit costs were US$57 per
beneficiary and US$13 per contact, whereas local NGO #2’s were
US$38 per beneficiary and US$7 per contact. The differences in the
unit costs reflect the location of the local NGOs and the number of
women participating from the associated health facilities. NGO #2
supported more women from larger and more accessible health
facilities (HF3 and HF4 in Table 2) that had a higher volume of
monthly ANC clients, whereas NGO 1 worked with a lower volume
of monthly clients from smaller and more remote health facilities
(HF1 and HF2).
Table 2. Summary of beneficiaries and total points of contact by health facility (2011–13)
Health facility Mothers only Including infantsa
Beneficiaries Total points of contact Beneficiaries Total points of contact
HF1 (health dispensary) 444 2071 601 2228
HF2 (health dispensary) 817 3699 1176 4058
HF3 (sub-district hospital) 1339 7981 1960 8602
HF4 (health centre) 681 3352 875 3546
Total 3281 17 103 4612 18 434
aIncluded infants of mothers who attended a PNC visit and received a voucher as part of Mama SASHA. Mothers may have attended other PNC visits with
their infants that are not recorded here.
Table 3. Total incremental financial costs by cost category
Cost category Total
frontline
costs (US$)
Total
costs
(%)
By implementation phase
Start-upa 50 165 10
Recurrent 457 644 90
By organization type
Local NGO 1 72 503 14
Local NGO 2 77 259 15
International Health 195 098 38
International Agriculture 162 949 32
By activity
Planning 16 881 3
Training 73 545 14
Development of materials 12 442 2
Awareness-raising and sensitization 2399 0.5
Establish plots for VMs or demonstration 44 885 9
Improve knowledge and practices for OFSP 30 750 6
Assure adequate and continuous supply
of roots to households
35 867 7
Health intervention 25 555 5
Meetings to co-ordinate and monitor
integration of activities
136 222 27
Capital investment 12 231 2
Administration 117 030 23
By input
Personnel 181 124 36
Agriculture supplies 11 910 2
Agriculture Equipment 5602 1
Vouchers 4915 1
Contracted Services 6325 1
Transportation (fuel and maintenance) 27 231 5
Travel/per diem/allowances 119 169 23
Other supplies 19 033 4
Mixed inputs 24 488 5
Overhead 100 252 20
Other 7761 2
Total 507 809 100
aStart-up activities included planning, training, development of materials,
awareness-raising and sensitization and establishing plots for VMs. Refresher
training is treated as a recurrent cost.
650 Health Policy and Planning, 2019, Vol. 34, No. 9
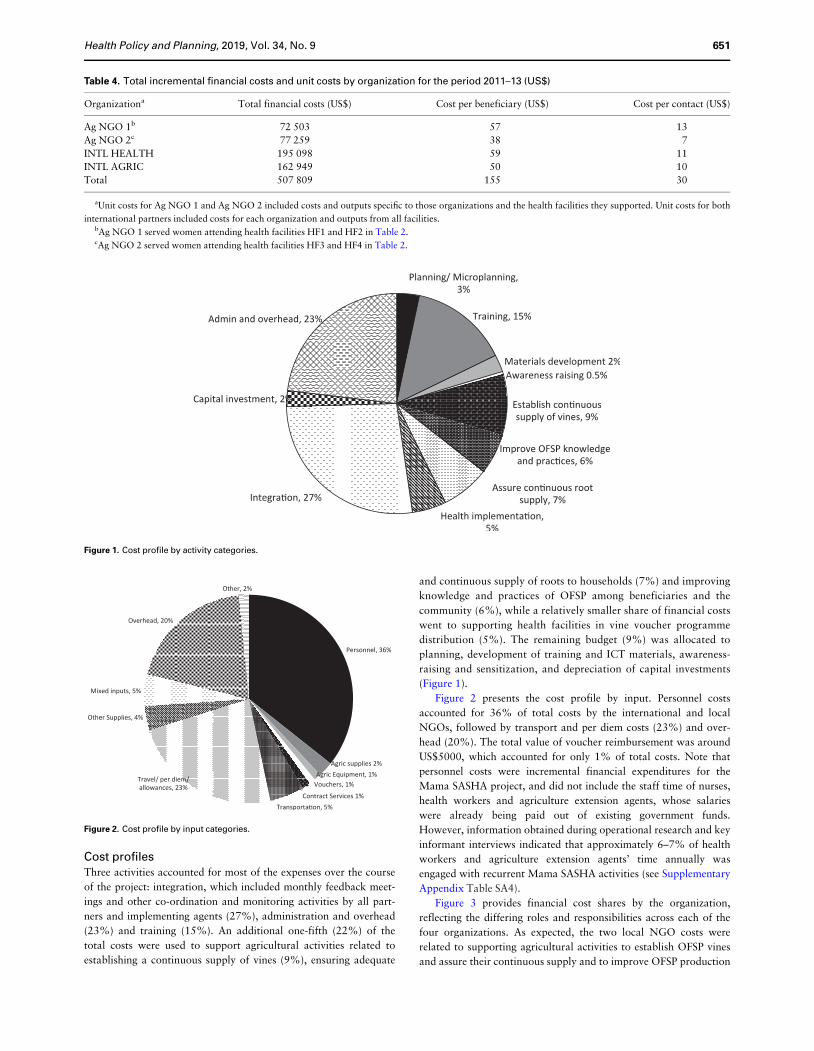
Cost profilesThree activities accounted for most of the expenses over the course
of the project: integration, which included monthly feedback meet-
ings and other co-ordination and monitoring activities by all part-
ners and implementing agents (27%), administration and overhead
(23%) and training (15%). An additional one-fifth (22%) of the
total costs were used to support agricultural activities related to
establishing a continuous supply of vines (9%), ensuring adequate
and continuous supply of roots to households (7%) and improving
knowledge and practices of OFSP among beneficiaries and the
community (6%), while a relatively smaller share of financial costs
went to supporting health facilities in vine voucher programme
distribution (5%). The remaining budget (9%) was allocated to
planning, development of training and ICT materials, awareness-
raising and sensitization, and depreciation of capital investments
(Figure 1).
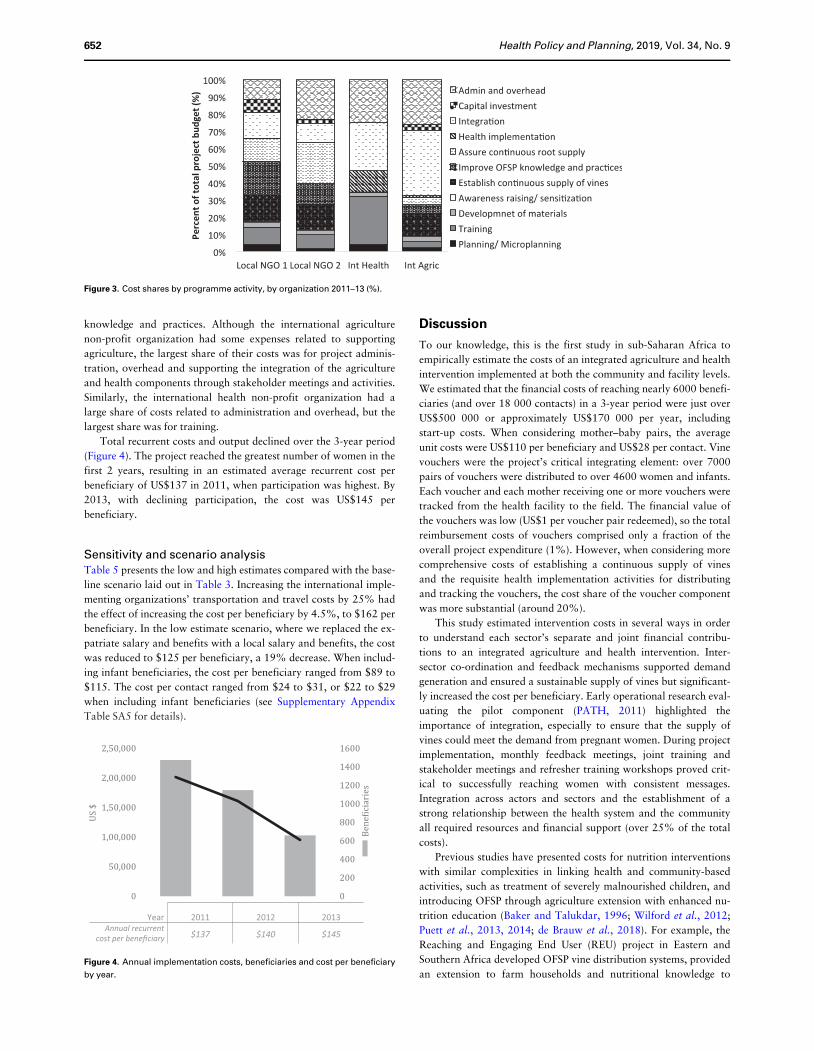
Figure 2 presents the cost profile by input. Personnel costs
accounted for 36% of total costs by the international and local
NGOs, followed by transport and per diem costs (23%) and over-
head (20%). The total value of voucher reimbursement was around
US$5000, which accounted for only 1% of total costs. Note that
personnel costs were incremental financial expenditures for the
Mama SASHA project, and did not include the staff time of nurses,
health workers and agriculture extension agents, whose salaries
were already being paid out of existing government funds.
However, information obtained during operational research and key
informant interviews indicated that approximately 6–7% of health
workers and agriculture extension agents’ time annually was
engaged with recurrent Mama SASHA activities (see Supplementary
Appendix Table SA4).
Figure 3 provides financial cost shares by the organization,
reflecting the differing roles and responsibilities across each of the
four organizations. As expected, the two local NGO costs were
related to supporting agricultural activities to establish OFSP vines
and assure their continuous supply and to improve OFSP production
Table 4. Total incremental financial costs and unit costs by organization for the period 2011–13 (US$)
Organizationa Total financial costs (US$) Cost per beneficiary (US$) Cost per contact (US$)
Ag NGO 1b 72 503 57 13
Ag NGO 2c 77 259 38 7
INTL HEALTH 195 098 59 11
INTL AGRIC 162 949 50 10
Total 507 809 155 30
aUnit costs for Ag NGO 1 and Ag NGO 2 included costs and outputs specific to those organizations and the health facilities they supported. Unit costs for both
international partners included costs for each organization and outputs from all facilities.bAg NGO 1 served women attending health facilities HF1 and HF2 in Table 2.cAg NGO 2 served women attending health facilities HF3 and HF4 in Table 2.
Figure 1. Cost profile by activity categories.
Figure 2. Cost profile by input categories.
Health Policy and Planning, 2019, Vol. 34, No. 9 651
knowledge and practices. Although the international agriculture
non-profit organization had some expenses related to supporting
agriculture, the largest share of their costs was for project adminis-
tration, overhead and supporting the integration of the agriculture
and health components through stakeholder meetings and activities.
Similarly, the international health non-profit organization had a
large share of costs related to administration and overhead, but the
largest share was for training.
Total recurrent costs and output declined over the 3-year period
(Figure 4). The project reached the greatest number of women in the
first 2 years, resulting in an estimated average recurrent cost per
beneficiary of US$137 in 2011, when participation was highest. By
2013, with declining participation, the cost was US$145 per
beneficiary.
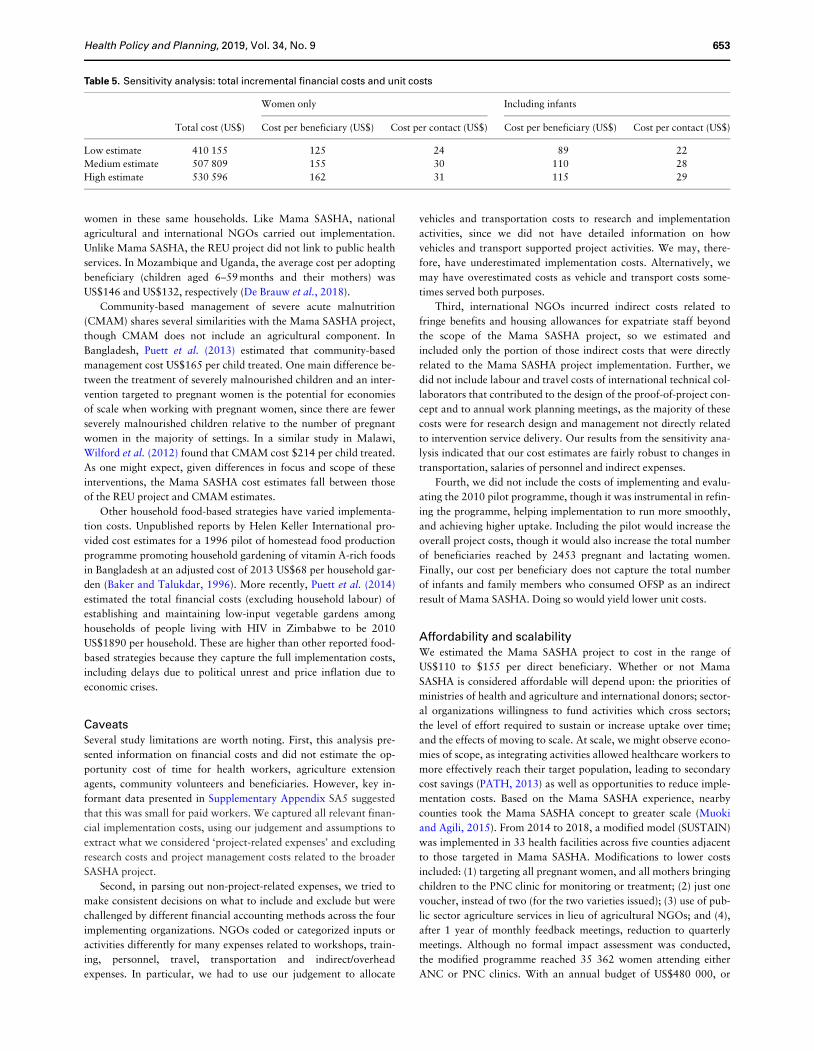
Sensitivity and scenario analysisTable 5 presents the low and high estimates compared with the base-
line scenario laid out in Table 3. Increasing the international imple-
menting organizations’ transportation and travel costs by 25% had
the effect of increasing the cost per beneficiary by 4.5%, to $162 per
beneficiary. In the low estimate scenario, where we replaced the ex-
patriate salary and benefits with a local salary and benefits, the cost
was reduced to $125 per beneficiary, a 19% decrease. When includ-
ing infant beneficiaries, the cost per beneficiary ranged from $89 to
$115. The cost per contact ranged from $24 to $31, or $22 to $29
when including infant beneficiaries (see Supplementary Appendix
Table SA5 for details).
Discussion
To our knowledge, this is the first study in sub-Saharan Africa to
empirically estimate the costs of an integrated agriculture and health
intervention implemented at both the community and facility levels.
We estimated that the financial costs of reaching nearly 6000 benefi-
ciaries (and over 18 000 contacts) in a 3-year period were just over
US$500 000 or approximately US$170 000 per year, including
start-up costs. When considering mother–baby pairs, the average
unit costs were US$110 per beneficiary and US$28 per contact. Vine
vouchers were the project’s critical integrating element: over 7000
pairs of vouchers were distributed to over 4600 women and infants.
Each voucher and each mother receiving one or more vouchers were
tracked from the health facility to the field. The financial value of
the vouchers was low (US$1 per voucher pair redeemed), so the total
reimbursement costs of vouchers comprised only a fraction of the
overall project expenditure (1%). However, when considering more
comprehensive costs of establishing a continuous supply of vines
and the requisite health implementation activities for distributing
and tracking the vouchers, the cost share of the voucher component
was more substantial (around 20%).
This study estimated intervention costs in several ways in order
to understand each sector’s separate and joint financial contribu-
tions to an integrated agriculture and health intervention. Inter-
sector co-ordination and feedback mechanisms supported demand
generation and ensured a sustainable supply of vines but significant-
ly increased the cost per beneficiary. Early operational research eval-
uating the pilot component (PATH, 2011) highlighted the
importance of integration, especially to ensure that the supply of
vines could meet the demand from pregnant women. During project
implementation, monthly feedback meetings, joint training and
stakeholder meetings and refresher training workshops proved crit-
ical to successfully reaching women with consistent messages.
Integration across actors and sectors and the establishment of a
strong relationship between the health system and the community
all required resources and financial support (over 25% of the total
costs).
Previous studies have presented costs for nutrition interventions
with similar complexities in linking health and community-based
activities, such as treatment of severely malnourished children, and
introducing OFSP through agriculture extension with enhanced nu-
trition education (Baker and Talukdar, 1996; Wilford et al., 2012;
Puett et al., 2013, 2014; de Brauw et al., 2018). For example, the
Reaching and Engaging End User (REU) project in Eastern and
Southern Africa developed OFSP vine distribution systems, provided
an extension to farm households and nutritional knowledge to
Figure 3. Cost shares by programme activity, by organization 2011–13 (%).
0
200
400
600
800
1000
1200
1400
1600
0
50,000
1,00,000
1,50,000
2,00,000
2,50,000
Be
ne
�ici
ari
es
US
$
Year 2011 2012 2013Annual recurrent
cost per beneficiary $137 $140 $145
Figure 4. Annual implementation costs, beneficiaries and cost per beneficiary
by year.
652 Health Policy and Planning, 2019, Vol. 34, No. 9
women in these same households. Like Mama SASHA, national
agricultural and international NGOs carried out implementation.
Unlike Mama SASHA, the REU project did not link to public health
services. In Mozambique and Uganda, the average cost per adopting
beneficiary (children aged 6–59 months and their mothers) was
US$146 and US$132, respectively (De Brauw et al., 2018).
Community-based management of severe acute malnutrition
(CMAM) shares several similarities with the Mama SASHA project,
though CMAM does not include an agricultural component. In
Bangladesh, Puett et al. (2013) estimated that community-based
management cost US$165 per child treated. One main difference be-
tween the treatment of severely malnourished children and an inter-
vention targeted to pregnant women is the potential for economies
of scale when working with pregnant women, since there are fewer
severely malnourished children relative to the number of pregnant
women in the majority of settings. In a similar study in Malawi,
Wilford et al. (2012) found that CMAM cost $214 per child treated.
As one might expect, given differences in focus and scope of these
interventions, the Mama SASHA cost estimates fall between those
of the REU project and CMAM estimates.
Other household food-based strategies have varied implementa-
tion costs. Unpublished reports by Helen Keller International pro-
vided cost estimates for a 1996 pilot of homestead food production
programme promoting household gardening of vitamin A-rich foods
in Bangladesh at an adjusted cost of 2013 US$68 per household gar-
den (Baker and Talukdar, 1996). More recently, Puett et al. (2014)
estimated the total financial costs (excluding household labour) of
establishing and maintaining low-input vegetable gardens among
households of people living with HIV in Zimbabwe to be 2010
US$1890 per household. These are higher than other reported food-
based strategies because they capture the full implementation costs,
including delays due to political unrest and price inflation due to
economic crises.
CaveatsSeveral study limitations are worth noting. First, this analysis pre-
sented information on financial costs and did not estimate the op-
portunity cost of time for health workers, agriculture extension
agents, community volunteers and beneficiaries. However, key in-
formant data presented in Supplementary Appendix SA5 suggested
that this was small for paid workers. We captured all relevant finan-
cial implementation costs, using our judgement and assumptions to
extract what we considered ‘project-related expenses’ and excluding
research costs and project management costs related to the broader
SASHA project.
Second, in parsing out non-project-related expenses, we tried to
make consistent decisions on what to include and exclude but were
challenged by different financial accounting methods across the four
implementing organizations. NGOs coded or categorized inputs or
activities differently for many expenses related to workshops, train-
ing, personnel, travel, transportation and indirect/overhead
expenses. In particular, we had to use our judgement to allocate
vehicles and transportation costs to research and implementation
activities, since we did not have detailed information on how
vehicles and transport supported project activities. We may, there-
fore, have underestimated implementation costs. Alternatively, we
may have overestimated costs as vehicle and transport costs some-
times served both purposes.
Third, international NGOs incurred indirect costs related to
fringe benefits and housing allowances for expatriate staff beyond
the scope of the Mama SASHA project, so we estimated and
included only the portion of those indirect costs that were directly
related to the Mama SASHA project implementation. Further, we
did not include labour and travel costs of international technical col-
laborators that contributed to the design of the proof-of-project con-
cept and to annual work planning meetings, as the majority of these
costs were for research design and management not directly related
to intervention service delivery. Our results from the sensitivity ana-
lysis indicated that our cost estimates are fairly robust to changes in
transportation, salaries of personnel and indirect expenses.
Fourth, we did not include the costs of implementing and evalu-
ating the 2010 pilot programme, though it was instrumental in refin-
ing the programme, helping implementation to run more smoothly,
and achieving higher uptake. Including the pilot would increase the
overall project costs, though it would also increase the total number
of beneficiaries reached by 2453 pregnant and lactating women.
Finally, our cost per beneficiary does not capture the total number
of infants and family members who consumed OFSP as an indirect
result of Mama SASHA. Doing so would yield lower unit costs.
Affordability and scalabilityWe estimated the Mama SASHA project to cost in the range of
US$110 to $155 per direct beneficiary. Whether or not Mama
SASHA is considered affordable will depend upon: the priorities of
ministries of health and agriculture and international donors; sector-
al organizations willingness to fund activities which cross sectors;
the level of effort required to sustain or increase uptake over time;
and the effects of moving to scale. At scale, we might observe econo-
mies of scope, as integrating activities allowed healthcare workers to
more effectively reach their target population, leading to secondary
cost savings (PATH, 2013) as well as opportunities to reduce imple-
mentation costs. Based on the Mama SASHA experience, nearby
counties took the Mama SASHA concept to greater scale (Muoki
and Agili, 2015). From 2014 to 2018, a modified model (SUSTAIN)
was implemented in 33 health facilities across five counties adjacent
to those targeted in Mama SASHA. Modifications to lower costs
included: (1) targeting all pregnant women, and all mothers bringing
children to the PNC clinic for monitoring or treatment; (2) just one
voucher, instead of two (for the two varieties issued); (3) use of pub-
lic sector agriculture services in lieu of agricultural NGOs; and (4),
after 1 year of monthly feedback meetings, reduction to quarterly
meetings. Although no formal impact assessment was conducted,
the modified programme reached 35 362 women attending either
ANC or PNC clinics. With an annual budget of US$480 000, or
Table 5. Sensitivity analysis: total incremental financial costs and unit costs
Women only Including infants
Total cost (US$) Cost per beneficiary (US$) Cost per contact (US$) Cost per beneficiary (US$) Cost per contact (US$)
Low estimate 410 155 125 24 89 22
Medium estimate 507 809 155 30 110 28
High estimate 530 596 162 31 115 29
Health Policy and Planning, 2019, Vol. 34, No. 9 653
approximately $2 000 000 for the intervention period, a simple cal-
culation estimates a cost of $57 per direct beneficiary reached with
vines and nutrition counselling.
Future work might consider innovative ways to harness market
forces and the private sector. In Western Kenya, there was a strong de-
mand for OFSP vines by NGOs and community-based projects to im-
prove agriculture, health and nutrition (P Muoki, personal
communication, 9 January 2018). As a result of Mama SASHA, a dozen
VMs established sustainable businesses to produce and sell surplus vines
to other local NGOs. Previous studies have demonstrated the import-
ance of early OFSP adopters and vine producers that can effectively
lower the costs of extension services to neighbouring communities and
encourage more rapid diffusion (De Brauw et al., 2018).
Conclusion
This study estimated the incremental costs of implementing an inte-
grated nutrition and agricultural intervention in rural Kenya. Results
suggest that the financial cost per beneficiary and the share of those
costs needed for integrating activities across sectors can be substantial.
Budgeting explicitly for joint training, regular monthly, quarterly and
annual meetings will help future projects ensure that each sector has
sufficient resources. Planning and implementing less intensive multi-
sectoral interventions may be possible, and economies of scale may
help to reduce overall costs. Empirical estimates of costs and their
breakdown across sectors are critical to inform the design, planning
and implementation of multi-sectoral programmes. Knowing costs by
components enables thoughtful examination of where cost savings
can be made with the goal of achieving the same level of impact.
Ethical approval
All research protocols were approved by the institutional review
boards at PATH and the Kenya Medical Research Institute.
Supplementary data
Supplementary data are available at Health Policy and Planning online
Acknowledgements
We are grateful to the guidance from our agricultural colleagues at the
Appropriate Rural Development Agriculture Programme (ARDAP) and the
Community Research in Environment and Development Initiatives
(CREADIS) in accessing, reviewing and interpreting the expense report data
for the project period. We also thank Victor Akelo for clinical-based observa-
tions and Haile Selassie Okuku for providing information on project outputs
from the analysis of the monitoring data. We also acknowledge Kristy Cook
and Christopher Kemp, who provided useful input into revised versions of the
original paper. This research was funded by the International Potato Center,
under the Sweetpotato Action for Security and Health in Africa grant pro-
vided by the Bill & Melinda Gates Foundation. Funding was provided by the
Bill & Melinda Gates Foundation [Grant ID OPP53344] and PATH.
Conflict of interest statement. None declared.
References
Atun R, de Jongh T, Secci F, Ohiri K, Adeyi O. 2010. A systematic review of
the evidence on integration of targeted health interventions into health sys-
tems. Health Policy and Planning 25: 1–14.
Baker S, Talukdar A. 1996. A large-scale model for delivering homestead horti-
cultural technologies in Bangladesh. Micronutrients and Agriculture 2: 22–4.
Bhutta ZA, Das JK, Rizvi A et al. 2013. Evidence-based interventions for im-
provement of maternal and child nutrition: what can be done and at what
cost? The Lancet 382: 452–77.
Black MM, Perez-Escamilla R, Fernandez Rao S. 2015. Integrating nutrition
and child development interventions: scientific basis, evidence of impact,
and implementation considerations Advances in Nutrition 6: 852–9.
Central Bank of Kenya. 2013. https://www.centralbank.go.ke, accessed 30
September 2013.
Cole DC, Levin C, Loechl C et al. 2016. Planning an integrated agriculture
and health program and designing its evaluation: experience from Western
Kenya. Evaluation and Program Planning 56: 11–22.
Creese A, Parker D. 1994. Cost Analysis in Primary Health Care. A Training
Manual for Programme Managers. Albany, NY: WHO Publications Center.
De Brauw A, Eozenou P, Gilligan DO et al. 2018. Biofortification, crop adop-
tion and health information: impact pathways in Mozambique and Uganda.
American Journal of Agricultural Economics 100: 906–30.
Fiedler J, Sanghvi T, Saunders M. 2007. The Costs of Micronutrient
Interventions: Policy Issues and Interventions. Technical Brief A2Z
Program. Washington, DC: USAID.
Fiedler JL, Villalobos CA, De Mattos AC. 2008. An activity-based cost ana-
lysis of the Honduras Community-Based, Integrated Child Care (AIN-C)
programme. Health Policy and Planning 23: 408–27.
Girard AW, Deneen M, Cole D et al. 2017a. An Integrated Agriculture,
Nutrition and Health Project Promoting Orange Flesh Sweet Potato
Improved Infant Vitamin a Consumption but Not Vitamin a Status in
Western Kenya. Cancun: Micronutrient Forum.
Girard AW, Grant F, Watkinson M et al. 2017b. Promotion of orange-fleshed
sweet potato increased vitamin A intakes and reduced the odds of low
retinol-binding protein among postpartum Kenyan women. The Journal of
Nutrition 147: 955–63.
Girard AW, Self JL, McAuliffe C, Olude O. 2012. The effects of household
food production strategies on the health and nutrition outcomes of women
and young children: a systematic review. Paediatric and Perinatal
Epidemiology 26: 205–22.
Hawkes C, Ruel M. 2006. Understanding the Links between Agriculture and
Health. 2020 Focus 13. Washington, DC: International Food Policy
Research Institute.
Hawkes C, Turner R, Waage J. 2012. Current and Planned Research on
Agriculture for Improved Nutrition: A Mapping and a Gap Analysis.
London: Department for International Development.
Horton S, Shekar M, McDonald C, Mahal A, Brooks JK. 2010. Scaling up
Nutrition: What Will It Cost? Washington, DC: World Bank.
Levin C, Grant F, de Brauw A et al. 2016. Integrating Agriculture, Nutrition,
and Health Using Biofortified Orange-Fleshed Sweetpotato: The Mama
SASHA Experience, Cross-Sectional Endline Findings, and Major
Outcomes. Report Submitted to the Bill & Melinda Gates Foundation.
Nairobi, Kenya: International Potato Center, 100 pages.
Machira YW. 2013. Mama SASHA Kenya Agriculture-Health
Proof-of-Concept Project: Operations Research Technical Report. Nairobi,
Kenya: International Potato Center.
Masset E, Haddad L, Cornelius A, Isaza-Castro J. 2012. Effectiveness of agri-
cultural interventions that aim to improve nutritional status of children: sys-
tematic review. British Medical Journal 344: d8222.
Muoki P, Agili S. 2015. Scaling up Sweetpotato through Agriculture and Nutrition
in Kenya. Nairobi, Kenya: International Potato Center (CIP), 2 pages.
Obure CD, Guinness L, Sweeney S, Vassall A, Initiative I. 2016. Does integra-
tion of HIV and SRH services achieve economies of scale and scope in prac-
tice? A cost function analysis of the Integra Initiative. Sexually Transmitted
Infections 92: 130–4.
PATH. 2011. SASHA Kenya Agriculture Health Proof of Concept Project
Operations Research for the Pilot Implementation. Technical Report.
Nairobi. Unpublished report.
PATH. 2013. SASHA Kenya Agriculture Health Proof of Concept Project
Operations Research for the Second Wave. Technical Report. Nairobi.
Unpublished report.
Puett C, Sadler K, Alderman H et al. 2013. Cost-effectiveness of the
community-based management of severe acute malnutrition by community
health workers in southern Bangladesh. Health Policy and Planning 28: 386–99.
654 Health Policy and Planning, 2019, Vol. 34, No. 9

Puett C, Salpeteur C, Lacroix E, Zimunya SD, Israel A-D, Aıt-Aıssa M. 2014.
Cost-effectiveness of community vegetable gardens for people living with
HIV in Zimbabwe. Cost Effectiveness and Resource Allocation 12: 11.
Ruel MT. 2001. Can Food-Based Strategies Help Reduce Vitamin A and Iron
Deficiencies (No. 594-2016-39955).
Ruel MT, Alderman H. 2013. Nutrition-sensitive interventions and pro-
grammes: how can they help to accelerate progress in improving maternal
and child nutrition? The Lancet 382: 536–51.
Ruel MT, Quisumbing AR, Balagamwala M. 2018. Nutrition-sensitive agri-
culture: what have we learned so far? Global Food Security 17: 128–53.
Siapka M, Remme M, Obure CD et al. 2014. Is there scope for cost savings
and efficiency gains in HIV services? A systematic review of the evidence
from low-and middle-income countries. Bulletin of the World Health
Organization 92: 499–511AD.
Sweeney S, Obure CD, Maier CB et al. 2012. Costs and efficiency of integrat-
ing HIV/AIDS services with other health services: a systematic review of evi-
dence and experience. Sexually Transmitted Infections 88: 85–99.
Walker D. 2001. Cost and cost-effectiveness guidelines: which ones to use?
Health Policy and Planning 16: 113–21.
Wilford R, Golden K, Walker DG. 2012. Cost-effectiveness of
community-based management of acute malnutrition in Malawi. Health
Policy and Planning 27: 127–37.
World Bank. 2008. From Agriculture to Nutrition: Pathways, Synergies
and Outcomes. Washington, DC: Agricultural and Rural Development Notes.
Health Policy and Planning, 2019, Vol. 34, No. 9 655