what is mds? how do we determine prognosis? do we determine prognosis? bart scott, m.d. ... cbc with...
TRANSCRIPT

What is MDS?
How Do We Determine
Prognosis?
Bart Scott, M.D.
Associate Member, FHCRC
Associate Professor, UWMC


Bone Marrow Failure
Syndromes
AML
PNH
MDSAA
MPN
Young NS. Ann Intern Med. 2002 Apr 2;136(7):534-46

MDS: Epidemiology
• 9,700 new cases/year in US (Adults)
• More common than AML
• Median survival 2-3 years
• Disease burden likely underestimated
• Predominantly a disease of the elderly
– Median age > 70
– Incidence males > females
– Incidence ↑ with age
Rollison et al. Blood. 2008;112:45-52
Greenberg et al. Blood 1997; 89:2085-

Age-Related Incidence of MDS
0 0 2 1 2 2 4
9
16
26
52
59 61
34
10
10
10
20
30
40
50
60
70
20- 25- 30- 35- 40- 45- 50- 55- 60- 65- 70- 75- 80- 85- 90- 95-
Age in 5-year blocks
Age-specific incidence
rates (per 100,000)
Less than 50 0.5
50-59 5.3
60-69 15
70-79 49
80 and over 89
Williamson PJ, et al. Br J Haematol. 1994 Aug;87(4):743-5.

MDS PathogenesisStage 1Intrinsic increase in
apoptotic response and
inflammation
Stage 2Acquisition of
anti-apoptotic molecules
Stage 3Initiation of
clonal evolution
↑ TNFα-induced
apoptosis↑ ROS ↑ Bcl-2
MPMP
MP
MP
aMP
MPMP
MP
MPMPMP
aMP
aMP
aMPMP
MP
MPMP
Induction of homeostatic
mechanismsExpansion
Telomere
erosion and
senescence
Impaired
immunosurveillance
by NK and T cells
Stem cell depletion Emergence of abnormal
clones with point
mutations in NRas
and AML1
Abnormalities in DNA repair
mechanisms with propagation
of abnormal cellsBone marrowAbnormal
ribosomes
Altered T-cell
homeostasis
Inflammatory
microenvironment
Altered MP
localizationStromal cell
defects
Molecular model of MDS progressionSuppressed
hematopoiesis
High risk
for leukemia
transformationEpling-Burnette PK, et al. Curr Opin Hematol. 2009;16:70-76.

Tefferi A & Vardiman JW
Mechanisms of disease:
Myelodysplastic syndromes
NEJM 2009; 361:1872-85

Abnormal
Normal
Cancer Genomics
Tumor
cell
chromosome
gene
Mutation discovery Patient care
•Cytogenetics
•Candidate gene sequencing
•Whole Genome Sequencing
(unbiased comprehensive platform)
• diagnosis
• risk stratification
• therapy
/Clonality

MDS Diagnostic CriteriaWHO Criteria: MDS
Minimal Morphologic Criteria
•≥10% of the cells in at least one
lineage must show dysplasia
•Dysplasia not required if defining
cytogenetic abnml present, BM blasts ≥
5%, PB blasts ≥ 2%, or Auer rods
•At least one cytopenia* present
•Causes of secondary dysplasia^ must
be excluded
Presumptive Diagnosis
Arber et al. Blood. 2016;127:2391-2405
^Hypothyroidism, Vit B 12 deficiency, Cu level, ETOH use
Unbalanced
-7 or del(7q)
-5 or del(5q)
i(17q) or t(17p)
-13 or del(13q)
del(11q)
del(12p) or t(12p)
del(9q)
idic(X)(q13)
Balanced
t(11;16)(q23;p13.3)
t(3;21)(q26.2;q22.1)
t(1;3)(p36.3;q21.1)
t(2;11)(p21;q23)
inv(3)(q21q26.2)
t(6;9)(p23;q34)
Other
Complex karyotype (≥ 3 abnormalities)
Vardiman et al. Blood. 2009;114:937-951

WHO 2016 Classification of MDS
Arber et al. Blood. 2016;127:2391-2405

IPSS and Comprehensive
Cytogenetic Scoring SystemClassification /
Prognostic Group
Abnormalities
Single Double Complex
IPSS
Good Normal; -Y;
del(5q); del(20q)
— —
Intermediate Other Any —
Poor 7* — ≥ 3†
5-Group
Very good -Y; del(11q) — —
Good Normal; del(5q);
del(20q); del(12p)
Incl. del(5q) —
Intermediate del(7q); +8; i(17q);
+19; any other
Any other —
Poor -7;
Inv(3)/t(3q)/del(3q)
Incl. -7/ del(7q) 3†
Very poor — — >3†
Greenberg P, et al. Blood. 1997;89:2079-2088
Schanz J. et al. J Clin Oncol. 2012;30:820-829
* Any chromosome 7 abnml
Ṫ number of clonal abnml

Revised IPSS (IPSS-R)
points 0 0.5 1 1.5 2 3 4
blasts ( %)<2% - 2-4% - 5-10% >10%
Hemoglobin >10 g/dl 8-10 g/dl <8 g/dl
ANC >0.8 G/l <0.8 G/l
Platelet >100 50-100 <50
CytogeneticsVery Good-Ydel(11q)
GoodNormalder(1;7)del(5q)del(20q)del(12p)Double incl del(5q)
Intermed-7/7q+8Iso(17q)+19+21other double inclusions
Poor:der3q(21)der3q(26)Complex Double inclusion 7q/7
Very PoorComplex >3
2 categories
5 categories
16 subgroups
3 categories
4 categories
3 categories
Greenberg PL, et al. Blood. 2012;120:2454-2465

IPSS-R
n-=1313
n=2646
N=1433
N=898
N=722
8.85.331.60.8
Greenberg PL, et al. Blood. 2012;120:2454-2465

Ogawa 2012. Int. J. Hematol. 96: 438-442.
Spliceosome mutations in 85% of MDS
Haferlach T et al. Leukemia 2014;28:241-247

Clonal evolution model
STAG2
PTPN11, RUNX1
Time
Clo
nal
he
mat
op
oie
sis
(%)
MDS 2°AML840 mutations
Founding clone subclone
Walter et al, NEJM 2012

Bejar R et al. N Engl J Med 2011;364:2496-2506.
Survival by Mutational Abnormalities
in MDS
EZH2
TP53
RUNX1
ASXL1
ETV6
CBL
NRAS
IDH2TET2
IDH1
KRAS
NPM1
JAK2
439 MDS Patients
Bejar R et al. J Clin Oncol 2012;30:3376-3382

The mutation/deletion status of multiple genes independently correlated with OS and combined with conventional prognostic factors was successfully used to construct a statistically relevant prognostic model.
Development of a novel prognostic risk classification
Clinical and genetic parameters(Model-1)
(Training cohort, N=611)
Only genetic parameters(Model-2)
Conventional model (IPSS-R)
AIC(Akaike's Information
Criterion)
327.2
337.5
334.8
Haferlach T et al. Leukemia 2014;28:241-247
(Validation cohort , N=175)
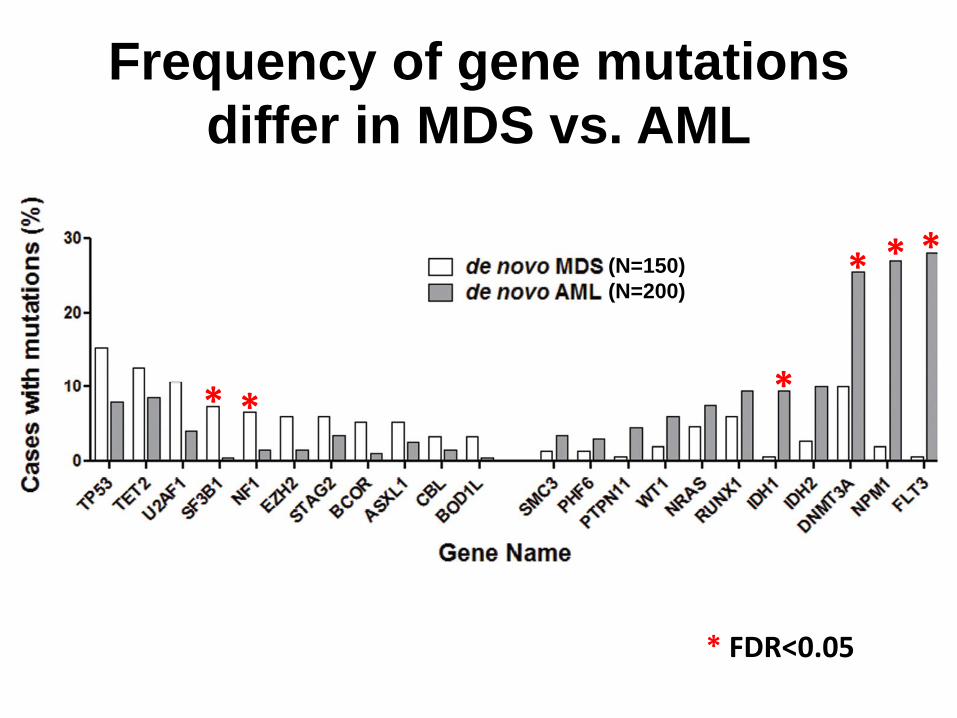
Frequency of gene mutations
differ in MDS vs. AML
* *
* *
*
*(N=150)
(N=200)
* FDR<0.05

Clinical Presentation
• Asymptomatic
• Symptoms related to low blood counts– Anemia (fatigue, SOB, DOE, angina, CHF)
– Infection (principal cause of death)
– Bleeding (petechiae, ecchymosis, epistaxis, hemorrhage)

Diagnostic Evaluation:
Peripheral BloodDiagnostic Study Clinical Significance
CBC with Differential & Platelet
Count,
Reticulocyte Count
Evaluate for cytopenias,
peripheral blasts
Serum Fe, TIBC, Ferritin, Folic
Acid, B12
Evaluate for other possible
causes of anemia
LDH, Haptoglobin,
Reticulocyte Count, Coombs
Evaluate for possible
underlying hemolysis
Serum Erythropoietin Baseline to determine role for
growth factor
NCCN Clinical Practice Guidelines in Oncology.TM Myelodysplastic Syndromes.V. 5, 2007.

Diagnostic Evaluation:
Bone MarrowDiagnostic Study Clinical Significance
Aspirate Evaluate for morphologic
abnormalities. Used for
flow, cytogenetics, FISH
Biopsy Evaluate cellularity & presence
of fibrosis
Cytogenetics Evaluate for non-random
chromosomal abnormalities.
Examine 20 metaphases. > 2 =
non-random event
NCCN Clinical Practice Guidelines in Oncology.TM Myelodysplastic Syndromes.V. 5, 2007.

• Myelodysplastic Syndromes (MDS)
– Usually hypercellular, although can be hypocellular
– Dysplasia involving at least 10% of any single cell line
– Characteristic cytogenetic findings
– Excess Blasts (>5%)
– Ringed sideroblasts (RARS)
– CD 34 + cells >0.5%
Bone Marrow Findings

Copyright ©2004 American Society of Hematology. Copyright restrictions may apply.
Maslak, P. ASH Image Bank 2004;2004:101115
Figure 2. Hypocellular MDS may be confused with Aplastic Anemia

Copyright ©2008 American Society of Hematology. Copyright restrictions may apply.
Lazarchick, J. ASH Image Bank 2008;2008:8-00114
Figure 1. A Prussian Blue histochemical stain of a bone marrow aspirate of a patient with myelodysplastic disorder, refractory anemia with ringed sideroblasts, is shown

Fukumoto, J. et al. ASH Image Bank 2006;2006:6-00022
Figure 3. Ringed sideroblast, myelodysplastic syndromes (MDS), shown with a Prussian blue stain at low power

Maslak, P. ASH Image Bank 2004;2004:100973
Figure 1. Dysplastic megakaryocytes

Maslak, P. ASH Image Bank 2004;2004:101102
Figure 1. Dysplastic erythroid precursor has open chromatin and basophilic cytoplasm

Vardiman, J. W ASH Image Bank 2001;2001:100197
Figure 8. This figure summarizes the characteristic findings associated with MDS with an isolated del(5q) syndrome

Pseudo Pelger-Huet cell
Ringed Sideroblasts
Hypolobated Micromega
Megaloblastoid Anemia

Conclusions
• Myelodysplastic syndromes are difficult to
diagnose
• Clinical and diagnostic studies are imprecise
• Many of bone marrow failure entities overlap
• Cytogenetic and molecular testing is
increasingly important