what is edgesight?
TRANSCRIPT
Document generated by Confluence on Nov 07, 2013 16:21 Page 1
Space DetailsKey: edgesight
Name: EdgeSight
Description:
Creator (Creation Date): gregan (Jun 26, 2009)
Last Modifier (Mod. Date): gregan (Jun 26, 2009)
Available Pages• Citrix EdgeSight Reporting Wiki (Beta)
• Contents• Getting Started with EdgeSight
• Where to Start Using EdgeSight?• Introduction to EdgeSight for XenApp Video
• Migrating from Resource Manager to EdgeSight
• Monitoring• Introduction to EdgeSight Monitoring
• Performance Monitoring• Experienced with Performance Monitoring?
• New to Performance Monitoring?
• Monitoring Farms• XenApp Farm Resiliency
• Alerting on Critical Health Changes
• Determining When a Data Collection Election Occurs
• Farm Resiliency Using the Farm Monitor and Reports
• Using EdgeSight to Monitor XenApp Infrastructure Servers
• Understanding EdgeSight Alerts• System Alerts
• Application Alerts
• Network Alerts
• Session Alerts
• XenApp Alerts• Using EdgeSight Active Application Monitoring
• XenDesktop Alerts
• Dashboard Monitoring
• Troubleshooting• Troubleshooting Using EdgeSight
• Troubleshooting XenApp Application Servers
• Troubleshooting XenApp Application Issues• Application Performance Factors
• Monitoring Applications Proactively
• Application Issue Troubleshooting
• Real Time Troubleshooting of Application Issues
• Troubleshooting Devices
• Troubleshooting XenApp Infrastructure Servers
Document generated by Confluence on Nov 07, 2013 16:21 Page 2
• Plan and Manage• What is Happening in My Environment?
• Finding Information about the Clients in Your Environment
• Detecting General Changes
• Using the Dashboard and Reports for an Environmental Overview
• What's Happening on My Network?
• What's Happening On My Servers?• Updating Hardware and Software Inventories
• What Are Users Up To?
• XenApp Server Health• Fixing Existing XenApp Server Issues
• Keeping Servers Healthy
• Troubleshooting Changes to XenApp Servers
• Uncovering Causes for Poor Server Performance
• Generating EdgeSight Reports for Management• Branch Office Performance
• Demonstrating SLA Compliance
• Track Usage• Monitoring License Usage
• Exporting User and Device License Usage Data
• Monitoring Published Applications Usage
• Monitoring Session Duration
• Reports (Browse)• Introduction to Reporting
• Guide to Interpreting Reports• EdgeSight Reporting Best Practices
• Aggregating and Grouping Averages and Sums in EdgeSightReports
• How Group and Department Structure Impact Reporting
• EdgeSight Report List• EdgeSight 5.4 Report List
• EdgeSight 5.3 Report List• Report Sample, ICA Client Version
• Report Sample, User Logon Counts
• EdgeSight 5.2 Report List• Environmental Usage
• ICA Printer IO
• ICA Session Compression
• ICA Session Latency
• ICA Session Round Trip Time
• Process Faults
• Process Network Delay
• Report Sample, CPU Utilization Management
• Report Sample, IMA Service Availability

Document generated by Confluence on Nov 07, 2013 16:21 Page 3
• Session Login Time
• Session Login Time for a User Group
• Session Startup Duration Details
• System CPU
• System Memory Usage
• User Login Details for a User Group
• User Summary for a User Group
• XenApp Server Utilization
• XenApp Summary
• XenApp User Summary
• EdgeSight 5.0 and 5.1 Report List• Presentation Server Summary
• Presentation Server User Summary
• Sessions Created for a User Group
• EdgeSight Report List by Task
• EdgeSight Data• End User Experience Monitoring Overview
• Understanding EdgeSight Data
• How EdgeSight Calculates ICA Traffic Numbers
• End User Experience Monitoring Data• Improving Slow Session Start Times
• Session Latency
• ICA Channel Data
• Network• Why EdgeSight Network Data Differs from Network Monitoring
Tools• Network Data
• What Constitutes a Session for EdgeSight?
• Adding a Custom Performance Monitoring Counter
• Support for Citrix Performance Monitoring Counters
• Report Counters Glossary
• Configuring EdgeSight for Your Environment• Configuring Alerts
• Data Maintenance
• Custom Reports• Citrix Service Provider - License Usage Reports
• Citrix Service Provider - Resource Usage per User Reports
• Citrix Service Provider - Server Utilization Report
• Citrix Service Provider - SLA Compliance Reports
• License Server Usage Trends - Custom Report
• Unique User Logon Counts - Custom Report
• EdgeSight for Load Testing
• Case Studies
Document generated by Confluence on Nov 07, 2013 16:21 Page 4
• Case Study, Managing Application Rollout
• Case Study, Application Performance Solution
• Case Study, Troubleshooting Remote Applications
• EdgeSight Support• Release History
• Citrix EdgeSight 5.2 and Citrix EdgeSight for Load Testing 3.6
• Citrix EdgeSight 5.3 and EdgeSight for Load Testing 3.6.1
• Citrix EdgeSight 5.4
• Top EdgeSight Knowledge Center Articles
• Using the EdgeSight Wiki• About the Citrix EdgeSight Wiki
• EdgeSight Wiki Community• EdgeSight TV
• EdgeSight Wiki Spotlight• Christian Tobon
• Who Are We? EdgeSight Wiki Editors and Contributors
• Getting Involved in the EdgeSight Wiki• Creating an EdgeSight Wiki Article
• EdgeSight Wiki Style• EdgeSight Wiki Editorial Policies
• Formatting Sources and Citations for the EdgeSight Wiki
• EdgeSight Wiki Syntax• Wiki Macros
• Ways You Can Help
• List of Stub Articles
• FAQ
• EdgeSight Wiki Site Map
• Home

Document generated by Confluence on Nov 07, 2013 16:21 Page 5
Citrix EdgeSight Reporting Wiki (Beta)
This page last changed on Oct 27, 2009 by sarahv.
Welcome to the Citrix EdgeSight Reporting Wiki. The Citrix EdgeSight Reporting Wiki is a collaborativeauthoring encyclopedia project supported by Citrix EdgeSight Engineering. This is intended to be acollaborative Web site for the EdgeSight community. This Wiki is part of an initiative to enhance theinformation available about EdgeSight reports and is the primary source of information about reports.
This Wiki focuses primarily on historical reports. However, it also includes information about real-timereports and other helpful EdgeSight product information.
The EdgeSight Engineering and Documentation teams, as well as EdgeSight escalation engineers,technical support personnel and product managers regularly review the Wiki content, vetting it fortechnical accuracy.
We are hoping that this Wiki helps you find the reports you need, interpret the reports you choose, andfind new ways to use reports. We also hope it provides an opportunity to converse with EdgeSight userswith similar interests on the discussion tabs of each article.
Getting Started
The Wiki is organized by the following types of information:
• Where to Start Using EdgeSight?• Contents• EdgeSight Wiki Site Map• Getting Involved in the EdgeSight Wiki• EdgeSight Reporting Tasks for XenApp• Migrating from Resource Manager to EdgeSight• EdgeSight Report List• EdgeSight Data• Scenarios and Case Studies• EdgeSight Reporting Best Practices• Report Counters Glossary• FAQ• Release History
You can access information either by searching for the name of specific reports or browsing to them asthey are listed on the Browse Reports page.
Comments
You guys must keep this site going. I see it's in Beta it needs to go production although I cant imaginewhy not more people are posting here. It's taken me a long time to scour the "internet" to compile somesemblance of pertinant information I can use to educate myself about Edgesight. Keep up the great workplease dont let this site fall by the wayside.
Posted by chriscdw2 at Jun 02, 2011......................................................................................................................................................................
I agree. I was just scouring the internet myself for some helpful information, so I'll review theinformation submitted so far and hope that this site can lead to a good online community for futurediscussions. I've been evaluating version 5.3 for a bit and would like more on User and Session

Document generated by Confluence on Nov 07, 2013 16:21 Page 6
information. Planning a new build for version 5.4 that was just released, and I want to evaluate thedifferences between the Basic and Advanced modes of operation.
Posted by at Aug 26, 2011......................................................................................................................................................................
Hi guys.
I´m happy to found this Wiki. That´s nice idea.
Let´s go to Keep update this site with more information. Thanks for spending time to help us. I´m wassearching something about how to implement Citrix EdgeSight and how to explain their reports and,because that, i found this site.
Great job.
Omar Fernandes
Posted by ofernandes.cavalcant at Feb 07, 2012......................................................................................................................................................................
Document generated by Confluence on Nov 07, 2013 16:21 Page 7
Contents
This page last changed on Nov 10, 2009 by sarahv.
This is the overall content for the EdgeSight Wiki site.
• Getting Started with EdgeSight• Monitoring• Troubleshooting• Plan and Manage• Track Usage• Reports (Browse)• Configuring EdgeSight for Your Environment• Custom Reports• EdgeSight for Load Testing• Case Studies• EdgeSight Support• Using the EdgeSight Wiki• FAQ• EdgeSight Wiki Site Map

Document generated by Confluence on Nov 07, 2013 16:21 Page 8
Getting Started with EdgeSight
This page last changed on Nov 10, 2009 by sarahv.
• Where to Start Using EdgeSight?• Migrating from Resource Manager to EdgeSight
Document generated by Confluence on Nov 07, 2013 16:21 Page 9
Where to Start Using EdgeSight?
This page last changed on Sep 15, 2011 by ronaldb1.
EdgeSight contains many powerful features and reports. Due to this rich feature set, new EdgeSight usersare often unsure where to start.
This article provides an overview of several key features and suggestions as to where to start usingEdgeSight.
Table of Contents
• 1 Introductory Video• 2 What is EdgeSight?• 3 What can I do with EdgeSight?• 4 What are the different tasks that I can do with EdgeSight?• 5 Where should I start?• 6 What about Monitoring and Troubleshooting?• 7 EdgeSight Functional Areas• ° 7.1 Monitor
° 7.2 Troubleshoot° 7.3 Plan and Manage° 7.4 Track Usage° 7.5 Browse° 7.6 Configure
• 8 Where do I find EdgeSight information?
Introductory Video
Introduction to EdgeSight for XenApp Video
What is EdgeSight?
EdgeSight is a performance and availability management solution for XenApp, Presentation Server,XenDesktop and endpoint systems. It monitors applications, sessions, devices, and the network in realtime, allowing you to quickly analyze, resolve, and proactively prevent problems. EdgeSight also monitorsCitrix License Servers and displays license usage information.
What can I do with EdgeSight?
A lot. You can monitor the health of your XenApp Farm, get notified when an application crashes,and discover when there is a network problem before all your users call the Help Desk. You can seewhich applications are used most frequently and which users are using the applications. You can viewthe license usage of any Citrix product that uses the license server and determine if you may need topurchase more licenses. You can see which applications take up the most system resources and seewhich application have had the most problems over the last few months. You can even figure out why ittakes a long time for a user launch a Published Application.
For those who are technically savvy the detailed real-time performance counters on XenApp servers,virtual device or endpoint will allow you to troubleshoot problems that are currently happening to a user.
What are the different tasks that I can do withEdgeSight?
The EdgeSight console is separated into six major functional areas; Monitor, Troubleshoot, Plan andManage, Track Usage, Browse, and Configure.
Document generated by Confluence on Nov 07, 2013 16:21 Page 10
Monitor - Allows you to see performance and availability problems in your environment in real-time. Ifyou are looking around to see if anyone is having problems start here.
Troubleshoot - Investigate performance and stability problems on a single device in real time. Youwould suspect that there is a problem with a device, application or user before using the troubleshooters.
Plan and Manage - This is all about performance and stability trends in your environment. Look herefor the worst performing servers, applications and sites that your users are accessing.
Track Usage - If you want to know how what the most frequently used Published Applications are orhow many Citrix licenses you have and how many are being consumed use these reports.
Browse - Browse throught the list of historical reports.
Configure - These are the EdgeSight settings pages.
Where should I start?
Start with the summary reports on the Plan and Manage page. If you are new to EdgeSight then you areprobably looking for general information on your environment. These reports will show you summarydata for your Farms, devices, and applications. If you see something of interest (e.g. large numbers oferrors, or long login time) click on the report and you will be see more detail.
The reason for starting with the Plan and Manage page is that the summary reports display high levelinformation about a lot of different things. If you don't know what you are looking for these reports willhighlight the areas of interest. When you see a problem then you can drill into detail.
The Track Usage page is also a good place to start if you want to know who is using what. If you want tosee License information you first have to tell EdgeSight which license servers to poll, this is done on theConfigure tab.
What about Monitoring and Troubleshooting?
Do you know what you want to monitor or which device you want to troubleshoot? If not then don'tcome here until you have a reason to do so, such as when a user calls the help desk to report a problem.
The charts allow you to monitor the health of a Farm or troubleshoot a device that is currently havingproblems. These pages contained very detailed information so it's helpful to be familiar with performancecounters, Windows Event Logs, and error messages in order to interpret this information.
As you become more familiar with EdgeSight and configure the alerts to trip when critical events occuryou will find the Alert Console and Farm Monitor extremely helpful in finding problems before your usersdo.
EdgeSight Functional Areas
Monitor
EdgeSight allows you to track the performance, availability, and stability of critical devices andapplications and quickly identify problems.
See the Monitoring pages for more info.
Troubleshoot
EdgeSight lets you access both real-time and historical data. When troubleshooting problems in yourenvironment, you will probably want to use mainly the real-time features, such as those found in theTroubleshoot tab. Directions for how to use these features are in the EdgeSight User's Guide and theonline help.

Document generated by Confluence on Nov 07, 2013 16:21 Page 11
Before attempting troubleshooting with EdgeSight, it is helpful to understand the source of problems andalso how to resolve those problems in the environment you are monitoring. That is, if you are trying toresolve why a user is having slow XenApp sessions, it helps to understand the major causes of sessionlatency on a farm. EdgeSight is only a monitoring product and consequently only displays metrics. Sincethe meaning of metrics vary by context, it is up to you to determine how to interpret the data and whatmetrics you need to evaluate. Fortunately, this Wiki is meant to aid with that task.
For more information in using EdgeSight for troubleshooting look at the following article:
Troubleshooting Using EdgeSight
Plan and Manage
EdgeSight generates many reports about the user experience and about performance in general, whichare further explained in Generating EdgeSight Reports for Management. If you want to use EdgeSightdata for status reports at weekly status meetings, familiarize yourself with how to run reports by readingthe relevant section in the EdgeSight User's Guide.
You may also want to review the articles "Demonstrating Service Level Agreement (SLA) Compliance" and"What is Happening in My Environment?" for additional tips about ways to evaluate environmental status.
Track Usage
New to version 5.3, EdgeSight has the ability to display license utilization for all Citrix products that usethe Citrix License Server. Published Application usage and session duration reports allow business users tosee the usage of applications and servers in an organization.
See the Track Usage pages for more info.
Browse
This page lists all the historical reports within EdgeSight. Use the left pane to filter the list to just thereport you are interested in.
See the Reports (Browse) page for more information
Configure
Here you can create an alert, add a new EdgeSight logon, or change the number of days the data is keptbefore it is deleted.
See the Configuring EdgeSight for Your Environment page for more information,
Where do I find EdgeSight information?
• Product documentation. As of EdgeSight 5.3, all new features and known issues, systemrequirements, installation, and management information for EdgeSight is located in Citrix eDocs.
• User manuals. The EdgeSight User's Guide is a scenario-based guide for EdgeSight Server Consoleusers and is available from the Citrix Knowledge Center. * Online help. EdgeSight and EdgeSightfor Load Testing each contain their own online help systems. In contrast with the manuals, theonline help tends to provide procedures and detailed information about navigating the userinterfaces.
• Forums. Both Citrix and BrianMadden.com have forums devoted to either EdgeSight orperformance monitoring in general.
• The EdgeSight Wiki. The EdgeSight Wiki is the primary vehicle for information about EdgeSightreports. Also, the Wiki provides extensive task-oriented scenarios integrating proven techniquesfrom XenApp. The Wiki is designed to help Citrix administrators figure out how to resolve XenAppand (in the future) XenDesktop tasks using EdgeSight.
Document generated by Confluence on Nov 07, 2013 16:21 Page 12
Introduction to EdgeSight for XenApp Video
This page last changed on Apr 09, 2010 by normanw1.
Introduction to EdgeSight for XenApp
Comments
Nice knowledge piece for beginners
Cheers
Raj
Posted by at Feb 25, 2011......................................................................................................................................................................
Thank so much for this video. It really helped me understandig the basics ofEdgeSight. I enjoyed it more than reading a paper about new stuff. I'm lookingforward to more of the videos announced.
Posted by at Sep 07, 2011......................................................................................................................................................................
Awesome presentation!
Thank you.
Prince
Posted by at Nov 23, 2011......................................................................................................................................................................

Document generated by Confluence on Nov 07, 2013 16:21 Page 13
Migrating from Resource Manager to EdgeSight
This page last changed on Apr 28, 2010 by ronaldb.
As of Citrix XenApp 5.0, XenApp (formerly known as Presentation Server) uses EdgeSight forperformance reporting and monitoring instead of Resource Manager. In some editions of XenApp 5.0for Windows Server 2008, a lighter version of EdgeSight is included that is known as Resource Manager(or sometimes Resource Manager powered by EdgeSight). Although similarly named, this XenApp 5.0component is distinct from the version of Resource Manager included in Presentation Server 4.5 andearlier versions.This article assumes that you are familiar with Presentation Server 4.5 Resource Manager usage andarchitecture.
Table of Contents
• 1 What is EdgeSight?• 2 How is EdgeSight Different from Resource Manager?• 3 EdgeSight Components• ° 3.1 EdgeSight Editions
° 3.2 Where do I find the... feature?° - 3.2.1 Dashboard
- 3.2.2 Performance Monitoring Counters• 4 What's Next?• ° 4.1 Key Points for Transitioning from Resource Manager
° 4.2 Key Points for EdgeSight Deployments• 5 FAQs• 6 EdgeSight Versions• 7 See Also• 8 References
Note: For clarity and consistency with the overall Wiki content, this article refers to the EdgeSightcomponent including the Resource Manager version of it as "EdgeSight." However, when EdgeSightis included as a feature of XenApp, it is also marketed under the name, "Application PerformanceMonitoring."
What is EdgeSight?
Citrix EdgeSight for XenApp is a performance management application that can monitor not only XenAppservers but also other non-Citrix devices on a network, such as servers or client devices, which itclassifies as endpoints. EdgeSight can also monitor user sessions and traffic over the ICA virtual channels.Administrators can use EdgeSight to evaluate the impact of changes to their environment, such asgrowth, patches, upgrades, and migrations quantitatively.Examples of tasks EdgeSight can perform include running reports to help determine the causes of slowsession start times, session latency, application crashes, and use at an administrator's weekly statusmeetings. Administrators can also use EdgeSight to monitor resource usage, the number of sessions onspecific servers, what applications users run on those servers, and other aspects of the user experience.
EdgeSight includes a separately-installed component known as EdgeSight for Load Test, which letsadministrators simulate loads on farms for application and scalability testing.
How is EdgeSight Different from ResourceManager?
EdgeSight captures more data than Resource Manager. Unlike Resource Manager, EdgeSight capturesProcess Errors, Process Faults, Process Hangs, Thread Counts, and quite a few other metrics.EdgeSight monitors back-end connections between the XenApp server and application and/or databaseservers. Measurements include network latency, delay and volume per user-session.
One key difference is that EdgeSight provides information about the end-user experience through its EndUser Monitoring features. You can use these metrics to run reports, such as the Session Startup DurationDetails report, which can help determine causes of slow session start times.
Document generated by Confluence on Nov 07, 2013 16:21 Page 14
EdgeSight also provides more report output formats than Resource Manager. EdgeSight lets you outputreports as PDFs, in Excel, and plain text. Unlike Resource Manager, EdgeSight also lets administratorssubscribe to these reports. This means administrators can, for example, specify for EdgeSight to generateand email specific reports to administrators every week the night before their weekly staff meeting.
However, unlike Resource Manager, EdgeSight does not have SMS support or scripts that run basedon events per say. Alert actions can be configured to run a remote process based on a specific alertoccurrence, essentially allowing an administrator to perform any task.
For a more complete description of the differences between the two components, see EdgeSight 4.5 forCitrix XenApp_Environments: Transitioning from Resource Manager, CTX116798.
EdgeSight Components
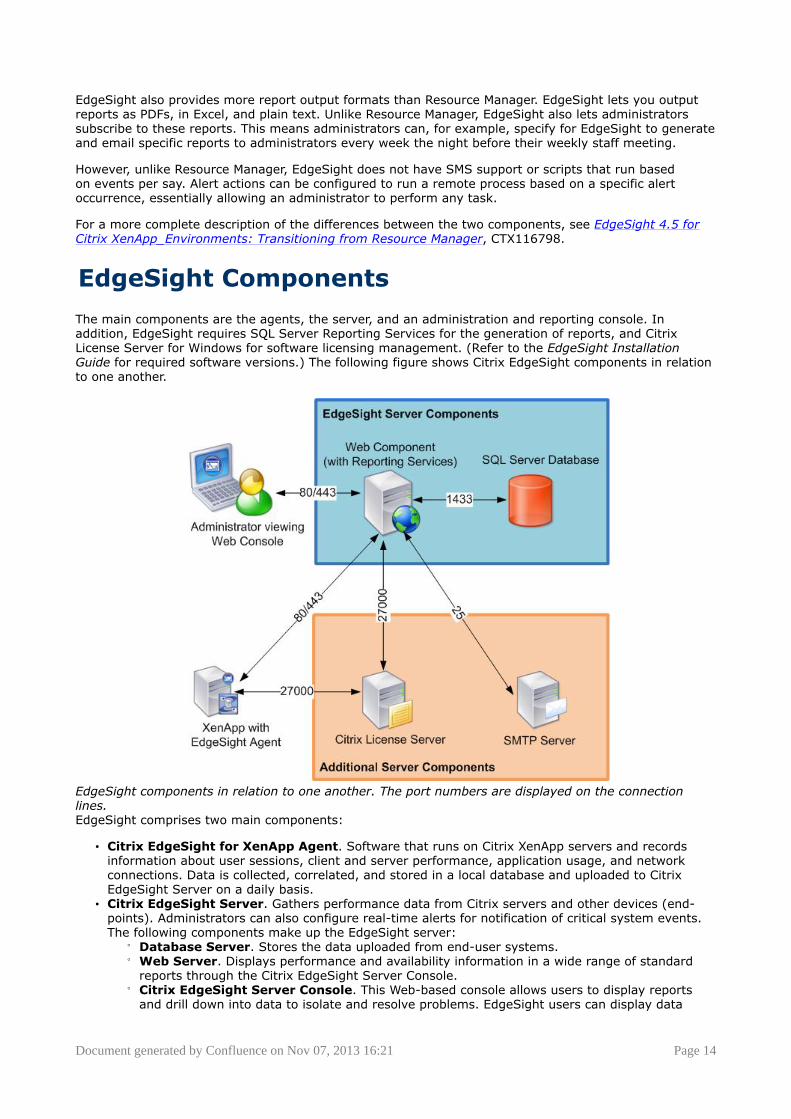
The main components are the agents, the server, and an administration and reporting console. Inaddition, EdgeSight requires SQL Server Reporting Services for the generation of reports, and CitrixLicense Server for Windows for software licensing management. (Refer to the EdgeSight InstallationGuide for required software versions.) The following figure shows Citrix EdgeSight components in relationto one another.
EdgeSight components in relation to one another. The port numbers are displayed on the connectionlines.EdgeSight comprises two main components:
• Citrix EdgeSight for XenApp Agent. Software that runs on Citrix XenApp servers and recordsinformation about user sessions, client and server performance, application usage, and networkconnections. Data is collected, correlated, and stored in a local database and uploaded to CitrixEdgeSight Server on a daily basis.
• Citrix EdgeSight Server. Gathers performance data from Citrix servers and other devices (end-points). Administrators can also configure real-time alerts for notification of critical system events.The following components make up the EdgeSight server:
° Database Server. Stores the data uploaded from end-user systems.° Web Server. Displays performance and availability information in a wide range of standard
reports through the Citrix EdgeSight Server Console.° Citrix EdgeSight Server Console. This Web-based console allows users to display reports
and drill down into data to isolate and resolve problems. EdgeSight users can display data

Document generated by Confluence on Nov 07, 2013 16:21 Page 15
directly from an agent database for use in problem resolution. The console can be run from anyworkstation using a supported browser.
EdgeSight Editions
There are two modes of EdgeSight available with XenApp:
• Citrix EdgeSight in Basic Mode, also sometimes known as Resource Manager powered by EdgeSight• Citrix EdgeSight in Advanced Mode
The mode available with XenApp depends on the edition level (Advanced, Enterprise, or Platinum), aswell as the XenApp product version. As previously stated, both editions of EdgeSight are referred tocollectively as EdgeSight. More information can be found in the EdgeSight Administrator's Guide.
Where do I find the... feature?
If you have been using Resource Manager for a long time, you will probably begin trying to use EdgeSightby looking for features you use frequently in Resource Manager. Here is some information about how tofind similar features in EdgeSight.
Dashboard
EdgeSight has a dashboard that lets you define a list of up to six parameters for a group of up to 20servers. EdgeSight queries the agents running on these servers and refreshes the dashboard at adefined interval. To see the dashboard, in EdgeSight 5.0, click the Configure tab and click Real-TimeDashboard. See the online help for further directions.
Performance Monitoring Counters
If you display Windows Performance Monitoring counters in EdgeSight, you might want to begin learningEdgeSight by using features with these counters. For more information, see the section for peopleexperienced with performance monitoring in Where to Start Using EdgeSight?.
What's Next?
To begin using EdgeSight as a performance monitoring solution, start by reviewing some of thewhitepapers and documentation on migration:
• EdgeSight 4.5 for Citrix XenApp Environments: Transitioning from Resource Manager, CTX116798• When planning an EdgeSight deployment, it is important to be aware of key differences in
EdgeSight's architecture, including best practices for the EdgeSight database and recommendationsfor the agent deployment. Start by looking at the Planning section of CTX116798; this sectionprovides a good introduction to best practices EdgeSight deployments. Then review the informationin the Citrix EdgeSight Installation Guide.
To get EdgeSight up and running, review the configuration and account information in the CitrixEdgeSight Administrator's Guide and then become familiar with EdgeSight's general functionality byreviewing the following:
• Citrix EdgeSight User's Guide. This guide provides case studies of how administrators can useEdgeSight to accomplish tasks like resoliving system, session, and application performanceproblems.
• "Where to Start Using EdgeSight?" This Wiki article provides an entry point with links to keyEdgeSight concepts such as Group and Department design, information to help administratorsunderstand how EdgeSight categorizes reports, and an introduction to performance monitoring.
• "EdgeSight Reporting Tasks for XenApp." This Wiki article provides an entry point for articles abouthow to use EdgeSight to improve session start times, farm health, and so on.
Document generated by Confluence on Nov 07, 2013 16:21 Page 16
Key Points for Transitioning from Resource Manager
Some key Resource Manager points to consider when planning the transition from Resource Manager toEdgeSight are:
• Plan to Run "In Parallel" Initially. If you are currently using Resource Manager, Citrixrecommends running your Resource Manager systems in parallel to implementing EdgeSight. Thiswill provide monitoring continuity until the transition to EdgeSight is complete.
• Accessing Historical Summary Database Information. Data cannot be migrated from ResourceManager to EdgeSight because of the differences in the database architectures.After the EdgeSight environment is tested and deployed, Citrix recommends disabling ResourceManager data collection and only using the summary database for historical reference.
• Alerts. Alerts and thresholds cannot be migrated from Resource Manager to EdgeSight. If you useMonitoring Profiles in Resource Manager, consider grouping alerts and metrics by department inEdgeSight.
Before migrating to EdgeSight, document the alerts and thresholds set in Resource Manager so youcan figure out their equivalent in EdgeSight. The most common alerts in EdgeSight and their ResourceManager counterparts are listed in the "Alerting and Metrics Consideration" section of EdgeSight 4.5 forCitrix XenApp Environments: Transitioning from Resource Manager, CTX116798.
Also, coordinate with your respective network monitoring teams if sending SMTP alerts or SNMP traps toother third-party monitoring systems. Use departments to apply specific alerts required for a group ofservers.
Key Points for EdgeSight Deployments
While reviewing this information, be sure to note some of the key points in managing and deployingEdgeSight:
• Automated Agent Deployment. To make installing and configuring easier, make sure that theagent software package contains all the required settings for an EdgeSight environment and use anysoftware deployment tools (Installation Manager, SMS, etc) you have in your own environment.
• Limit the Initial Agent Deployment. Perform a test deployment on a limited number of XenAppservers to gauge the impact on your farm. Use this pilot to adjust initial EdgeSight configurations.It is easier to deploy and manage 25 EdgeSight agents than it is 250 EdgeSight agents (especiallyif it's required to execute a roll-back plan). Also, this approach reduces risk and overall customerimpact in the event an issue arises.
• Baseline Performance and Fine-Tuning. Citrix suggests baselining your server performance andregularly revisiting alert and threshold settings.
FAQs
1. Can I use EdgeSight to monitor Presentation Server 4.5?No. If you have a mixed farm with Presentation Server 4.5 servers and XenApp 5.0 for Windows Serverr2003 or Windows Server 2008, you must use Resource Manager to monitor the Presentation Server 4.5servers and use EdgeSight to monitor the XenApp 5.0 servers.While you can monitor Presentation Server 4.5 servers with EdgeSight, EdgeSight does not recognizethese legacy servers and treats them as unidentified end-points.
2. How do I find the Resource Manager report I'm used to using in EdgeSight?For a table of the EdgeSight equivalent of Resource Manager reports, see the "Reporting Considerations"section of the EdgeSight 4.5 for Citrix XenApp Environments: Transitioning from Resource Manager,CTX116798.
3. How do I migrate my Resource Manager database to EdgeSight?It is not possible to migrate data or the Resource Manager database to EdgeSight. Because of thedifferences in architecture between the two systems, the data and databases are incompatible.
Document generated by Confluence on Nov 07, 2013 16:21 Page 17
EdgeSight Versions
The techniques and features in this article are compatible with the following versions of EdgeSight:
• EdgeSight 5.3• EdgeSight 5.2• EdgeSight 5.1• EdgeSight 5.0• EdgeSight 4.5• Resource Manager powered by EdgeSight 4.5
See Also
Where to Start Using EdgeSight?
References
The specific product version requirements are listed in Improving Slow Session Start Times.
• EdgeSight 4.5 for Citrix XenApp Environments: Transitioning from Resource Manager, CTX116798• Citrix EdgeSight Installation Guide• Citrix EdgeSight Administrator's Guide• Citrix EdgeSight User's Guide
Document generated by Confluence on Nov 07, 2013 16:21 Page 18
Monitoring
This page last changed on Mar 31, 2010 by normanw1.
• Introduction to EdgeSight Monitoring• Performance Monitoring• Monitoring Farms• Understanding EdgeSight Alerts• Dashboard Monitoring
Document generated by Confluence on Nov 07, 2013 16:21 Page 19
Introduction to EdgeSight Monitoring
This page last changed on Mar 31, 2010 by normanw1.This article discusses when you would want to use EdgeSight's Monitoring features.
Table of Contents
• 1 Overview• 2 Farm Monitor• 3 Alerts• 4 Dashboard• 5 Difference Between Monitoring and Reports• 6 See Also
Overview
EdgeSight provides a wide range of tools and reports allowing you to access remote devices and displayreal-time data stored in an EdgeSight agent database. The tools on the Monitoring tab are designed toprovide timely notification of alert conditions or of performance problems on critical machines. Use thesepages to discover a problem before the end-user calls the help desk.Monitoring tools include:
• Farm Monitor• Dashboard• Alert Console and Alert List
Alerts also fall into the broad category of Monitoring features.
Farm Monitor
The Farm Monitor helps you monitor alert conditions occurring on XenApp and XenDesktop systemswithin farms. The farm structure shown on the monitor is read directly from the farms. When an alertcondition is detected by an EdgeSight Agent running on a device, an alert is generated and this conditionappears on the Farm Monitor. Tip: Configure your alerts wisely. If there are too many alerts configured or they fire to frequently therewill be too much noise and the Farm Monitor will not have as much value as us would if the alerts aresetup to fire for critical events.
Alerts
EdgeSight provides numerous alerts, which can be extremely helpful for everyday management of yourCitrix environment. Alerts are warnings that trigger when a certain event occurs on the devices EdgeSightis monitoring. In addition to being displayed in the EdgeSight console, EdgeSight can be configured tosend alerts via email or SNMP trap.
Examples of alerts are:
• Application errors and faults• XenApp and XenDesktop unavalibility and errors• Session performance problems• System performance problems• Windows event log messages• Network slowdowns
Dashboard
The Dashboard allows you to see real time information for specific devices. This allows you to quicklydetect changes in performance and resource usage on critical machines in your environment or machinesthat have performance problems.
Document generated by Confluence on Nov 07, 2013 16:21 Page 20
Difference Between Monitoring and Reports
Because the EdgeSight Monitoring features provide real-time information, they are designed to providequick insight into what is happening in your environment right now. In contrast the reports provide longterm historical trending.
See Also
• End\-User Experience Monitoring \(EUEM\)• What is Happening in My Environment?• Using EdgeSight Active Application Monitoring• Using EdgeSight to Monitor XenApp Infrastructure Servers
Document generated by Confluence on Nov 07, 2013 16:21 Page 21
Performance Monitoring
This page last changed on Mar 31, 2010 by normanw1.
• Experienced with Performance Monitoring?• New to Performance Monitoring?
Document generated by Confluence on Nov 07, 2013 16:21 Page 22
Experienced with Performance Monitoring?
This page last changed on Apr 28, 2010 by ronaldb.
If you are an administrator who is experienced with performance monitoring, and in particular, perfmoncounters, you may want to begin using EdgeSight by mapping your existing knowledge of perfmoncounters onto EdgeSight.In addition to collecting some perfmon counters, EdgeSight also gathers data from a variety of sourcesincluding the Event Log, XenApp, Windows Management (WMI) on end-user workstations and Citrixservers. Consequently, perfmon counter alerts and reports are only a subset of the information EdgeSightprovides.
The following table provides examples of where you can find perfmon counters in EdgeSight:
To... Use...
baseline your environment using Perfmoncounters
• Real-time Device Summary• Real-time System Performance
see a wide range of Perfmon counters from thelast three days (grouped in three hour blocks)
• Device Troubleshooter
set alerts based on a specific Perfmon counter The Custom Performance Counters feature toadd a perfmon counter. These will show up in thereal-time reports. In the Troubleshoot tab, clickReal-Time Reports > Custom PerformanceCounters > Configuration.
perform other reporting tasks using Perfmoncounter
All of the Real-time reports in the Browse tab arebased on Perfmon counters:
• Real-time Device Summary• Real-time Network Performance• Real-time Presentation Server User
Summary• Real-time System Compare• Real-time System Performance
The advantage to using EdgeSight to gather and report on these Perfmon counters is that unlikedisplaying these metrics in Perfmon, EdgeSight lets you display the information remotely, generate andprint reports, and display the information from multiple servers simultaneously.
References
• Windows Perfmon: The Top Ten Counters. Written on April 2007 on Adminfoo.net. Accessed on July24, 2009.
• "Establishing a Performance Baseline" a Microsoft TechNet article, accessed on April 20, 2009.• http://support.citrix.com/article/CTX031126
• Key Performance Metrics Exposed in EdgeSight for XenApp 5.0 and EdgeSight for Endpoints 5.0.Citrix Whitepaper.
• Forum post, http://www.brianmadden.com/forums/t/26734.aspx, accessed on April 16, 2009.

Document generated by Confluence on Nov 07, 2013 16:21 Page 23
New to Performance Monitoring?
This page last changed on Apr 28, 2010 by ronaldb.
Because EdgeSight is a performance monitoring product, it assumes a certain amount of performancemonitoring knowledge. Before using the product, it may be helpful to understand basic performancemonitoring concepts such as:
• How to establish a performance baseline or benchmark• How to use performance counters to determine system health and load• The reasons organizations use metrics to evaluate network performance and how they can benefit
you
Microsoft provides a good overview of performance monitoring in its TechNet article, Overview ofPerformance Monitoring. While this information pertains to Windows Server 2000, the general principlesstill apply. A very easy introduction to using Windows Performance Counters is available in the article,Windows Perfmon: The Top Ten Counters.
The following resources will help with establishing a performance baseline:
• "Establishing a Performance Baseline" a Microsoft TechNet article, accessed on April 20, 2009.• http://support.citrix.com/article/CTX031126
• Key Performance Metrics Exposed in EdgeSight for XenApp 5.0 and EdgeSight for Endpoints 5.0.Citrix Whitepaper.
• Forum post, http://www.brianmadden.com/forums/t/26734.aspx, accessed on April 16, 2009.
Document generated by Confluence on Nov 07, 2013 16:21 Page 24
Monitoring Farms
This page last changed on Nov 11, 2009 by sarahv.
• XenApp Farm Resiliency
Document generated by Confluence on Nov 07, 2013 16:21 Page 25
XenApp Farm Resiliency
This page last changed on Dec 02, 2009 by danag.
To prevent major outages and crises, it is important to become immediately aware of significant changesto data collectors, XML Brokers, and other servers vital to farm infrastructure.
This article defines farm resiliency, which is predicated on the concept of infrastructure servers, and anexplanation of this concept. It provides a foundation for the following series of articles, which providestep-by-step instructions for ensuring farm resiliency:
• Alerting on Critical Health Changes• Determining When a Data Collection Election Occurs• Farm Resiliency Using the Farm Monitor and Reports• Using EdgeSight to Monitor XenApp Infrastructure Servers
Table of Contents
• 1 Overview• ° 1.1 Background Information• 2 References
Overview
To ensure farm resiliency, Citrix recommends monitoring the following events:
1. Any server in your farm is not accepting user connections. This is an essential step in preventing"blackhole" conditions - especially in load-managed application groups.
2. A data collector election occurs.
Good farm management also requires knowing how busy your application servers are in actuality andwhen they exceed certain thresholds.
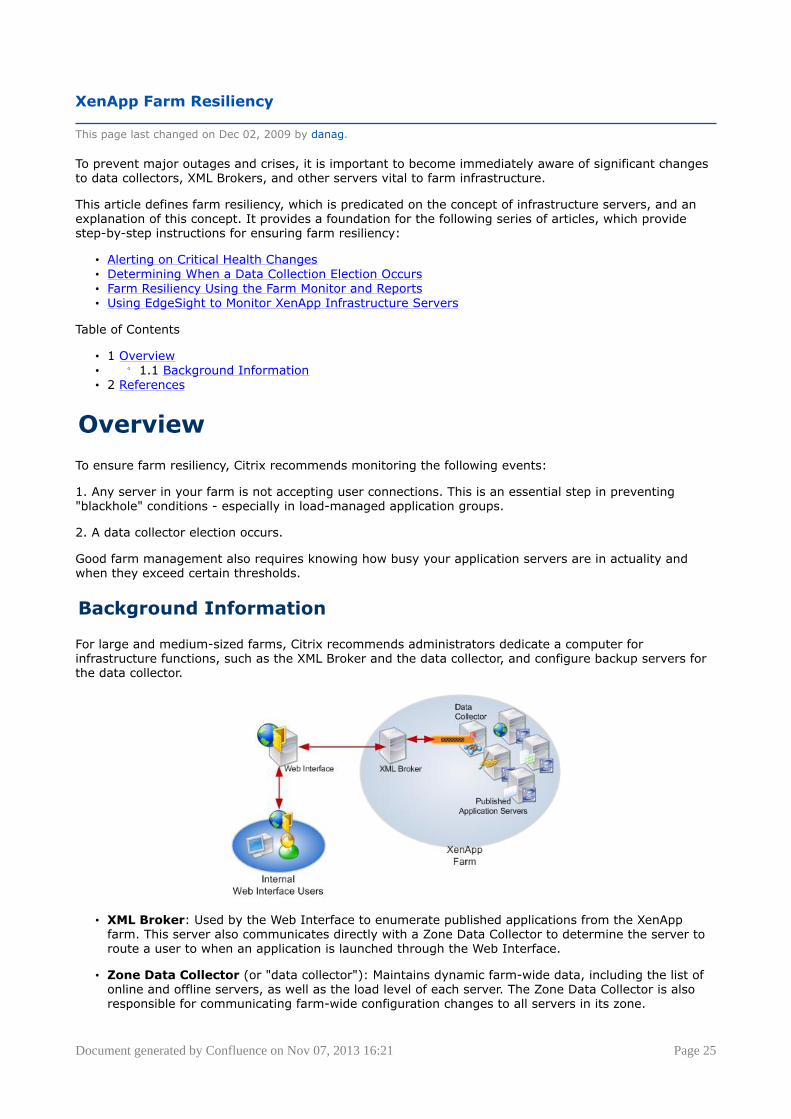
Background Information
For large and medium-sized farms, Citrix recommends administrators dedicate a computer forinfrastructure functions, such as the XML Broker and the data collector, and configure backup servers forthe data collector.
• XML Broker: Used by the Web Interface to enumerate published applications from the XenAppfarm. This server also communicates directly with a Zone Data Collector to determine the server toroute a user to when an application is launched through the Web Interface.
• Zone Data Collector (or "data collector"): Maintains dynamic farm-wide data, including the list ofonline and offline servers, as well as the load level of each server. The Zone Data Collector is alsoresponsible for communicating farm-wide configuration changes to all servers in its zone.
Document generated by Confluence on Nov 07, 2013 16:21 Page 26
Note: Ideally, farm administrators should set the data-collector election preferences on the data collectormachine to Most Preferred and its backups to be Preferred. (Since Citrix recommends that applicationservers not host data collectors, application servers should be set to Default Preference or NotPreferred.)
References
• XenApp Infrastructure Monitoring and Alerting, CTX118742• Improving Farm Performance and Resiliency with Hotfix Rollup Pack 3, CTX119922• Citrix XenApp 5.0 for Windows Server 2008 Administrator's Guide, CTX115519.
Document generated by Confluence on Nov 07, 2013 16:21 Page 27
Alerting on Critical Health Changes
This page last changed on Apr 27, 2010 by ronaldb.
This article provides suggestions for ways administrators can set alerts for critical health changes.
Table of Contents
• 1 Overview• ° 1.1 Requirements
° 1.2 Setting Alerts for High Resource Utilization° 1.3 Setting Alerts to Prevent Load Balancing Black Holes° - 1.3.1 Configuring EdgeSight Alerts for Unreachable Servers
- - 1.3.1.1 Part 1: To configure the ICA Listener test- 1.3.1.2 Part 2: To configure EdgeSight to alert you if a server stops accepting
connections° 1.4 Reporting for Custom Performance Monitoring Counters° - 1.4.1 Reporting and Analysis° 1.5 Determining the Number of Elections on Your Farm
• 2 Using the Farm Monitor to Display Recent Farm Health• 3 Using Reports for Farm Health• ° 3.1.1 Other Useful Farm Health Alerts• 4 References
Overview
This article assumes that, in accordance with good farm design, there is one or more computersdedicated to infrastructure functions. For an explanation of infrastructure servers, see BackgroundInformation.
To ensure farm resiliency, Citrix recommends knowing immediately when:
1. Any server in your farm is not accepting user connections. This is an essential step in preventing"blackhole" conditions - especially in load-managed application groups.
2. A data collector election occurs.
Good farm management also requires knowing how busy your application servers are in actuality andwhen they exceed certain thresholds.
Requirements
This article assumes administrators have the following configuration:
• XenApp 5.0 for Windows Server 2003, Hotfix Rollup Pack 3• EdgeSight 5.0
While some techniques in this article might still be possible without HRP03, not all of them will be.
HRP03 contains critical farm resiliency enhancments. Citrix strongly recommends installing Hotfix RollupPack 3 (HRP03) for Presentation Server 4.5 and XenApp 5 for Windows Server 2003 on all applicable farmservers. Without HRP03, the black-hole conditions discussed in the sections that follow result in the entirezone or possibly even entire farm failing.
As of this authoring date, HRP03 farm resiliency features are not available for XenApp products runningon Windows Server 2008.
Setting Alerts for High Resource Utilization
Administrators can configure EdgeSight to set alerts when a resource utilization (CPU, thread counts,queue length, memory) for specific processes exceeds a specified value. In practice, this means thatadministrators can create alerts for critical services, such as the Citrix XML Service.
Document generated by Confluence on Nov 07, 2013 16:21 Page 28
For example, in an organization with four XML Broker servers, a high CPU load on one XML Broker mightcause intermittently slow application enumeration and launch performance. Without setting an alert, thisscenario might be time consuming to isolate. By configuring an EdgeSight alert, the administrator can seethe issue in the EdgeSight Farm Monitor. By associating an action with this alert, EdgeSight will notifythe administrator about the high load before the peak logon period, which lets the administrator preventthe problem from impacting the user community.
This scenario and the procedure that follows are just meant as an example. Other examples ofApplication Performance alerts administrators might want to set include:
Problem Service Display Name Service Executable Alert Rule Conditions
IMA service becomesunresponsive on somedevices
Citrix IndependentManagementArchitecture
ImaSrv.exe EventLog = 'System'AND EventID = '3999'AND EventSource ='IMAService'
Failure to authenticateexternally (or internallydepending on farmdesign)
Citrix Secure GatewayProxy
CtxSGSvc.exe TBD
Print Manager failure(Overloaded Citrix PrintManager Service)
Citrix Print ManagerService
cpsvc.exe When the thread countexceeds the value youcalculated this canindicate a problem.
To create an alert on the XML Broker for overload conditions
1. Create the Alert Rule as follows:Rule Category: Application AlertsRule Type: Application PerformanceRule Name: _XML Broker Overload
Alert Rule Conditions:
• Process file name: ctxxmlss.exe• Process company name: Citrix• CPU time (percent): 85• Thread count:• Thread queue length:
Note: The environment must meet all the criteria you specify in the Alert Rule, including the sampleratio, before it will fire. The more parameters adminstrators enter, the more difficult it is for the alert tobe triggered. Leave all other fields at their default settings.2. Apply the alert to the department or farm in which the XML Broker resides. EdgeSight will monitor allservers in this department for the alert criteria.
3. Create an Action for this alert specifying "XML Broker Overloaded" as the subject.
Note: Instructions for creating alerts are available in the EdgeSight product documentation.
Setting Alerts to Prevent Load Balancing Black Holes
To ensure farm health, you want to know immediately when an application server stops accepting ICAconnections (that is, the ICA protocol stack fails). This is particularly true when the application server isbeing load balanced.
When one load-managed application server cannot accept connections, a state can result where userscannot connect to any instances of that application in the load-managed group. To prevent these load-balancing black holes, consider setting EdgeSight to alert you whenever an application server stopsacccepting user (ICA) connections.
Cause?
Document generated by Confluence on Nov 07, 2013 16:21 Page 29
This unreachable state results because the Citrix Independent Management Architecture (IMA) servicecannot detect when an application server stops accepting user connections. If the application server is ina load-balanced group, the IMA service perceives that the unreachable server is the least-loaded serverand continues to direct user connections to it. This misperception results in the IMA service not directingconnections to the other servers for that application: consequently, users cannot connect to any instancesof the application.
Configuring EdgeSight Alerts for Unreachable Servers
You can configure EdgeSight to alert you when an application server stops accepting ICA connections byusing the following two-part process:
1. Configuring the XenApp Health Monitoring & Recovery feature to run the ICA Listener test.2. Configuring EdgeSight to alert you when the ICA Listener test fails.
This procedure requires that you remove the unreachable server from load balancing.
Part 1: To configure the ICA Listener test
1. In XenApp, configure the Health Monitoring & Recovery feature to run the ICA Listener test every60 seconds on all application servers in the farm. This test determines if a XenApp server can acceptconnections. For instructions on configuring the Health Monitoring & Recovery feature, see the CitrixXenApp 5.0 for Windows Server 2008 Administrator's Guide.
2. In the Health Monitoring & Recovery feature, as the recovery action, specify for XenApp to RemoveServer From Load Balance Tables. This option instructs XenApp to remove a server not acceptinguser connections from its load-balanced server group. This prevents the "black-hole" condition.
Part 2: To configure EdgeSight to alert you if a server stops accepting connections
Note: This procedure requires that you have Server Settings permissions in EdgeSight.
1. In EdgeSight, create two new alert rules with the following settings (based on EdgeSight 5.0):
Rule 1:
Event ID 1004 is the event log entry that the Health Monitoring & Recovery feature logs when it takes anunreachable server out of its load-balanced group.
• Rule Category: System Alerts• Alert Type: Windows Event Log• Alert Rule Conditions:
° Event Log Name: Application° Event Type: Any ° Event ID: 1004° Event Source: MetaFrameEvents
Rule 2:
Event ID 1005 is the event log entry that the Health Monitoring & Recovery feature logs when it fails totake an unreachable server out of its load-balanced group.
• Rule Category: System Alerts• Alert Type: Windows Event Log• Alert Rule Conditions:
° Event Log Name: Application° Event Type: Any ° Event ID: 1005° Event Source: MetaFrameEvents
2. Assign the alert rule to the Department containing all farms being monitored (PS Farms) or to aspecific farm.
3. Configure an alert action to send you an email alert. You can also create an action that runs anexecutable (for example, opening the command-line interface for applications like Tivoli or HP OpenView).
Document generated by Confluence on Nov 07, 2013 16:21 Page 30
Tip: Creating farm-specific alerts, for example, including the farm name in the alert name (such as"Farm0012 Unreachable Server"), can help you quickly identify the source of the problem. You can alsoconfigure alert actions that generate a notification email to one or more administrators.
Reporting for Custom Performance Monitoring Counters
XenApp provides some Performance Monitoring counters that can be beneficial to monitor for farm health.Unfortunately, not all of these counters are currently available in EdgeSight. However, it is possible toadd these counters and run a report on them. The limitation is that you can only run a report for customcounters on one device in your farm at a time. Because the data in this report is from the EdgeSightagent, it is possible to run reports on real-time information, which shows changes as they occur, ratherthan see historical data (typically three days old) from the database.
Creating reports for the Performance Monitoring counters listed in XenApp Infrastructure Monitoring andAlerting, CTX118742 is a two-step process:
1. Add the Performance Monitoring counter to EdgeSight for the counters it does not monitor already.2. Run a report (specifically, the Custom Performance Counters > Chart) on the data.
This process is explained in more detail in the article, Generating Reports for a Custom PerformanceMonitoring Counter in EdgeSight.
Reporting and Analysis
This section provides information about ways to proactively improve your farm performance by gettinginsight into past performance though historical reports and similar features.
Determining the Number of Elections on Your Farm
When evaluating the overall health of your farm, you might want to determine how many times over thelast few days election storms have occured.
To display trends for recent election storms
1. In EdgeSight, click the Monitor tab.
2. Click Alert Console.
3. Select one of the following:
• Department.• Group. Select Data Collectors as the Group.
4. From the Alert Name list box, select Zone Elections too Frequent.
5. Select By Device as the Filter.
6. (Optional.) Change the Zoom interval to narrow or expand your date range, as desired.
Tip: You can also use the Event Log Alerts report filtered on the Data Collectors Group (groupedby Device) to display the number alerts over a longer period of time. Look for the alert Zone DataCollector Election Triggered in the report.
To identify the data collectors affected by election storms and monitor elections in real time
1. In EdgeSight, click the Monitor tab.
2. Click Farm Monitor.
3. From the Alert Name list box, select Zone Elections too Frequent.
5. In the tree view, select the farm name and click Go.
7. In the Device Information pane, click the System tab.
Document generated by Confluence on Nov 07, 2013 16:21 Page 31
8. In the Counter column, look (or search) for the Zone Elections Triggered Performance Monitoringcounter. This counter increments each time a server triggers a data collector election.
Using the Farm Monitor to Display RecentFarm Health
Use the Farm Monitor to browse through your farms and display real-time data for alerts received withinthe last 6 hours.
Note: This procedure requires that you have administrative privileges on the farm experiencing the alertcondition.
To display information for a recent alert
1. Browse the farm structure, or search for a specific farm. Farms with recent alerts are marked with analert !farm_mon_alert.jpg|width=32,height=32! icon.2. Click on the menu !menubtn.jpg|width=32,height=32! icon and select Alert Detail to display adescription of the alert condition.
3. Click on an alert to retrieve system context around the time of the alert.
4. Select the applicable tab to display information on process, system, session, and n4etwork counters.
To display information for alerts received within the last three days, use the Alert Console.
Using Reports for Farm Health
The following reports can also provide insight into farm health:
• Device Summary. Provides device performance data (CPU and memory usage, network delay,event log alerts, and application errors)
• Environmental Usage. Provides data on users, clients, sessions (start, end, and duration),published applications, and processes.(Note: You must enable uploading environmental usage data before you can run this report. See theEdgeSight online help for details. )
• ICA Round Trip Time. Provides session and network round trip time (RTT).• Network Delay for a User Group. Session network delay, broken down by server, client, and
network delay.• Port Network Delay. Port network delay, broken down by server, client, and network delay.• Port Network Volume. Port network volume (kilobytes sent and received).• Presentation Server Summary. XenApp performance data (login time, active sessions, ICA
session latency, and CPU and memory usage).• Presentation Server User Summary. XenApp performance from a user perspective (for example,
client traffic, login time, session latency, and recent sessions).
Other Useful Farm Health Alerts
In environments plagued by frequent connection failures to the Terminal Server License Server,administrators can set alerts when this occurs.
By default, EdgeSight monitors for failure to connect to its environment's Terminal Services licenseserver. (The Terminal Server License Server Discovery Failure alert is enabled by default.) However,administrators must associate this alert with an action for them to receive a real-time warning (forexample, an email message).
References
• XenApp Infrastructure Monitoring and Alerting, CTX118742• Improving Farm Performance and Resiliency with Hotfix Rollup Pack 3, CTX119922
Document generated by Confluence on Nov 07, 2013 16:21 Page 32
• QueryDC, CTX106317. This article includes information about the -t function Citrix added to theQueryDC tool.
• Creating, Configuring, and Testing Health Monitoring, CTX112166.• HMR Test Pack, CTX112805.• Case Study: Using EdgeSight 5.0 to Troubleshoot Application Enumeration, CTX120307.• Citrix XenApp 5.0 for Windows Server 2008 Administrator's Guide, CTX115519.
Document generated by Confluence on Nov 07, 2013 16:21 Page 33
Determining When a Data Collection Election Occurs
This page last changed on Nov 09, 2009 by sarahv.The XenApp data collector is a critical aspect of all farms. Regardless of whether the data collector is on adedicated or shared server, when it performs poorly it will affect all user connections in that zone.
This article provides an overview of how to configure alerts for when a data collector election occurs andwhen there are excessive elections ("election storms").
Table of Contents
• 1 Overview• ° 1.1 Requirements• 2 To create an alert when data-collector elections occur• 3 Monitoring for Data Collector Election Storms• ° 3.1 Preventing Data Collector Election Black Holes• 4 Applicable Versions• 5 References
Overview
When communications fail between data collectors or between a server and its data collector, the processto choose a new data collector begins. This process is known as the data-collector election.
Citrix recommends that you be notified immediately when a data collector fails over to its backupdata collector. This is because after failover the farm (or zone) only has one data collector. If that datacollector fails, your entire farm will stop accepting user connections.
The easiest way to find out that an election occured is to configure an alert in EdgeSight. Since theAccess Management Console does not display elections, without EdgeSight, you must remember to runthe QuerryDC command or check the event logs on the data collector and its backup.
Requirements
This article assumes administrators have the following configuration:
• XenApp 5.0 for Windows Server 2003, Hotfix Rollup Pack 3• EdgeSight 5.0
While some techniques in this article might still be possible without HRP03, not all of them will be.
HRP03 contains critical farm resiliency enhancments. Citrix strongly recommends installing Hotfix RollupPack 3 (HRP03) for Presentation Server 4.5 and XenApp 5 for Windows Server 2003 on all applicable farmservers. Without HRP03, the black-hole conditions discussed in the sections that follow result in the entirezone or possibly even entire farm failing.
As of this authoring date, HRP03 farm resiliency features are not available for XenApp products runningon Windows Server 2008.
To create an alert when data-collectorelections occur
1. In EdgeSight, create a new alert rule with the rule category Presentation Server Error Alerts.2. Specify Zone Data Collector Election Triggered as the Alert Type.3. Create an action that emails you when this alert occurs.
Tip: You can also create a System alert based on the Event ID 3999. If you do this, the alert displays thename of the zone, which server triggered the election, and the name of the server that is the new datacollector. You may also want to create an action for this alert.
Document generated by Confluence on Nov 07, 2013 16:21 Page 34
Monitoring for Data Collector Election Storms
In larger farms, in extreme circumstances, network issues or high load can sometimes unnecessarilyand repeatedly trigger data collector elections in rapid succession. These rapid elections are typicallyreferred to as _election storms_. Election storms can result in downtime for end users since the datacollectors must repeatedly rebuild dynamic data, which prevents them from load balancing incoming userrequests.
To configure an EdgeSight alert for excessive data collector elections
1. In EdgeSight, create a new alert rule with the rule category Presentation Server PerformanceAlert.
2. Specify Zone Elections too Frequent as the Alert Type.3. Specify the number of elections that you want to occur before EdgeSight alerts you. In farms prone
to frequent storms, you can specify either a higher number of election counts or lower pollinginterval and increase the Re-alert parameter (which is found in the Advanced Parameters) sothat it alerts you less frequently once the storm begins.
4. Create an action that emails you when this alert occurs.Note: XenApp 5.0 for Windows Server 2003, Hotfix Rollup Pack 3 introduces features that helpreduce election storms. Citrix strongly recommends upgrading to this hotfix if election storms arean issue in your farm. For more information, see Improving Farm Performance and Resiliency withHotfix Rollup Pack 3, CTX119922.
Preventing Data Collector Election Black Holes
An election "black hole" condition can occur when a data collector only partially fails - that is, it cannotfunction as a data collector yet continues to win elections and causes an outage.
To configure an EdgeSight alert when IMA on a data collector is unresponsive
1. In EdgeSight, create a new alert rule (and email action) with the following settings:
• Rule Category: System Alerts• Alert Type: Windows Event Log• Alert Rule Conditions:
° Event Log Name: System° Event Type: Any° Event ID: 4001° Event Source: MetaFrameEvents
To configure an EdgeSight alert when IMA an offline data collector becomes available again1. In EdgeSight, create a new alert rule (and email action) with the following settings:
• Rule Category: System Alerts• Alert Type: Windows Event Log• Alert Rule Conditions:
° Event Log Name: System° Event Type: Any° Event ID: 4002° Event Source: MetaFrameEvents
Applicable Versions
This article applies to:
• EdgeSight 5.2• EdgeSight 5.1• EdgeSight 5.0
Document generated by Confluence on Nov 07, 2013 16:21 Page 35
References
• XenApp Infrastructure Monitoring and Alerting, CTX118742• Improving Farm Performance and Resiliency with Hotfix Rollup Pack 3, CTX119922• QueryDC, CTX106317. This article includes information about the -t function Citrix added to the
QueryDC tool.• Creating, Configuring, and Testing Health Monitoring, CTX112166.• HMR Test Pack, CTX112805.• Case Study: Using EdgeSight 5.0 to Troubleshoot Application Enumeration, CTX120307.• Citrix XenApp 5.0 for Windows Server 2008 Administrator's Guide, CTX115519.

Document generated by Confluence on Nov 07, 2013 16:21 Page 36
Farm Resiliency Using the Farm Monitor and Reports
This page last changed on Nov 09, 2009 by sarahv.
This article provides information about how to use EdgeSight's Farm Monitor feature to ensure farmhealth and resiliency. It also discusses generating reports for farm health and how to generate alerts.
Table of Contents
• 1 Using the Farm Monitor to Display Recent Farm Health• 2 Using Reports for Farm Health• ° 2.1 Other Useful Farm Health Alerts• 3 References
Using the Farm Monitor to Display RecentFarm Health
Use the Farm Monitor to browse through your farms and display real-time data for alerts received withinthe last 6 hours.
Note: This procedure requires that you have administrative privileges on the farm experiencing the alertcondition.
To display information for a recent alert
1. Browse the farm structure, or search for a specific farm. Farms with recent alerts are marked with an
alert icon.2. Click on the menu
icon and select AlertDetail to display a description of the alert condition.
3. Click on an alert to retrieve system context around the time of the alert.
4. Select the applicable tab to display information on process, system, session, and network counters.
To display information for alerts received within the last three days, use the Alert Console.
Using Reports for Farm Health
The following reports can also provide insight into farm health:
• Device Summary. Provides device performance data (CPU and memory usage, network delay,event log alerts, and application errors)
• Environmental Usage. Provides data on users, clients, sessions (start, end, and duration),published applications, and processes.(Note: You must enable uploading environmental usage data before you can run this report. See theEdgeSight online help for details. )
• ICA Round Trip Time. Provides session and network round trip time (RTT).• Network Delay for a User Group. Session network delay, broken down by server, client, and
network delay.• Port Network Delay. Port network delay, broken down by server, client, and network delay.• Port Network Volume. Port network volume (kilobytes sent and received).• Presentation Server Summary. XenApp performance data (login time, active sessions, ICA
session latency, and CPU and memory usage).• Presentation Server User Summary. XenApp performance from a user perspective (for example,
client traffic, login time, session latency, and recent sessions).
Document generated by Confluence on Nov 07, 2013 16:21 Page 37
Other Useful Farm Health Alerts
In environments plagued by frequent connection failures to the Terminal Server License Server,administrators can set alerts when this occurs.
By default, EdgeSight monitors for failure to connect to its environment's Terminal Services licenseserver. (The Terminal Server License Server Discovery Failure alert is enabled by default.) However,administrators must associate this alert with an action for them to receive a real-time warning (forexample, an email message).
References
• XenApp Infrastructure Monitoring and Alerting, CTX118742• Improving Farm Performance and Resiliency with Hotfix Rollup Pack 3, CTX119922• QueryDC, CTX106317. This article includes information about the -t function Citrix added to the
QueryDC tool.• Creating, Configuring, and Testing Health Monitoring, CTX112166.• HMR Test Pack, CTX112805.• Case Study: Using EdgeSight 5.0 to Troubleshoot Application Enumeration, CTX120307.• Citrix XenApp 5.0 for Windows Server 2008 Administrator's Guide, CTX115519.
Document generated by Confluence on Nov 07, 2013 16:21 Page 38
Using EdgeSight to Monitor XenApp Infrastructure Servers
This page last changed on Apr 27, 2010 by ronaldb.
This is a stub article and may be combined with another article or expanded.
While many people think of EdgeSight as a tool for monitoring servers hosting published applications, youcan also use EdgeSight to monitor your infrastructure servers.
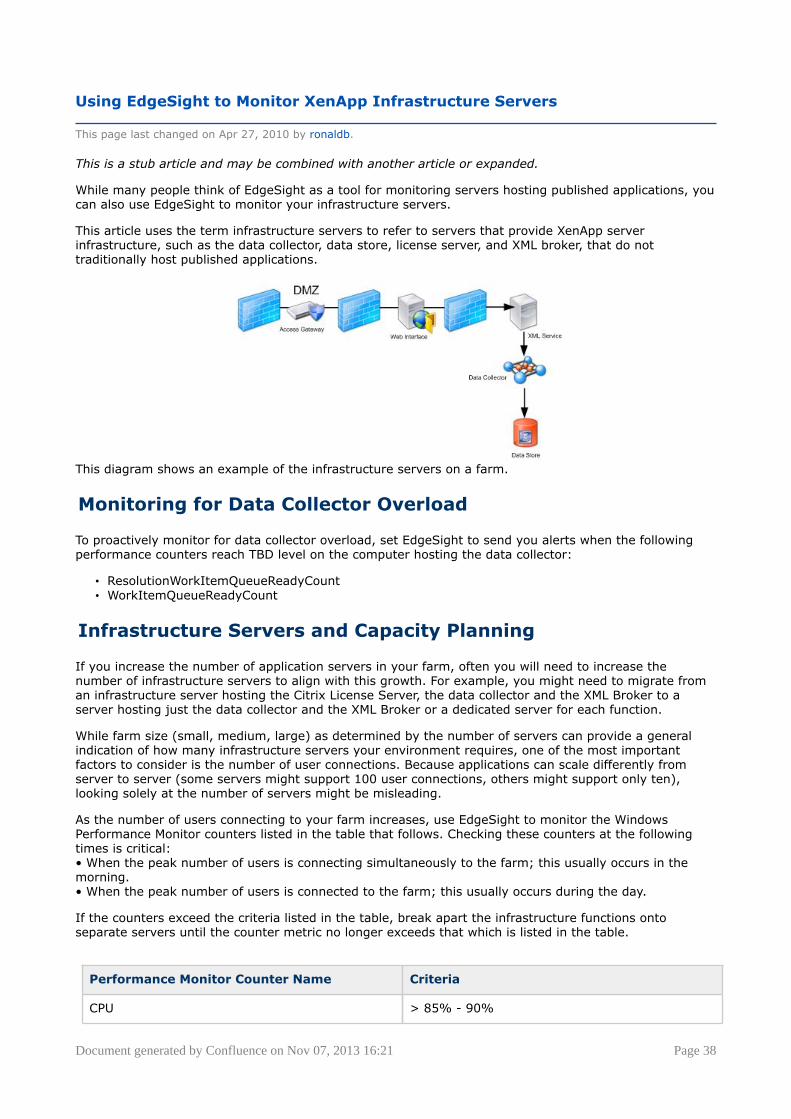
This article uses the term infrastructure servers to refer to servers that provide XenApp serverinfrastructure, such as the data collector, data store, license server, and XML broker, that do nottraditionally host published applications.
This diagram shows an example of the infrastructure servers on a farm.
Monitoring for Data Collector Overload
To proactively monitor for data collector overload, set EdgeSight to send you alerts when the followingperformance counters reach TBD level on the computer hosting the data collector:
• ResolutionWorkItemQueueReadyCount• WorkItemQueueReadyCount
Infrastructure Servers and Capacity Planning
If you increase the number of application servers in your farm, often you will need to increase thenumber of infrastructure servers to align with this growth. For example, you might need to migrate froman infrastructure server hosting the Citrix License Server, the data collector and the XML Broker to aserver hosting just the data collector and the XML Broker or a dedicated server for each function.
While farm size (small, medium, large) as determined by the number of servers can provide a generalindication of how many infrastructure servers your environment requires, one of the most importantfactors to consider is the number of user connections. Because applications can scale differently fromserver to server (some servers might support 100 user connections, others might support only ten),looking solely at the number of servers might be misleading.
As the number of users connecting to your farm increases, use EdgeSight to monitor the WindowsPerformance Monitor counters listed in the table that follows. Checking these counters at the followingtimes is critical:• When the peak number of users is connecting simultaneously to the farm; this usually occurs in themorning.• When the peak number of users is connected to the farm; this usually occurs during the day.
If the counters exceed the criteria listed in the table, break apart the infrastructure functions ontoseparate servers until the counter metric no longer exceeds that which is listed in the table.
Performance Monitor Counter Name Criteria
CPU > 85% - 90%
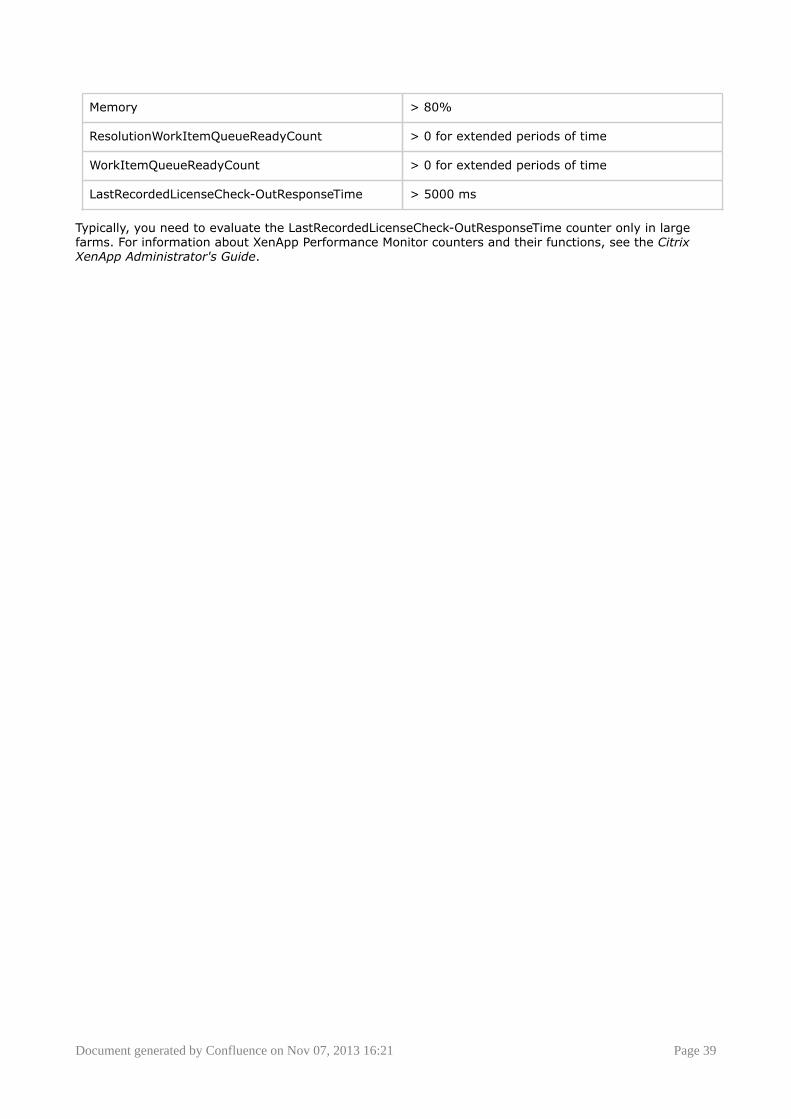
Document generated by Confluence on Nov 07, 2013 16:21 Page 39
Memory > 80%
ResolutionWorkItemQueueReadyCount > 0 for extended periods of time
WorkItemQueueReadyCount > 0 for extended periods of time
LastRecordedLicenseCheck-OutResponseTime > 5000 ms
Typically, you need to evaluate the LastRecordedLicenseCheck-OutResponseTime counter only in largefarms. For information about XenApp Performance Monitor counters and their functions, see the CitrixXenApp Administrator's Guide.
Document generated by Confluence on Nov 07, 2013 16:21 Page 40
Understanding EdgeSight Alerts
This page last changed on Nov 12, 2009 by sarahv.
• System Alerts• Application Alerts• Network Alerts• Session Alerts• XenApp Alerts• XenDesktop Alerts
Document generated by Confluence on Nov 07, 2013 16:21 Page 41
System Alerts
This page last changed on Nov 12, 2009 by sarahv.

Document generated by Confluence on Nov 07, 2013 16:21 Page 42
Application Alerts
This page last changed on Nov 12, 2009 by sarahv.

Document generated by Confluence on Nov 07, 2013 16:21 Page 43
Network Alerts
This page last changed on Nov 12, 2009 by sarahv.

Document generated by Confluence on Nov 07, 2013 16:21 Page 44
Session Alerts
This page last changed on Nov 12, 2009 by sarahv.

Document generated by Confluence on Nov 07, 2013 16:21 Page 45
XenApp Alerts
This page last changed on Nov 12, 2009 by sarahv.
• Using EdgeSight Active Application Monitoring
Document generated by Confluence on Nov 07, 2013 16:21 Page 46
Using EdgeSight Active Application Monitoring
This page last changed on Jun 02, 2010 by ronaldb.
This is a stub article and may be combined with another article or expanded.
EdgeSight Active Application Monitoring is an easy to install and configure automated performance testingtool that monitors the end user experience in Presentation Server and XenApp environments.
Table of Contents
• 1 Overview• ° 1.1 Getting Started with Active Application Monitoring
° 1.2 Differences Between EdgeSight for Load Test
Overview
Active Application Monitoring is a separate tool included with EdgeSight, Service Pack 2.0 and higher.
Active Application Monitoring lets you create scripts to replicate user actions for a specific application.You can use Active Application Monitoring to perform scalability testing for an application and alsodemonstrate SLA compliance.
The module has a separate installation program, which is found on the EdgeSight DVD. The installationinstructions are included in the text of the installation wizard.
Getting Started with Active Application Monitoring
To use the Active Application Monitoring tool to demonstrate SLA compliance, create a script to performspecific actions in an application and then run it against the corresponding application server in theproduction environment. In the script, you define the specific items you want to monitor as MonitoringPoints.
When you run the script, you only specify for it to simulate one user so as not to create excess load onthe server. The Active Application Monitor launcher can then capture metrics about how the applicationbehaves on that application server. These metrics are uploaded to EdgeSight.
After the metrics are in EdgeSight, you can run one of the Application Response reports. These reportsprovide metrics for the monitoring point you specified in the script.
Note: The Active Application Monitoring online help is installed with the Active Application Monitoring tool.This help system provides instructions for configuring the module initially and creating scripts.
Differences Between EdgeSight for Load Test
While Active Application Monitoring is designed to test application availability and responsiveness,EdgeSight for Load Testing performs load tests in a XenApp environment. EdgeSight for Load Testingrecords and replays scripts which simulate a virtual user's interaction with an application, generating thenecessary information to simulate the activity of multiple users. This data helps XenApp administratorsidentify performance bottlenecks before applications are delivered to the production environment, and toestablish application monitoring baselines based on transaction and system performance. Once created,scripts can be re-used for application regression testing of updates or for comparing performance of newhardware options or configurations.
Document generated by Confluence on Nov 07, 2013 16:21 Page 47
XenDesktop Alerts
This page last changed on Nov 12, 2009 by sarahv.

Document generated by Confluence on Nov 07, 2013 16:21 Page 48
Dashboard Monitoring
This page last changed on Apr 27, 2010 by ronaldb.
This is a stub article and may be combined with another article or expanded.
Document generated by Confluence on Nov 07, 2013 16:21 Page 49
Troubleshooting
This page last changed on Apr 27, 2010 by ronaldb.
• Troubleshooting Using EdgeSight
Document generated by Confluence on Nov 07, 2013 16:21 Page 50
Troubleshooting Using EdgeSight
This page last changed on Apr 27, 2010 by ronaldb.
Administrators can use EdgeSight real-time reports, historical reports, and troubleshooting features toperform troubleshooting in their environments. For articles about troubleshooting techniques, see:
• Troubleshooting Devices• Troubleshooting XenApp Application Servers• Troubleshooting XenApp Application Issues• Troubleshooting XenApp Infrastructure Servers• Case Study, Troubleshooting Remote Applications
Table of Contents° 1 Overview° 2 Starting Points° 3 Troubleshooting Tools° - 3.1 Data in Real-time Troubleshooting Features
- 3.2 Custom Counters° 4 References
Overview
Troubleshooting is a form of systematic problem solving used to isolate the root cause of an issue sothat steps can be taken to fix the issue and restore one or more systems to proper operation. In thecontext of this Wiki, troubleshooting techniques are applied to isolate problems with various components,services, or features in your XenApp environment, including XenApp servers, infrasturcture servers (XMLBroker, Data Collector, and Data Store), published applications, and printing services.
Identifying the root cause and resolving application issues is best done within a framework such as thescientific method:1
1. Identify and understand the problem/question. Ask meaningful questions and state the problem orquestion in a way that it is conceivably possible to answer it. Gather relevant information to attemptto answer the question.
2. Formulate a hypothesis. Propose a solution or answer to the problem or question. State thehypothesis in a way that can be tested.
3. Test the hypothesis. Test the hypothesis before it is corroborated and given any real validity. Thereare two ways to do this: conduct an experiment and/or make further observations.
4. Collect and analyze the data. If the hypothesis fails the test, it must be rejected and eitherabandoned or modified. A modified hypothesis must be tested again. If the hypothesis passesfurther tests, it is considered to be a corroborated hypothesis, and it can now be published.
5. Make conclusions. The final step is to construct, support, or cast doubt on a theory. A scientifictheory is a unifying and self-consistent explanation of fundamental natural processes or phenomenathat is totally constructed of corroborated hypotheses.
You can use several different EdgeSight features, often the real-time features, to troubleshoot issues inXenApp environments. Because data in EdgeSight's real-time features is not averaged, this data showsresource utilization spikes, which is helpful when troubleshooting.
Depending on the scope of the problem you are troubleshooting, you may need to use multiple tools toaccomplish the task. For an overview of the full range of troubleshooting options for Citrix products, seeCitrix Technical Support Brief Troubleshooting Guide, CTX106727.
Starting Points
When beginning to troubleshoot issues, it is helpful to gather as much of the following information aspossible:1
• User ID• The permissions and policies associated with the user account

Document generated by Confluence on Nov 07, 2013 16:21 Page 51
• The user's activities before the issue occurred• If the user saw anything unusual before the issue occurred• Errors messages• If the user can reproduce the issue• If the application runs correctly when an administrator is logged into the user's console• If the user has the same issue when an ICA connection is made to a desktop
Troubleshooting Tools
EdgeSight provides two major tools for troubleshooting issues:
• User Troubleshooter. Lets you display detailed performance data for sessions across a farm for aspecified user over the last three days.
• Device Troubleshooter. Lets you display detailed real-time performance data for a device. You caneither search or browse for a device.
In addition to these generalized troubleshooting tools, EdgeSight also provides the following morespecialized tools:
• Device Trace Route. Lets you execute a trace route from the selected device to a specifiednetwork host, allowing you to identify and locate routing problems.
• Device Process List. Lets you display detailed information about processes currently running onthe selected device. This tool also lets you initiate a remote snapshot when you see the onset of aperformance problem. This feature allows you to remotely analyze the current state of the system,identify a potential problem, and capture a full set of diagnostic data that can be shared internallywith the application owner or externally with a third-party vendor to troubleshoot any potentialproblems within the application.
For usage instructions, see the EdgeSight User Guide.
Data in Real-time Troubleshooting Features
EdgeSight's Troubleshooting tools (the User Troubleshooter and Device Troubleshooter), the Real-time Excel reports in the Browse tab, and the Custom Performance Monitor Chart generate charts andreports based on real-time data. There are several important things to know about using features thatemploy real-time data:
• This data is much finer grained (5 to 15 second samples) than the historical data on the EdgeSightServer.
• Real-time data is stored in the Agent Database for three days by default.• Real-time data is raw data that it not correlated with data from other devices the way it is in the
EdgeSight Server.• Real-time reports can only provide data about one device at a time.• Users must have administrative permissions on the device from which they wish to obtain real-time
data.
Custom Counters
If troubleshooting techniques require using performance monitoring counters not included in EdgeSight,you might be able to add them. For more information, see Generating Reports for a Custom PerformanceMonitoring Counter in EdgeSight.
References
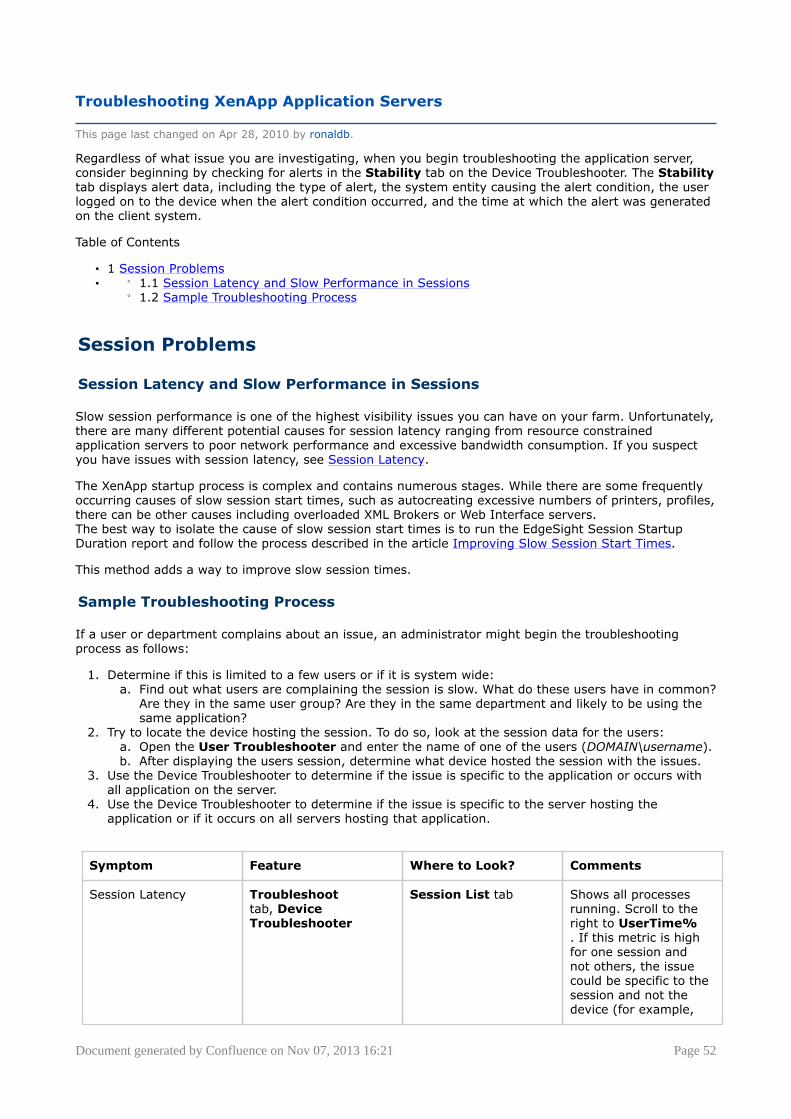
Document generated by Confluence on Nov 07, 2013 16:21 Page 52
Troubleshooting XenApp Application Servers
This page last changed on Apr 28, 2010 by ronaldb.
Regardless of what issue you are investigating, when you begin troubleshooting the application server,consider beginning by checking for alerts in the Stability tab on the Device Troubleshooter. The Stabilitytab displays alert data, including the type of alert, the system entity causing the alert condition, the userlogged on to the device when the alert condition occurred, and the time at which the alert was generatedon the client system.
Table of Contents
• 1 Session Problems• ° 1.1 Session Latency and Slow Performance in Sessions
° 1.2 Sample Troubleshooting Process
Session Problems
Session Latency and Slow Performance in Sessions
Slow session performance is one of the highest visibility issues you can have on your farm. Unfortunately,there are many different potential causes for session latency ranging from resource constrainedapplication servers to poor network performance and excessive bandwidth consumption. If you suspectyou have issues with session latency, see Session Latency.
The XenApp startup process is complex and contains numerous stages. While there are some frequentlyoccurring causes of slow session start times, such as autocreating excessive numbers of printers, profiles,there can be other causes including overloaded XML Brokers or Web Interface servers.The best way to isolate the cause of slow session start times is to run the EdgeSight Session StartupDuration report and follow the process described in the article Improving Slow Session Start Times.
This method adds a way to improve slow session times.
Sample Troubleshooting Process
If a user or department complains about an issue, an administrator might begin the troubleshootingprocess as follows:
1. Determine if this is limited to a few users or if it is system wide:a. Find out what users are complaining the session is slow. What do these users have in common?
Are they in the same user group? Are they in the same department and likely to be using thesame application?
2. Try to locate the device hosting the session. To do so, look at the session data for the users:a. Open the User Troubleshooter and enter the name of one of the users (DOMAIN\username).b. After displaying the users session, determine what device hosted the session with the issues.
3. Use the Device Troubleshooter to determine if the issue is specific to the application or occurs withall application on the server.
4. Use the Device Troubleshooter to determine if the issue is specific to the server hosting theapplication or if it occurs on all servers hosting that application.
Symptom Feature Where to Look? Comments
Session Latency Troubleshoottab, DeviceTroubleshooter
Session List tab Shows all processesrunning. Scroll to theright to UserTime%. If this metric is highfor one session andnot others, the issuecould be specific to thesession and not thedevice (for example,
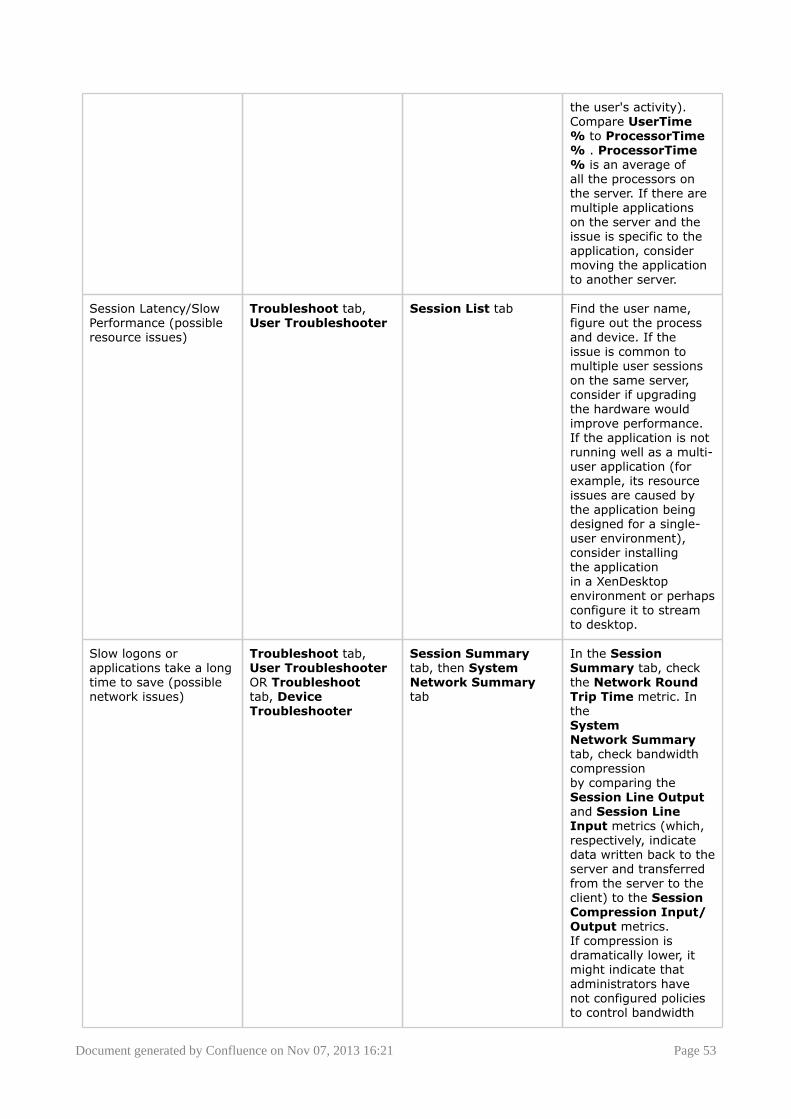
Document generated by Confluence on Nov 07, 2013 16:21 Page 53
the user's activity).Compare UserTime% to ProcessorTime% . ProcessorTime% is an average ofall the processors onthe server. If there aremultiple applicationson the server and theissue is specific to theapplication, considermoving the applicationto another server.
Session Latency/SlowPerformance (possibleresource issues)
Troubleshoot tab,User Troubleshooter
Session List tab Find the user name,figure out the processand device. If theissue is common tomultiple user sessionson the same server,consider if upgradingthe hardware wouldimprove performance.If the application is notrunning well as a multi-user application (forexample, its resourceissues are caused bythe application beingdesigned for a single-user environment),consider installingthe applicationin a XenDesktopenvironment or perhapsconfigure it to streamto desktop.
Slow logons orapplications take a longtime to save (possiblenetwork issues)
Troubleshoot tab,User TroubleshooterOR Troubleshoottab, DeviceTroubleshooter
Session Summarytab, then SystemNetwork Summarytab
In the SessionSummary tab, checkthe Network RoundTrip Time metric. IntheSystemNetwork Summarytab, check bandwidthcompressionby comparing theSession Line Outputand Session LineInput metrics (which,respectively, indicatedata written back to theserver and transferredfrom the server to theclient) to the SessionCompression Input/Output metrics.If compression isdramatically lower, itmight indicate thatadministrators havenot configured policiesto control bandwidth
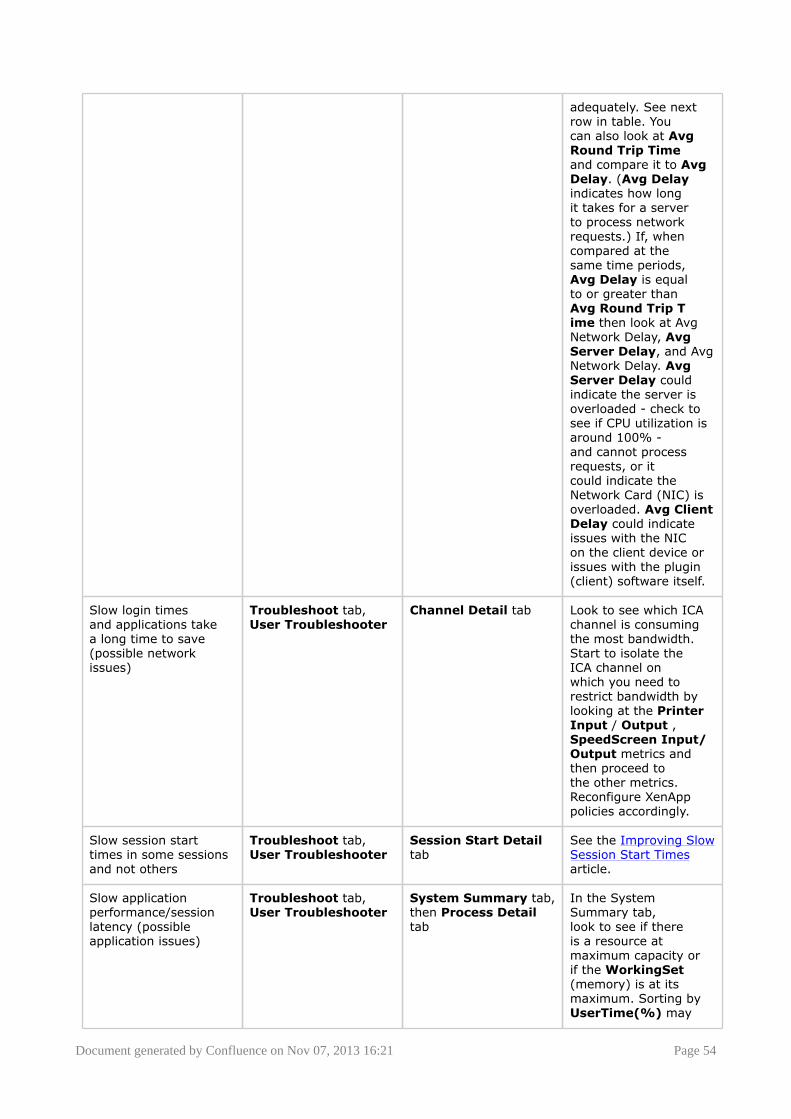
Document generated by Confluence on Nov 07, 2013 16:21 Page 54
adequately. See nextrow in table. Youcan also look at AvgRound Trip Timeand compare it to AvgDelay. (Avg Delayindicates how longit takes for a serverto process networkrequests.) If, whencompared at thesame time periods,Avg Delay is equalto or greater thanAvg Round Trip Time then look at AvgNetwork Delay, AvgServer Delay, and AvgNetwork Delay. AvgServer Delay couldindicate the server isoverloaded - check tosee if CPU utilization isaround 100% -and cannot processrequests, or itcould indicate theNetwork Card (NIC) isoverloaded. Avg ClientDelay could indicateissues with the NICon the client device orissues with the plugin(client) software itself.
Slow login timesand applications takea long time to save(possible networkissues)
Troubleshoot tab,User Troubleshooter
Channel Detail tab Look to see which ICAchannel is consumingthe most bandwidth.Start to isolate theICA channel onwhich you need torestrict bandwidth bylooking at the PrinterInput / Output ,SpeedScreen Input/Output metrics andthen proceed tothe other metrics.Reconfigure XenApppolicies accordingly.
Slow session starttimes in some sessionsand not others
Troubleshoot tab,User Troubleshooter
Session Start Detailtab
See the Improving SlowSession Start Timesarticle.
Slow applicationperformance/sessionlatency (possibleapplication issues)
Troubleshoot tab,User Troubleshooter
System Summary tab,then Process Detailtab
In the SystemSummary tab,look to see if thereis a resource atmaximum capacity orif the WorkingSet(memory) is at itsmaximum. Sorting byUserTime(%) may

Document generated by Confluence on Nov 07, 2013 16:21 Page 55
be helpful. Look tosee which process isconsuming the mostresources
Session hangs Troubleshoot tab,User Troubleshooter
Stability tab Look for applicationerrors.
Document generated by Confluence on Nov 07, 2013 16:21 Page 56
Troubleshooting XenApp Application Issues
This page last changed on Nov 11, 2009 by sarahv.
This article discusses ways to use EdgeSight to troubleshoot issues with applications published onXenApp.
Table of Contents
• 1 Overview• 2 Application Testing and Deployment• 3 Application Alerts• 4 Monitoring Applications and Troubleshooting Application Issues• 5 Applicable Versions
Overview
Users running applications through XenApp often call the help desk to report that their application hascrashed, is slow, or that they received a cryptic error message. Sometimes these events occur severaltimes before a user finally becomes frustrated and reports the problem.
Citrix administrators used to rely on users to report these issues, requiring the user to accuratelydescribe the conditions when the error or crash occurred as well as the complete error message. Inaddition, administrators were often charged with trying to re-create this error or crash so they canforward the appropriate information to either a developer or a vendor.
The EdgeSight Agent running on a XenApp server monitors process availability and performance. Forexample, the agent creates a standard mini-dump file for any published application that crashes, whetherthe application was developed in-house or by a third party. These mini-dump files contain a complete setof information that an application developer can use to investigate the issue. Note that in some cases,the nature of the crash prevents system context data from being collected, but an application fault alertis still generated.) In the case of an application error, the complete error text is captured along with theexact time it occurred.
As a result, administrators no longer need users to report these issues or hope they can re-create anapplication issue in an environment where EdgeSight has been deployed.
In many organizations, there is often one person in charge of supporting an application. It is possible toidentify a particular process and get a performance summary for a particular application.
One of the ways to minimize the impact of application issues is to proactively monitor applicationperformance. EdgeSight provides historical reports that tell people "how application X performed lastweek." You can set up a subscription so the report is emailed to an application analyst or group ofadministrators on a regularly scheduled basis. In many cases, reports on application errors or highresource usage by an application can help you proactively identify a problem application before a crashoccurs.
EdgeSight also provides real-time reports, monitors, and troubleshooters which allow you to displaydetailed information about an application- or session-related alert.
Application Testing and Deployment
Many application issues can be avoided, or at least caught before they affect a production environment,by solid application testing and a careful deployment strategy. Use the Web to search for knownapplication compatibility issues prior to deployment. Consider using the Microsoft ApplicationCompatibility Toolkit to identify the root cause of application issues concerning INI files and registrysettings. See the Citrix XenApp Installation Guide for best practice information on assessing applicationsfor XenApp compatibility, evaluating application delivery methods, and locating applications on servers.
Document generated by Confluence on Nov 07, 2013 16:21 Page 57
Application Alerts
The unique alerting functionality of EdgeSight can notify administrators in real time when an applicationevent has occurred, such as alert errors driven by exact error messages, high resource usage by anapplication, or a non-responsive process. These alerts can trigger email notifications, can be sent to third-party consoles that accept Simple Network Management Protocol (SNMP) traps, or as of EdgeSight forXenApp 5.2, can be sent to Microsoft® System Center Operations Manager.
Monitoring Applications and TroubleshootingApplication Issues
See the following topics for more information on proactively monitoring applications and troubleshootingapplications when problems occur.
• Application Performance Factors• Monitoring Applications Proactively• Application Issue Troubleshooting• Real Time Troubleshooting of Application Issues
Applicable Versions
• EdgeSight 5.2• EdgeSight 5.1• EdgeSight 5.0
Document generated by Confluence on Nov 07, 2013 16:21 Page 58
Application Performance Factors
This page last changed on Apr 27, 2010 by ronaldb.
Before troubleshooting applications, it is important to know what an application issue looks like andwhat can affect application performance. Application issues can show up as one or more of the followingsymptoms:
• The application fails to start or initialize• That application does not behave correctly or normally• The application and/or application server crashes• Poor application and/or application server performance is observed• Disconnected ICA sessions occur• Slow ICA sessions are observed
There are many factors that impact application performance, including system resources, networkbandwidth, and application compatibility issues. The following are some of the more common causes ofpoor application performance on a farm.
Too many user connections or application requests: Too many user connections to a particularapplication server or too many requests to the server from other applications can cause slow responsetimes. Use the Process Usage report, filtered for the application and the server, to show the number ofunique users connecting to the application. In the case of too many requests from other applications,the cause of the slowdown is often insufficent memory or CPU resources. Use the System CPU and theSystem Memory Usage reports to investigate these situations.
Insufficient bandwidth: Incorrect printing design, such as printing traffic that uses the network printingmodel that goes from the XenApp server across the WAN to the print server and then to the printer. Ifthere are no XenApp policies set to limit printing bandwidth, other traffic on the WAN is compromised.Effectively, without setting either the XenApp Session Limits > Printer or Session Limits > Printer (%)policies, print jobs can consume as much WAN bandwidth as they want. This negatively impacts othertraffic that crosses the WAN, including ICA traffic, and this has a severe impact on users. To determineif bandwidth is actually the issue, you may want to try running the application from another location.For example, if the problem is occurring when the application is run over the WAN, try running it overanother WAN or over the LAN to see if there is a difference in performance.
To determine how much bandwidth your XenApp printing traffic is consumming, run the ICA Printer I/O report. If the application makes havy use of audio or video, run the ICA Audio I/O and ICA Video I/O reports. You can also display peak and average overall bandwidth used by a session by running theSession Network Bandwidth Used report.
Local latency: Local latency if often due to slow processing of reads and writes by the databaseserver. Areas to investigate include CPU and memory usage, on both the application server and thedatabase server, as well as database size. Use the System CPU and the System Memory Usage reports toinvestigate these situations. It may also be helpful to verify that regular database maintenance has beentaking place.
Traffic bottlenecks: Traffic bottlenecks can occur because one or more applications on a server has ahigh CPU usage. Run the Process CPU report, filtered by device, to see which processes are using themost CPU on the server. It may also be helpful to run the Process Thread Count report, filtered by processand device, to see the average thread count for the process.
Slow request processing: In some cases, applications that were not written with Terminal Services inmind may have problems running in a multi-user environment, resulting in slow request processing. Sincethese type of applications will perform poorly in both ICA and RDP sessions, try running the application inan RDP session and compare the performance.
For more ideas about using EdgeSight reports to detect application issues before they become critical, seeMonitoring Applications Proactively.

Document generated by Confluence on Nov 07, 2013 16:21 Page 59
Monitoring Applications Proactively
This page last changed on Nov 04, 2009 by ronaldb.
The historical reports provided by EdgeSight allow you to identify process performance trends overtime and, used in conjunction with your system baseline data, allow you to measure performanceimprovement or degradation.
Monitoring Overall Performance with Historical Reports
The Process Performance Summary by Process report can help you proactively identify application issuesbefore they become critical.
1. You can display this report or deliver it to subscribers on a regular basis, filtering the report by theDepartment or Group containing the XenApp servers you are interested in.
2. If the report shows abnormally high CPU or process memory usage, or a long network delay, youmay want to investigate further. For example, if the process memory usage is significantly above thebaseline value, click on that subreport to display the Process Memory Usage report.
3. You can drill down by expanding report rows to show process memory usage related to the specificdevice and user.
Once you have identified a problem application, you may want to find out if this is a one-time situation oran ongoing issue. For example, if you expand the timeframe of the report, use the Optional Parameters toselect the specific application, and sort by date, you can quickly identify past spikes in memory usage.
Monitoring Process Stability
Another way look at applications is by how stable they are, based on the number of errors, hangs, weberrors, and faults encountered. In many cases, application faults (crashes) are preceded by an increasednumber of more application errors or hangs.
Use the Process Stability Summary by Process report to display which applications are experiencing themost issues. Click on any of the charts to display more details about a specific type of problem and drilldown to show the device and user associated with the error.
The data in the process stability reports is based on conditions detected by the EdgeSight Agent installedon the XenApp Server. The agent determines a message box to be a notification of an applicationerror if the message box contains an error icon or the text of the message box contains one or moreof the following error keywords: error, unable, fail*, unsuccessful, unexpected, bad, fault, invalid,illegal, denied, not valid, exception, or memory. EdgeSight software uses the Windows API (theIsHangAppWindow call) to determine if an application is not responding. An application is consideredto be not responding if it is not waiting for input, is not in startup processing, and has not called thePeekMessage function within the internal timeout period of 5000 milliseconds (5 seconds).
Monitoring Network Performance for a Process
Understanding the network metrics EdgeSight provides is a key concept and something that can quicklyindicate where a problem might be.
For example, you run the Process Network Delay report, filtered for a critical process. The report showsa large amount of server delay. Server delay is the amount of network delay that is caused by waitingfor the server or back end application to respond to our requests. For example, the spike might havebeen caused that day by a back-end server going down or an unusual number of users accessing theapplication.
By looking at this report, it is possible to tell that it is not a network problem because the network-onlyportion of the delay is well within normal values. If the network portion of the delay was high, it wouldbe possible to deduce that the connection from the XenApp server to the application had some issues.For example, maybe the server and the streaming file share are in different data centers and there waslatency over the connection.
Document generated by Confluence on Nov 07, 2013 16:21 Page 60
You may want to correlate the network delay information with the network volume for the same processat the same time to see if the delay amy be caused by large amounts of data being sent or recieved. Usethe Process Network Volume report to display sent, received, and total network volume.
Some network problems can show up as application errors or faults, such as when an application fails tostart properly, or fails to connect to a required component. Applications may fail to connect to a remotecomponent causing it to terminate during the startup process or malfunction during run-time. Invalidhostnames, IP addresses, and/or port numbers may cause these issues. Applications may also fail toconnect to remote components when firewalls and routers are incorrectly configured for the applications.Some applications require specific ports to be opened on the firewall. In some cases, the router may nothave the information to correctly route a connection request to the application's remote component.
Next Steps
Once you have identified an application issue, you'll need to troubleshoot it to determine the root cause.Application Issue Troubleshooting provides a framework for troubleshooting applications. When youstart actively troubleshooting application issues, you'll want to look beyond the historical reports tothe real-time data provided by the troubleshooters and rea;-time reports, as described in Real TimeTroubleshooting of Application Issues.
Document generated by Confluence on Nov 07, 2013 16:21 Page 61
Application Issue Troubleshooting
This page last changed on Nov 09, 2009 by ronaldb.
In troubleshooting application issues in XenApp environments, these general steps apply. The appplicationissue and its system context must be evaluated. The behavior of the application and the associatedenvironment must be analyzed to highlight the symptoms of the issue. Based on gathered information,multiple hypotheses can be formulated and test cases can be developed to validate that one or moreof the hypotheses are correct. Once hypotheses are proven to be true, workarounds or solutions canbe developed to resolve the issue. EdgeSight helps you understand the problem and isolate symptoms,gather system context data, and monitor application performance when testing hypotheses.
When applications are running in a Terminal Services environment, you need to know under whatconditions the application will run and under what conditions iwill fail. Here are some basic questions toask concerning the application and your environment:
• Does the application run when the user is logged onto the server console? Rights issues can beuncovered by atempting to run the application from an administor account and a user-class account.
• Does the application run when a user is logged on to an RDP desktop session? This can help isolateproblems that only occur on ICA sessions.
• Does the application write information to the C drive? Poor network performance may affectapppllications which frequently attempt to write to the client's C drive. Failures may also occur ifdrivew mapping is disabled.
• Can the application be executed from the command line or through a batch file?• Can the application be run in a fixed window size or seamless window?
For more information about troubleshooting applications in a Terminal Services environment, see How toEffectively Troubleshoot Application Integration Issues at http://support.citrix.com/article/CTX101709.
One of the things you should know when you start troubleshooting an application is what recent changeshave occurred on the XenApp server. Run the Asset Changes report filtered by the device. Have therebeen any changes in hardware or registry settings? Also, run the New Processes report for the device.Have any new applications been installed recently, especially new versions or hotfixes for the targetapplication or similar applications?
If you are troubleshooting an application issue that occurred recently, you can get detailed data fromreal-time reports and troubleshooters as described in Real Time Troubleshooting of Application Issues.
Document generated by Confluence on Nov 07, 2013 16:21 Page 62
Real Time Troubleshooting of Application Issues
This page last changed on Nov 04, 2009 by ronaldb.
If you are investigating a current or recent application issue, you can use the real-time monitoringcapabilities of EdgeSight to troubleshoot the situation. The specific monitoring tool you use may dependon how you're notified of the issue and how you choose to investigate the cause.
Remote access to information stored in the the EdgeSight Agent database has some requirements thatmust be met:
• Downloaded controls may be required - You will be prompted to download controls when initiallyusing monitoring or troubleshooting tools. Ensure that your browser settings will allow you toperform downloads.
• Administrative privileges - Because you are directly accessing the EdgeSight Agent database,administrative privileges are required on the device you are accessing.
To troubleshoot using... Use... Timeframe
Real-time alert context data Monitor > Farm MonitorNote that no data is displayed inthe monitor unless an alert hasbeen triggered on the agent.
Up to 6 hours
User session data Troubleshoot > UserTroubleshooter
Up to 3 days
Device performance data Troubleshoot > DeviceTroubleshooter
Up to 3 days
Troubleshooting Using the Farm Monitor
The Farm Monitor displays not only alerts occurring on the farm, but the system context at the time thealert occurred and at the current time. This context data includes information about processes, systemresourced and performance, session performance, and network performance.
Note that the tabs displayed in the Farm Monitor depend on the type of alert being displayed. Forexample, the Process tab is only displayed for a process alert (such as Application Error, Process Fault,or Thrashing Application). If the alert is triggered by system, generic XenApp or network condition,the Process tab is not displayed. If the alert is related to a specific XenApp session (such as DominantSession or Disconnected Session), the Session tab is displayed.
You can quickly identfy farms and XenApp machines which have encountered alertconditions by looking for the addition of the error symbol to the farm or server icon:
Clustering of alerts may indicate a system-wide problem. For example, if multiple applications on a serverare encountering high CPU usage in a short space of time, looking at processor-related metrics would bea logical starting place.
When you click on a specific alert, data is retrieved from the EdgeSight Agent database.You can step through the tabs to display different sets of data and gain insight into the possible rootcause of the problem:
• Process: This tab shows performance data for the process that is the source of the alert. Are therespikes in resource usage or network traffic prior to the alert being triggered? Are there spikes justafter the alert? Did resource usage and network traffic levels return to normal?
• Session: This tab shows performance data for the session that is the source of the alert. Are therespikes in round trip time or bandwidth prior to the alert being triggered? Are there spikes just afterthe alert? Did round trip time or bandwidth levels return to normal?also, what resource usage was associated with the session?
Document generated by Confluence on Nov 07, 2013 16:21 Page 63
• System: This tab shows performance data for the system hosting the application. Are there system-wide performance issues which could cause the application problem?
• Process Summary: This tab shows performance data for all applications running on the system.How does the performance of the target application compare to similar or related applications? Areother applications experiencing performance issues at the same time as the target application?
• Session Summary: This tab shows performance data for active sessions. Is the session associatedwith the problem application showing high resource usage? Is the session round trip time high? Wasthere a spike in input or output bandwidth at the time of the alert?
• Network Summary: This tab shows network performance data. Is there significant network delaywhich could contribute to the application issue? Is the delay on the server or on the client? Is thevolume of network traffic unusally high at the time of the alert? Were there an increased number ofnetwork errors at the time of the alert?
Once you have identified an area of concern, you may want to display more fine-grained data. Click onthe menu icon for the alert and select Alert Excel Sheet to display a report in Microsoft Excel. If the issueis an application hang, here are some possible indicators of the root cause. You may see the Disk queuelength (Disk Q Len) spike at the time of the alert being triggered. This may indicate that the disk could bethe cause of the contention. You may see the network throughput is low before the alert and then jumpsafter the alert. This may indicate that an initiated request was waiting on a backend server to respond.If this is the case, double click a data point in the Network chart to display the real-time network data tosee which ports and hosts were being used at the time of the alert.
Using the User and Device Troubleshooters
The process for investigating issues using the User and Device Troubleshooters is similar to the wayyou use the Farm Monitor. With the troubleshooters, you are able to access data for the last threedays and data can be displayed at any time, not just when an alert condition has occured. Whichtroubleshooter you use may depend on whether the application issue is associated with a specific usersession (User Troubleshooter), or whether the issue is associated with a specific XenApp server (DeviceTroubleshooter). Also, don't ignore the possibility that a user-reported application issue may be theresult of a problem on the user's device and not on the XenApp server. If the reported problem is notapparent when looking at the session or XenApp server data, use the Device Troubleshooter to look at theperformance metrics for the user's system.
Troubleshooting Using Snapshots
Another tool to use in investigating application issues is the snapshot. EdgeSight allows you to initiate aremote snapshot from the Device Process List when you see the onset of a performance problem. Thisfeature allows you to remotely analyze the current state of the system, identify a potential problem, andcapture a full set of diagnostic data that can be shared internally with the application owner or externallywith a third-party vendor to troubleshoot any potential problems within the application. In most cases,you will generate a Normal snapshot. Keep in mind that selecting Full generates a full process dump,which is as large as the selected process. Full snapshots consume system resources and may result in adiscernable impact on system performance.

Document generated by Confluence on Nov 07, 2013 16:21 Page 64
Troubleshooting Devices
This page last changed on Nov 10, 2009 by ronaldb.
Even when you know what device is causing problems in your environment, it still might be difficult topinpoint the problem with the device. This topic provides suggestions for ways to troubleshoot XenAppapplication and infrastructure servers.
Sample Process: Troubleshooting Resource Utilization
When troubleshooting using the EdgeSight Troubleshooters, many let you drill down into additionaldetail. For example, if you suspect that resource utilization is high on a particular device, you can do thefollowing:1. Select the device in the Device Troubleshooter and display data for the device.
2. In the Device Details view, click the System Summary tab, scan the graphs for the counters,looking for the ones with the highest counts (typically represented by a straight line across the top of thegraph). In this example, Total Processor Time is high.
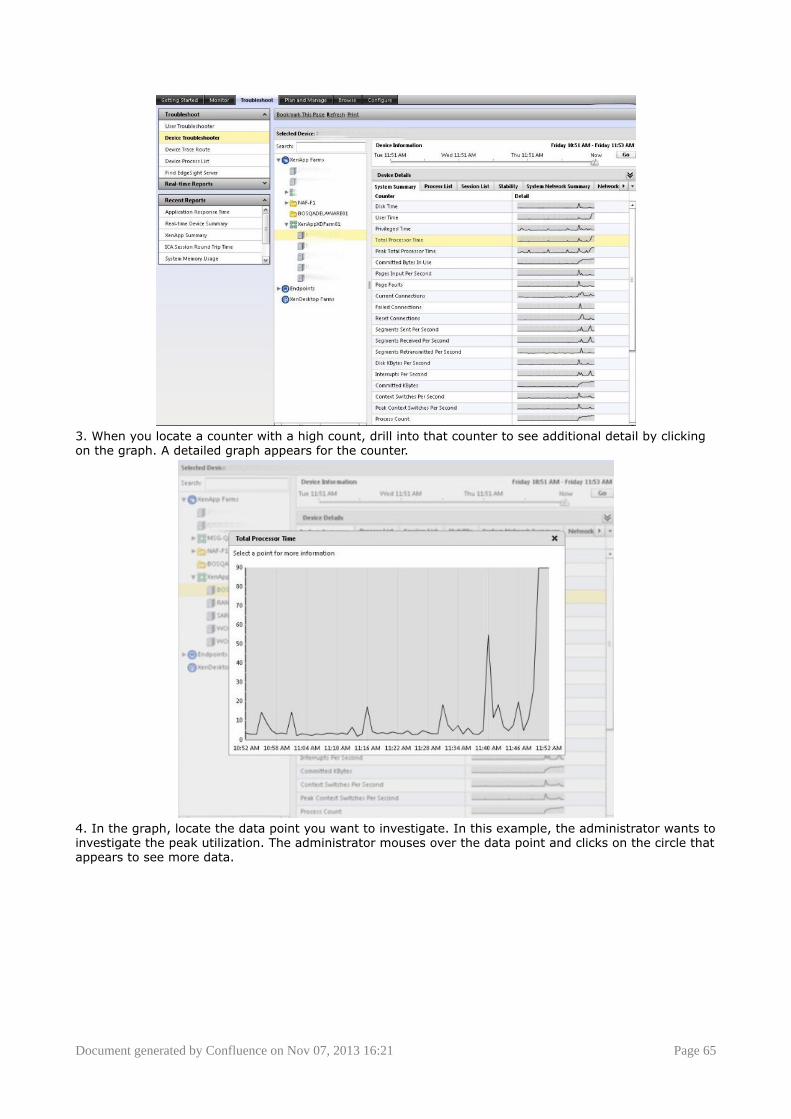
Document generated by Confluence on Nov 07, 2013 16:21 Page 65
3. When you locate a counter with a high count, drill into that counter to see additional detail by clickingon the graph. A detailed graph appears for the counter.
4. In the graph, locate the data point you want to investigate. In this example, the administrator wants toinvestigate the peak utilization. The administrator mouses over the data point and clicks on the circle thatappears to see more data.
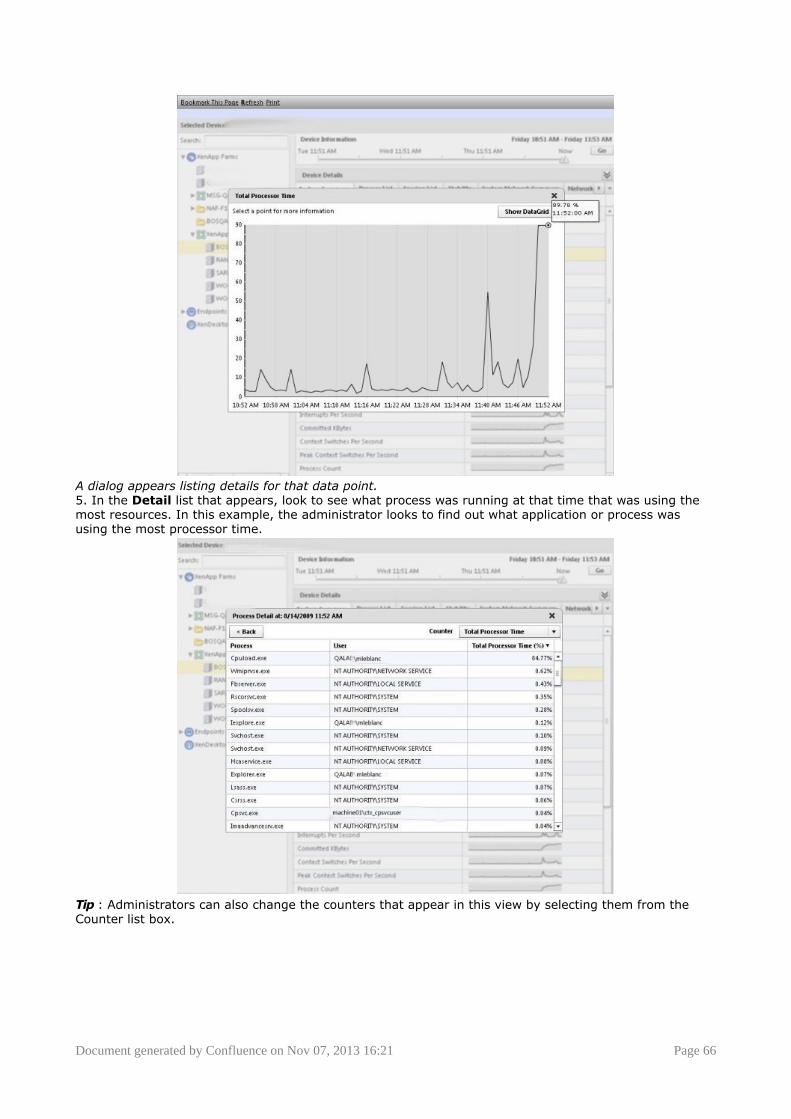
Document generated by Confluence on Nov 07, 2013 16:21 Page 66
A dialog appears listing details for that data point.5. In the Detail list that appears, look to see what process was running at that time that was using themost resources. In this example, the administrator looks to find out what application or process wasusing the most processor time.
Tip : Administrators can also change the counters that appear in this view by selecting them from theCounter list box.
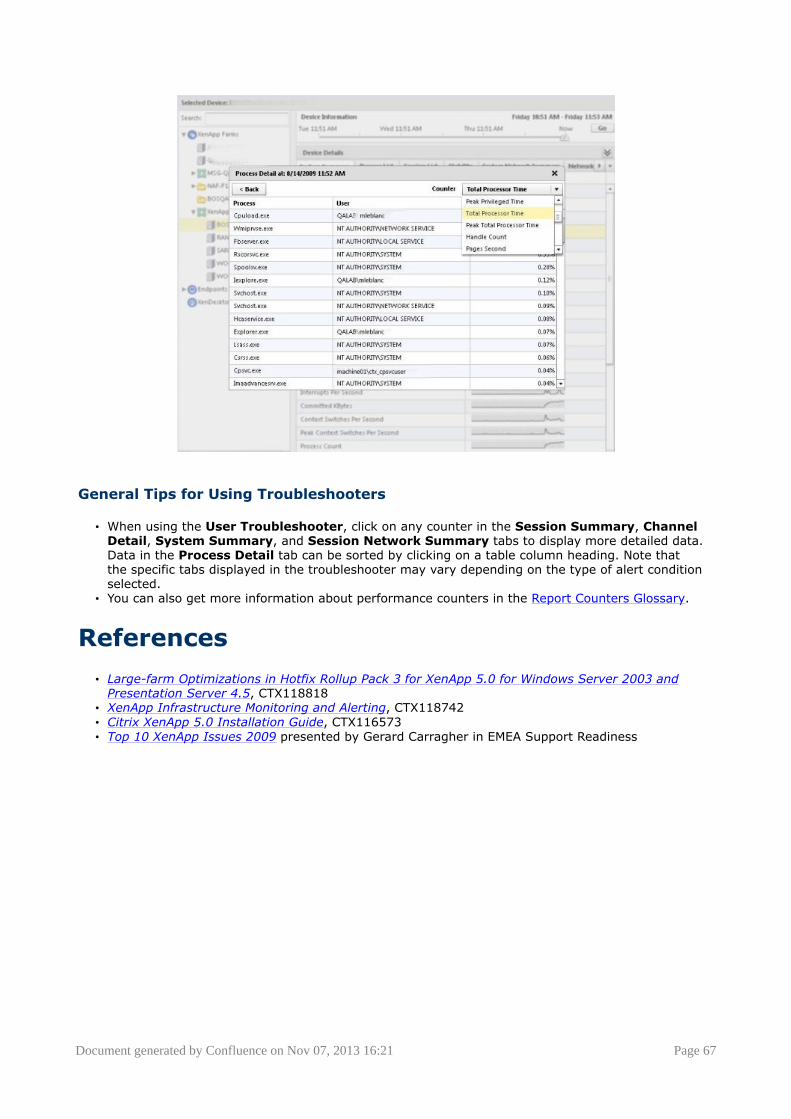
Document generated by Confluence on Nov 07, 2013 16:21 Page 67
General Tips for Using Troubleshooters
• When using the User Troubleshooter, click on any counter in the Session Summary, ChannelDetail, System Summary, and Session Network Summary tabs to display more detailed data.Data in the Process Detail tab can be sorted by clicking on a table column heading. Note thatthe specific tabs displayed in the troubleshooter may vary depending on the type of alert conditionselected.
• You can also get more information about performance counters in the Report Counters Glossary.
References
• Large-farm Optimizations in Hotfix Rollup Pack 3 for XenApp 5.0 for Windows Server 2003 andPresentation Server 4.5, CTX118818
• XenApp Infrastructure Monitoring and Alerting, CTX118742• Citrix XenApp 5.0 Installation Guide, CTX116573• Top 10 XenApp Issues 2009 presented by Gerard Carragher in EMEA Support Readiness
Document generated by Confluence on Nov 07, 2013 16:21 Page 68
Troubleshooting XenApp Infrastructure Servers
This page last changed on Nov 11, 2009 by sarahv.
In some ways, monitoring the farm's infrastructure servers is arguably more important than monitoringindividual application servers. An application server failure will only make one application unavailable.Issues on an infrastructure server could make the entire farm unavailable.
Table of Contents
• 1 Troubleshooting the XML Broker• 2 Troubleshooting the Data Collector• ° 2.1 Election Storms
° 2.2 Application Launch (Enumeration) Delays• 3 Troubleshooting the Data Store• ° 3.1 Troubleshooting a SQL Server Data Store• 4 Troubleshooting Service Packs, Hotfixes, and Other Changes to Servers• 5 References
Troubleshooting the XML Broker
Initial Symptoms : If the XML Broker is overloaded, users will not be able to enumerate theirapplications. That is, when they logon to the Web Interface or the XenApp plugin (formerly known asProgram Neighborhood Agent), it will take a long time for their applications set to appear. Also, it will takea long time for the application to start up. (This is because the XML server is taking a long time to findthe appropriate server to let the user session to which to connect, even if the application server is healthyand running successfully.)
Metric Device Displayed Location Comment
Application Resolutions/sec
XML Broker Custom PerformanceCounters Chart
Compare this with thevalue you recordedfor your baseline tosee if the number ofapplication resolutions/sec has slowed. If ithas slowed, this mayindicateyou need to increasethe computer power forthe XML Broker, eitherby adding another XMLBroker to the farm or
Number of busy XMLthreads
XML Broker Custom PerformanceCounters Chart
If this counter exceeds16 for 1 minute orlonger *, it indicatesXML threads are waitingto be processed . (Themaximum number ofrequests that the XMLservice can process atany one time is 16. )
Resolution WorkItemQueue Ready Count
XML Broker Custom PerformanceCounters Chart
If this counter issustainedabove 0 for 1 minute*, it indicates there arean excessive number ofwork items (related toapplication launches)
Document generated by Confluence on Nov 07, 2013 16:21 Page 69
that are waiting for IMAto process
WorkItem Queue ReadyCount
XML Broker Custom PerformanceCounters Chart
If this counter issustainedabove 0 for 1 minute*, it indicates there arean excessive number ofwork items (related toapplication launches)that are waiting for IMAto process
Troubleshooting the Data Collector
Election Storms
Initial Symptom: Excessive data collector election storms.
Metric Device Displayed Location Comment
Zone ElectionsTriggered
Any application serverthat repeatedly winsdata collector electionsduring election storms.Note: This metric canappear on any XenAppserver, not just serversset to be backup datacollectors.
Custom PerformanceCounters Chart
This counter shouldnot increase by morethan 2 in one hour.This counter helpsdetermine if a specificserver is triggeringthe election storms.This counter indicatesthe amount of timesthis server has calledfor an election. Thiscounter is incrementedregardless of whetheror a not a new ZoneData Collector waselected. NOTE: Thiscounter is added withHotfix Rollup Pack 3for Presentation Server4.5.
Application Launch (Enumeration) Delays
Initial Symptoms: If users find it slow to connect to their applications, check to see if the data collectoris overloaded. Specifically, when users launch an application (that is, for example, click the link to theapplication in Web Interface), it will take a long time for the ICA file to download when launching theapplication or they may receive an error message stating the application cannot be launched. When adata collector is overloaded, it struggles to resolve the application and users will find it hard to connect totheir applications.
Metric Device EdgeSight DisplayedLocation
Comment
Resolution WorkItemQueue Ready Count
Data Collectorsand backup DataCollectors*
Custom PerformanceCounters Chart
Indicates the numberof resolution workitems that are ready
Document generated by Confluence on Nov 07, 2013 16:21 Page 70
to be executed. If thiscounter is sustainedabove 0 for 1 minute,it indicates thereare an excessivenumber of work items(related to applicationlaunches) waiting forIMA to process.
WorkItem QueueReady Count
Data Collectorsand backup DataCollectors*
Custom PerformanceCounters Chart
Indicates the numberof work items that areready to be executed.If this counter issustained above0 for 1 minute, itindicates there arean excessive numberof work items (notrelated to applicationlaunches) waiting forIMA to process.
*Backup data collectors are any XenApp servers with election preferences set to Most Preferred orPreferred.
Troubleshooting the Data Store
In environments that are having problems with data store performance, you can generate a reportshowing how frequently a server cannot reach the data store. To do so, you must add a customPerformance Monitoring counter (Data Store Connection Failure) found on XenApp servers to EdgeSightas a custom counter. To display this counter, you must generate it in a Custom Performance MonitoringCounters Chart specifying a XenApp server you suspect was disconnected from the data store as thedevice. This can be helpful in two circumstances:
1. You suspect a specific server is not connecting to the data store.2. Many servers cannot connect to the data store (that is, the data store is offline) and you select one
server to represent the total amount of time the data store was offline.
Metric Device EdgeSight DisplayedLocation
Comment
Data StoreConnection Failure
Any XenApp server Custom PerformanceCounters Chart
Check this metric tosee how long the datastore has been offline.This counter displaysthe number of minutesXenApp hasbeen disconnected fromthe data store. Its valueis zero under normaloperatingconditions.
Troubleshooting a SQL Server Data Store
If the data store is running on SQL Server, administrators can also use SQL Server-specific PerformanceMonitor counters to evaluate data store health. To do so, install the EdgeSight agent for endpoints on thedata store and configure EdgeSight to monitor the data store as an endpoint.
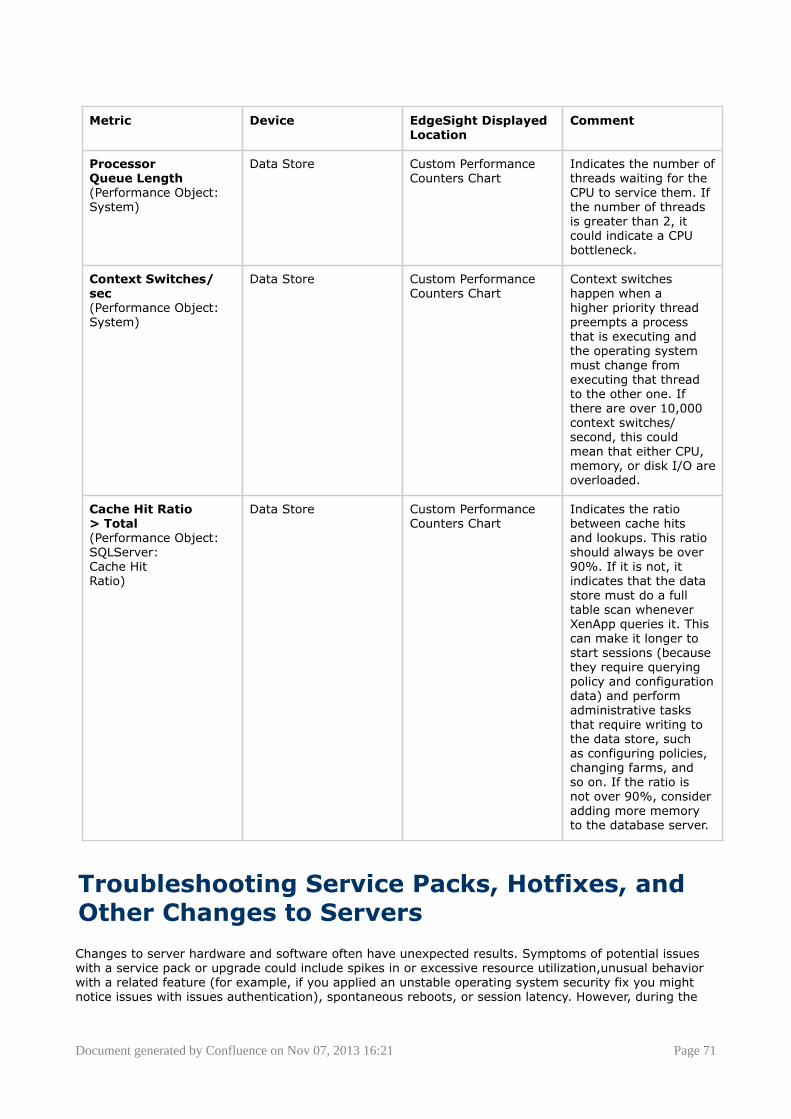
Document generated by Confluence on Nov 07, 2013 16:21 Page 71
Metric Device EdgeSight DisplayedLocation
Comment
ProcessorQueue Length(Performance Object:System)
Data Store Custom PerformanceCounters Chart
Indicates the number ofthreads waiting for theCPU to service them. Ifthe number of threadsis greater than 2, itcould indicate a CPUbottleneck.
Context Switches/sec(Performance Object:System)
Data Store Custom PerformanceCounters Chart
Context switcheshappen when ahigher priority threadpreempts a processthat is executing andthe operating systemmust change fromexecuting that threadto the other one. Ifthere are over 10,000context switches/second, this couldmean that either CPU,memory, or disk I/O areoverloaded.
Cache Hit Ratio> Total(Performance Object:SQLServer:Cache HitRatio)
Data Store Custom PerformanceCounters Chart
Indicates the ratiobetween cache hitsand lookups. This ratioshould always be over90%. If it is not, itindicates that the datastore must do a fulltable scan wheneverXenApp queries it. Thiscan make it longer tostart sessions (becausethey require queryingpolicy and configurationdata) and performadministrative tasksthat require writing tothe data store, suchas configuring policies,changing farms, andso on. If the ratio isnot over 90%, consideradding more memoryto the database server.
Troubleshooting Service Packs, Hotfixes, andOther Changes to Servers
Changes to server hardware and software often have unexpected results. Symptoms of potential issueswith a service pack or upgrade could include spikes in or excessive resource utilization,unusual behaviorwith a related feature (for example, if you applied an unstable operating system security fix you mightnotice issues with issues authentication), spontaneous reboots, or session latency. However, during the
Document generated by Confluence on Nov 07, 2013 16:21 Page 72
troubleshooting process,it can be difficult to pinpoint issues or even determine if changes were made to aserver.
You can use the Software Asset Changes or the Hardware Asset Changes report, specifying theserver as the Device in the Optional Parameters , to see if another administrator made changes to thesoftware or hardware on the server you are trying to troubleshoot.
You may also want to look at the New Processes report, filtered for the specific device. Sometimes anapplication conflict can affect system performance, and if the onset of performance issues coincides withthe use of a new application, this may provide an area for investigation.
If you suspect a hotfix or update may be the reason your server is performing badly, consider runningthe Process Stability Summary by Process report for reducing crashes and hangs on the upgradedservers as a group. You can either manually create a group of servers before you apply a hotfix or useReporting Services to do so, as described in How Group and Department Structure Impact Reporting. Infact, before applying a hotfix, administrators may, as a routine best practice, want to create groups forthe hotfixed serves and then delete the groups once they are sure the hotfix is performing acceptably.
To determine what servers have hotfixes applied to them, use the Hotfix Management tool in the AccessManagement Console.
References
• Large-farm Optimizations in Hotfix Rollup Pack 3 for XenApp 5.0 for Windows Server 2003 andPresentation Server 4.5, CTX118818
• XenApp Infrastructure Monitoring and Alerting, CTX118742• Citrix XenApp 5.0 Installation Guide, CTX116573• Top 10 XenApp Issues 2009 presented by Gerard Carragher in EMEA Support Readiness http://
community.citrix.com/blogs/citrite/richcr/2009/07/10/Top+10+XenApp+Issues+2009+presented+by+Gerard+Carragher

Document generated by Confluence on Nov 07, 2013 16:21 Page 73
Plan and Manage
This page last changed on Mar 31, 2010 by normanw1.
• What is Happening in My Environment?• XenApp Server Health• Generating EdgeSight Reports for Management

Document generated by Confluence on Nov 07, 2013 16:21 Page 74
What is Happening in My Environment?
This page last changed on Nov 11, 2009 by sarahv.
When you are monitoring your network on a day-to-day basis, you might have specific questions abouthow your Citrix environment is performing and if anything has changed. You also might want to knowthe amount of time users spend using instant messaging (or "chatting") and if they tried to access illicitWeb sites. This article provides suggestions for using EdgeSight to find out what is happening in yourenvironment.
The following topics provide answers to certain facets of these questions:
• Finding Information about the Clients in Your Environment• Detecting General Changes• Using the Dashboard and Reports for an Environmental Overview• What's Happening on My Network?• What's Happening On My Servers?• What Are Users Up To?
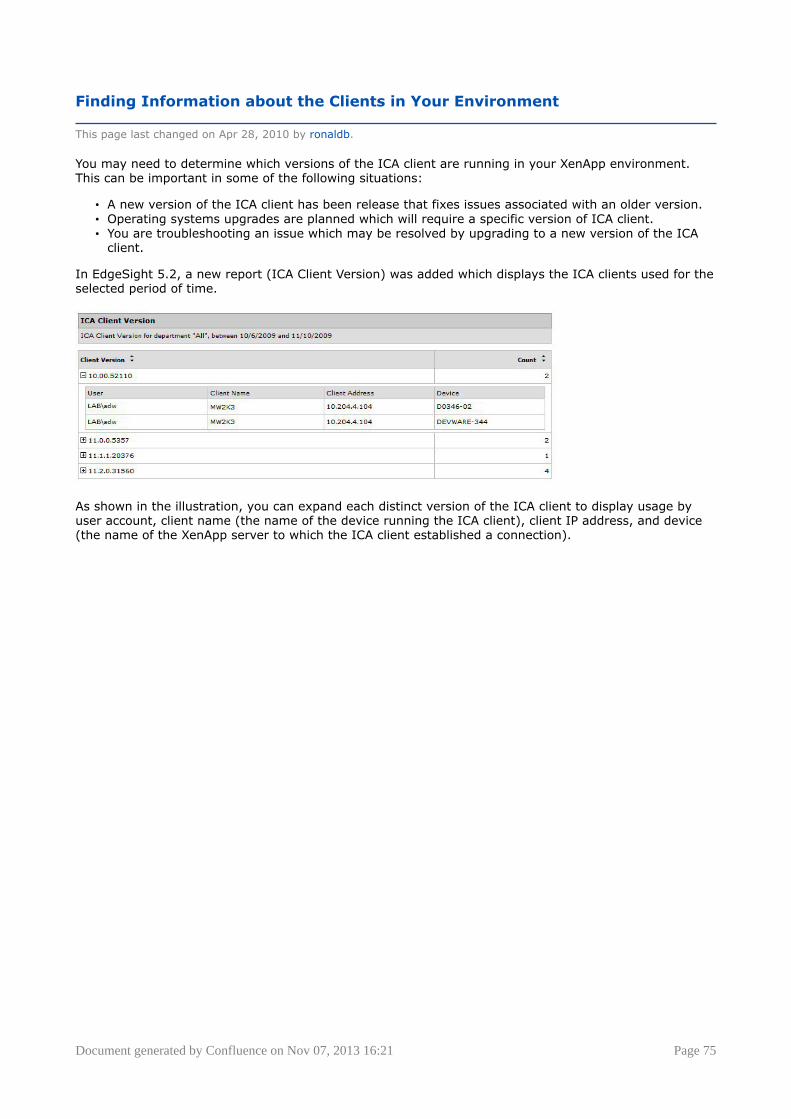
Document generated by Confluence on Nov 07, 2013 16:21 Page 75
Finding Information about the Clients in Your Environment
This page last changed on Apr 28, 2010 by ronaldb.
You may need to determine which versions of the ICA client are running in your XenApp environment.This can be important in some of the following situations:
• A new version of the ICA client has been release that fixes issues associated with an older version.• Operating systems upgrades are planned which will require a specific version of ICA client.• You are troubleshooting an issue which may be resolved by upgrading to a new version of the ICA
client.
In EdgeSight 5.2, a new report (ICA Client Version) was added which displays the ICA clients used for theselected period of time.
As shown in the illustration, you can expand each distinct version of the ICA client to display usage byuser account, client name (the name of the device running the ICA client), client IP address, and device(the name of the XenApp server to which the ICA client established a connection).
Document generated by Confluence on Nov 07, 2013 16:21 Page 76
Detecting General Changes
This page last changed on Apr 27, 2010 by ronaldb.
Sometimes it isn't always obvious if users have violated an organizational policy or other administratorshave added applications. EdgeSight provides features that make it easier to montior for these types ofchanges -- both in real time and historically.
Administrators can use EdgeSight to obtain several different types of information about applicationservers:
• Information about the sessions run on a server• Changes to assets on the server (hardware, software, or otherwise)
Alerts
To find out if... Configure this alert...
a user attempts to connect a hard drive or USBdrive
System Alerts > Plug and Play HardwareChange
a user is running a new process on their machine Application Alerts > New Process
Reports
To find out if... Run this report...
another adminstrator has applied a hotfix or anupgrade to an application server
Software Asset ChangesORNew Processes, which lists any new processeson device and the date the EdgeSight agent firstdetected them.
if a hotfix is working in an acceptable manner Process Stability Summary by ProcessORProcess Summary, which summarizes theperformance of a particular application. Specifythe group of servers to which you applied thehotfix as the Group.ORProcess Faults
Document generated by Confluence on Nov 07, 2013 16:21 Page 77
Using the Dashboard and Reports for an Environmental Overview
This page last changed on Nov 11, 2009 by sarahv.
There are two main ways EdgeSight provides for adminsitrators to get an overview of their environments.They can:
• Use the EdgeSight Dashboard to see alerts• Run the Environmental Usage report
Table of Contents
• 1 Using the Dashboard to See Alerts• 2 Reporting on the Environment
Using the Dashboard to See Alerts
When you are trying to determine at a high level what is happening with your devices, a good startingpoint is often the EdgeSight dashboard. The dashboard provides a visual snapshot of device performanceagainst key performance indicators. Techniques for using the dashboard vary according to the type ofserver you are looking at:
• Infrastructure Servers. To ensure health for vital functions, such as the data collector, you maywant to create custom configurations based on these groups (assuming, for example, you have aData Collector group defined).
• Application Servers. Based on the scalability test results for each application, you might want tospecify a threshold for the maximum number of sessions that you want running on that server. Forexample, if your load evaluators are configured to redirect user connections once the applicationserver reaches 100 connections, you might want to become aware when the server approaches thisnumber, before the loads are balanced.
If you define thresholds, they appear as alerts in the dashboard. Consequently, you might want to definespecific thresholds for CPU utilization, memory usage, context switches, and other metrics that cannegatively impact the user experience based on your scalability testing.
Like all thresholds, these need to be revisited and iterated over so they align with the actual experience inthe environment. For example, do your users report they are experiencing latency when there is a greenlight for the metric? If so, tweak the threshold in the dashboard's configuration until the experience inyour envrionment aligns with the lights on the dashboard.
Reporting on the Environment
To get a high level overview of your environment, run the Environmental Usage report. This reportdisplays data on users, clients/plugins, sessions (start, end, and duration), published applications, andprocesses.
To use this report, you must configure EdgeSight to collect and upload environmental usage data. To doso, see the EdgeSight online help for details.
Document generated by Confluence on Nov 07, 2013 16:21 Page 78
What's Happening on My Network?
This page last changed on Nov 11, 2009 by sarahv.
While EdgeSight is not a network monitoring tool, it can provide some information about your network.
A great starting point for obtaining information about network performance are the Network Summaryand the Network Summary by Site reports.
It provides information through alerts and reports, as follows:
To find out... Do the following...
The amount of bandwidth consummed by sessions Run the Session Network Bandwidth Usedreport
The amount of network delay in sessions Run the Session Network Delay report
The amount of data sent over the network bysessions
Run the Session Network Volume report
The amount of network delay Run these reports, as applicable:
• Site Network Delay• Transaction Network Delay• Port Network Delay
The amount of traffic a particular applicationsends across the network
Run the Process Network Volume report
You can also find out about critical changes to your network as they occur by configuring Network Alerts.EdgeSight provides the following network alerts in the Network Alert category:
• Network Connection Performance Exceeded SLA. This alert flags administrators if theconnection performance metrics (such as round trip time and transaction delay) the administratorspecifies exceed the limits he or she set.
• Network Socket Error.• Network Transaction Failure.• Network Transaction Performance Exceeded SLA. This alert flags administrators if the
performance metrics for network transactions (such as round trip time, transaction response, andtransaction delay) the administrator specifies exceed the limits he or she set.
Document generated by Confluence on Nov 07, 2013 16:21 Page 79
What's Happening On My Servers?
This page last changed on Nov 11, 2009 by sarahv.
In large environments with multiple administrators, it can be hard to keep track of changes to servers.Reports that can help include:
• Software Asset Changes. Recent changes related to software on your farm servers. Thisreport indicates how software on an application server changed, including removing items fromstartup properties, removing software, and installing software. You can see how EdgeSightcategorizes software by looking in Application Categories in the Configure tab.
• Hardware Asset Changes. This report lists changes to hardware or peripherals on servers in thefarm, including changes such as when a memory module is replaced or a printer is mapped to anapplication server. EdgeSight obtains this information from Windows Management Instrumentation(WMI).
Table of Contents
• 1 Are Any Servers Down?• 2 Do Any Servers in a Silo Have More Connections than Others?• 3 Overall Stability• 4 Assessing the Performance of Hotfixes
Are Any Servers Down?
If you want to find out if any servers are currently offline, run the ns:IMA Service State report. Thisreport indicates whether or not the IMA Service is offline or running as well as when the service startedand rebooted. You can run the report against specific groups of servers or an individual server.
Do Any Servers in a Silo Have More Connections than Others?
For load balancing purposes, sometimes administrators want to know if one application is receiving moreuser traffic than others or if one server in an application silo is consisently getting a disproportionatenumber of user connections.
To determine if any application servers in a silo have more connections that other servers or silos, do thefollowing:
1. Create groups for (a) all the applications in the farm and (b) all the silos in the farm (assumingthese are not the same thing). This process is described in the article [How Group and DepartmentStructure Impact Reporting.
2. Run the Session Statistics report on either the silo or application as the group. Group the reportby Hour, then by Device.
Overall Stability
Reports you can run to indicate the overall stability of your envirionment include:
• Process Not Responding Alerts. Provides information about applications that hung (did notrespond), including the name of the application and the users affected.
• Process Not Responding Alerts for a User Group. Process not responding (application hang)conditions with alert details.
• Session Auto-Reconnects. The number of sessions automatically reconnected on a server. (Alsoprovides number of times a user's session automatically reconnected.)
Assessing the Performance of Hotfixes
After applying a hotfix or a service pack to a server, you can use Edgesight to make tracking theperformance of the hotfix easier. To do so, do the following:
You can also find information about what hotfixes are installed on a server or an end user's computer byrunning the Assets for a Device report. The hotfixes are listed towards the bottom of the report.
Document generated by Confluence on Nov 07, 2013 16:21 Page 80
Updating Hardware and Software Inventories
This page last changed on Nov 11, 2009 by sarahv.
EdgeSight provides the ability to monitor changes to hardware and software assets and inventory them,as follows:
• Assets for a Device. Lists the hardware components, such as BIOS, RAM, processor, and videocard, as well as software components, such as the operating system, startup items, registry size,print drivers, and hotfixes for any device monitored including application servers and client devices.
• Software Asset Changes. Lists changes to software.• Hardware Asset Changes. Lists changes to software.
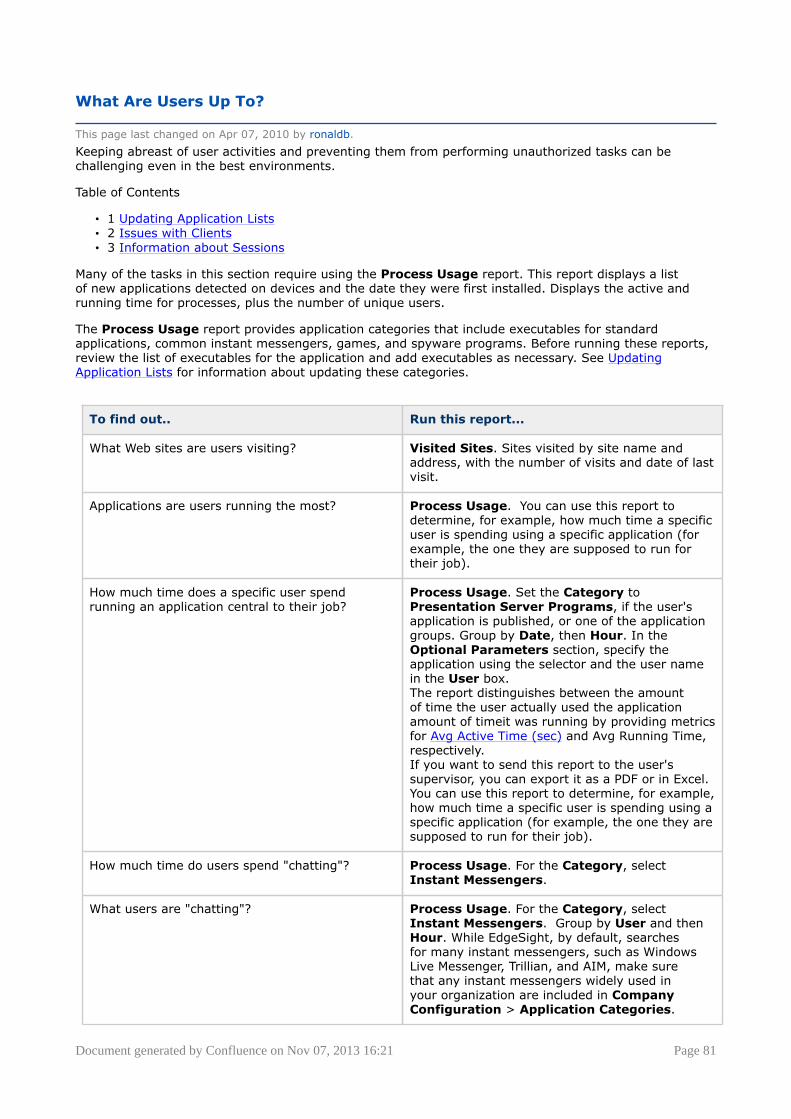
Document generated by Confluence on Nov 07, 2013 16:21 Page 81
What Are Users Up To?
This page last changed on Apr 07, 2010 by ronaldb.
Keeping abreast of user activities and preventing them from performing unauthorized tasks can bechallenging even in the best environments.
Table of Contents
• 1 Updating Application Lists• 2 Issues with Clients• 3 Information about Sessions
Many of the tasks in this section require using the Process Usage report. This report displays a listof new applications detected on devices and the date they were first installed. Displays the active andrunning time for processes, plus the number of unique users.
The Process Usage report provides application categories that include executables for standardapplications, common instant messengers, games, and spyware programs. Before running these reports,review the list of executables for the application and add executables as necessary. See UpdatingApplication Lists for information about updating these categories.
To find out.. Run this report...
What Web sites are users visiting? Visited Sites. Sites visited by site name andaddress, with the number of visits and date of lastvisit.
Applications are users running the most? Process Usage. You can use this report todetermine, for example, how much time a specificuser is spending using a specific application (forexample, the one they are supposed to run fortheir job).
How much time does a specific user spendrunning an application central to their job?
Process Usage. Set the Category toPresentation Server Programs, if the user'sapplication is published, or one of the applicationgroups. Group by Date, then Hour. In theOptional Parameters section, specify theapplication using the selector and the user namein the User box. The report distinguishes between the amountof time the user actually used the applicationamount of timeit was running by providing metricsfor Avg Active Time (sec) and Avg Running Time,respectively.If you want to send this report to the user'ssupervisor, you can export it as a PDF or in Excel.You can use this report to determine, for example,how much time a specific user is spending using aspecific application (for example, the one they aresupposed to run for their job).
How much time do users spend "chatting"? Process Usage. For the Category, selectInstant Messengers.
What users are "chatting"? Process Usage. For the Category, selectInstant Messengers. Group by User and thenHour. While EdgeSight, by default, searchesfor many instant messengers, such as WindowsLive Messenger, Trillian, and AIM, make surethat any instant messengers widely used inyour organization are included in CompanyConfiguration > Application Categories.
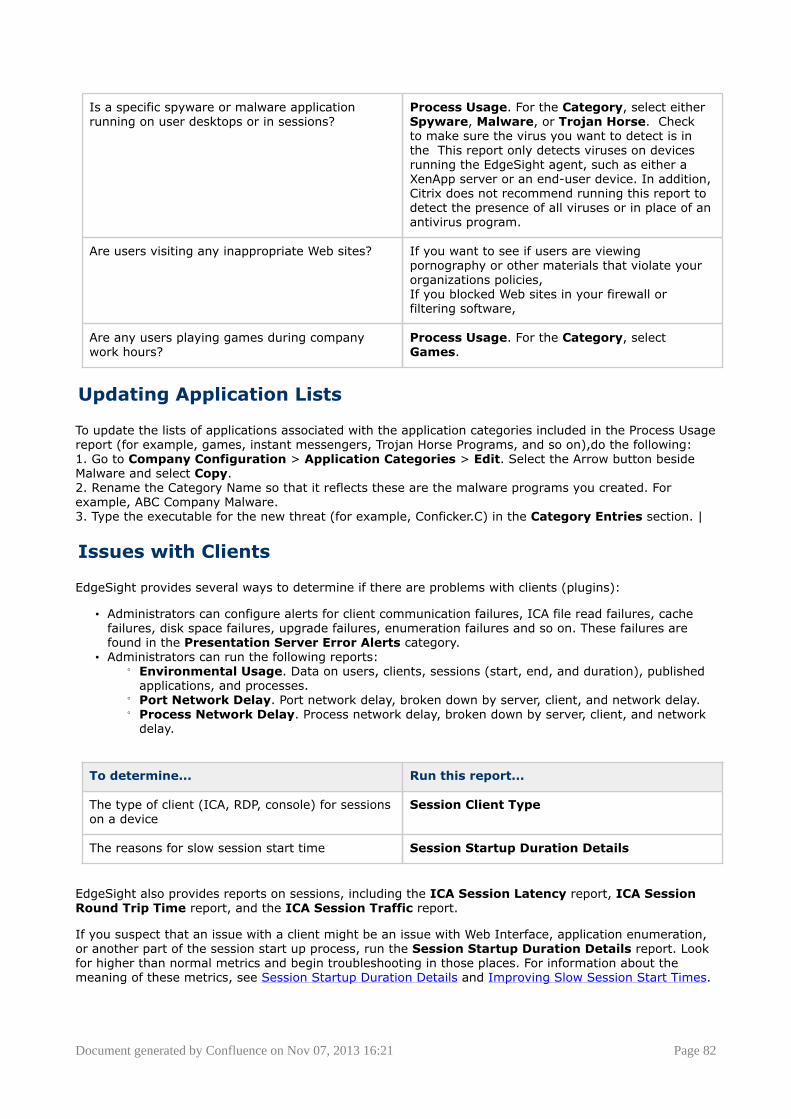
Document generated by Confluence on Nov 07, 2013 16:21 Page 82
Is a specific spyware or malware applicationrunning on user desktops or in sessions?
Process Usage. For the Category, select eitherSpyware, Malware, or Trojan Horse. Checkto make sure the virus you want to detect is inthe This report only detects viruses on devicesrunning the EdgeSight agent, such as either aXenApp server or an end-user device. In addition,Citrix does not recommend running this report todetect the presence of all viruses or in place of anantivirus program.
Are users visiting any inappropriate Web sites? If you want to see if users are viewingpornography or other materials that violate yourorganizations policies,If you blocked Web sites in your firewall orfiltering software,
Are any users playing games during companywork hours?
Process Usage. For the Category, selectGames.
Updating Application Lists
To update the lists of applications associated with the application categories included in the Process Usagereport (for example, games, instant messengers, Trojan Horse Programs, and so on),do the following:1. Go to Company Configuration > Application Categories > Edit. Select the Arrow button besideMalware and select Copy.2. Rename the Category Name so that it reflects these are the malware programs you created. Forexample, ABC Company Malware.3. Type the executable for the new threat (for example, Conficker.C) in the Category Entries section. |
Issues with Clients
EdgeSight provides several ways to determine if there are problems with clients (plugins):
• Administrators can configure alerts for client communication failures, ICA file read failures, cachefailures, disk space failures, upgrade failures, enumeration failures and so on. These failures arefound in the Presentation Server Error Alerts category.
• Administrators can run the following reports:° Environmental Usage. Data on users, clients, sessions (start, end, and duration), published
applications, and processes.° Port Network Delay. Port network delay, broken down by server, client, and network delay.° Process Network Delay. Process network delay, broken down by server, client, and network
delay.
To determine... Run this report...
The type of client (ICA, RDP, console) for sessionson a device
Session Client Type
The reasons for slow session start time Session Startup Duration Details
EdgeSight also provides reports on sessions, including the ICA Session Latency report, ICA SessionRound Trip Time report, and the ICA Session Traffic report.
If you suspect that an issue with a client might be an issue with Web Interface, application enumeration,or another part of the session start up process, run the Session Startup Duration Details report. Lookfor higher than normal metrics and begin troubleshooting in those places. For information about themeaning of these metrics, see Session Startup Duration Details and Improving Slow Session Start Times.
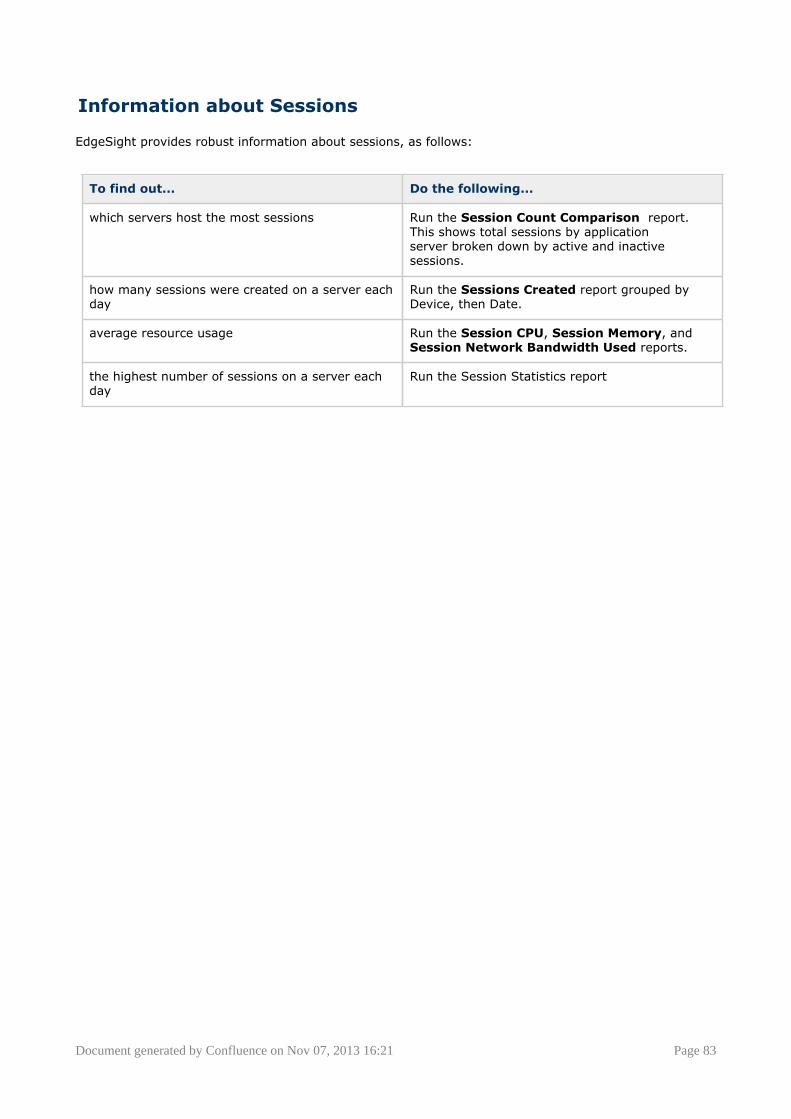
Document generated by Confluence on Nov 07, 2013 16:21 Page 83
Information about Sessions
EdgeSight provides robust information about sessions, as follows:
To find out... Do the following...
which servers host the most sessions Run the Session Count Comparison report.This shows total sessions by applicationserver broken down by active and inactivesessions.
how many sessions were created on a server eachday
Run the Sessions Created report grouped byDevice, then Date.
average resource usage Run the Session CPU, Session Memory, andSession Network Bandwidth Used reports.
the highest number of sessions on a server eachday
Run the Session Statistics report
Document generated by Confluence on Nov 07, 2013 16:21 Page 84
XenApp Server Health
This page last changed on Nov 09, 2009 by sarahv.
You can use EdgeSight to uncover the causes of poor XenApp server performance.
In contrast with the term farm health, which refers to evaluating the health of the farm infrastructureand its application servers overall, the term server health refers to the health of individual serversthemselves. For information about using EdgeSight to ensure farm health, see XenApp Farm Resiliency.
When trying to improve the health of individual farm servers, administrators can either try to:
• Fix issues as they become apparent (reactively)• Prevent issues in advance (proactively)
While the ideal strategy is for organizations perform enough proactive maintenance that emergency,reactive responses are rarely necessary, in reality most organizations use a combination of bothapproaches.
This article provides guidance about how to use EdgeSight for both scenarios: to fix existing issues andprevent issues.
For guidance about how to resolve server-health issues and strategies for ensuring servers remainhealthy, see the following series of related articles:
• Fixing Existing XenApp Server Issues• Keeping Servers Healthy• Troubleshooting Changes to XenApp Servers• Uncovering Causes for Poor Server Performance
Document generated by Confluence on Nov 07, 2013 16:21 Page 85
Fixing Existing XenApp Server Issues
This page last changed on Nov 09, 2009 by sarahv.
This article provides information about fixing existing issues on XenApp servers and uncovering thoseissues using EdgeSight. This article recommends fixing simple issues before trying more advancedtroubleshooting techniques.
Table of Contents
• 1 Fixing Existing Issues• ° 1.1 Reducing Errors, Crashes, and Hangs
° - 1.1.1 Part 1: Finding the server with issues- 1.1.2 Part 2: Fixing Errors, Faults, and Hangs- 1.1.3 Part 3: Fixing Issues
• 2 Applicable Versions
Fixing Existing Issues
Before administrators can start proactively ensuring server health, they should try to fix as many issuesas possible on each server. In many cases, depending on the source of the issue, one solution could helpresolve problems on many servers.
Reducing Errors, Crashes, and Hangs
Begin evaluating a server's health by trying to reduce the number of errors, crashes, and hangs on theserver.
Part 1: Finding the server with issues
Perform one of the following procedures:
To find servers in your farm with issues
If you do not already know what server is having issues, a good way to uncover the servers with thehighest numbers of issues is to run the Process Stability Summary by Process report. This report listsprocesses with the most stability issues (errors, faults, hangs, and transaction errors.)
To find the server users are complaining has issues
If a specific user group has been complaining of crashes or hangs, to identify the servers, run eitherProcess Faults for a User Group or Process Not Responding Alerts for a User Group reports.
After determing what server(s) have the most issues, perform the following, as applicable, on eachserver:
Part 2: Fixing Errors, Faults, and Hangs
To find application crashes (process failing)
• Run the Process Faults report grouped by Process, then Date. In the Optional Parameterssection, specify the problematic server as the Device.
To find application hangs (process not responding)
• Run the Process Not Responding Alerts report.
Part 3: Fixing Issues
Review the reports and fix the most crucial issues and most frequently occurring errors (in volume).
Document generated by Confluence on Nov 07, 2013 16:21 Page 86
Applicable Versions
• EdgeSight 5.2• EdgeSight 5.1• EdgeSight 5.0
Document generated by Confluence on Nov 07, 2013 16:21 Page 87
Keeping Servers Healthy
This page last changed on Apr 28, 2010 by ronaldb.
This article provides suggestions for ways to keep XenApp servers healthy using EdgeSight.
Table of Contents
• 1 Using Alerts to Keep Servers Healthy• ° 1.1 Monitoring Application Response Performance• 2 Monitoring the Health of Infrastructure Servers• ° 2.1 Forms of Alerting
° - 2.1.1 Monitoring the XML Broker Test- 2.1.2 Monitoring the Data Store- 2.1.3 Monitoring the IMA Service- 2.1.4 Other Infrastructure Health Tasks
• 3 Applicable Versions• 4 References• ° 4.1.1 See Also
Using Alerts to Keep Servers Healthy
EdgeSight provides a variety of different alerts to help you keep your users productive and your servershealthy.
If you know that certain changes can cause servers to become unhealthy, you can set alerts to flag you ofthese changes:
To be alerted when... configure the following alerts...
applications are not available Process Fault and/or Process Hung
applications could become unavailable Thrashing Application
application performance degrades significantly High Application Resource Usage and/orApplication Performance
a session is dominant Presentation Server Performance Alerts >Dominant Session
there are excessive disconnected sessions Presentation Server Performance Alerts >Excess Disconnected Sessions
session performance drops below a predefinedlevel
Presentation Server Performance Alerts > PSSession Performance
system performance drops below a predefinedlevel
Presentation Server Performance Alerts > PSSystem Performance
Alerts to Set on Mission Critical Servers
When setting alerts, it is important to consider the volume of messages you might receive from aparticular alert. Consequently, consider only setting these alerts on individual servers with misson-criticalapplications.
To be alerted when a... configure the following alerts...
session is idle longer than a specified amount oftime
Presentation Server Performance Alerts >Session Idle Too Long
Document generated by Confluence on Nov 07, 2013 16:21 Page 88
session is in a down state longer than a specifiedamount of time
Presentation Server Performance Alerts >Session in Down State
session has a slow ICA connection Presentation Server Performance Alerts >Slow ICA Connection or Slow ICA Connectionfor PS 4.5+
Administrators can also add a custom perfmon counter for the Application Resolutions XenAppperformance monitor counter and set an alert for when sessions exceed the level of their choice.
Note: Setting excessive amounts of alerts can affect EdgeSight performance. See the Citrix EdgeSightAdministrator's Guide for details.
Monitoring Application Response Performance
Administrators can configure the EdgeSight Active Application Monitoring tool to simulate the applicationperformance a user would experience when they log in to to a server. For information about this tool, seeUsing EdgeSight Active Application Monitoring.
If administrators have created and implemented a test script using Active Application Monitoring, theycan set alerts for either when a test fails (which could indicate, for example, users cannot connect) orwhen an application's response exceeds a predefined level (which would typically correspond with an SLAthreshold).
To use either of these approaches, administrators should configure one of the following rules from thePresentation Server Performance Alerts category:
• Application Response Failure. Creates an alert when a script fails.• Application Response Time. Creates an alert when the amount of time for a script to run exceeds
the threshold you set.
Monitoring the Health of InfrastructureServers
XenApp infrastructure servers, such as the XML Broker (sometimes also called the XML Service or XMLserver), play a vital role in your farm's overall health. The XML Broker is the server that relays logininformation during application enumeration. When it is not functioning optimally, it may take longer forusers to open applications.
You can also run a XenApp Health Monitoring and Recovery feature's Check XML Threads test to seeif the XML Broker is running correctly. This test can show you if the XML Broker is accepting tickets.For instructions on configuring the Health Monitoring & Recovery feature, see the Citrix XenApp 5.0 forWindows Server 2008 Administrator's Guide.
Forms of Alerting
Here are some examples of alerts you can use to monitor the health of infrastructure servers.
Monitoring the XML Broker Test
Note: This procedure requires that you have Server Settings permissions in EdgeSight.
1. In EdgeSight, create a new alert rule with the following settings (based on EdgeSight 5.0):
• Rule Category: System Alerts• Alert Type: Windows Event Log• Alert Rule Conditions:
° Event Log Name: System° Event Type: Any
Document generated by Confluence on Nov 07, 2013 16:21 Page 89
° Event ID: 4001° Event Source: MetaFrameEvents
Monitoring the Data Store
You can monitor the data store as an EdgeSight end point and use EdgeSight to identify resourceconstraints.
Warning: Do not directly query or change information in the data store. Doing so could cause thedata store to become corrupt. Only IMA-based tools or MFCOM utilities should be used to access theinformation in the data store. All information in the data store is in binary format. No meaningful queriescan be run directly against the data store.
Monitoring the IMA Service
By default, EdgeSight monitors for IMA service failures; the IMA Service is Unresponsive alert isenabled by default.
You can run the IMA Service State report to determine if the IMA service is currently running.
For historical analysis you can run the IMA Service Availability report to determine how much time theIMA service was unavailable.
Other Infrastructure Health Tasks
You can also use Health Monitoring and Recovery to make sure that the data stored in the XenAppserver's local host cache is not corrupted and that there are no duplicate entries by running the CheckLocal Host Cache test.
Applicable Versions
• EdgeSight 5.2• EdgeSight 5.1• EdgeSight 5.0
References
• Citrix XenApp 5.0 for Windows Server 2008 Administrator's Guide, CTX115519.• Citrix Load Manager Administrator's Guide, CTX116426.
See Also
• How to Monitor Farm Health using MedEvac, CTX119899.
Document generated by Confluence on Nov 07, 2013 16:21 Page 90
Troubleshooting Changes to XenApp Servers
This page last changed on Nov 09, 2009 by sarahv.
This article provides techniques for using EdgeSight to troubleshoot changes to XenApp servers, includinghow to detect issues with hotfixes.
Table of Contents
• 1 Uncovering Changes to Servers• 2 Assessing Service Packs• 3 Applicable Versions
Uncovering Changes to Servers
Changes to server hardware and software often have unexpected results. However, during thetroubleshooting process it can be difficult to determine if changes were made to a server.
You can use the Software Asset Changes or the Hardware Asset Changes report, specifying theserver as the Device in the Optional Parameters, to see if another administrator made changes to thesoftware or hardware on the server you are trying to troubleshoot.
You may also want to look at the New Processes report, filtered for the specific device. Sometimes anapplication conflict can affect system performance, and if the onset of performance issues coincide withthe use of a new application, this may provide an area for investigation.
Assessing Service Packs
If you suspect a hotfix or update may be the reason your server is performing badly, consider runningthe Process Stability Summary by Process, reports for reducing crashes and hangs on the upgradedservers as a group. You can either manually create a group of servers before you apply a hotfix or useReporting Services to do so, as described in How Group and Department Structure Impact Reporting.
Applicable Versions
• EdgeSight 5.2• EdgeSight 5.1• EdgeSight 5.0
Document generated by Confluence on Nov 07, 2013 16:21 Page 91
Uncovering Causes for Poor Server Performance
This page last changed on Apr 27, 2010 by ronaldb.
Traditionally, evaluating computer health is based on analysing key performance counters, such as onesfor CPU utlilization, network utilization, and memory usage. When evaluating system performance, it ishelpful to know the following:
• Performance monitoring basics -- see Where to Start Using EdgeSight?• A performance baseline for the system in question.
This article assumes that you already identified the system that has performance issues and provides aprocess for isolating issues.
When evaluating server health, running the Device Summary report - either on the server in question ora group of servers in your farm - can be a good starting point for investigating server performance.
Table of Contents
• 1 Process• ° 1.1 1. Check CPU Utilization
° 1.2 2. Check Network Utilization° 1.3 3. Check Memory Utilization° 1.4 Suggested Actions° - 1.4.1 Excessive CPU Usage
• 2 Are Some Servers Down Frequently?• 3 Applicable Versions
Process
When you have a server that appears to be performing suboptimally, before replacing the server or loadbalancing the server, generate the Device Summary report (filtered for the specific device) and use thefollowing process to try to narrow down the cause:
1. Check CPU Utilization
Is CPU utilization too high for this server?
If the Device CPU chart in the Device Summary report shows an excessive percentage of time spentrunning with high utilization, try to narrow down the reasons, as follows:
1. Double-click on the Device CPU chart. This generates the System CPU report. Make sure that theSystem CPU report is filtering on the system with the performance issues.
2. In the System CPU report, scroll to the table at the bottom and fully expand the device. The tabledisplays the following data for the device's CPU as a percentage:
• Privileged Time (%)• User Time (%)
If the majority of the processor time is spent in Priviledged Time (%), this means that the server'soperating system and its components, including kernel and drivers, as opposed to user applications, isusing excessive amounts of processor time. This can occur because a driver or an application is poorlydesigned or tuned and inefficient.
When CPU utilization is continously high, consider if you need to upgrade the CPU or add processors.Alternatively, a high CPU usage rate may indicate a poorly tuned or designed application. Optimizing theapplication can lower CPU utilization.
If the Priviledged Time (%) counter is high while the Physical Disk counters are high, consider if amore efficient disk subsystem would be beneficial.
The User Time (%) counter displays the percentage of time that the processor spends executing userprocesses, such as published applications.
Document generated by Confluence on Nov 07, 2013 16:21 Page 92
You can also look at CPU utilization in the Device Troubleshooter, which provides real-time data forone server. To do so, look at the Total Processor Time metric in the System Summary tab. If thismetric is high for a sustained period (that is, a bar consistenty across the top of a chart) be sure to lookat the Processor Queue Length metric. If there are more than two threads waiting in the queue fora sustained period of time, then consider if more CPU resources are needed. (High CPU utilization (forexample, 90%) is not necessarily an issue if that is the way in which the applicaiton typically runs and theutilization level is not causing bottlenecks. The true indicator of processor business is the queue length.)
If this doesn't provide a clear indication of the reason for poor server performance, try some of thefollowing:
Determine if... by running this report... Comments
Is there a process using toomuch CPU?
Process CPU, grouped byDevice
Look for the server with thepoor performance in the listof devices. In the table at thebottom of the report, fullyexpand the device name so thatyou can see all the processesrunning on that device. Lookin the Total CPU % colunnfor any processes consummingexcessive amounts of CPU time.
Are there too many users loggedon?
Session Counts, grouped byDevice, then Hour
Compare the average numberof active sessions on the serverduring the time at which peoplereported problems.The number of users logged onto a server is only too manyrelative to the number typicallylogged on to that applicationserver.XenApp does not have a specificpreset number of users thatcan log on to applicationservers. The number of usersa server can support is basedon its resources as well as theapplication's scalability.To see how many sessions totalwere created on the server(instead of just those thatare active), run the SessionsCreated report grouped byDevice, then Hour.
2. Check Network Utilization
Is network utilization is high?
Determine if... by running thisreport...
Comments
Network utilization ishigh?
Session NetworkBandwidth Used(peak and averageinput nad output used
Use these reports tosee if XenApp sent alot of data over theline or if it used a lot of

Document generated by Confluence on Nov 07, 2013 16:21 Page 93
by sessions) groupedby Device using theOptional Parameters orUser.ORSession NetworkVolume, which showsquantity of KB sent andrec'd .
bandwidth for a smallinefficient amount ofdata.
3. Check Memory Utilization
Is too much memory in use?
Start by running the Device Summary report and looking at the Device Memory chart. If thereappears to be too much Device Memory in use, try to isolate the cause:
Determine if... by running this report... Comments
There is a process usingexcessive memory (morethan its share or more than itshould)?
Process Memory Usagewith the Category set to[All Processes], grouped byProcess, then Device
Look for the processesconsumming the most memory.To find memory leaks, see if theprocess's value for the Virtual(KB) column is higher than thePrivate (KB) value. Look for aeither a steady increase or asharp spike in virtual byte usage(ProcessVirtual Bytes).Excessive memory in use bya well-written application thatreturns memory when neededmay not be negative and,consequently, may not indicatean application issue.
If so, is the memory fault(swapping) too high?
Process Pages per Second,grouped by Device and thenServer
Scan the Avg Pages PerSecond column to see if anyprocesses have significantlyhigher values. This counter isthe primary indicator of the kindof faults that cause system widedelays.Tip: To determine whetherlatency is within the sessionor is a hardware issue, run theSystem Page Faults report tosee if there are page faults onall processes on the server.
Suggested Actions
Excessive CPU Usage
If there is a process using too much CPU, then consider the following:
• Is this the first time this occurred or is this historically consistent for the process(or application)? If this is historically consistent you may want to reevaluate your scalability
Document generated by Confluence on Nov 07, 2013 16:21 Page 94
assessment for this server and either add another server (load balancing) or upgrade the hardwarefor this application.
• Have you enabled the CPU Rebalancer feature in XenApp? Citrix has changed therecommendations for the CPU Rebalancer feature and this feature is frequently misunderstood.Citrix only recommends that you use the Citrix CPU Utilization Mgmt/CPU Rebalancer service If youenable Fair sharing of CPU on a multiprocessor system and fair sharing does not occur. Do not startthe CPU rebalancer service simply because your server has multiple processors. If fair sharing isoccurring, enabling the CPU Rebalancer service can impact server performance. For guidance aboutthe CPU Rebalancer service, including information about how to determine ifdetermine if fair sharing is actually occurring, see the Citrix XenApp Administrator's Guide_.
To find out whether or not the CPU Utilization Management feature is enabled on a XenApp server, run thens:CPU Utilization Management EdgeSight report. The table at the bottom of the page lists whether theCPU Utilization Management is enable or disabled on a per device basis.
• Load Balanced Servers. For Load Balanced servers, such as application silos, you can controlswapping, CPU utilization, and memory usage by customizing the load evaluators that apply to thatserver. In XenApp 5.0, do this in the XenApp Advanced Configuration console (formerly known asthe Presentation Server Console) and select the Advanced option when applying the load evaluator.For more information, see Citrix Load Manager Administrator's Guide and the "To assign a loadevaluator to a server" topic in the Citrix XenApp Administrator's Guide.
Are Some Servers Down Frequently?
If you want to find out if any servers are offline, start by running the ns:IMA Service Availability report,as follows:
• Run an IMA Service Availability report on the entire farm or department.• Assuming that you have created groups for your application servers, run a report on the individual
load-managed application server groups (for example, the group of servers hosting your email clientand then one on the group hosting your word-processing application).
In the report, look down the Unplanned Down (%) column to see if there are any servers that have aparticularly high period of time offline.
If you discover that one or more servers has a high period of time offline, run the report on those servers'application groups. If other servers in the same application group have high amounts of unplanned timeoffline, this could indicate that the servers are overloaded or performing suboptimally.
You may want to compare the data in the times the server was offline (that is, the IMA service wasunavailable) against the times that the IMA service itself was restarting. To see this, expand the device inthe IMA Service State report. This shows the time the service started, when it rebooted, and how longit was running.
Other reports that may be helpful include the Hardware Alerts report, which shows disk failures, andthe Reboots report, which shows unexpected device reboots.
Applicable Versions
• EdgeSight 5.2• EdgeSight 5.1• EdgeSight 5.0
Document generated by Confluence on Nov 07, 2013 16:21 Page 95
Generating EdgeSight Reports for Management
This page last changed on Apr 29, 2010 by normanw1.
Many organizations hold weekly staff meetings where IT administrators report on the status of theirnetworks. At these meetings, managers and executives might ask administrators questions like:
• Do we need to budget to add more servers?• Are users having productivity issues? Can they access their applications in a timely manner?• How much is n costing us?
EdgeSight can generate high-level reports that respond to these questions effectively for non-technicalaudiences.
When providing information for management, you can supplement the information gathered fromtechniques in this article with ideas for information in the articles XenApp Farm Resiliency, XenAppServer Health, What is Happening in My Environment?, and Demonstrating SLA Compliance.
Table of Contents
• 1 Different Reports for Different Audiences• 2 IT Directors and Managers• ° 2.1 Suggested Reports for IT Status Meetings• 3 Suggested Reports• 4 Executives• ° 4.1 Recommendations• 5 Versions
Different Reports for Different Audiences
While the interests of managers and executives at different organizations may vary, for simplicity, thisarticle assumes the following:
• IT Managers and Directors. Managers of IT departments want administrators to list problemsin the environment and potential solutions. Managers may be the quintessential "Don't tell me theproblem; tell me the solution" audience. Since this audience might be more technical, they mightask difficult questions about the source or validity of metrics.
• Executives. Executives or "C levels" want high-level reports focusing on the financial impact of ITevents and decisions. For the purposes of this article, we assume this audience is non-technical andwants fast, concise summaries.
IT Directors and Managers
Many weekly IT department meetings begin with a discussion of the overall stability of the network, oftenwith requests to quantify issues. Questions may include:
• What are the technical issues in the environment this week?• How are we going to solve them?
Administrators also might be asked to quantify the productivity and financial impact of a new hotfix rolluppack or patch on their enviornment.
When preparing for the meeting, in some cases, administrators might want to drill into specific trendsso they can answer tough questions. Likewise, if you aren't the person who will actually be planning thechanges to fix issues, you can refer the network engineer to the detailed reports from to obtain additionaldetails about issues.
Suggested Reports for IT Status Meetings
• Overview• Device Summary
Document generated by Confluence on Nov 07, 2013 16:21 Page 96
• Network Summary• XenApp Summary• Process Summary• User Summary for a User Group• Farm authentication
Here's an example of a user gathering and presenting status information, starting off by using thePresentation Server summary.
Pat Brown has configured EdgeSight to generate the Presentation Server Summary report each Thursdayat noon and send the report by email. Pat sets the time interval in the report to be for the most recentweek. This gives Pat enough time to prepare for the department's weekly status meeting.
Pat typically begins preparing for the meeting by analysing the information in the Presentation ServerSummary report. This report displays the Average ICA Session Latency chart and the Average CPU andMemory chart.
Pat notices that the average ICA session latency spikes on the Tuesday of that week. All the other dayson the report average between 400 to 600 ms. However, on Tuesday the latency spiked to 1400 ms. Toinvestigate, Pat double-clicks on the Average ICA Session Latency by Day chart. EdgeSight generates theICA Session Latency report, which provides more detail for each day, and scrolls to Tuesday.
By expanding Tuesday, Pat notices that the first user listed, JackieN has an average session latency (AvgLatency) three times higher than the next highest user. By expanding the line item for JackieN, Pat cansee the name of the client device that Jackie was connecting from and its IP address. Pat writes down thisinformation.
While Pat has narrowed down the issue, Pat still doesn't know the reason this client was experiencingsuch bad latency.
However, by going back to the Presentation Server Summary report and looking at the Average CPU andMemory chart to see utilization, Pat notices that, in general, memory usage tends to be higher than CPUusage (35% vs. 5%). As a result, Pat double-clicks on the memory usage bar in the Average CPU andMemory chart and EdgeSight generates System Memory Usage chart.
After all of this investigation, Pat can report that one user, JackieN, was experiencing latency in themiddle of the week. After looking into the issue, it turns out that Jackie was streaming a 2-hour videopresentation on her computer.
Suggested Reports
Whether you need to do a presentation to lobby for more equipment or show your boss a report at yourweekly staff meeting, these reports may help when talking to management:
• User Summary for a Group• Device Summary• Process Faults, Process Summary, Process Performance Summary by Process, Process Stability
Summary by Process• Network Summary by Site, Network Summary, Network Transaction Summary• XenApp Summary• XenApp User Summary
All of these reports present data in a "four-up" format (that is, four reports summarized on one page).These reports are designed to give you a high-level overview of what is happening in your Citrixenvironment.
Executives
When preparing reports for executives, consider their goal in requesting information. Likewise, considertheir time requirements and attention span when preparing the information - shorter documents arealways better.
Executives may want to get answers to questions like:
Document generated by Confluence on Nov 07, 2013 16:21 Page 97
• What is the average cost of a ticket per user?• How much money is it costing me per user?• How much money will a service outage cost the organization? They may want a projection of cost
based on how many tickets you project the outage will generate.• How many outages have there been in the past n number of days? How does this impact the
business?
To obtain this information, you might want to combine EdgeSight information with other information thatyou've gathered in your environment, such as reports from your help desk ticket system and your outagecalendar.
Recommendations
An easy report to start with for showing to management is the User Summary for a Group report. Thisreport provides a good overall view of Farm Health.
If you decide that you want to use this report to provide to managers or executives, think about howyou will want to display the data in the report. Will it be the overall health for the entire farm or anapplication silo or the servers in one location or another? Create groups as necessary; see How Groupand Department Structure Impact Reporting.
Versions
EdgeSight 5.3
EdgeSight 5.2
EdgeSight 5.1
EdgeSight 5.0

Document generated by Confluence on Nov 07, 2013 16:21 Page 98
Branch Office Performance
This page last changed on Apr 28, 2010 by ronaldb.
This article discusses using the User Summary for a User Group EdgeSight report to monitor branchoffices.
Table of Contents
• 1 Overview• 2 How To Do This• 3 Determining If An Issue Occurs At All Sites• 4 Applicable Versions
Overview
If your organization has remote offices or has remote users, you can use the User Summary for a UserGroup report to take a quick snapshot of your environment and see the performance for a particular setof users.
How To Do This
1. In EdgeSight, create a group for each branch office you want to monitor. You can create user groupsby IP address range, account name, or query. (This lets you contrast one branch's performance withthat of another.)Note: Creating Groups in EdgeSight is described in more detail in How Group and DepartmentStructure Impact Reporting and in the Citrix EdgeSight 5.2 Users's Guide.
2. Run the User Summary for a User Group report specifying the group you created for the branchoffice.
This screen capture displays example of the User Summary for a User Group report from EdgeSight 5.2.
Document generated by Confluence on Nov 07, 2013 16:21 Page 99
Determining If An Issue Occurs At All Sites
You can also use User Summary for a User Group report to determine if an issue is only occurring in onelocation or across all branches. Since the report does not display multiple groups simultaneously, you cantake one of two approaches:
• Create a group that contains all users in all branch offices.OR
• Run separate reports for each branch office's EdgeSight group.
After you create the report, if you see an issue, such as a user who has a particularly long login time, youcan click the bar beside that user name to run a report that provides additional detail for that user.
Applicable Versions
• EdgeSight 5.2• EdgeSight 5.1• EdgeSight 5.0

Document generated by Confluence on Nov 07, 2013 16:21 Page 100
Demonstrating SLA Compliance
This page last changed on Oct 27, 2009 by sarahv.
This article provides information about using either EdgeSight or the Active Application Monitoringmodule included with EdgeSight to demonstrate application availability for Service Level Monitoring (SLM)purposes.
Table of Contents
• 1 Overview• 2 Preventing SLA Violations• ° 2.1 Preventing Application Performance Violations
° - 2.1.1 Alerts for Application Behavior- 2.1.2 Alerts for Changes in Application Performance Metrics
° 2.2 Preventing Network Performance Violations• 3 Running Reports to Prove Performance• ° 3.1 Getting Started with Active Application Monitoring
° - 3.1.1 Demonstrating Compliance with Active Application Monitoring° 3.2 Demonstrating Compliance with EdgeSight Reports° 3.3 Suggested Reports° 3.4 References
Overview
Many IT organizations have formal agreements, known as Service Level Agreement (SLA), stating thattheir IT services will meet a specific, predefined service level. For example, an organization may need todemonstrate the percentage of availability over a month for an application, server, or farm. Likewise, theymay need to demonstrate how much time an application was unavailabe.
EdgeSight provides reports, alerts, and tools to help administrators maintain and monitor for servicelevel compliance. This monitoring activity is known as service level monitoring (SLM) or, sometimes,application performance monitoring.
Administrators can use EdgeSight to monitor the following aspects of service:
• Network delay and round trip time• Application response times• Application latency• Application hangs and freezes• Application availability
This article provides two methods of performing service level monitoring as well as instructions oncreating alerts to help prevent violating agreed upon service levels.
Preventing SLA Violations
Administrators can set EdgeSight alerts to help them prevent an environmental condition (network,application)that would violate their SLAs. For example, administrators can set an alert that would emailthem when the round trip time exceeds the maximum threshold value specified in their SLA.
This section provides an overview of preventing violations for:
• Application performance• Network performance
Preventing Application Performance Violations
There are two different approaches to configuring alerts for application performance:
• Creating alerts for changes in application behavior using Active Application Monitoring
Document generated by Confluence on Nov 07, 2013 16:21 Page 101
• Creating alerts for changes in counters in EdgeSight
Alerts for Application Behavior
If administrators have configured Active Application Monitoring monitoring, they can set alerts for eitherwhen a test fails (which could indicate, for example, users cannot connect) or when an application'sresponse exceeds a predefined level (which would typically correspond with an SLA threshold).
To use either of these approaches, administrators should configure one of the following rules from thePresentation Server Performance Alerts category:
• Application Response Failure. Creates an alert when a script fails.• Application Response Time. Creates an alert when the amount of take for a script to run exceeds
the threshold you set.
Alerts for Changes in Application Performance Metrics
EdgeSight provides the following alerts to help ensure application availability and performance. Thesealerts may also help prevent SLA violations. All of these alerts are found in the Application Alertscategory:
To prevent violations because... configure the following alerts...
applications are not available Process Fault and/or Process Hung
applications could become unavailable Thrashing Application
of application performance degradation High Application Resource Usage and/orApplication Performance
A few tips...
• If administrators know that an application begins to fail when a metric reaches a specific level(for example, when the threads active in a process reach 950), they can set an ApplicationPerformance alert to email them when or before that number of threads is reached. For example,if an administrator has observed that the Citrix Print Manager Service starts to fail when thethreads reach a certain number, they can set an alert to email them before this happens. For moreinformation about using this alert for printing, see Using EdgeSight to Troubleshoot XenApp Printing.
• If administrators know that the performance of an application begins to critically degrade whena certain metric reaches a specific level (for example, when memory usage reaches 150,000KB), they can set a High Application Resource Usage alert to email them when or before thatamount of memory usage is reached.
Preventing Network Performance Violations
EdgeSight provides the following alerts to help prevent network performance SLA violations. All of thesealerts are found in the Network Alerts category:
To prevent violations dueto...
create the following alert...
round-trip time or transactiondelays
Network ConnectionPerformance Exceeded SLA
network socket errors Network Socket Error
network transaction failures Network Transaction Failure
Document generated by Confluence on Nov 07, 2013 16:21 Page 102
round trip time, transactionresponse, and transaction delay
Network TransactionPerformance Exceeded SLA
Running Reports to Prove Performance
There are two different potential approaches for monitoring application performance:
• Using Citrix EdgeSight Active Application Monitoring scripts (and the EdgeSight Application Responsereports) to simulate a user actions for a specific application on an application server
• Running a series of EdgeSight reports on real data on your farm
To run the Application Response reports, administrators must install the Active Application Monitoringtool and create scripts for the application they want to monitor. The scripts are not difficult to create:administrators just click Record and move their mouse as a user would. However, you can also usestandard EdgeSight reports to demonstrate compliance based on real traffic on your farm. The methodyou choose depends on what type of data you ultimately want to obtain.
Getting Started with Active Application Monitoring
EdgeSight Active Application Monitoring is an automated performance testing tool that monitors the enduser experience in Presentation Server and XenApp environments.
EdgeSight Active Application Monitoring is an EdgeSight module included with EdgeSight, Service Pack2.0 and higher. The module has a separate installation program, which is found on the EdgeSight DVD.The installation instructions are included in the text of the installation wizard.
Active Application Monitoring lets you create scripts to replicate user actions for a specific application.You can use Active Application Monitoring to perform scalability testing for an application and alsodemonstrate SLA compliance.
To use the Active Application Monitoring tool to demonstrate SLA compliance, create a script to performspecific actions in an application and then run it against the corresponding application server in theproduction environment. In the script, you define the specific items you want to monitor as MonitoringPoints.
When you run the script, you only specify for it to simulate one user so as not to create excess load onthe server. The Active Application Monitor launcher can then capture metrics about how the applicationbehaves on that application server. These metrics are uploaded to EdgeSight.
After the metrics are in EdgeSight, you can run one of the Application Response reports. These reportsprovide metrics for the monitoring point you specified in the script.
Note: The Active Application Monitoring online help is installed with the Active Application Monitoring tool.This help system provides instructions for configuring the module initially and creating scripts.
Demonstrating Compliance with Active Application Monitoring
To use Active Application Monitoring to demonstrate compliance, do the following:
1. Determine what criteria you want to evaluate to demonstrate SLA compliance. In some companiesapplication performance might be more important than network performance. For example, maybemanagement is concerned about previous complaints it takes too long for users to logon eachmorning.
2. Install the Active Application Monitoring module and configure it according to the directions in theActive Application Monitoring tool, create scripts that will test the aspects of performance you wantto monitor.
3. In EdgeSight, create a Group for each application that you want to monitor, as described in HowGroup and Department Structure Impact Reporting.
4. Run the Application Response Time report this shows the amount of time it takes for the activityyou want to monitor.
Note: The Application Response reports require EdgeSight 5.0, Service Pack 2.

Document generated by Confluence on Nov 07, 2013 16:21 Page 103
Demonstrating Compliance with EdgeSight Reports
To use live farm data and EdgeSight to demonstrate compliance, do the following:
1. As per above, determine what criteria you want to evaluate to demonstrate SLA compliance.2. In EdgeSight, create a Group for each application that you want to monitor, as described in How
Group and Department Structure Impact Reporting.3. Run the following reports, as applicable:
If you want todemonstrate compliancefor...
run...
Application response time N/A
Session latency ICA Session LatencyICA Session Round Trip Timefor a User Group
Session start times Session Startup DurationDetailSession Login Time for a UserGroup Session Login Time
Application availability, hangs,and freezes
Process Stability Summary byProcess Process Not Responding Alerts Process Not Responding Alertsfor a User Group
Network round trip time,Network availability
Session Network Round TripTime Process Network Delay Process Network Volume
Suggested Reports
This is a summary of reports mentioned in this article:
• Application Response Failures. This report shows the results from Active Application Responsetests and displays monitoring point failure and success counts.
• Application Response Time. This report shows the results from Active Application Response testsand displays monitoring point durations.
• Application Response Time for a Test. Lets administrators run a report on how long it takesa test from Active Application Monitoring to run. This is useful for evaluating pilot farms andperforming capacity planning.
References
• Service level agreement, Wikipedia, retrieved April 14, 2009.
Document generated by Confluence on Nov 07, 2013 16:21 Page 104
Track Usage
This page last changed on Apr 27, 2010 by ronaldb.
The Track Usage tab and associated reports were added in Edgesight 5.3. These reports allow you totrack the usage of Citrix licenses and published applications in your environment as well as monitorsession durations.
• Monitoring License Usage• Exporting User and Device License Usage Data• Monitoring Published Applications Usage• Monitoring Session Duration

Document generated by Confluence on Nov 07, 2013 16:21 Page 105
Monitoring License Usage
This page last changed on Sep 01, 2011 by ronaldb1.
EdgeSight can monitor Citrix License Servers and display license usage information. An EdgeSight userwith the role of EdgeSight Administrator or License Server Monitor Administrator must specify one ormore Citrix License Servers to monitor before data is displayed. If you do not see a specific license serverlisted in the reports, this could be due to the following: monitoring has not been enabled for the licenseserver or no configuration was added for the license server. Contact your EdgeSight Administrator toeither enable or add the license server configuration.
Monitoring license usage can help you make decisions about when to purchase additional licenses, basedon usage or license expiration dates. For example, you are asked to help forecast the potential need fornew XenApp licenses. You may want to start by looking at a snapshot of current license usage and thenidentify license usage trends using the following reports:
• License Usage Summary—Displays the most recent license usage information.• License Usage Trending—Displays historical license usage information.
With EdgeSight 5.4, you can monitor the user and device licenses used with XenDesktop deployments.You can also capture a snapshot of user and device liceses currently checked out, as described inExporting User and Device License Usage Data. Keep in mind that you may need to upgrade your licenseserver to be able to monitor these types of licenses. See the System Requirements topic in eDocs formore information: http://support.citrix.com/proddocs/topic/edgesight54/es-system-reqs-54.html
Document generated by Confluence on Nov 07, 2013 16:21 Page 106
Exporting User and Device License Usage Data
This page last changed on Sep 01, 2011 by ronaldb1.
The User/Device License List report provides user/device licensing information from a single licenseserver as a CSV file.
Table of Contents
• 1 Overview• 2 Interpreting the Data• 3 Applicable Versions
Overview
The exported CSV file provides a snapshot of the user/devices licenses which have been checked out.
Interpreting the Data
The file is formatted as follows:
<license server>,<feature code>,<version>,User,<user name>
<license server>,<feature code>,<version>,Device,<device name>
For example, the following row:
licserver01,XDT_PLT_UD,2011.1202,User,jsmith
indicates that a user license for Citrix XenDesktop Platinum with a version of 2011.1202 has beenchecked out by user jsmith.
Because this report is a snapshot, the data has limited currency. The startup of new sessions or thereallocation of user/device licenses after the data for this report is retrieved can have a significant impacton the number and type of checked out licenses in a relatively short time.
Applicable Versions
EdgeSight 5.4
Document generated by Confluence on Nov 07, 2013 16:21 Page 107
Monitoring Published Applications Usage
This page last changed on Apr 27, 2010 by ronaldb.
When managing published applications, you may need to answer the following questions aboutapplication usage:
• What are the most frequently used published applications?• Who is using specific published applications and for how long?• Who are the most active users and what published applications are they using?
EdgeSight provides reports on the Track Usage tab which provide the information to answer thesequestions. These reports, plus additional detail reports, are also available from the Browse tab. Forgeneral published application usage monitoring, you can use the following summary reports:
• Summary for a Farm—Displays bar charts showing the publishedapplications with the most launches and the most unique users, and trendsfor launches and users over time. The data is in relation to a department orgroup of machines.
• Summary for a User Group—Displays bar charts showing the publishedapplications with the most launches and the most unique users, and trendsfor launches and users over time. The data is in relation to a group of users.
You can click on any subreport in these summary reports to drill down into detailed data.
Document generated by Confluence on Nov 07, 2013 16:21 Page 108
Monitoring Session Duration
This page last changed on Apr 28, 2010 by ronaldb.
This is a stub article and may be combined with another article or expanded.
By monitoring the duration and frequency of sessions across a farm or a user group, you can determinehow XenApp and XenDesktop resources are being used in your environment. The Session Duration fora Farm and the Session Duration for a User Group allow you to display which users or devices have thehighest total session duration for a period of time.
Document generated by Confluence on Nov 07, 2013 16:21 Page 109
Reports (Browse)
This page last changed on Mar 31, 2010 by normanw1.
• Introduction to Reporting• Guide to Interpreting Reports• EdgeSight Report List• EdgeSight Data
Document generated by Confluence on Nov 07, 2013 16:21 Page 110
Introduction to Reporting
This page last changed on Apr 27, 2010 by ronaldb.
This article provides an introduction to reports, including the key benefits to IT and other departments,the types included with EdgeSight, and key concepts to remember when using EdgeSight reports.
Table of Contents
• 1 Overview• 2 Types of Reports• 3 Finding Reports• 4 Understanding Data
Overview
One of EdgeSight's key benefits is that it lets you generate reports about your environment. Reportsprovide a way to aggregate, sort, and summarize complex data in a common form. EdgeSight reports,sometimes referred to as "historical reports," provide insight into past transactions in your environment.
Reports are a way to capture historical events and trends for analysis that can be beneficial fortroubleshooting, planning, estimating expenses, and comparing past and present performance.
Reports can show you:
• Application usage• Licensing• Issues and problems in your environment • How well your environment is performing• Trends in your environment• User activities• Lists of hardware and software inventory• Environmental performance
Many departments in an organization will find reports useful:
• Business managers will be interested in Application Usage and Licensing reports• Finance and operations will benefit from software and hardware asset reports.• IT will look at performance and stability reports
Types of Reports
You may want to use reports when you want to examine trends over long time periods or across largenumbers of devices. EdgeSight displays information in these general types of reports:
• Administrative - Oriented towards the business manager: licensing, usage and availability• Summary - Displays high level information on devices, applications, XenApp and XenDesktop Farms• TopN - What are the best (and worst) performing devices• List - Assets, client version, applications run, sites visited• Archive - Used for exporting data from the EdgeSight server database to another database, such as
a data warehouse
Finding Reports
You can browse, filter, or search for reports:
• All reports are available from the Browse tab.• The report list can be refined by choosing the Time Frame, Data Type, Object Type or Report Type
that you are looking for.

Document generated by Confluence on Nov 07, 2013 16:21 Page 111
• You can find reports by using the Search box. This is useful when you do not know the report name,or even if a report exists, but you know the type of data you want in the report. Search looks atreport names, descriptions, and labels.
Tip: As you work with EdgeSight, you may find that you use some reports frequently. Add these reportsto your Favorite Reports page for easy access. Display the report and click on the Add to Favorite Reportslink in the menu bar.
Understanding Data
For reports to be effective, it is best to spend time carefully considering what information you want toretrieve, or what question you want answered.
Comparing the correct data is a critical element in all reports.
EdgeSight Data

Document generated by Confluence on Nov 07, 2013 16:21 Page 112
Guide to Interpreting Reports
This page last changed on Apr 29, 2010 by normanw1.
This article is a guide to interpreting EdgeSight reports.
Table of Contents
• 1 Best Reports as a Starting Point• 2 How to use the reports• 3 Using EdgeSight Departments and Groups
Best Reports as a Starting Point
When starting with EdgeSight the best historical reports to start with are the summary reports. These reports show you a high-level view of your environment and can be used as a starting point foridentifying and resolving issues.
The report you select depends on how your organization practices farm management. For example, is thefocus (a) how the servers in the farm are performing or (b) what the farm's users are experiencing?
Here are some common uses for these reports:
• Device Summary° See which devices are using the most CPU and memory, have the most errors or have the
longest network delay.• Process Summary
° See which processes are using the most CPU and memory, have the most errors or have thelongest network delay
• XenApp Summary° See which XenApp servers are using the most CPU and memory, have the most active
sessions, have the longest login time, or have the longest latency• User Summary for a User Group
° Determine which users are experiencing the longest latency, longest login time and the mostapplication errors
• XenDesktop Summary° See the overall login time, latency, CPU and memory, and number of session running in your
XenDesktop farm.
How to use the reports
At a high level, there are a few common techniques to interpreting EdgeSight reports:
• The summary reports display four different charts with different but related information. Drilling intoeach summary chart brings you to another report with more detailed information.
• If there is a specific piece if information that you are looking for, login time for example, use thebrowse page to narrow the report list to only login related reports and choose the appropriate reportfrom the list.
• When using reports to track down an issue look for a data point that is significantly higher orlower than the rest of the data points. In other words, what data stands out? For example, if youare trying to track down the reason your average session logon times were high in the SessionStartup Duration Details report, look to see if there are any users who had a longer than averagelogon time. If you see a user has a logon time that is double the length of the other users, tryto determine the reason for the difference. This might mean running a report to determine whatapplication the user was running (Process Usage grouped by User then Process) and keeping acalendar of network events handy to correlate this information with events on your network.
• All reports contain columns with specific metrics as their heading. To find the meaning of thesemetrics, see the Report Counters Glossary.
Document generated by Confluence on Nov 07, 2013 16:21 Page 113
Using EdgeSight Departments and Groups
Citrix strongly recommends filtering by department or groups when running reports in order to make thereports more meaningful by constraining the report data to similar Farms, device types or organizationalunits. The Departments are assigned using the Active Directory structure you have defined or the Farmfolder structure you have defined within XenApp or XenDesktop. EdgeSight provides out-of-the-boxgroups based on different platforms and system types, such as Windows 7, Windows 2008, Laptops,Desktops, XenApp Servers, or XenDesktop devices. EdgeSight also offers user groups such as XenAppUsers or Anonymous Users. You may want to create custom groups to focus on a particular set ofsystems or users, as described in How Group and Department Structure Impact Reporting.
The objects (servers, users, devices) that a report contains are controlled by how you design EdgeSightgroups. For example, if you want the ability to compare all servers with the same hardware (same CPU,memory, and so on), or the users in a specific IP range, you must create a custom group for this purpose.
Document generated by Confluence on Nov 07, 2013 16:21 Page 114
EdgeSight Reporting Best Practices
This page last changed on Apr 15, 2009 by sarahv.
The following series of articles present best practices for using EdgeSight reports:
• How Group and Department Structure Impact Reporting• Aggregating and Grouping Averages and Sums in EdgeSight Reports
Document generated by Confluence on Nov 07, 2013 16:21 Page 115
Aggregating and Grouping Averages and Sums in EdgeSight Reports
This page last changed on Jul 17, 2009 by ronaldb.
Overview
You can use filtering to aggregate or group averages and sums in reports by department, group, usergroup, time period, process, device, user, site, and other data types.
Once a report is selected, use the Filter Bar at the top of the report to filter data. Filter data to isolateinformation based on particular classes of processes, devices, or users and to quickly identify problems ortrends. Many reports containing data on user experience can be filtered by user groups, allowing you tomonitor session performance for a group of users with specific characteristics.
Remember to click Go to apply filter parameters, or set Automatically Run Reports to Yes in yourEdgeSight Server Console profile to dynamically regenerate reports when you change the filtering.
Filtering Scenarios
Here are some scenarios where you can use filtering to expand, restrict, or change the precedence of thedata shown to help you resolve performance and availability issues.
Looking at High Average Login Time
When you display the Presentation Server Summary report, you notice a sharp spike in average logintime across your farm. You click on the login time chart to display the Session Login Time report. Yourfirst concern is to find out if the high session login times are associated with a specific server. By selectingDevice from the Group By menu, you can display the session login times for each server, with the serverhaving the longest login times first.
You next step may be to find out which users are experiencing high login times. By selecting User fromthe Group By menu and Device from the Then Group By menu, you can see which users are mostaffected. When you expand the user row in the report, you can see which servers they are using.
From here, you can use other reports to display information about the server, such as the System CPUreport filtered by the specific device to see if CPU usage exceeds recommended levels, or about the user,such as the Presentation Server User Summary filtered by the specific user to display the user's overallexperience.
Once you have resolved the issue at hand, you may want to investigate past instances of high sessionlogin times to see if they correspond to events or changes in your environment. When you display areport with the default parameters, it shows data for the previous week. By expanding the date range,you can identify past spikes in login time and the see if the same server or user are involved.

Document generated by Confluence on Nov 07, 2013 16:21 Page 116
How Group and Department Structure Impact Reporting
This page last changed on Sep 22, 2009 by ronaldb.
Groups are a very important filter for many EdgeSight reports. They allow you to select a collection ofspecific devices for each report. This lets you run the desired report for only the devices with thecharacteristics you are studying.
When you install EdgeSight, there are a selection of out-of-the-box groups based on operating system(such as All Windows 2003 and All Windows 2008) or type of device (such as Citrix XenApp or TerminalServers). When you create custom groups, consider how you would like information in reports to begrouped. You can create groups so that data can be displayed for the entire farm, for a silo of applicationservers or for any other group of servers.
Because the department structure for XenApp farms is determined by the farm and cannot be changedthrough the EdgeSight Server Console, the ability to create custom groups provides the flexibility toreport on a selected set of machines regardless of department structure.
Table of Contents
• 1 Groups: An Overview• ° 1.1 Suggestions for Groups
° - 1.1.1 Create Groups for Load-Managed Groups of Applications- 1.1.2 Create a Group for Data Collectors- 1.1.3 Create a Group for the XML Broker(s)- 1.1.4 Creating Custom Groups- - 1.1.4.1 Create Groups for End User Devices by Location
- 1.1.4.2 Create Groups for Newly Upgraded or Hotfixed Servers• 2 Suggestions for User Groups• ° 2.1 Create User Groups for All Users by Farm• 3 References
Groups: An Overview
A group can be defined using one or more of the following criteria:
• All of the devices in one or more departments• A selected set of individual devices within a department or across departments• A selected set of individual devices to be excluded from the group• A set of individual devices selected using an SQL query run against the EdgeSight database
Group capabilities of EdgeSight allow you to create collections of users by selecting users by username,IP address or IP range, or by running a SQL query against the EdgeSight database. The users can beXenApp or endpoint users. Many reports containing data on user experience can be filtered by usergroups, allowing you to monitor system performance for a group of users with specific characteristics.
Suggestions for Groups
Creating a Group or managing the EdgeSight department structure effectively helps you filter reportsto see what you care about. When determining group structure, think about how you like to look atinformation about your network. Will you want to look at the overall health for the entire farm, anapplication silo, or the servers in one location or another? Consider creating groups to segment theservers in this manner.
To get started, one guiding principle is to group similar servers together.
Create Groups for Load-Managed Groups of Applications
Creating a group for each one of your sets of application servers (that is, each load-managed group)makes it easier to isolate user issues with specific applications and isolate causes of outages.
Document generated by Confluence on Nov 07, 2013 16:21 Page 117
Create a Group for Data Collectors
Creating a group for the servers designated as data collectors and backkup data collectors on your farmmakes it wasier to run reports to learn about data collector elections and election storms.
Create a Group for the XML Broker(s)
Even if you do not have a dedicated server for the XML Broker, creating a group that may only containthis server makes it faster to find and identify the server when you want to run reports.
Creating Custom Groups
Creating your own custom groups is relatively easy and allows you almost limitless options for focusingyour reports. By using SQL queries, you can create a group based on almost any characteristic a deviceor group of devices may have.
For more ideas about the device characteristic, or assets, that you can choose, see the Assets for aDevice report, which provides insight view into your options.
You can create custom groups for specific:
• Machine names• Machine serial numbers• Models• Processor speeds• Memory
For more information about the SQL queries for the above, see Examples of How to Create EdgeSightCustom Groups Using SQL Queries, CTX111032.
Create Groups for End User Devices by Location
An easy way to create an EdgeSight group for a group of end-user devices is by using SQL queries. Forexample, you might want the ability to run reports on a specific geographical group of client devices, suchas all the client devices on the west side of the second floor of your building.
To create geographic-based device groups
1. Run one of the following SQL queries: By IPRange:
select instidfrom instancewhere ip_address like '192.168.%'
By IPRange using only the last octet (to select ip 1-99 only):
select instid from instancewhere dbo.udf_core_ip_to_int(ip_address) between dbo.udf_core_ip_to_int ('10.202.1.1') AND dbo.udf_core_ip_to_int ('10.202.1.99')
Create Groups for Newly Upgraded or Hotfixed Servers
After applying Windows upgrades or Citrix hotfix rollup packs, you can create EdgeSight groups thatcombine devices of the same patch. This lets you monitor the performance of the upgraded servers - andmakes it easier to determine if you need to roll them back.
To create a group of servers with a specific Citrix Hotfix Rollup Pack
1. Run the following SQL query:
select instid
Document generated by Confluence on Nov 07, 2013 16:21 Page 118
from instancewhere instid not in (select i.instid from instance i join asset a on i.instid = a.instid join asset_prop ap on a.apid = ap.apid where ap.property = N'HotFixID' and a.prop_value = N'KB888113')
To create a group of servers with a specific Windows Service Pack
1. Run the following:By Service Pack Level:
select instidfrom vw_es_archive_device_asset_detailwhere property = 'ServicePackInEffect' and property_value = 'KB885836'
Suggestions for User Groups
Groups of users can be selected by user name, IP address, or by running SQL queries.
Create User Groups for All Users by Farm
You may want to generate reports for all users associated with a specific farm, such as the farm which isused to deliver application to the sales team. Since the departments associated with XenApp farms aredetermined by the farm, you can use a query that looks at the department table to match the specificfarm.
select sessidfrom vw_es_usergroup_ica_users ujoin instance i on i.instid = u.instidjoin dept d on d.deptid = i.deptidwhere d.path = 'All\XenApp Farms\SalesFarm'
References
• Examples of How to Create EdgeSight Custom Groups Using SQL Queries, CTX111032.
Document generated by Confluence on Nov 07, 2013 16:21 Page 119
EdgeSight Report List
This page last changed on Oct 27, 2009 by sarahv.
• EdgeSight 5.4 Report List• EdgeSight 5.3 Report List• EdgeSight 5.2 Report List• EdgeSight 5.0 and 5.1 Report List• EdgeSight Report List by Task
Document generated by Confluence on Nov 07, 2013 16:21 Page 120
EdgeSight 5.4 Report List
This page last changed on Aug 30, 2011 by ronaldb1.
For definitions of metrics, see Report Counters Glossary.
Important: To find out what reports use a specific metric, in the EdgeSight Server Console, click theBrowse tab and type the name of the metric in the Search box in the user interace (not the Find, CTRL+ F, feature in the Web browser). You can also find reports by entering a report name or description inthe Search box.
A B C D E F G H I J K L M N O P Q R S T U V W X Y Z
A
AlertsNumber of alerts by type with alert details.
Application Response FailuresActive Application Response test and monitoring point failure and success counts.
Application Response TimeActive Application Response test and monitoring point durations.
Application Response Time for a TestActive Application Response duration and status for a test.
Asset ChangesChanges to hardware and software device assets.
Assets for a DeviceHardware and software assets on a device.
C
CPU Utilization ManagementCPU Utilization Management status (enabled or disabled), plus average and peak CPU usage.
D
Device ArchiveArchive report.
Device SummaryDevice performance data (CPU and memory usage, network delay, event log alerts, and applicationerrors).
E
Environmental UsageData on users, clients, sessions (start, end, and duration), published applications, and processes.
Environmental Usage ArchiveArchive report for Environmental Usage data. Use this report to export Environmental Usage data fromthe EdgeSight database.
Error ArchiveArchive report.
Event Log AlertsEvent log alerts with alert details.
Event Log Alerts for a User GroupEvent log alerts with alert details.

Document generated by Confluence on Nov 07, 2013 16:21 Page 121
H
Hardware AlertsHardware alerts (reboot, disk failure, and plug and play changes) with alert details.
Hardware Asset ChangesRecent changes to hardware assets on devices.
HDX MediaStream I/OSpeedscreen Multimedia input and output for HDX sessions.
HDX Plug-n-Play I/OUSB and Smart Card input and output for HDX sessions.
I
ICA Audio I/OAudio input and output bandwidth used during ICA sessions.
ICA Client VersionThe version of the client used during ICA sessions.
ICA Drive I/ODrive input and output bandwidth for file operations during ICA sessions.
ICA Printer IOPrinter input and output bandwidth used during ICA sessions as well as the printer name and printerdriver name. This report can be grouped by User, Device, Date, and Hour.
ICA Session CompressionDisplays the compression ratios used from server to client (ICA Session Compression Output (%))andclient to server (ICA Session Compression Input (%)).
ICA Session I/OInput and output line speed for ICA sessions.
ICA Session LatencyLatency (peak and average) for ICA sessions. Only pertains to pre-4.5 Presentation Servers. PresentationServers with EUEM data will not be reflected on this report.
ICA Session Latency for a User GroupLatency (peak and average) for ICA sessions. Only pertains to pre-4.5 Presentation Servers. PresentationServers with EUEM data will not be reflected on this report.
ICA Session Round Trip TimeICA session and network round trip time (RTT). Only pertains to EdgeSight Presentation Server Agents4.5 and later, Presentation Server 4.5 and later (Enterprise or Platinum Editions), and ICA Client version10 and later. Pre 4.5 Presentation Servers data will not be reflected on this report.
ICA Session Round Trip Time ArchiveArchive report.
ICA Session Round Trip Time for a User GroupICA session and network round trip time (RTT). Only pertains to EdgeSight Presentation Server Agents4.5 and later, Presentation Server 4.5 and later (Enterprise or Platinum Editions), and ICA Client version10 and later. Pre 4.5 Presentation Servers data will not be reflected on this report.
ICA Session TrafficTraffic (peak and average input and output) for ICA sessions.
ICA Session Traffic for a User GroupTraffic (peak and average input and output) for ICA sessions.
ICA Video I/OVideo frame and SpeedScreen input and output for ICA sessions.
IMA Service Availability

Document generated by Confluence on Nov 07, 2013 16:21 Page 122
Current IMA service availability status and the time since the last state change.
IMA Service StateCurrent IMA service state and the time since the last state change.
L
License Server Monitor ArchiveArchive report for License Server Monitor data. Use this report to export License Server Monitor data fromthe EdgeSight database.
N
Network Connection ArchiveArchive report.
Network SummarySummary of network performance for a site (delay, volume, RTT, and transaction errors).
Network Summary by SiteSummary of network performance (delay, RTT, Web errors, and transaction errors).
Network Transaction ArchiveArchive report.
Network Transaction SummarySummary of network performance for a transaction (delay, volume, RTT, and Web errors).
New ProcessesNew processes detected on devices with the date first seen.
New SitesNew sites detected on devices with the date first seen.
P
Port Network DelayPort network delay, broken down by server, client, and network delay.
Port Network Round Trip TimeMaximum and average round trip time (RTT) for ports.
Port Network VolumePort network volume (kilobytes sent and received).
Port Web ErrorsWeb errors (transaction and Winsock) for a port.
Process CPUProcess CPU usage (privileged time, user time, and total CPU).
Process Cumulative CPUProcess Cumulative CPU usage time.
Process ErrorsProcess errors with alert details.
Process Errors for a User GroupProcess errors with alert details.
Process FaultsProcess faults (crashes) with alert details.
Process Faults for a User GroupProcess faults (crashes) with alert details.
Process Memory Usage

Document generated by Confluence on Nov 07, 2013 16:21 Page 123
Memory (virtual, private, and working set) used by processes.
Process Network DelayProcess network delay, broken down by server, client, and network delay.
Process Network VolumeProcess network volume (kilobytes sent and received).
Process Not Responding AlertsProcess not responding (application hang) conditions with alert details.
Process Not Responding Alerts for a User GroupProcess not responding (application hang) conditions with alert details.
Process Pages Per SecondAverage pages per second for processes.
Process Performance ArchiveArchive report.
Process Performance Summary by ProcessProcess performance summary (high CPU or memory usage, long network delay or active time).
Process Stability Summary by ProcessProcesses with the most stability issues (errors, faults, hangs, and transaction errors.)
Process SummarySummary of process performance (CPU and memory usage, network delay, and errors).
Process Thread CountAverage number of active threads for processes.
Process UsageActive and running time for processes, plus the number of unique users.
Process Usage ArchiveArchive report.
Published Application Launch Archive !NewArchive report for Published Application Launch data. Use this report to export Published ApplicationLaunch data from the EdgeSight database.
Published Application Launch Count - Details !NewThe number of times a Published Application has been launched.
Published Application Launch Count for a User Group - Details !NewThe number of times a Published Application has been launched for a user group.
Published Application Launch Summary !NewThe number of times a Published Application has been launched (summary view).
Published Application Launch Summary for a User Group !NewThe number of times a Published Application has been launched for a user group (summary view).
Published Application Summary !NewPublished Applications with the most launches and the most users (top 5 and trend).
Published Application Summary for a User Group !NewPublished Applications with the most launches and the most users for a user group (top 5 and trend).
Published Application User Count - Details !NewMost active users of Published Applications. The number of unique users per Published Application.
Published Application User Count for a User Group - Details !NewMost active users of Published Applications. The number of unique users per Published Application for auser group.
Published Application User Summary !New

Document generated by Confluence on Nov 07, 2013 16:21 Page 124
The number of unique users per Published Application (summary view).
Published Application User Summary for a User Group !NewThe number of unique users per Published Application for a user group (summary view).
R
Real-time Alert List (Excel)Real-time detailed alert information.
Real-time Device Summary (Excel)Real-time alert, network delay, processor usage, and memory usage summary information.
Real-time Network Performance (Excel)Real-time detailed network volume, delay, round trip time, and error information.
Real-time System Compare (Excel)Real-time performance counters from multiple devices for use in comparing system performance.
Real-time System Performance (Excel)Real-time detailed system, network, and process performance information.
Real-time XenApp Summary (Excel)Real-time performance counters from multiple XenApp servers for use in comparing system performance.
Real-time XenApp User Summary (Excel)Real-time system, application, and session information for a XenApp user.
RebootsDevice reboots (expected and unexpected).
S
Session Auto-ReconnectsSession Auto-Reconnects.
Session Client and Server Startup DurationAverage Session client startup duration (CSD) and server startup duration (SSD). Displays login duration.
Session Client Startup DurationElapsed time for client startup (from request to ICA connection). Displays login duration.
Session Client Startup Time ArchiveArchive report.
Session Client TypeClient type (ICA, RDP, or console) for sessions on a device.
Session CountsAverage active, inactive, and total session counts.
Session CPUAverage total CPU used by sessions.
Session CPU for a User GroupAverage total CPU used by sessions.
Session Duration !NewSession duration summary and detail.
Session Duration for a User Group !NewSession duration summary and detail for a user group.
Session Login TimeAverage login time for ICA sessions.
Session Login Time for a User Group
Document generated by Confluence on Nov 07, 2013 16:21 Page 125
Average login time for ICA sessions.
Session MemoryMemory (virtual, private, and working set) used by sessions.
Session Network Bandwidth UsedNetwork bandwidth (peak and average input and output) used by sessions.
Session Network DelaySession network delay, broken down by server, client, and network delay.
Session Network Delay for a User GroupSession network delay, broken down by server, client, and network delay.
Session Network Round Trip TimeMaximum and average round trip time (RTT) for sessions.
Session Network Round Trip Time for a User GroupMaximum and average round trip time (RTT) for sessions.
Session Network VolumeSession network volume (kilobytes sent and received).
Session Network Volume for a User GroupSession network volume (kilobytes sent and received).
Session Page FaultsAverage number of page faults per second for sessions.
Session Performance ArchiveArchive report for Session Performance data. Use this report to export Session Performance data from theEdgeSight database.
Session Server Startup DurationAverage time to startup a session on a Presentation Server.
Session Server Startup Time ArchiveArchive report.
Session Startup Duration DetailsSession client startup duration (CSD) and server startup duration (SSD). This contains the followingserver-side metrics: CASD, CONSD, COSD, PNCOSD, PLSD, LSEED, PCSID, DMSD, and SCSD. It alsocontains the following client-side metrics: CFDCD, BUCC, AECD, COCD, IFDCD, NRWD, TRWD, LPWD,SCCD, NRCD, and SLCD.
Site Network DelaySite network delay, broken down by server, client, and network delay.
Site Network ErrorsNetwork errors (transaction and Winsock) for a site.
Site Network Errors for a User GroupNetwork errors (transaction and Winsock) for a site.
Site Network Round Trip TimeMaximum and average round trip time (RTT) for sites.
Site Network VolumeSite network volume (kilobytes sent and received).
Software Asset ChangesRecent changes to software assets on devices.
System CPUSystem CPU usage (privileged time, user time, and total CPU).
System CPU SummaryCPU percent usage summary for devices.
Document generated by Confluence on Nov 07, 2013 16:21 Page 126
System Disk UsageDisk usage shown as percent free disk space.
System Disk Usage ArchiveArchive report.
System Disk Usage SummarySummary of disk usage with disk capacity and percent free disk space.
System Kernel for a DeviceSystem kernel activity (context switches, system calls, interrupts, and process count) for devices.
System Memory for a User GroupMemory (virtual, private, and working set) used by sessions.
System Memory SummaryPhysical memory percent usage summary for devices.
System Memory UsageAverage percent memory used for devices.
System Page FaultsAverage page faults per second for devices.
System Performance ArchiveArchive report.
T
Trace Event ArchiveArchive report.
Transaction Network DelayTransaction network delay, broken down by server, client, and network delay.
Transaction Network Round Trip TimeMaximum and average round trip time (RTT) for transactions.
Transaction Network VolumeNetwork volume (KB) for transactions by host.
Transaction Web ErrorsWeb errors associated with a host and transaction.
U
User Logon CountsNumber of XenApp and XenDesktop users who have logged on.
User Logon DetailsXenApp and XenDesktop user logons counts, times, and client information. This also displays the numberof sessions created.
User Logon Details for a User GroupXenApp and XenDesktop user logons counts, times, and client information. This also displays the numberof sessions created.
User Summary for a User GroupUser experience by user group summary (ICA RTT, login time, process errors, and recent sessions).
V
Visited SitesSites visited by site name and address, with the number of visits and date of last visit.
Document generated by Confluence on Nov 07, 2013 16:21 Page 127
X
XenApp Server UtilizationAverage CPU, average memory, and peak concurrent sessions for XenApp servers. This report containsinformation about the most heavily loaded servers. This report was added for the EdgeSight for XenApp5.2 release.
XenApp SummaryXenApp performance data (login time, active sessions, ICA session latency, and CPU and memory usage).
XenApp System Performance ArchiveArchive report for XenApp System Performance data. Use this report to export XenApp SystemPerformance data from the EdgeSight database.
XenApp User SummaryXenApp performance from a user perspective (ICA client traffic, login time, ICA session latency, andrecent sessions).
XenDesktop SummaryXenDesktop performance data (login time, active sessions, ICA session latency, and CPU and memoryusage).
XenDesktop User SummaryXenDesktop performance from a user perspective (ICA client traffic, login time, ICA session latency, andrecent sessions).
Document generated by Confluence on Nov 07, 2013 16:21 Page 128
EdgeSight 5.3 Report List
This page last changed on Jul 09, 2010 by chiuc.
For definitions of metrics, see Report Counters Glossary.
Important: To find out what reports use a specific metric, in the EdgeSight Server Console, click theBrowse tab and type the name of the metric in the Search box in the user interace (not the Find, CTRL+ F, feature in the Web browser). You can also find reports by entering a report name or description inthe Search box.
A B C D E F G H I J K L M N O P Q R S T U V W X Y Z
A
AlertsNumber of alerts by type with alert details.
Application Response FailuresActive Application Response test and monitoring point failure and success counts.
Application Response TimeActive Application Response test and monitoring point durations.
Application Response Time for a TestActive Application Response duration and status for a test.
Asset ChangesChanges to hardware and software device assets.
Assets for a DeviceHardware and software assets on a device.
C
CPU Utilization ManagementCPU Utilization Management status (enabled or disabled), plus average and peak CPU usage.
D
Device ArchiveArchive report.
Device SummaryDevice performance data (CPU and memory usage, network delay, event log alerts, and applicationerrors).
E
Environmental UsageData on users, clients, sessions (start, end, and duration), published applications, and processes.
Environmental Usage ArchiveArchive report for Environmental Usage data. Use this report to export Environmental Usage data fromthe EdgeSight database.
Error ArchiveArchive report.
Event Log AlertsEvent log alerts with alert details.
Event Log Alerts for a User GroupEvent log alerts with alert details.
Document generated by Confluence on Nov 07, 2013 16:21 Page 129
H
Hardware AlertsHardware alerts (reboot, disk failure, and plug and play changes) with alert details.
Hardware Asset ChangesRecent changes to hardware assets on devices.
HDX MediaStream I/OSpeedscreen Multimedia input and output for HDX sessions.
HDX Plug-n-Play I/OUSB and Smart Card input and output for HDX sessions.
I
ICA Audio I/OAudio input and output bandwidth used during ICA sessions.
ICA Client VersionThe version of the client used during ICA sessions.
ICA Drive I/ODrive input and output bandwidth for file operations during ICA sessions.
ICA Printer IOPrinter input and output bandwidth used during ICA sessions as well as the printer name and printerdriver name. This report can be grouped by User, Device, Date, and Hour.
ICA Session CompressionDisplays the compression ratios used from server to client (ICA Session Compression Output (%))andclient to server (ICA Session Compression Input (%)).
ICA Session I/OInput and output line speed for ICA sessions.
ICA Session LatencyLatency (peak and average) for ICA sessions. Only pertains to pre-4.5 Presentation Servers. PresentationServers with EUEM data will not be reflected on this report.
ICA Session Latency for a User GroupLatency (peak and average) for ICA sessions. Only pertains to pre-4.5 Presentation Servers. PresentationServers with EUEM data will not be reflected on this report.
ICA Session Round Trip TimeICA session and network round trip time (RTT). Only pertains to EdgeSight Presentation Server Agents4.5 and later, Presentation Server 4.5 and later (Enterprise or Platinum Editions), and ICA Client version10 and later. Pre 4.5 Presentation Servers data will not be reflected on this report.
ICA Session Round Trip Time ArchiveArchive report.
ICA Session Round Trip Time for a User GroupICA session and network round trip time (RTT). Only pertains to EdgeSight Presentation Server Agents4.5 and later, Presentation Server 4.5 and later (Enterprise or Platinum Editions), and ICA Client version10 and later. Pre 4.5 Presentation Servers data will not be reflected on this report.
ICA Session TrafficTraffic (peak and average input and output) for ICA sessions.
ICA Session Traffic for a User GroupTraffic (peak and average input and output) for ICA sessions.
ICA Video I/OVideo frame and SpeedScreen input and output for ICA sessions.
IMA Service Availability
Document generated by Confluence on Nov 07, 2013 16:21 Page 130
Current IMA service availability status and the time since the last state change.
IMA Service StateCurrent IMA service state and the time since the last state change.
L
License Server Monitor ArchiveArchive report for License Server Monitor data. Use this report to export License Server Monitor data fromthe EdgeSight database.
N
Network Connection ArchiveArchive report.
Network SummarySummary of network performance for a site (delay, volume, RTT, and transaction errors).
Network Summary by SiteSummary of network performance (delay, RTT, Web errors, and transaction errors).
Network Transaction ArchiveArchive report.
Network Transaction SummarySummary of network performance for a transaction (delay, volume, RTT, and Web errors).
New ProcessesNew processes detected on devices with the date first seen.
New SitesNew sites detected on devices with the date first seen.
P
Port Network DelayPort network delay, broken down by server, client, and network delay.
Port Network Round Trip TimeMaximum and average round trip time (RTT) for ports.
Port Network VolumePort network volume (kilobytes sent and received).
Port Web ErrorsWeb errors (transaction and Winsock) for a port.
Process CPUProcess CPU usage (privileged time, user time, and total CPU).
Process Cumulative CPUProcess Cumulative CPU usage time.
Process ErrorsProcess errors with alert details.
Process Errors for a User GroupProcess errors with alert details.
Process FaultsProcess faults (crashes) with alert details.
Process Faults for a User GroupProcess faults (crashes) with alert details.
Process Memory Usage
Document generated by Confluence on Nov 07, 2013 16:21 Page 131
Memory (virtual, private, and working set) used by processes.
Process Network DelayProcess network delay, broken down by server, client, and network delay.
Process Network VolumeProcess network volume (kilobytes sent and received).
Process Not Responding AlertsProcess not responding (application hang) conditions with alert details.
Process Not Responding Alerts for a User GroupProcess not responding (application hang) conditions with alert details.
Process Pages Per SecondAverage pages per second for processes.
Process Performance ArchiveArchive report.
Process Performance Summary by ProcessProcess performance summary (high CPU or memory usage, long network delay or active time).
Process Stability Summary by ProcessProcesses with the most stability issues (errors, faults, hangs, and transaction errors.)
Process SummarySummary of process performance (CPU and memory usage, network delay, and errors).
Process Thread CountAverage number of active threads for processes.
Process UsageActive and running time for processes, plus the number of unique users.
Process Usage ArchiveArchive report.
Published Application Launch Archive !NewArchive report for Published Application Launch data. Use this report to export Published ApplicationLaunch data from the EdgeSight database.
Published Application Launch Count - Details !NewThe number of times a Published Application has been launched.
Published Application Launch Count for a User Group - Details !NewThe number of times a Published Application has been launched for a user group.
Published Application Launch Summary !NewThe number of times a Published Application has been launched (summary view).
Published Application Launch Summary for a User Group !NewThe number of times a Published Application has been launched for a user group (summary view).
Published Application Summary !NewPublished Applications with the most launches and the most users (top 5 and trend).
Published Application Summary for a User Group !NewPublished Applications with the most launches and the most users for a user group (top 5 and trend).
Published Application User Count - Details !NewMost active users of Published Applications. The number of unique users per Published Application.
Published Application User Count for a User Group - Details !NewMost active users of Published Applications. The number of unique users per Published Application for auser group.
Published Application User Summary !New
Document generated by Confluence on Nov 07, 2013 16:21 Page 132
The number of unique users per Published Application (summary view).
Published Application User Summary for a User Group !NewThe number of unique users per Published Application for a user group (summary view).
R
Real-time Alert List (Excel)Real-time detailed alert information.
Real-time Device Summary (Excel)Real-time alert, network delay, processor usage, and memory usage summary information.
Real-time Network Performance (Excel)Real-time detailed network volume, delay, round trip time, and error information.
Real-time System Compare (Excel)Real-time performance counters from multiple devices for use in comparing system performance.
Real-time System Performance (Excel)Real-time detailed system, network, and process performance information.
Real-time XenApp Summary (Excel)Real-time performance counters from multiple XenApp servers for use in comparing system performance.
Real-time XenApp User Summary (Excel)Real-time system, application, and session information for a XenApp user.
RebootsDevice reboots (expected and unexpected).
S
Session Auto-ReconnectsSession Auto-Reconnects.
Session Client and Server Startup DurationAverage Session client startup duration (CSD) and server startup duration (SSD). Displays login duration.
Session Client Startup DurationElapsed time for client startup (from request to ICA connection). Displays login duration.
Session Client Startup Time ArchiveArchive report.
Session Client TypeClient type (ICA, RDP, or console) for sessions on a device.
Session CountsAverage active, inactive, and total session counts.
Session CPUAverage total CPU used by sessions.
Session CPU for a User GroupAverage total CPU used by sessions.
Session Duration !NewSession duration summary and detail.
Session Duration for a User Group !NewSession duration summary and detail for a user group.
Session Login TimeAverage login time for ICA sessions.
Session Login Time for a User Group

Document generated by Confluence on Nov 07, 2013 16:21 Page 133
Average login time for ICA sessions.
Session MemoryMemory (virtual, private, and working set) used by sessions.
Session Network Bandwidth UsedNetwork bandwidth (peak and average input and output) used by sessions.
Session Network DelaySession network delay, broken down by server, client, and network delay.
Session Network Delay for a User GroupSession network delay, broken down by server, client, and network delay.
Session Network Round Trip TimeMaximum and average round trip time (RTT) for sessions.
Session Network Round Trip Time for a User GroupMaximum and average round trip time (RTT) for sessions.
Session Network VolumeSession network volume (kilobytes sent and received).
Session Network Volume for a User GroupSession network volume (kilobytes sent and received).
Session Page FaultsAverage number of page faults per second for sessions.
Session Performance ArchiveArchive report for Session Performance data. Use this report to export Session Performance data from theEdgeSight database.
Session Server Startup DurationAverage time to startup a session on a Presentation Server.
Session Server Startup Time ArchiveArchive report.
Session Startup Duration DetailsSession client startup duration (CSD) and server startup duration (SSD). This contains the followingserver-side metrics: CASD, CONSD, COSD, PNCOSD, PLSD, LSEED, PCSID, DMSD, and SCSD. It alsocontains the following client-side metrics: CFDCD, BUCC, AECD, COCD, IFDCD, NRWD, TRWD, LPWD,SCCD, NRCD, and SLCD.
Site Network DelaySite network delay, broken down by server, client, and network delay.
Site Network ErrorsNetwork errors (transaction and Winsock) for a site.
Site Network Errors for a User GroupNetwork errors (transaction and Winsock) for a site.
Site Network Round Trip TimeMaximum and average round trip time (RTT) for sites.
Site Network VolumeSite network volume (kilobytes sent and received).
Software Asset ChangesRecent changes to software assets on devices.
System CPUSystem CPU usage (privileged time, user time, and total CPU).
System CPU SummaryCPU percent usage summary for devices.

Document generated by Confluence on Nov 07, 2013 16:21 Page 134
System Disk UsageDisk usage shown as percent free disk space.
System Disk Usage ArchiveArchive report.
System Disk Usage SummarySummary of disk usage with disk capacity and percent free disk space.
System Kernel for a DeviceSystem kernel activity (context switches, system calls, interrupts, and process count) for devices.
System Memory for a User GroupMemory (virtual, private, and working set) used by sessions.
System Memory SummaryPhysical memory percent usage summary for devices.
System Memory UsageAverage percent memory used for devices.
System Page FaultsAverage page faults per second for devices.
System Performance ArchiveArchive report.
T
Trace Event ArchiveArchive report.
Transaction Network DelayTransaction network delay, broken down by server, client, and network delay.
Transaction Network Round Trip TimeMaximum and average round trip time (RTT) for transactions.
Transaction Network VolumeNetwork volume (KB) for transactions by host.
Transaction Web ErrorsWeb errors associated with a host and transaction.
U
User Logon CountsNumber of XenApp and XenDesktop users who have logged on.
User Logon DetailsXenApp and XenDesktop user logons counts, times, and client information. This also displays the numberof sessions created.
User Logon Details for a User GroupXenApp and XenDesktop user logons counts, times, and client information. This also displays the numberof sessions created.
User Summary for a User GroupUser experience by user group summary (ICA RTT, login time, process errors, and recent sessions).
V
Visited SitesSites visited by site name and address, with the number of visits and date of last visit.
Document generated by Confluence on Nov 07, 2013 16:21 Page 135
X
XenApp Server UtilizationAverage CPU, average memory, and peak concurrent sessions for XenApp servers. This report containsinformation about the most heavily loaded servers. This report was added for the EdgeSight for XenApp5.2 release.
XenApp SummaryXenApp performance data (login time, active sessions, ICA session latency, and CPU and memory usage).
XenApp System Performance ArchiveArchive report for XenApp System Performance data. Use this report to export XenApp SystemPerformance data from the EdgeSight database.
XenApp User SummaryXenApp performance from a user perspective (ICA client traffic, login time, ICA session latency, andrecent sessions).
XenDesktop SummaryXenDesktop performance data (login time, active sessions, ICA session latency, and CPU and memoryusage).
XenDesktop User SummaryXenDesktop performance from a user perspective (ICA client traffic, login time, ICA session latency, andrecent sessions).
Comments
Hi, anyone know how to find Published report tag New! on this page ?
Edgdesight was update on 5.4.6.3
Thanks for ur help.
Posted by laurent.boursin at Dec 28, 2011......................................................................................................................................................................
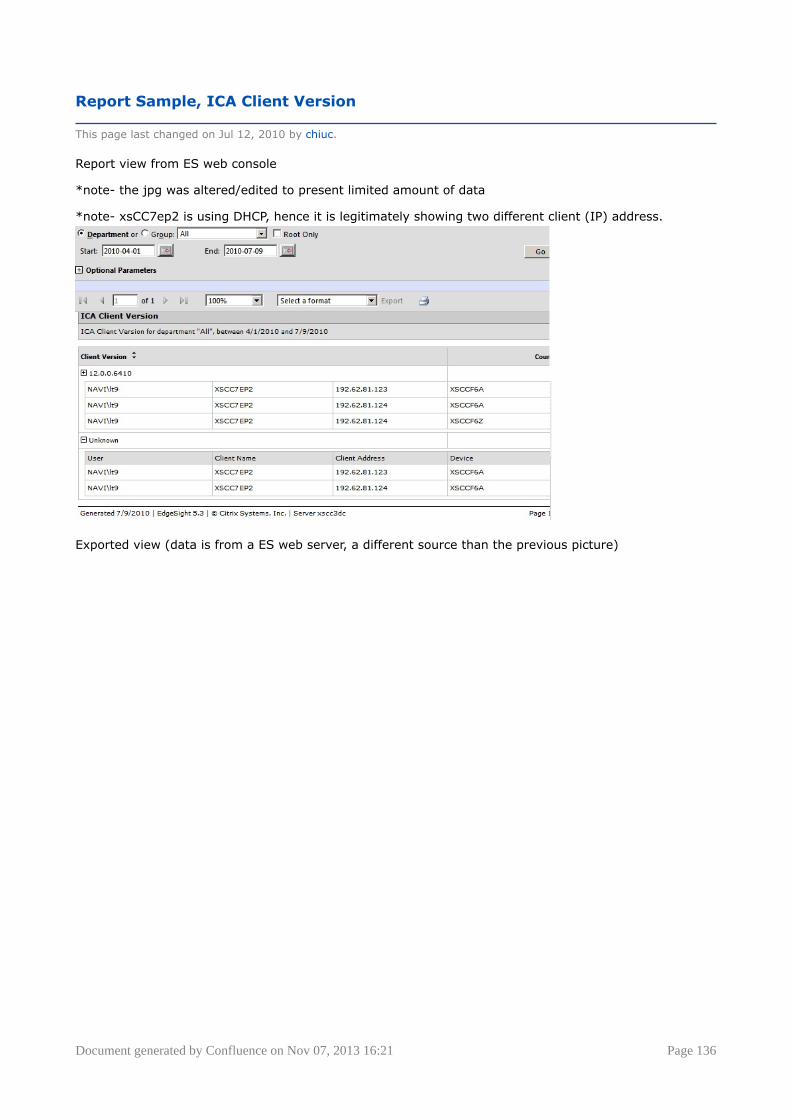
Document generated by Confluence on Nov 07, 2013 16:21 Page 136
Report Sample, ICA Client Version
This page last changed on Jul 12, 2010 by chiuc.
Report view from ES web console
*note- the jpg was altered/edited to present limited amount of data
*note- xsCC7ep2 is using DHCP, hence it is legitimately showing two different client (IP) address.
Exported view (data is from a ES web server, a different source than the previous picture)
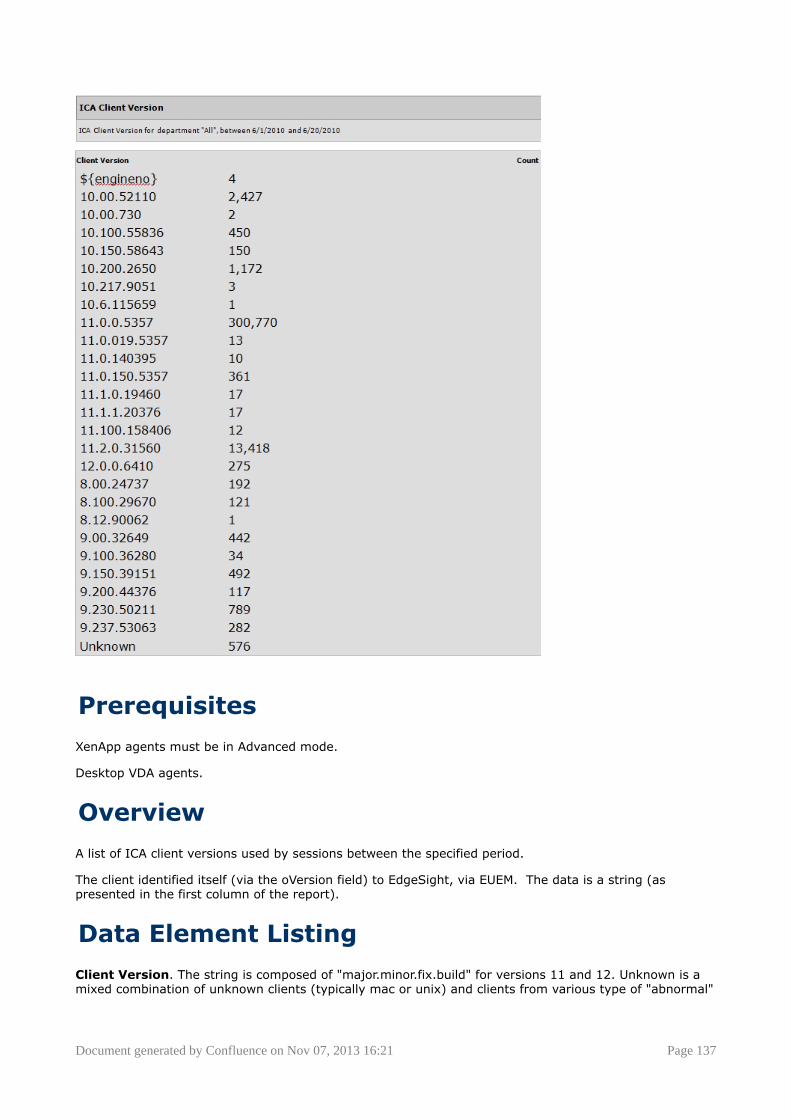
Document generated by Confluence on Nov 07, 2013 16:21 Page 137
Prerequisites
XenApp agents must be in Advanced mode.
Desktop VDA agents.
Overview
A list of ICA client versions used by sessions between the specified period.
The client identified itself (via the oVersion field) to EdgeSight, via EUEM. The data is a string (aspresented in the first column of the report).
Data Element Listing
Client Version. The string is composed of "major.minor.fix.build" for versions 11 and 12. Unknown is amixed combination of unknown clients (typically mac or unix) and clients from various type of "abnormal"
Document generated by Confluence on Nov 07, 2013 16:21 Page 138
sessions. The client can be drilled into to display the following information- user, client name, clientaddress, and device.*
• User- the domain user that started the session.• Client Name- the name of the client that started the session.• Client Address- the IP of the client name.• Device- the XenApp server hosting the session.
Count. The number of sessions invoked, during the specified period, by the version of client.
Further Details
unknown
As you can see from the first picture (report taken from a lab environment)- xsCC7ep2 is using version12.0.0.6410 to access a XenApp session. However, there are two unknown client counts attributed tothe same lab environment. This can be caused in different ways- for example, a session terminated tooquickly to provide the oVersion field to EUEM. Basically if EdgeSight is unable to obtain the client versioninformation (oVersion is blank or EUEM never received the data)- then it is "unknown."
Mac client of version 11.2.xx.yy (before July 2010) will be counted as unknown. A future change to themac client will contain an identifier in the oVersion field for EdgeSight.
${engineno}
This is the string shown for Blackberry devices. It is expected that this string will be different in thefuture.
TBD
a wiki page on client version mapping would be useful.
Document generated by Confluence on Nov 07, 2013 16:21 Page 139
Report Sample, User Logon Counts
This page last changed on Jun 22, 2011 by chiuc.
Here is what this report looks like.
xa_vda_user_logon_count.mhtml
Document generated by Confluence on Nov 07, 2013 16:21 Page 140
EdgeSight 5.2 Report List
This page last changed on Apr 29, 2010 by ronaldb.For definitions of metrics, see Report Counters Glossary.
Important: To find out what reports use a specific metric, in the EdgeSight Server Console, click theBrowse tab and type the name of the metric in the Search box in the user interace (not the Find, CTRL+ F, feature in the Web browser). You can also find reports by entering a report name or description inthe Search box.
A B C D E F G H I J K L M N O P Q R S T U V W X Y Z
A
AlertsNumber of alerts by type with alert details.
Application Response FailuresActive Application Response test and monitoring point failure and success counts.
Application Response TimeActive Application Response test and monitoring point durations.
Application Response Time for a TestActive Application Response duration and status for a test.
Asset ChangesChanges to hardware and software device assets.
Assets for a DeviceHardware and software assets on a device.
C
CPU Utilization ManagementCPU Utilization Management status (enabled or disabled), plus average and peak CPU usage.
D
Device ArchiveArchive report.
Device SummaryDevice performance data (CPU and memory usage, network delay, event log alerts, and applicationerrors).
E
Environmental UsageData on users, clients, sessions (start, end, and duration), published applications, and processes.
Environmental Usage ArchiveArchive report for Environmental Usage data. Use this report to export Environmental Usage data fromthe EdgeSight database.
Error ArchiveArchive report.Event Log AlertsEvent log alerts with alert details.
Event Log Alerts for a User GroupEvent log alerts with alert details.
H
Hardware Alerts
Document generated by Confluence on Nov 07, 2013 16:21 Page 141
Hardware alerts (reboot, disk failure, and plug and play changes) with alert details.
Hardware Asset ChangesRecent changes to hardware assets on devices.
HDX MediaStream I/OSpeedscreen Multimedia input and output for HDX sessions.
HDX Plug-n-Play I/OUSB and Smart Card input and output for HDX sessions.
I
ICA Audio I/OAudio input and output bandwidth used during ICA sessions.
ICA Client VersionThe version of the client used during ICA sessions.
ICA Drive I/ODrive input and output bandwidth for file operations during ICA sessions.
ICA Printer IOPrinter input and output bandwidth used during ICA sessions as well as the printer name and printerdriver name. This report can be grouped by User, Device, Date, and Hour.
ICA Session CompressionDisplays the compression ratios used from server to client (ICA Session Compression Output (%))andclient to server (ICA Session Compression Input (%)).
ICA Session I/OInput and output line speed for ICA sessions.
ICA Session LatencyLatency (peak and average) for ICA sessions. Only pertains to pre-4.5 Presentation Servers. PresentationServers with EUEM data will not be reflected on this report.
ICA Session Latency for a User GroupLatency (peak and average) for ICA sessions. Only pertains to pre-4.5 Presentation Servers. PresentationServers with EUEM data will not be reflected on this report.
ICA Session Round Trip TimeICA session and network round trip time (RTT). Only pertains to EdgeSight Presentation Server Agents4.5 and later, Presentation Server 4.5 and later (Enterprise or Platinum Editions), and ICA Client version10 and later. Pre 4.5 Presentation Servers data will not be reflected on this report.
ICA Session Round Trip Time ArchiveArchive report.
ICA Session Round Trip Time for a User GroupICA session and network round trip time (RTT). Only pertains to EdgeSight Presentation Server Agents4.5 and later, Presentation Server 4.5 and later (Enterprise or Platinum Editions), and ICA Client version10 and later. Pre 4.5 Presentation Servers data will not be reflected on this report.
ICA Session TrafficTraffic (peak and average input and output) for ICA sessions.
ICA Session Traffic for a User GroupTraffic (peak and average input and output) for ICA sessions.
ICA Video I/OVideo frame and SpeedScreen input and output for ICA sessions.
IMA Service AvailabilityCurrent IMA service availability status and the time since the last state change.
IMA Service State
Document generated by Confluence on Nov 07, 2013 16:21 Page 142
Current IMA service state and the time since the last state change.
N
Network Connection ArchiveArchive report.
Network SummarySummary of network performance for a site (delay, volume, RTT, and transaction errors).
Network Summary by SiteSummary of network performance (delay, RTT, Web errors, and transaction errors).
Network Transaction ArchiveArchive report.
Network Transaction SummarySummary of network performance for a transaction (delay, volume, RTT, and Web errors).
New ProcessesNew processes detected on devices with the date first seen.
New SitesNew sites detected on devices with the date first seen.
P
Port Network DelayPort network delay, broken down by server, client, and network delay.
Port Network Round Trip TimeMaximum and average round trip time (RTT) for ports.
Port Network VolumePort network volume (kilobytes sent and received).
Port Web ErrorsWeb errors (transaction and Winsock) for a port.
Process CPUProcess CPU usage (privileged time, user time, and total CPU).
Process Cumulative CPUProcess Cumulative CPU usage time.
Process ErrorsProcess errors with alert details.
Process Errors for a User GroupProcess errors with alert details.
Process FaultsProcess faults (crashes) with alert details.
Process Faults for a User GroupProcess faults (crashes) with alert details.
Process Memory UsageMemory (virtual, private, and working set) used by processes.
Process Network DelayProcess network delay, broken down by server, client, and network delay.
Process Network VolumeProcess network volume (kilobytes sent and received).
Process Not Responding Alerts
Document generated by Confluence on Nov 07, 2013 16:21 Page 143
Process not responding (application hang) conditions with alert details.
Process Not Responding Alerts for a User GroupProcess not responding (application hang) conditions with alert details.
Process Pages Per SecondAverage pages per second for processes.
Process Performance ArchiveArchive report.
Process Performance Summary by ProcessProcess performance summary (high CPU or memory usage, long network delay or active time).
Process Stability Summary by ProcessProcesses with the most stability issues (errors, faults, hangs, and transaction errors.)
Process SummarySummary of process performance (CPU and memory usage, network delay, and errors).
Process Thread CountAverage number of active threads for processes.
Process UsageActive and running time for processes, plus the number of unique users.
Process Usage ArchiveArchive report.
R
[ns:EXCEL] Real-time Alert ListReal-time detailed alert information.
[ns:EXCEL] Real-time Device SummaryReal-time alert, network delay, processor usage, and memory usage summary information.
[ns:EXCEL] Real-time Network PerformanceReal-time detailed network volume, delay, round trip time, and error information.
[ns:EXCEL] Real-time System CompareReal-time performance counters from multiple devices for use in comparing system performance.
[ns:EXCEL] Real-time System PerformanceReal-time detailed system, network, and process performance information.
[ns:EXCEL] Real-time XenApp SummaryReal-time performance counters from multiple XenApp servers for use in comparing system performance.
[ns:EXCEL] Real-time XenApp User SummaryReal-time system, application, and session information for a XenApp user.
RebootsDevice reboots (expected and unexpected).
S
Session Auto-ReconnectsSession Auto-Reconnects.
Session Client and Server Startup DurationAverage Session client startup duration (CSD) and server startup duration (SSD). Displays login duration.
Session Client Startup DurationElapsed time for client startup (from request to ICA connection). Displays login duration.
Session Client Startup Time Archive
Document generated by Confluence on Nov 07, 2013 16:21 Page 144
Archive report.
Session Client TypeClient type (ICA, RDP, or console) for sessions on a device.
Session CountsAverage active, inactive, and total session counts.
Session CPUAverage total CPU used by sessions.
Session CPU for a User GroupAverage total CPU used by sessions.
Session Login TimeAverage login time for ICA sessions.
Session Login Time for a User GroupAverage login time for ICA sessions.
Session MemoryMemory (virtual, private, and working set) used by sessions.
Session Network Bandwidth UsedNetwork bandwidth (peak and average input and output) used by sessions.
Session Network DelaySession network delay, broken down by server, client, and network delay.
Session Network Delay for a User GroupSession network delay, broken down by server, client, and network delay.
Session Network Round Trip TimeMaximum and average round trip time (RTT) for sessions.
Session Network Round Trip Time for a User GroupMaximum and average round trip time (RTT) for sessions.
Session Network VolumeSession network volume (kilobytes sent and received).
Session Network Volume for a User GroupSession network volume (kilobytes sent and received).
Session Page FaultsAverage number of page faults per second for sessions.
Session Performance ArchiveArchive report for Session Performance data. Use this report to export Session Performance data from theEdgeSight database.
Session Server Startup DurationAverage time to startup a session on a Presentation Server.
Session Server Startup Time ArchiveArchive report.
Session Startup Duration DetailsSession client startup duration (CSD) and server startup duration (SSD). This contains the followingserver-side metrics: CASD, CONSD, COSD, PNCOSD, PLSD, LSEED, PCSID, DMSD, and SCSD. It alsocontains the following client-side metrics: CFDCD, BUCC, AECD, COCD, IFDCD, NRWD, TRWD, LPWD,SCCD, NRCD, and SLCD.
Site Network DelaySite network delay, broken down by server, client, and network delay.
Site Network ErrorsNetwork errors (transaction and Winsock) for a site.

Document generated by Confluence on Nov 07, 2013 16:21 Page 145
Site Network Errors for a User GroupNetwork errors (transaction and Winsock) for a site.
Site Network Round Trip TimeMaximum and average round trip time (RTT) for sites.
Site Network VolumeSite network volume (kilobytes sent and received).
Software Asset ChangesRecent changes to software assets on devices.
System CPUSystem CPU usage (privileged time, user time, and total CPU).
System CPU SummaryCPU percent usage summary for devices.
System Disk UsageDisk usage shown as percent free disk space.
System Disk Usage ArchiveArchive report.
System Disk Usage SummarySummary of disk usage with disk capacity and percent free disk space.
System Kernel for a DeviceSystem kernel activity (context switches, system calls, interrupts, and process count) for devices.
System Memory for a User GroupMemory (virtual, private, and working set) used by sessions.
System Memory SummaryPhysical memory percent usage summary for devices.
System Memory UsageAverage percent memory used for devices.
System Page FaultsAverage page faults per second for devices.
System Performance ArchiveArchive report.
T
Trace Event ArchiveArchive report.
Transaction Network DelayTransaction network delay, broken down by server, client, and network delay.
Transaction Network Round Trip TimeMaximum and average round trip time (RTT) for transactions.
Transaction Network VolumeNetwork volume (KB) for transactions by host.
Transaction Web ErrorsWeb errors associated with a host and transaction.
U
User Logon CountsNumber of XenApp and XenDesktop users who have logged on.
Document generated by Confluence on Nov 07, 2013 16:21 Page 146
User Logon DetailsXenApp and XenDesktop user logons counts, times, and client information. This also displays the numberof sessions created.
User Logon Details for a User GroupXenApp and XenDesktop user logons counts, times, and client information. This also displays the numberof sessions created.
User Summary for a User GroupUser experience by user group summary (ICA RTT, login time, process errors, and recent sessions).
V
Visited SitesSites visited by site name and address, with the number of visits and date of last visit.
X
XenApp Server UtilizationAverage CPU, average memory, and peak concurrent sessions for XenApp servers. This report containsinformation about the most heavily loaded servers. This report was added for the EdgeSight for XenApp5.2 release.
XenApp SummaryXenApp performance data (login time, active sessions, ICA session latency, and CPU and memory usage).
XenApp System Performance ArchiveArchive report for XenApp System Performance data. Use this report to export XenApp SystemPerformance data from the EdgeSight database.
XenApp User SummaryXenApp performance from a user perspective (ICA client traffic, login time, ICA session latency, andrecent sessions).
XenDesktop SummaryXenDesktop performance data (login time, active sessions, ICA session latency, and CPU and memoryusage).
XenDesktop User SummaryXenDesktop performance from a user perspective (ICA client traffic, login time, ICA session latency, andrecent sessions).
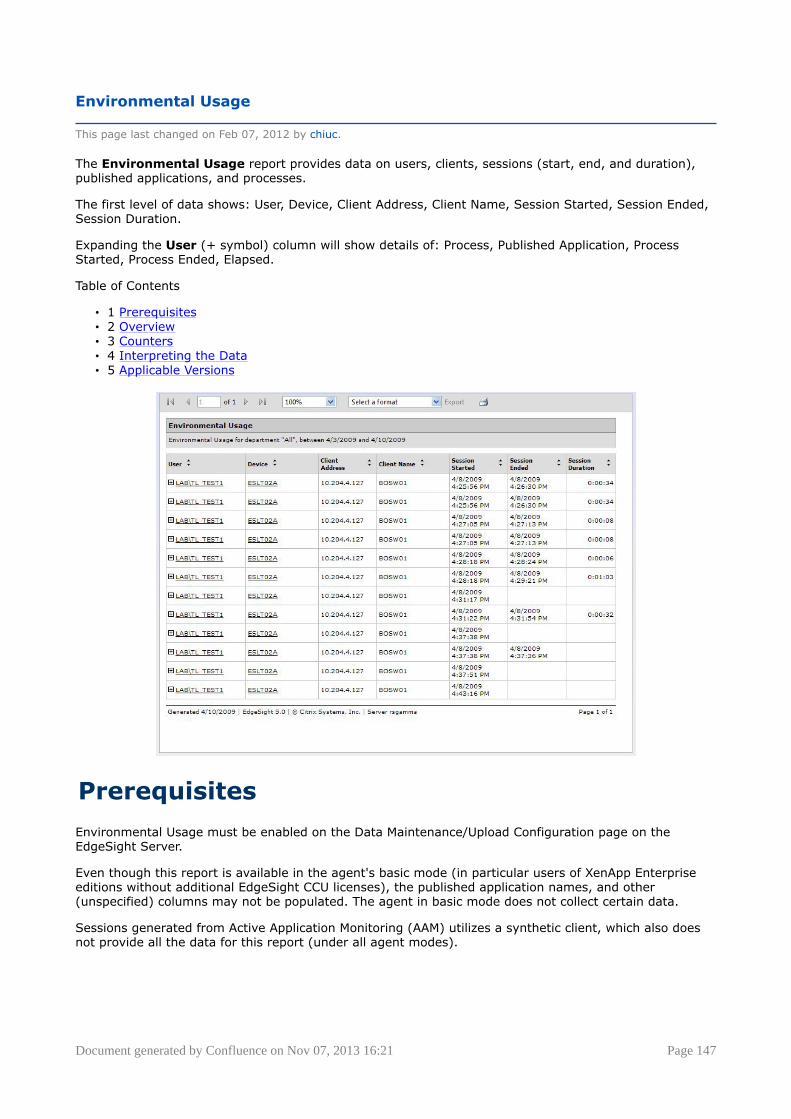
Document generated by Confluence on Nov 07, 2013 16:21 Page 147
Environmental Usage
This page last changed on Feb 07, 2012 by chiuc.
The Environmental Usage report provides data on users, clients, sessions (start, end, and duration),published applications, and processes.
The first level of data shows: User, Device, Client Address, Client Name, Session Started, Session Ended,Session Duration.
Expanding the User (+ symbol) column will show details of: Process, Published Application, ProcessStarted, Process Ended, Elapsed.
Table of Contents
• 1 Prerequisites• 2 Overview• 3 Counters• 4 Interpreting the Data• 5 Applicable Versions
Prerequisites
Environmental Usage must be enabled on the Data Maintenance/Upload Configuration page on theEdgeSight Server.
Even though this report is available in the agent's basic mode (in particular users of XenApp Enterpriseeditions without additional EdgeSight CCU licenses), the published application names, and other(unspecified) columns may not be populated. The agent in basic mode does not collect certain data.
Sessions generated from Active Application Monitoring (AAM) utilizes a synthetic client, which also doesnot provide all the data for this report (under all agent modes).

Document generated by Confluence on Nov 07, 2013 16:21 Page 148
Overview
For EdgeSight versions 5.0 through 5.2, this is the only report that displays published applications data.EdgeSight 5.3 includes new published applications reports which provide information on launches andunique users.
Note that there is an archive version of this report which can be stored and retrieved for long-termanalysis of usage patterns.
Counters
• Client Address• Client Name• Session Started• Session Ended• Session Duration
Interpreting the Data
Applicable Versions
EdgeSight 5.4EdgeSight 5.3EdgeSight 5.2EdgeSight 5.1EdgeSight 5.0

Document generated by Confluence on Nov 07, 2013 16:21 Page 149
ICA Printer IO
This page last changed on Feb 09, 2010 by sarahv.

Document generated by Confluence on Nov 07, 2013 16:21 Page 150
ICA Session Compression
This page last changed on Sep 02, 2011 by ronaldb1.
This report displays the amount (as a percentage) that traffic from the server to client (ICA SessionCompression Output (%)) and client to server (ICA Session Compression Input (%)) is compressed.
Table of Contents
• 1 Overview• 2 Counters• 3 Applicable Versions
Overview
Counters
• ICA Session Compression Input(%)• ICA Session Compression Output(%)
Applicable Versions
EdgeSight 5.4EdgeSight 5.3EdgeSight 5.2EdgeSight 5.1EdgeSight 5.0
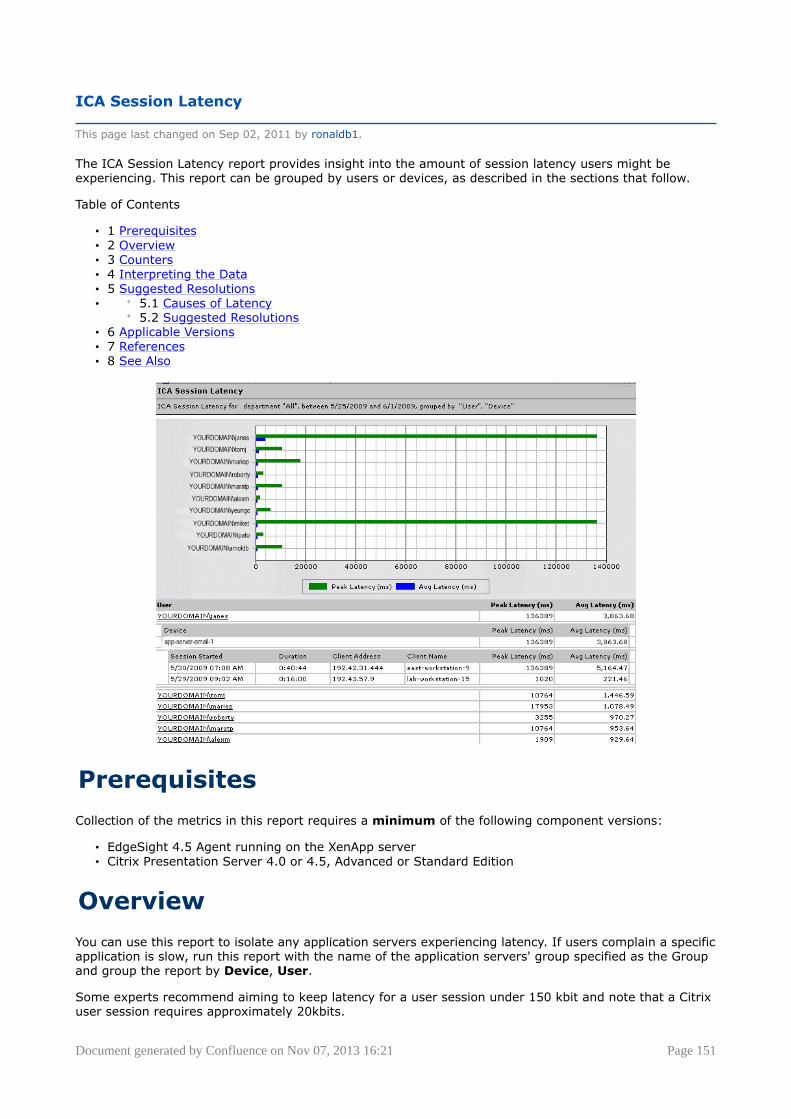
Document generated by Confluence on Nov 07, 2013 16:21 Page 151
ICA Session Latency
This page last changed on Sep 02, 2011 by ronaldb1.
The ICA Session Latency report provides insight into the amount of session latency users might beexperiencing. This report can be grouped by users or devices, as described in the sections that follow.
Table of Contents
• 1 Prerequisites• 2 Overview• 3 Counters• 4 Interpreting the Data• 5 Suggested Resolutions• ° 5.1 Causes of Latency
° 5.2 Suggested Resolutions• 6 Applicable Versions• 7 References• 8 See Also
Prerequisites
Collection of the metrics in this report requires a minimum of the following component versions:
• EdgeSight 4.5 Agent running on the XenApp server• Citrix Presentation Server 4.0 or 4.5, Advanced or Standard Edition
Overview
You can use this report to isolate any application servers experiencing latency. If users complain a specificapplication is slow, run this report with the name of the application servers' group specified as the Groupand group the report by Device, User.
Some experts recommend aiming to keep latency for a user session under 150 kbit and note that a Citrixuser session requires approximately 20kbits.
Document generated by Confluence on Nov 07, 2013 16:21 Page 152
Note: ICA session latency only pertains to Presentation Server 4.0 or 4.5 (Standard and AdvancedEditions only).
Counters
• Peak Latency (ms)• Avg Latency (ms)
Interpreting the Data
The following provides a suggested process for interpreting the data and isolating the cause of thelatency.
To begin interpreting this report
1. Look for any outlying data points for users or devices. For example, if the report is groupedprimarily by users, any users with double the session latency, such as "JaneS" and "MikeT" in thescreen capture above. In this screen capture, the Peak Latency for "JaneS" is over ten times thePeak Latency of other users. In this report, the summary value for Peak Latency is the highest valuereached ever; it is not an average of the Peak Latency for all sessions. However, the summary valuefor the Average Latency is an average of the average latency reported for each session.
2. Expand the outlying data point for more detail. 3. Compare the Peak Latency with the Avg Latency. Is the user experiencing latency all the time or
only at certain times?4. Compare the individual sessions to each other. Is there one session that has more latency than the
others? If so, where any events or upgrades occurring on the network? What about that applicationserver's group? Was that server overloaded? To investigate server and farm health, see
5. (Optional.) If there was one server with more latency than the others, rerun the ICA SessionLatency report grouped by Device, then User. Specify the name of the application server where theuser experienced latency in the optional parameters.
6. (Optional.) Consider rerunning this report grouped by Hour if you are trying to correlate the latencyagainst network events, such as outages or upgrades.
After reviewing this data, run the following reports determine if the latency is prominent on a particularvirtual channel.
Start by running one of the ICA I/O reports (ICA Audio I/O, ICA Audio I/O) for the most likely candidate.The application server where the latency occurred might indicate where to start. For example, if theserver hosts a Web browser, consider starting with the ICA Video I/O or the ICA Audio I/O report. If theserver hosts a graphics aplication or Word processing application, consider starting with the ICA Printer I/O.
When you run these reports, group the report first by device and specify the application server's name asan Optional Parameter.
When you determine the channel on whihc the latency is occurring, run the ICA Session Compressionreport to see how effectively the XenApp is compressing session data. If ICA Session Compression Output(%) is significantly less than the ICA Session Compression Input (%), then TBD - xxx.
You can also use the ICA Session Monitoring and Control (SMC) portion of the Citrix Server SoftwareDevelopment Kit (SDK) to test the impact of restricting bandwidth on specific channels.
1
Suggested Resolutions
This section alludes to potential causes of latency and points to resources for resolution.
Document generated by Confluence on Nov 07, 2013 16:21 Page 153
Causes of Latency
There are a variety of reasons for latency in sessions, including:
• Incorrect application scalability or excessive numbers of users connecting to the application server --see
° Outage of another server in a load managed group• Network bandwidth issues
° Excessive bandwidth devoted to printing - see• Incorrect or suboptimal network design: the data store should be on the same subnet as most of the
XenApp servers to minimize network traffic, file servers should be peer nodes in the same subnetas the farm servers. Also, consider teaming network cards in servers that initiate and maintainsessions, such as the Web Interface.
Suggested Resolutions
• Consider whether you can disable features that consume a lot of bandwidth, such as audio andmultimedia.
• Session latency can also be improved by enabling features such as the SpeedScreen Accelerationfeatures, Heavyweight Compression, SpeedScreen Latency Reduction, ICA Display, and ICA Browser.See the Citrix XenApp Administrator's Guide. Using mandatory profiles can help reduce latency.
In some cases, low bandwidth leads to session timeouts. You can mitigate this issue by ensuring theSession Reliability, Auto Client Reconnect, and ICA Keep Alive features are enabled.
Applicable Versions
EdgeSight 5.4EdgeSight 5.3EdgeSight 5.2EdgeSight 5.1EdgeSight 5.0
References
See Also
• Citrix Knowledge Center Support Forum post, "ICA session latency." Accessed on June 1, 2009.
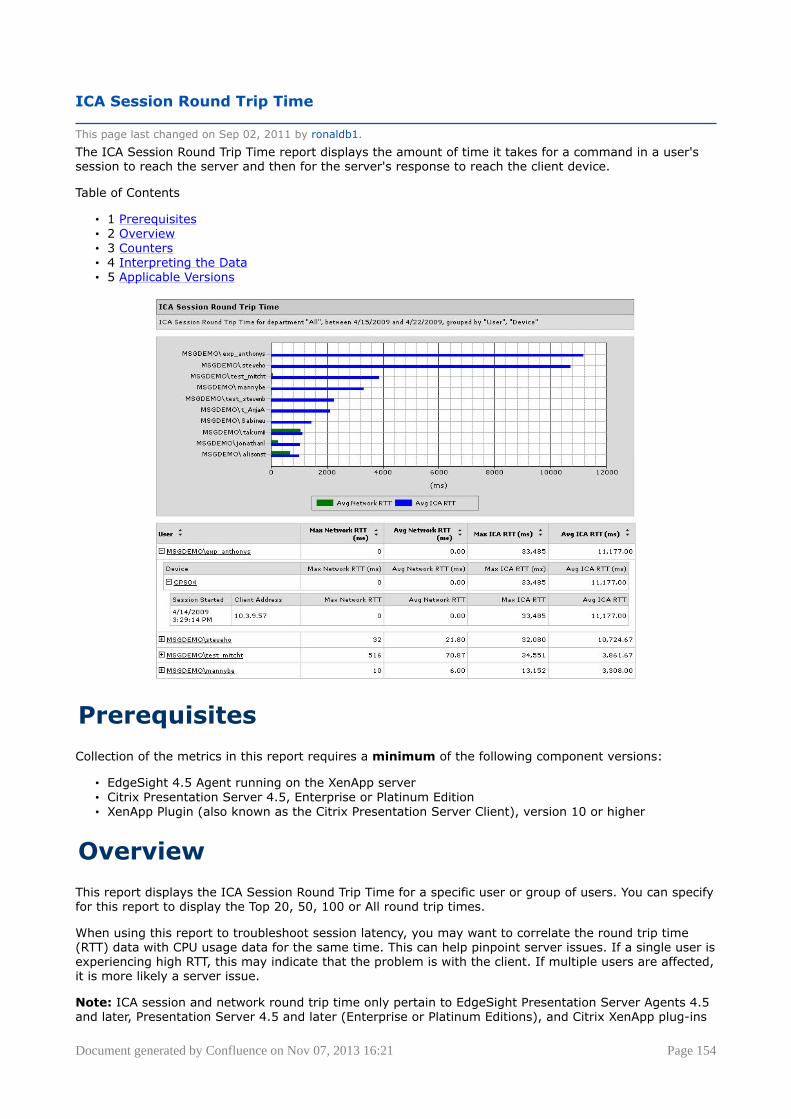
Document generated by Confluence on Nov 07, 2013 16:21 Page 154
ICA Session Round Trip Time
This page last changed on Sep 02, 2011 by ronaldb1.
The ICA Session Round Trip Time report displays the amount of time it takes for a command in a user'ssession to reach the server and then for the server's response to reach the client device.
Table of Contents
• 1 Prerequisites• 2 Overview• 3 Counters• 4 Interpreting the Data• 5 Applicable Versions
Prerequisites
Collection of the metrics in this report requires a minimum of the following component versions:
• EdgeSight 4.5 Agent running on the XenApp server• Citrix Presentation Server 4.5, Enterprise or Platinum Edition• XenApp Plugin (also known as the Citrix Presentation Server Client), version 10 or higher
Overview
This report displays the ICA Session Round Trip Time for a specific user or group of users. You can specifyfor this report to display the Top 20, 50, 100 or All round trip times.
When using this report to troubleshoot session latency, you may want to correlate the round trip time(RTT) data with CPU usage data for the same time. This can help pinpoint server issues. If a single user isexperiencing high RTT, this may indicate that the problem is with the client. If multiple users are affected,it is more likely a server issue.
Note: ICA session and network round trip time only pertain to EdgeSight Presentation Server Agents 4.5and later, Presentation Server 4.5 and later (Enterprise or Platinum Editions), and Citrix XenApp plug-ins
Document generated by Confluence on Nov 07, 2013 16:21 Page 155
with the ICA engine (client version 10 and later). Data from servers running versions of XenApp releasedbefore Presentation Server 4.5 does not appear on this report.
Counters
• Avg Network RTT (ms)• Avg ICA RTT (ms)
Interpreting the Data
See the following article for an explanation of EUEM metrics: http://support.citrix.com/article/CTX114495
Applicable Versions
• EdgeSight 5.4• EdgeSight 5.3• EdgeSight 5.2• EdgeSight 5.1• EdgeSight 5.0
Document generated by Confluence on Nov 07, 2013 16:21 Page 156
Process Faults
This page last changed on Apr 29, 2010 by danag.
This Process Faults report lets the administrator select a particular process (or software application) andview each crash that has occurred over a specified time frame.
Table of Contents
• 1 Overview• 2 Counters• 3 Interpreting the Data• 4 See Also
Overview
The data is grouped by day by default. Expanding any of the dates where there are crashes will display
the details surrounding the event. Clicking on the info button will open a dialogue box where the crashfiles collected can be downloaded.
Counters
• Average Memory Usage• Average CPU• Average Network Delay• Errors, Hangs, Faults
Interpreting the Data
For example, it is possible to generate this report on specific applications published on your XenApp farm,such as Microsoft Word, or categories of applications, such as "Graphics Programs."
This is a summary report comprising four sub-reports:
• Average Memory Usage by Day (in KB)• Average CPU by Day• Average Network Delay by Day• Errors, Hanage, Faults by Day
Clicking on one of the reports lets you display that report in additional detail. For example, clicking on theAverage Network Delay by Day report displays an expanded version of the report (that is, the ProcessNetwork Delay), which includes a list of processes using network resources.
A common misconception is that Citrix EdgeSight defines an application as hung only if the user isactively utilizing it in the foreground and it appears to hang. However, EdgeSight defines an applicationas hung even if the user is not using it at the time. More specifically, alerts are generated for applicationsrunning in the background when the hang occurs.
A classic example of this is when Microsoft Outlook seems to hang when attempting to sync email overa slow network. Even though windows messages are not being sent to the Graphical User Interfaceand "not responding" appears in the window title bar, the application is still working behind the scenes.Most users have Microsoft Outlook running in the background while using other applications during thissynchronizing stage. Citrix EdgeSight records Microsoft Outlook as hanging even though the user is notusing it.
As a best practice, look at the Windows Task Manager while the application hang occurs. If Task Managerindicates the process is "not responding", then an alert should be generated, otherwise a deeperinvestigation may be required.

Document generated by Confluence on Nov 07, 2013 16:21 Page 157
See Also
• Citrix EdgeSight Process Hung Alert Explanation
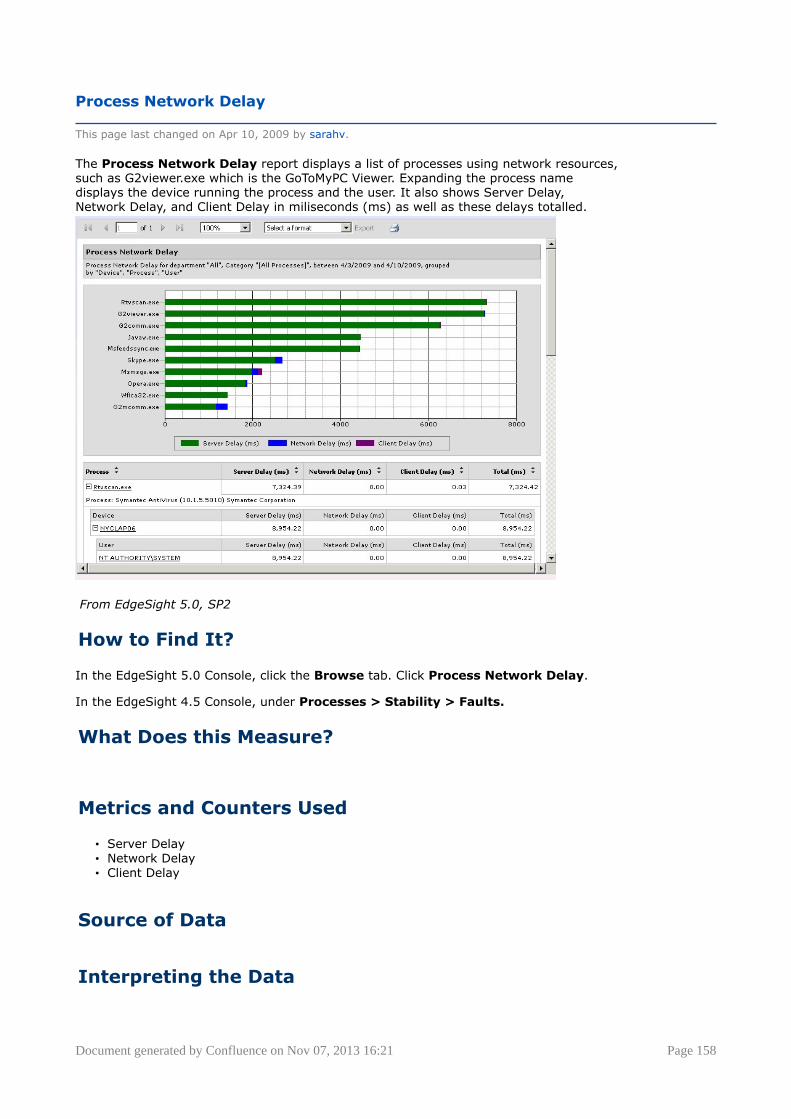
Document generated by Confluence on Nov 07, 2013 16:21 Page 158
Process Network Delay
This page last changed on Apr 10, 2009 by sarahv.
The Process Network Delay report displays a list of processes using network resources,such as G2viewer.exe which is the GoToMyPC Viewer. Expanding the process namedisplays the device running the process and the user. It also shows Server Delay,Network Delay, and Client Delay in miliseconds (ms) as well as these delays totalled.
From EdgeSight 5.0, SP2
How to Find It?
In the EdgeSight 5.0 Console, click the Browse tab. Click Process Network Delay.
In the EdgeSight 4.5 Console, under Processes > Stability > Faults.
What Does this Measure?
Metrics and Counters Used
• Server Delay• Network Delay• Client Delay
Source of Data
Interpreting the Data

Document generated by Confluence on Nov 07, 2013 16:21 Page 159
Additional Information
Customer Use Cases and Examples
Additional References
• Citrix EdgeSight Process Hung Alert Explanation

Document generated by Confluence on Nov 07, 2013 16:21 Page 160
Report Sample, CPU Utilization Management
This page last changed on Apr 30, 2010 by danag.
Table of Contents
• 1 Prerequisites• 2 Overview• 3 Data Element Listing
Prerequisites
Within XenApp - enable CPU Utilization Manager for the specific server (from the Access ManagementConsole).
Overview
• #1: The same filename (reported in a server) is repeated with different published applicationnames. The data collected only once, when the same user invoked the same application! The resulting table is very confusing when you have this situation. As shown, "iExplorer.exe"has a peak CPU of 18.75% and average of 0.10% by the same user "Anon000." The secondline information of iExplorer is redundant and is not counted separately for average (%). Iexplorer.exe is typically the program that caused redundant lines of information to appear- asthe XA administrator can published 2 links (e.g. cnn.com and youtube.com), or a desktop (whichappears as the iExplorer.exe program).
Document generated by Confluence on Nov 07, 2013 16:21 Page 161
• #2 : Because the architecture have only collected two average points (the sample screenshot isshowing 3 lines, but only 2 lines of data will be used)- the average is calculated as "(0.25+0.10)/2= 0.175" which is represented as "0.17" in the sample screenshot.
Data Element Listing
Device. The device name. All data in this report is aggregated and averaged for the device.
CPU Utilization Management. The values are "Enabled" or "Disabled." If the XenApp administratorallows the device to be managed by CPU Utilization Management, then it is shown as "Enabled." Regardless of this flag, the data for Peak and Average is collected and reported on.
Peak CPU (%). Peak CPU percentage used by a program on the device. The peak CPU% is read onevery polling point (15 seconds on XenApp; 5 seconds on EndPoints). If you have CPU spikes thatonly last <10 seconds randomly, there is a chance that such (or some) spike is never noticed byEdgeSight.NOTE- this value is not the Peak CPU of the machine!! It is the peak CPU used by onepublished application.
Average CPU (%). The average CPU % of the program being monitored. EdgeSight reporting datais stored as an hourly aggregate on the EdgeSight database. The average CPU tends to be lower thanexpected due to the fact that the data is the hourly aggregate.
Published Application. The name of the published application (as defined in XenApp AMC).
File Name. The name of the program being executed for the published application.
File Version. The file version of the program.
Peak CPU % User. The username of the person using the application.

Document generated by Confluence on Nov 07, 2013 16:21 Page 162
Report Sample, IMA Service Availability
This page last changed on Sep 02, 2011 by ronaldb1.
This report shows IMA Service availability status and the time since the last state change.
Table of Contents
• 1 Prerequisites• 2 Overview• 3 Interpreting the Data• 4 Applicable Versions
Prerequisites
• XenApp 4.5 or higher.• EdgeSight 5.0 or higher. This data is collected under all modes (both Advanced and Basic).
Overview
Interpreting the Data
The data columns "Service Up Time," "Planned Down Time," and "Unplanned Down Time" are selfexplanatory.
The data column "State Unknown Time" is driven by the last upload time of the Server. It is basically("End:" data - last upload time). The last upload time is not reflected on this report, which makes the"State Unknown Time" somewhat perplexing and mysterious. When you see 100% for the time period, itbasically means that the particular server have not uploaded data for the entire date range.
Using the picture from above-
* it is an 8 day report (4/23 - 4/30 inclusive).
Document generated by Confluence on Nov 07, 2013 16:21 Page 163
* the report was executed sometime on 4/30. To avoid seeing unknown time, do not include today's datein the report.
* D08R2-PARRA-DD1 last uploaded at 4/30 7:13:34, therefore 16:24:46 hours is unaccounted for due tothe end date time being 4/30 11:59:59 (or 4/31 00:00:00).
* DEV-DELAWARE-31 falls into a similar pattern with last uploaded at 4/30 6:21:24.
* all other servers have not uploaded data (or its data on the database is deleted) during this timeperiod. Given that these are test servers it is likely that they are just shutdown for the past 8 days.
Applicable Versions
EdgeSight 5.4EdgeSight 5.3EdgeSight 5.2EdgeSight 5.1EdgeSight 5.0
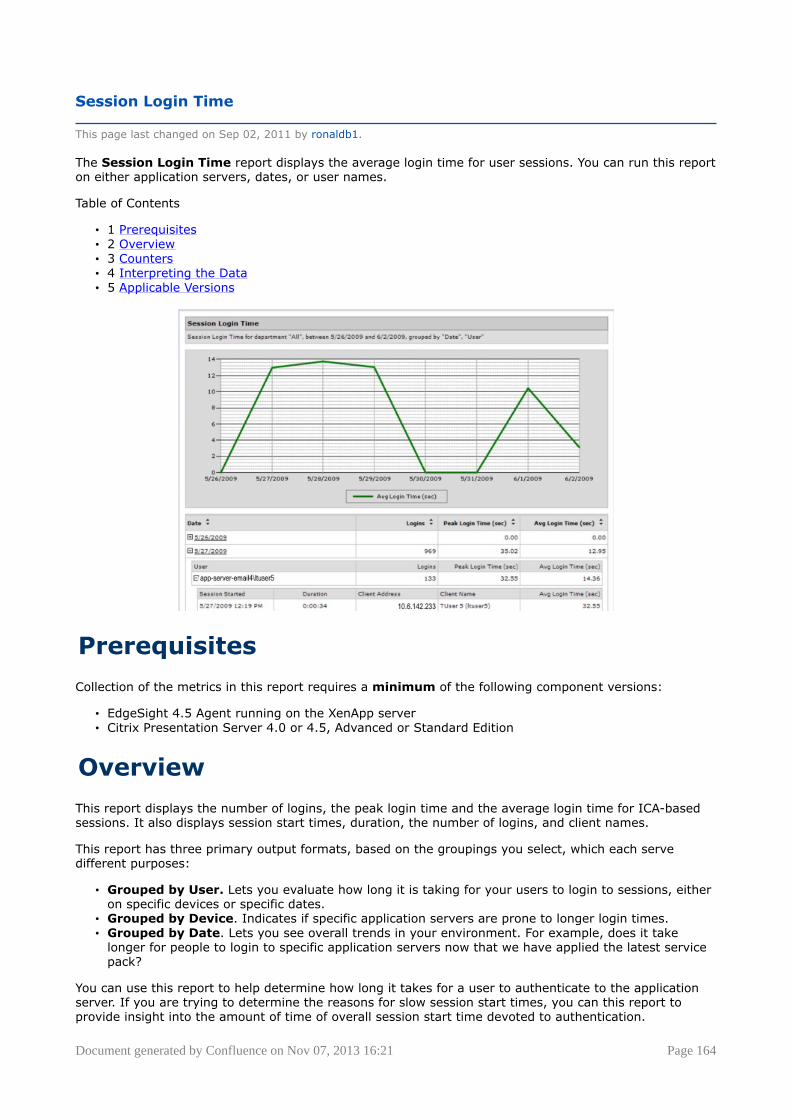
Document generated by Confluence on Nov 07, 2013 16:21 Page 164
Session Login Time
This page last changed on Sep 02, 2011 by ronaldb1.
The Session Login Time report displays the average login time for user sessions. You can run this reporton either application servers, dates, or user names.
Table of Contents
• 1 Prerequisites• 2 Overview• 3 Counters• 4 Interpreting the Data• 5 Applicable Versions
Prerequisites
Collection of the metrics in this report requires a minimum of the following component versions:
• EdgeSight 4.5 Agent running on the XenApp server• Citrix Presentation Server 4.0 or 4.5, Advanced or Standard Edition
Overview
This report displays the number of logins, the peak login time and the average login time for ICA-basedsessions. It also displays session start times, duration, the number of logins, and client names.
This report has three primary output formats, based on the groupings you select, which each servedifferent purposes:
• Grouped by User. Lets you evaluate how long it is taking for your users to login to sessions, eitheron specific devices or specific dates.
• Grouped by Device. Indicates if specific application servers are prone to longer login times.• Grouped by Date. Lets you see overall trends in your environment. For example, does it take
longer for people to login to specific application servers now that we have applied the latest servicepack?
You can use this report to help determine how long it takes for a user to authenticate to the applicationserver. If you are trying to determine the reasons for slow session start times, you can this report toprovide insight into the amount of time of overall session start time devoted to authentication.
Document generated by Confluence on Nov 07, 2013 16:21 Page 165
Note: Session Login Time only pertains to Presentation Server 4.0 or 4.5 (Standard and AdvancedEditions only).
Counters
• User• Logins• Peak Login Time (sec)• Avg Login Time (sec)
Interpreting the Data
Depending on the grouping options chosen, the axis vary. In the screen capture in this article, the Y axisrepresents seconds with the maximum number of the average login time being the highest value on theaxis. Consequently, this report lets you see trends in login times over a series of days.
Applicable Versions
• EdgeSight 5.4• EdgeSight 5.3• EdgeSight 5.2• EdgeSight 5.1• EdgeSight 5.0
Comments
It would be nice if we could create an alert based on this. Howto do this ?
Posted by at Nov 23, 2011......................................................................................................................................................................
Has anyone seen why the session login time is constantly 0? There are no errors in pulling up the report,yet it doesn't seem to collect the data properly. How can I fix this?
Posted by at Jan 24, 2012......................................................................................................................................................................
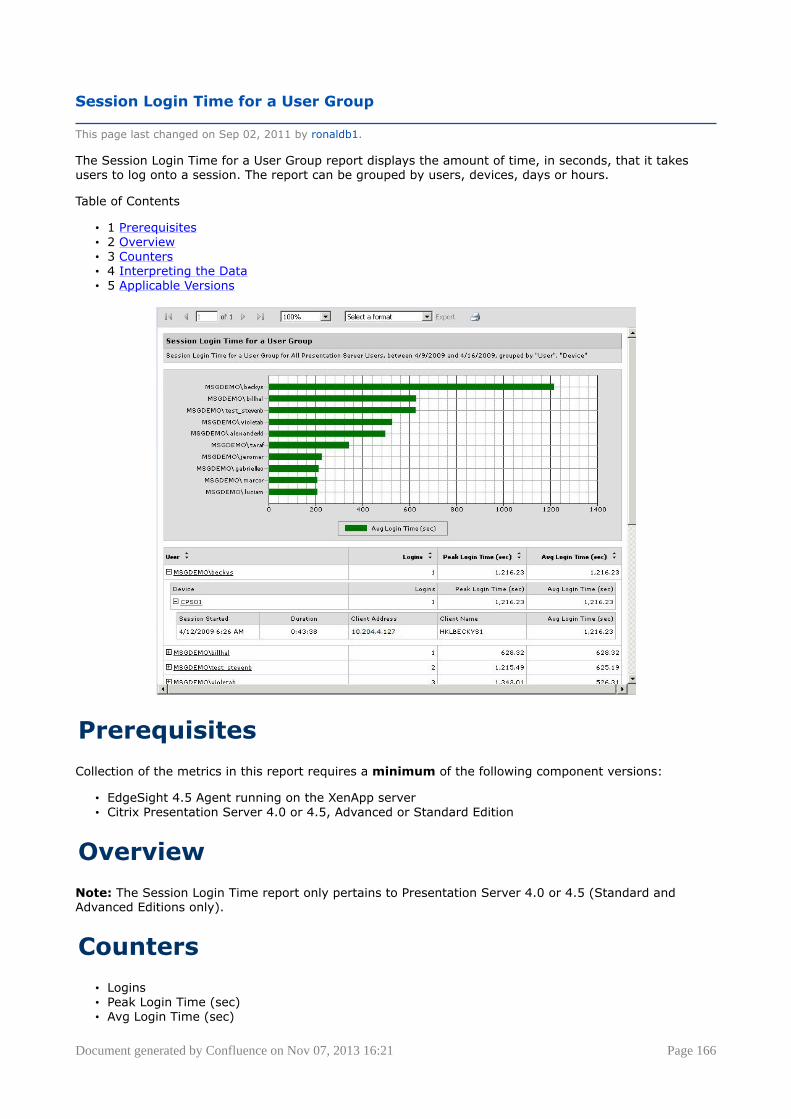
Document generated by Confluence on Nov 07, 2013 16:21 Page 166
Session Login Time for a User Group
This page last changed on Sep 02, 2011 by ronaldb1.
The Session Login Time for a User Group report displays the amount of time, in seconds, that it takesusers to log onto a session. The report can be grouped by users, devices, days or hours.
Table of Contents
• 1 Prerequisites• 2 Overview• 3 Counters• 4 Interpreting the Data• 5 Applicable Versions
Prerequisites
Collection of the metrics in this report requires a minimum of the following component versions:
• EdgeSight 4.5 Agent running on the XenApp server• Citrix Presentation Server 4.0 or 4.5, Advanced or Standard Edition
Overview
Note: The Session Login Time report only pertains to Presentation Server 4.0 or 4.5 (Standard andAdvanced Editions only).
Counters
• Logins• Peak Login Time (sec)• Avg Login Time (sec)
Document generated by Confluence on Nov 07, 2013 16:21 Page 167
Interpreting the Data
Applicable Versions
EdgeSight 5.4EdgeSight 5.3EdgeSight 5.2EdgeSight 5.1EdgeSight 5.0
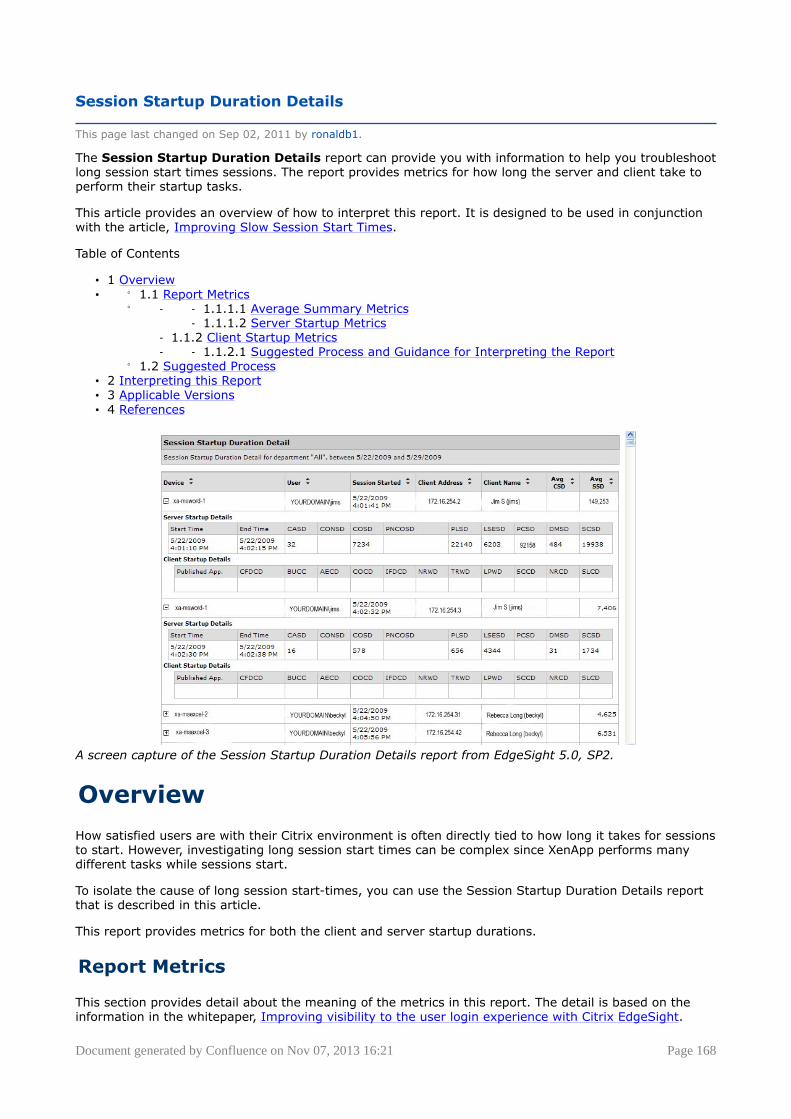
Document generated by Confluence on Nov 07, 2013 16:21 Page 168
Session Startup Duration Details
This page last changed on Sep 02, 2011 by ronaldb1.
The Session Startup Duration Details report can provide you with information to help you troubleshootlong session start times sessions. The report provides metrics for how long the server and client take toperform their startup tasks.
This article provides an overview of how to interpret this report. It is designed to be used in conjunctionwith the article, Improving Slow Session Start Times.
Table of Contents
• 1 Overview• ° 1.1 Report Metrics
° - - 1.1.1.1 Average Summary Metrics- 1.1.1.2 Server Startup Metrics
- 1.1.2 Client Startup Metrics- - 1.1.2.1 Suggested Process and Guidance for Interpreting the Report
° 1.2 Suggested Process• 2 Interpreting this Report• 3 Applicable Versions• 4 References
A screen capture of the Session Startup Duration Details report from EdgeSight 5.0, SP2.
Overview
How satisfied users are with their Citrix environment is often directly tied to how long it takes for sessionsto start. However, investigating long session start times can be complex since XenApp performs manydifferent tasks while sessions start.
To isolate the cause of long session start-times, you can use the Session Startup Duration Details reportthat is described in this article.
This report provides metrics for both the client and server startup durations.
Report Metrics
This section provides detail about the meaning of the metrics in this report. The detail is based on theinformation in the whitepaper, Improving visibility to the user login experience with Citrix EdgeSight.
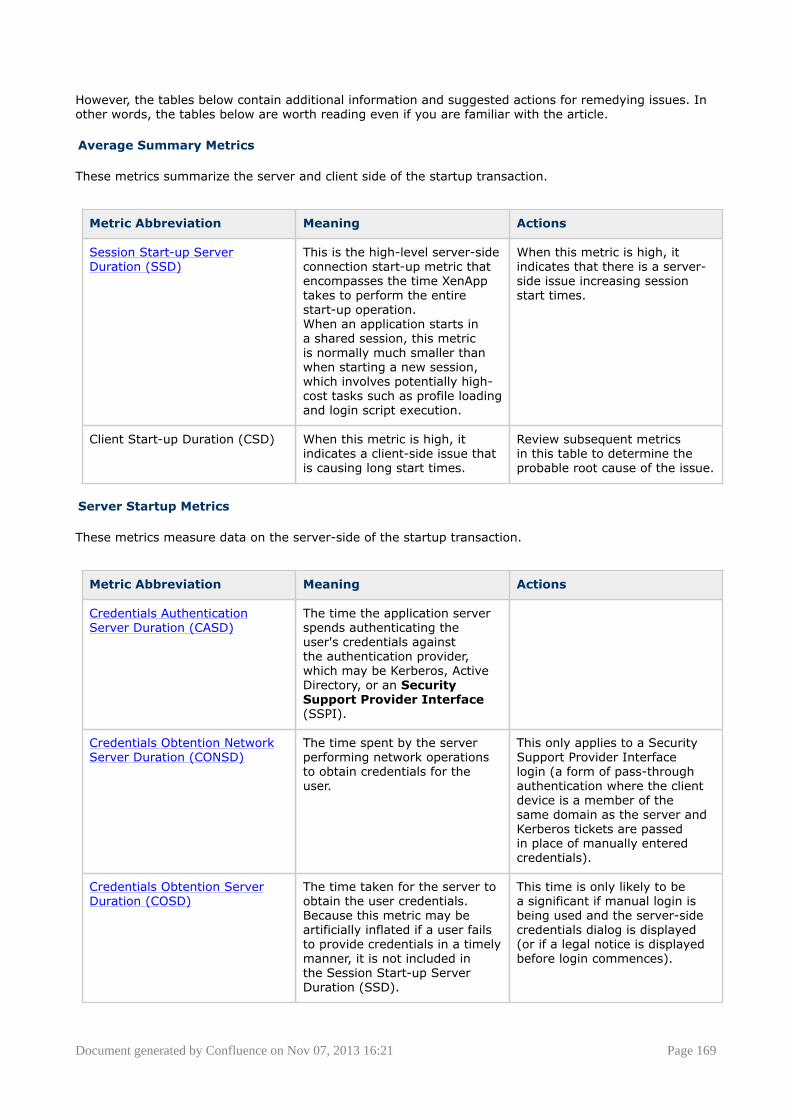
Document generated by Confluence on Nov 07, 2013 16:21 Page 169
However, the tables below contain additional information and suggested actions for remedying issues. Inother words, the tables below are worth reading even if you are familiar with the article.
Average Summary Metrics
These metrics summarize the server and client side of the startup transaction.
Metric Abbreviation Meaning Actions
Session Start-up ServerDuration (SSD)
This is the high-level server-sideconnection start-up metric thatencompasses the time XenApptakes to perform the entirestart-up operation.When an application starts ina shared session, this metricis normally much smaller thanwhen starting a new session,which involves potentially high-cost tasks such as profile loadingand login script execution.
When this metric is high, itindicates that there is a server-side issue increasing sessionstart times.
Client Start-up Duration (CSD) When this metric is high, itindicates a client-side issue thatis causing long start times.
Review subsequent metricsin this table to determine theprobable root cause of the issue.
Server Startup Metrics
These metrics measure data on the server-side of the startup transaction.
Metric Abbreviation Meaning Actions
Credentials AuthenticationServer Duration (CASD)
The time the application serverspends authenticating theuser's credentials againstthe authentication provider,which may be Kerberos, ActiveDirectory, or an SecuritySupport Provider Interface(SSPI).
Credentials Obtention NetworkServer Duration (CONSD)
The time spent by the serverperforming network operationsto obtain credentials for theuser.
This only applies to a SecuritySupport Provider Interfacelogin (a form of pass-throughauthentication where the clientdevice is a member of thesame domain as the server andKerberos tickets are passedin place of manually enteredcredentials).
Credentials Obtention ServerDuration (COSD)
The time taken for the server toobtain the user credentials.Because this metric may beartificially inflated if a user failsto provide credentials in a timelymanner, it is not included inthe Session Start-up ServerDuration (SSD).
This time is only likely to bea significant if manual login isbeing used and the server-sidecredentials dialog is displayed(or if a legal notice is displayedbefore login commences).
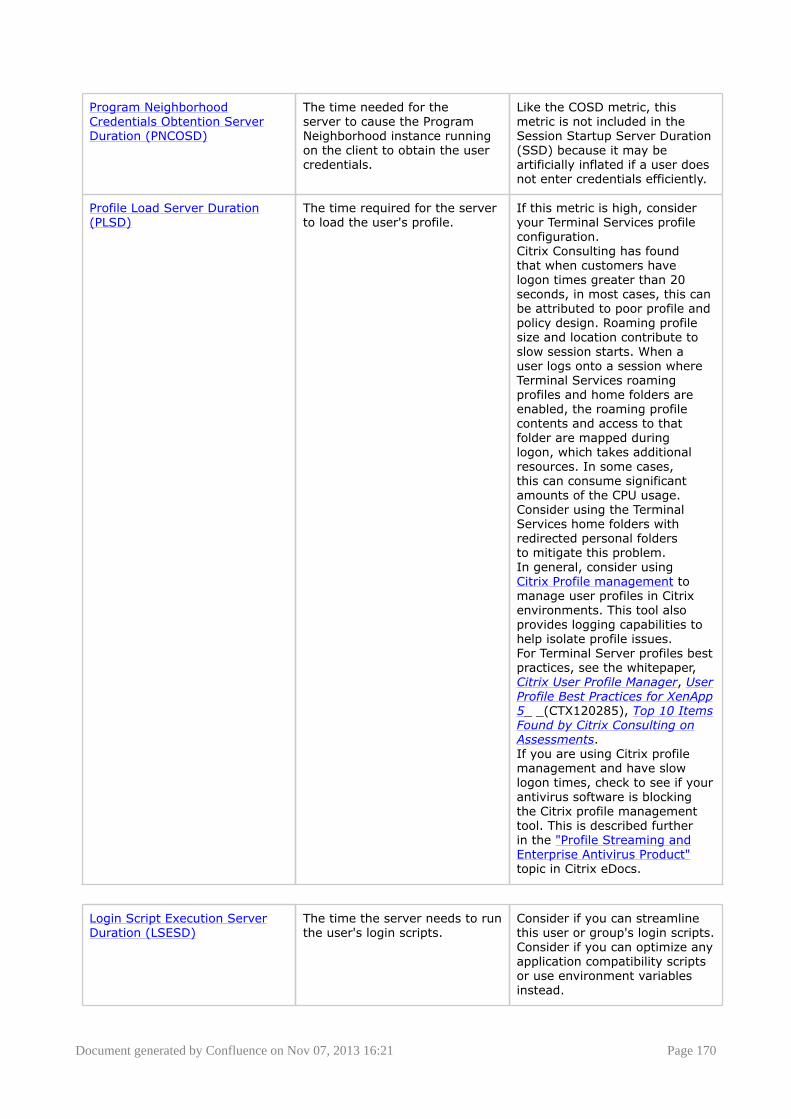
Document generated by Confluence on Nov 07, 2013 16:21 Page 170
Program NeighborhoodCredentials Obtention ServerDuration (PNCOSD)
The time needed for theserver to cause the ProgramNeighborhood instance runningon the client to obtain the usercredentials.
Like the COSD metric, thismetric is not included in theSession Startup Server Duration(SSD) because it may beartificially inflated if a user doesnot enter credentials efficiently.
Profile Load Server Duration(PLSD)
The time required for the serverto load the user's profile.
If this metric is high, consideryour Terminal Services profileconfiguration.Citrix Consulting has foundthat when customers havelogon times greater than 20seconds, in most cases, this canbe attributed to poor profile andpolicy design. Roaming profilesize and location contribute toslow session starts. When auser logs onto a session whereTerminal Services roamingprofiles and home folders areenabled, the roaming profilecontents and access to thatfolder are mapped duringlogon, which takes additionalresources. In some cases,this can consume significantamounts of the CPU usage.Consider using the TerminalServices home folders withredirected personal foldersto mitigate this problem.In general, consider usingCitrix Profile management tomanage user profiles in Citrixenvironments. This tool alsoprovides logging capabilities tohelp isolate profile issues.For Terminal Server profiles bestpractices, see the whitepaper,Citrix User Profile Manager, UserProfile Best Practices for XenApp5_ _(CTX120285), Top 10 ItemsFound by Citrix Consulting onAssessments. If you are using Citrix profilemanagement and have slowlogon times, check to see if yourantivirus software is blockingthe Citrix profile managementtool. This is described furtherin the "Profile Streaming andEnterprise Antivirus Product"topic in Citrix eDocs.
Login Script Execution ServerDuration (LSESD)
The time the server needs to runthe user's login scripts.
Consider if you can streamlinethis user or group's login scripts.Consider if you can optimize anyapplication compatibility scriptsor use environment variablesinstead.
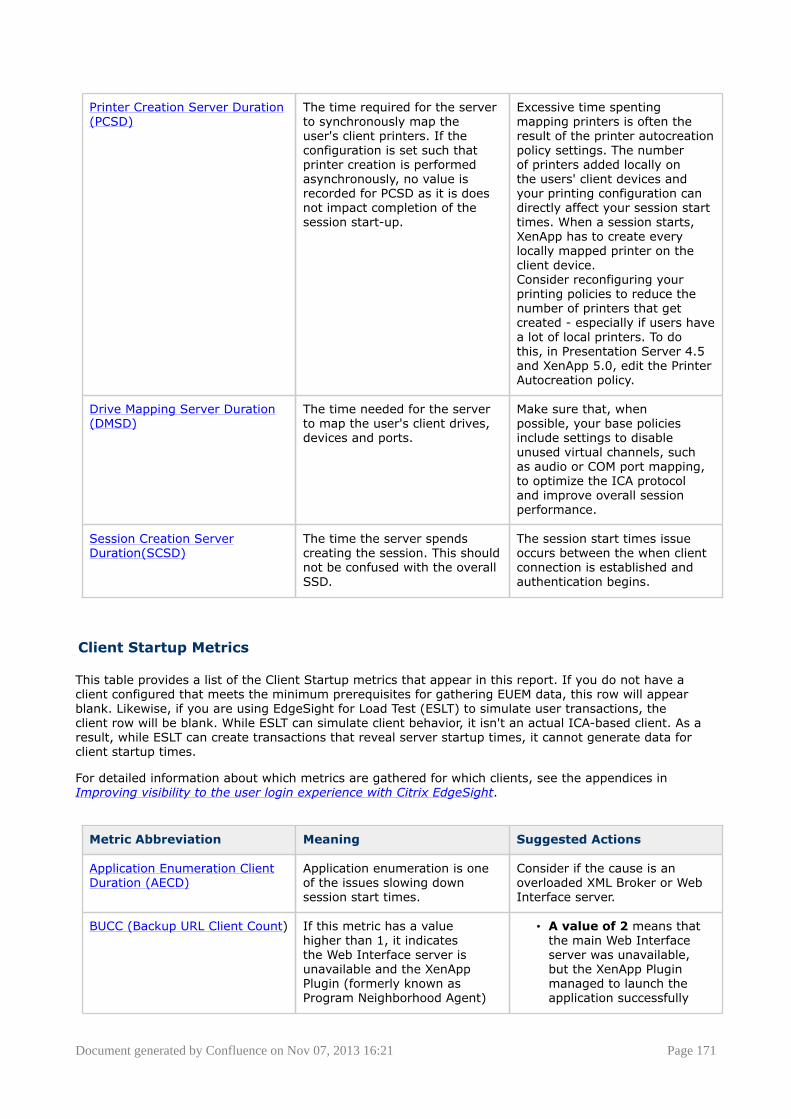
Document generated by Confluence on Nov 07, 2013 16:21 Page 171
Printer Creation Server Duration(PCSD)
The time required for the serverto synchronously map theuser's client printers. If theconfiguration is set such thatprinter creation is performedasynchronously, no value isrecorded for PCSD as it is doesnot impact completion of thesession start-up.
Excessive time spentingmapping printers is often theresult of the printer autocreationpolicy settings. The numberof printers added locally onthe users' client devices andyour printing configuration candirectly affect your session starttimes. When a session starts,XenApp has to create everylocally mapped printer on theclient device. Consider reconfiguring yourprinting policies to reduce thenumber of printers that getcreated - especially if users havea lot of local printers. To dothis, in Presentation Server 4.5and XenApp 5.0, edit the PrinterAutocreation policy.
Drive Mapping Server Duration(DMSD)
The time needed for the serverto map the user's client drives,devices and ports.
Make sure that, whenpossible, your base policiesinclude settings to disableunused virtual channels, suchas audio or COM port mapping,to optimize the ICA protocoland improve overall sessionperformance.
Session Creation ServerDuration(SCSD)
The time the server spendscreating the session. This shouldnot be confused with the overallSSD.
The session start times issueoccurs between the when clientconnection is established andauthentication begins.
Client Startup Metrics
This table provides a list of the Client Startup metrics that appear in this report. If you do not have aclient configured that meets the minimum prerequisites for gathering EUEM data, this row will appearblank. Likewise, if you are using EdgeSight for Load Test (ESLT) to simulate user transactions, theclient row will be blank. While ESLT can simulate client behavior, it isn't an actual ICA-based client. As aresult, while ESLT can create transactions that reveal server startup times, it cannot generate data forclient startup times.
For detailed information about which metrics are gathered for which clients, see the appendices inImproving visibility to the user login experience with Citrix EdgeSight.
Metric Abbreviation Meaning Suggested Actions
Application Enumeration ClientDuration (AECD)
Application enumeration is oneof the issues slowing downsession start times.
Consider if the cause is anoverloaded XML Broker or WebInterface server.
BUCC (Backup URL Client Count) If this metric has a valuehigher than 1, it indicatesthe Web Interface server isunavailable and the XenAppPlugin (formerly known asProgram Neighborhood Agent)
• A value of 2 means thatthe main Web Interfaceserver was unavailable,but the XenApp Pluginmanaged to launch theapplication successfully
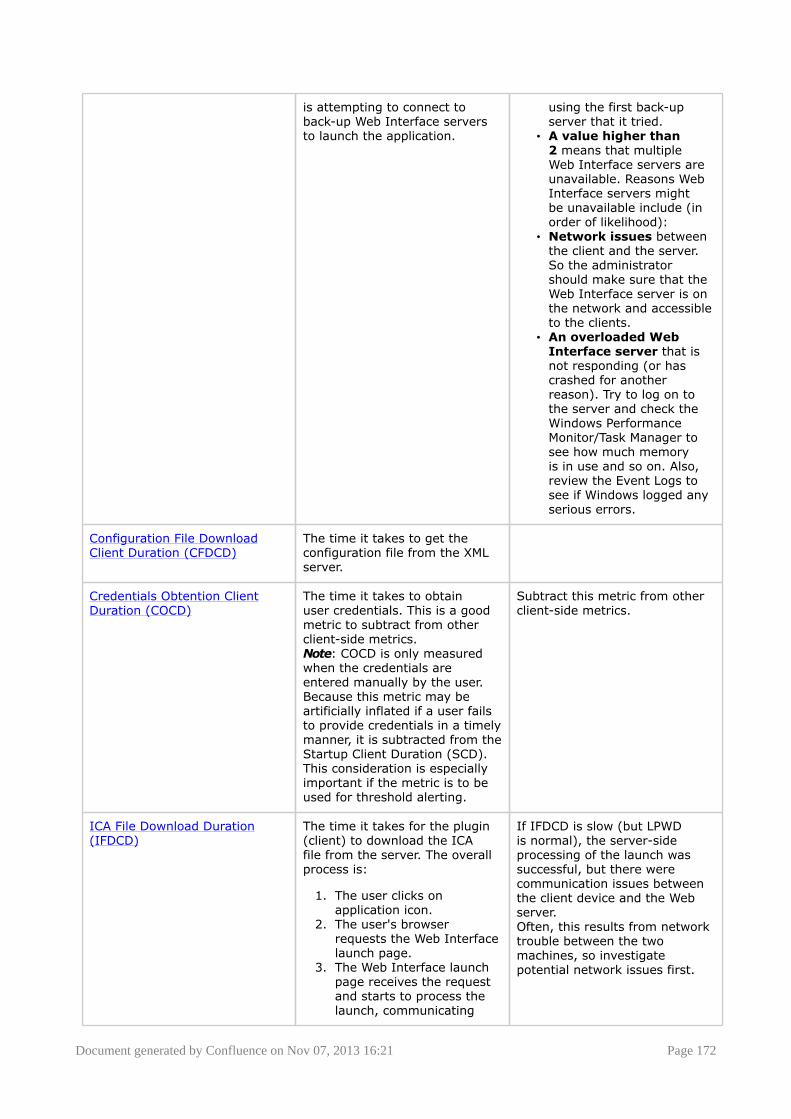
Document generated by Confluence on Nov 07, 2013 16:21 Page 172
is attempting to connect toback-up Web Interface serversto launch the application.
using the first back-upserver that it tried.
• A value higher than2 means that multipleWeb Interface servers areunavailable. Reasons WebInterface servers mightbe unavailable include (inorder of likelihood):
• Network issues betweenthe client and the server.So the administratorshould make sure that theWeb Interface server is onthe network and accessibleto the clients.
• An overloaded WebInterface server that isnot responding (or hascrashed for anotherreason). Try to log on tothe server and check theWindows PerformanceMonitor/Task Manager tosee how much memoryis in use and so on. Also,review the Event Logs tosee if Windows logged anyserious errors.
Configuration File DownloadClient Duration (CFDCD)
The time it takes to get theconfiguration file from the XMLserver.
Credentials Obtention ClientDuration (COCD)
The time it takes to obtainuser credentials. This is a goodmetric to subtract from otherclient-side metrics.Note: COCD is only measuredwhen the credentials areentered manually by the user.Because this metric may beartificially inflated if a user failsto provide credentials in a timelymanner, it is subtracted from theStartup Client Duration (SCD).This consideration is especiallyimportant if the metric is to beused for threshold alerting.
Subtract this metric from otherclient-side metrics.
ICA File Download Duration(IFDCD)
The time it takes for the plugin(client) to download the ICAfile from the server. The overallprocess is:
1. The user clicks onapplication icon.
2. The user's browserrequests the Web Interfacelaunch page.
3. The Web Interface launchpage receives the requestand starts to process thelaunch, communicating
If IFDCD is slow (but LPWDis normal), the server-sideprocessing of the launch wassuccessful, but there werecommunication issues betweenthe client device and the Webserver. Often, this results from networktrouble between the twomachines, so investigatepotential network issues first.
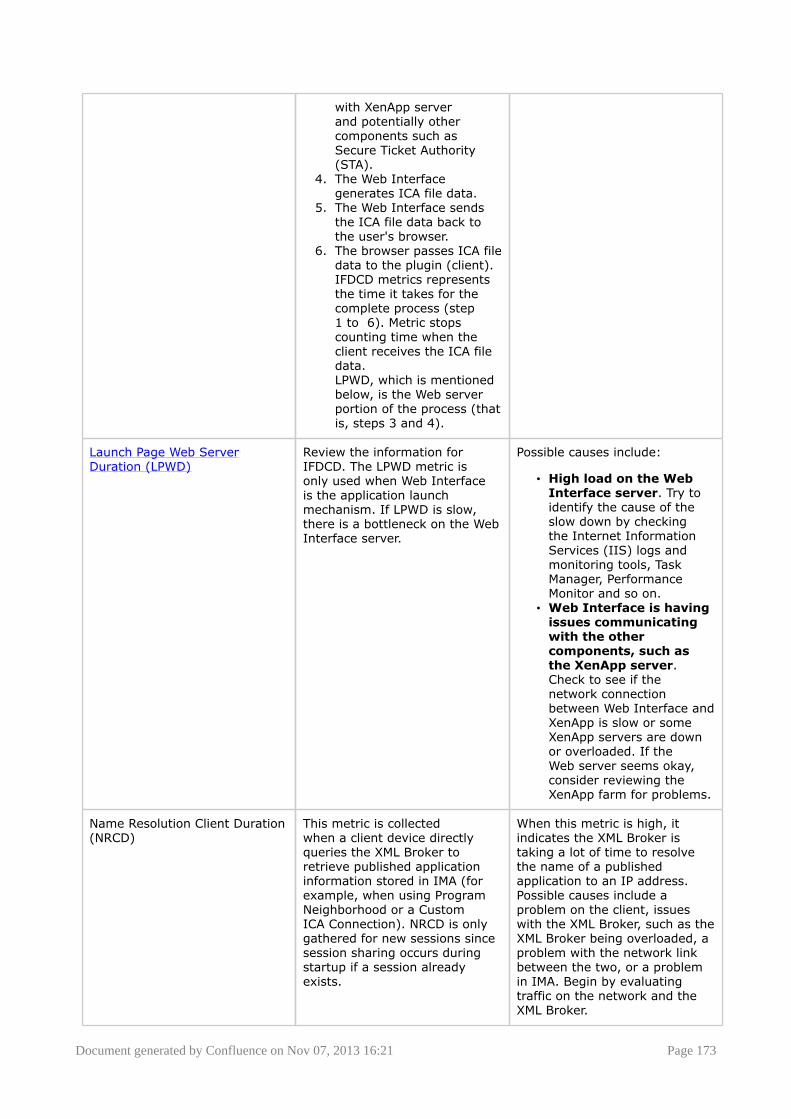
Document generated by Confluence on Nov 07, 2013 16:21 Page 173
with XenApp serverand potentially othercomponents such asSecure Ticket Authority(STA).
4. The Web Interfacegenerates ICA file data.
5. The Web Interface sendsthe ICA file data back tothe user's browser.
6. The browser passes ICA filedata to the plugin (client).IFDCD metrics representsthe time it takes for thecomplete process (step1 to 6). Metric stopscounting time when theclient receives the ICA filedata.LPWD, which is mentionedbelow, is the Web serverportion of the process (thatis, steps 3 and 4).
Launch Page Web ServerDuration (LPWD)
Review the information forIFDCD. The LPWD metric isonly used when Web Interfaceis the application launchmechanism. If LPWD is slow,there is a bottleneck on the WebInterface server.
Possible causes include:
• High load on the WebInterface server. Try toidentify the cause of theslow down by checkingthe Internet InformationServices (IIS) logs andmonitoring tools, TaskManager, PerformanceMonitor and so on.
• Web Interface is havingissues communicatingwith the othercomponents, such asthe XenApp server.Check to see if thenetwork connectionbetween Web Interface andXenApp is slow or someXenApp servers are downor overloaded. If theWeb server seems okay,consider reviewing theXenApp farm for problems.
Name Resolution Client Duration(NRCD)
This metric is collectedwhen a client device directlyqueries the XML Broker toretrieve published applicationinformation stored in IMA (forexample, when using ProgramNeighborhood or a CustomICA Connection). NRCD is onlygathered for new sessions sincesession sharing occurs duringstartup if a session alreadyexists.
When this metric is high, itindicates the XML Broker istaking a lot of time to resolvethe name of a publishedapplication to an IP address.Possible causes include aproblem on the client, issueswith the XML Broker, such as theXML Broker being overloaded, aproblem with the network linkbetween the two, or a problemin IMA. Begin by evaluatingtraffic on the network and theXML Broker.

Document generated by Confluence on Nov 07, 2013 16:21 Page 174
Name Resolution Web ServerDuration (NRWD)
When this metric is high, therecould be an issue with the WebInterface server or the XenAppplugin site (formerly known asthe Neighborhood Agent site),the XML Service, the networklink between the two, or aproblem in IMA.Like NRCD, this metric indicateshow long it takes the XMLservice to resolve the nameof a published application to aXenApp IP address. However,this metric is collected when aWeb Interface site is performingthis process on behalf of alaunch request it has receivedfrom either the XenApp plugin(previously known as ProgramNeighborhood Agent) or froma user clicking a Web Interfacepage icon. This metric appliesto all sessions launched throughthe Web Interface or the XenAppplugin (formerly, the ProgramNeighborhood Agent).
Session Look-up Client Duration(SLCD)
This metric represents thetime it takes to query everysession to host the requestedpublished application. Thecheck is performed on theclient to determine whetheran existing session can handlethe application launch request.The method used depends onwhether the session is new orshared.
Ticket Response Web ServerDuration (TRWD)
This metric is collectedwhen Program NeighborhoodAgent or Web Interface is theapplication launch mechanism.This metric indicates the time ittakes to get a ticket (if required)from the STA server or XMLservice.
When this metric is high, it canindicate that the Secure TicketAuthority (STA) server or theXML Broker are overloaded.
Session Creation Client Duration(SCCD)
This metric represents the timeit takes to create a new session,from the moment wfica32.exe islaunched to when the connectionis established.
Suggested Process and Guidance for Interpreting the Report
You can use this report in any of the following situations:
• After a user complains about how long it takes for his or her session to load• Before rolling out an initial farm deployment• After upgrading your farm or making significant changes
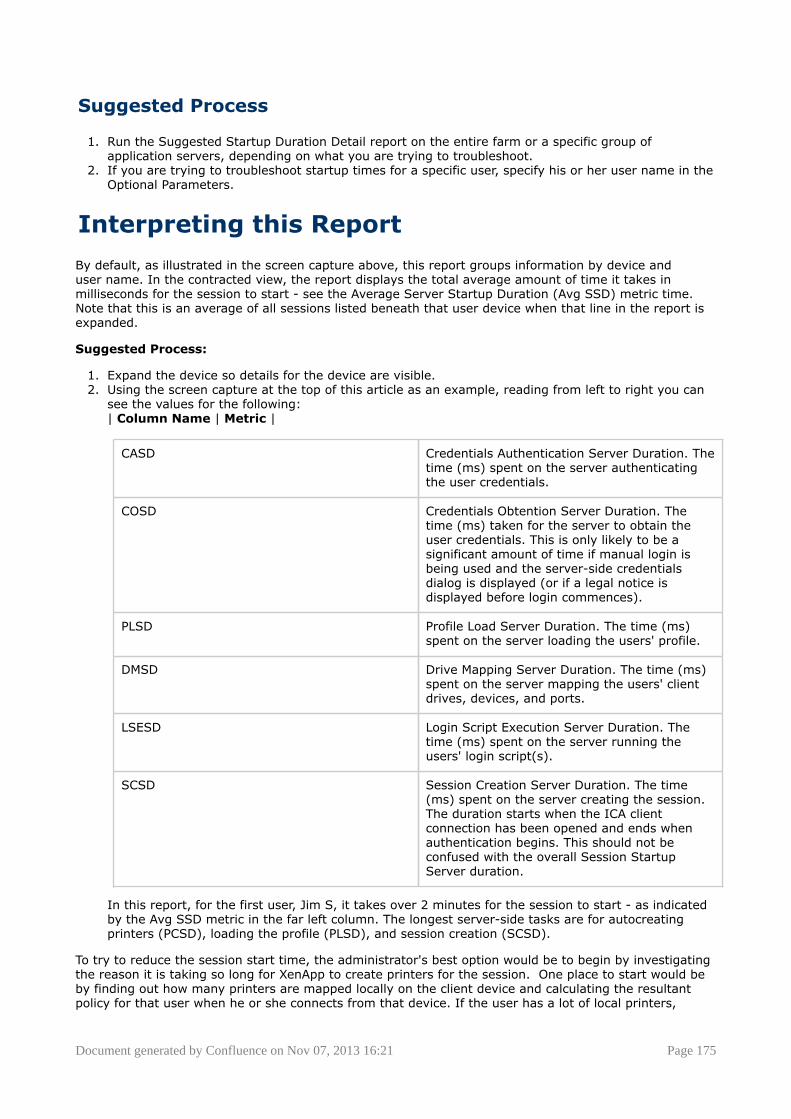
Document generated by Confluence on Nov 07, 2013 16:21 Page 175
Suggested Process
1. Run the Suggested Startup Duration Detail report on the entire farm or a specific group ofapplication servers, depending on what you are trying to troubleshoot.
2. If you are trying to troubleshoot startup times for a specific user, specify his or her user name in theOptional Parameters.
Interpreting this Report
By default, as illustrated in the screen capture above, this report groups information by device anduser name. In the contracted view, the report displays the total average amount of time it takes inmilliseconds for the session to start - see the Average Server Startup Duration (Avg SSD) metric time.Note that this is an average of all sessions listed beneath that user device when that line in the report isexpanded.
Suggested Process:
1. Expand the device so details for the device are visible.2. Using the screen capture at the top of this article as an example, reading from left to right you can
see the values for the following: | Column Name | Metric |
CASD Credentials Authentication Server Duration. Thetime (ms) spent on the server authenticatingthe user credentials.
COSD Credentials Obtention Server Duration. Thetime (ms) taken for the server to obtain theuser credentials. This is only likely to be asignificant amount of time if manual login isbeing used and the server-side credentialsdialog is displayed (or if a legal notice isdisplayed before login commences).
PLSD Profile Load Server Duration. The time (ms)spent on the server loading the users' profile.
DMSD Drive Mapping Server Duration. The time (ms)spent on the server mapping the users' clientdrives, devices, and ports.
LSESD Login Script Execution Server Duration. Thetime (ms) spent on the server running theusers' login script(s).
SCSD Session Creation Server Duration. The time(ms) spent on the server creating the session.The duration starts when the ICA clientconnection has been opened and ends whenauthentication begins. This should not beconfused with the overall Session StartupServer duration.
In this report, for the first user, Jim S, it takes over 2 minutes for the session to start - as indicatedby the Avg SSD metric in the far left column. The longest server-side tasks are for autocreatingprinters (PCSD), loading the profile (PLSD), and session creation (SCSD).
To try to reduce the session start time, the administrator's best option would be to begin by investigatingthe reason it is taking so long for XenApp to create printers for the session. One place to start would beby finding out how many printers are mapped locally on the client device and calculating the resultantpolicy for that user when he or she connects from that device. If the user has a lot of local printers,
Document generated by Confluence on Nov 07, 2013 16:21 Page 176
consider editing the Printer Autocreation policy (in XenApp 5.0 and earlier) to limit the printers that arecreated.
After that, the administrator might want to investigate the profile configuration for this user. For moreinformation, see User Profile Best Practices for XenApp 5_, CTX120285.
In this case, the amount of time dedicated to login scripts is negligible relative to the printer autocreationand the profile loading, so the administrator might choose not to investigate the scripts.
Applicable Versions
EdgeSight 5.4EdgeSight 5.3EdgeSight 5.2EdgeSight 5.1EdgeSight 5.0
References
• Improving Slow Session Start Times. EdgeSight Wiki, accessed on October 1, 2009.• User Profile Best Practices for XenApp 5, CTX120285. Citrix Systems.• Improving visibility to the user login experience with Citrix EdgeSight. Citrix Systems, 2007.
Comments
[from Chiu Chan 2010-05-11]How do the timing add up, and related to each other?
Q1- Session Start (total) = Client + Server; or are client start up and session start up independent ofeach other.
Q2- Are the individual sums of client start add up to 100%. I believe the answer is it is not- we shoulddocument which values are subsets of something.
Posted by chiuc at May 11, 2010......................................................................................................................................................................
Thanks for your comment!
Q1 - The client and server startup metric values do not add up to a total session start time. They areindependent.
Q2 - Whether we're talking server or client, the individual sums do not add up to 100%. There can beoverlaps and latencies during the session startup process that prevent this. As a side note, differentindividual metrics may or may not have values displayed based on the session lauch mechanism.
Posted by ronaldb at May 11, 2010......................................................................................................................................................................
We are using EdgeSight 5.4 Standard Edition. Should this report be available to us and if so where canwe get it from?
cheers.
Posted by jmucis1 at Mar 13, 2012......................................................................................................................................................................
Andrew,
This report, and the collection of the data, is only available with EdgeSight Advanced. It can be purchasedseparately and is also bundled with XenApp Platinum.
Thanks,
Document generated by Confluence on Nov 07, 2013 16:21 Page 177
norm
Posted by normanw1 at Mar 13, 2012......................................................................................................................................................................
Andrew,Back to Chans QuestionIs there any way to calculate Total logon time per user per session using the information from this report?If not, what would be the best way to go about calculating Total logon time per user per session usingdata from ES?
Posted by e_fromme at Mar 20, 2012......................................................................................................................................................................
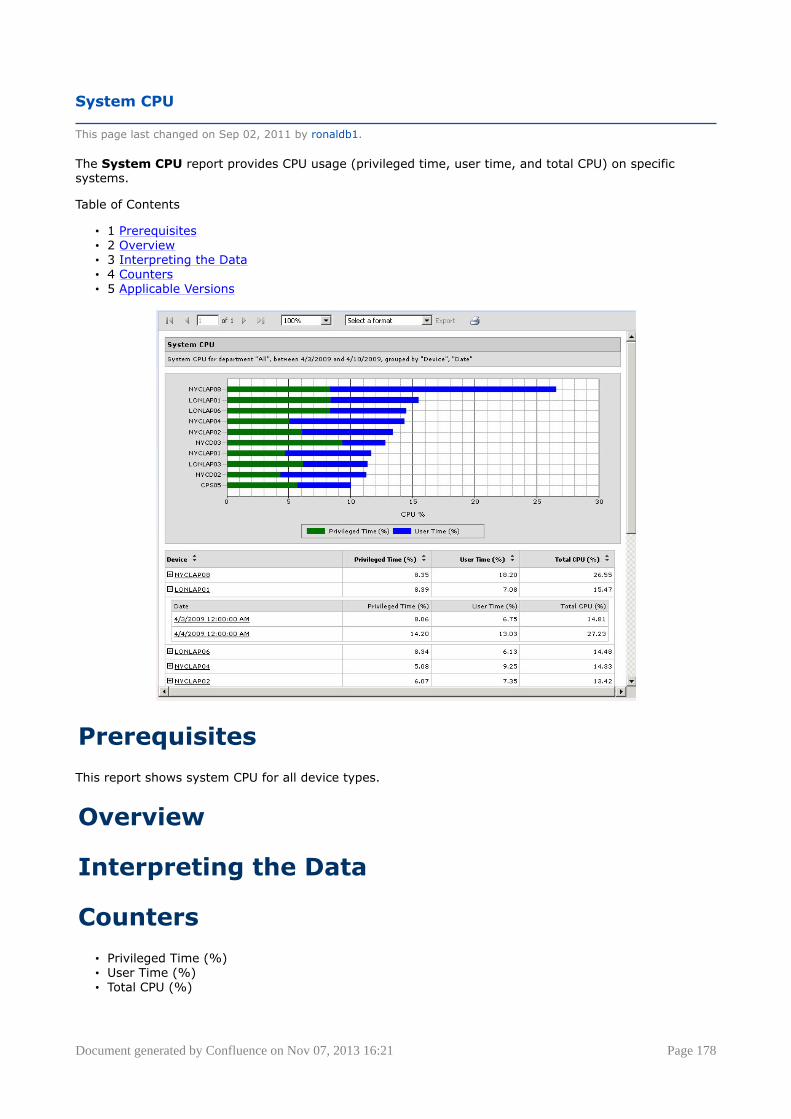
Document generated by Confluence on Nov 07, 2013 16:21 Page 178
System CPU
This page last changed on Sep 02, 2011 by ronaldb1.
The System CPU report provides CPU usage (privileged time, user time, and total CPU) on specificsystems.
Table of Contents
• 1 Prerequisites• 2 Overview• 3 Interpreting the Data• 4 Counters• 5 Applicable Versions
Prerequisites
This report shows system CPU for all device types.
Overview
Interpreting the Data
Counters
• Privileged Time (%)• User Time (%)• Total CPU (%)
Document generated by Confluence on Nov 07, 2013 16:21 Page 179
Applicable Versions
• EdgeSight 5.4• EdgeSight 5.3• EdgeSight 5.2• EdgeSight 5.1• EdgeSight 5.0
Comments
please explain what privileged time and user time means
Posted by at Jan 12, 2011......................................................................................................................................................................
Privileged Time is the percentage of elapsed time that the processor spent executing code in privilegedmode. Windows system services often run in privileged mode to gain access to system-private data. Suchdata is protected from access by threads executing in user mode. Calls to the system can be explicit orimplicit, such as page faults or interrupts. Windows uses process boundaries for subsystem protection inaddition to user and privileged modes.
User Time is the percentage of elapsed time the processor spent executing code in user mode. Usermode is a restricted processing mode designed for applications, environment subsystems, and integralsubsystems. The operating system switches application threads to privileged mode to access operatingsystem services.
These counters display the average time in either privileged or user mode as a percentage of the sampletime.
In general, the amount of time spent in privileged mode depends on the system, especially on the diskcontoller and drivers. More efficient disk controllers and drivers use less privileged time, allowing thesystem more time for user applications. More time for user apps means better overall throughput.
Posted by ronaldb at Jan 12, 2011......................................................................................................................................................................
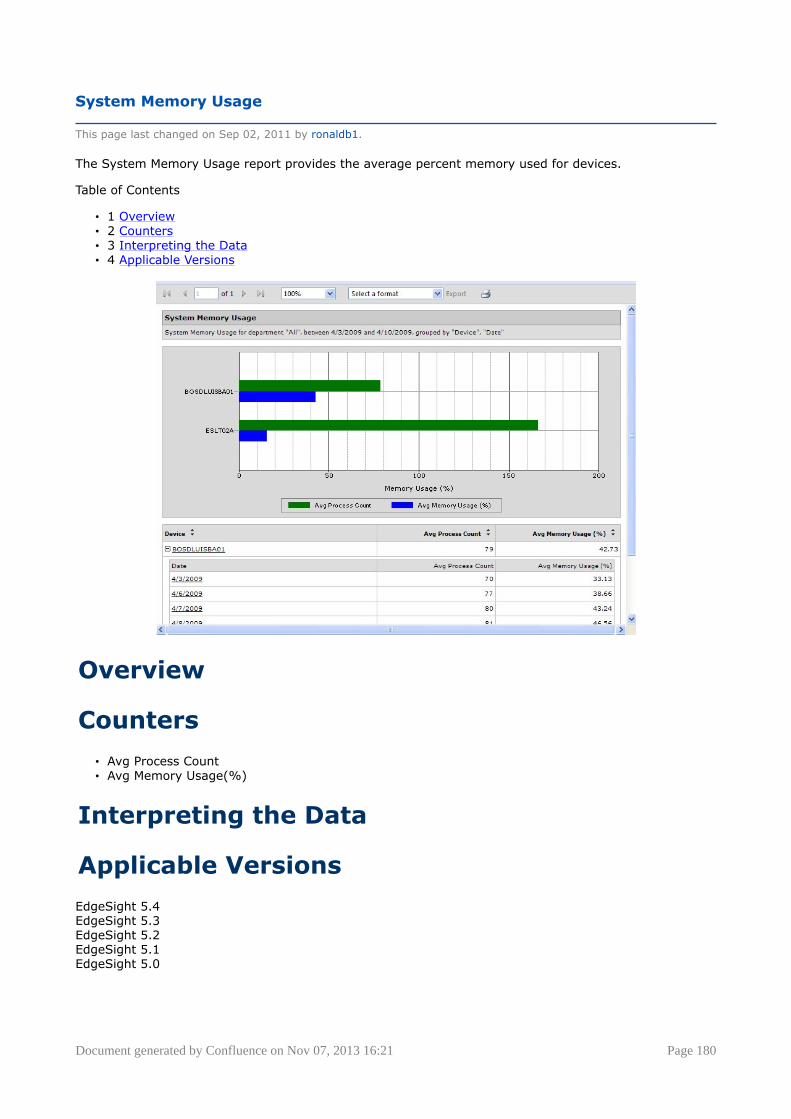
Document generated by Confluence on Nov 07, 2013 16:21 Page 180
System Memory Usage
This page last changed on Sep 02, 2011 by ronaldb1.
The System Memory Usage report provides the average percent memory used for devices.
Table of Contents
• 1 Overview• 2 Counters• 3 Interpreting the Data• 4 Applicable Versions
Overview
Counters
• Avg Process Count• Avg Memory Usage(%)
Interpreting the Data
Applicable Versions
EdgeSight 5.4EdgeSight 5.3EdgeSight 5.2EdgeSight 5.1EdgeSight 5.0

Document generated by Confluence on Nov 07, 2013 16:21 Page 181
User Login Details for a User Group
This page last changed on Nov 12, 2009 by ronaldb.
This report displays XenApp and XenDesktop user logons counts, times, and client information. Thisreport also displays the number of sessions created.
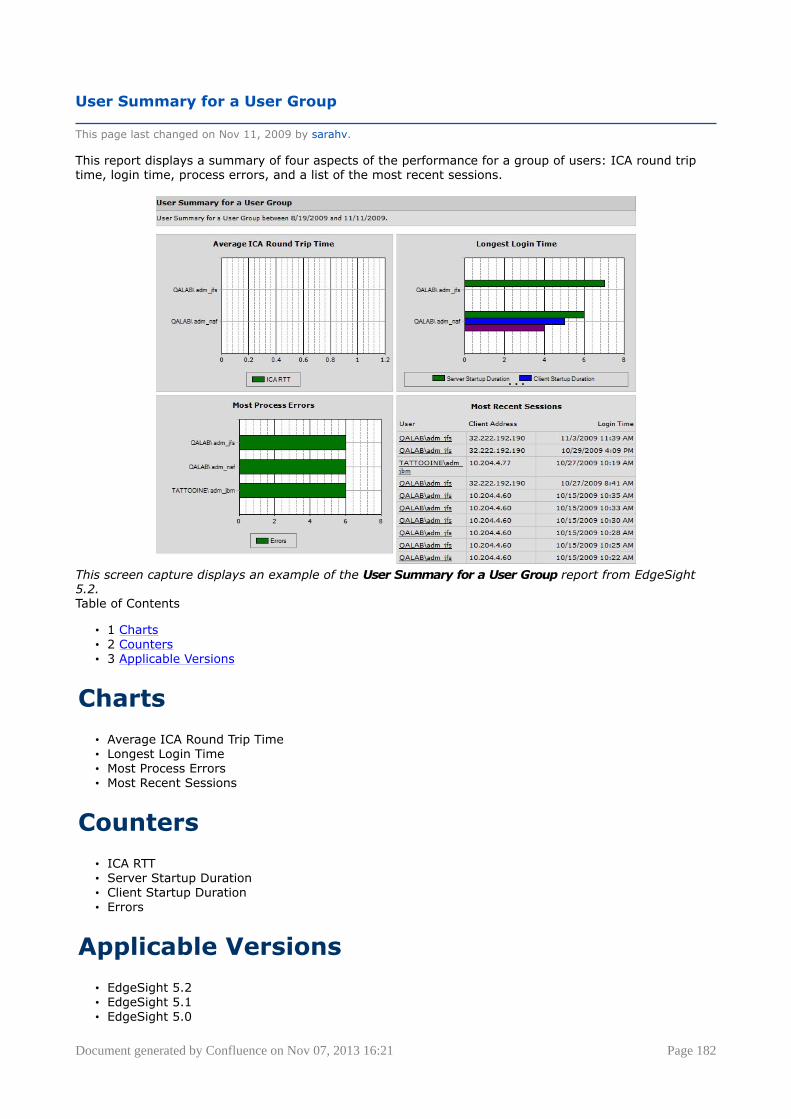
Document generated by Confluence on Nov 07, 2013 16:21 Page 182
User Summary for a User Group
This page last changed on Nov 11, 2009 by sarahv.
This report displays a summary of four aspects of the performance for a group of users: ICA round triptime, login time, process errors, and a list of the most recent sessions.
This screen capture displays an example of the User Summary for a User Group report from EdgeSight5.2.Table of Contents
• 1 Charts• 2 Counters• 3 Applicable Versions
Charts
• Average ICA Round Trip Time• Longest Login Time• Most Process Errors• Most Recent Sessions
Counters
• ICA RTT• Server Startup Duration• Client Startup Duration• Errors
Applicable Versions
• EdgeSight 5.2• EdgeSight 5.1• EdgeSight 5.0
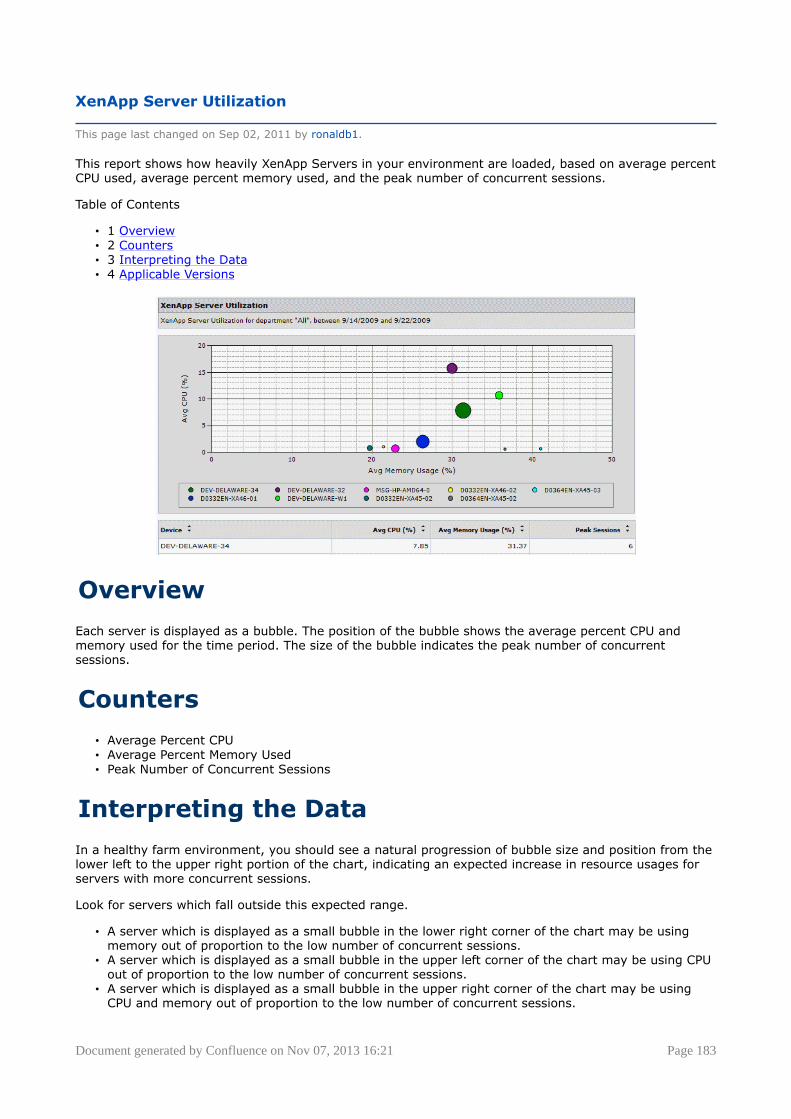
Document generated by Confluence on Nov 07, 2013 16:21 Page 183
XenApp Server Utilization
This page last changed on Sep 02, 2011 by ronaldb1.
This report shows how heavily XenApp Servers in your environment are loaded, based on average percentCPU used, average percent memory used, and the peak number of concurrent sessions.
Table of Contents
• 1 Overview• 2 Counters• 3 Interpreting the Data• 4 Applicable Versions
Overview
Each server is displayed as a bubble. The position of the bubble shows the average percent CPU andmemory used for the time period. The size of the bubble indicates the peak number of concurrentsessions.
Counters
• Average Percent CPU• Average Percent Memory Used• Peak Number of Concurrent Sessions
Interpreting the Data
In a healthy farm environment, you should see a natural progression of bubble size and position from thelower left to the upper right portion of the chart, indicating an expected increase in resource usages forservers with more concurrent sessions.
Look for servers which fall outside this expected range.
• A server which is displayed as a small bubble in the lower right corner of the chart may be usingmemory out of proportion to the low number of concurrent sessions.
• A server which is displayed as a small bubble in the upper left corner of the chart may be using CPUout of proportion to the low number of concurrent sessions.
• A server which is displayed as a small bubble in the upper right corner of the chart may be usingCPU and memory out of proportion to the low number of concurrent sessions.
Document generated by Confluence on Nov 07, 2013 16:21 Page 184
Once you have identified a suspect server, you can use the Device Troubleshooter to investigate overallperformance and especially resource usage for the server. You can also use the Farm Monitor to see if anyalerts have been generated against the server.
Applicable Versions
EdgeSight 5.4EdgeSight 5.3EdgeSight 5.2
Document generated by Confluence on Nov 07, 2013 16:21 Page 185
XenApp Summary
This page last changed on Sep 02, 2011 by ronaldb1.
This report gives the administrator a fast high-level picture of farm health for any group of XenAppservers.
Table of Contents
• 1 Overview• ° 1.1 Reports Average Login Time by Day
° 1.2 Active Sessions by Day° 1.3 Average ICA Session Latency by Day° 1.4 Average CPU and Memory by Day
• 2 Counters• 3 Interpreting the Data• 4 Tips• ° 4.1 Group and Department Structure• 5 Applicable Versions• 6 See Also
Overview
This report contains four sub-reports:
• Average Login Time by Day• Active Sessions by Day• Average ICA Session Latency by Day• Average CPU and Memory by Day
Reports Average Login Time by Day
The Average Login Time by Day report displays the average length of time (seconds) it takes for usersto login to farm servers. The report displays a trend line over a period of time, so you can see if logintimes are increasing or decreasing during the time period specified. This may be helpful if you recentlymade changes to your environment. It should be noted that trend line for the Login Time in this reportreflects overall farm traffic: on days when there are no sessions, login time can appear artificially low.Clicking on the trend line in this report displays the Session Login Time report.
To determine the reasons for slow session login times, see Session Startup Duration Details.
Metrics Displayed
• Login Time
Active Sessions by Day
The Active Sessions by Day report displays two trendlines:
• The average number of active sessions each day on farm servers. • The peak number of actives sessions each day on farm servers.
The report displays trends over a period of time, so you can see if the number of sessions are increasingor decreasing. Clicking on either the Avg Active Sessions (blue) or the Peak Sessions (green) trend linedisplays the Session Statistics report.
Metrics Displayed
• Peak Sessions• Avg Active Sessions

Document generated by Confluence on Nov 07, 2013 16:21 Page 186
Average ICA Session Latency by Day
The Average CPU and Memory by Day report is a bar chart that displays the amounts of latency forclients and servers that support the End User Monitoring metrics (ICA RTT) and ones that do not (ICALatency). When the Presentation Server Summary report is run on a specific group of application servers,this subreport can indicate if specific servers are experiencing latency. Clicking on the trend line in thisreport displays the Session Login Timereport.
Metrics Displayed
• ICA Latency• ICA RTT
Average CPU and Memory by Day
The Active Sessions by Day report displays a bar chart for the average CPU and memory usage in agroup of servers (or the group you choose to run the XenApp Summary report on). If memory usageappears higher may be helpful if you recently made changes to your environment. Clicking on the trendline in this report displays the ICA Session Round Trip Time report, which can help determine if networklatency is causing session latency (or if the latency is the product of something in the farm environment).
Metrics Displayed
• Avg CPU (%)• Avg Memory Usage (%)
Counters
• Login Time• Peak Sessions• Avg Active Sessions• ICA Latency• ICA RTT• Average CPU (%)• Average Memory Usage (%)
Interpreting the Data
You can click on the charts in the summary reports and drill down to see the specific server dataregarding that metric. For example, if there is a spike in Logon time, you can drill down to see wherethere may have been an issue. You can see if it was it just one server that day or all servers, one user orall users.
Tips
• Double-click on the chart for more detail and to uncover issues.• Set up a subscription to email out this report in PDF format before the weekly staff meeting. This
saves people from having to log on to the EdgeSight Console at the last minute.
Group and Department Structure
Consider making custom groups so that you can select groupings of servers that provide meaningfulinformation when you generate this report. For example, you might want to run this report on a specificgroup of application servers about which users were complaining.
For information about the effect of Group and Deparatment Structure on reporting, see and the EdgeSightAdministrator's Guide.
Document generated by Confluence on Nov 07, 2013 16:21 Page 187
Applicable Versions
EdgeSight 5.4EdgeSight 5.3EdgeSight 5.2EdgeSight 5.1EdgeSight 5.0
See Also
• Session Startup Duration Details
Comments
I would like some claification, but the Average Sessions By Day Peak Sessions reports the actual peak forthe department/group being reported on and not an average of the all the peaks for all department/groupbeing reported on. If you have one server get larger number of session for whatever reason, then thisline will spike up. I've observed this in EdgeSight 5.3.
Thanks,
Alain Assaf
Wag the Real
Posted by alaincitrix1 at Jun 29, 2011......................................................................................................................................................................
Yes, the peak is an absolute number, not an average. The intention of the summary reports is to offera quick view of the environment - in this case, a higher than normal peak value may warrant furtherinvestigation. Clicking on the report brings up the Session Count report which can be grouped by Devicethen Date to isolate which server expereinced the peak session count.
Posted by ronaldb1 at Jul 05, 2011......................................................................................................................................................................

Document generated by Confluence on Nov 07, 2013 16:21 Page 188
XenApp User Summary
This page last changed on Apr 29, 2010 by danag.
Document generated by Confluence on Nov 07, 2013 16:21 Page 189
EdgeSight 5.0 and 5.1 Report List
This page last changed on May 03, 2010 by williamry1.
For definitions of metrics, see Report Counters Glossary.
Important: To find out what reports use a specific metric, in EdgeSight 5.0, click the Browse tab andtype the name of the metric in the Search box in the user interace (not the Find (CTRL + F) feature inthe Web browser). You can also find reports by entering a report name or description in the Search box.
A B C D E F G H I J K L M N O P Q R S T U V W X Y Z
A
Alert ArchiveArchive report.
AlertsNumber of alerts by type with alert details.
Application Response FailuresActive Application Response test and monitoring point failure and success counts.
Application Response TimeActive Application Response test and monitoring point durations.
Application Response Time for a TestActive Application Response duration and status for a test.
Asset ChangesChanges to hardware and software device assets.
Assets for a DeviceHardware and software assets on a device.
C
CPU Utilization ManagementCPU Utilization Management status (enabled or disabled), plus average and peak CPU usage.
D
Device ArchiveArchive report.
Device SummaryDevice performance data (CPU and memory usage, network delay, event log alerts, and applicationerrors).
E
Environmental UsageData on users, clients, sessions (start, end, and duration), published applications, and processes.
Event Log AlertsEvent log alerts with alert details.
Event Log Alerts for a User GroupEvent log alerts with alert details.
H
Hardware AlertsHardware alerts (reboot, disk failure, and plug and play changes) with alert details.
Hardware Asset ChangesRecent changes to hardware assets on devices.
Document generated by Confluence on Nov 07, 2013 16:21 Page 190
I
ICA Audio I/OAudio input and output bandwidth used during ICA sessions.
ICA Drive I/ODrive input and output bandwidth for file operations during ICA sessions.
ICA Printer I/OPrinter input and output bandwidth used during ICA sessions.
ICA Session CompressionInput and output compression ratio for ICA sessions.
ICA Session I/OInput and output line speed for ICA sessions.
ICA Session LatencyLatency (peak and average) for ICA sessions. Only pertains to pre-4.5 Presentation Servers. PresentationServers with EUEM data will not be reflected on this report.
ICA Session Latency for a User GroupLatency (peak and average) for ICA sessions. Only pertains to pre-4.5 Presentation Servers. PresentationServers with EUEM data will not be reflected on this report.
ICA Session Round Trip TimeICA session and network round trip time (RTT). Only pertains to EdgeSight Presentation Server Agents4.5 and later, Presentation Server 4.5 and later (Enterprise or Platinum Editions), and ICA Client version10 and later. Pre 4.5 Presentation Servers data will not be reflected on this report.
ICA Session Round Trip Time ArchiveArchive report.
ICA Session Round Trip Time for a User GroupICA session and network round trip time (RTT). Only pertains to EdgeSight Presentation Server Agents4.5 and later, Presentation Server 4.5 and later (Enterprise or Platinum Editions), and ICA Client version10 and later. Pre 4.5 Presentation Servers data will not be reflected on this report.
ICA Session TrafficTraffic (peak and average input and output) for ICA sessions.
ICA Session Traffic for a User GroupTraffic (peak and average input and output) for ICA sessions.
ICA Video I/OVideo frame and SpeedScreen input and output for ICA sessions.
IMA Service AvailabilityCurrent IMA service availability status and the time since the last state change.
IMA Service StateCurrent IMA service state and the time since the last state change.
N
Network Connection ArchiveArchive report.
Network SummarySummary of network performance for a site (delay, volume, RTT, and transaction errors).
Network Summary by SiteSummary of network performance (delay, RTT, Web errors, and transaction errors).
Network Transaction ArchiveArchive report.
Document generated by Confluence on Nov 07, 2013 16:21 Page 191
Network Transaction SummarySummary of network performance for a transaction (delay, volume, RTT, and Web errors).
New ProcessesNew processes detected on devices with the date first seen.
New SitesNew sites detected on devices with the date first seen.
P
Port Network DelayPort network delay, broken down by server, client, and network delay.
Port Network Round Trip TimeMaximum and average round trip time (RTT) for ports.
Port Network VolumePort network volume (kilobytes sent and received).
Port Web ErrorsWeb errors (transaction and Winsock) for a port.
Presentation Server Environmental Usage ArchiveArchive report.
Presentation Server Session Performance ArchiveArchive report.
Presentation Server SummaryPresentation Server performance data (login time, active sessions, ICA session latency, and CPU andmemory usage).
Presentation Server System Performance ArchiveArchive report.
Presentation Server User SummaryPresentation Server performance from a user perspective (ICA client traffic, login time, ICA sessionlatency, and recent sessions).
Process CPUProcess CPU usage (privileged time, user time, and total CPU).
Process Cumulative CPUProcess Cumulative CPU usage time.
Process ErrorsProcess errors with alert details.
Process Errors for a User GroupProcess errors with alert details.
Process FaultsProcess faults (crashes) with alert details.
Process Faults for a User GroupProcess faults (crashes) with alert details.
Process Memory UsageMemory (virtual, private, and working set) used by processes.
Process Network DelayProcess network delay, broken down by server, client, and network delay.
Process Network VolumeProcess network volume (kilobytes sent and received).
Process Not Responding Alerts
Document generated by Confluence on Nov 07, 2013 16:21 Page 192
Process not responding (application hang) conditions with alert details.
Process Not Responding Alerts for a User GroupProcess not responding (application hang) conditions with alert details.
Process Pages Per SecondAverage pages per second for processes.
Process Performance ArchiveArchive report.
Process Performance Summary by ProcessProcess performance summary (high CPU or memory usage, long network delay or active time).
Process Stability Summary by ProcessProcesses with the most stability issues (errors, faults, hangs, and transaction errors.)
Process SummarySummary of process performance (CPU and memory usage, network delay, and errors).
Process Thread CountAverage number of active threads for processes.
Process UsageActive and running time for processes, plus the number of unique users.
Process Usage ArchiveArchive report.
R
[ns:EXCEL] Real-time Alert ListReal-time detailed alert information.
[ns:EXCEL] Real-time Device SummaryReal-time alert, network delay, processor usage, and memory usage summary information.
[ns:EXCEL] Real-time Network PerformanceReal-time detailed network volume, delay, round trip time, and error information.
[ns:EXCEL] Real-time Presentation Server SummaryReal-time performance counters from multiple Presentation Servers for use in comparing systemperformance.
[ns:EXCEL] Real-time Presentation Server User SummaryReal-time system, application, and session information for a Presentation Server user.
[ns:EXCEL] Real-time System CompareReal-time performance counters from multiple devices for use in comparing system performance.
[ns:EXCEL] Real-time System PerformanceReal-time detailed system, network, and process performance information.
RebootsDevice reboots (expected and unexpected).
S
Session Auto-ReconnectsSession Auto-Reconnects.
Session Client Startup Time ArchiveArchive report.
Session Client TypeClient type (ICA, RDP, or console) for sessions on a device.
Document generated by Confluence on Nov 07, 2013 16:21 Page 193
Session Count ComparisonAverage active, inactive, and total session counts for Presentation Servers.
Session CPUAverage total CPU used by sessions.
Session CPU for a User GroupAverage total CPU used by sessions.
Session Login TimeAverage login time for ICA sessions.
Session Login Time for a User GroupAverage login time for ICA sessions.
Session MemoryMemory (virtual, private, and working set) used by sessions.
Session Network Bandwidth UsedNetwork bandwidth (peak and average input and output) used by sessions.
Session Network DelaySession network delay, broken down by server, client, and network delay.
Session Network Delay for a User GroupSession network delay, broken down by server, client, and network delay.
Session Network Round Trip TimeMaximum and average round trip time (RTT) for sessions.
Session Network Round Trip Time for a User GroupMaximum and average round trip time (RTT) for sessions.
Session Network VolumeSession network volume (kilobytes sent and received).
Session Network Volume for a User GroupSession network volume (kilobytes sent and received).
Session Page FaultsAverage number of page faults per second for sessions.
Session Server Startup DurationAverage time to startup a session on a Presentation Server.
Session Server Startup Time ArchiveArchive report.
Session Startup Duration DetailsSession client startup duration (CSD) and server startup duration (SSD). This contains the followingserver-side metrics: CASD, CONSD, COSD, PNCOSD, PLSD, LSEED, PCSID, DMSD, and SCSD. It alsocontains the following client-side metrics: CFDCD, BUCC, AECD, COCD, IFDCD, NRWD, TRWD, LPWD,SCCD, NRCD, and SLCD.
Session StatisticsSession activity statistics (peak concurrent, and average active and inactive sessions).
Sessions CreatedNumber of sessions created on a Presentation Server.
Sessions Created for a User GroupNumber of sessions created on a Presentation Server.
Site Network DelaySite network delay, broken down by server, client, and network delay.
Site Network ErrorsNetwork errors (transaction and Winsock) for a site.
Document generated by Confluence on Nov 07, 2013 16:21 Page 194
Site Network Errors for a User GroupNetwork errors (transaction and Winsock) for a site.
Site Network Round Trip TimeMaximum and average round trip time (RTT) for sites.
Site Network VolumeSite network volume (kilobytes sent and received).
Software Asset ChangesRecent changes to software assets on devices.
System CPUSystem CPU usage (privileged time, user time, and total CPU).
System CPU SummaryCPU percent usage summary for devices.
System Disk UsageDisk usage shown as percent free disk space.
System Disk Usage ArchiveArchive report.
System Disk Usage SummarySummary of disk usage with disk capacity and percent free disk space.
System Kernel for a DeviceSystem kernel activity (context switches, system calls, interrupts, and process count) for devices.
System Memory for a User GroupMemory (virtual, private, and working set) used by sessions.
System Memory SummaryPhysical memory percent usage summary for devices.
System Memory UsageAverage percent memory used for devices.
System Page FaultsAverage page faults per second for devices.
System Performance ArchiveArchive report.
T
Trace Event ArchiveArchive report.
Transaction Network DelayTransaction network delay, broken down by server, client, and network delay.
Transaction Network Round Trip TimeMaximum and average round trip time (RTT) for transactions.
Transaction Network VolumeNetwork volume (KB) for transactions by host.
Transaction Web ErrorsWeb errors associated with a host and transaction.
U
User Summary for a User GroupUser experience by user group summary (ICA RTT, login time, process errors, and recent sessions).

Document generated by Confluence on Nov 07, 2013 16:21 Page 195
V
Visited SitesSites visited by site name and address, with the number of visits and date of last visit.
X
XenApp Server UtilizationAverage CPU, average memory, and peak concurrent sessions for XenApp servers. This report containsinformation about the most heavily loaded servers. This report was added for the EdgeSight for XenApp5.2 release.
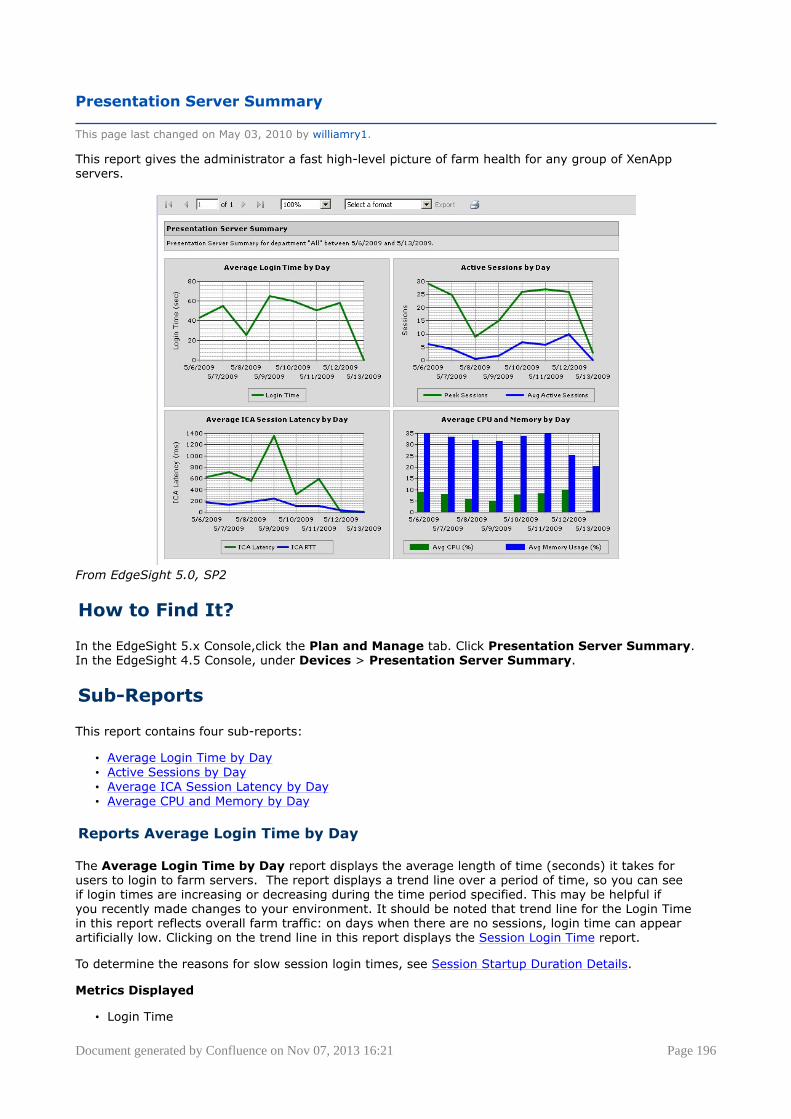
Document generated by Confluence on Nov 07, 2013 16:21 Page 196
Presentation Server Summary
This page last changed on May 03, 2010 by williamry1.
This report gives the administrator a fast high-level picture of farm health for any group of XenAppservers.
From EdgeSight 5.0, SP2
How to Find It?
In the EdgeSight 5.x Console,click the Plan and Manage tab. Click Presentation Server Summary.In the EdgeSight 4.5 Console, under Devices > Presentation Server Summary.
Sub-Reports
This report contains four sub-reports:
• Average Login Time by Day• Active Sessions by Day• Average ICA Session Latency by Day• Average CPU and Memory by Day
Reports Average Login Time by Day
The Average Login Time by Day report displays the average length of time (seconds) it takes forusers to login to farm servers. The report displays a trend line over a period of time, so you can seeif login times are increasing or decreasing during the time period specified. This may be helpful ifyou recently made changes to your environment. It should be noted that trend line for the Login Timein this report reflects overall farm traffic: on days when there are no sessions, login time can appearartificially low. Clicking on the trend line in this report displays the Session Login Time report.
To determine the reasons for slow session login times, see Session Startup Duration Details.
Metrics Displayed
• Login Time
Document generated by Confluence on Nov 07, 2013 16:21 Page 197
Active Sessions by Day
The Active Sessions by Day report displays two trendlines:
• The average number of active sessions each day on farm servers. • The peak number of actives sessions each day on farm servers.
The report displays trends over a period of time, so you can see if the number of sessions are increasingor decreasing. Clicking on either the Avg Active Sessions (blue) or the Peak Sessions (green) trend linedisplays the Session Statistics report.
Metrics Displayed
• Peak Sessions• Avg Active Sessions
Average ICA Session Latency by Day
The Average CPU and Memory by Day report is a bar chart that displays the amounts of latency forclients and servers that support the End User Monitoring metrics (ICA RTT) and ones that do not (ICALatency). When the Presentation Server Summary report is run on a specific group of application servers,this subreport can indicate if specific servers are experiencing latency. Clicking on the trend line in thisreport displays the Session Login Timereport.
Metrics Displayed
• ICA Latency• ICA RTT
Average CPU and Memory by Day
The Active Sessions by Day report displays a bar chart for the average CPU and memory usagein a group of servers (or the group you choose to run the Presentation Server Summary report on). Ifmemory usage appears higher may be helpful if you recently made changes to your environment. Clickingon the trend line in this report displays the ICA Session Round Trip Time report, which can help determineif network latency is causing session latency (or if the latency is the product of something in the farmenvironment).
Metrics Displayed
• Avg CPU (%)• Avg Memory Usage (%)
Parameters
• Departments or Group
Optional Parameters
• Device
Metrics and Counters Used
• Login Time• Peak Sessions• Avg Active Sessions• ICA Latency• ICA RTT• Average CPU (%)
Document generated by Confluence on Nov 07, 2013 16:21 Page 198
• Average Memory Usage (%)
Interpreting the Data
You can click on the charts in the summary reports and drill down to see the specific server dataregarding that metric. For example, if there is a spike in Logon time, you can drill down to see wherethere may have been an issue. You can see if it was it just one server that day or all servers, one user orall users.
Group and Department Structure
Consider making custom groups so that you can select groupings of servers that provide meaningfulinformation when you generate this report. For example, you might want to run this report on a specificgroup of application servers about which users were complaining.
For information about the effect of Group and Deparatment Structure on reporting, see and the EdgeSightAdministrator's Guide.
Tips
• Double-click on the chart for more detail and to uncover issues.• Set up a subscription to email out this report in PDF format before the weekly staff meeting. This
saves people from having to log on to the EdgeSight Console at the last minute.
See Also
• Session Startup Duration Details*
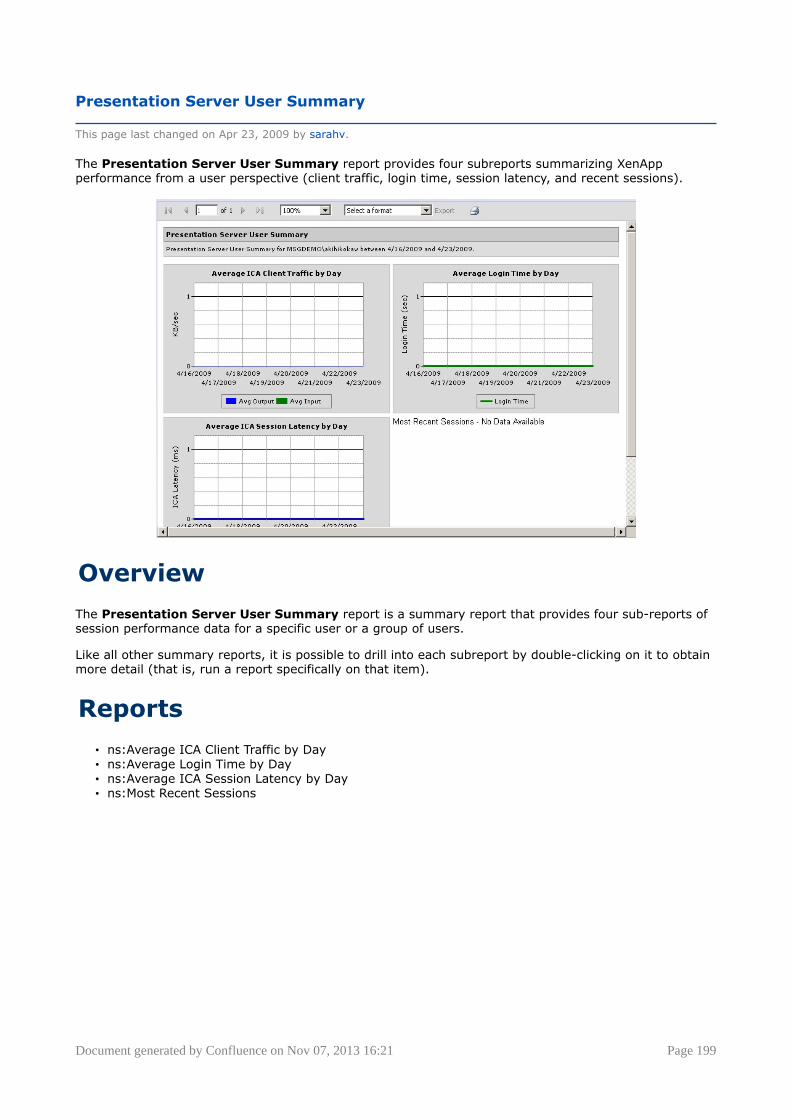
Document generated by Confluence on Nov 07, 2013 16:21 Page 199
Presentation Server User Summary
This page last changed on Apr 23, 2009 by sarahv.
The Presentation Server User Summary report provides four subreports summarizing XenAppperformance from a user perspective (client traffic, login time, session latency, and recent sessions).
Overview
The Presentation Server User Summary report is a summary report that provides four sub-reports ofsession performance data for a specific user or a group of users.
Like all other summary reports, it is possible to drill into each subreport by double-clicking on it to obtainmore detail (that is, run a report specifically on that item).
Reports
• ns:Average ICA Client Traffic by Day• ns:Average Login Time by Day• ns:Average ICA Session Latency by Day• ns:Most Recent Sessions
Document generated by Confluence on Nov 07, 2013 16:21 Page 200
Sessions Created for a User Group
This page last changed on Apr 15, 2009 by sarahv.
This report logs the number of sessions created on a XenApp server.
It also tracks user logons, including user login times and the actual time spent logged into a publishedapplication.
TBD
Document generated by Confluence on Nov 07, 2013 16:21 Page 201
EdgeSight Report List by Task
This page last changed on May 03, 2010 by williamry1.
This topic provides a list of EdgeSight reports grouped by task.
Table of Contents
• 1 Session• 2 Alerts• 3 Performance• 4 Performance Monitoring Counters• 5 Environmental
Session
• Sessions Created for a User Group• Session Login Time for a User Group• Session Startup Duration Details• Session Startup Duration Details• ICA Session Latency
Alerts
• Alerts
Performance
• XenApp Server Utilization• System CPU• System Memory Usage
Performance Monitoring Counters
The following Microsoft Excel-based reports display perfmon counter information based on real-time data:
• (EXCEL) Real-time Alert List• (EXCEL) Real-time Device Summary• (EXCEL) Real-time Network Performance• (EXCEL) Real-time Presentation Server Summary• (EXCEL) Real-time Presentation Server User Summary• (EXCEL) Real-time System Compare• (EXCEL) Real-time System Performance
Environmental
• Environmental Usage• Presentation Server Summary
Document generated by Confluence on Nov 07, 2013 16:21 Page 202
EdgeSight Data
This page last changed on Apr 30, 2010 by normanw1.
This section of the EdgeSight Reporting Wiki provides articles about how to understand EdgeSight data.
• End User Experience Monitoring Overview• Understanding EdgeSight Data• How EdgeSight Calculates ICA Traffic Numbers• End User Experience Monitoring Data• ICA Channel Data• Network• What Constitutes a Session for EdgeSight?• Adding a Custom Performance Monitoring Counter• Support for Citrix Performance Monitoring Counters• Report Counters Glossary
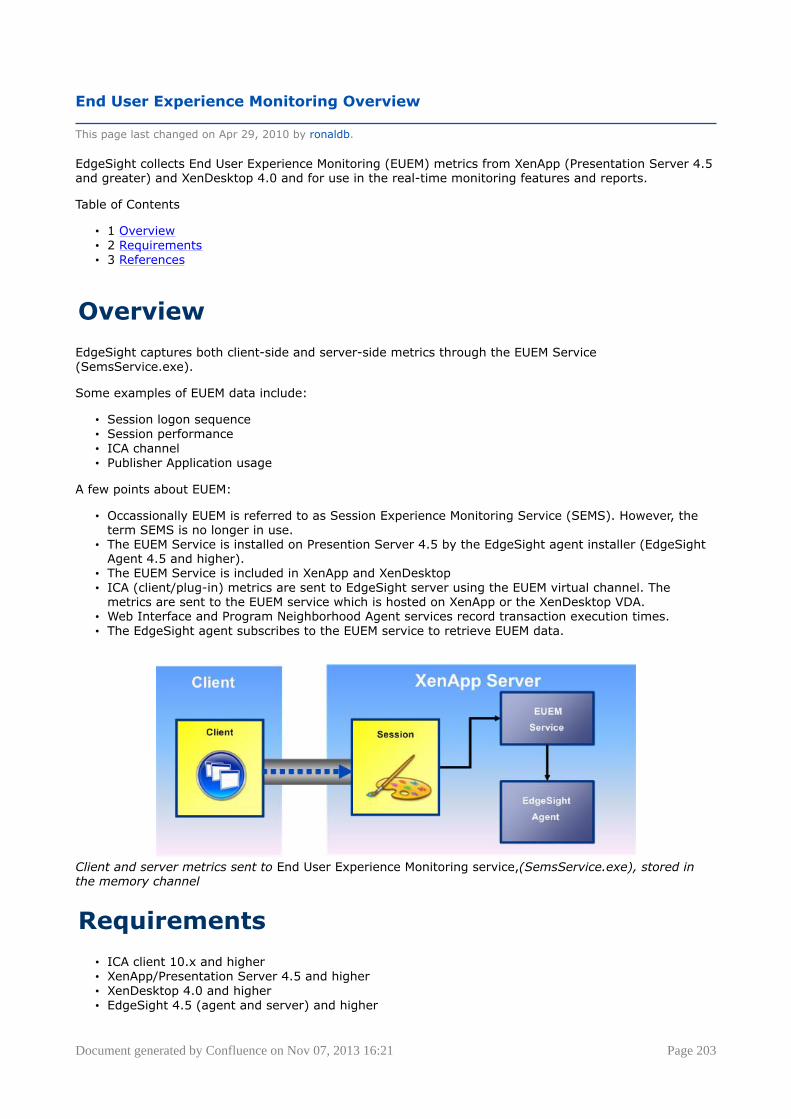
Document generated by Confluence on Nov 07, 2013 16:21 Page 203
End User Experience Monitoring Overview
This page last changed on Apr 29, 2010 by ronaldb.
EdgeSight collects End User Experience Monitoring (EUEM) metrics from XenApp (Presentation Server 4.5and greater) and XenDesktop 4.0 and for use in the real-time monitoring features and reports.
Table of Contents
• 1 Overview• 2 Requirements• 3 References
Overview
EdgeSight captures both client-side and server-side metrics through the EUEM Service(SemsService.exe).
Some examples of EUEM data include:
• Session logon sequence• Session performance• ICA channel• Publisher Application usage
A few points about EUEM:
• Occassionally EUEM is referred to as Session Experience Monitoring Service (SEMS). However, theterm SEMS is no longer in use.
• The EUEM Service is installed on Presention Server 4.5 by the EdgeSight agent installer (EdgeSightAgent 4.5 and higher).
• The EUEM Service is included in XenApp and XenDesktop• ICA (client/plug-in) metrics are sent to EdgeSight server using the EUEM virtual channel. The
metrics are sent to the EUEM service which is hosted on XenApp or the XenDesktop VDA.• Web Interface and Program Neighborhood Agent services record transaction execution times.• The EdgeSight agent subscribes to the EUEM service to retrieve EUEM data.
Client and server metrics sent to End User Experience Monitoring service,(SemsService.exe), stored inthe memory channel
Requirements
• ICA client 10.x and higher• XenApp/Presentation Server 4.5 and higher• XenDesktop 4.0 and higher• EdgeSight 4.5 (agent and server) and higher
Document generated by Confluence on Nov 07, 2013 16:21 Page 204
References
• End User Experience Monitoring Data• End User Experience Monitoring Statistics Explained

Document generated by Confluence on Nov 07, 2013 16:21 Page 205
Understanding EdgeSight Data
This page last changed on Apr 28, 2010 by normanw1.
This article provides an overview of the types of data EdgeSight gathers. Specifically, it answers thequestion, "What Does the EdgeSight Agent Monitor?"
Table of Contents
• 1 EdgeSight Agent Data Collection• ° 1.1 Event-driven data
° 1.2 Polled data° 1.3 Scheduled data
• 2 How Data Is Used in Reports• 3 Major Categories of Data• 4 References
EdgeSight Agent Data Collection
The EdgeSight Agent monitors the following types of data:
Event-driven data
• Process starts/stops, errors and faults• User logon• WinSock connection• HTTP web transactions• Session connects/disconnects• ICA session data
Polled data
• System reboots• NT event log• Performance metrics for processes and system
Scheduled data
• Drive space calculation• Asset history• Detailed logon and session metrics, virtual channel statistics
How Data Is Used in Reports
A few key points about how EdgeSight data appears in reports:
• EdgeSight groups its reports by the entity to monitor:° Device° Network° Processes° User
• Then by the type of data to display:° Performance° Stability
• EdgeSight reports use data from the EdgeSight agent and EdgeSight server databases.• EdgeSight consolidates data into one-hour slices for its non-realtime reports.• Real-time reports display data directly from an EdgeSight agent database.

Document generated by Confluence on Nov 07, 2013 16:21 Page 206
Major Categories of Data
• End User Experience Monitoring Overview• Network Data• Support for Citrix Performance Monitoring Counters
The data EdgeSight collects varies according to the agent installed on the device and the version of thedevice being monitored. For example, if a Basic agent is installed on a XenApp or Presentation Serversystem, session-level performance metrics are not collected. See the Citrix EdgeSight Administrator'sGuide for information on data availability by agent and device type and version.
A few points to remember:
• By default, EdgeSight polls for performance counters from the operating system• XenApp 5.0 agents do not collect Citrix IMA and other counters by default, only ICA Latency
counters• The XenApp 5.0 agent with EUEM does not collect ICA latency counters, instead, EUEM gets that
data from the SMC driver and EdgeSight retrieves it through that service.• Polling periods vary by EdgeSight Agent type:
° 5/5/60 minutes for endpoints° 15/5/60 minutes for XenApp
• Custom counters are configurable and can be added for third-party products or non-core systemcounters
References
• Citrix EdgeSight Administrator's Guide
Document generated by Confluence on Nov 07, 2013 16:21 Page 207
How EdgeSight Calculates ICA Traffic Numbers
This page last changed on Apr 28, 2010 by josephfo.
This article is a placeholder and will be expanded or combined with another.

Document generated by Confluence on Nov 07, 2013 16:21 Page 208
End User Experience Monitoring Data
This page last changed on Apr 29, 2010 by ronaldb.
This article describes the metrics for the End User Experience Monitoring service (EUEM). It was originallybased on CTX114495.Note: All time measurements are in milliseconds unless otherwise noted.
Session Performance Metrics
Metric Description
AVG_NETWORK_LATENCY Network latency is the detected network latencybetween the Presentation Server Client deviceand the server running Presentation Server. Unlikethe ICA round trip metric, the network round tripis largely independent of processing time on theclient or server.
AVG_ROUND_TRIP_TIME The ICA round trip time. The average time intervalmeasured at the client between the first step(user action) and the last step (graphical responseis displayed).
INPUT_BANDWIDTH_USED The actual bandwidth consumed on the network(Presentation Server Client to PresentationServer) in bits per second. This measurementis taken at the server end of the connection bycounting the actual bytes that flow to and fromthe server running Presentation Server for eachuser's session. It measures traffic on the wire(after optimization and compression has takenplace). The network bandwidth used is averagedacross the ICA round trip check period (bydefault, the Presentation Server Client initiates anICA round trip check every 15 seconds).
OUTPUT_BANDWIDTH_USED The actual bandwidth consumed on the network(Presentation Server to Presentation ServerClient) in bits per second. This measurementis taken at the server end of the connection,counting the actual bytes that flow both to andfrom the server running Presentation Server foreach user's session. It measures traffic on thewire (after optimization and compression hastaken place). The network bandwidth used isaveraged across the ICA round trip check period.
Session Performance Data (ICA round trip)
Note: Metrics on the duration of a portion of the handling of a graphical frame during the measurementof ICA roundtrip time (EUEM trigger, frame cut, frame send, first draw, and Winstation Driver trigger) areincluded in this report. A frame is the unit of graphical transfer from the server to the client. Note thatdepending on the trigger for the graphical frame, not all of these metrics will be present for each ICAround trip.
Metric Description
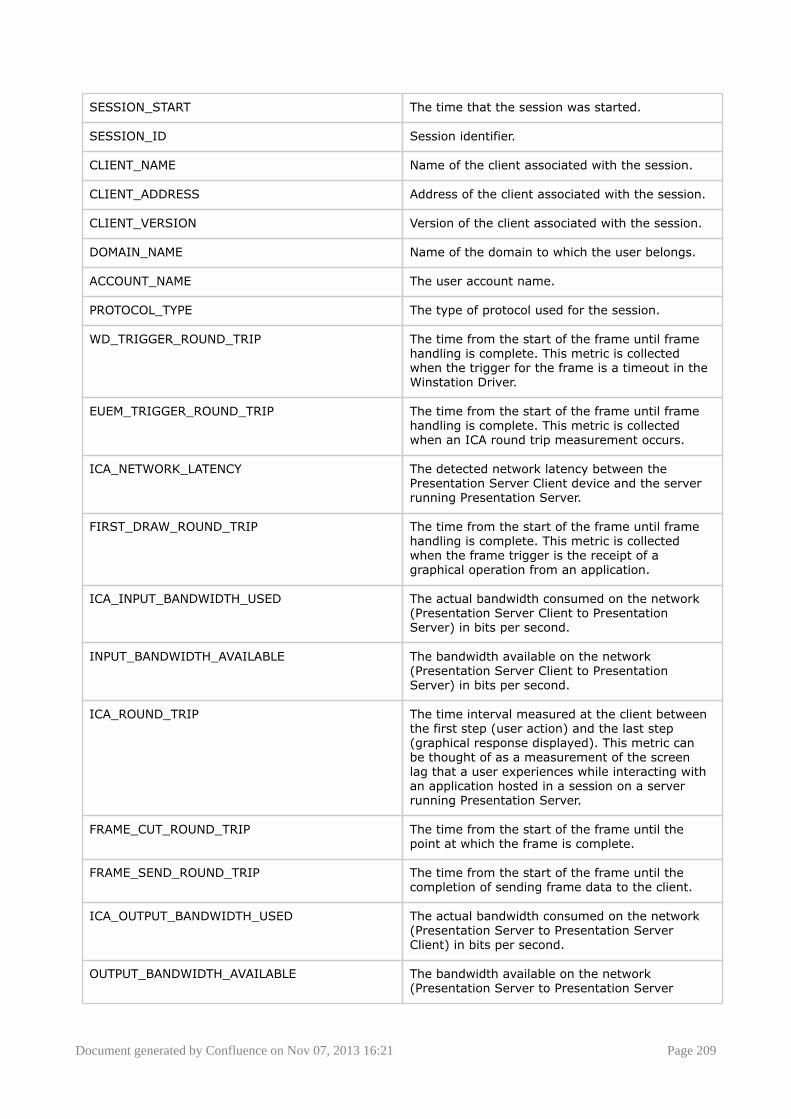
Document generated by Confluence on Nov 07, 2013 16:21 Page 209
SESSION_START The time that the session was started.
SESSION_ID Session identifier.
CLIENT_NAME Name of the client associated with the session.
CLIENT_ADDRESS Address of the client associated with the session.
CLIENT_VERSION Version of the client associated with the session.
DOMAIN_NAME Name of the domain to which the user belongs.
ACCOUNT_NAME The user account name.
PROTOCOL_TYPE The type of protocol used for the session.
WD_TRIGGER_ROUND_TRIP The time from the start of the frame until framehandling is complete. This metric is collectedwhen the trigger for the frame is a timeout in theWinstation Driver.
EUEM_TRIGGER_ROUND_TRIP The time from the start of the frame until framehandling is complete. This metric is collectedwhen an ICA round trip measurement occurs.
ICA_NETWORK_LATENCY The detected network latency between thePresentation Server Client device and the serverrunning Presentation Server.
FIRST_DRAW_ROUND_TRIP The time from the start of the frame until framehandling is complete. This metric is collectedwhen the frame trigger is the receipt of agraphical operation from an application.
ICA_INPUT_BANDWIDTH_USED The actual bandwidth consumed on the network(Presentation Server Client to PresentationServer) in bits per second.
INPUT_BANDWIDTH_AVAILABLE The bandwidth available on the network(Presentation Server Client to PresentationServer) in bits per second.
ICA_ROUND_TRIP The time interval measured at the client betweenthe first step (user action) and the last step(graphical response displayed). This metric canbe thought of as a measurement of the screenlag that a user experiences while interacting withan application hosted in a session on a serverrunning Presentation Server.
FRAME_CUT_ROUND_TRIP The time from the start of the frame until thepoint at which the frame is complete.
FRAME_SEND_ROUND_TRIP The time from the start of the frame until thecompletion of sending frame data to the client.
ICA_OUTPUT_BANDWIDTH_USED The actual bandwidth consumed on the network(Presentation Server to Presentation ServerClient) in bits per second.
OUTPUT_BANDWIDTH_AVAILABLE The bandwidth available on the network(Presentation Server to Presentation Server

Document generated by Confluence on Nov 07, 2013 16:21 Page 210
Client) in bits per second. A value of 0 indicatesthat no data was available.
SYSTEMTIME The time when the data was collected, asrecorded on the system running the EdgeSightAgent.
Session Client Startup Data
Metric Description
LOGON_TIME The time that the user logged on to start thesession.
APP_NAME The name of the published application.
LAUNCH_TYPE The type of session launch. The values are:0---Unknown1---Obsolete (This could be a captured ICA filebeing used through file-type association.)2---Web Interface3---Program Neighborhood4---Program Neighborhood Agent5---Web portal (Advanced Access Control orMetaFrame Secure Access Manager)
LAUNCH_TYPE_ID Launch type identifier (0-5), indicating atype of session launch as shown above underLAUNCH_TYPE.
SESSION_ID The session identifier.
SESSION_SHARED_FLAG A flag indicating whether a pre-existing session isbeing shared for this application launch.
SCCD - STARTUP_CLIENT This is the high-level client connection startupmetric. It starts as close as possible to the time ofthe request (mouse click) and ends when the ICAconnection between the client device and serverrunning Presentation Server has been established.In the case of a shared session, this durationwill normally be much smaller, as many of thesetup costs associated with the creation of a newconnection to the server are not incurred.
CFDCD - CONFIG_FILE_DOWNLOAD_CLIENT The time it takes to get the configuration file fromthe XML server.
BUCC - BACKUP_URL_CLIENT_COUNT The number of backup URL retries before success.Note that this is the only start-up metric that is acount of attempts, rather than a duration.
AECD - APPLICATION_ENUM_CLIENT The time it takes to get the list of applications.
COCD - CREDENTIALS_OBTENTION_CLIENT The time it takes to get the user credentials. Notethat COCD is only measured when credentials areentered manually by the user.
IFDCD - ICA_FILE_DOWNLOAD_CLIENT The time it takes the client to download theICA file from the Web server for ProgramNeighborhood Agent or Web Interface.
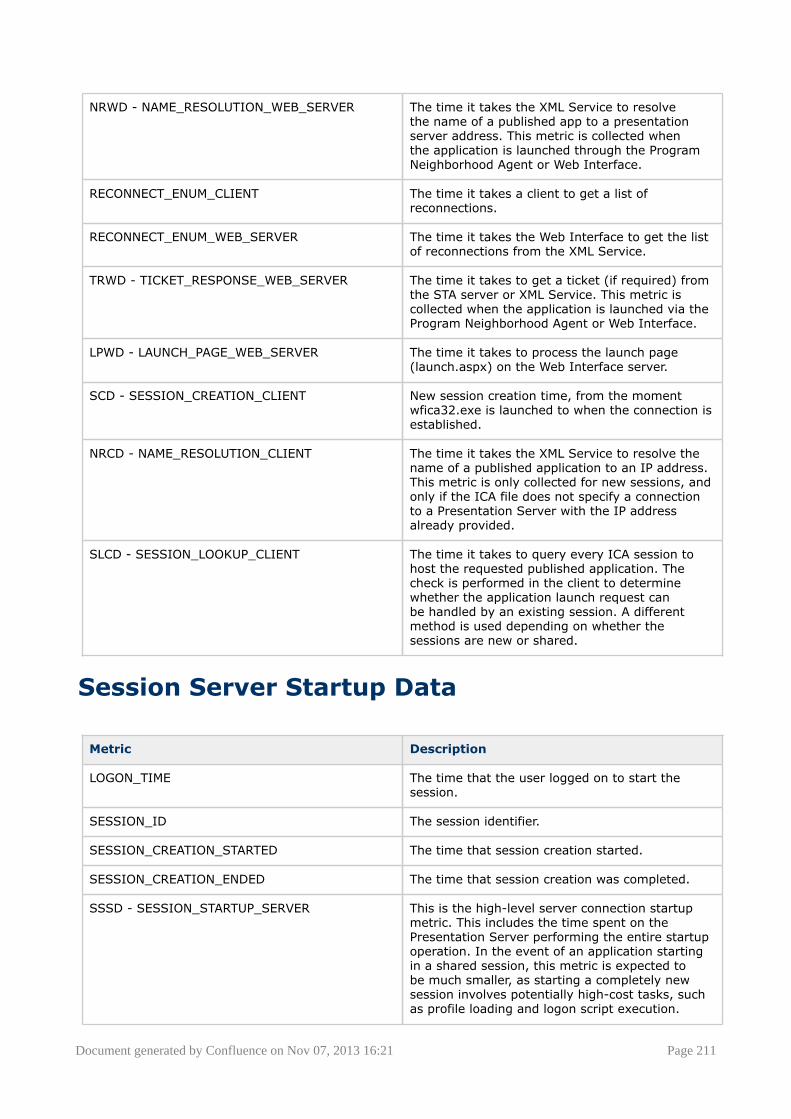
Document generated by Confluence on Nov 07, 2013 16:21 Page 211
NRWD - NAME_RESOLUTION_WEB_SERVER The time it takes the XML Service to resolvethe name of a published app to a presentationserver address. This metric is collected whenthe application is launched through the ProgramNeighborhood Agent or Web Interface.
RECONNECT_ENUM_CLIENT The time it takes a client to get a list ofreconnections.
RECONNECT_ENUM_WEB_SERVER The time it takes the Web Interface to get the listof reconnections from the XML Service.
TRWD - TICKET_RESPONSE_WEB_SERVER The time it takes to get a ticket (if required) fromthe STA server or XML Service. This metric iscollected when the application is launched via theProgram Neighborhood Agent or Web Interface.
LPWD - LAUNCH_PAGE_WEB_SERVER The time it takes to process the launch page(launch.aspx) on the Web Interface server.
SCD - SESSION_CREATION_CLIENT New session creation time, from the momentwfica32.exe is launched to when the connection isestablished.
NRCD - NAME_RESOLUTION_CLIENT The time it takes the XML Service to resolve thename of a published application to an IP address.This metric is only collected for new sessions, andonly if the ICA file does not specify a connectionto a Presentation Server with the IP addressalready provided.
SLCD - SESSION_LOOKUP_CLIENT The time it takes to query every ICA session tohost the requested published application. Thecheck is performed in the client to determinewhether the application launch request canbe handled by an existing session. A differentmethod is used depending on whether thesessions are new or shared.
Session Server Startup Data
Metric Description
LOGON_TIME The time that the user logged on to start thesession.
SESSION_ID The session identifier.
SESSION_CREATION_STARTED The time that session creation started.
SESSION_CREATION_ENDED The time that session creation was completed.
SSSD - SESSION_STARTUP_SERVER This is the high-level server connection startupmetric. This includes the time spent on thePresentation Server performing the entire startupoperation. In the event of an application startingin a shared session, this metric is expected tobe much smaller, as starting a completely newsession involves potentially high-cost tasks, suchas profile loading and logon script execution.
Document generated by Confluence on Nov 07, 2013 16:21 Page 212
CASD - CREDENTIALS_AUTH_SERVER The time spent on the server authenticating theuser credentials.
CONSD - CREDENTIALS_OBT_NETWORK_SVR The time spent by the server performing networkoperations to obtain credentials for the user.This only applies to a Security Support ProviderInterface (SSPI) logon (a form of pass-throughauthentication where the client device is amember of the same domain as the server andKerberos tickets are passed in place of manuallyentered credentials).
COSD - CREDENTIALS_OBT_SERVER This is also called COSD. It is the time taken forthe server to obtain the user credentials. Thisis only likely to be a significant amount of timeif a manual logon is used and the server-sidecredentials dialog is displayed (or if a legal noticeis displayed before the logon commences).
PNCOSD - PNC_CREDENTIALS_OBT_SERVER The time taken for the server to cause theProgram Neighborhood instance running on theclient (Program Neighborhood Classic) to obtainthe user credentials. This credentials dialog isdisplayed and managed by the client side, but theduration is measured on the server.
DMSD - DEVICE_MAPPING_SERVER The time spent on the server mapping the user'sclient drives, devices, and ports.
LSESD - LOGIN_SCRIPT_EXEC_SERVER The time spent on the server running the user'slogon script(s).
PCSD - PRINTER_CREATION_SERVER The time spent on the server synchronouslymapping the user's client printers. If theconfiguration is set such that this printer creationis performed asynchronously, no value isrecorded; it does not affect the completion of thesession startup.
PLSD - PROFILE_LOAD_SERVER The time spent on the server loading the user'sprofile.
SCSD - SESSION_CREATION_SERVER The time spent on the server creating the session.The duration starts when the PresentationServer Client connection is opened and endswhen authentication begins. This should not beconfused with the overall Session Startup Serverduration.
Examples of Using EUEM Data
Some examples of common user problems you can use EdgeSight to monitor include:
• Improving Slow Session Start Times• Session Latency

Document generated by Confluence on Nov 07, 2013 16:21 Page 213
Improving Slow Session Start Times
This page last changed on Feb 17, 2010 by sarahv.
One of XenApp users' most frequent complaints is slow session start times.
By running the Session Startup Duration Details report, administrators can use techniques described inthis article to isolate the causes for slow session start times.
This article is meant to be used in conjunction with the article about the Session Startup Duration Detailsreport.
Table of Contents
• 1 Overview• ° 1.1 XenApp Session Startup Process• 2 Isolating the Causes of Slow Start Times• ° 2.1 Requirements
° 2.2 Preparation° 2.3 Suggested Process° - 2.3.1 Interpreting the Data and Finding Solutions
- - 2.3.1.1 Frequent Causes of Slow Session Start Times- 2.3.1.2 Alternate Causes
° 2.4 References
Overview
Frequent causes of slow session start-times include XenApp authentication process, mapping clientdrives, mapping client printers, executing logon scripts, and executing user Group Policy Objects. Tosummarize, factors on the client side and the XenApp server side can contribute to slow session starttimes.
Administrators can use the Session Startup Duration Details report to isolate the slow session starttimes. This report utilizes a collection of metrics known as End User Experience Monitoring. Thesemetrics are also included in some other historical reports, real-time reports, and underlie some alerts andtroubleshooters. However, they are not gathered unless specific versions of EdgeSight, XenApp, and theOnline plug-in are installed -- see Requirements.
XenApp Session Startup Process
Before determining the causes of slow session start times, it is important to understand the sessionstartup process.
A high-level overview of the five distinct phases of the startup process, depicted graphically.At an extremely high level, session startup involves five distinct phases, each with multiple sub-activities:
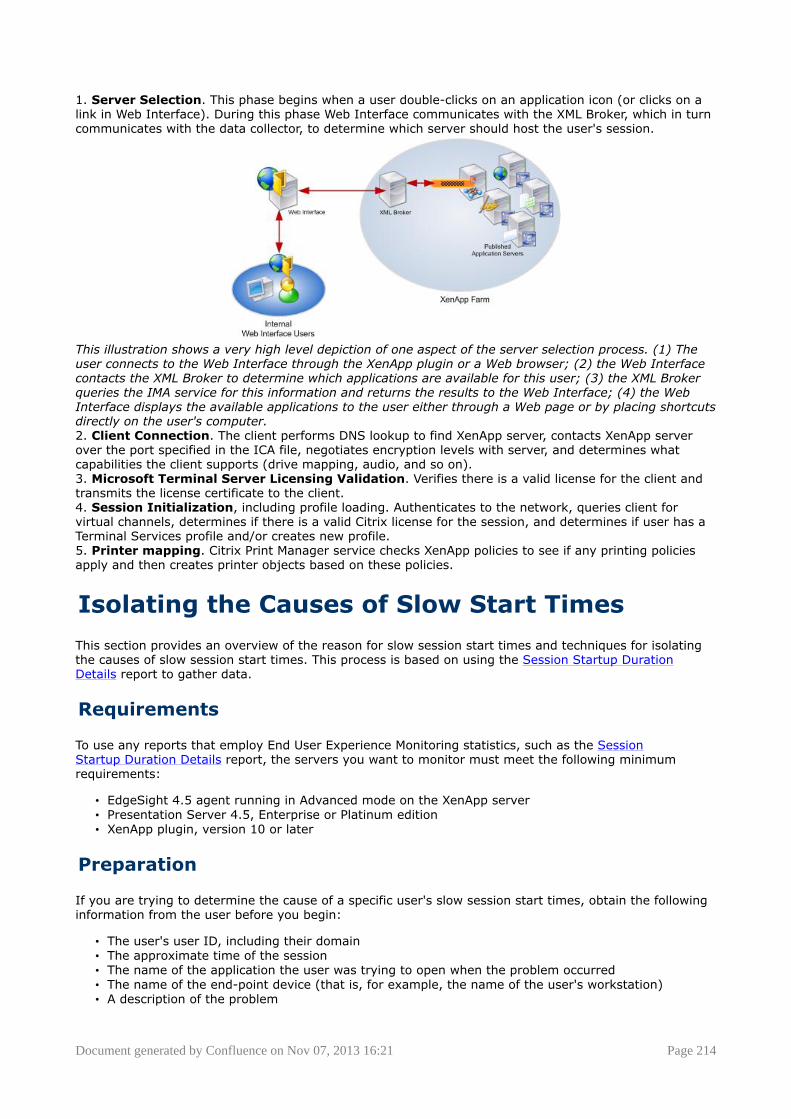
Document generated by Confluence on Nov 07, 2013 16:21 Page 214
1. Server Selection. This phase begins when a user double-clicks on an application icon (or clicks on alink in Web Interface). During this phase Web Interface communicates with the XML Broker, which in turncommunicates with the data collector, to determine which server should host the user's session.
This illustration shows a very high level depiction of one aspect of the server selection process. (1) Theuser connects to the Web Interface through the XenApp plugin or a Web browser; (2) the Web Interfacecontacts the XML Broker to determine which applications are available for this user; (3) the XML Brokerqueries the IMA service for this information and returns the results to the Web Interface; (4) the WebInterface displays the available applications to the user either through a Web page or by placing shortcutsdirectly on the user's computer. 2. Client Connection. The client performs DNS lookup to find XenApp server, contacts XenApp serverover the port specified in the ICA file, negotiates encryption levels with server, and determines whatcapabilities the client supports (drive mapping, audio, and so on).3. Microsoft Terminal Server Licensing Validation. Verifies there is a valid license for the client andtransmits the license certificate to the client.4. Session Initialization, including profile loading. Authenticates to the network, queries client forvirtual channels, determines if there is a valid Citrix license for the session, and determines if user has aTerminal Services profile and/or creates new profile.5. Printer mapping. Citrix Print Manager service checks XenApp policies to see if any printing policiesapply and then creates printer objects based on these policies.
Isolating the Causes of Slow Start Times
This section provides an overview of the reason for slow session start times and techniques for isolatingthe causes of slow session start times. This process is based on using the Session Startup DurationDetails report to gather data.
Requirements
To use any reports that employ End User Experience Monitoring statistics, such as the SessionStartup Duration Details report, the servers you want to monitor must meet the following minimumrequirements:
• EdgeSight 4.5 agent running in Advanced mode on the XenApp server• Presentation Server 4.5, Enterprise or Platinum edition• XenApp plugin, version 10 or later
Preparation
If you are trying to determine the cause of a specific user's slow session start times, obtain the followinginformation from the user before you begin:
• The user's user ID, including their domain• The approximate time of the session• The name of the application the user was trying to open when the problem occurred• The name of the end-point device (that is, for example, the name of the user's workstation)• A description of the problem
Document generated by Confluence on Nov 07, 2013 16:21 Page 215
Suggested Process
1. Run the Session Startup Duration Details report specifying your farm or a group of application serversknown to have slow session start times as the Group.
2. In the report output, review the data against the values in the Client Startup Metrics and ServerStartup Metrics tables in the Session Startup Duration Details article.
Interpreting the Data and Finding Solutions
Use the tables in the Session Startup Duration Details article to assess the values for each metric.
Sometimes, however, it isn't always obvious that a value for a startup metric is high. For example, avalue of 2 and higher for BUCC (Backup URL Client Count) is considered high. Note: Not all startupmetrics appear in all client-server configurations, depending on the client and server launch mechanisms.For specifics, see the appendices in Improving visibility to the user login experience with Citrix EdgeSight.In addition, if you use EdgeSight for Load Test to generate data, the client row of the Session StartupDuration Details report will be blank.
The top level client and server startup metrics (CSD and SSD) do not represent the sum of the detailmetrics. For example, some detail metrics such as COCD (Credentials Obtention Client Duration) andCOSD (Credentials Obtention Server Duration) are excluded from the top level metrics due to theirtendency to artifically inflate the totals by including user response time. In the Session StartupDuration Details report, CSD and SSD are displayed as a average values because of the possibility thatmore than one Server or Client Startup per session can exist when a session is disconnected or when auser starts another session from a different client.
Frequent Causes of Slow Session Start Times
While every environment is different, some causes of slow session start times occur across many differentenvironments. While you are reviewing the metrics in the table below, look carefully at the followingmetrics:
• LSESD. LOGIN_SCRIPT_EXEC_SERVER.• PCSD. PRINTER_CREATION_SERVER.• PLSD. PROFILE_LOAD_SERVER.• SCSD. SESSION_CREATION_SERVER.
However, rather than focusing exclusively on these metrics, it is better to systematically review eachmetric in order.
Important: Tables with guidance about interpreting each metric are included in the article, SessionStartup Duration Details. That article is designed to be used with this article to help diagnose the cause ofspecific problems and provides information about how to resolve the issues.
Alternate Causes
If, after reviewing these metrics, the cause of slow sessions is not apparent, consider if any of thesefactors are affecting session start times:
• Policy design. Consider reevaluating your policy design. According to a Citrix Consultingstudy, the tenth most common problem they see in customer environments is suboptimal policydesign. Whenever possible, set policies to optimize the ICA protocol and improve overall sessionperformance (for example, by disabling unused virtual channels, such as audio or COM portmapping). Ideally, these settings should be included in a baseline XenApp policy, which is a policythat applies to all servers or users and has many common settings and optimizations. Bandwidthrestrictions and common printing configurations are also ideal candidates for inclusion in a baselineCitrix policy. For an example of a good baseline policy, see Top 10 Items Found by Citrix Consultingon Assessments and _How Policies Impact Presentation Server Environments.
• Network activities occurring independently of sessions. Standard operations affecting starttimes include logging on to Active Directory, querying Lightweight Directory Access Protocol (LDAP)directory servers, loading user profiles, executing logon scripts, mapping network drives, and writing
Document generated by Confluence on Nov 07, 2013 16:21 Page 216
environment variables to the registry. Also, connection speed and programs in the Startup itemswithin the session, such as virus scanners, can affect start times.
• Whether the data collector has sufficient resources to make load balancing decisionsefficiently. If your environment has grown, make sure that you have reevaulated the systemhosting the XML Broker. You might need to give the XML Broker its own dedicated server. Inenvironments with collocated infrastructure servers, Citrix suggests hosting the Citrix XML Broker onthe data collector to avoid delays. For concrete guidelines (using Performance Monitor counters) forevaluating infrastructure server sizing, including the XML Broker, and general information about theXML broker, see the Citrix XenApp 5.0 Installation Guide.
• License Server Location. For WANs with multiple zones, where the Terminal Services licenseserver is in relation to the zone.
• General latency. While high client network latency (for example, ICA performing startup queries)can lengthen session start time, often XenApp and network configuration (profiles, printers, GPOs,scripts, antivirus) are the culprits. In addition, if the application server has a lot of activity, suchas logins, too many sessions, an application using excessive CPU utilization, or a lot of page faultsand so on, then session start times are going to be slow. For more information, see ICA SessionLatency.
References
• Improving visibility to the user login experience with Citrix EdgeSight, Citrix whitepaper.• End User Experience Monitoring Statistics Explained, CTX114495• Functionality for the ICA Session Latency Reports Explained, CTX114291 http://kb.citrite.net/article/
ctx114291• Citrix XenApp 5.0 Installation Guide • Top 10 Items Found by Citrix Consulting on Assessments• How Policies Impact Presentation Server Environments• The excrutiating detail of the Citrix logon process: A huge wall chart by Brian Madden on
brianmadden.com, accessed on June 5, 2009.
Document generated by Confluence on Nov 07, 2013 16:21 Page 217
Session Latency
This page last changed on Apr 29, 2010 by ronaldb.
Users perceive latency in sessions when there is a delay between the time at which they press a key andthey receive feedback. There are multiple reasons for session latency on the client side (for example,client network latency, client network congestion) and on the server side (for example, overloadedapplication servers, database servers, and network backbones).
This article provides an overview of these factors and resources for obtaining more detailed information.
Table of Contents
• 1 Overview• 2 Isolating Causes for Session Latency• ° 2.1 Starting with User Complaints about Latency
° 2.2 Overall Poor Network Performance° - 2.2.1 XenApp Printing Consumming Excessive Bandwidth° 2.3 Application Scalability and Server Performance
• 3 EUEM Session Data Replaces Deprecated Session Latency Data• 4 References
Overview
When users first report performance problems with an application, it can be due to a number of reasons.It could be a rogue process running with the CPU, heavy paging or writing to disk, or it could be a graphicintensive application causing ICA Latency. It could also be a slow link or bad network connection.
Isolating Causes for Session Latency
Starting with User Complaints about Latency
If a user is complaining about latency, begin by determining if the latency is a product of the session oron the server hosting the session.
Page Faults
If there are page faults, determine if the latency is a product of the session or on the server hosting thesession.
1. Run the System Page Faults report, grouped by Process. If you see page faults consistently on allprocesses, then the problem is on the server hardware.-OR-
2. Run the Session Page Faults report grouped by Device.3. If it is not a server-side problem, run the Session Page Faults report grouped by Process to look
for trends in sessions experiencing page faults for the same application as the one the user wasrunning.
Overall Poor Network Performance
Because all session transactions occur across the network as the XenApp plugin (client) communicateswith the server, reduced network bandwidth can affect session response times. In EdgeSight 5.x, go tothe Browse tab and seach for ICA to display ICA-related reports. Reports for ICA traffic, ICA latency andICA round trips will help to determine if the problem is related to ICA network traffic.
XenApp Printing Consumming Excessive Bandwidth
Poor XenApp printing configurations can consume excessive amounts of network bandwidth. In particular,configuring print jobs to take the network printing pathway in WAN environments should be avoided.
Document generated by Confluence on Nov 07, 2013 16:21 Page 218
To determine if your sessions are experiencing latency due to printing bandwidth consumption, run theICA Printer I/O report. This report lists printer input and output in bps as well as the client device name,printer name and driver name.
Application Scalability and Server Performance
When application servers are overloaded, users may experience poor session performance. They mayreport it takes them a long time to logon or their sessions are not responsive to commands. To determineif servers are overloaded, you need to examine not only the performance of the individual server but alsothe scalability of the application that server is hosting. To better understand server performance factors,see XenApp Server Health.
EUEM Session Data Replaces DeprecatedSession Latency Data
The session experience monitoring data replaces the previously collected session latency data. If theprerequisites listed in [End User Experience Monitoring Overview} are present, the following reports willnot contain data:
• Highest ICA Session Latency for a Group by Device• Highest ICA Session Latency for a Group by User• ICA Session Latency for a Group by Day• ICA Session Latency for a Group by Hour• ICA Session Latency for a Device by Day• ICA Session Latency for a Device by Hour• ICA Session Latency for a User by Day• ICA Session Latency for a User by Hour
References
• Use Cases for EdgeSight 4.5 - Monitoring and Managing the Environment with EdgeSight,CTX115727, accessed on April 15, 2009.
• Madden, Brian. Understanding Citrix's SpeedScreen Latency Reduction. Accessed on April 15, 2009
Document generated by Confluence on Nov 07, 2013 16:21 Page 219
ICA Channel Data
This page last changed on Apr 29, 2010 by normanw1.
EdgeSight collects a full set of metrics for the ICA channels. These include:
• Audio and Video • Printer• Drive• COM port• Session Compression• Session Line Speed• Clipboard• SpeedScreen• USB (XenDesktop only)• Smartcard (XenDesktop only)
Custom ICA channels are not monitored.
What Does this Mean?
With this capability users will be able to, for example, monitor printing delays in the XenApp farm as wellas certain visibility into potential file transfer issues and performance across the XenApp farm.
You can use this metrics to help determine whether whether printing, file transfers or audio, or videocould be causing user experience issues. Run the ICA Traffic reports to see this information.
EdgeSight uses these metrics its historical and real-time reports.
What Tasks Can I Perform with this Data?
You can use this data to perform the following tasks:
• Monitoring the End-User Experience• Troubleshooting the End-User Experience• Capacity Planning
Reports Using this Data
• ICA Audio I/O• ICA Drive I/O• ICA Printer I/O• ICA Session Compression• ICA Session I/O• ICA Session Traffic• ICA Video I/O• HDX MediaSteam I/O (XenDesktop only)• HDX Plug-n-Play I/O (XenDesktop only)
Document generated by Confluence on Nov 07, 2013 16:21 Page 220
Network
This page last changed on Apr 30, 2010 by normanw1.
• Why EdgeSight Network Data Differs from Network Monitoring Tools• Network Data
Document generated by Confluence on Nov 07, 2013 16:21 Page 221
Why EdgeSight Network Data Differs from Network Monitoring Tools
This page last changed on Apr 29, 2010 by normanw1.
EdgeSight users who are running multiple network monitoring tools in their enviornments may noticeEdgeSight has different values for data that is captured by network monitoring tools.
The reason the data differs is because of the way in which EdgeSight captures, records, and calculatesmetrics.
EdgeSight measures all network data from within the monitored application and not on the network itself.Consequently, EdgeSight always displays different measurement values than the value calculated by anetwork sniffer or a tap.
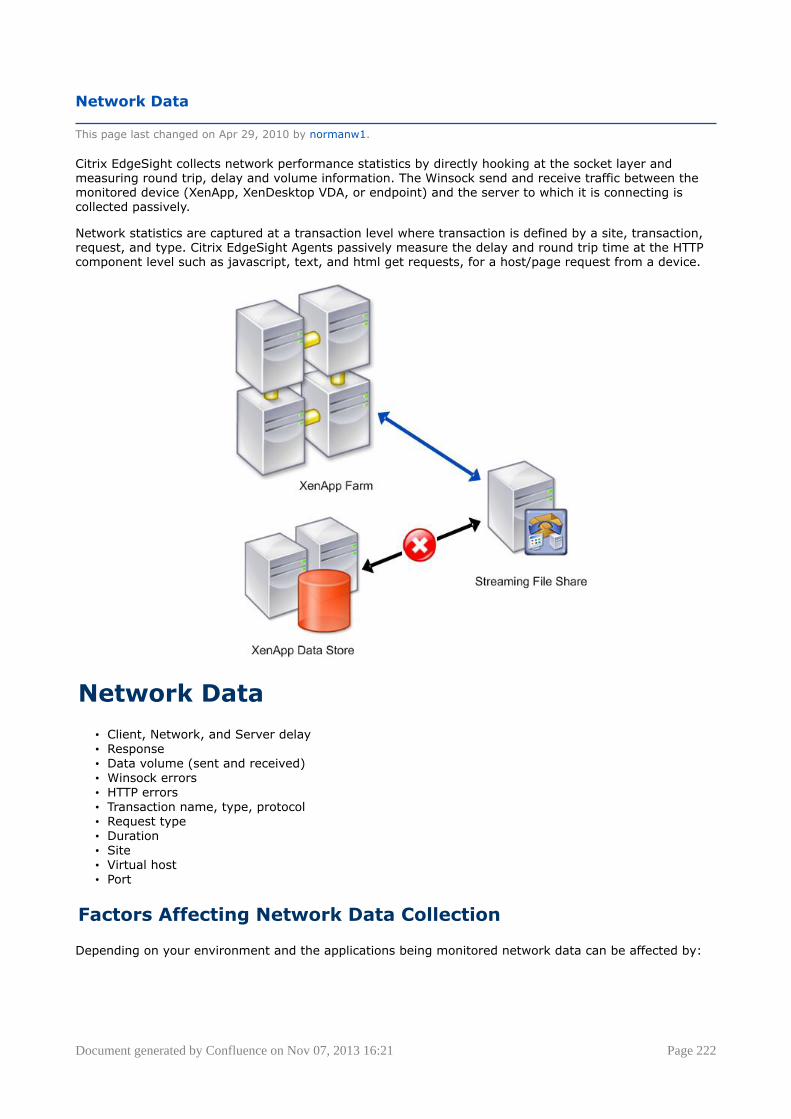
Document generated by Confluence on Nov 07, 2013 16:21 Page 222
Network Data
This page last changed on Apr 29, 2010 by normanw1.
Citrix EdgeSight collects network performance statistics by directly hooking at the socket layer andmeasuring round trip, delay and volume information. The Winsock send and receive traffic between themonitored device (XenApp, XenDesktop VDA, or endpoint) and the server to which it is connecting iscollected passively.
Network statistics are captured at a transaction level where transaction is defined by a site, transaction,request, and type. Citrix EdgeSight Agents passively measure the delay and round trip time at the HTTPcomponent level such as javascript, text, and html get requests, for a host/page request from a device.
Network Data
• Client, Network, and Server delay• Response• Data volume (sent and received)• Winsock errors• HTTP errors• Transaction name, type, protocol• Request type• Duration• Site • Virtual host• Port
Factors Affecting Network Data Collection
Depending on your environment and the applications being monitored network data can be affected by:
Document generated by Confluence on Nov 07, 2013 16:21 Page 223
Socket Lifetime
Network applications can have short-lived or long-lived TCP sockets. Long-lived sockets are often usedwhen repeated calls to a site are expected, the protocol requires a long-lived socket, or large amounts ofdata are to be transferred.
For short-lived sockets, EdgeSight records all network metrics when the socket is closed. For long-livedsockets, EdgeSight polls socket performance every 5 seconds, with the timer based on socket transitionsresulting from data transfers.
Data Grooming
The EdgeSight agent automatically tunes data collection based on the volume of data seen and theagent configuration settings for data retention. For EdgeSight for XenApp agents, the data retentionperiod is three days. The number of network sockets created depends on application usage, applicationarchitecture, and the number of users accessing an application. During periods of extremely highusage, collection data for all sockets may not be feasible. To balance data collection with the impacton monitored systems, if the number of unique data collection points during the agent data retentionperiod exceeds 360,000, network operations occurring after the limit has been reached are not recorded.Network data collection resumes when the number of collection points falls below the threshold.Data collection points include short-lived socket connections and poll intervals on long-lived socketconnections.
Proxies
The EdgeSight agent monitors application experience with the network resources accessed by theapplication. Proxies, firewalls, and NAT devices are considered part of the network, unless the applicationis configured to use a proxy. In this case, the agent considers the proxy as the site for all network traffic.
Reports using this data
Network reports can be found by choosing the "Network" Object Type from the leftside navigation paneon the Browse page.
• Network Summary• Network Summary by Site• Network Transaction Summary• New Sites• Port Network Delay• Port Network Round Trip Time• Port Network volume• Port Web Errors• Process Network Delay• Process Network Volume• Site Network Delay• Site Network Volume• Site Network Errors• Site Network Round Trip Time• Site Network Volume• Transaction Network Delay• Transaction Network Round Trip Time• Transaction Network Volume• Transaction Web Errors• Visited Sites

Document generated by Confluence on Nov 07, 2013 16:21 Page 224
What Constitutes a Session for EdgeSight?
This page last changed on Apr 28, 2010 by josephfo.
EdgeSight considers a session to start when a user opens a published application. (The session does notstart when a user initially creates the client connection by, for example, starting the Web Interface.) Thesession is the instance of the user's interaction with the application on the server.
This article provides details about what EdgeSight considers to be a XenApp session.
Background: XenApp and Sessions
In a XenApp environment, when a user logs on to the farm, the client device links to the server througha connection and establishes a session. This connection is known as the client connection. Users accesspublished resources through the client connection in what is known as a session. When a user initiallyconnects to the farm and starts a published application, the server opens the application in a session.
Users access published applications in sessions after the client device establishes a connection with theserver.
Passthrough Client Authentication
When a user connects to applications published on different servers, passthrough clientauthentication enables XenApp to automatically pass a user's credentials from theinitial server to the server hosting the next application. This prevents the userfrom having to re-authenticate when opening applications on different servers.
<image>
If session sharing is not enabled, EdgeSight counts each session created as a by-product of passthroughauthentication as a separate session. However, if session sharing is enabled EdgeSight counts by-productsessions as one session but tracks separate session information for them.
The Citrix End User Experience Monitoring service runs on individual XenApp computers. As a result, theservice sees each "hop" in the passthrough authentication chain as a separate and unique instance of aconnection, session and application. (The outer "hop" of the pass-through chain only lists an applicationthat was the ICA Client instance.)
If you are using EdgeSight with third-party products, the Citrix End User Experience Monitoring servicerecords extra information associated with pass-through client connections to passthrough chain.
What EdgeSight Considers a Session
When Does EdgeSight Consider a Session to Have Started?
With the exception of some session reconnection scenarios such as the use of smooth roaming or anauto-reconnect, EdgeSight considers every time a user starts an application or desktop to be a new

Document generated by Confluence on Nov 07, 2013 16:21 Page 225
session. The EdgeSight startup metrics (xxx, xxx) capture the time taken to perform various activitiesthat occur when a session, connection or application begins.At first glance, the start-up time for a XenApp user appears simple: the time it takes to get from theinitial mouse-click from a user on an icon to the point at which the user's application is ready for inputfrom the end user.In reality, this process is more complex. As we have already seen, Connection, Session, and Applicationare independent entities.<move to metric section:> Each metric abbreviation ends with either the combination CD, WD or SD(except BUCC which is a special case). This indicates where the metric has been gathered. CD indicates aduration on the client device. WD indicates a duration measured on a Web Server (where Web Interfaceor PN Agent are in use). SD indicates a duration measured on the presentation server.All start-up metric durations are provided in milliseconds.EdgeSight calculates session start times differently depending on whether it gathered the metric from theserver or the client.
Session Start on the Server
To start a new session on a server, the user must be authenticated. Once authenticated, the sessionmust perform any client device mapping tasks (printers or drives), load the user's profile, execute logonscripts, and then start the user's application (for a published desktop this is explorer.exe). If a sessionalready exists and a new application is being started through session sharing (see section 3.2), then onlythe application start stage occurs.
The server start-up metrics cover all of the stages that occur to create a new session and application,or launch a new application within an existing session. It should be noted that the metric set does notdraw a distinction between the two cases - the relevant metrics will have values depending on the actionsexecuted.Each task within the session start-up process is individually instrumented for duration, and these metricsare passed to the End User Experience Monitoring Service. An overall Server Start-up metric is provided,as well as drill-down detail into each individual task.
The high level Session and Application Startup Metric is the SSSD: Session Startup Server Duration. Thisincludes the time spent on the presentation server performing the entire start-up operation. In the eventof an Application starting in a shared session, this metric is expected to be much smaller, as startinga completely new session involves potentially high cost tasks such as profile loading and login scriptexecution.
Application Launches During Server Startup
EdgeSight records each application launch separately from the session startup. This is because eachsession can host multiple launched applications, and indeed it is possible for these application launchesto overlap, where the launch of a subsequent application can start before the launch of the precedingapplication is complete. Each application launch consists of one or more processes starting, with earlierprocesses potentially spawning later processes as part of their launch activity. The end of the launch ofeach individual process is the point at which that process becomes 'Input Idle', which means that it is idlewaiting for user input.
The complete Application Launch Server Duration (ALSD) is the time from the end of the session startupto the point when the application is ready for user interaction, which is deemeda to be when the lastprocess spawned as part of the application launch has reached the 'Input Idle' state. The launch timingcan be visualized as follows:
<image>
Incomplete Start-Ups
Sessions might not finish starting for a number of reasons - network interruptions, failure to authenticate,failure to license, or a manual abort from the end user. In these cases, the Citrix End User ExperienceMonitoring service may provide partial metrics that it has managed to gather before the abort occurs.In the case of a re-connection to an existing session, the Citrix End User Experience Monitoring serviceautomatically re-associating the new start-up metrics with the original session.
Document generated by Confluence on Nov 07, 2013 16:21 Page 226
Session Termination Events
Session Disconnection Termination Events are generated when a session being monitored ends. Theonly information associated with these events is the identity of the session that is terminating and thetimestamp of when the event occurred.
Document generated by Confluence on Nov 07, 2013 16:21 Page 227
Adding a Custom Performance Monitoring Counter
This page last changed on Apr 29, 2010 by ronaldb.
EdgeSight supports adding performance monitoring counters that it does not collect by default andcreating a report for a custom counter. This lets you run reports on XenApp counters not currentlyincluded in EdgeSight and other counters you might find valuable. This article explains how to add thecounters, provides a few sample use cases for the counters, and how to create a chart for a customcounter.
Table of Contents
• 1 Overview• 2 Adding a Custom Performance Monitoring Counter• 3 Generating Reports for Custom Counters• 4 Suggestions for Performance Monitoring Counters to Add• 5 References
Overview
While EdgeSight collects many performance monitoring counters, it does not collect all of them bydefault. This is partially done to keep the size of the database from growing excessively, but in somecases this is also the result of XenApp and EdgeSight releasing at different times.Adding some custom perfmon counters for important infrastructure functions can greatly improve yourfarm management. Important perfmon counters include ones for the XML Broker and the data collector.However, when you are adding perfmon counters for these servers, be aware of the following:
• EdgeSight is not "XML-Broker" aware. That is, while you can see the server running the XMLService and communicating with the Web Interface just like you'd see any other server on the farm,EdgeSight doesn't apply specific labels to call out this server role. This also applies to the datacollector and any backup data collectors.
• Specialty perfmon counters, such as Application Resolutions/sec or Filtered ApplicationEnumerations/sec, will only appear in the EdgeSight user interface when you specify thedevice on which they are collected. For example, if the XML Broker is the only server onwhich Application Resolutions/sec is visible, you will only see Application Resolutions/secin EdgeSight when you select your farm's XML Broker as the device. For more informationabout which perfmon counters appear on which XenApp server roles, see the Server(s)column in XenApp Infrastructure Monitoring and Alerting, CTX118742 .
• The only report that displays custom perfmon counters is the Chart report in the Troubleshoottab ( Real-time Reports > Custom Performance Counters > Chart ). The reports found in theBrowse tab do not display these any perfmon counters that you added.
Generating a report based on a custom perfmon counter is a two-part process:
1. You must add the custom counter2. You must run the report
For more information, see Custom Counter Configuration and Real Time Device Reports in the EdgeSightonline help.
Adding a Custom Performance MonitoringCounter
1. In EdgeSight, click the Troubleshoot tab.2. Click Real-time Reports > Custom Performance Counters > Configuration.3. In the Custom Performance Counters section, specify the device on which you can find the
performance monitoring counter you want to add. <do you need to do this for every server with thecounter on the farm or is once enough?>
Note : To add a custom counter, you must have administrator privileges on the XenApp server from whichyou want to add the custom perfmon counter.

Document generated by Confluence on Nov 07, 2013 16:21 Page 228
Note : EdgeSight uses the credentials from the computer on which you are running the EdgeSight consolewhenever you use a feature that requires real-time data from a XenApp server. Consequently, if you arelogged on to the computer on which you are running the EdgeSight console with different credentials (notthe admin credentials), then you must either (a) log on to a computer with the XenApp server credentialsand run EdgeSight or (b) configure your browser to prompt you whenever it requires credentials. Forexample, in Internet Explorer 7. x , you would select the Prompt for user name and password optionin the Security Settings dialog for both the Internet and Local intranet zones.After the Status displays the word " Ready " then the Settings , Add New Counter , and ConfiguredCounters sections appear.
1. In the Add New Counter section, from the Object list box, select the name of the performancecounter object. For example, Citrix MetaFrame Presentation Server.
2. From the Counter list box, select the counter you want to add. For example, Maximum number ofXML threads .
Note : Only counters available on this server appear in the list box. See CTX118742 for information aboutthe counters that are available on what types of servers.
1. Click Add Counter . The newly added counter appears in the Configured Counters section.
Generating Reports for Custom Counters
As described previously in this article, the only report that lets you generate reports for custom countersis the Chart report for Custom Performance Counters.
1. In EdgeSight, click the Troubleshoot tab.2. Click Real-time Reports > Custom Performance Counters > Chart .3. In the Custom Performance Counters section, specify the device for which you want to run the
report. You can only run reports for one server at a time.
Note: Security settings in Internet Explorer and Excel 2007 can cause real-time reports to appear asblank. See Data in Remote Reports are Not Populating Correctly Using Excel 2007, CTX112965.You mayalso need to go into the Trust Center in Excel 2007 and select the following options: Enable all macros(not recommended, potentially dangerous code can run) and Trust access to the VBA projectobject model.
Suggestions for Performance MonitoringCounters to Add
Proactively monitoring specific indicators (or perfmon counters) can help alert administrators of problemconditions before they impact users and help quickly isolate causes. All counters are Citrix MetaFramePresentation Server objects.
Counter to Add Purpose Baseline orThreshold
What Device
ApplicationResolution Time (ms)
Measures the timerequired to determinethe Least-LoadedServer during anapplication launch
A baseline would needto be established inyour environment toaccount for increasesduring peak logontimes before accuratethresholds can bedefined
All XML Brokers
Data StoreConnection Failure
The number of minutesthat the server runningPresentation Server has
Threshold should takeinto account eventssuch as reboots andscheduled maintenance
All XenApp servers
Document generated by Confluence on Nov 07, 2013 16:21 Page 229
been disconnected fromthe data store
Number of busy XMLthreads
The number of XMLrequests that arecurrently beingprocessed. Themaximum number ofrequests that the XMLservice can process atany one time is 16.
Any count over 16sustained for 1 minuteor longer is potentiallyproblematic
All XML Brokers
WorkItem QueueReady Count
The number of workitems that are readyand waiting to beprocessed by IMA
If this counter issustained above 0 for aminute there may be aproblem
All XML Brokers
• Most Preferredand PreferredData Collectors(that is,XenApp serverswith electionpreferences set toMost Preferred orset to Preferred)
Resolution WorkItemQueue Ready Count
The number of workitems (related toapplication launches)that are waiting to beprocessed by IMA
If this counter issustained above 0 for aminute there may be aproblem
All XML Brokers, MostPreferred and PreferredData Collectors
Zone Elections Won Amount of times thisserver has won anelection
If this counter increasesby 2 in 1 hour theremay be a problem
Most Preferred andPreferred DataCollectors
Zone ElectionsTriggered
Amount of times thisserver has called for anelection. This counter isincremented regardlessof whether or a nota new Zone DataCollector was elected.NOTE: This counteris added with HotfixRollup Pack 3 forPresentation Server4.5 .
If this counter increasesby 2 in 1 hour theremay be a problem
All XenApp servers
References
Data in Remote Reports are Not Populating Correctly Using Excel 2007
Document generated by Confluence on Nov 07, 2013 16:21 Page 230
Support for Citrix Performance Monitoring Counters
This page last changed on Apr 29, 2010 by ronaldb.
This article provides an overview of EdgeSight support for Citrix performance monitoring (perfmon)counters.
Overview
EdgeSight monitors Windows and Citrix-specific performance monitoring counters (often referred to as"perfmon counters"). However, not all performance monitoring counters are in EdgeSight by default.
You can add perfmon counters to EdgeSight and display them on a per device basis in the Realtime(historical) reports. This is explained in Adding a Custom Performance Monitoring Counter.
XenApp Performance Monitoring Counters
XenApp counters are divided into major categories, known as performance objects, these include:
• Citrix CPU Utilization Mgmt User• Citrix IMA Networking• Citrix Licensing• Citrix MetaFrame Presentation Server• ICA Session• Secure Ticket Authority
EdgeSight can monitor all of the major categories of XenApp performance monitoring counters; however,the counters may need to be added to EdgeSight. The individual counters for each category above arelisted in the Citrix XenApp Administrator's Guide. You can also view these counters through the WindowsPerformance monitor.
EdgeSight monitors most ICA performance monitoring counters that are installed with XenApp. XenApphas performance monitoring counters for:
• Bandwidth and compression for ICA sessions and XenApp servers• Bandwidth for individual virtual channels within a ICA session• Latency for ICA sessions
References
Document generated by Confluence on Nov 07, 2013 16:21 Page 231
Report Counters Glossary
This page last changed on Apr 28, 2010 by ronaldb.
This glossary provides definitions of the counters and other data fields shown in EdgeSight reports.Some fields, such as Name, are self-explanatory and are not included in this glossary. For the definitionof the metrics included in archive reports, see the tables in Accessible Citrix SQL Views and AccessibleEdgeSight SQL Views as listed in Archive Reports.
In some cases, the XenApp server, plug-in (ICA client), and EdgeSight Agent versions running on amonitored device affect which counters are collected. See Session Experience Monitoring Metrics inthe Working with Reports topic for more information. End user experience monitoring (EUEM) metricscollected by the session experience monitoring service are indicated by a label of "EUEM" at the end ofthe metric description.
Use the letters below to go directly to a section of the glossary. Note that terms are listed as they areshown in report headers. In some cases symbols (as in % User Time) or abbreviations (as in Avg CPU)are used due to space considerations.
Important: To find out what reports use a specific metric, in EdgeSight 5.0, click the Browse tab andtype the name of the metric in the Search box in the user interace (not the Find (CTRL + F) feature inthe Web browser). You can also find reports by entering a report name or description in the Search box.
A B C D E F G H I J K L M N O P Q R S T U V W X Y Z
Historical Report Counters and Data Fields
A
Active Time
Active time is the actual amount of time that the user has the application as the active window on theirdesktop. The active window is the window that has focus on the desktop. Citrix EdgeSight Agents trackapplication usage to calculate how long an application is actively used and how long it is run, and tocollect usage counts for license tracking.
Address
The IPv4 or IPv6 address for a site.
AECD
Application Enumeration Client Duration. The time (ms) it takes to get the list of applications. (EUEM)
Alert Count
The number of alerts received by the EdgeSight Server during the specified time frame.
Alert Name
The specific name of the alert rule associated with the condition.
Alert Type
The type of alert condition, such as reboot, process fault, or system performance. The same type of alertcan be triggered based on different rules, depending on the specific condition triggering the alert. Forexample, an alert with a type of system performance can be triggered based on a system slowdown,system low resources, or system thrashing alert rule.

Document generated by Confluence on Nov 07, 2013 16:21 Page 232
Alerts
The number of alerts of a specific type received by the EdgeSight Server for a specified time period.
Alerts Today
The number of alerts received by the server for the current day.
Asset
Hardware and software asset report data is derived from Windows Management Instrumentation (WMI).For more information on WMI classes, see the WMI Reference at:
http://msdn.microsoft.com/en-us/library/aa394572.aspx
Asset Changes
The number of changes to device hardware and software assets during a specified time period.
Audio Input (bps)
The bandwidth, measured in bps, used when playing sound in an ICA session.
Audio Output (bps)
The bandwidth, measured in bps, used for playing sound in an ICA session.
Average Active
The average number of active sessions during a specified time period.
Average Inactive
The average number of inactive sessions during a specified time period.
Average Sessions/Device
The average number of sessions (active and inactive) for a device over a specified time period.
Avg Active Time
The average active time for an application. See Active Time.
Avg Alerts/hour
The average number of alerts per hour for the selected time period.
Avg Client Startup Duration (ms) or Avg CSD
The average time elapsed from the time of the request (mouse click) to the time when the ICAconnection between the client device and Presentation Server has been established. In the case of ashared session, this duration will normally be much smaller, as many of the setup costs associated withthe creation of a new connection to the server are not incurred.
Avg CPU or Avg CPU (%)
The average percent CPU usage over the specified time period. See CPU(%) for information on calculatingCPU usage on multiprocessor machines.
Document generated by Confluence on Nov 07, 2013 16:21 Page 233
Avg Delay (ms)
See Network Delay (ms).
Avg Free Mem (%)
The average percentage of free memory on a device or group of devices for a specified time period.
Avg ICA RTT (ms)
The average ICA round trip time over the specified time period. The ICA round trip is the time intervalmeasured at the client between the first step (user action) and the last step (graphical response isdisplayed ), as calculated by the session experience monitoring service. The ICA round trip metric can bebest thought of as a measurement of the "screen lag" that a user experiences while interacting with anapplication hosted in a session on a Presentation Server.
Avg Input (KB/sec)
A measure of ICA client traffic from an ICA Client to a Presentation Server.
Avg Input Bandwidth Used (Kbps)
The average input bandwidth used over the specified time period, expressed as kilobits per second. Inputbandwidth used is the actual bandwidth consumed on the network (ICA Client to Presentation Server).(EUEM)
Avg Latency (ms)
The average ICA session latency in milliseconds. ICA session latency is based on the last recorded latencymeasured for the session (Latency - Last Recorded). The samples recorded by the agent are consolidatedto one hour intervals in the data uploaded to the server.
Avg Login Time (sec)
Login time is the time between the start of a session and the end of the last process created as part ofthe login operation for that session.
Avg Memory Usage (%)
The average percentage of total memory used over the specified time period. See Memory Usage %.
Avg MP Duration (ms)
The average time, in milliseconds, taken to execute a monitoring point. Monitoring points are createdusing EdgeSight Active Application Monitoring, and can be a single instruction or a folder containingmultiple instructions that measure application availability or response time.
Avg Network RTT (ms)
The average network round trip time (RTT) is based on network latency. Network latency is the detectednetwork latency between the ICA client device and the Citrix Presentation Server. Unlike the ICA roundtrip metric, the network round trip is largely independent of processing time on the client or server.
Avg Output (KB/sec)
A measure of ICA client traffic from a Presentation Server to an ICA Client.
Document generated by Confluence on Nov 07, 2013 16:21 Page 234
Avg Output Bandwidth Used (Kbps)
The average output bandwidth used over the specified time period, expressed as kilobits per second.Output bandwidth used is the actual bandwidth consumed on the network (Presentation Server to ICAClient). (EUEM)
Avg Page Faults/sec
The average number of page faults per second for In capturing page faults, both hard and soft pagefaults are counted (with hard page faults, data must be read from disk; with soft page faults, data isfound in physical memory but must be rearranged). Page faults can occur if the virtual memory systembecomes unstable due to a shortage of physical memory (RAM) or a shortage of free disk space.
Avg Pages Per Second
The average pages per second read from or written to disk over the specified time period. See Pages perSecond.
Avg Process Count
The average number of processes running on a device for a specified time period.
Avg RTT (ms)
The average round trip time. Round trip time (RTT) is a measure of network response. Citrix EdgeSightAgents measures the round-trip time passively during a network connection creation. Whenever a TCP/IP socket connection is made, the agent records the RTT for that socket connection to the server. RTT cansometimes be measured to be zero.
Avg Running Time
The average running time for an application over the specified time period. See Running Time.
Avg Server Startup Duration (ms) or Avg SSD
The average time spent on the Presentation Server performing the entire start-up operation. In the eventof an application starting in a shared session, this metric is expected to be much smaller, as startinga completely new session involves potentially high cost tasks such as profile loading and login scriptexecution.
Avg Test Duration (ms)
The average time, in milliseconds, taken to execute a test. Tests are created using EdgeSight ActiveApplication Monitoring and can include one or more scripts that measure application availability orresponse time.
Avg Thread Count
The average thread count over the specified time period. See Thread Count.
Avg Total Active Sessions
The average number of total active sessions for a group of devices over a specified time period.
Avg Total Inactive Sessions
The average number of total inactive sessions for a group of devices over a specified time period.
Document generated by Confluence on Nov 07, 2013 16:21 Page 235
Avg Total Sessions
The average number of total sessions for a group of devices over a specified time period.
Back to top
B
BUCC
Backup URL Client Count. The number of backup URL retries before success. Note that this is the onlyclient start-up metric that is a count of attempts, rather than a duration. (EUEM)
C
Capacity (GB)
The total disk capacity in gigabytes (GB) for a device. This is used in calculating the percentage of freedisk space.
CASD
Credentials Authentication Server Duration. The time (ms) spent on the server authenticating the usercredentials. (EUEM)
Category
A classification for applications or processes based on their type or function, such as email programs orspyware programs.
CFDCD
Configuration File Download Client Duration. The time (ms) it takes to get the configuration file from theXML server. (EUEM)
Client Address
The IP address of a device connecting to a Presentation Server.
Client Delay (ms)
To calculate client delay (ClientPercent), we first calculate the amount of time between successive readsof data coming from the server. This is the amount of time taken by the client to read and process thebuffers that make up a server response.
Client Name
The name of a device connecting to a Presentation Server.
Client Time
In alert reports, the time that an alert condition occurred on the device running an EdgeSight Agent (notto be confused with a client device connecting to a Presentation Server). If the device where the alertcondition occurred and the server are in different time zones, the time is converted to the time zone ofthe server.
Client Type
The type of client connecting to a Presentation Server, such as ICA Win32 or RDP.
Document generated by Confluence on Nov 07, 2013 16:21 Page 236
Client Version
The version of the executable file for a client connecting to a Presentation Server. This data may not bedisplayed for all client types. For example, a version is displayed for ICA Win32 clients, but not for RDPclients.
COCD
Credentials Obtention Client Duration. The time (ms) it takes to get the user credentials. Note that COCDis only measured when credentials are entered manually by the user. (EUEM)
Connections
The number of connections made to a Presentation Server by a type of client for the specified timeperiod.
CONSD
Credentials Obtention Network Server Duration. The time (ms) spent by the server performing networkoperations to obtain credentials for the user. This only applies to an SSPI login (a form of pass-throughauthentication where the client device is a member of the same domain as the server and Kerberostickets are passed in place of manually entered credentials). (EUEM)
Console
The number of sessions using the console connection.
Context Switches / sec
Context Switches/sec is the combined rate at which all processors on the computer are switched from onethread to another. Context switches occur when a running thread voluntarily relinquishes the processor,is preempted by a higher priority ready thread, or switches between user-mode and privileged (kernel)mode to use an Executive or subsystem service. It is the sum of ThreadContext Switches/sec for all threads running on all processors in the computer and is measured innumbers of switches. There are context switch counters on the System and Thread objects. This counterdisplays the difference between the values observed in the last two samples, divided by the duration ofthe sample interval.
COSD
Credentials Obtention Server Duration. The time (ms) taken for the server to obtain the user credentials.This is only likely to be a significant amount of time if manual login is being used and the server-sidecredentials dialog is displayed (or if a legal notice is displayed before login commences). (EUEM)
CPU (%)
The average percent CPU usage over the specified time period. If a machine has more than oneprocessor, the counter value for each processor is totaled, and the resulting value is divided by thenumber of processors. A separate value is not attributed to a specific processor. The same calculationmethod is used for hyperthreaded processors. For example, if a machine has dual, hyperthreadedprocessors, the total metric is divided by four.
CPU Time
The cumulative CPU usage time over the specified time period.
Document generated by Confluence on Nov 07, 2013 16:21 Page 237
CPU Utilization Management
Indicates whether the CPU Utilization Management feature is enabled or disabled. This is a feature ofPresentation Server 4.0 designed to give each user a fair share of the CPU by modifying the normal jobpriority scheduling in the operating system. CPU time will be allocated fairly across all users on the server.It normalizes the CPU usage of each user by smoothing out the normal CPU peaks that most applicationshave. It will limit very CPU-intensive applications to a fair-share of the CPU, so that one user does notinadvertently have an inappropriate adverse affect on the other users. This enables administrators toeasily calculate how many users can fit on a machine at once and hence how many machines must bepurchased.
Current Service State
The current state of the IMA service: Machine Boot, Service Started, Service Stopped, Service StoppedUnexpectedly, Machine Shutdown, Machine Shutdown Unexpectedly, or Unknown state.
Back to top
D
Date
The date on which the associated data was collected. Note that dates and times in historical reports areexpressed relative to the time zone of the EdgeSight server.
Device
A system hosting an EdgeSight agent. This can be a Presentation Server of an endpoint system.
DMSD
Drive Mapping Server Duration. The time (ms) spent on the server mapping the users' client drives,devices, and ports. (EUEM)
Drive Input (bps)
The bandwidth, measured in bps, used when performing file operations between the client and serverdrives during an ICA session.
Drive Output (bps)
The bandwidth, measured in bps, used when performing file operations between the client and serverdrives during an ICA session.
Duration - session
The total elapsed time for a session.
Duration (ms)
In the Application Response Time for a Test report, the total elapsed time to execute an EdgeSight ActiveApplication Monitoring test.
Back to top

Document generated by Confluence on Nov 07, 2013 16:21 Page 238
E
End Time
The time that a user's Presentation Server session was terminated.
Errors - process
The number of errors detected for a process. This can be reported relative to a process, a device, ora user. EdgeSight determines a message box to be a notification of a process error if the messagebox contains an error icon or the text of the message box contains one or more of the following errorkeywords: error, unable, fail*, unsuccessful, unexpected, bad, fault, invalid, illegal, denied, not valid,exception, or memory. Process errors fall into the following categories:
• File---Problems such as an invalid file or folder name, or a media error.• Login & Authorization---Problems such as a logon failure due to an invalid username or password.• Security---Problems such as a failure to access files or services due to not having been granted the
required permissions or not having been assigned the required role.• Printer---Problems such as a failure to access a printer or queue a file for printing.• Data---Problems such as a failure to read or write data due to syntax, connectivity, or resource
issues.• Database---Problems such as an error when selecting, inserting, or updating data due to syntax or
database connectivity issues.• Connecting & Downloading---Problems such as the loss of a network connection or a download
failure due to resource or network constraints.• Uncategorized---Problems that can not be categorized based on keywords contained in the error
message.
Errors - Web
The number of Web errors detected. Web errors include both transaction errors and Winsock errors.
Event ID
An event number used to identify the specific event.
Event Type
The classification of the event by the operating system, such as Error, Warning, information, SuccessAudit, or Failure Audit.
Back to top
F
Faults
The number of faults (crashes) detected for a process. This can be reported relative to a process, adevice, or a user. You can view crash reports and dump files (Crash Details, XML Report, Mini Dump, orCrash CAB), if available. When displaying process faults in a report, click the information icon to displayfault report details. Note that in some cases, crash conditions prevent the collection of data.
Filename
The name of the executable file for a process.
First Seen - process or site
The date on which the process or site was first detected by an EdgeSight Agent. To avoid over reportingnew processes, there is a lag time of several days after EdgeSight Server and Agents are installed before
Document generated by Confluence on Nov 07, 2013 16:21 Page 239
processes are reported as new. This allows baseline data to be established for applications alreadyinstalled on managed systems. This ensures that the information displayed reflects applications that aretruly new to your enterprise.
Free Space (GB)
The amount of free space on a disk in gigabytes.
Back to top
H
Highest Memory Usage (%)
The highest percentage of memory used on a device during the specified time period.
Host
A system hosting a Web site. In some cases, host and site are used interchangeably.
Back to top
I
ICA (Independent Computing Architecture)
The architecture that Presentation Server uses to separate an application's logic from its user interface.With ICA, only the keystrokes, mouse clicks, and screen updates pass between the client and server onthe network, while 100% of the application's logic executes on the server.
ICA Session Compression Input (%)
The compression ratio used from client to server for a session.
ICA Session Compression Output (%)
The compression ratio used from server to client for a session.
ICA Session Line Input (bps)
The line speed, measured in bps, used from client to server for a session.
ICA Session Line Output (bps)
The line speed, measured in bps, used from server to client for a session.
IFDCD
ICA File Download Duration. The time (ms) it takes the client to download the ICA file from the webserver for Program Neighborhood Agent or Web Interface. (EUEM)
IMA (Independent Management Architecture)
A server-to-server infrastructure that provides robust, secure, and scalable tools for managing any sizeserver farm. Among other features, IMA enables centralized platform-independent management, anODBC-compliant data store, and management products that plug into a management console.
Document generated by Confluence on Nov 07, 2013 16:21 Page 240
Interrupts/sec
Interrupts per second is the average rate, in incidents per second, at which the processor received andserviced hardware interrupts. It does not include deferred procedure calls (DPCs), which are countedseparately. This value is an indirect indicator of the activity of devices that generate interrupts, such asthe system clock, the mouse, disk drivers, data communication lines, network interface cards, and otherperipheral devices. These devices normally interrupt the processor when they have completed a taskor require attention. Normal thread execution is suspended. The system clock typically interrupts theprocessor every 10 milliseconds, creating a background of interrupt activity. This counter displays thedifference between the values observed in the last two samples, divided by the duration of the sampleinterval.
Back to top
L
Last Alert
The date and time that the most recent alert was received by the server.
Last Change
The date and time that the last asset change (addition, property change, or removal) occurred on adevice.
Last Visited - sites
The date and time that a Web site was last accessed by a user.
Launcher
The name of the EdgeSight Active Application Monitoring launcher from which tests were run.
Login Time (sec) {LoginTime]
Login time is the time between the start of a session and the end of the last process created as partof the login operation for that session. The login time metric is computed on the Presentation Servermachine where the agent is running.
Logins
The number of separate Presentation Server logins by a user over a specified time period.
LPWD
Launch Page Web Server Duration. The time (ms) it takes to process the launch page (launch.aspx) onthe Web Interface server. (EUEM)
LSESD
Login Script Execution Server Duration. The time (ms) spent on the server running the users' loginscript(s). (EUEM)
Back to top
Document generated by Confluence on Nov 07, 2013 16:21 Page 241
M
Manufacturer
The company which made a hardware asset which was the source of an alert condition. This is analogousto vendor for software assets.
Max Queue Length
The maximum thread queue length for the specified time period. Thread queue length indicates how longa particular thread is waiting for instructions to be performed. A high thread queue length may be causedby an underpowered machine.
Max ICA RTT (ms)
The greatest single ICA round trip time during the specified time period. The ICA round trip is the timeinterval measured at the client between the first step (user action) and the last step (graphical responseis displayed ), as calculated by the session experience monitoring service. The ICA round trip metric canbe best thought of as a measurement of the "screen lag" that a user experiences while interacting with anapplication hosted in a session on a Presentation Server. (EUEM)
Max MP Duration (ms)
The maximum time, in milliseconds, taken to execute a monitoring point. Monitoring points are createdusing EdgeSight Active Application Monitoring, and can be a single instruction or a folder containingmultiple instructions that measure application availability or response time.
Max Network RTT (ms)
The maximum network round trip time (RTT) is based on network latency. Network latency is thedetected network latency between the ICA client device and the Citrix Presentation Server. Unlike the ICAround trip metric, the Network round trip is largely independent of processing time on the client or server.(EUEM)
Max Queue Length
The greatest number of threads in the queue during the specified time period. Thread queue lengthindicates how long a particular thread is waiting for instructions to be performed. A high thread queuelength may be caused by an underpowered machine.
Max RTT (ms)
The maximum round trip time in milliseconds. Round trip time (RTT) is a measure of network response.Citrix EdgeSight Agents measures the round-trip time passively during a network connection creation.Whenever a TCP/IP socket connection is made, the agent records the RTT for that socket connection tothe server. RTT can sometimes be measured to be zero.
Max Test Duration (ms)
The maximum time, in milliseconds, taken to execute a test. Tests are created using EdgeSight ActiveApplication Monitoring and can include one or more scripts that measure application availability orresponse time.
Memory Usage (%)
% Committed Bytes, which is the ratio of MemoryCommitted Bytes to the MemoryCommit Limit. Committed memory is the physical memory in use for which space has been reservedin the paging file should it need to be written to disk. The commit limit is determined by the size of
Document generated by Confluence on Nov 07, 2013 16:21 Page 242
the paging file. If the paging file is enlarged, the commit limit increases, and the ratio is reduced. Thiscounter displays the current percentage value only; it is not an average.
The percent of committed bytes is used as the metric for monitoring memory usage because it mostaccurately reflects the system-wide memory consumption on the machine.
As memory usage increases, so does the % Committed Bytes value. If a static memory consumptionvalue, like Committed Bytes, was used, it would not be possible to determine the memory load onthe machine as well as the total available memory. % Committed Bytes takes both used and availablememory into account.
The metric is also valuable for device comparison purposes. A percentage is normalized from one machineto the next but a static memory consumption value is not. For example:
Machine A---------
Committed Bytes: 746MBCommit Limit: 2461MB% Committed Bytes: 30.3%
Machine B---------
Committed Bytes: 587MBCommit Limit: 843MB% Committed Bytes: 69.6%
It is possible to tell from % Committed Bytes alone that Machine B has a high memory load and MachineA does not. However, by looking at Committed Bytes, it is only possible to tell is that Machine A is usingmore memory than Machine B. There is no insight into the load on the machine.
Min MP Duration (ms)
The minimum time, in milliseconds, taken to execute a monitoring point. Monitoring points are createdusing EdgeSight Active Application Monitoring, and can be a single instruction or a folder containingmultiple instructions that measure application availability or response time.
Min Test Duration (ms)
The minimum time, in milliseconds, taken to execute a test. Tests are created using EdgeSight ActiveApplication Monitoring and can include one or more scripts that measure application availability orresponse time.
Monitoring Point
An instruction or group of instructions within an EdgeSight Active Application Monitoring script which isused to measure application availability or response time.
MP's Failed
The number of monitoring points which failed during the time period selected. Monitoring points arecreated using EdgeSight Active Application Monitoring, and can be a single instruction or a foldercontaining multiple instructions that measure application availability or response time.
MP's Passed
The number of monitoring points which passed during the time period selected. Monitoring pointsare created using EdgeSight Active Application Monitoring, and can be a single instruction or a foldercontaining multiple instructions that measure application availability or response time.
Back to top
Document generated by Confluence on Nov 07, 2013 16:21 Page 243
N
Network Delay (ms)
Network delay is the network round-trip time plus the time it takes the server to respond to thetransaction request. Network delay is measured passively on the client by monitoring the sends andreceives between a client and a server.
On the initial connection of a socket, the round-trip time (RTT) to the first level server for that connectionis recorded. Then, on a sampled basis (or when the socket is closed), the number of round trips(NumRoundTrips) is estimated based on the amount of sent and received data for the socket. The delayfor the current transaction (TransDelay) is also recorded. A transaction is defined as a request followed bya response. The delay is detected at the Winsock level.
In order to maintain the efficiency of the Citrix EdgeSight Agent, network delay is ignored when verysmall network payloads occur. This is consistent with the goal of providing an accurate assessment ofend-user network performance.
NRCD
Name Resolution Client Duration. The time (ms) it takes the XML service to resolve the name of apublished application to an IP Address. This metric is only collected for new sessions, and only if the ICAfile does not specify a connection to a Presentation Server with the IP address already provided. (EUEM)
NRWD
Name Resolution Web Server Duration. The time (ms) it takes the XML service to resolve the name of apublished application to a presentation server address. This metric is collected when the application islaunched via the Program Neighborhood Agent or Web Interface. (EUEM)
Back to top
P
Pages per Second
Pages per second. Pages/sec is the rate at which pages are read from or written to disk to resolve hardpage faults. This counter is a primary indicator of the kinds of faults that cause system-wide delays. It isthe sum of MemoryPages Input/sec and MemoryPages Output/sec. It is counted in numbers of pages, so it can be compared to other counts of pages,such as MemoryPage Faults/sec, without conversion. It includes pages retrieved to satisfy faults in the file system cache(usually requested by applications) non-cached mapped memory files.
PCSD
Printer Creation Server Duration. The time (ms) spent on the server synchronously mapping the users'client printers. If the configuration is set such that this printer creation is performed asynchronously, thenno value is recorded as it does not affect the completion of the session startup. (EUEM)
Peak Concurrent or Peak Concurrent Sessions
The most sessions (active and inactive) at any given time during the specified time period.
Peak CPU (%)
The highest percentage of CPU used by a device during the specified time period.See CPU(%).
Document generated by Confluence on Nov 07, 2013 16:21 Page 244
Peak CPU % User
The user associated with the session accounting for the peak CPU usage, as displayed in Peak CPU (%).
Peak Input (KB/sec)
A measure of ICA client traffic from an ICA Client to a Presentation Server.
Peak Input Bandwidth Used (Kbps)
The greatest single input bandwidth used data sample, expressed as kilobits per second. Input bandwidthused is the actual bandwidth consumed on the network (ICA Client to Presentation Server). This metric iscalculated by the session experience monitoring service.
Peak Latency (ms)
The highest measured ICA session latency in milliseconds for a time period. ICA session latency is basedon the last recorded latency measured for the session (Latency - Last Recorded). The samples recordedby the agent are consolidated to one hour intervals in the data uploaded to the server.
Peak Login Time (sec)
The highest recorded login time for a selected time period. Login time is the time between the start of asession and the end of the last process created as part of the login operation for that session. The logintime metric is computed on the Presentation Server machine where the agent is running.
Peak Output (KB/sec)
A measure of ICA client traffic from the Presentation Server to an ICA Client.
Peak Output Bandwidth Used (Kbps)
The greatest single output bandwidth used data sample, expressed as kilobits per second. Outputbandwidth used is the actual bandwidth consumed on the network (Presentation Server to ICA Client).
Percent Free
The percentage of total space on a disk which is free.
Percent Memory
The percentage of available memory used on a device over a specified time period.
Percent of All Connections
The percentage of all connections made to a Presentation Server that were made by a specific client typeover the specified time period.
Physical Memory (MB)
The amount of physical memory (in megabytes) installed on a device.
PLSD
Profile Load Server Duration. The time (ms) spent on the server loading the users' profile. (EUEM)

Document generated by Confluence on Nov 07, 2013 16:21 Page 245
PNCOSD
Program Neighborhood Credentials Obtention Server Duration. The time (ms) taken for the serverto cause the Program Neighborhood instance running on the client (PN Classic) to obtain the usercredentials. This credentials dialog is displayed and managed by the client side, but the duration ismeasured on the server. (EUEM)
Port
The port, identified by port number, for a Web site.
PPS
See Pages per second.
Printer Input (bps)
The bandwidth, measured in bps, used when printing to a client printer through a client that has printspooler support enabled.
Printer Output (bps)
The bandwidth, measured in bps, used when printing to a client printer through a client that has printspooler support enabled.
Private Kbytes (or Private KB)
The current size, in bytes, of memory that this process has allocated (ProcessPrivate Bytes). Private bytes cannot be shared with other processes.
Privileged Time %
Privileged Time % is the percentage of elapsed time that the process threads spent executing code inprivileged mode. Windows system services often runs in privileged mode to gain access to system-privatedata. Such data is protected from access by threads executing in user mode. Calls to the system can beexplicit or implicit, such as page faults or interrupts. Windows uses process boundaries for subsystemprotection in addition user and privileged modes.
Proc Count
In CPU reports, the number of processors on a device.
Process
The name of the specific process being reported on.
Process Count
The number of processes run on the device over the specified time period.
Process Ended
The date and time that a process within a session ended.
Process Faults
The number of process faults encountered during the specified time period. See Faults.
Document generated by Confluence on Nov 07, 2013 16:21 Page 246
Processor Speed
In CPU reports, a range of processor speeds (expressed in gigahertz), such as 1 GHz to 2Ghz. In detailareas, processor speed is shown in megahertz (MHz) for individual devices.
Process Started
The date and time that a process within a session started.
Property
In asset reports, the WMI property associated with an asset change. See Asset for more information.
Published Application
The name under which an application is published on a Presentation Server. If this field is blank, thisindicates that the application is not a published application.
Back to top
R
RDP
The number of sessions using RDP (Remote Desktop Protocol). RDP is an input/output presentationprotocol from Microsoft that controls keyboard, mouse, and screen formatting between clients andservers in a thin client environment.
Reboots
The number of system reboots detected during the specified time period, including both expected andunexpected reboots. An expected or user-initiated reboot is one occurring under software control as aresult of a user action. For example, a user initiated reboot occurs when applying a service pack requiringa reboot, or shutting down the system from the shutdown menu or the task manager. An unknown orunexpected reboot is defined as one that did not occur under software control. For example, pressingthe reset button, unplugging the computer, or turning off power are all examples of unexpected reboots.Unexpected reboots may indicate an end user response to system problems.
RECD
Reconnect Enumeration Client Duration. The time (ms) it takes a client to get a list of reconnections.(EUEM)
Received (KB) - volume
Network volume is the total number of kilobytes received from a server as measured passively from theclients.
Request
The part of a web transaction that specifies the type of content exchanged, such as text/html.
REWD
Reconnect Enumeration Web Server Duration. The time (ms) it takes the Web Interface to get the list ofreconnections from the XML service. (EUEM)
Document generated by Confluence on Nov 07, 2013 16:21 Page 247
Running Time
Running time is the actual amount of time that a program is running in memory, regardless of whetherthe user is using the application. Citrix EdgeSight Agents track application usage to calculate how long anapplication is actively used and how long it is run, and to collect usage counts for license tracking.
Back to top
S
SCSD
Session Creation Server Duration. The time (ms) spent on the server creating the session. The durationstarts when the ICA client connection has been opened and ends when authentication begins. This shouldnot be confused with the overall Session Startup Server duration. (EUEM)
Sent (KB) - volume
Network volume is the total number of kilobytes sent from a server as measured passively from theclients.
Server Delay (ms)
Server delay (ServerPercent) is derived from Network and Client Delay. The server delay value representsthe delay beyond the first level server, which could contain multiple tiers of delay.
Server Time
The time that an event occurred or was received by the server. The time is displayed relative to the timezone of the server. Note that clients (devices running the EdgeSight Agent) and the associated servermay be in different time zones.
Session Duration
The total elapsed time that a session was active.
Session Ended
The date and time that a Presentation Server session was ended.
Session Started
The date and time that a Presentation Server session was started.
Sessions
The number of Presentation Server sessions started over a specified time period.
Sessions Created
The total number of Presentation Server sessions created during a specified time period.
Site
A Web site, identified by an IP address or host name.
Document generated by Confluence on Nov 07, 2013 16:21 Page 248
Source
The system entity causing the alert condition, such as an application, process, web site, or systemservice.
SpeedScreen Input (bps)
The bandwidth, measured in bps, used from client to server for data channel traffic.
SpeedScreen Output (bps)
The bandwidth, measured in bps, used from server to client for data channel traffic.
SSSD
Session Startup Server Duration. This is the high level server connection startup metric. This includesthe time (ms) spent on the Presentation Server performing the entire start-up operation. In the eventof an application starting in a shared session, this metric is expected to be much smaller, as startinga completely new session involves potentially high cost tasks such as profile loading and login scriptexecution. (EUEM)
Started or Start Time
The time that a user's Presentation Server session was started.
Status
In the Application Response Time for a Test report, the pass/fail status of an EdgeSight Active ApplicationMonitoring test.
System Calls/sec
System Calls/sec is the combined rate of calls to operating system service routines by all processesrunning on the computer. These routines perform all of the basic scheduling and synchronization ofactivities on the computer, and provide access to non-graphic devices, memory management, and namespace management. This counter displays the difference between the values observed in the last twosamples, divided by the duration of the sample interval.
Back to top
T
Test
The name of an EdgeSight Active Application Monitoring test.
Test Start Time
The time that an EdgeSight Active Application Monitoring test was started. A test can include one or morescripts.
Tests Failed
The number of tests which failed during the time period selected. Tests are created using EdgeSightActive Application Monitoring and can include one or more scripts.
Document generated by Confluence on Nov 07, 2013 16:21 Page 249
Tests Passed
The number of tests which passed during the time period selected. Tests are created using EdgeSightActive Application Monitoring and can include one or more scripts.
Thread Count
The number of threads currently active in a process (ProcessThread Count).
Total CPU (%)
The percentage of total CPU time used by a session or process over the specified time period. See CPU(%).
Total Delay (ms)
The total network delay over a specified time period. See Network Delay (ms).
Total KB - volume
See Volume (KB)
Total Sessions
The total number of sessions (active and inactive) during the specified time period.
Total Volume (KB)
See Volume (KB).
Transaction
A network transaction, defined by a site, transaction, request, and type. Citrix EdgeSight Agents passivelymeasure the delay and round trip time at the HTTP component level, such as javascript, text, and htmlget requests, for a host/page request from a device.
Type
In asset reports, the type of asset change that occurred, such as added, changed, or removed.
In web transaction reports, the type of action being performed, such as GET or POST.
Back to top
U
Unique Users
The number of unique users (defined by domain and user name) of a process.
User
An individual logged on to a monitored device and identified by a domain and username.
User Time %
User Time% is the percentage of elapsed time the processor spends in the user mode. User mode is arestricted processing mode designed for applications, environment subsystems, and integral subsystems
Document generated by Confluence on Nov 07, 2013 16:21 Page 250
(privileged mode is designed for operating system components and allows direct access to hardware andall memory). The operating system switches application threads to privileged mode to access operatingsystem services. This counter displays the average busy time as a percentage of the sample time.
Back to top
V
Version
The version number of a process or application.
Video Frame Input (bps)
The bandwidth from client to server traffic on a virtual channel. Measured in bps.
Video Frame Output (bps)
The bandwidth from server to client traffic on a virtual channel. Measured in bps.
Virtual Kbytes (or Virtual KB)
The current size, in kilobytes, of the virtual address space used by the selected process (ProcessVirtual Bytes). This metric is useful for diagnosing memory leaks, which can cause either a steadyincrease or a sharp spike in virtual byte usage.
Volume (KB)
Network volume is the total number of kilobytes sent and received from a server as measured passivelyfrom the clients.
W
Web Errors
Web errors include both transaction errors and Winsock errors.
Working Set (KB)
The shared and private kilobytes allocated to a process (ProcessWorking Set). The working set represents the actual amount of physical memory used by a process.
Back to top
Document generated by Confluence on Nov 07, 2013 16:21 Page 251
Configuring EdgeSight for Your Environment
This page last changed on Apr 29, 2010 by ronaldb.
After EdgeSight is installed, the person doing the installation uses the Post-Installation Wizard to explicitlyspecify critical operating parameters for EdgeSight Server:
• an initial (or root) company• a Superuser account that can access all companies on a server and can create new users• email settings used to send server notifications• a port used to communicate with the license server.
In addition to these setting, there are many default settings which enable EdgeSight to be fullyoperational as quickly as possible. See the Citrix EdgeSight Administrator's Guide for more informationabout configuring EdgeSight.
• Configuring Alerts• Data Maintenance
Document generated by Confluence on Nov 07, 2013 16:21 Page 252
Configuring Alerts
This page last changed on Apr 27, 2010 by ronaldb.
This is a stub article and may be combined with another article or expanded.
Document generated by Confluence on Nov 07, 2013 16:21 Page 253
Data Maintenance
This page last changed on Apr 29, 2010 by ronaldb.
Overview
Data maintenance starts with proactive planning and preparation around database storage requirementsand maintenance procedures. These are essential to ensuring the right set of data can be retrievedquickly and efficiently. Influencing factors around database sizing and grooming include:
• What data to I need to keep (current and archive)?• How long is historical data retained?• What applications will I be monitoring/measuring?• How many endpoints and/or servers are monitored/measured?• How long do I want to keep alerts and network performance statistics?• Are there regulatory or
other factors driving data retention requirements?
As each environment is unique in its size, complexity and monitoring methodology, performing a proof ofconcept with EdgeSight for XenApp helps establish a baseline database size based ona company's definedrequirements. Evaluating these results, in conjunction with the number of monitored nodes, monitoringrequirements, and planned/unplanned growth will assist in determining the appropriate amount ofspace required by the EdgeSight database. Depending on the number of end-user systems, applications,and network activity, databases can grow quickly without proper management. In addition to standarddatabase maintenance guidelines for Microsoft SQL Server, EdgeSight addresses growing databases withdatabase grooming features and data archiving techniques:
• Grooming is the process of removing older data from a database at regular intervals to make roomfor new data. Grooming is critical for maintaining efficient database operation. An effective groomingschedule controls database size and helps ensure acceptable performance while retaining sufficientdata for business operations. Additional information on database grooming in EdgeSight is availablein the Citrix EdgeSight Administrator's Guide and http://support.citrix.com/article/ctx111021 onhow to properly configure and manage this feature.
• Archiving is housing data required for long-term use, such as trend analysis, compliancedocumentation, and capacity planning. Data should be warehoused in preference to relaxing thegrooming configuration. Archiving ensures that required data is available for long-termreportingwithout compromising the performance of Citrix EdgeSight in day-to-day operations. Additionalinformation on data warehousing and archiving concepts with EdgeSight 4.5 canbe found in theCitrix EdgeSight User's Guide.
Configuring Data Uploading
You can select what types of performance and availability data you want to upload to the server (ServerConfiguration > Data Maintenance > Upload Configuration). This allows you to optimize EdgeSightServer performance by limiting data uploads to reflect the data you actually use.
The uploading of XenApp Environmental Usage data is disabled by default, and should only be enabled ifyou plan to use the Environmental Usage report, which displays this data. Depending on the number ofsessions for the group or device, the data used to generate these reports can significantly increase thesize of your EdgeSight database. In many cases, you may want to enable data collection for a period oftime as required and then disable data collection when no longer needed. In the past, one of the reasonsfor using this report was that it contained some Publaished Applications data. As of EdgeSight 5.3, thereare a number of new reports which track the usage of Published Applications.
Document generated by Confluence on Nov 07, 2013 16:21 Page 254
Custom Reports
This page last changed on Apr 29, 2010 by ronaldb.
From time to time, EdgeSight engineers or EdgeSight users develop custom reports. This page is a placeto share new reports with the EdgeSight community. Reports are stored and delivered as RDL (ReportDefinition Language) files. Note that these custom reports have not gone through the same qualityassurance process as have the standard EdgeSight reports.
To upload a custom report, click on the link for the report and save the RDL file. Then open the EdgeSightServer Console and navigate to Configure > My Settings > Custom Reports. Click Upload a Reportand follow the instructions provided in online help.
Available Custom Reports
• Citrix Service Provider - License Usage Reports• Citrix Service Provider - Resource Usage per User Reports• Citrix Service Provider - Server Utilization Report• Citrix Service Provider - SLA Compliance Reports• License Server Usage Trends - Custom Report• Unique User Logon Counts - Custom Report
Comments
Hi there.
Is it possible to include custom reports for Edgesight for Netscaler? I noticed that these reports are forEdgesight for Xenapp / Presentation Servers.
Thanks.
Posted by fquijano at Oct 03, 2011......................................................................................................................................................................
Hello
I am looking for a report how shows the maximum of CCU Users for a department and a certain period(month).
The XenApp performance report has a subreport which does what I want. Is there anyone who can tellme how to schedule just that sub-report
Report Name="subreport_ctrx_active_sessions_byday_line">
Regards
Reinhard
Posted by rtravni42 at Apr 13, 2012......................................................................................................................................................................
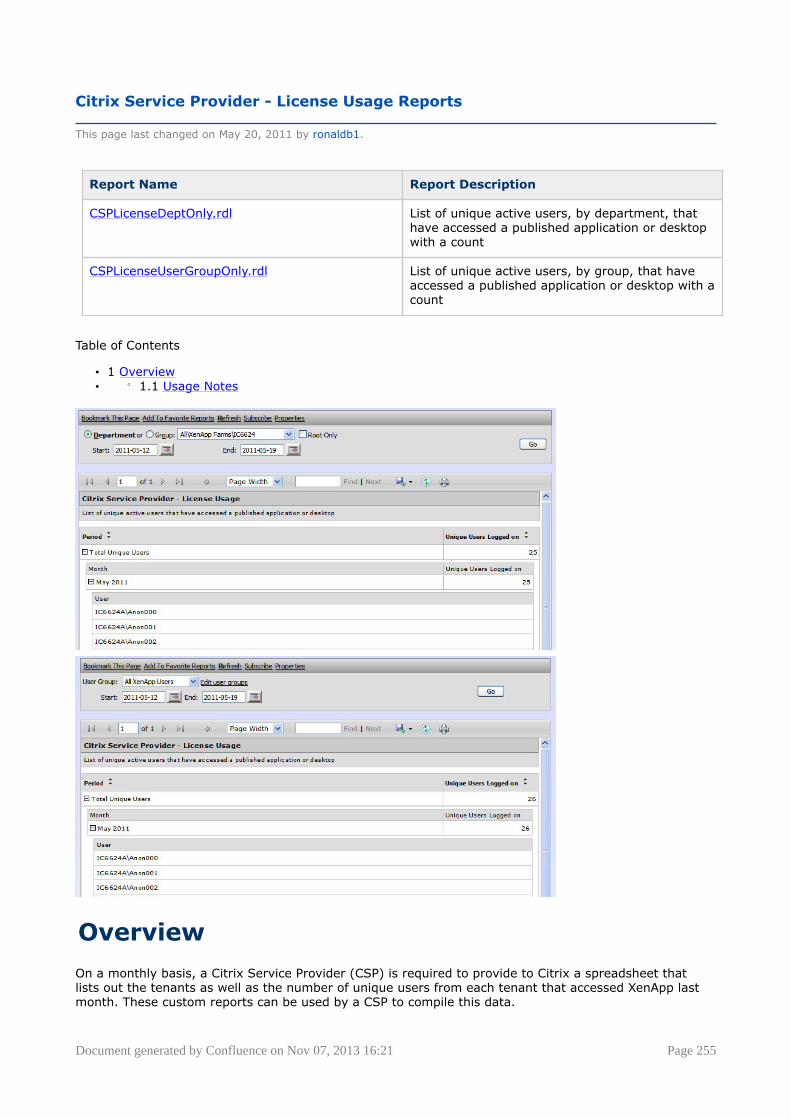
Document generated by Confluence on Nov 07, 2013 16:21 Page 255
Citrix Service Provider - License Usage Reports
This page last changed on May 20, 2011 by ronaldb1.
Report Name Report Description
CSPLicenseDeptOnly.rdl List of unique active users, by department, thathave accessed a published application or desktopwith a count
CSPLicenseUserGroupOnly.rdl List of unique active users, by group, that haveaccessed a published application or desktop with acount
Table of Contents
• 1 Overview• ° 1.1 Usage Notes
Overview
On a monthly basis, a Citrix Service Provider (CSP) is required to provide to Citrix a spreadsheet thatlists out the tenants as well as the number of unique users from each tenant that accessed XenApp lastmonth. These custom reports can be used by a CSP to compile this data.
Document generated by Confluence on Nov 07, 2013 16:21 Page 256
Usage Notes
1. Two reports are provided, one in which users are filtered by department and one in which they arefiltered by user group. Select the report to use based on your reporting requirements.
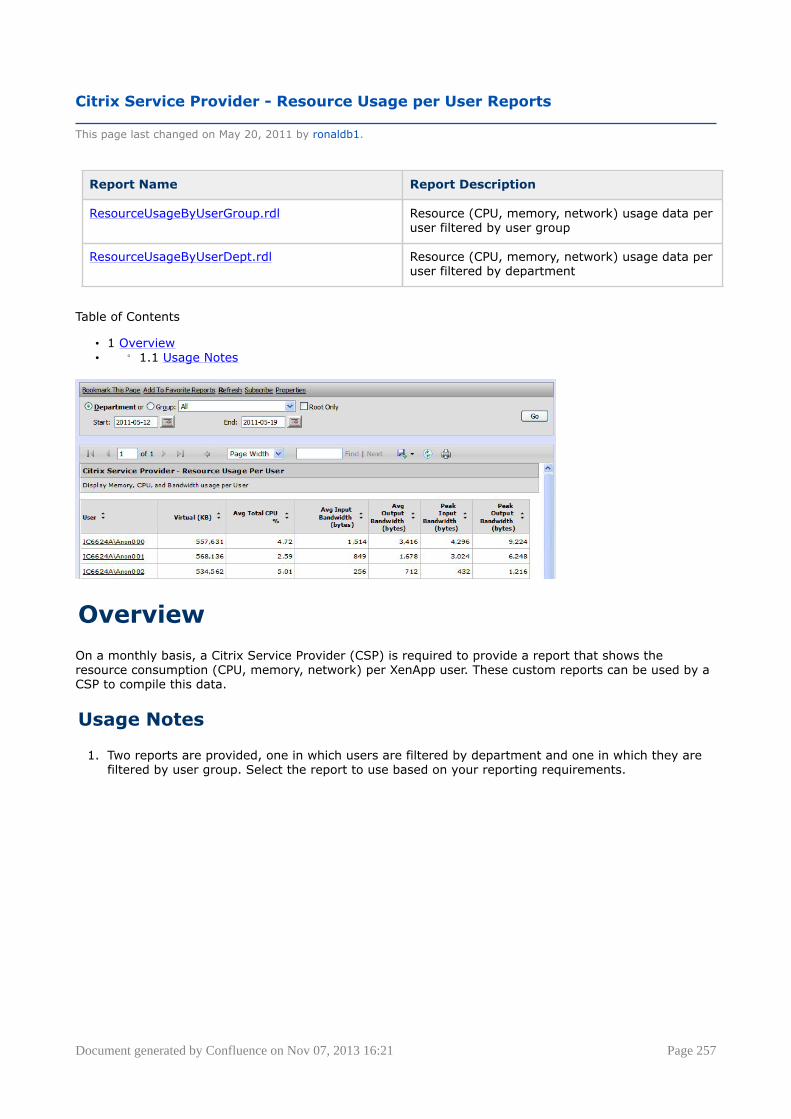
Document generated by Confluence on Nov 07, 2013 16:21 Page 257
Citrix Service Provider - Resource Usage per User Reports
This page last changed on May 20, 2011 by ronaldb1.
Report Name Report Description
ResourceUsageByUserGroup.rdl Resource (CPU, memory, network) usage data peruser filtered by user group
ResourceUsageByUserDept.rdl Resource (CPU, memory, network) usage data peruser filtered by department
Table of Contents
• 1 Overview• ° 1.1 Usage Notes
Overview
On a monthly basis, a Citrix Service Provider (CSP) is required to provide a report that shows theresource consumption (CPU, memory, network) per XenApp user. These custom reports can be used by aCSP to compile this data.
Usage Notes
1. Two reports are provided, one in which users are filtered by department and one in which they arefiltered by user group. Select the report to use based on your reporting requirements.
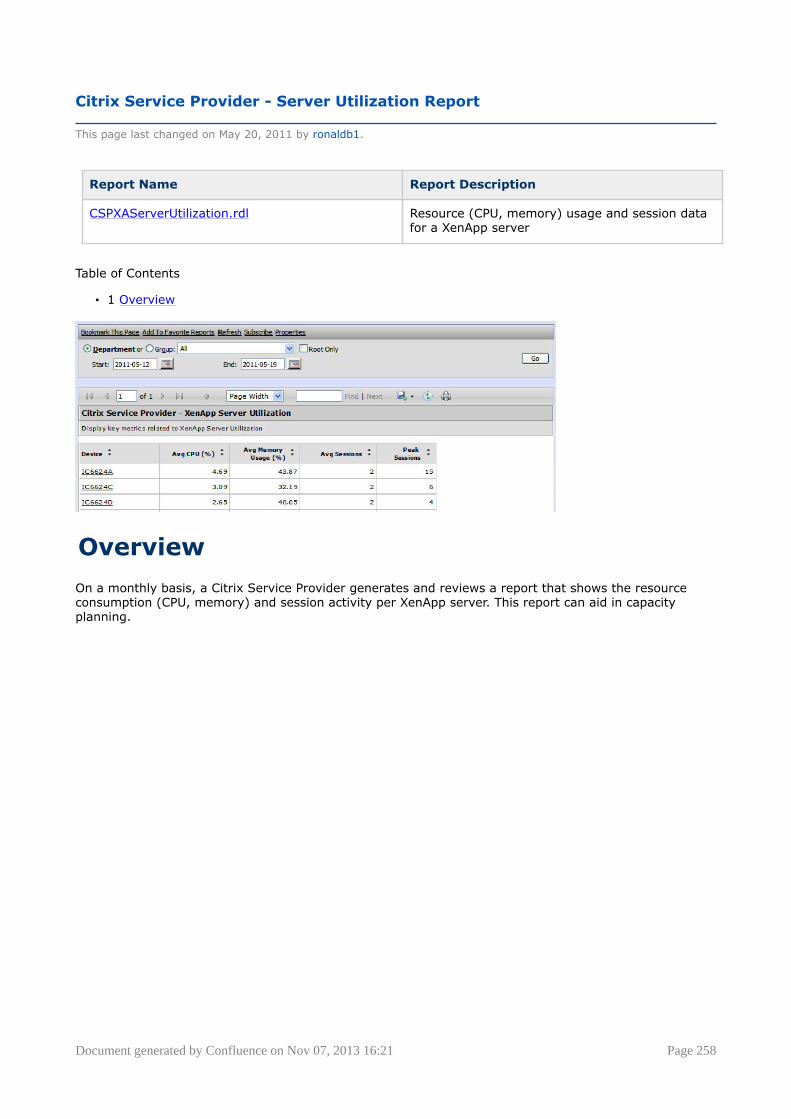
Document generated by Confluence on Nov 07, 2013 16:21 Page 258
Citrix Service Provider - Server Utilization Report
This page last changed on May 20, 2011 by ronaldb1.
Report Name Report Description
CSPXAServerUtilization.rdl Resource (CPU, memory) usage and session datafor a XenApp server
Table of Contents
• 1 Overview
Overview
On a monthly basis, a Citrix Service Provider generates and reviews a report that shows the resourceconsumption (CPU, memory) and session activity per XenApp server. This report can aid in capacityplanning.
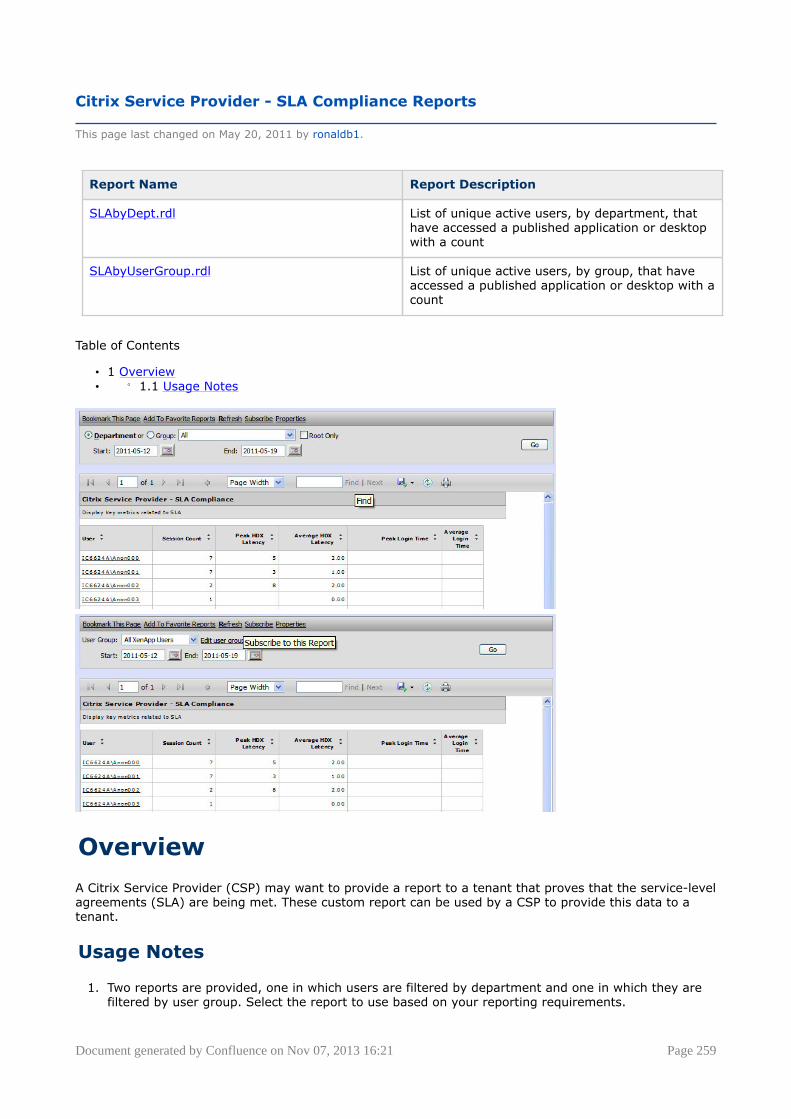
Document generated by Confluence on Nov 07, 2013 16:21 Page 259
Citrix Service Provider - SLA Compliance Reports
This page last changed on May 20, 2011 by ronaldb1.
Report Name Report Description
SLAbyDept.rdl List of unique active users, by department, thathave accessed a published application or desktopwith a count
SLAbyUserGroup.rdl List of unique active users, by group, that haveaccessed a published application or desktop with acount
Table of Contents
• 1 Overview• ° 1.1 Usage Notes
Overview
A Citrix Service Provider (CSP) may want to provide a report to a tenant that proves that the service-levelagreements (SLA) are being met. These custom report can be used by a CSP to provide this data to atenant.
Usage Notes
1. Two reports are provided, one in which users are filtered by department and one in which they arefiltered by user group. Select the report to use based on your reporting requirements.
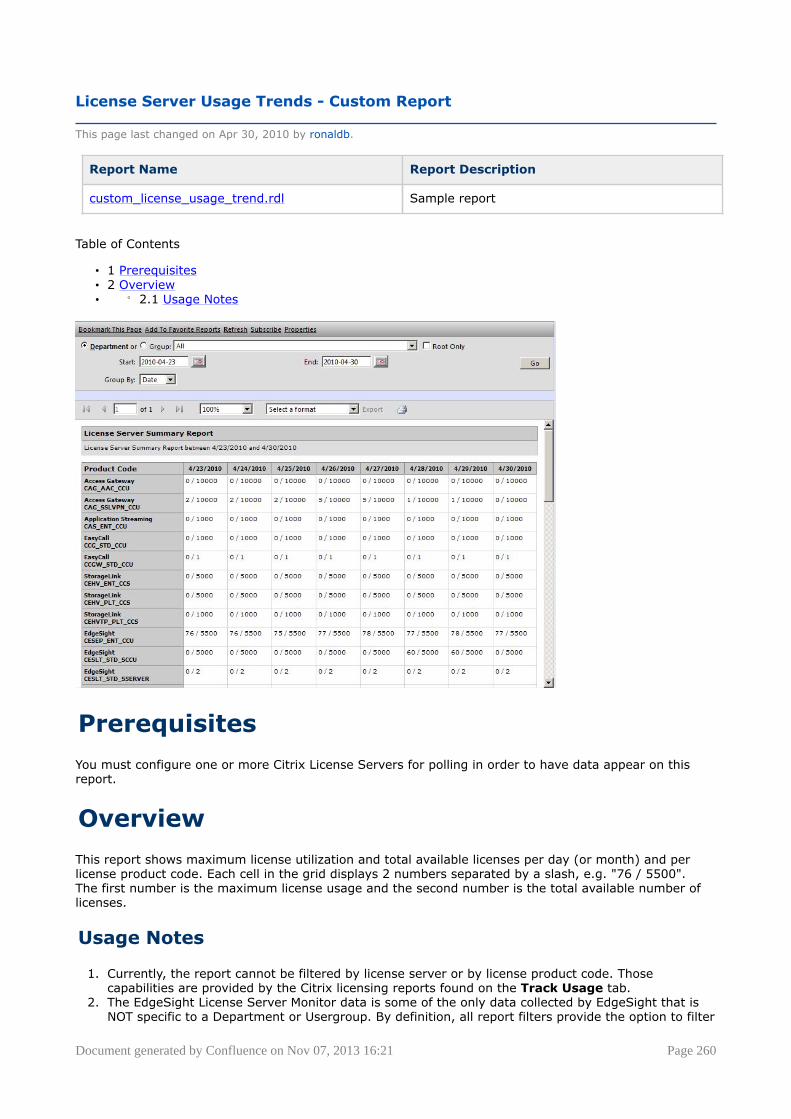
Document generated by Confluence on Nov 07, 2013 16:21 Page 260
License Server Usage Trends - Custom Report
This page last changed on Apr 30, 2010 by ronaldb.
Report Name Report Description
custom_license_usage_trend.rdl Sample report
Table of Contents
• 1 Prerequisites• 2 Overview• ° 2.1 Usage Notes
Prerequisites
You must configure one or more Citrix License Servers for polling in order to have data appear on thisreport.
Overview
This report shows maximum license utilization and total available licenses per day (or month) and perlicense product code. Each cell in the grid displays 2 numbers separated by a slash, e.g. "76 / 5500".The first number is the maximum license usage and the second number is the total available number oflicenses.
Usage Notes
1. Currently, the report cannot be filtered by license server or by license product code. Thosecapabilities are provided by the Citrix licensing reports found on the Track Usage tab.
2. The EdgeSight License Server Monitor data is some of the only data collected by EdgeSight that isNOT specific to a Department or Usergroup. By definition, all report filters provide the option to filter
Document generated by Confluence on Nov 07, 2013 16:21 Page 261
by Department or Usergroup, but in the case of this report, selecting a Department or Usergroupwill have no effect on the data displayed.
3. Each license product code is grouped by the Citrix product name (e.g. Access Gateway, EasyCall,EdgeSight, XenApp, etc.) There can be multiple license product codes per Citrix product. In a fewcases for newer product codes, EdgeSight cannot determine the Citrix product for a particularlicense product code; in those cases, the license product code is listed twice.
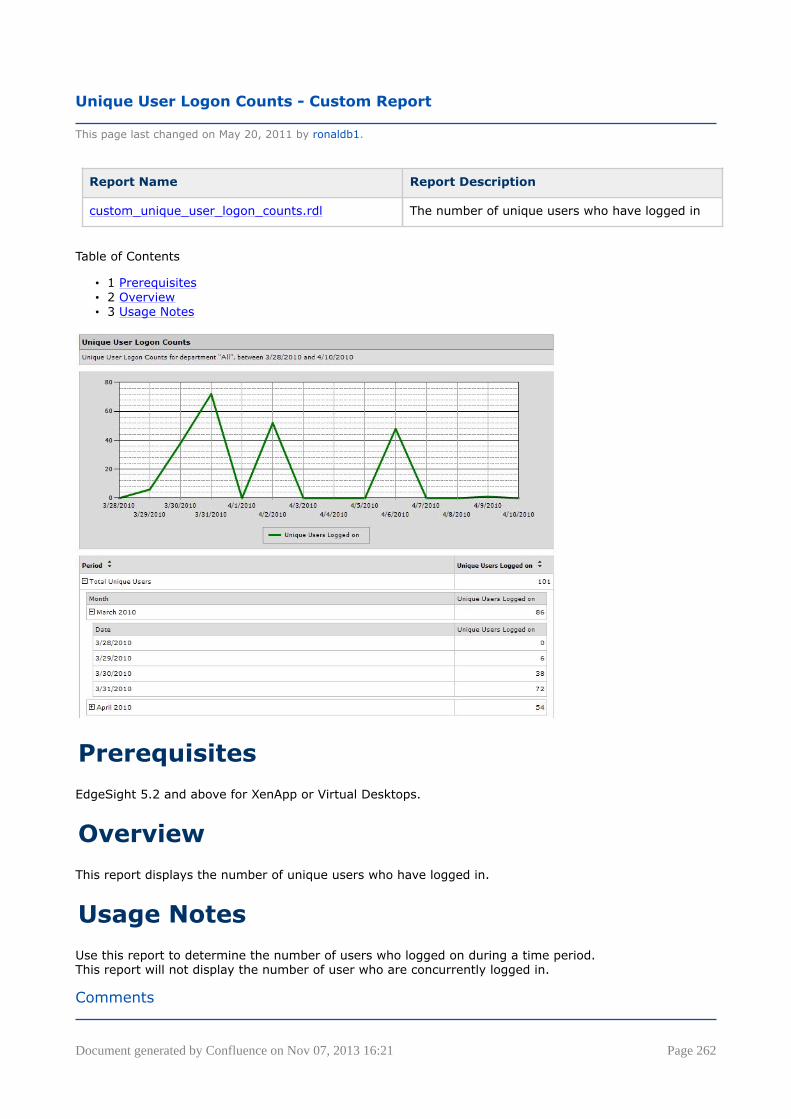
Document generated by Confluence on Nov 07, 2013 16:21 Page 262
Unique User Logon Counts - Custom Report
This page last changed on May 20, 2011 by ronaldb1.
Report Name Report Description
custom_unique_user_logon_counts.rdl The number of unique users who have logged in
Table of Contents
• 1 Prerequisites• 2 Overview• 3 Usage Notes
Prerequisites
EdgeSight 5.2 and above for XenApp or Virtual Desktops.
Overview
This report displays the number of unique users who have logged in.
Usage Notes
Use this report to determine the number of users who logged on during a time period.This report will not display the number of user who are concurrently logged in.
Comments
Document generated by Confluence on Nov 07, 2013 16:21 Page 263
More Custom reports please ... or even better, a guide showing how to take a SQL query and make acustom report out of it!
Posted by at Aug 10, 2010......................................................................................................................................................................
This report is great although it would be even better if it also reported who the unique users were. Isthere any way that this can be added to the report?
Posted by at Nov 01, 2010......................................................................................................................................................................
EdgeSight 5.3 when importing the above report an Error saving file. An error occurred while parsingEntityName. Line 923, position 11063. Can you help with this ? Many Thanks
Posted by at Jun 02, 2011......................................................................................................................................................................
Are you using EdgeSight 5.3? We can try the import here. Also, we'll take a look at the syntax of the linein question. Thanks!
Posted by ronaldb1 at Jun 02, 2011......................................................................................................................................................................
I have saved the report and imported it to an EdgeSight 5/3 server successfully. Could you detail thesteps you used? Thanks.
Posted by ronaldb1 at Jun 02, 2011......................................................................................................................................................................
Hi Ronald, can you please give the step by step process of saving this file and importing into EdgeSight5.3 Many thanks
Posted by at Jun 22, 2011......................................................................................................................................................................
Sure thing! Here's what I do:
1. Right click on the file name and select Save Target As... from the context menu.
2. Save the file, making sure the extension is RDL.
3. Open the EdgeSight Console and click on the Configure tab.
4. Go to My Settings > Custom Report and click on Upload Report. The Upload Custom Report page isdisplayed.
5. Browse to the saved RDL file, supply a name (required) and click Upload. The report will be listed onthe Custom Reports page and on the Browse tab.
The browser initially tried to treat the file as XML rather than RDL - I reapplied the Content Type to theattachment and that seemed to force the browser to recognize it as RDL.
Posted by ronaldb1 at Jun 22, 2011......................................................................................................................................................................
Thanks Ronald that works a treat.!! Also is there a simalar report that can be produced to show the sameinformation as this report but for session counts and not unique users? I want to keep your format andlayout, Many Thanks for your help.
Posted by at Jun 23, 2011......................................................................................................................................................................
It looks like the closest thing would be the standard Session Counts report (average active, inactive,and total session counts.) It goes down to an hourly granularity. For XenApp and XenDesktop, since thedepartment structure mirrors the farm structure, you can filter by department to show sessions for thewhole farm down to specific servers.
Posted by ronaldb1 at Jun 23, 2011......................................................................................................................................................................
Document generated by Confluence on Nov 07, 2013 16:21 Page 264
Hi Ronald, I have used the standard report but it does not give me a total month figure like your reportdoes, I can see it has the same structure but not the total total it only shows daily totals
Can you help ?
Many Thanks
Posted by at Jun 23, 2011......................................................................................................................................................................
I was able to import the custom report and run it, but what do I enter for all of the parameters?LocaleCode, XA_VDA_Device, ParamLabels, CompID, etc...
Posted by at Nov 14, 2011......................................................................................................................................................................
Report runs well for me on ES 5.4. I too would like to know which tables/views this data is coming from. I want to ensure that my grooming configuration does not drop this data off prematurely.
Thanks,
Chris Woosley
Posted by chriswoosley at Jan 11, 2012......................................................................................................................................................................
Document generated by Confluence on Nov 07, 2013 16:21 Page 265
EdgeSight for Load Testing
This page last changed on Apr 27, 2010 by ronaldb.
This is a stub article and may be combined with another article or expanded.
Table of Contents
• 1 Overview• 2 Releases• ° 2.1 EdgeSight for Load Testing 3.5
Overview
This article provides a brief overview of EdgeSight for Load Testing. EdgeSight for Load Testing isan automated load and performance testing solution for Citrix XenApp and Presentation Serverenvironments. The product extends the application performance visibility that Citrix EdgeSight forXenApp provides by introducing pre-production application performance tools. EdgeSight for Load Testingcomponents include a controller and launchers.
The Controller is used to record and create virtual user scripts and define tests. When the test is ready forplayback, the Controller instructs the Launchers to run the test with a certain number of virtual users fora certain period of time. The Launchers receive the commands from the Controller and generate virtualuser ICA sessions on the target XenApp or Presentation Servers. The number of Launchers required willvary based on the target virtual user load.
The Launchers then report session information back to the Controller for run-time and post run-timeanalysis. This load generating software solution enables administrators to predict how systems will copewith high levels of user load. By simulating hundreds of virtual users and monitoring the responsivenessof the system under test, it allows the administrator to determine how the current configuration andhardware infrastructure will support anticipated demand.
Releases
<description of release>
EdgeSight for Load Testing 3.5
<summary>
This video discusses the new features in EdgeSight for Load Testing 3.5.
Document generated by Confluence on Nov 07, 2013 16:21 Page 266
Case Studies
This page last changed on Oct 27, 2009 by sarahv.
• Case Study, Managing Application Rollout• Case Study, Application Performance Solution• Case Study, Troubleshooting Remote Applications

Document generated by Confluence on Nov 07, 2013 16:21 Page 267
Case Study, Managing Application Rollout
This page last changed on Oct 27, 2009 by sarahv.
This article provides a case study of how EdgeSight can help manage application deployment.
Table of Contents
• 1 Background• 2 Application Rollout Scenario• 3 Displaying Current and Prior Resource Usage• 4 Displaying Prior and Current Alerts
Background
During deployment of new applications, a project manager needs to progress carefully. It is neveradvisable to simply deploy the application to all desktops without proper testing. It should be a phasedapproach that includes testing, pilot deployment, partial production deployment and then full deployment.Throughout each phase, the systems should be monitored for stability and performance, ensuring thatthe eventual full deployment does not have a negative impact on either user productivity or on thecorporate network.
Traditionally, monitoring performance and stability during pilot phases has been a manual process ofcommunicating with pilot users who report on any perceived issues. In responding to these issues, theproject manager may have someone visit the desk and run monitoring tools on that specific system. Thisprocess does not provide optimal data and can leave the picture incomplete.
EdgeSight provides the capability of evaluating performance and stability across a group of machinesover a given period of time. The following scenario demonstrates how EdgeSight can be used to analyzea specific set of machines that are the pilot for a new application. Performance and stability can beevaluated before, during, and after the deployment of the application, allowing you to make an informeddecision about the impact on the environment.
Application Rollout Scenario
John is the project manager for the deployment of a new Line of Business (LOB) application. In alaboratory situation, he tested the application on corporate Windows Vista machines and has seen thatthe application behaves well with other corporate applications. It is now time to deploy the applicationto a group of 50 pilot users who constitute a representative sample of the company's job functions. Thegoal is to ensure that the application does not adversely affect system performance or stability during thecourse of a regular work day.{}John plan is to perform the following tasks:
• From a central location, monitor the CPU and memory of the pilot machines after deployment of thenew application
° Compare this performance to what it was before the deployment• From a central location, monitor the stability of the pilot machines after the deployment of the new
application° Compare this stability to what it was before the deployment
*Gather specific error messages or other data related to instability in order to solve the issues.
• EdgeSight collects all the data that John is planning to use in his evaluation. The historicalperformance and stability metrics are already there for his pilot machines and EdgeSight willcontinue to gather this data throughout the duration of the pilot. John now needs to organize thedata and generate the right reports to meet his needs.
Start by creating a custom group that contains all of the machines in the pilot. This can be done by eithercreating a query based group that automatically places any machine with the LOB application installedinto the group, or by manually adding the machine names to the group. See the Groups topic in onlinehelp or see the Citrix EdgeSight Administrator's Guide for more information on creating custom groups ofdevices.
Document generated by Confluence on Nov 07, 2013 16:21 Page 268
Note You will require the Manage Public Device Groups permission in order to create a new group or editan existing group. Using the System Memory Summary report, show average memory usage for thegroup before the deployment of the application and then again to show average memory usage for thetime period after deployment.
• Using the System CPU Summary report, show average CPU usage for the group before thedeployment of the application and then again to show average CPU usage for the time period afterdeployment.
• Using the Alerts report, show alerts generated from the group during a time period beforedeployment and then again for the time period after deployment.
Displaying Current and Prior Resource Usage
Once the custom group has been created, he next step is to display the average CPU and memory usagefor the group before and after the deployment. To do so, run the System CPU and the System MemoryUsage reports against the pilot group. A few key points:
• In the report, select a date range that starts and ends before deployment of the new application.• Group the report data by Date and display the top 50 devices.
The results categorize machines by their capacity: processor speed or physical memory, depending on thereport.
Displaying Prior and Current Alerts
In order to gauge the stability of the application, you can display alerts generated by the group beforeand after deployment. Run an Alerts report against the pilot group. A few key points:
• In the report, select a date range that starts and ends before deployment of the new application.• Group the report data by Date and display the top 50 devices. The results show the alert count for
each machine in the group for the given date.• Expand the date to display alert counts by device.
You can expand the device to view actual alert messages and times.
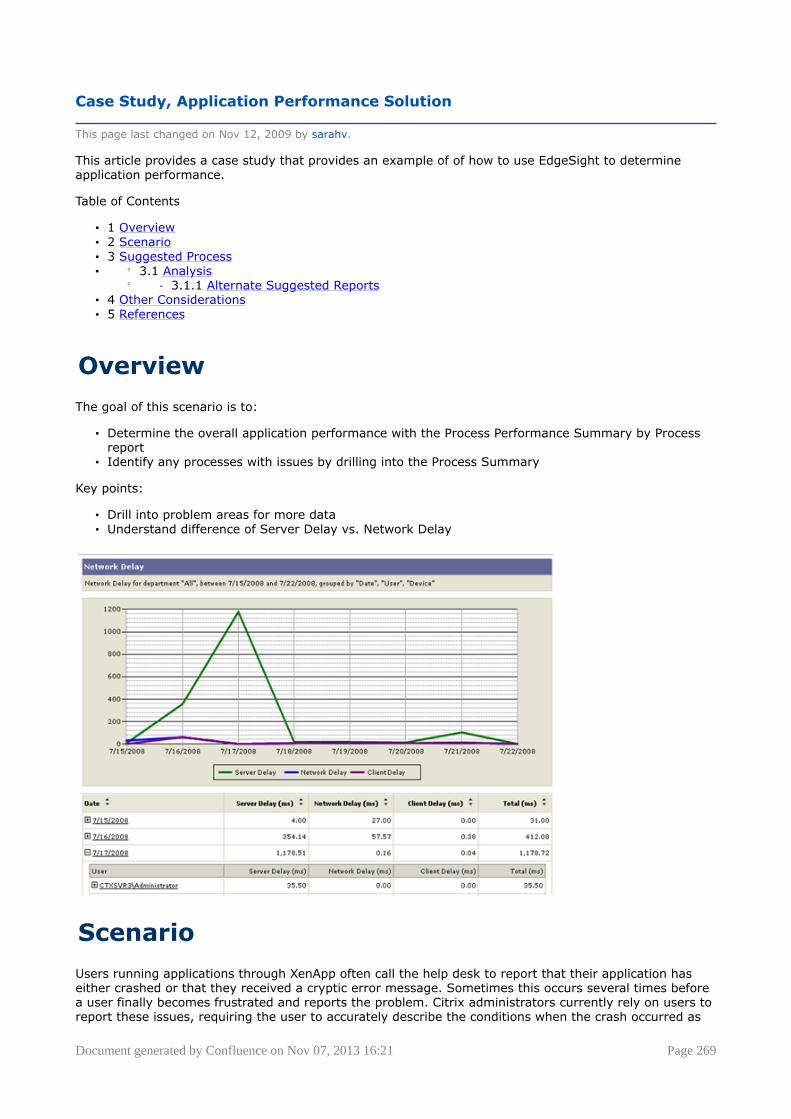
Document generated by Confluence on Nov 07, 2013 16:21 Page 269
Case Study, Application Performance Solution
This page last changed on Nov 12, 2009 by sarahv.
This article provides a case study that provides an example of of how to use EdgeSight to determineapplication performance.
Table of Contents
• 1 Overview• 2 Scenario• 3 Suggested Process• ° 3.1 Analysis
° - 3.1.1 Alternate Suggested Reports• 4 Other Considerations• 5 References
Overview
The goal of this scenario is to:
• Determine the overall application performance with the Process Performance Summary by Processreport
• Identify any processes with issues by drilling into the Process Summary
Key points:
• Drill into problem areas for more data• Understand difference of Server Delay vs. Network Delay
Scenario
Users running applications through XenApp often call the help desk to report that their application haseither crashed or that they received a cryptic error message. Sometimes this occurs several times beforea user finally becomes frustrated and reports the problem. Citrix administrators currently rely on users toreport these issues, requiring the user to accurately describe the conditions when the crash occurred as
Document generated by Confluence on Nov 07, 2013 16:21 Page 270
well as the complete error message. In addition, administrators are often charged with trying to re-createthis error or crash so they can forward the appropriate information to either a developer or a vendor.Because the EdgeSight Agent is always running on XenApp servers, it creates a standard mini-dumpfile for any published application that crashes, whether the application was developed in-house or by athird party. These mini-dump files contain a complete set of information that an application developercan use to investigate the issue. For an application error, the complete error text is captured along withthe exact time it occurred. As a result, administrators no longer need users to report these issues orhope they can re-create an application issue in an environment where EdgeSight has been deployed.In many organizations, there is often one person in charge or supporting an application. It is possibleto indentify a particular process and get a performance summary for a particular application. EdgeSightprovides reports that tell people "how is application X performing last week." It is also possible to set upa subscription so the report is emailed to an application analyst or group of administrators on a weekly orbi-weekly basis.
Suggested Process
To get an overall view of application performance, you can use the Process Performance Summary byProcess to get a quick look at which applications are consuming the most resources in the farm. If yousee a spike on specific day, then drill down to see if this is a one-time occurrence or if it is indicative of aproblem.
Analysis
Understanding the network metrics EdgeSight provides is a key concept and something that can quicklyindicate where a problem might be. In the screenshot above we see a large amount of server delay.Server delay is the amount of network delay that is caused by waiting for the server or back endapplication to respond to our requests. For example, the spike might have been caused that day by aback-end server going down or an unusual number of users accessing the application. By looking at thisreport, it is possible to tell that it is not a network problem because the network portion of the delay isreally small. If there was a large value here, it would be possible to deduce that the connection from theXenApp server to the application had some issues. For example, maybe the server and the streaming fileshare are in different data centers and there was latency over the connection.
1
Alternate Suggested Reports
• Process Faults (for a process, by day)• Process Errors (by day)• Most Process Faults for a Group by Process• Most Process Errors for a Group by Process
Other Considerations
The unique alerting functionality of EdgeSight can be used to notify administrators in real time when anevent described above has occurred, such as alert errors driven by exact error messages. These alertscan trigger email notifications or be sent to third-party consoles that accept Simple Network ManagementProtocol (SNMP) traps.
References
Document generated by Confluence on Nov 07, 2013 16:21 Page 271
Case Study, Troubleshooting Remote Applications
This page last changed on Nov 12, 2009 by sarahv.
A health-care provider in Alaska asked Citrix Consulting to determine why a particular Web applicationhad slow performance. This is the process consulting used to troubleshoot the problem.
A team of two consultants arrived on site: one specializing in XenApp and one specializing in EdgeSight.Their project objectives were as follows:
• Install and Configure EdgeSight• Leverage EdgeSight to assist in determining the root cause of issues• Investigate unsatisfactory performance of ProvPort application
The EdgeSight consultant started his investigation by running the Presentation ServerSummary report on the host server to see a high-level overview of the system, including the processcount, processor usage, percentage of committed bytes in use, and average the number of activesessions. The application issue did not appear to be stemming from poor server health. The report did notreveal any factors that would cause the server to be in poor health.
The consultant then ran the Transaction Delay report on the server. But this proved to be anotherdead-end. Overall, there was nothing that stood out in terms of network delays, client delays, or serverdelays. The consultant also ran the Web Errors by Transaction per Day report. While this revealedsome 404 errors, it did not have enough to cause significant performance delays. To confirm this, he ranthe Non 404 Web Transaction Errors report, which also revealed some errors but nothing significant.
The consultant began to suspect that the issue might be specific to the users. To confirm his suspicions,the consultant ran the User Summary for a User Group report. He looked at the report to see whichusers had the highest session latency (for example, over 3000 ms of latency). The consultant looked fortwo things:
(1) To see if the users whose sessions had the high latency always had high latency
(2) What users were not affected (that is, what do the users with the high latency have in common?). Dothese users have session latency that is consistently low (for example, 150 to 200 ms)?
According to the consultant, some of the key questions he asks himself when isolating a problem are,Does the issue always happen or is it just a one time event? What do the users having the problem havein common? How are these users different from other users (for example, location, usage time, level ofactivity, or tasks/features used)? Consequently, when he looked at the session-latency report, he askedhimself what these users shared.
It turned out that these users were accessing the application from remote areas of Alaska that only hadhigh-speed satellite Internet service. As a result, there was little the consultant could do to improveperformance other than make sure the XenApp policy that applied to the user's connection was set toWAN optimization and optimized for the best performance over slow connections.
Document generated by Confluence on Nov 07, 2013 16:21 Page 272
EdgeSight Support
This page last changed on Oct 27, 2009 by sarahv.
• Release History• Top EdgeSight Knowledge Center Articles
Document generated by Confluence on Nov 07, 2013 16:21 Page 273
Release History
This page last changed on Mar 31, 2010 by normanw1.
• Citrix EdgeSight 5.2 and Citrix EdgeSight for Load Testing 3.6• Citrix EdgeSight 5.3 and EdgeSight for Load Testing 3.6.1• Citrix EdgeSight 5.4
Document generated by Confluence on Nov 07, 2013 16:21 Page 274
Citrix EdgeSight 5.2 and Citrix EdgeSight for Load Testing 3.6
This page last changed on Mar 23, 2010 by normanw1.
The EdgeSight team is pleased to announce the release to web of Citrix EdgeSight 5.2 and CitrixEdgeSight for Load Testing 3.6.
Key updates include: EdgeSight 5.2 (for XenApp, Endpoints, and Virtual Desktops):
• Key integration with XenDesktop - Enables Farm-wide monitoring and troubleshooting of virtual andphysical desktops
• Support for the latest Citrix Receiver - Service Monitoring plug-in• Microsoft Systems Center Operation Manager (MS SCOM) Support - EdgeSight ships with a .mp
(management pack) connector• New summary reports - XenApp & XenDesktop• Additional Operating System support - Windows 7• Citrix Service monitoring introduction
EdgeSight for Load Testing 3.6:
• Service-based architecture - Easier to manage and does not require logged-in users for running thelaunchers
• Enhanced application security - When replaying scripts, allows for a basic level of authentication
Introduced in EdgeSight for Load Testing 3.5
• Intelligent Load Control - Ability to sense script execution & delays, and adjust accordingly• Xen Counters - Exposure of performance issues when XenApp is running on XenServer
EdgeSight for XenApp, Endpoints and Virtual Desktops AND EdgeSight for Load Testing are available inthe following languages:
• English, German, French, Japanese, and Spanish
The English version of EdgeSight is now supported for use with the following Windows OS languagevariants:
• Simplified and Traditional Chinese, Korean, and Russian
Release to Web (RTW) The products are now available for customers and partners to download fromwww.MyCitrix.com.https://www.citrix.com/English/ss/downloads/results.asp?productID=25119

Document generated by Confluence on Nov 07, 2013 16:21 Page 275
Citrix EdgeSight 5.3 and EdgeSight for Load Testing 3.6.1
This page last changed on Apr 27, 2010 by ronaldb.
What's New in EdgeSight 5.3
This release includes the following new features:
• Monitoring of Citrix License Servers and reporting on license usage by product group or individualproducts. The license servers to be monitored are specified at Configure > License MonitorConfiguration > License Servers. License usage reports are available on the Track Usage tab.
• Monitoring of Published Applications and reporting on application launches and unique users.Published application reports are available on the Track Usage tab and the Browse tab.
• Monitoring of session duration by farm or user group. Session duration reports are available on theTrack Usage tab and the Browse tab.
• EdgeSight Agent support for XenApp 6.
New Reports and SQL Views
The following reports were added for this release:
• License Server Monitor Archive (XenApp)• Published Application Launch Archive (XenApp)• Published Application Launch Count - Details (XenApp)• Published Application Launch Count for a User Group - Details (XenApp)• Published Application Launch Summary (XenApp)• Published Application Launch Summary for a User Group (XenApp)• Published Application Summary (XenApp)• Published Application Summary for a User Group (XenApp)• Published Application User Count - Details (XenApp)• Published Application User Count for a User Group - Details (XenApp)• Published Application User Summary (XenApp)• Published Application User Summary for a User Group (XenApp)• Session Duration (XenApp and XenDesktop)• Session Duration for a User Group (XenApp and XenDesktop)• XenApp Server Utilization (XenApp)
What's New in EdgeSight for Load Testing3.6.1
The user interface has been translated into Simplified Chinese
Release to Web (RTW)
Release date: 11-March-2010
The products are available for customers and partners to download from www.MyCitrix.com: https://www.citrix.com/English/ss/downloads/results.asp?productID=25119
Follow-on release date: 19-April-2010
The initial release of the EdgeSight 5.3 media contained a new EdgeSight Agent, EdgeSight for XenApp 6Agent x64 5.3 (64-bit), as well as the previous 5.2 SP1 releases of the EdgeSight for XenApp, EdgeSightfor Endpoints, and EdgeSight for Virtual Desktops agents. Additional EdgeSight 5.3 agents (EdgeSight forXenApp, EdgeSight for Endpoints, and EdgeSight for Virtual Desktops) are available for download fromthe Citrix Downloads page.
Document generated by Confluence on Nov 07, 2013 16:21 Page 276
Citrix EdgeSight 5.4
This page last changed on Sep 02, 2011 by ronaldb1.
This release of the product includes the following new features:
• EdgeSight Agent support for XenApp 6.5 for Windows 2008 R2. The EdgeSight for XenApp 6.x Agentx64 5.4 is supported on both XenApp 6.0 and XenApp 6.5 for Windows 2008 R2 systems.
• Support for SQL Server Reporting Services 2008 R2.• Reporting on user/device license usage in the license trend and usage reports available on the Track
Usage tab.• The ability to export a list of user/device licenses currently checked out from a selected license
server. The User/Device License Listis available on the Track Usage tab.• The addition of advanced EdgeSight Agent properties used to throttle the number and frequency of
event log message alerts for each log type (Application, Security, and System).
Important: Note that EdgeSight Server 5.3 requires SQL Server 2005 or SQL Server 2008. If you areupgrading EdgeSight Server from a release prior to EdgeSight 5.2 using SQL Server 2000, you will alsoneed to upgrade your SQL Server installation.
Note: If you are upgrading EdgeSight Server from a release prior to EdgeSight 5.2, note that support forthe EdgeSight Virtual Desktop Agent is not enabled by default. To enable support after upgrading, openthe EdgeSight Server Console and go to Configure > Server Configuration > Settings and set EdgeSightfor XenDesktop Support to On.
New and Revised Reports and SQL Views
The User/Device License List is the only new report included in this release. There are no new SQLviews, but the vw_lsm_archive_license_statistics (License Server Monitor Archive) SQL view was revisedto remove unused fields and add fields related to user/device license data. The following fields wereremoved: license_type, grace_period, component_list, subscription_advantage, overdraft_protection,days_to_expire, and perm_license_count. The following fields were added: total_user_count andtotal_device_count. Use of the revised SQL view requires EdgeSight Server 5.4 and Citrix License Server11.9.
EdgeSight Agents Supported for Upload toEdgeSight Server
Only the following agent types and versions are supported for upload to EdgeSight Server:
• EdgeSight for Endpoints 5.2 or higher• EdgeSight for Virtual Desktops 5.2 or higher• EdgeSight for XenApp 5.2 or higher• EdgeSight for XenApp 6 Agent x64 5.3 (64-bit) running on XenApp 6.0 systems.• EdgeSight for XenApp 6.x Agent x64 5.4 (64-bit) running on either XenApp 6.0 or XenApp 6.5 for
Windows 2008 R2 systems.
Document generated by Confluence on Nov 07, 2013 16:21 Page 277
Top EdgeSight Knowledge Center Articles
This page last changed on Apr 30, 2010 by normanw1.
The EdgeSight escalation engineers would like to highlight the following articles that may be of interest:
• Improving Visibility to the User Login Experience with Citrix EdgeSight• Required Antivirus Software Configuration for the EdgeSight Server• Some Session Experience Monitoring Service Reports Do Not Contain Data for ICA Client 10.0 for
Macintosh• Case Study: Using EdgeSight 5.0 to Troubleshoot Application Enumeration• EdgeSight SQL File Groups Explained
Document generated by Confluence on Nov 07, 2013 16:21 Page 278
Using the EdgeSight Wiki
This page last changed on Oct 27, 2009 by sarahv.
• About the Citrix EdgeSight Wiki• EdgeSight Wiki Community• Getting Involved in the EdgeSight Wiki
Document generated by Confluence on Nov 07, 2013 16:21 Page 279
About the Citrix EdgeSight Wiki
This page last changed on Apr 27, 2010 by ronaldb.
Welcome to the Citrix EdgeSight Wiki. The Citrix EdgeSight Wiki is a collaborative authoring encyclopediaproject supported by Citrix EdgeSight Engineering. This is intended to be a collaborative Web site forthe EdgeSight community. This Wiki is part of an initiative to enhance the information available aboutEdgeSight reports and is the primary source of information about reports.
This Wiki focuses primarily on historical reports. However, it also includes information about real-timereports and other helpful EdgeSight product information.
The EdgeSight Engineering and Documentation teams, as well as EdgeSight escalation engineers,technical support personnel and product managers regularly review the Wiki content, vetting it fortechnical accuracy.
We are hoping that this Wiki helps you find the reports you need, interpret the reports you choose, andfind new ways to use reports. We also hope it provides an opportunity to converse with EdgeSight userswith similar interests on the discussion tabs of each article.

Document generated by Confluence on Nov 07, 2013 16:21 Page 280
EdgeSight Wiki Community
This page last changed on Dec 24, 2009 by sarahv.
• EdgeSight TV• EdgeSight Wiki Spotlight• Who Are We? EdgeSight Wiki Editors and Contributors
Document generated by Confluence on Nov 07, 2013 16:21 Page 281
EdgeSight TV
This page last changed on Apr 27, 2010 by ronaldb.
This page provides links to EdgeSight multimedia presentations and a schedule of upcoming events.
Table of Contents
• 1 What's New?• 2 Upcoming Events• 3 Videos• 4 Chats
What's New?
• EdgeSight Wiki Tour
Upcoming Events
None scheduled at this time.
Videos
• EdgeSight Wiki Tour• Introduction to EdgeSight• EdgeSight for Load Testing• EdgeSight for Load Testing (how to create a script)
Chats
Document generated by Confluence on Nov 07, 2013 16:21 Page 282
EdgeSight Wiki Spotlight
This page last changed on Dec 24, 2009 by sarahv.
• Christian Tobon

Document generated by Confluence on Nov 07, 2013 16:21 Page 283
Christian Tobon
This page last changed on Jan 04, 2010 by sarahv.
Christian was chosen as our first EdgeSight Wiki Contributor Spotlight winner because he was one ofthe first Citrix employees outside of EdgeSight engineering to make contributions to the Wiki. He alsohappened to have made the most contributions in our initial development and review period.
Q&A with Christian Tobon
How long have you worked at Citrix?
I started in June 2005, so this June will be my 5th year at Citrix.
What positions have you held?
• Tech Support Engineer I• Tech Support Engineer II• Senior Tech Support Engineer II• Escalation Engineer• Lead Escalation Engineer
What do you like about your job?
I mostly enjoy being able to work through complex environment issues, which ultimately leads to highercustomer satisfaction.
What is the most interesting thing you've learned about EdgeSight?
EdgeSight is just such a detailed product, that I cannot name just a single aspect. I think the processinception may be the most interesting piece to gather application crashes, errors and network traffic.
What hobbies do you have outside of work?
I enjoy indoor rock climbing and watching tons of movies, as well as playing video games.
Document generated by Confluence on Nov 07, 2013 16:21 Page 284
Who Are We? EdgeSight Wiki Editors and Contributors
This page last changed on Aug 05, 2011 by ronaldb1.
Citrix contributors to the EdgeSight Wiki include:
EdgeSight Engineering
• Ron Brown (editor), Senior Technical Writer (EdgeSight)• Joel Sheppherd, Manager of EdgeSight Testing• Jeffrey Klofft, Vice President of EdgeSight Engineering• Sarah Vallieres, Senior Technical Writer (XenServer and EdgeSight) - profile
EdgeSight Technical Support
• Chiu Chan, EdgeSight Escalation• Christian Tobon, EdgeSight Escalation
Other
• Steve Weizman• John Scoles
Document generated by Confluence on Nov 07, 2013 16:21 Page 285
Getting Involved in the EdgeSight Wiki
This page last changed on Apr 28, 2010 by ronaldb.
This page provides an overview of how to create EdgeSight Wiki articles.
Table of Contents
• 1 Why a Wiki?• 2 We Welcome Contributions• ° 2.1 How to Help with the Wiki• 3 Tutorial: Editing and Creating a Wiki Article• ° 3.1 Controlling Changes
° 3.2 Unacceptable or Offensive Content ° 3.3 Technical Accuracy
• 4 Wiki Syntax• 5 Stub Articles• 6 Wiki Guidelines• 7 Illustration Guidelines• ° 7.1 Warnings about Screen Captures• 8 Stewardship• 9 Wiki Style• 10 References
Why a Wiki?
After reviewing user feedback about the difficulties they had in learning to use EdgeSight, we wantedto create an environment where people could come to exchange ideas and learn. After some thought,we choose a Wiki because the software lends itself to free-form collaboration. For information about theunique qualities of this medium, see Wikipedia's section about Wiki characteristics.
Rather than stopping contributions by making it difficult to contribute or creating review bottlenecks, wedecided to create a community based on trust. We hope that users will help other users by enhancingtechniques and supplementing information.
We Welcome Contributions
The EdgeSight Reporting Wiki welcomes contributors from all members of the EdgeSight community,including customers, VARs, and internal Citrix personnel.
We are always looking for contributions that tell the EdgeSight community how you used one of ourreports. Likewise, if you have received information from Citrix Technical Support about our reports thatyou think would interest the broader community, we would appreciate you posting it.
How to Help with the Wiki
We recognize that there may be people who feel they lack the expertise to make technical or use casecontributions to EdgeSight Wiki but would like to contribute in another way. If you fall into this categoryor you are looking for easy ways to contribute, see the article, Ways You Can Help.
Tutorial: Editing and Creating a Wiki Article
Anyone with a MyCitrix account can edit Wiki articles. In fact, we encourage contributions. See Creatingan EdgeSight Wiki Article. However, because the structure of some top-level articles provides the overallTable of Contents structure to the Wiki, some of these articles have restricted permissions.
If you are a frequent contributer, to apply for permission to create or modify top-level articles, send anemail to the managing editors of the Wiki. <xxx>
Document generated by Confluence on Nov 07, 2013 16:21 Page 286
Controlling Changes
The EdgeSight Wiki is designed to make it easy to "correct mistakes, rather than making it difficult tomake them."
1
Consequently, at any given time information on the Wiki may be no more correct than the informationyou would find on a product forum. To help make it easier for you to vet content on your own, weencourage contributors to use footnotes (cite sources).
An editor in the EdgeSight Engineering team maintains all content on the EdgeSight Wiki. In practice, thisperson reviews recent changes to Wiki pages, and if possible, sends the pages to the appropriate SubjectMatter Expert on the EdgeSight engineering team for technical review. However, due to the difficulty inrecreating the customer's unique circumstances, EdgeSight engineering does not test techniques and usecases customers propose in the articles.
Ensuring the validity and significance of content helps make it easy for readers to find the informationthey need. Controlling changes helps create a Wiki envrionment that is helpful for all users.
Unacceptable or Offensive Content
Please alert the Wiki editor immediately if you find unaceptable content, including text that containswears or other unsuitable words, offensive images, and copyright violations.
Technical Accuracy
While contributions are regularly reviewed by EdgeSight Engineering, it helps other Wiki users if youinclude footnotes providing the source of the information. When articles are in an unreviewed state, thislets other Wiki users determine for themselves if the newly added content is at a sufficiently reliable.
The best way to determine if an article is technically accurate is review the changes that were made sincethe last time the article was technically reviewed. See Displaying Version History.
Wiki Syntax
For information about Wiki syntax and macros, see the main article EdgeSight Wiki Syntax.
Stub Articles
The EdgeSight Wiki contains stub articles or brief articles that are still under development.
1
You can tell an article is a stub because stubs are typically accompanied by boilerplate text indicating thearticle is a stub.We welcome contributions to stub articles. Often, stubs represent ideas or suggestions we've received buthave not had time to research. Consequently, any contributions you can make to these articles can behighly valuable to helping us start research, stimulating other contributions, and helping the EdgeSightcommunity in the interim.
Document generated by Confluence on Nov 07, 2013 16:21 Page 287
Wiki Guidelines
When contributing please be specific about the task you were trying to perform or goal you were trying toachieve, the specific reports you used, and what metrics you looked at. Any observations you have aboutwhat these metrics mean in practice in your environment are always greatly appreciated.
For information about acceptable content, see EdgeSight Wiki Editorial Policies.
Illustration Guidelines
The EdgeSight Wiki always welcomes screen captures of reports or other aspects of your environment aswell as copyright-free technical illustrations. See copyright information for further details.
.PNG and .JPEG graphics are the optimum file formats for use with the underlying Wiki software,Confluence. Please consider users with slow connection speeds and ensure file sizes are not excessivelylarge when posting graphics.
Warnings about Screen Captures
When posting screen captures to the Edgesight Wiki, be careful they do not contain information thatwould allow unscrupulous individuals to hack your organization. This information includes, but is notlimited to, real IP addresses, user names, device or workstation names, and domain names. If you posta screen capture on the Wiki, you implicitly agree, when you post it, to accept all responsibility for thepublic display of any information contained in it.
Stewardship
(Coming soon.) If you are are a frequent contributors, you can run for one of many of levels of volunteerstewardship. A combination of contribution frequency and quality of contributions can increase your level.With higher levels not only titles inidcating your level of expertise but also the ability to delete pages, lockarticles from being changed in case of vandalism or editorial disputes, and block users from editing.
Wiki Style
The EdgeSight Wiki style is primarily based on Wikipedia's style as explained in the Wikipedia:Manual ofStyle. However, it draws on Citrix's product branding guidelines and the Chicago Manual of Style. See themain article, EdgeSight Wiki Style.
References
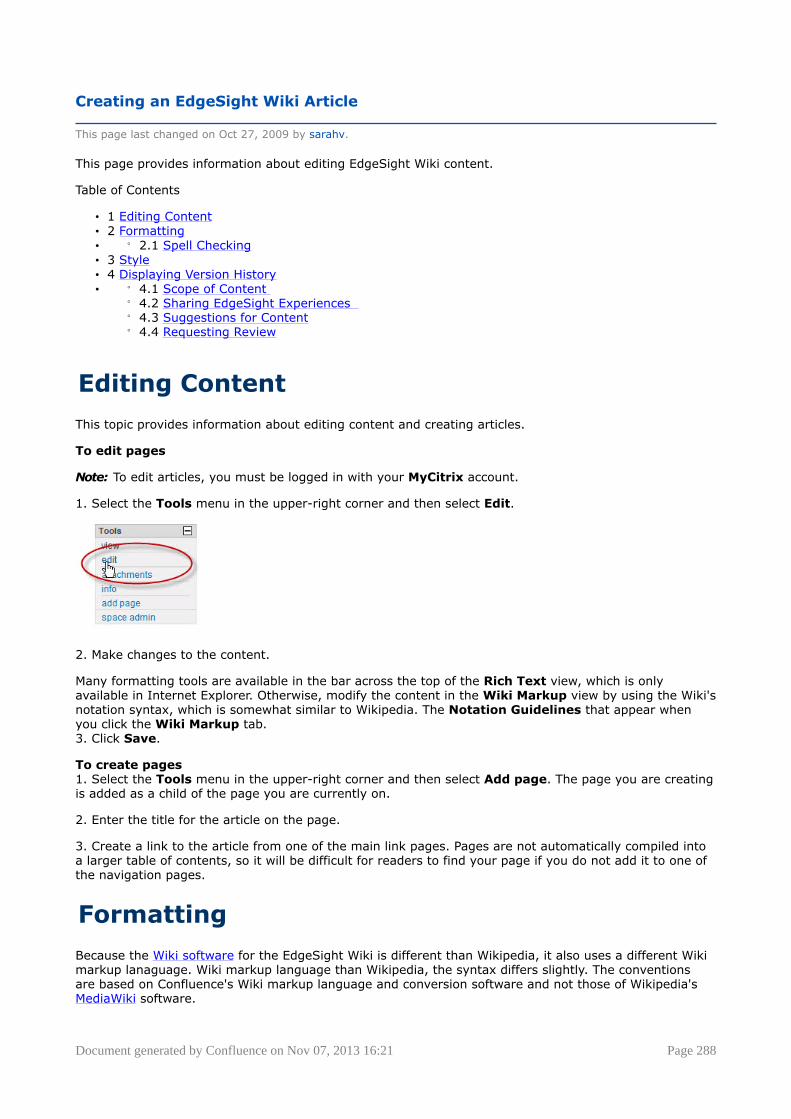
Document generated by Confluence on Nov 07, 2013 16:21 Page 288
Creating an EdgeSight Wiki Article
This page last changed on Oct 27, 2009 by sarahv.
This page provides information about editing EdgeSight Wiki content.
Table of Contents
• 1 Editing Content• 2 Formatting• ° 2.1 Spell Checking• 3 Style• 4 Displaying Version History• ° 4.1 Scope of Content
° 4.2 Sharing EdgeSight Experiences ° 4.3 Suggestions for Content° 4.4 Requesting Review
Editing Content
This topic provides information about editing content and creating articles.
To edit pages
Note: To edit articles, you must be logged in with your MyCitrix account.
1. Select the Tools menu in the upper-right corner and then select Edit.
2. Make changes to the content.
Many formatting tools are available in the bar across the top of the Rich Text view, which is onlyavailable in Internet Explorer. Otherwise, modify the content in the Wiki Markup view by using the Wiki'snotation syntax, which is somewhat similar to Wikipedia. The Notation Guidelines that appear whenyou click the Wiki Markup tab.3. Click Save.
To create pages1. Select the Tools menu in the upper-right corner and then select Add page. The page you are creatingis added as a child of the page you are currently on.
2. Enter the title for the article on the page.
3. Create a link to the article from one of the main link pages. Pages are not automatically compiled intoa larger table of contents, so it will be difficult for readers to find your page if you do not add it to one ofthe navigation pages.
Formatting
Because the Wiki software for the EdgeSight Wiki is different than Wikipedia, it also uses a different Wikimarkup lanaguage. Wiki markup language than Wikipedia, the syntax differs slightly. The conventionsare based on Confluence's Wiki markup language and conversion software and not those of Wikipedia'sMediaWiki software.

Document generated by Confluence on Nov 07, 2013 16:21 Page 289
Spell Checking
Currently, the EdgeSight Wiki functionality does not include a spell checker. To check spelling in contentyou add, we suggest using a Web browser, such as Google's Chrome, that provides this capability orcopying the content into a wordprocessing program.
Style
For information about style, see the article, EdgeSight Wiki Style.
Displaying Version History
Displaying history and determining what changes were made since the last EdgeSight Engineering reviewis one of the most effective ways to determine the validity of technical content.
To display a history of changes for an article1. From the the Tools menu, select Info. The version history appears in the right corner.
2. Expand the version history by clicking the Recent Changes link.
Scope of Content
The EdgeSight Wiki is not meant to be a replacement for the EdgeSight product documentation nor is itmeant to duplicate it.
In general, Wiki content should reference the product documentation rather than repeat it. For example,if an article refers to performing a series of tasks it should summarize the tasks the user needs toperform in the EdgeSight console rather than providing step-by-step instructions (mouse clicks) in theuser interface.
Sharing EdgeSight Experiences
One of the main purposes for creating the EdgeSight Wiki is to allow users to share their experiencesmanaging Citrix environments using EdgeSight. Consequently, we strongly encourage any and all types ofcontributions. If you have something you want to share about EdgeSight, we want you to add it!
Generally, there are two methods for sharing on the Wiki with the broader EdgeSight community:
1. Adding case studies in a subheading in an article.
2. Adding Comments to articles. In future iterations of this Wiki, resources permitting, we hope to providea Discussion tab similar to Wikipedia. See the article EdgeSight Wiki Roadmap. <xxx xref>
Suggestions for Content
If there is an article or topic that you would like to see created in the EdgeSight Wiki, but you don'thave the time or information required to create it, suggest it to the EdgeSight Wiki editor <link xxxx>.Ideas for articles might include ideas for different ways to use EdgeSight, use cases, scenarios and casestudies, things you dn't understand about EdgeSight, and information not covered in the EdgeSightproduct documentation.
While we don't gaurantee our ability to start all topics or research them, we will provide you withfeedback about your idea and, if it is do-able, queue the article for authoring.
Requesting Review
If there is information in a Wiki article you would like reviewed for technical accuracy, please send arequest to the Wiki editor. <link xxxx>.
Document generated by Confluence on Nov 07, 2013 16:21 Page 290
EdgeSight Wiki Style
This page last changed on Sep 02, 2009 by sarahv.
This page provides information about EdgeSight Wiki style. While brief, it functions as the EdgeSightWiki's style guide.
Table of Contents
• 1 Overview• ° 1.1 Philosophy• 2 Formatting• 3 Sources and Citations• ° 3.1 When to Use Footnotes and Cite Sources
° 3.2 Internal Wiki Links° 3.3 External Links
• 4 Editorial Policies
Overview
The EdgeSight Wiki style is drawn primarily from the Wikipedia:Manual of Style. However, since theWiki provides technical information specific to Citrix products it also draws on internal documents thatcover Citrix's product naming conventions and documentation style. In some cases, the EdgeSight Wikistyle uses conventions from Chicago Manual of Style.
These guidelines are meant to document where the EdgeSight Wiki style differs from the standards putforth by Wikipedia or points significant enough to warrant repeating. If a subject is not covered in theguidelines provided in this article, use the conventions in the Wikipedia:Manual of Style.
Philosophy
Because we are extremely grateful to receive contributions from all EdgeSight users, these stylisticguidelines are not required to create articles. They are not meant to be onerous or make it difficult tocreate contributions.
The guidleines are provided for frequent contributors who want to contribute to the EdgeSight Wikicommunity overall as well as for the editors internal use. Adding content in cleaner condition freesresources for other tasks such as doing research on different ways to use EdgeSight and responding torequests for articles.
In general, the Wiki editors will try to clean up or edit articles for style on a regular basis. However,it si possible that an article might require editing before the editors reach that point in theschedule. Currently, the EdgeSight Wiki does not have a function that indicates if article should becleaned up. However, it is possible to email the Wiki editors directly to suggest that articles be reviewedfor this purpose.
Formatting
Sources and Citations
In general, footnotes and citations should contain the following elements:
• Author's Name• Title of work (and/or link to Web site)• Publication or Delivery Date• Date Accessed • Publisher or Company
Document generated by Confluence on Nov 07, 2013 16:21 Page 291
The EdgeSight Wiki appreciates all contributions. Consequently, we feel it is more important forcontributors to worry less about ensuring bibliographic format is followed and more about ensuring theinformation is verifiable (by indicating where you found it). The Wiki editor can clean up bibliographicformatitng as necessary.
For contributors interested in creating entries using the format the Wiki editors use, the format isprovided in the article, Formatting Sources and Citations for the EdgeSight Wiki.
When to Use Footnotes and Cite Sources
Citrix does not guarantee the technical accuracy of content in the EdgeSight Wiki. While Citrix tries toreview the Wiki's content regularly, like Citrix forums, it may not be possible to ensure content at anygiven time is accurate.
Consequently, it is important to provide readers and Citrix Technical Support a way to trace backthe source of technical information. It is not necessary to cite every single sentence; providing whatWikipedia refers to as "general referencing" is acceptable. (That is, if all facts in a paragraph stem fromthe same source, only referencing it once. See Formatting Sources and Citations for the EdgeSight Wiki.)
Furthermore, citing sources is also crucial to prevent plagiarism and unfairly reproducing the labor andintellectual property of others. Citrix does not want or intend to reproduce material from non-Citrixconsultants or other experts without acknowledging their contribution.
Some examples of when sourcing is critical:
• When a Wiki contributor outside of EdgeSight Engineering adds information about a metric (reportcounter) that expands upon information contained in the report counters glossary. If the secondparty assumes the information is correct and makes a purchasing decision based on the information,information the contributor intended to be helpful could be harmful. Including the source - whethera note that it is from a technical support call with John Smith, slides from a presentation at Synergy,or an email received from Citrix Consulting - can save a lot of time in verifying this information andlet readers determine the level of technical accuracy they feel is acceptable on their own.
• When providing information about relatively obscure Performance Monitoring counters or otheraspects of networking that should be verified.
• When providing information about Citrix product performance. For example, listing the maximumpercentage of CPU utilization Citrix recommends for the XenApp data collector.
• When adding potentially controversial information or information likely to be challenged.
When sourcing is desirable:
• To provide additional information or guidance about information. For example, indicaitn the manualsomebody might find a procedure about configuring a XenApp feature. While not necessarily strictlyrelevant to the article, this type of helpful information could save many people time.
When sourcing is not necessary:
• When explaining how you used the feature, especially when providing information about how yourorganization used EdgeSight or use cases.
• When making a general widely accepted point. For example, a point you could (theoretically) find inthree different books about XenApp or Microsoft Windows.
• While the nature of our articles differs in that we encourage readers to contribute personalexperiences as well as factual information, generally, we look to Wikipedia's guidelines as a modelof Wikis, referencing, and verifiability. Additional guidelines for helping Wiki users determine thereliability of content are elaborated on in Wikipedia's article, Verifiability.
Internal Wiki Links
Linking key words, glossary definitions, is a crucial aspect of making articles useful and retrievable.Wikifying the EdgeSight Wiki, to use a Wikipedia word, is an on-going effort and we welcome any and allhelp in this area.
To reduce visual clutter, only link the first instance of a word. It is acceptable to repeat links for words innew, larger sections within articles.
Document generated by Confluence on Nov 07, 2013 16:21 Page 292
Valuable items to link include report counter names (to the report counters glossary), report names,EdgeSight best practices (such as the principles of good grouping), and other, relevant Wiki articles.
External Links
When linking to an external Web site, include a footnote and note the date you accessed the Web site.Despite the best intentions of the EdgeSight Wiki editors, due to the size and complexity of the Wiki, itis not possible to keep external links up-to-date. Likewise, content on the Web changes frequently andinformation cited could be deleted from an whitepaper a few weeks later.
Providing an "Accessed on..." date in footnotes can help reduce reader frustration by giving them an ideaof how long ago the information was cited.
Editorial Policies
See the main article, EdgeSight Wiki Editorial Policies.
Document generated by Confluence on Nov 07, 2013 16:21 Page 293
EdgeSight Wiki Editorial Policies
This page last changed on Oct 27, 2009 by sarahv.
To create an environment that is useful and enjoyable for all users, the Wiki employs specific editorialpolicies. This article provides guidelines about subject matter, tone, citations, and usefulness. Contentthat does not meet these standards will be edited appropriately or deleted.
Table of Contents
• 1 Subject Matter• 2 Neutral Point of View/Reduced "Marketing-ese"• 3 Citing Sources• 4 Copyrights• 5 Renaming and Deleting Articles• 6 Conduct and Flaming
Subject Matter
The EdgeSight Wiki is an editable encyclopedia designed to help the EdgeSight developer and usercommunity exchange techniques for better managing Citrix products through EdgeSight. Subjects forarticles can include ways to manage XenApp farms or XenDesktop deployments using EdgeSight, casestudies/use cases and scenarios, information about the meaning of reports or metrics, and tips for usingEdgeSight.
Ideally, articles focus on a specific problem and the way somebody uncovered the problem or resolved itusing EdgeSight. Originally, the EdgeSight Engineering team intended the Wiki to bridge the gap betweenfarm-management tasks XenApp administrators wanted to perform and how to translate those tasksinto EdgeSight features. This remains a primary goal and is a desirable subject for articles. The Wikiis not meant to replace Knowledge Center ("KB") articles or duplicate content already in the productdocumentation.
While it is acceptable to allude to techniques using Windows Performance Monitor and other commonlyused monitoring tools, the primary focus should be on using EdgeSight. Likewise, it is acceptable toprovide background information about tasks or architecture of the product being monitored (for example,XenApp or XenDesktop) provided they are required to understand the article.
When creating articles, determine if the topic is sufficient to expand beyond a dictionary definitionor if the information could be folded into a larger article. Likewise, if part of a large article growsdisproportionately to other sections, determine if this section should be broken off into another article.
Neutral Point of View/Reduced "Marketing-ese"
The intention of the EdgeSight Wiki is to provide the user community with clear, easy to understandfactual information about using EdgeSight to manage their environment. Ultimately, we want to make iteasier for people to use EdgeSight. The Wiki is not intended to be a vehicle to promote or market Citrixproducts.
Clear speech and substantial, useful content is encouraged in articles. Content should be concrete withspecific details and not vague. For example, it should name the specific features used to accomplish atask or refer to specific reports run. Ideally, articles should not be laden with industry jargon.
Content contributed that is unclear or has an excessive marketing tone will be edited appropriately.
Document generated by Confluence on Nov 07, 2013 16:21 Page 294
Citing Sources
To contribute to the factual nature of the Wiki, all information added should refer to specific features andproduct versions. In general, use footnotes, if possible, whenever providing information about Microsoftfunctionality.
Refer to Citrix product documentation, if possible, if directing readers to find a non-EdgeSight featurein a specific component. For example, if telling readers to create a Health Monitoring & Recovery test inXenApp add a footnote and write, "as described in the Citrix XenApp 5.0 Administrator's Guide." (It is notdesirable to duplicate the steps to perform in the user interface, especially for products and componentsbesides EdgeSight.)
If you are referring to techniques first explained in third-party white papers or Web sites, cite the Website or author. This not only gives credit where credit is due, it also lets readers find additional informationabout the subject.
Copyrights
Do not copy and paste or reproduce any copyrighted material without permission of its owner. Likewise,do not add copyrighted images, icons, or diagrams to the Web site that were created by parties outside ofCitrix. Use your own words whenever possible.
Diagrams must not use any icons or clipart that is not copyright free. Creating diagrams with thestandard icon set provided in Visio is acceptable. Be careful when using third-party clipart.
Any material suspected of copyright violations will be deleted.
Renaming and Deleting Articles
If you believe an article is incorrectly named, please contact the Wiki editor. If you suspect an articleplagiarizes or in any other way violates copyright agreements, contact the editor immediately. Likewise, ifyou believe an article should be deleted or combined with another article, contact the editor.
Conduct and Flaming
The EdgeSight Wiki aims to create an atmosphere of friendliness and support. While disagreements mayarise about performance monitoring techniques or technical details, please assume the good intentions ofthe other party and refrain from personally critical, ad hominem remarks.
Citrix reserves the right to delete comments that are derogatory towards any of its products oremployees.
Document generated by Confluence on Nov 07, 2013 16:21 Page 295
Formatting Sources and Citations for the EdgeSight Wiki
This page last changed on Sep 02, 2009 by sarahv.
overview
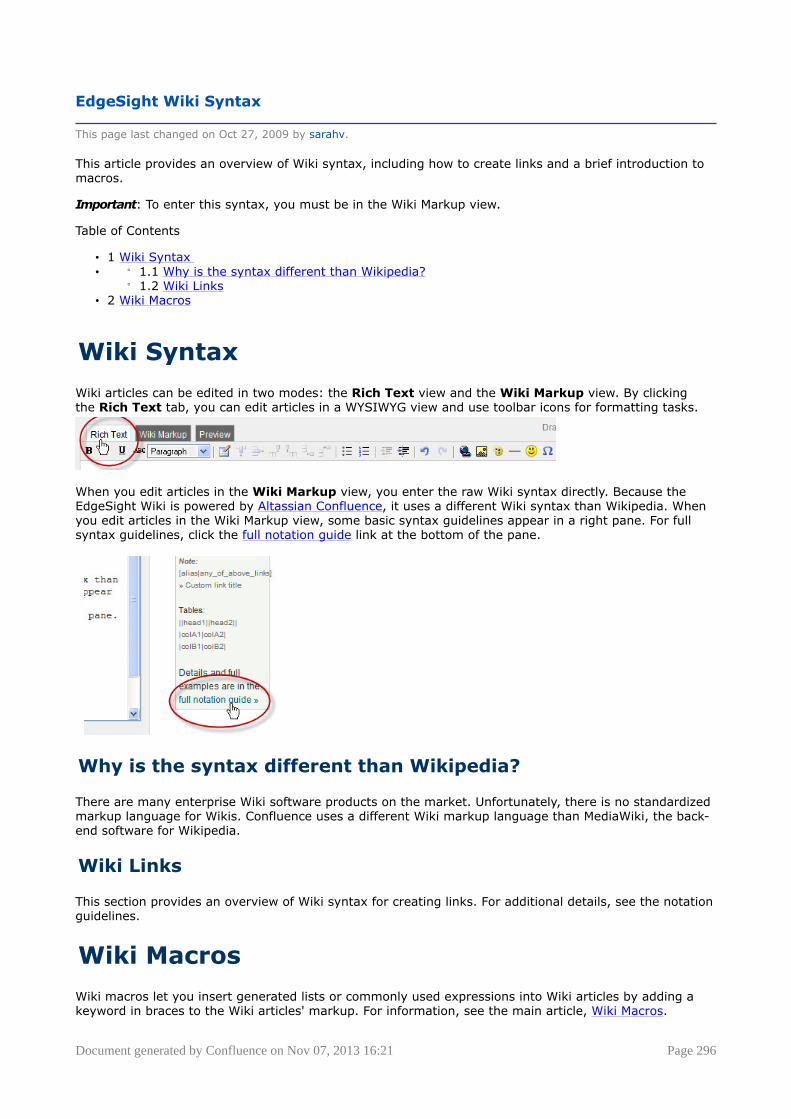
Document generated by Confluence on Nov 07, 2013 16:21 Page 296
EdgeSight Wiki Syntax
This page last changed on Oct 27, 2009 by sarahv.
This article provides an overview of Wiki syntax, including how to create links and a brief introduction tomacros.
Important: To enter this syntax, you must be in the Wiki Markup view.
Table of Contents
• 1 Wiki Syntax • ° 1.1 Why is the syntax different than Wikipedia?
° 1.2 Wiki Links• 2 Wiki Macros
Wiki Syntax
Wiki articles can be edited in two modes: the Rich Text view and the Wiki Markup view. By clickingthe Rich Text tab, you can edit articles in a WYSIWYG view and use toolbar icons for formatting tasks.
When you edit articles in the Wiki Markup view, you enter the raw Wiki syntax directly. Because theEdgeSight Wiki is powered by Altassian Confluence, it uses a different Wiki syntax than Wikipedia. Whenyou edit articles in the Wiki Markup view, some basic syntax guidelines appear in a right pane. For fullsyntax guidelines, click the full notation guide link at the bottom of the pane.
Why is the syntax different than Wikipedia?
There are many enterprise Wiki software products on the market. Unfortunately, there is no standardizedmarkup language for Wikis. Confluence uses a different Wiki markup language than MediaWiki, the back-end software for Wikipedia.
Wiki Links
This section provides an overview of Wiki syntax for creating links. For additional details, see the notationguidelines.
Wiki Macros
Wiki macros let you insert generated lists or commonly used expressions into Wiki articles by adding akeyword in braces to the Wiki articles' markup. For information, see the main article, Wiki Macros.
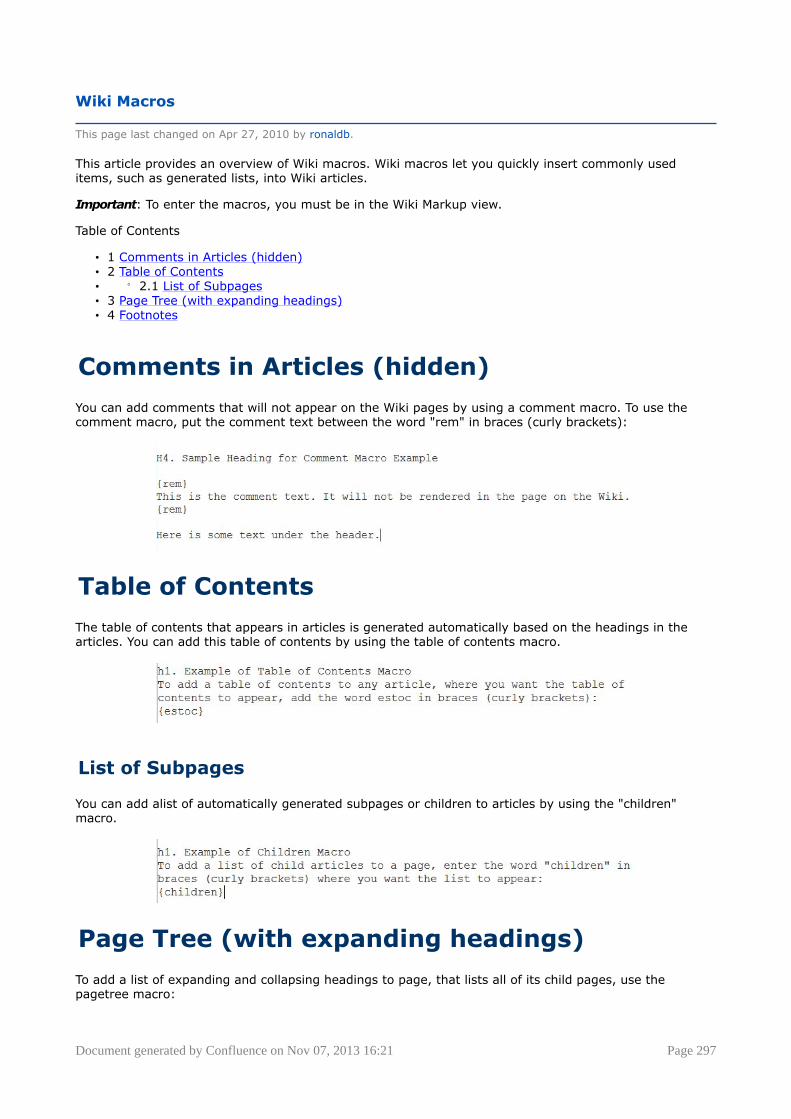
Document generated by Confluence on Nov 07, 2013 16:21 Page 297
Wiki Macros
This page last changed on Apr 27, 2010 by ronaldb.
This article provides an overview of Wiki macros. Wiki macros let you quickly insert commonly useditems, such as generated lists, into Wiki articles.
Important: To enter the macros, you must be in the Wiki Markup view.
Table of Contents
• 1 Comments in Articles (hidden)• 2 Table of Contents• ° 2.1 List of Subpages• 3 Page Tree (with expanding headings)• 4 Footnotes
Comments in Articles (hidden)
You can add comments that will not appear on the Wiki pages by using a comment macro. To use thecomment macro, put the comment text between the word "rem" in braces (curly brackets):
Table of Contents
The table of contents that appears in articles is generated automatically based on the headings in thearticles. You can add this table of contents by using the table of contents macro.
List of Subpages
You can add alist of automatically generated subpages or children to articles by using the "children"macro.
Page Tree (with expanding headings)
To add a list of expanding and collapsing headings to page, that lists all of its child pages, use thepagetree macro:
Document generated by Confluence on Nov 07, 2013 16:21 Page 298
Footnotes
Creating footnotes requires two separate tasks:
Task 1
In the place in the paragraph where you are creating the footnote marker (that is, the superscriptnumber), enter the bibliographical information, as follows:
For example,
Task 2To output the footnote information you entered, go to the References section of the article and enter thefollowing syntax:
All of the footnotes you've added to this article will display where you entered the macro once the page isrendered.
Document generated by Confluence on Nov 07, 2013 16:21 Page 299
Ways You Can Help
This page last changed on Oct 27, 2009 by sarahv.
The EdgeSight Wiki is a large project that we hope will contribute to the larger XenApp and XenDesktopcommunities. There are many small tasks contributors can do to help improve the retrievability, usability,beauty, usefulness, and enjoy-ability of the content.
This article talks about a few opportunities for ways to help.
How You Can Help
This is an on-going list of tasks that people looking to make small, non-technical contributions to the Wikican perform. The Wiki editors and EdgeSight engineering are extremely grateful to any and all who helpwith these tasks.
Graphical Improvements
This is our ongoing list of desired aesthetic improvements to the Wiki:
• Adding screen captures for every report, ideally with different filters applied. See .• Adding illustrations to articles, especially ones that illustrate points, provide useful screen captures.• Adding graphics to articles that look visually bland, especially beside the table of contents section.• Creating technical illustrations, balancing the page layout and so on.
Technical Improvements
This is our current list of desired technical improvements to the Wiki:
• Add links for the first instance of report counters any where report counters are mentioned,especially in articles about the reports themselves
• Add links between articles about reports and related tasks• Create hyperlinks between the letters at the top of the page in the report list and in the sections• Create expanding thumbnails for report screen captures
This is our ongoing list of desired technical improvements:
• Fixing typos and grammatical errors• Fixing broken links• Creating redirects• Adding See Also references and references to relevant procedures in product documentation
Additional ideas for ways to help can be found in Wikipedia's aritcle about these magical creatures. SeeWikiFairies and WikiGnomes.
Document generated by Confluence on Nov 07, 2013 16:21 Page 300
List of Stub Articles
This page last changed on Oct 07, 2009 by sarahv.
This is a list of stub articles that are still under development.
Document generated by Confluence on Nov 07, 2013 16:21 Page 301
FAQ
This page last changed on Apr 28, 2010 by normanw1.
This page provides a list of Frequently Asked Questions (FAQ). In the future, we hope to expand theseFAQs into EdgeSight Wiki articles.
Why do reports sometimes display a user named CITRIX\UNKNOWN?
The UNKNOWN user appears when EdgeSight cannot determine the user account. In some cases, theoperating system can not determine the user account name, and, in turn, EdgeSight records it as CITRIX\UNKNOWN. Look at the SYS_EVENT_TXT file around the same time for more information or check theEvent Logs on the server.
Document generated by Confluence on Nov 07, 2013 16:21 Page 302
EdgeSight Wiki Site Map
This page last changed on Oct 27, 2009 by sarahv.
Document generated by Confluence on Nov 07, 2013 16:21 Page 303
Home
This page last changed on Jun 26, 2009 by gregan.
This is the home page for the EdgeSight profile.