"what is different this time around" at saastr annual 2016
TRANSCRIPT

Venture Capital 2016 - Some Upfront Views
1
Mark Suster @msuster
There is Some Stuff We All Know
We all know the funding markets for venture-backed startups have been strong for 7 straight years
2
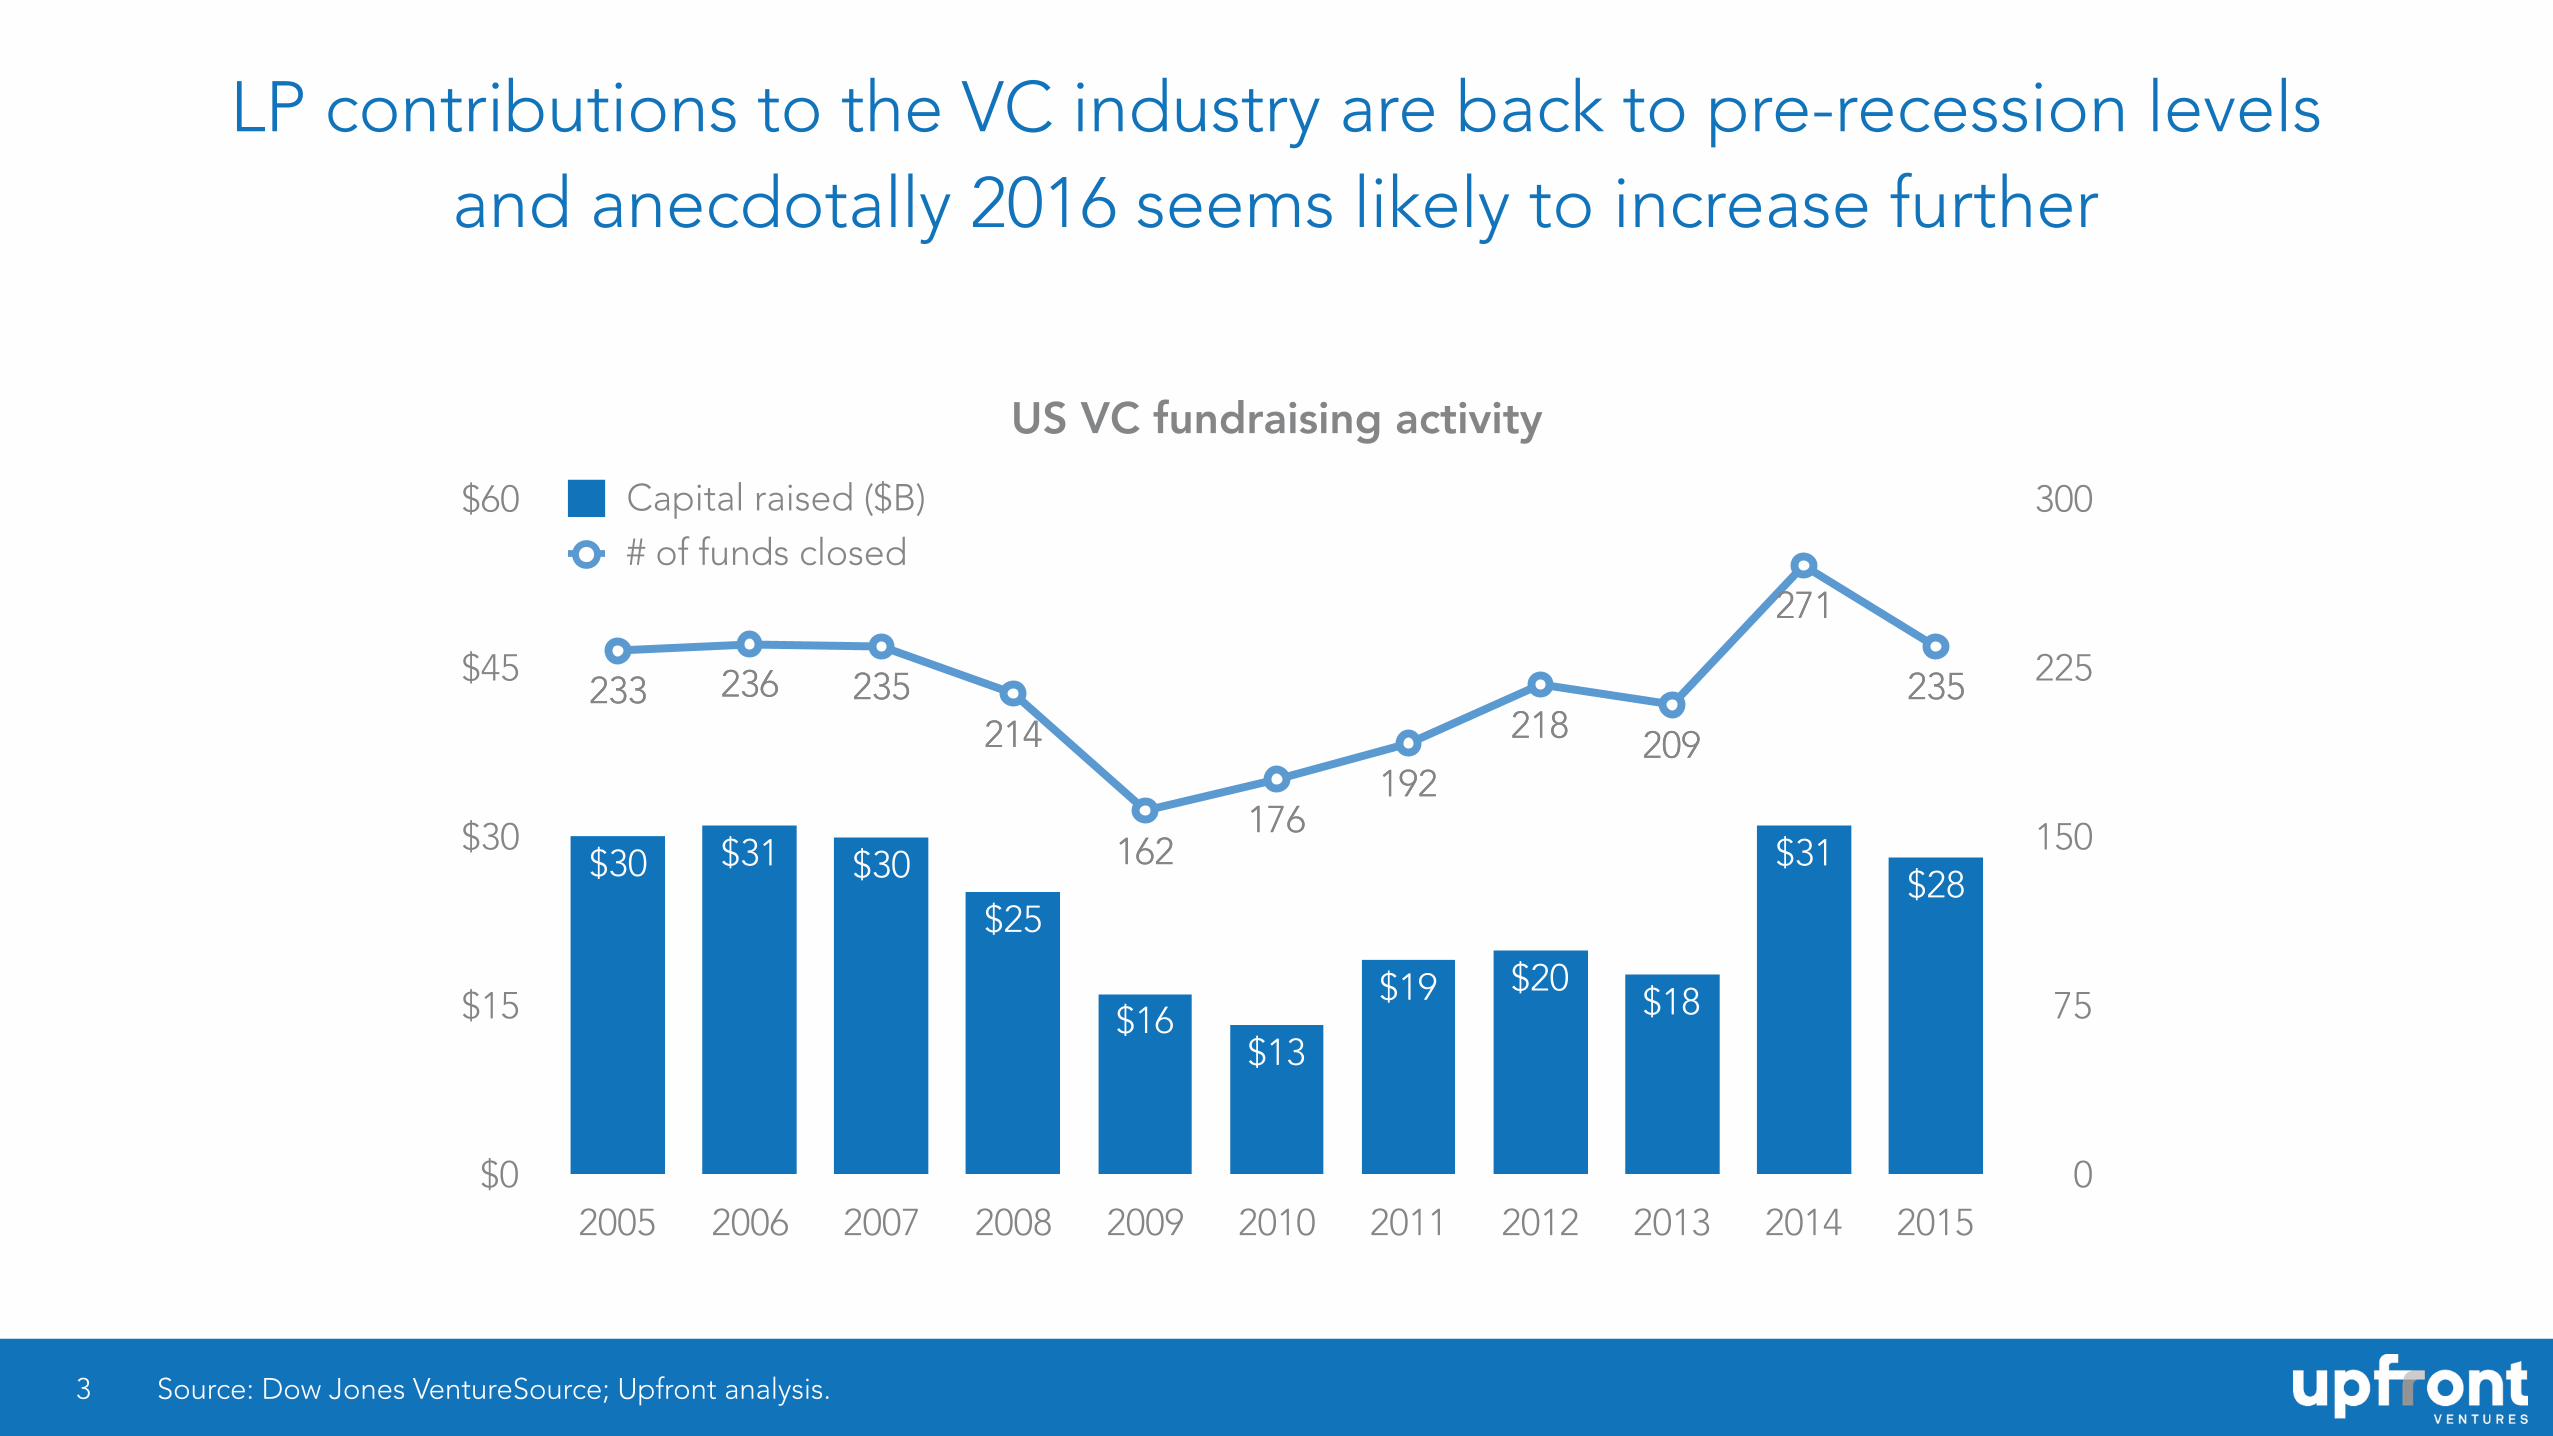
LP contributions to the VC industry are back to pre-recession levels and anecdotally 2016 seems likely to increase further
3
US VC fundraising activity
0
75
150
225
300
$0
$15
$30
$45
$60
2005 2006 2007 2008 2009 2010 2011 2012 2013 2014 2015
Capital raised ($B)# of funds closed
235
271
209218
192176
162
214235236233
$28$31
$18$20$19
$13$16
$25$30$31$30
233 236 235214
162176
192
218 209
271
235
Source: Dow Jones VentureSource; Upfront analysis.

With more money (and new non VC entrants) venture financings have obviously increased. 2015 was an enormous year (2x pre recession)
4
US VC financing activity
0
2,500
5,000
7,500
10,000
$0
$25
$50
$75
$100
2005 2006 2007 2008 2009 2010 2011 2012 2013 2014 2015
Capital invested ($B)# of rounds closed
8,097
9,3818,563
7,572
6,428
5,193
4,3164,5334,119
3,1452,574
$77
$68
$44$40$42
$30$26
$36$35$28
$23
2,5743,145
4,1194,533 4,316
5,193
6,428
7,572
8,5639,381
8,097
Source: PitchBook 2015 Annual U.S. Venture Industry Report; Upfront analysis.
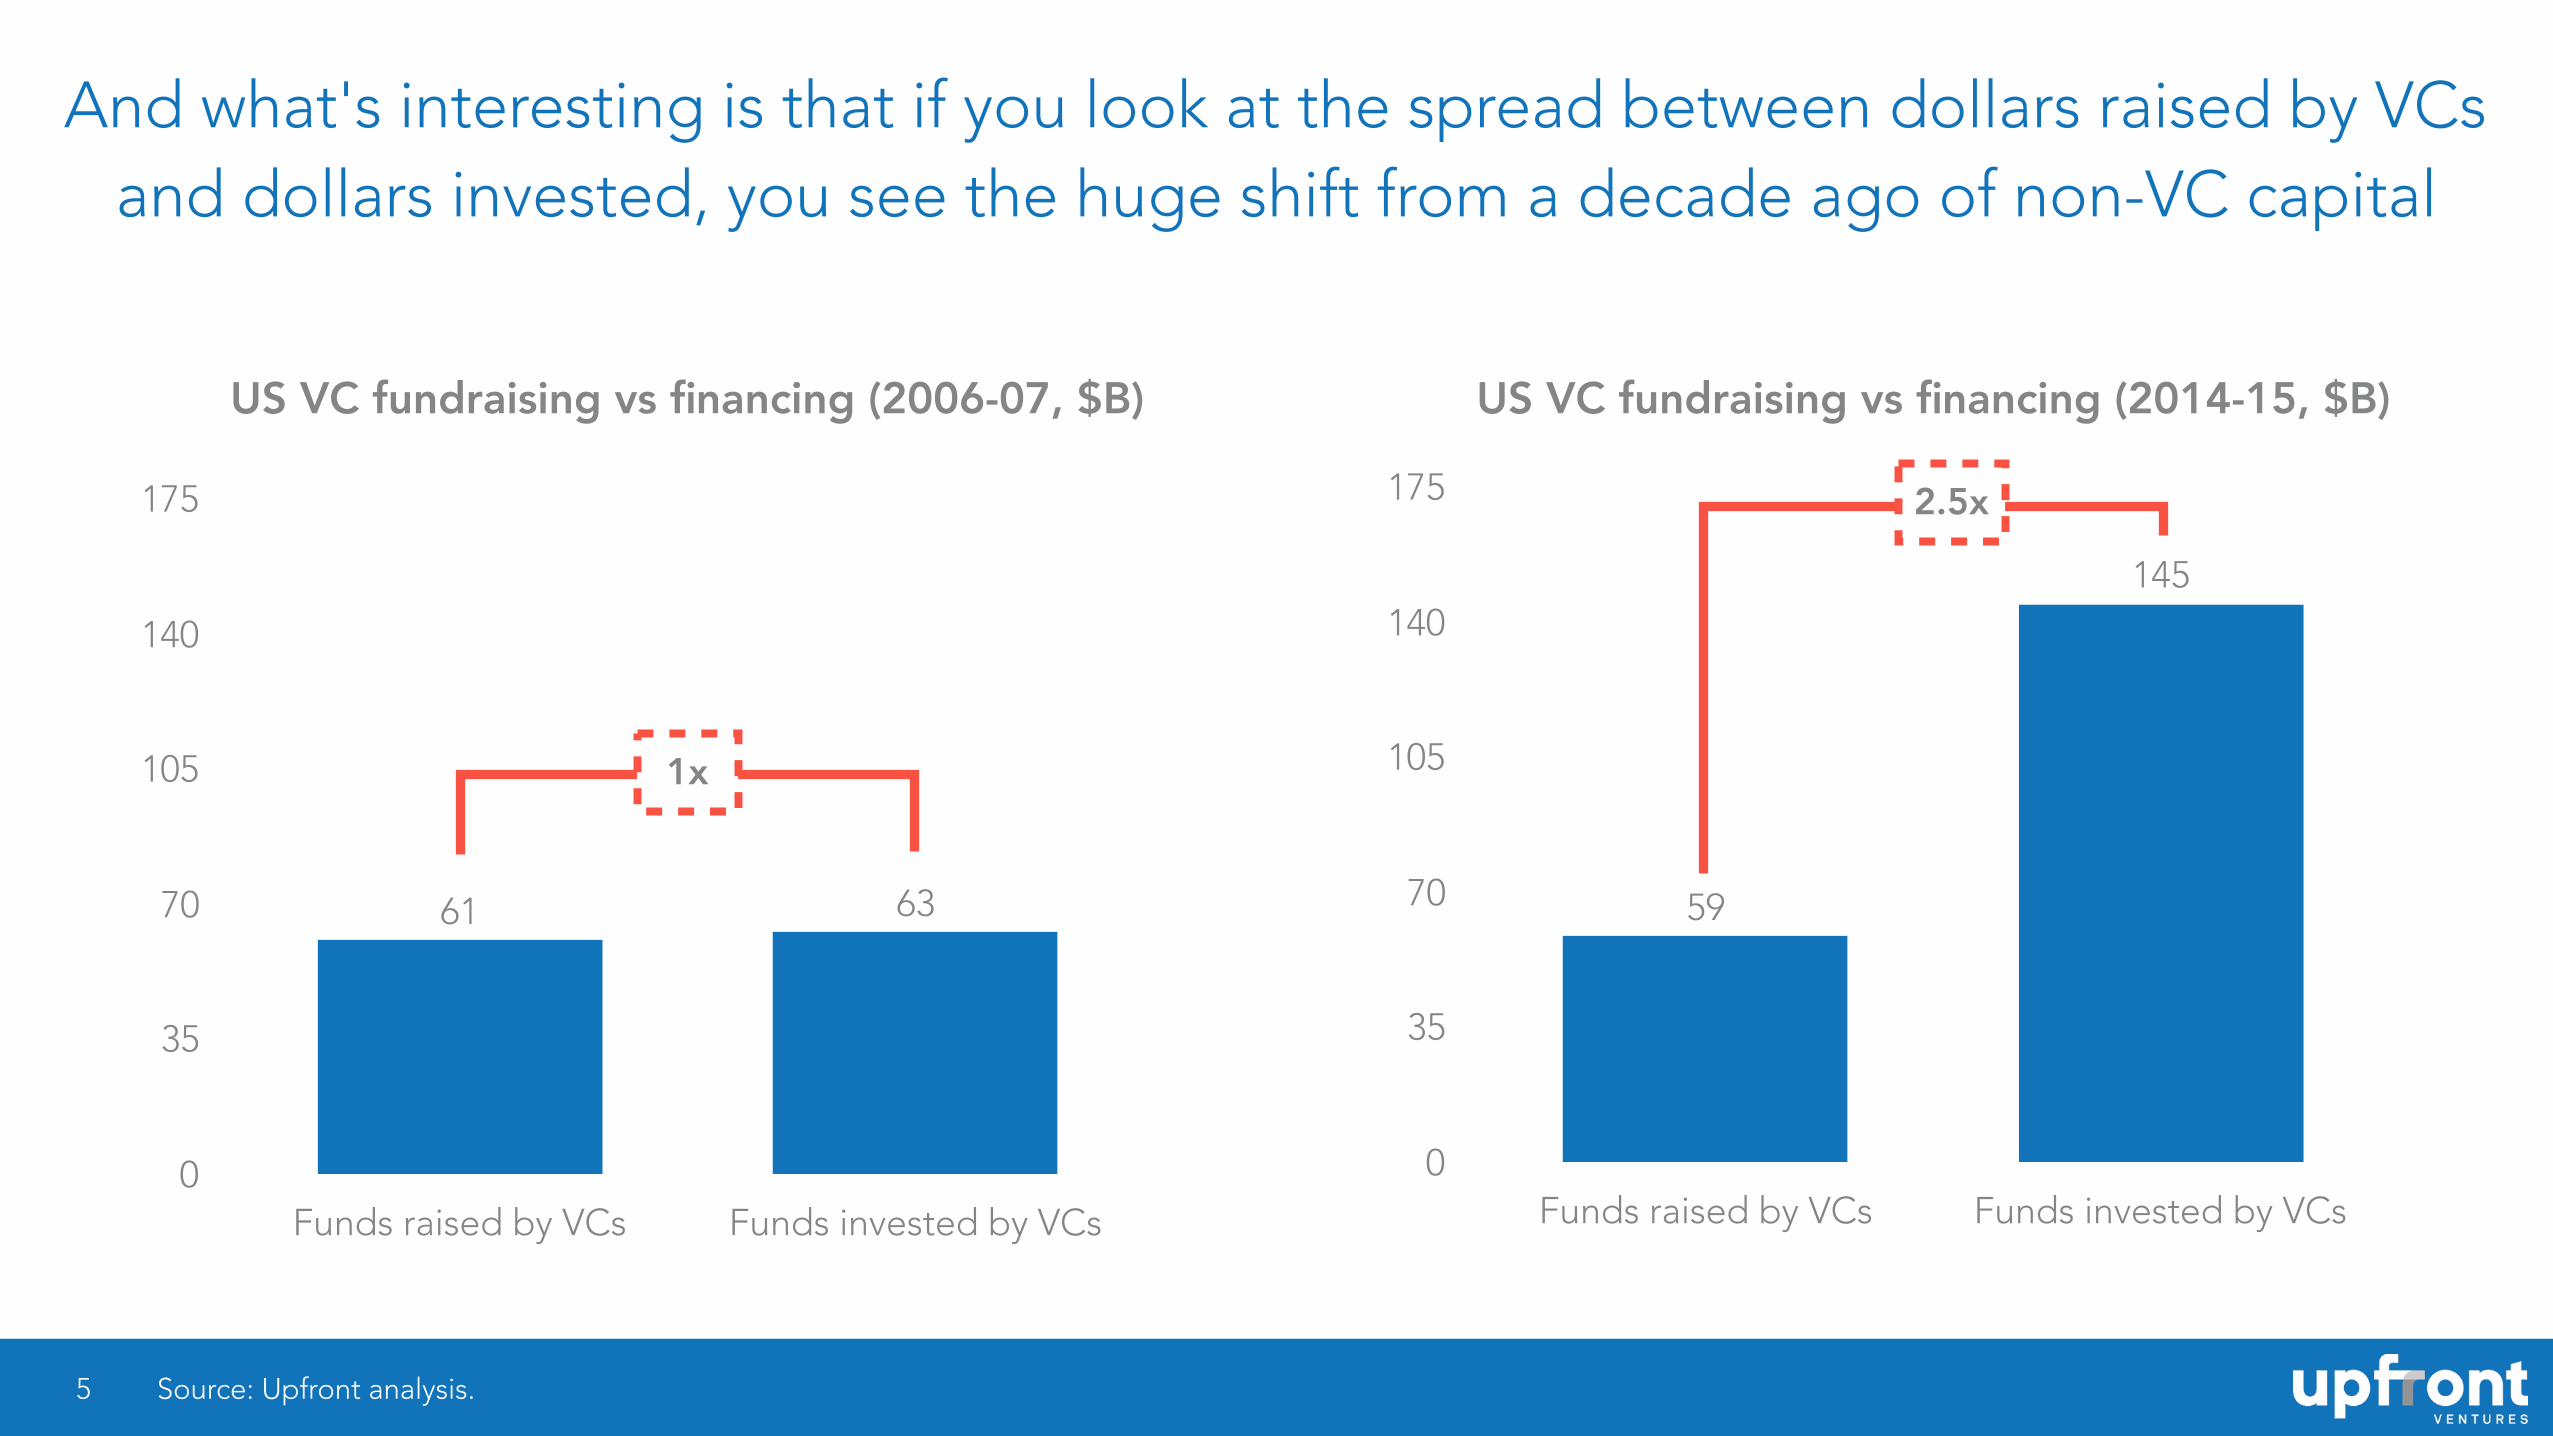
And what's interesting is that if you look at the spread between dollars raised by VCs and dollars invested, you see the huge shift from a decade ago of non-VC capital
5 Source: Upfront analysis.
US VC fundraising vs financing (2006-07, $B)
0
35
70
105
140
175
Funds raised by VCs Funds invested by VCs
6361
1x
US VC fundraising vs financing (2014-15, $B)
0
35
70
105
140
175
Funds raised by VCs Funds invested by VCs
145
59
2.5x

Angel & Seed deals have grown fastest but dollars have scaled massively into a smaller number of later-stage deals (doubling in just 2 years)
6 Source: PitchBook 2015 Annual U.S. Venture Industry Report; Upfront analysis.
US VC # of rounds closed by stage US VC capital invested ($B) by stage
0
10
20
30
40
50
2010 2011 2012 2013 2014 20150
1,000
2,000
3,000
4,000
5,000
2010 2011 2012 2013 2014 2015
Early Stage
CAGR
21%
36%
16%
CAGR
1%
22%
3%
Angel/ Seed
Late Stage
Early Stage
Late Stage
Angel/Seed

And the dollars into late-stage deals has largely been driven by non-traditional VCs entering the market (up 50% in the last 3 years)
7 Source: CBInsights, VC-backed $20M+ rounds; non-VC defined as Asset Mgmt, Corporate/Corporate VC, Family Office, Hedge & Mutual Funds; Upfront analysis.
Non-VC participation in US $20 million-plus rounds
0%
15%
30%
45%
60%
2012 2013 2014 2015
55%47%47%
37%
CAGR ’12-’15
15%

M&A pace hasn’t matched the increases in funding pace so VC mark-ups have been good but cash distributions less so
8
US VC-backed M&A activity
300
375
450
525
600
$0
$38
$75
$113
$150
2011 2012 2013 2014 2015
Amount Paid ($B)Number of M&As
473
510
470462
542
$54
$81
$42$43$47
542
462 470
510
473
Source: Dow Jones VentureSource Venture Capital Report 4Q’15; Upfront analysis.
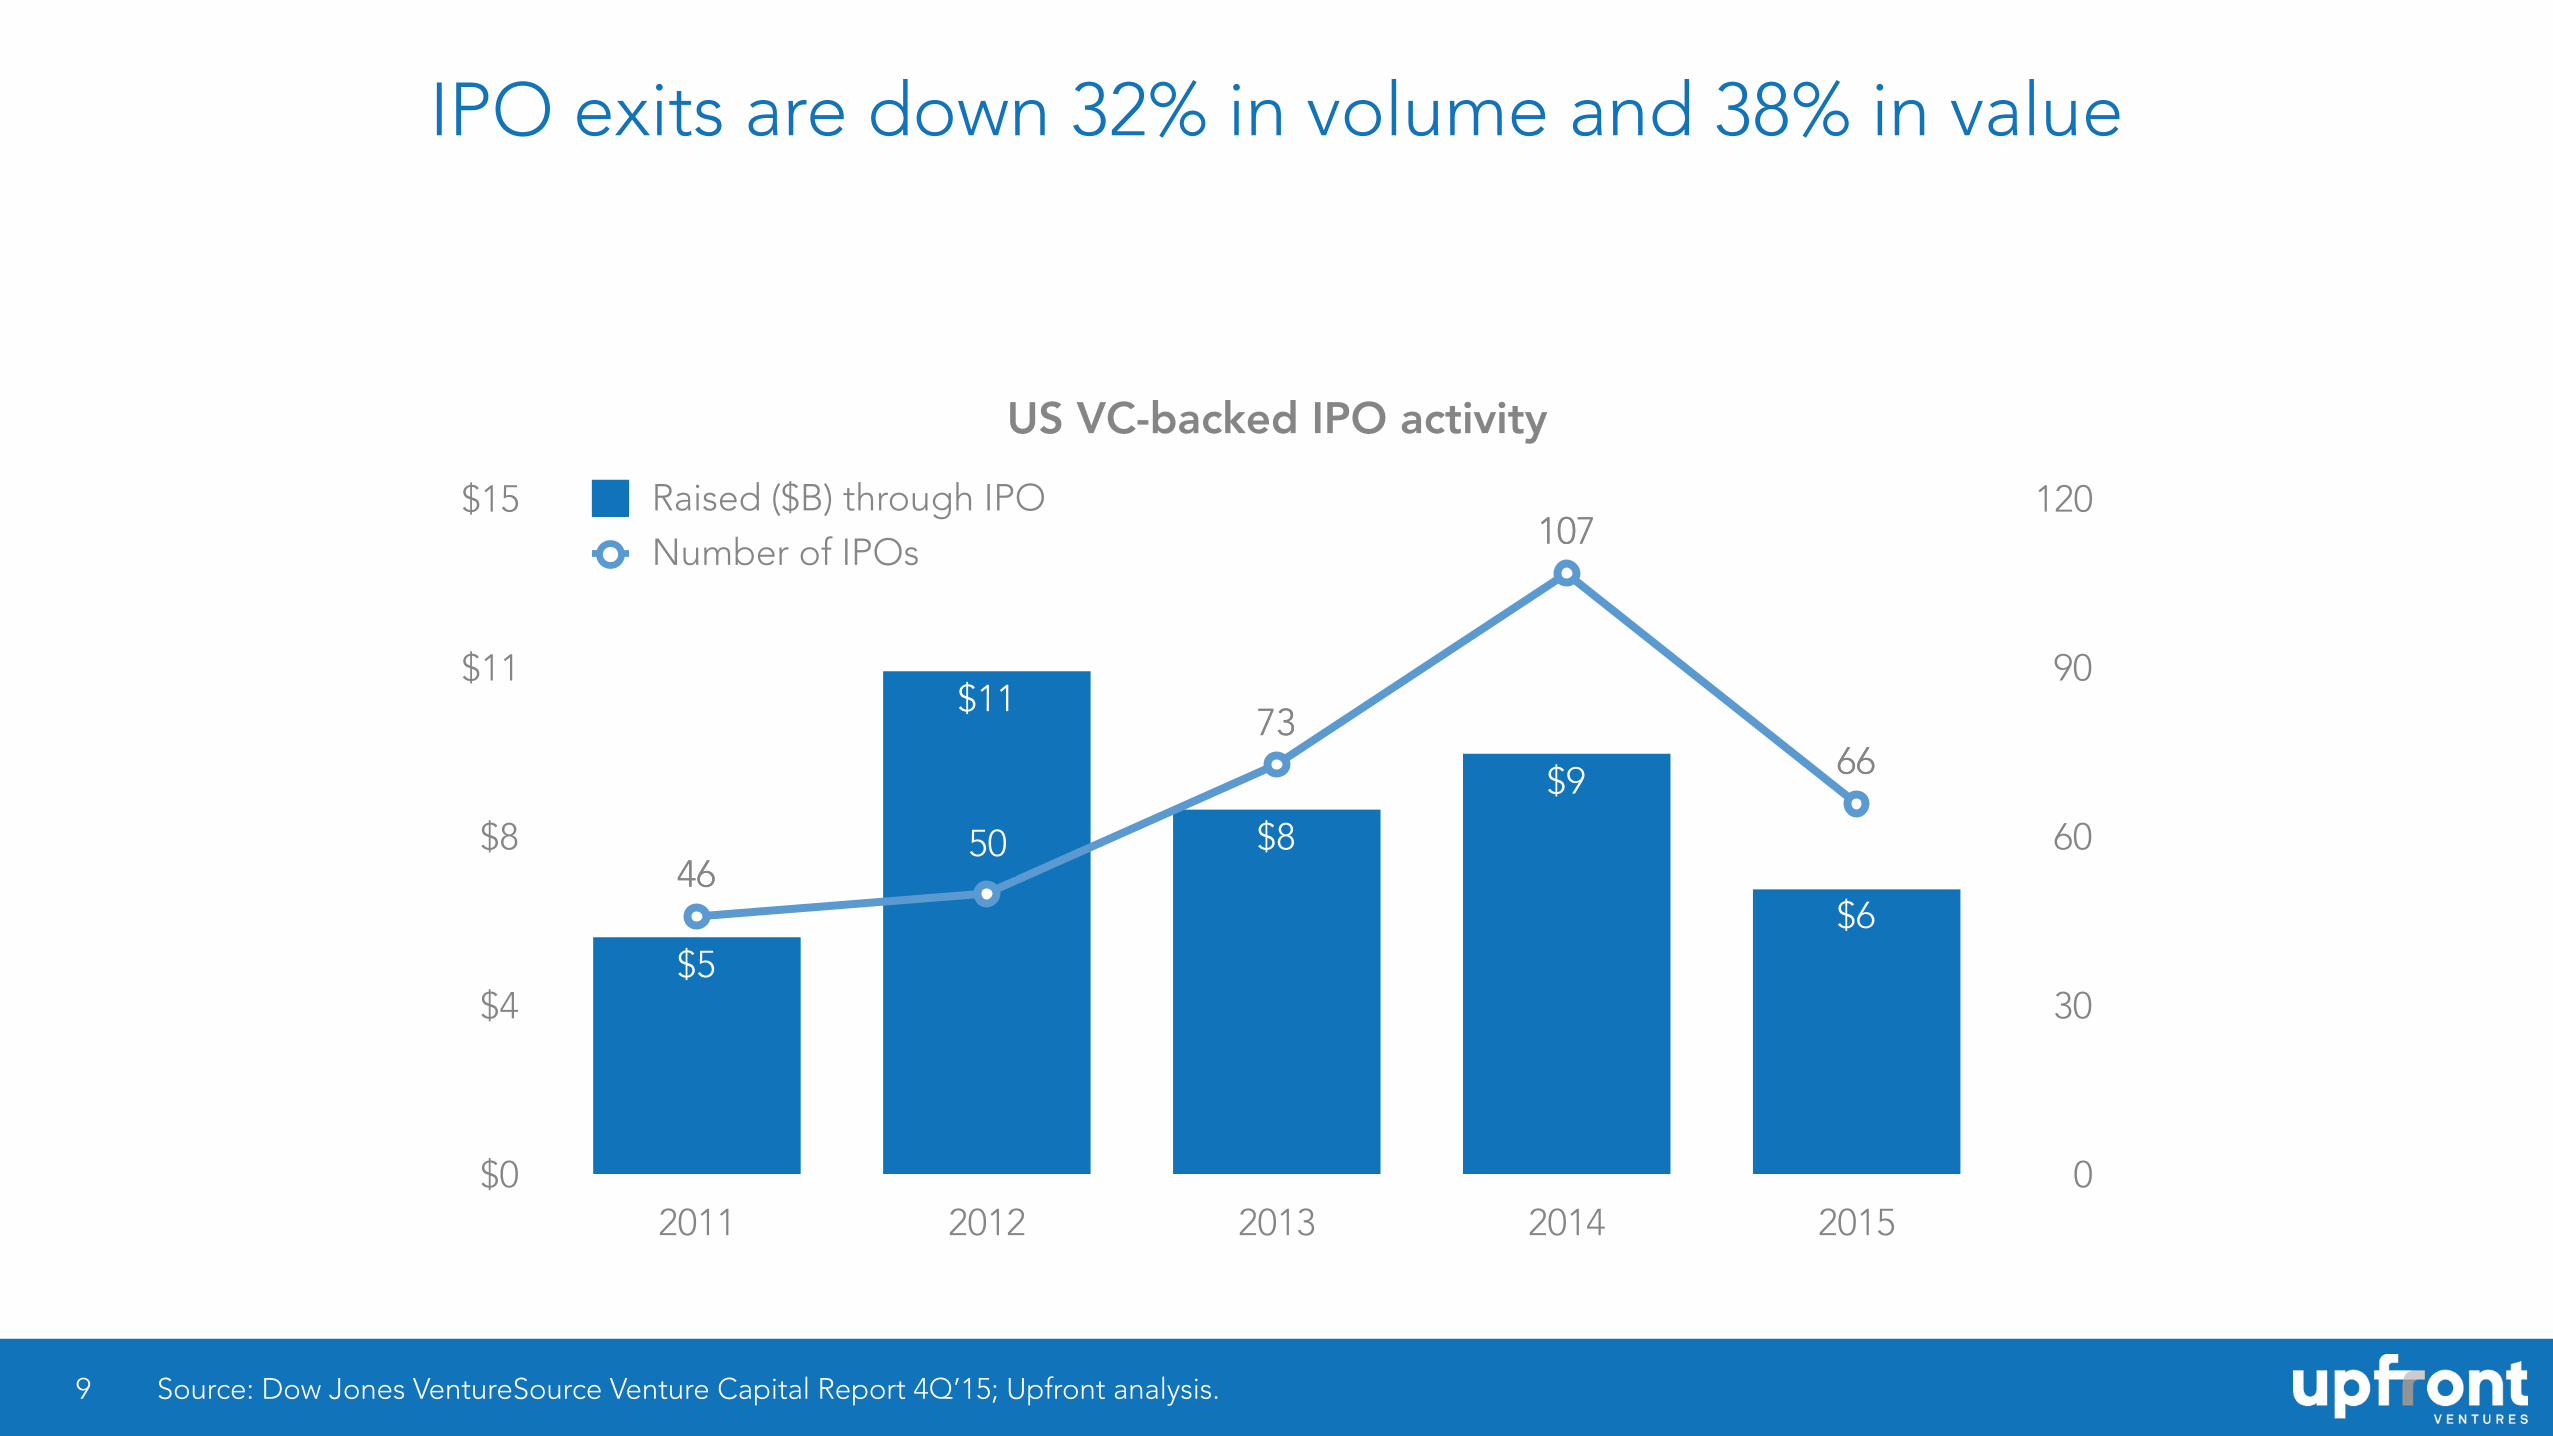
IPO exits are down 32% in volume and 38% in value
9
US VC-backed IPO activity
0
30
60
90
120
$0
$4
$8
$11
$15
2011 2012 2013 2014 2015
Raised ($B) through IPONumber of IPOs
66
107
73
5046
$6
$9
$8
$11
$5
4650
73
107
66
Source: Dow Jones VentureSource Venture Capital Report 4Q’15; Upfront analysis.
50

But there are other truths that people have only recently begun to speak about
10

11
Public Tech Markets are obviously off dramatically in the past three months beginning the question of what this means for private valuations
NASDAQ
Apple
(9%)
(18%)
(19%)
(41%)
Source: 3-month valuations November 02, 2015 to January 29, 2016; Upfront analysis.
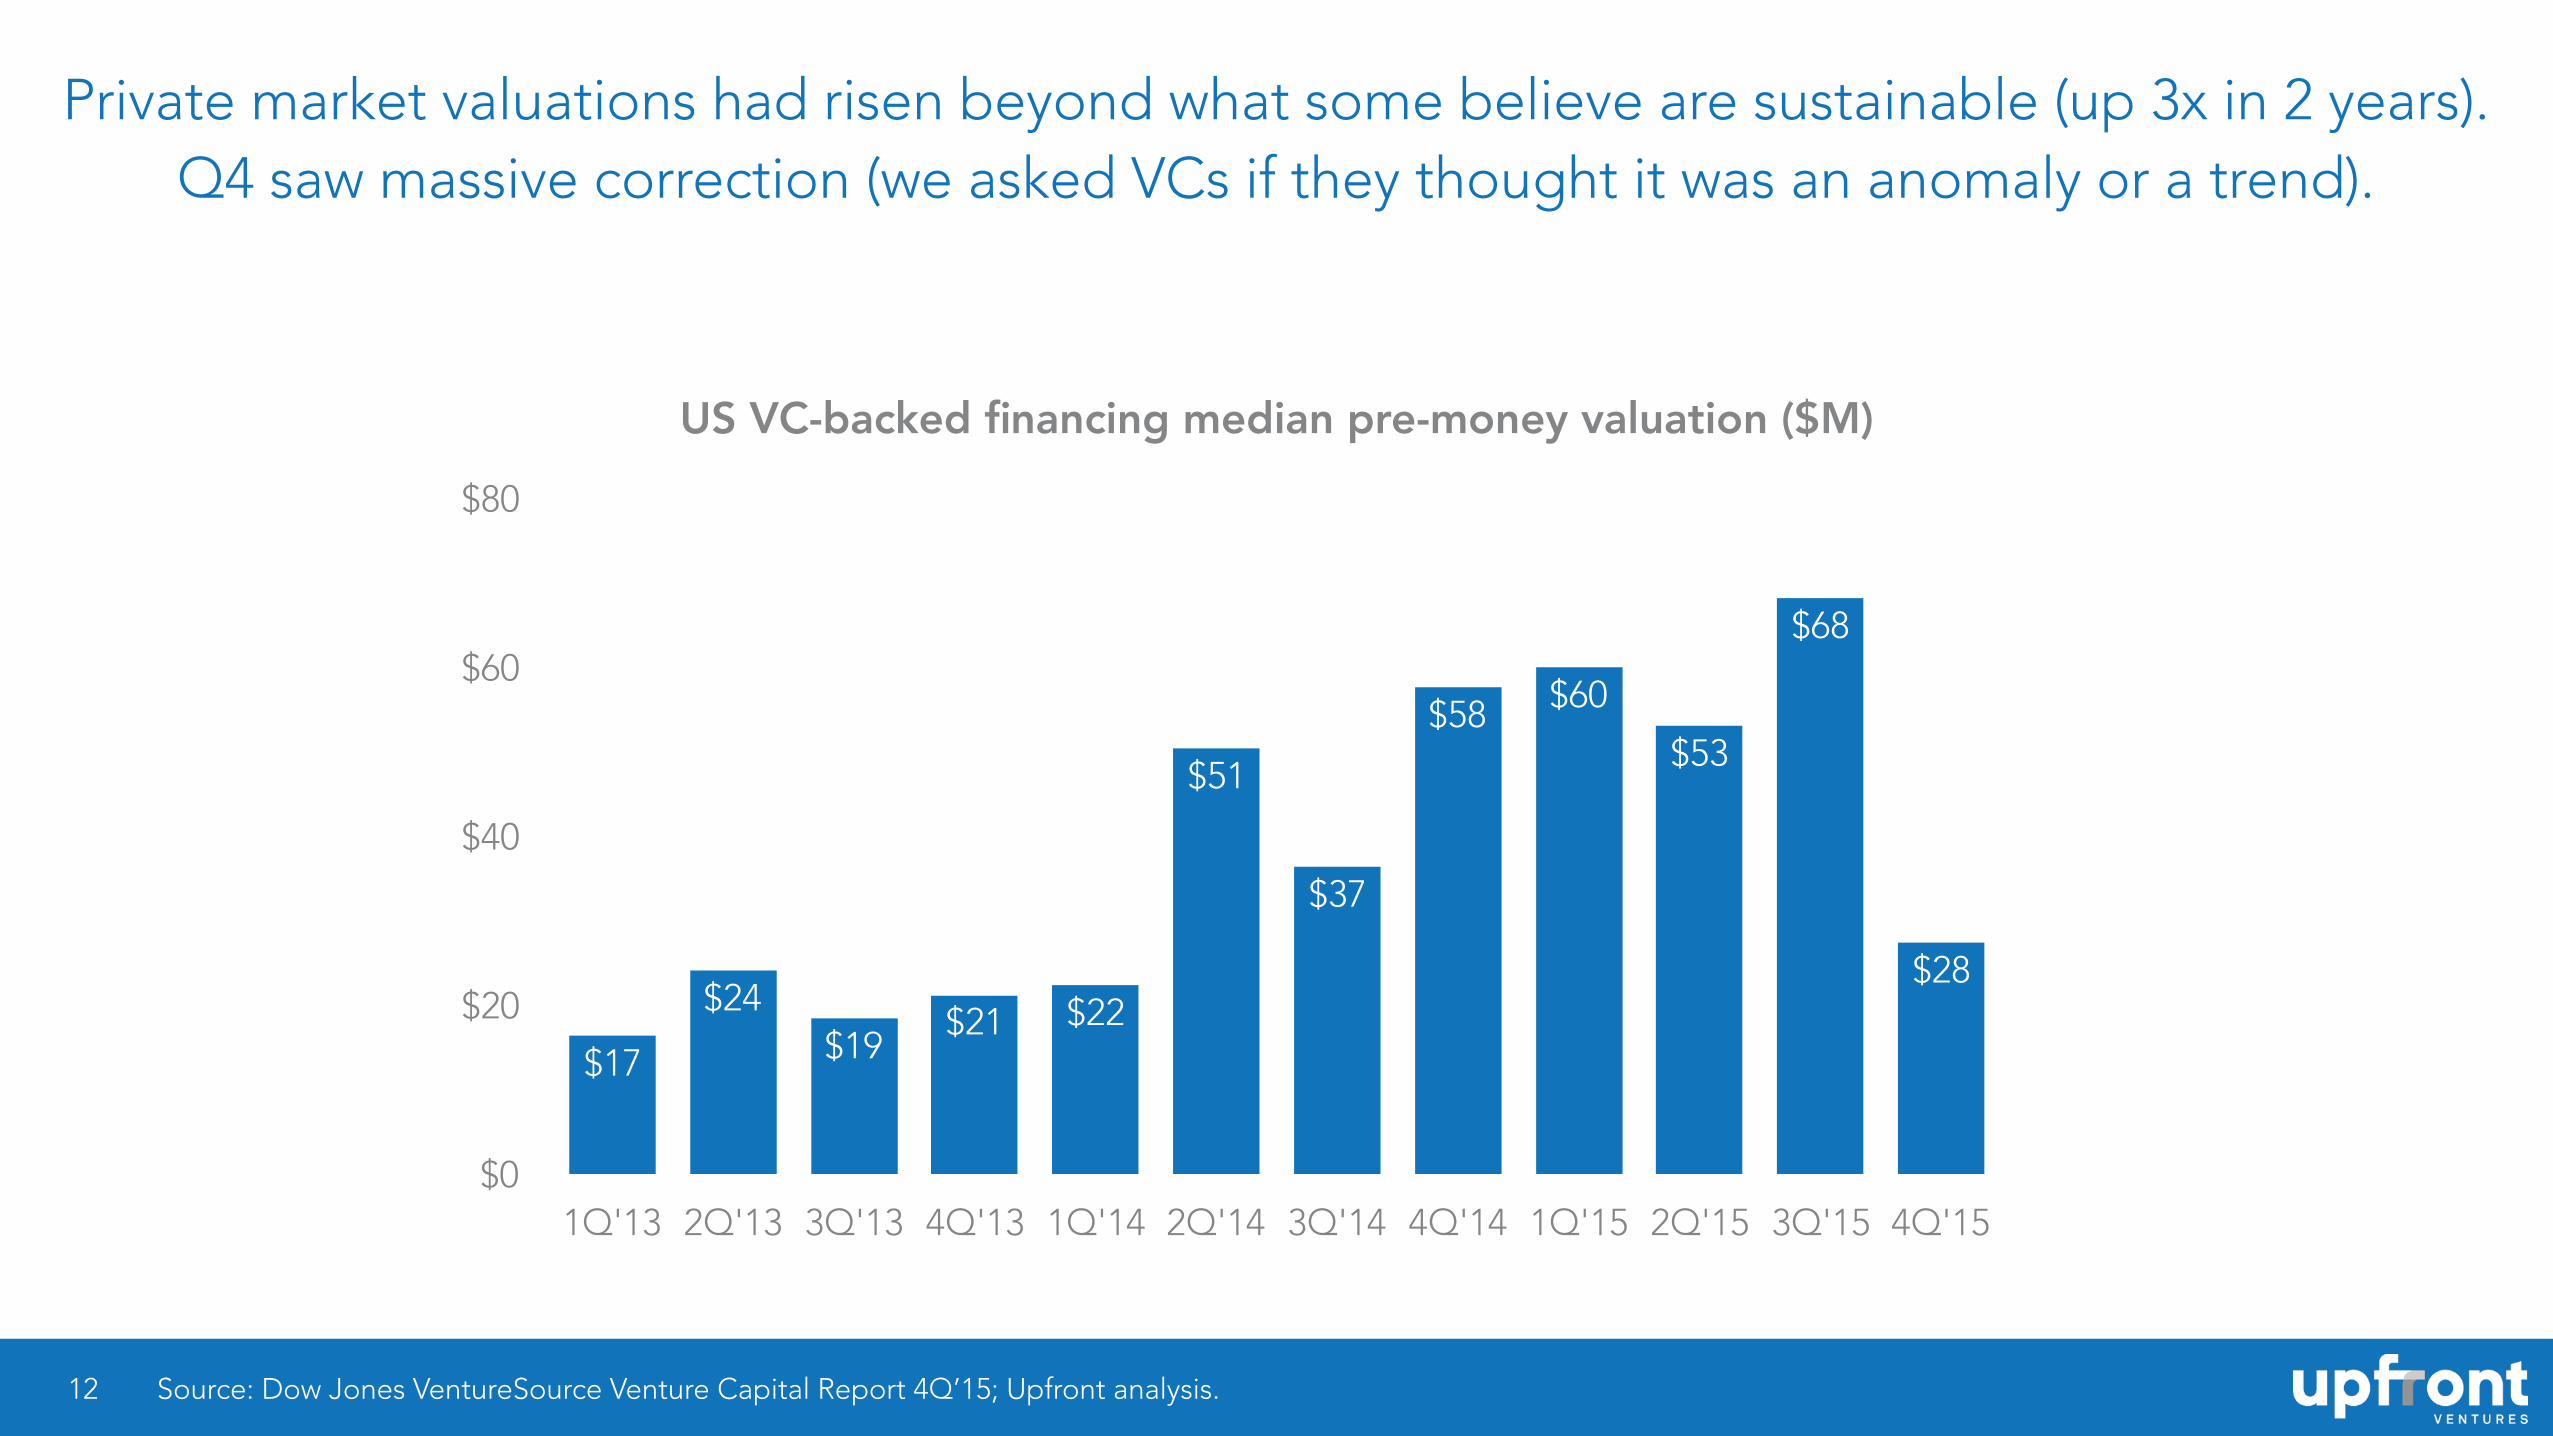
Private market valuations had risen beyond what some believe are sustainable (up 3x in 2 years). Q4 saw massive correction (we asked VCs if they thought it was an anomaly or a trend).
12
US VC-backed financing median pre-money valuation ($M)
$0
$20
$40
$60
$80
1Q'13 2Q'13 3Q'13 4Q'13 1Q'14 2Q'14 3Q'14 4Q'14 1Q'15 2Q'15 3Q'15 4Q'15
$28
$68
$53
$60$58
$37
$51
$22$21$19
$24
$17
Source: Dow Jones VentureSource Venture Capital Report 4Q’15; Upfront analysis.
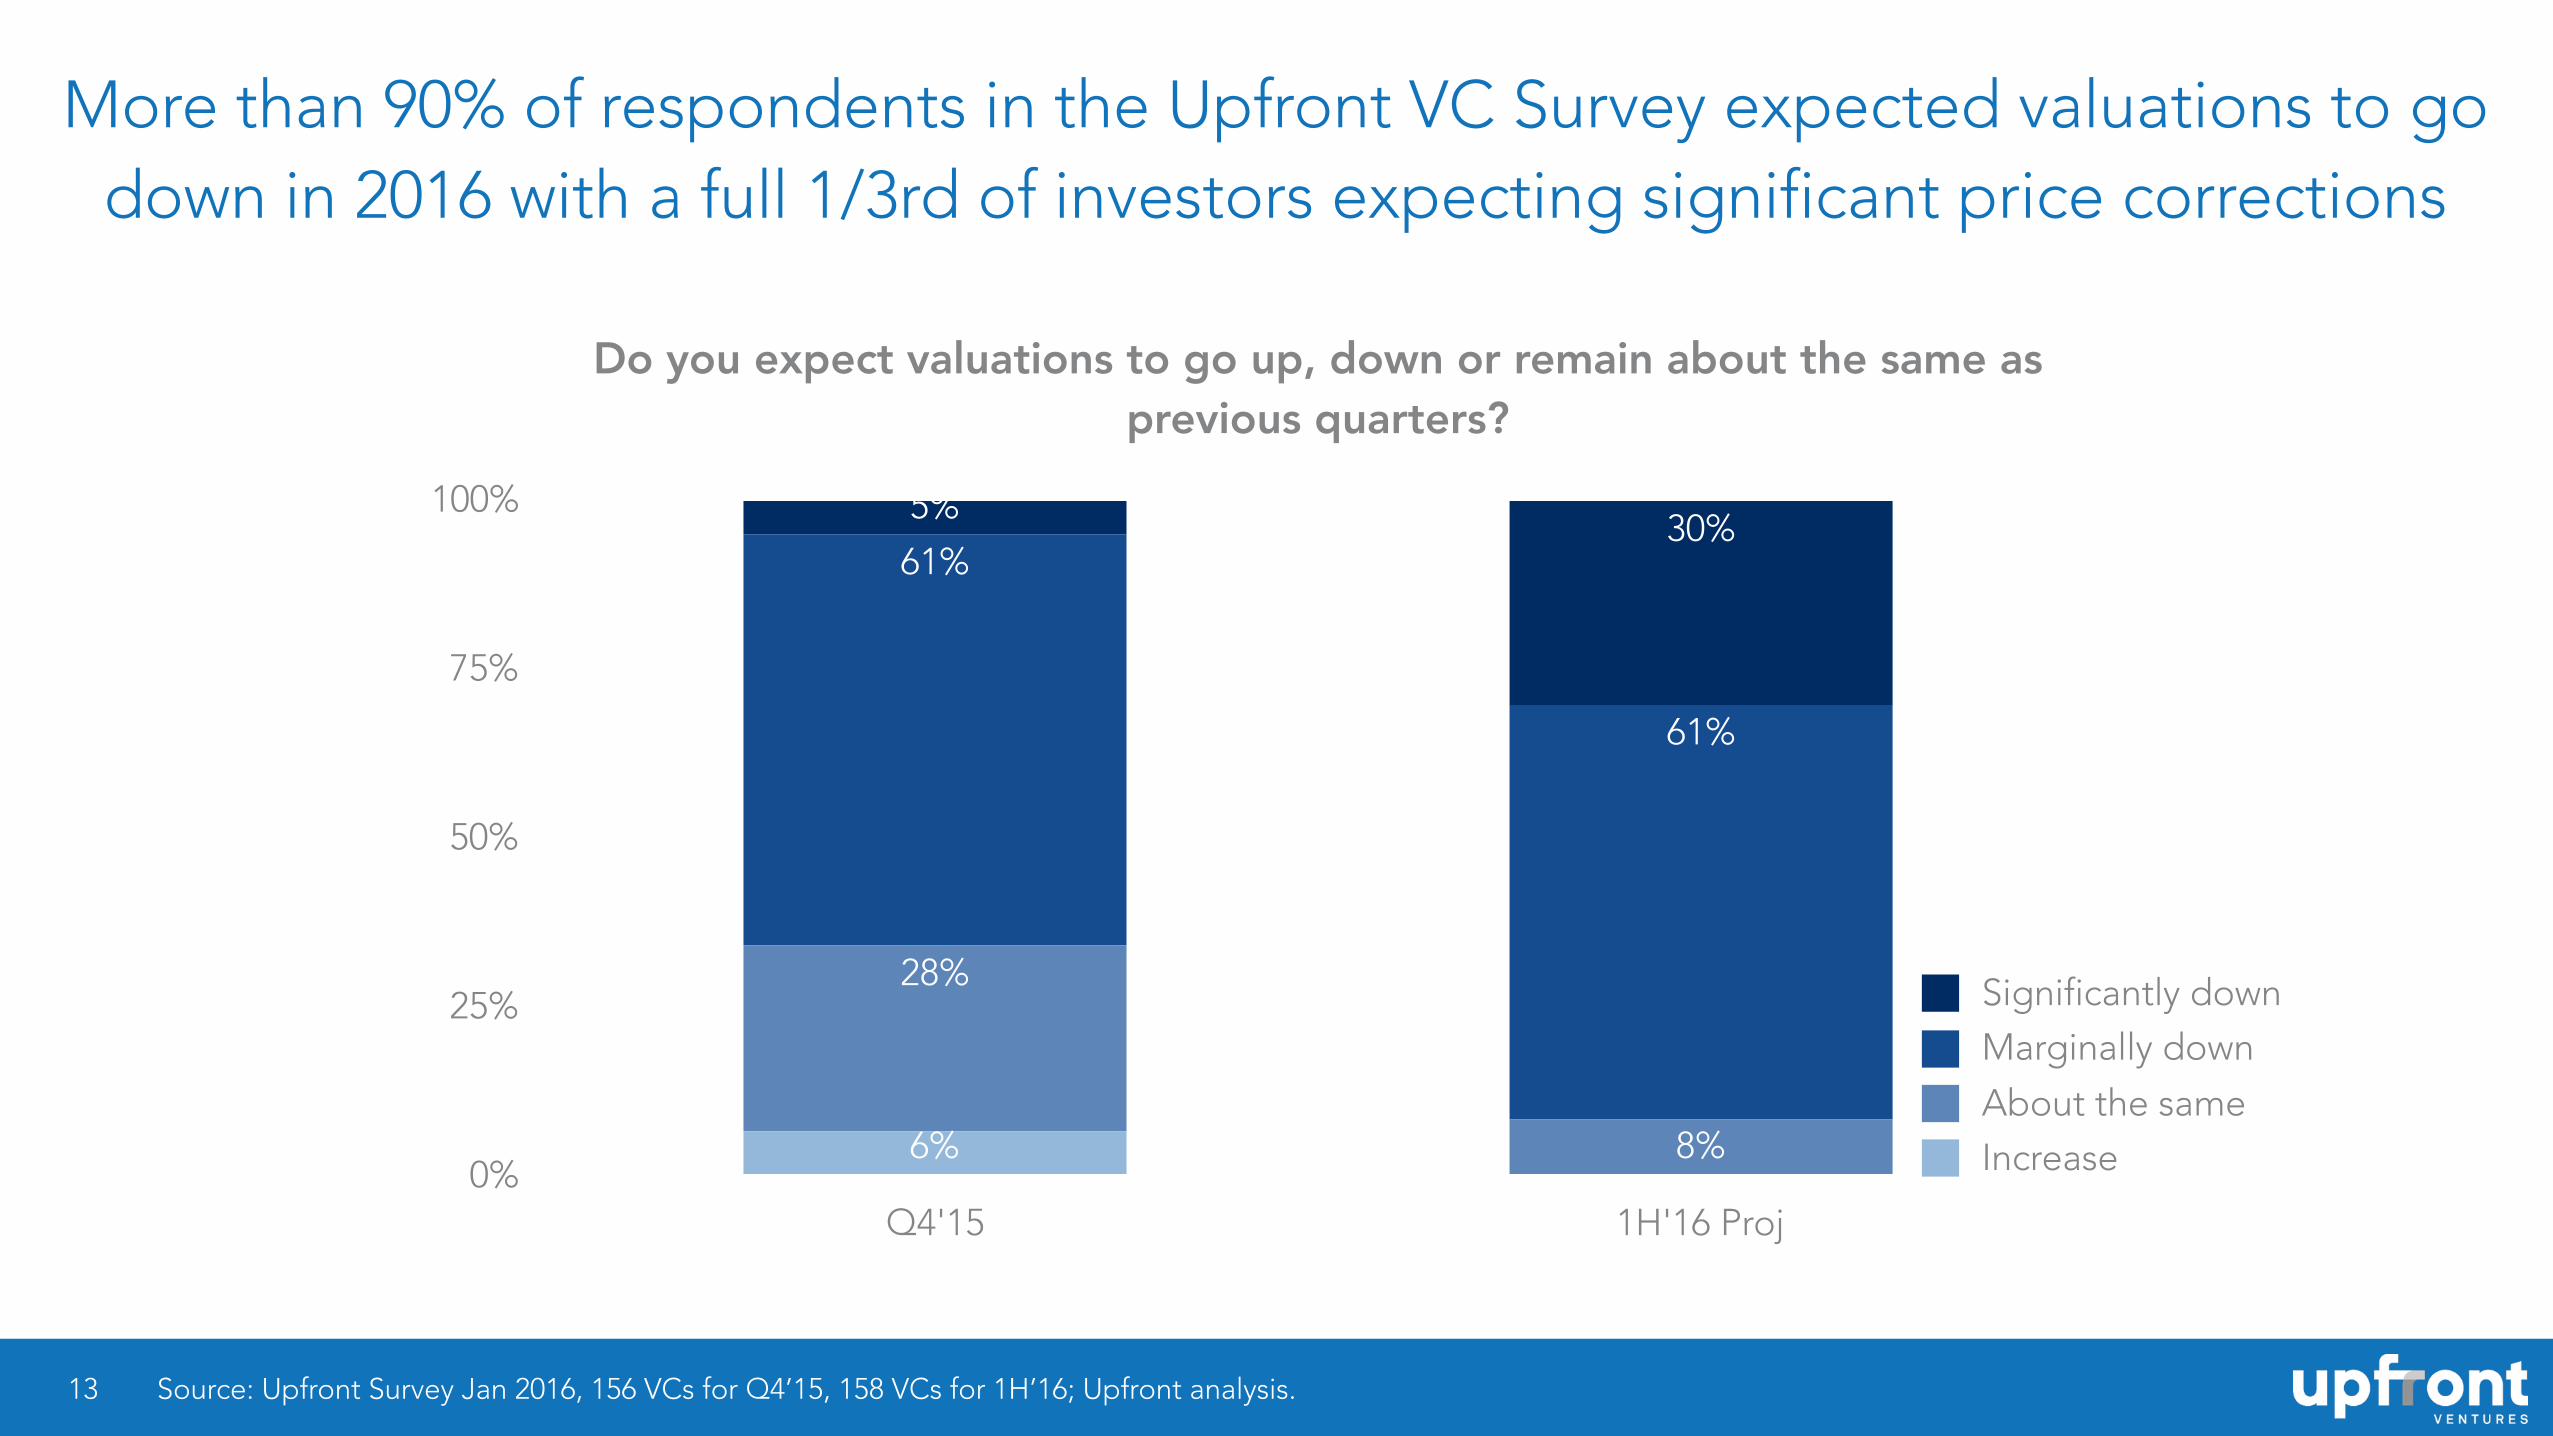
More than 90% of respondents in the Upfront VC Survey expected valuations to go down in 2016 with a full 1/3rd of investors expecting significant price corrections
13
Do you expect valuations to go up, down or remain about the same as previous quarters?
0%
25%
50%
75%
100%
Q4'15 1H'16 Proj
30%5%
61%
61%
8%
28%
6% IncreaseAbout the same
Marginally downSignificantly down
Source: Upfront Survey Jan 2016, 156 VCs for Q4’15, 158 VCs for 1H’16; Upfront analysis.
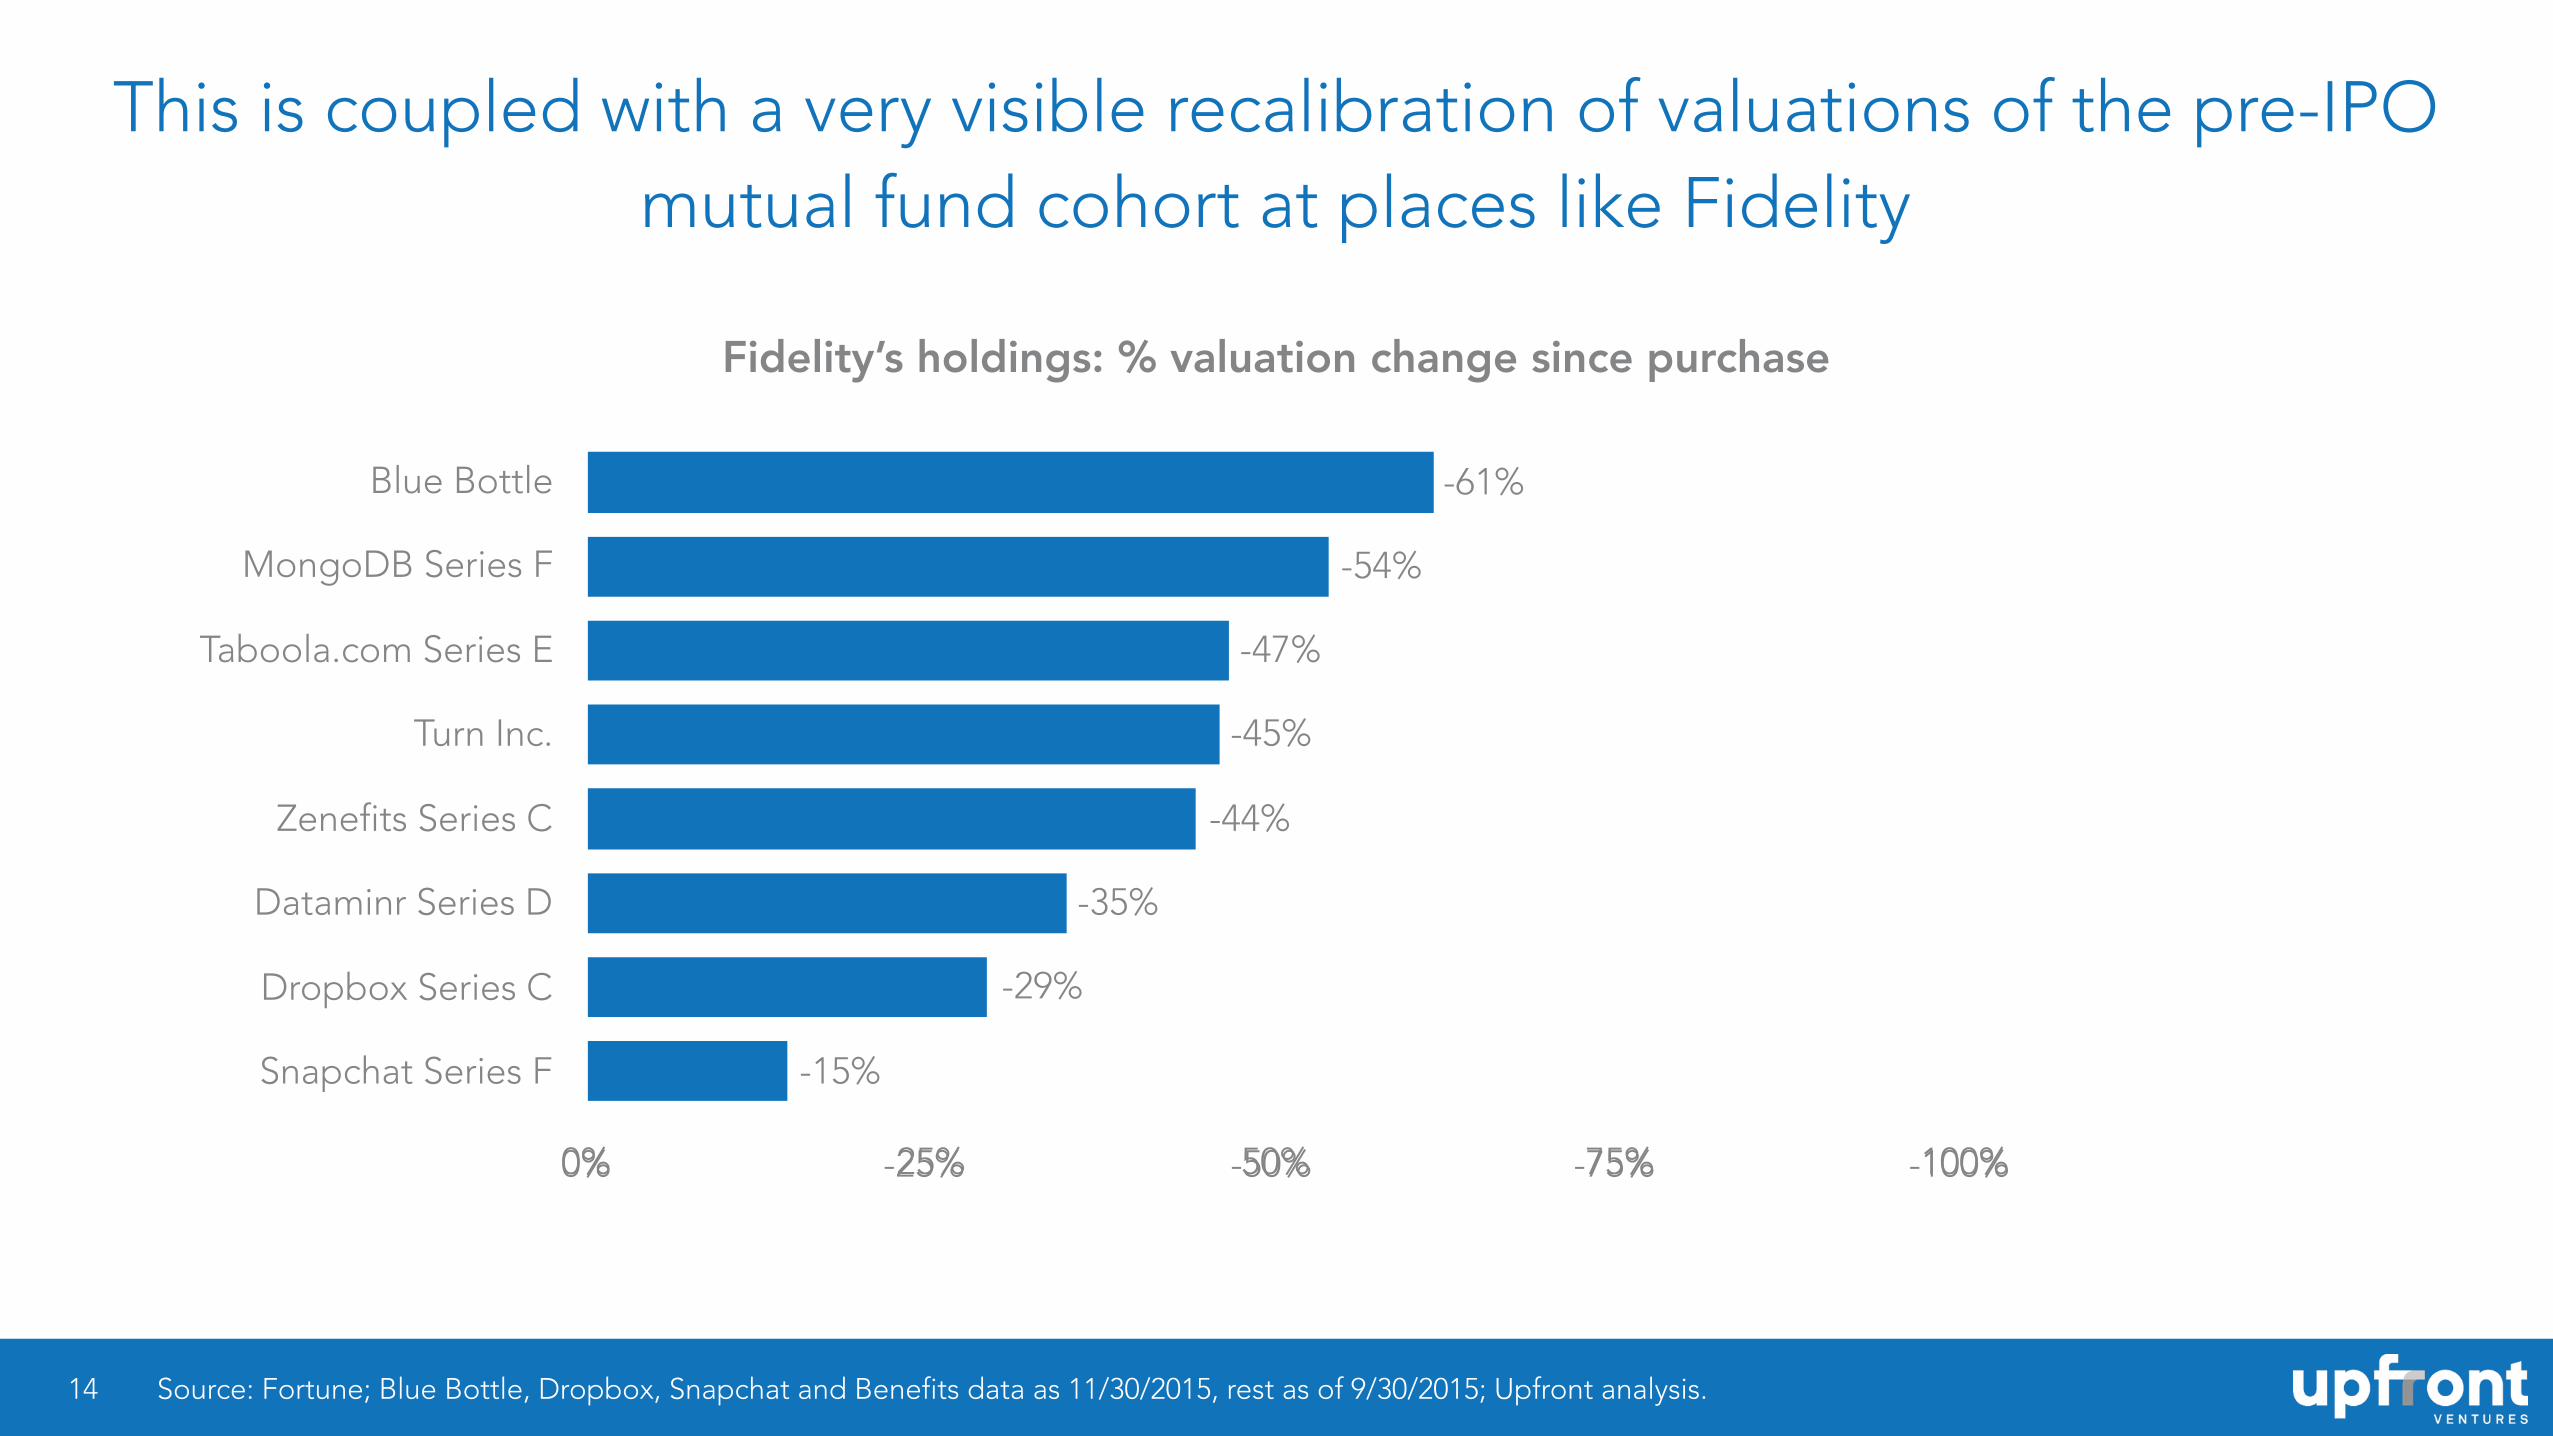
This is coupled with a very visible recalibration of valuations of the pre-IPO mutual fund cohort at places like Fidelity
14
Fidelity’s holdings: % valuation change since purchase
Blue Bottle
MongoDB Series F
Taboola.com Series E
Turn Inc.
Zenefits Series C
Dataminr Series D
Dropbox Series C
Snapchat Series F
0% 25% 50% 75% 100%
Source: Fortune; Blue Bottle, Dropbox, Snapchat and Benefits data as 11/30/2015, rest as of 9/30/2015; Upfront analysis.
0% -25% -50% -75% -100%
-61%
-54%
-45%
-44%
-35%
-29%
-15%
-47%
15
This has swung sentiment for many experienced VC firms firmly toward controlling burn over rapid growth
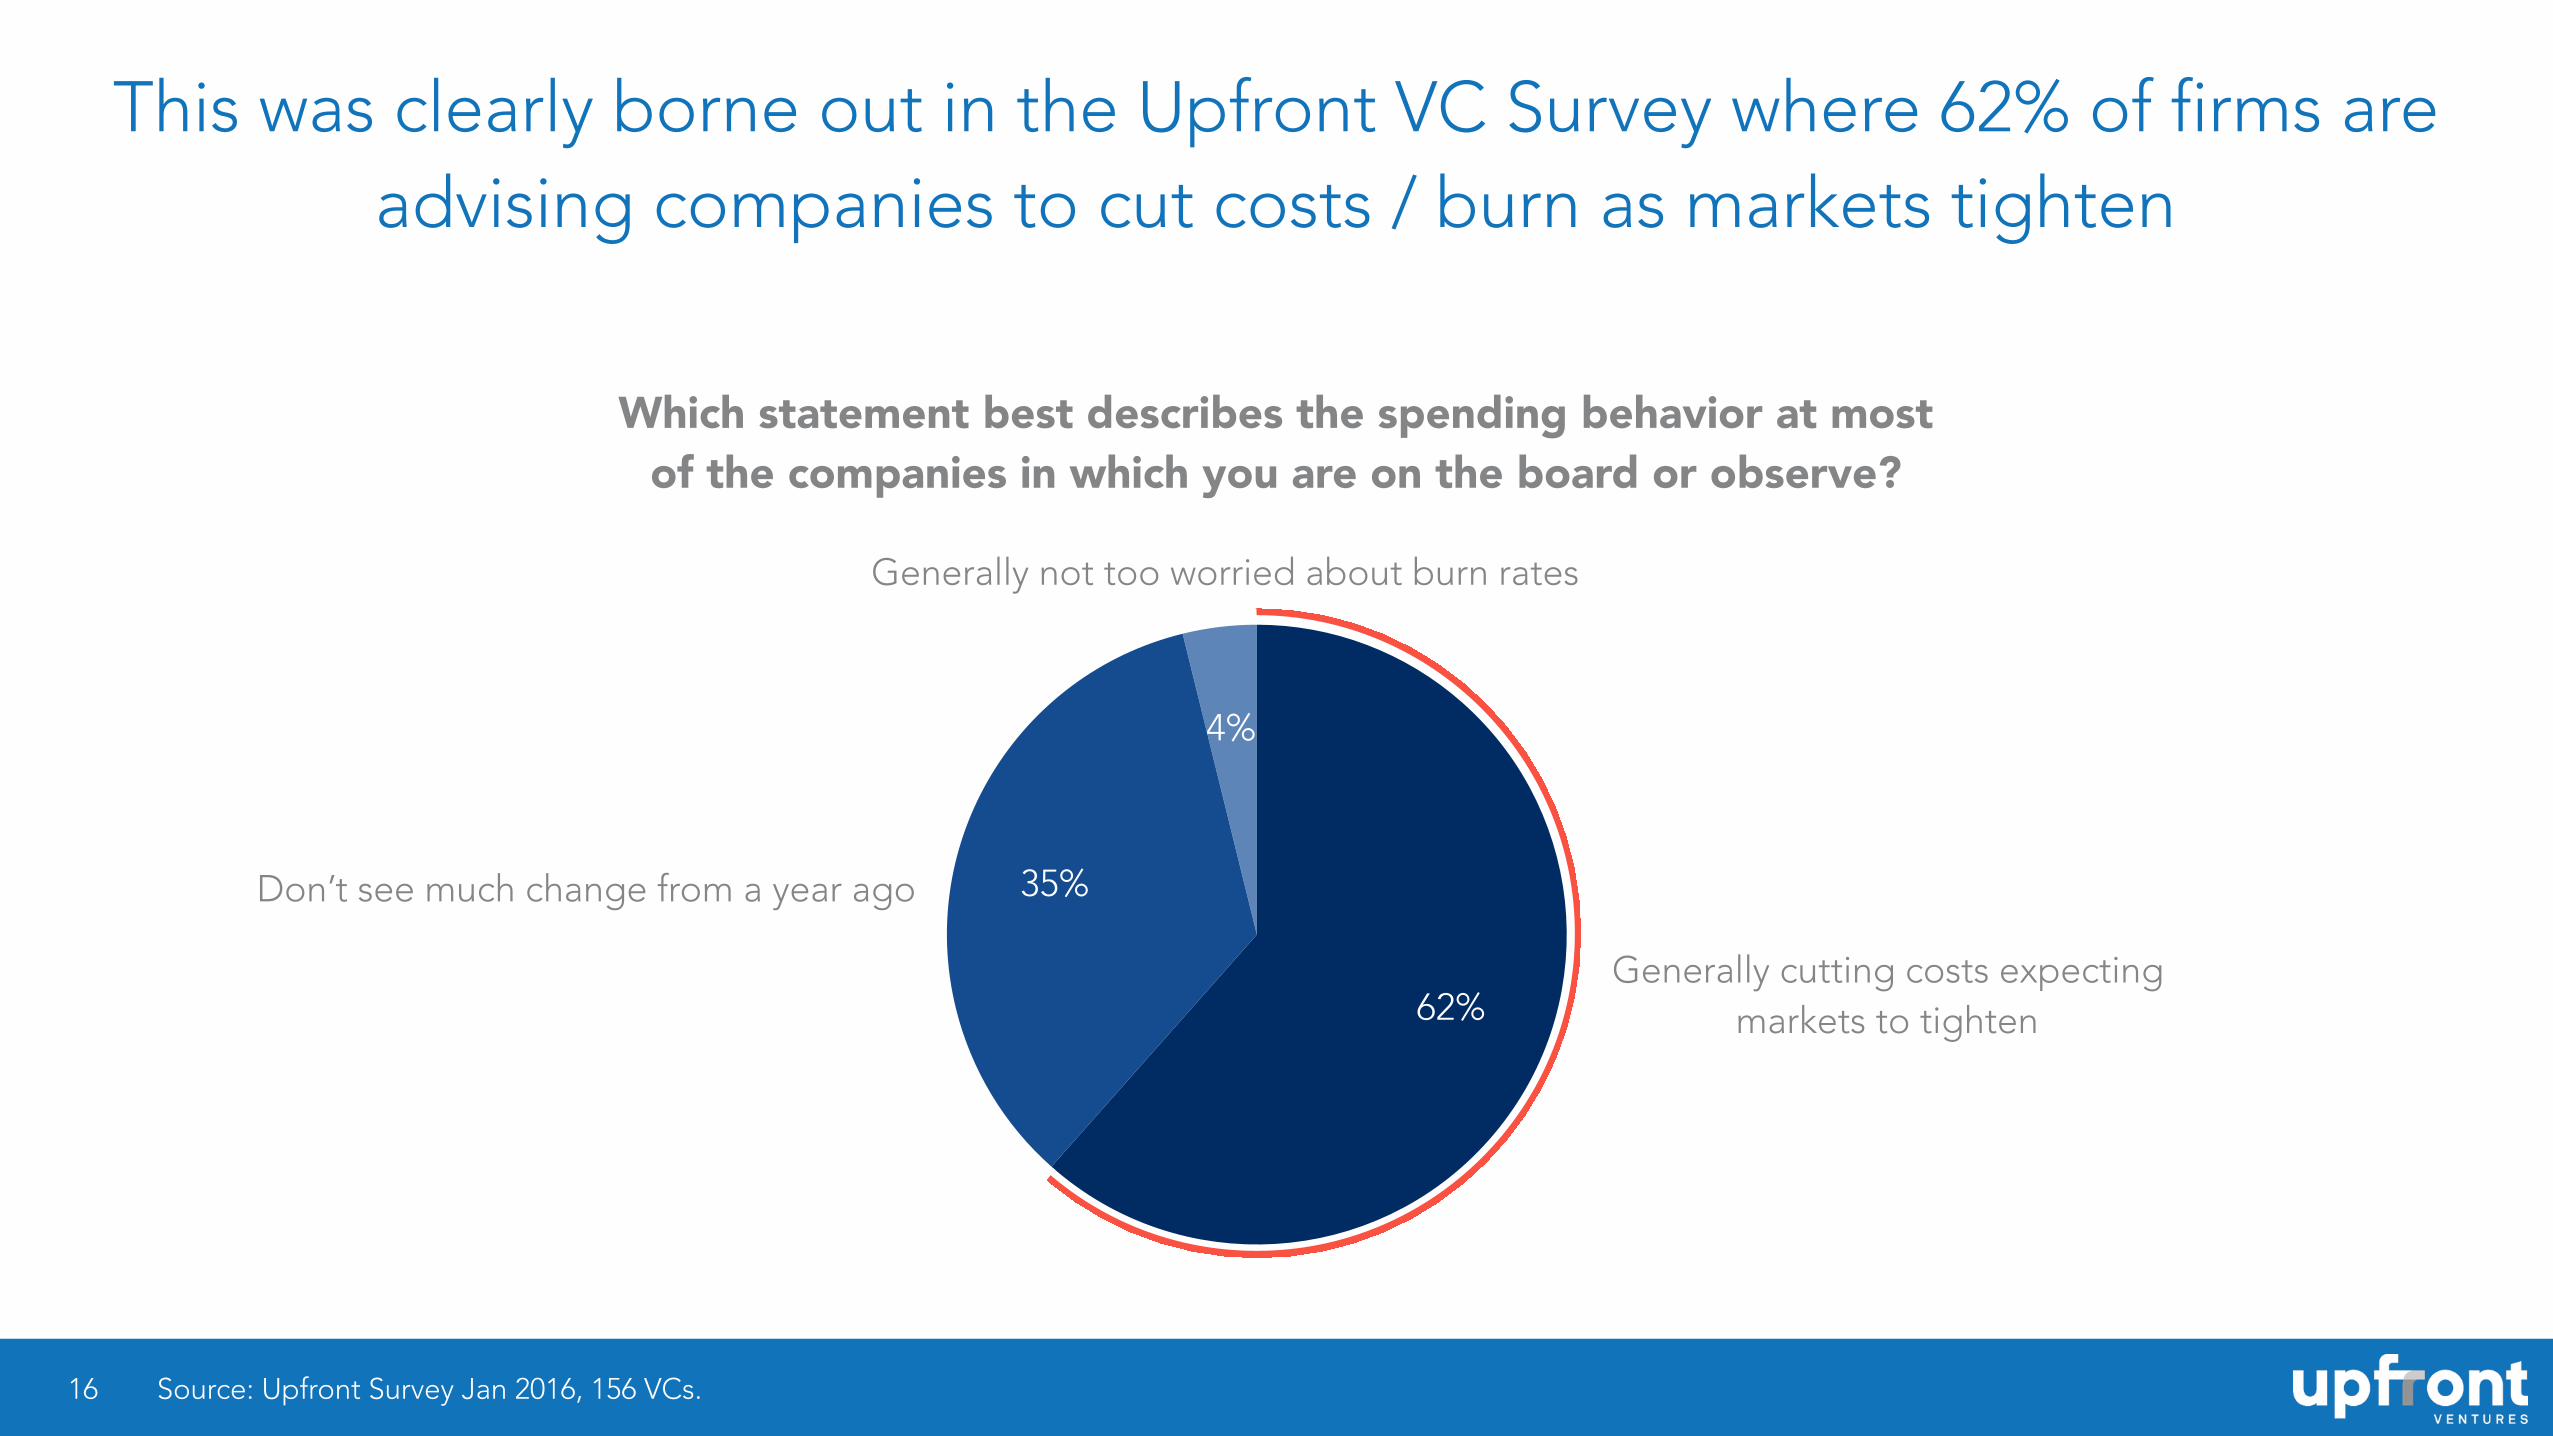
This was clearly borne out in the Upfront VC Survey where 62% of firms are advising companies to cut costs / burn as markets tighten
16
4%
35%
62%
Source: Upfront Survey Jan 2016, 156 VCs.
Which statement best describes the spending behavior at most of the companies in which you are on the board or observe?
Generally cutting costs expecting markets to tighten
Don’t see much change from a year ago
Generally not too worried about burn rates

17
“Winter is Coming” message
received by portfolio
companies
18
“Winter is Coming” message
received by portfolio
companies
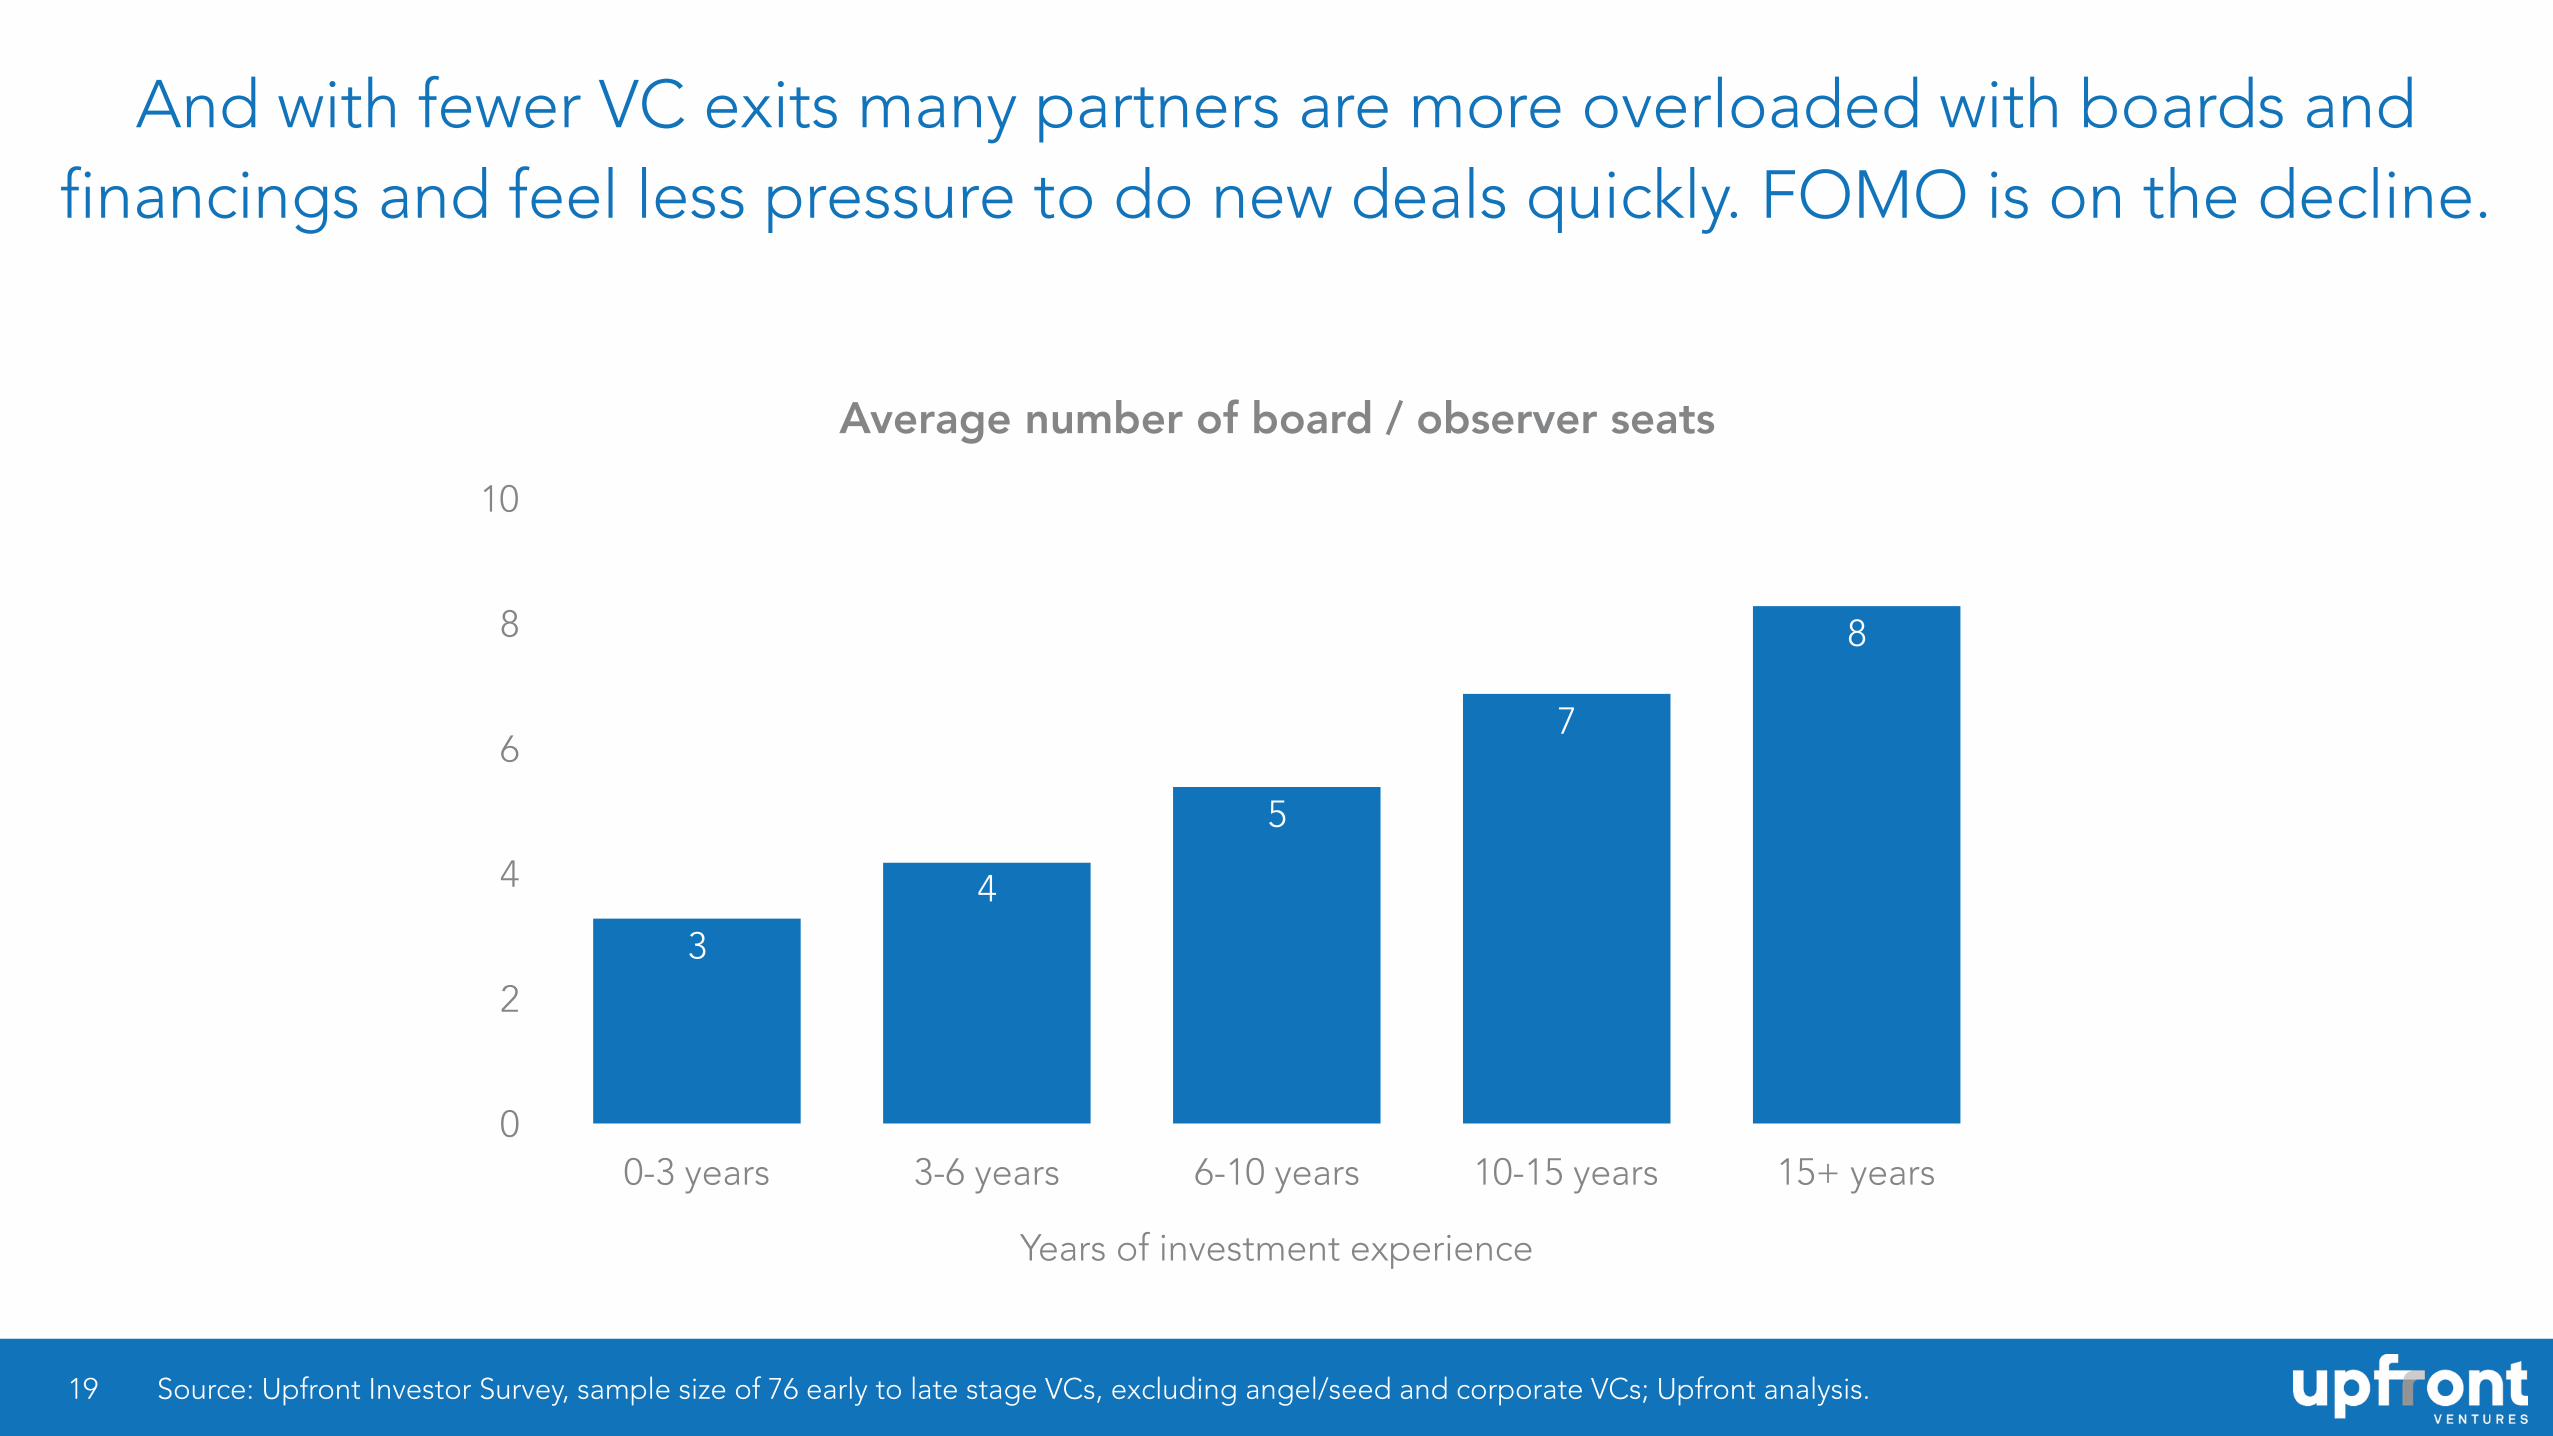
And with fewer VC exits many partners are more overloaded with boards and financings and feel less pressure to do new deals quickly. FOMO is on the decline.
19
Average number of board / observer seats
0
2
4
6
8
10
Years of investment experience
0-3 years 3-6 years 6-10 years 10-15 years 15+ years
8
7
5
4
3
Source: Upfront Investor Survey, sample size of 76 early to late stage VCs, excluding angel/seed and corporate VCs; Upfront analysis.

There is a clear feeling that fund raising cycles are taking longer and 77% felt this pace is likely to slow down even further in 2016
20
Do you expect deals to take longer in the process than previous funding quarters, the same or shorter?
0%
25%
50%
75%
100%
Q4'15 1H'16 Proj
77%45%
22%
51%
1%4% Shorter than normal
About the same as normalGetting longer
Source: Upfront Survey Jan 2016, 159 VCs for Q4’15 and 158 VCs for 1H’16.
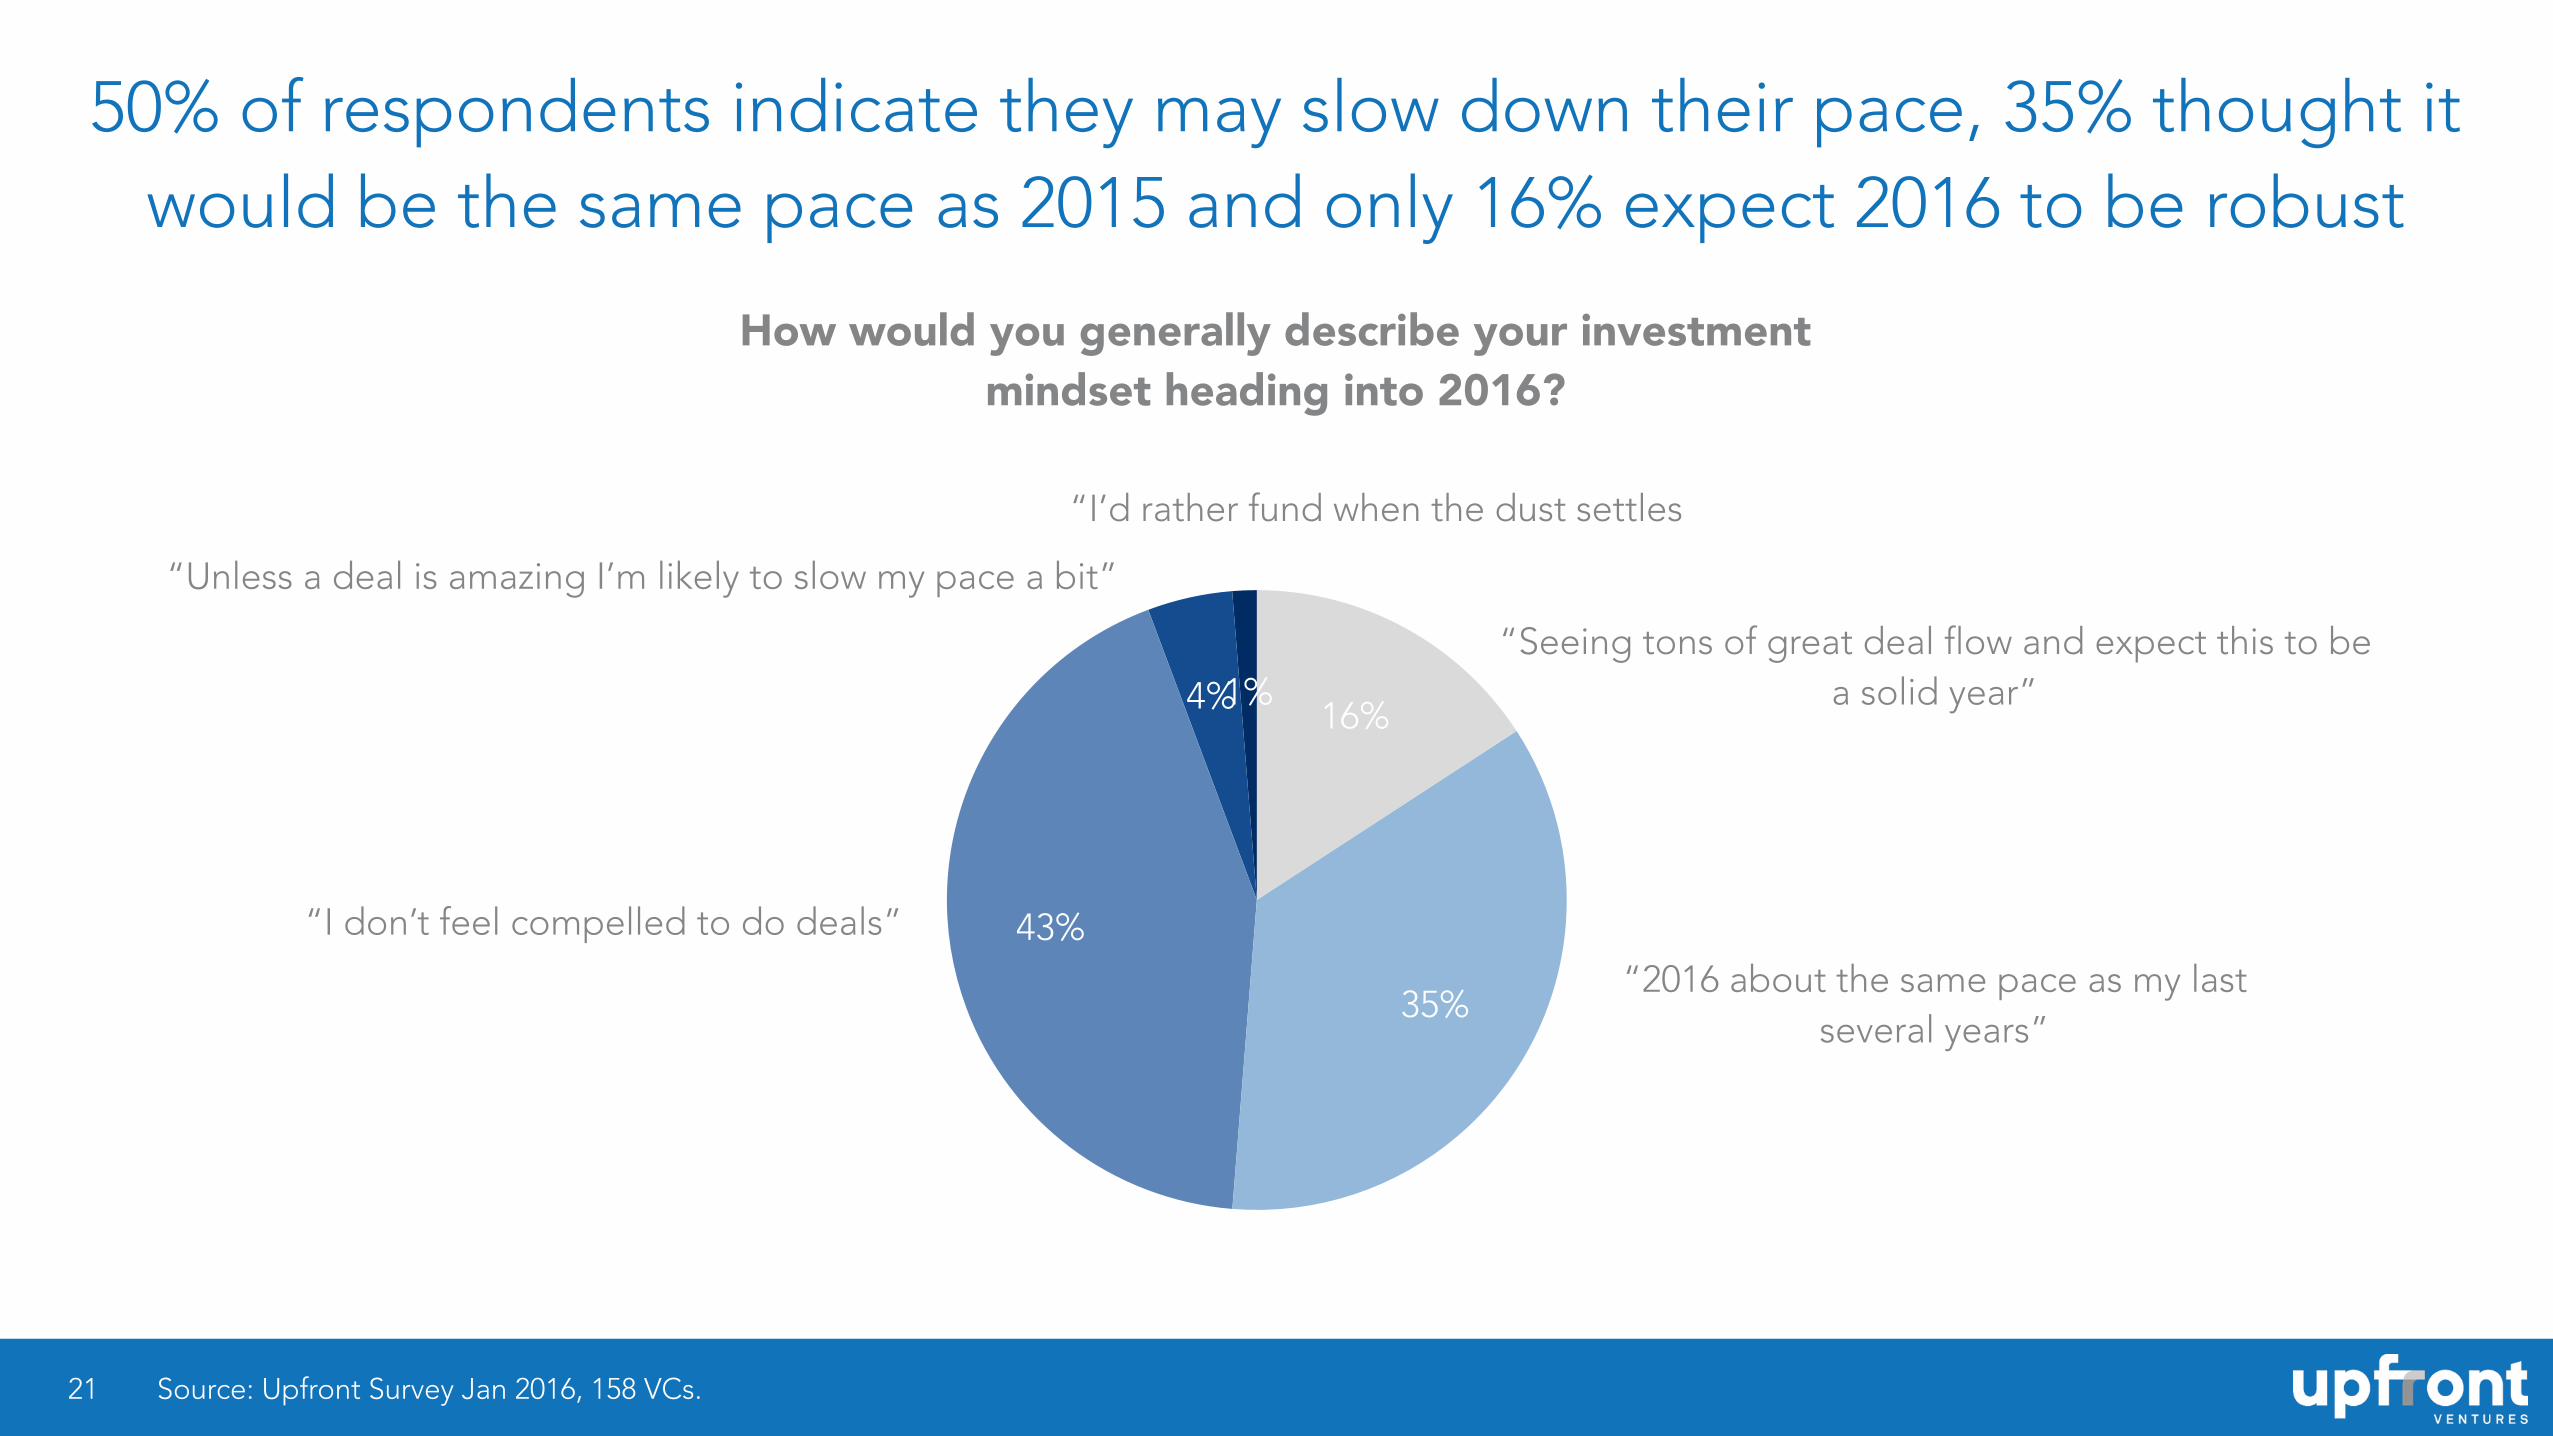
50% of respondents indicate they may slow down their pace, 35% thought it would be the same pace as 2015 and only 16% expect 2016 to be robust
21
1%4%
43%
35%
16%
Source: Upfront Survey Jan 2016, 158 VCs.
How would you generally describe your investment mindset heading into 2016?
“Seeing tons of great deal flow and expect this to be a solid year”
“Unless a deal is amazing I’m likely to slow my pace a bit”
“I don’t feel compelled to do deals”
“2016 about the same pace as my last several years”
“I’d rather fund when the dust settles
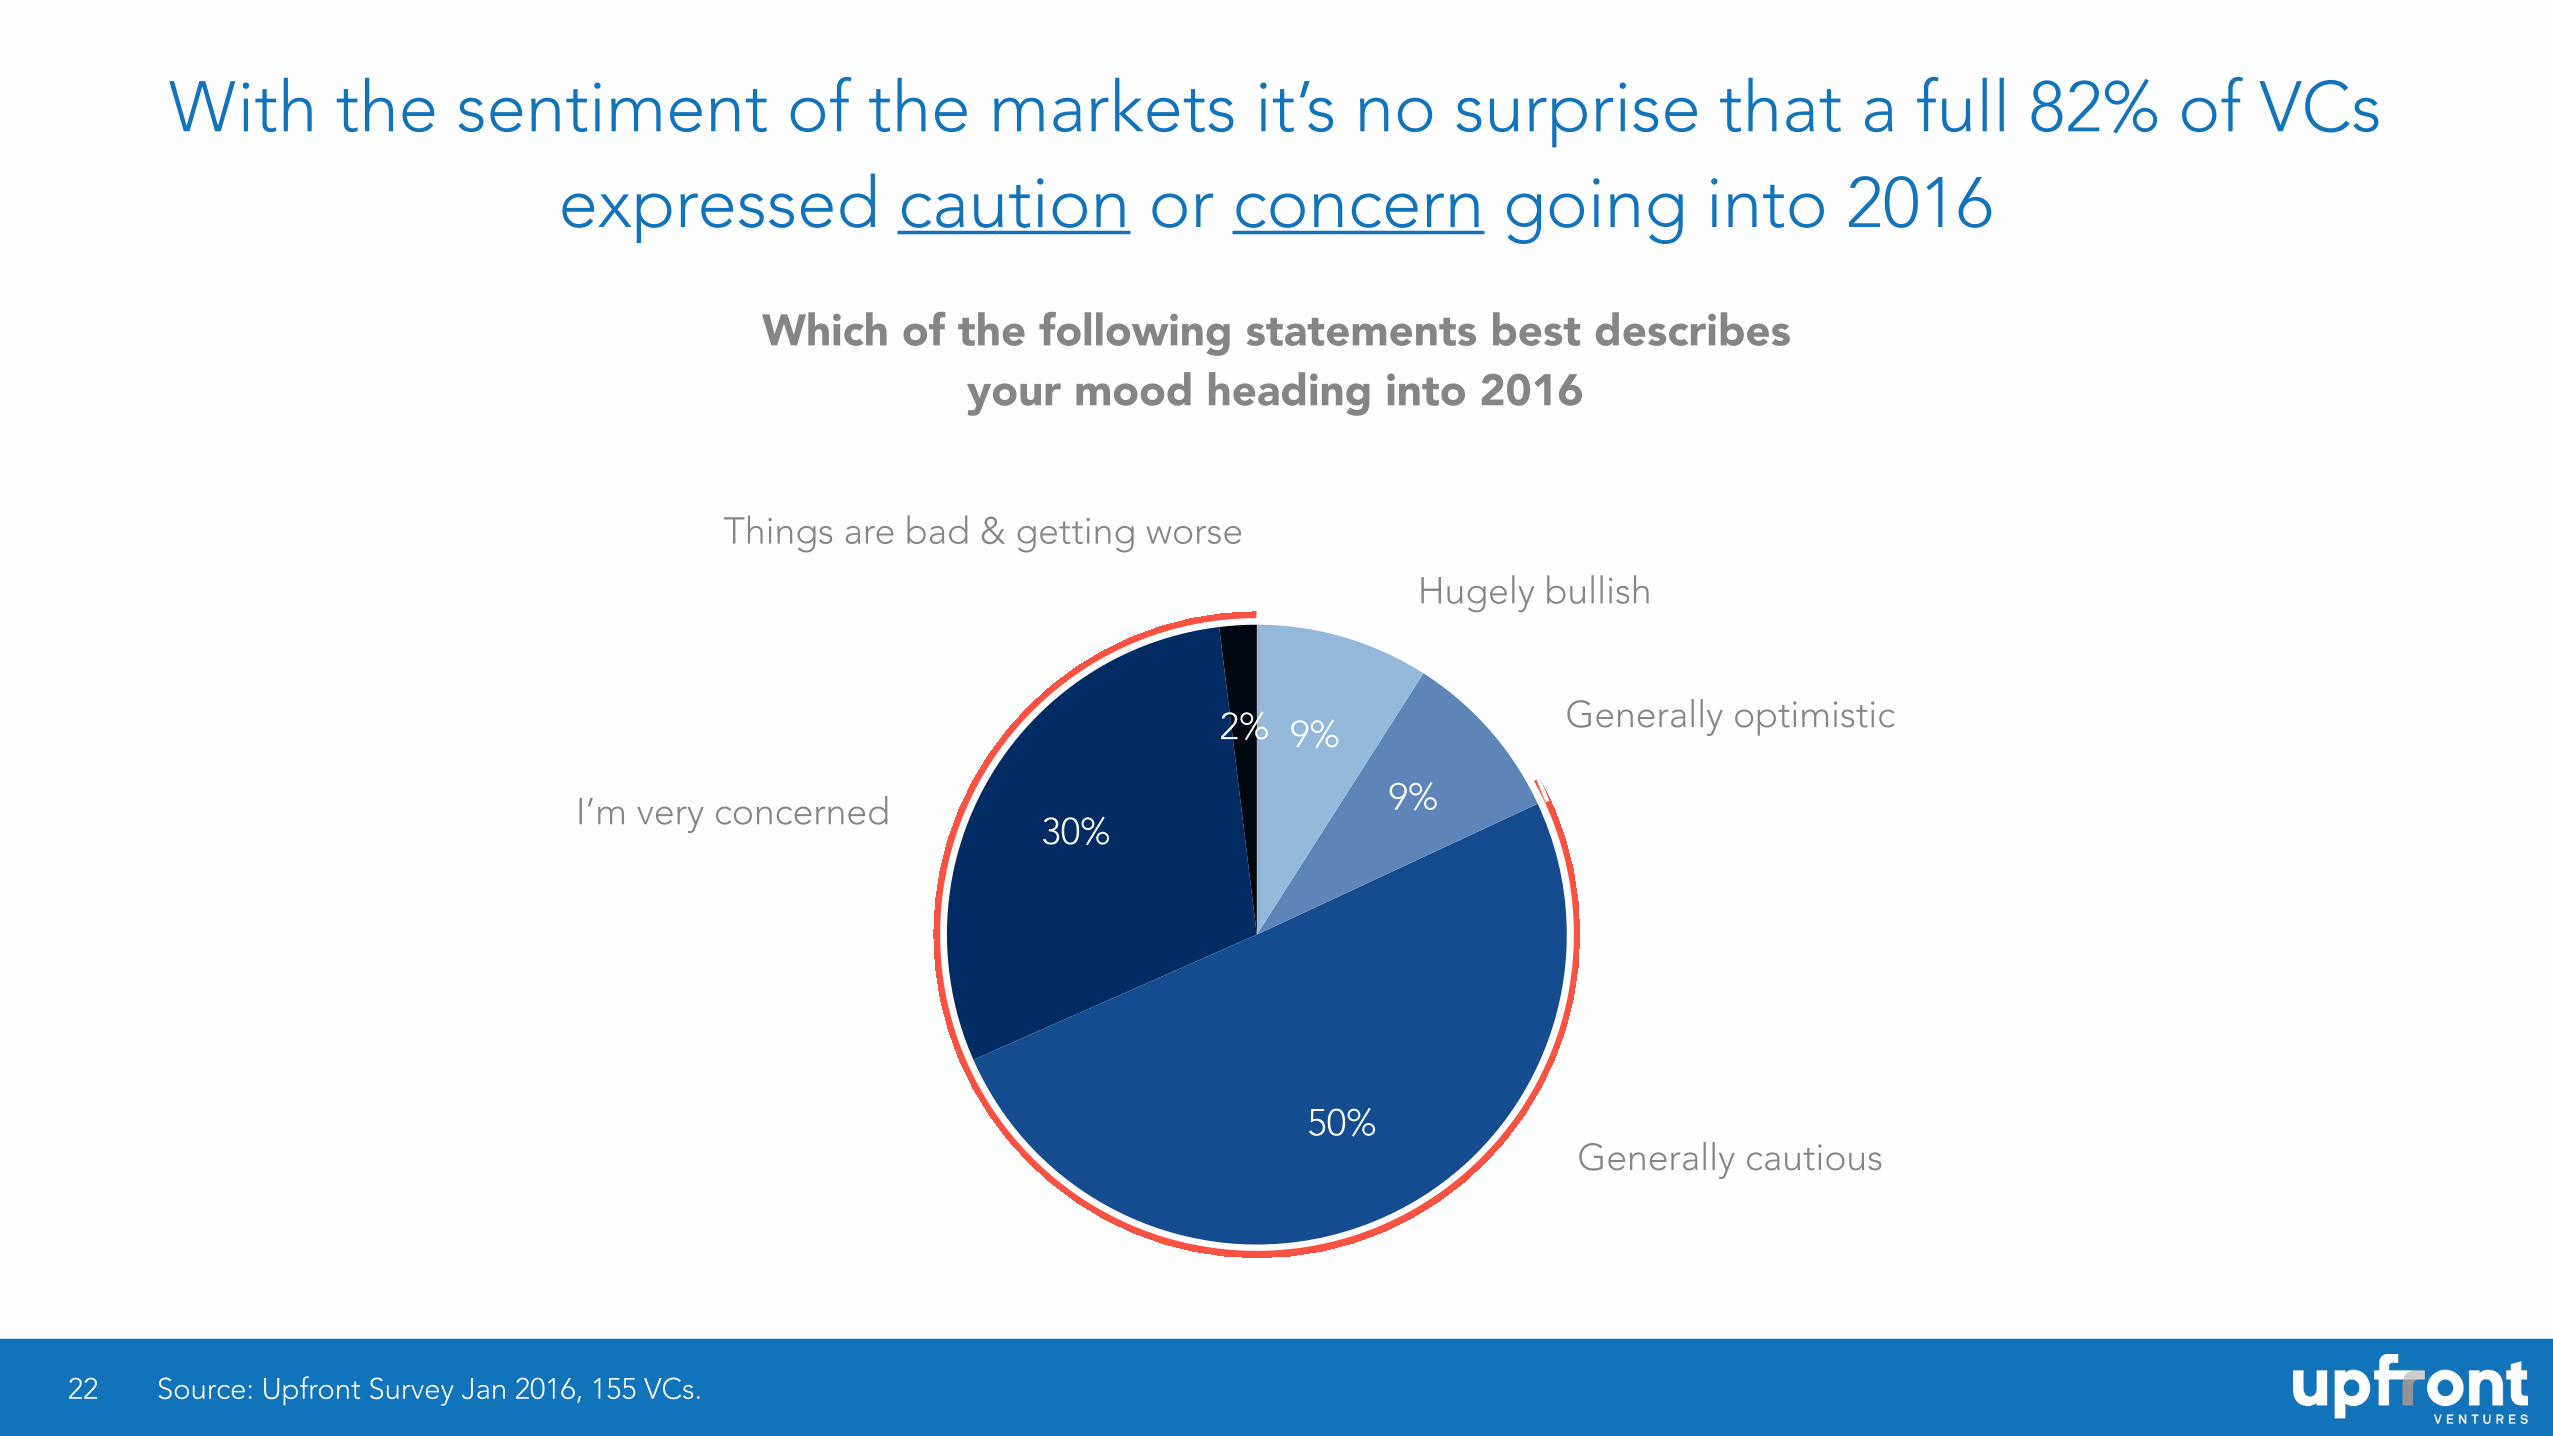
With the sentiment of the markets it’s no surprise that a full 82% of VCs expressed caution or concern going into 2016
22
2%
30%
50%
9%
9%
Source: Upfront Survey Jan 2016, 155 VCs.
Hugely bullish
I’m very concerned
Things are bad & getting worse
Generally cautious
Generally optimistic
Which of the following statements best describes your mood heading into 2016
And how does the growth in funding, valuations and anxiety play in the minds of LPs who fund the VC
industry ultimately?
23
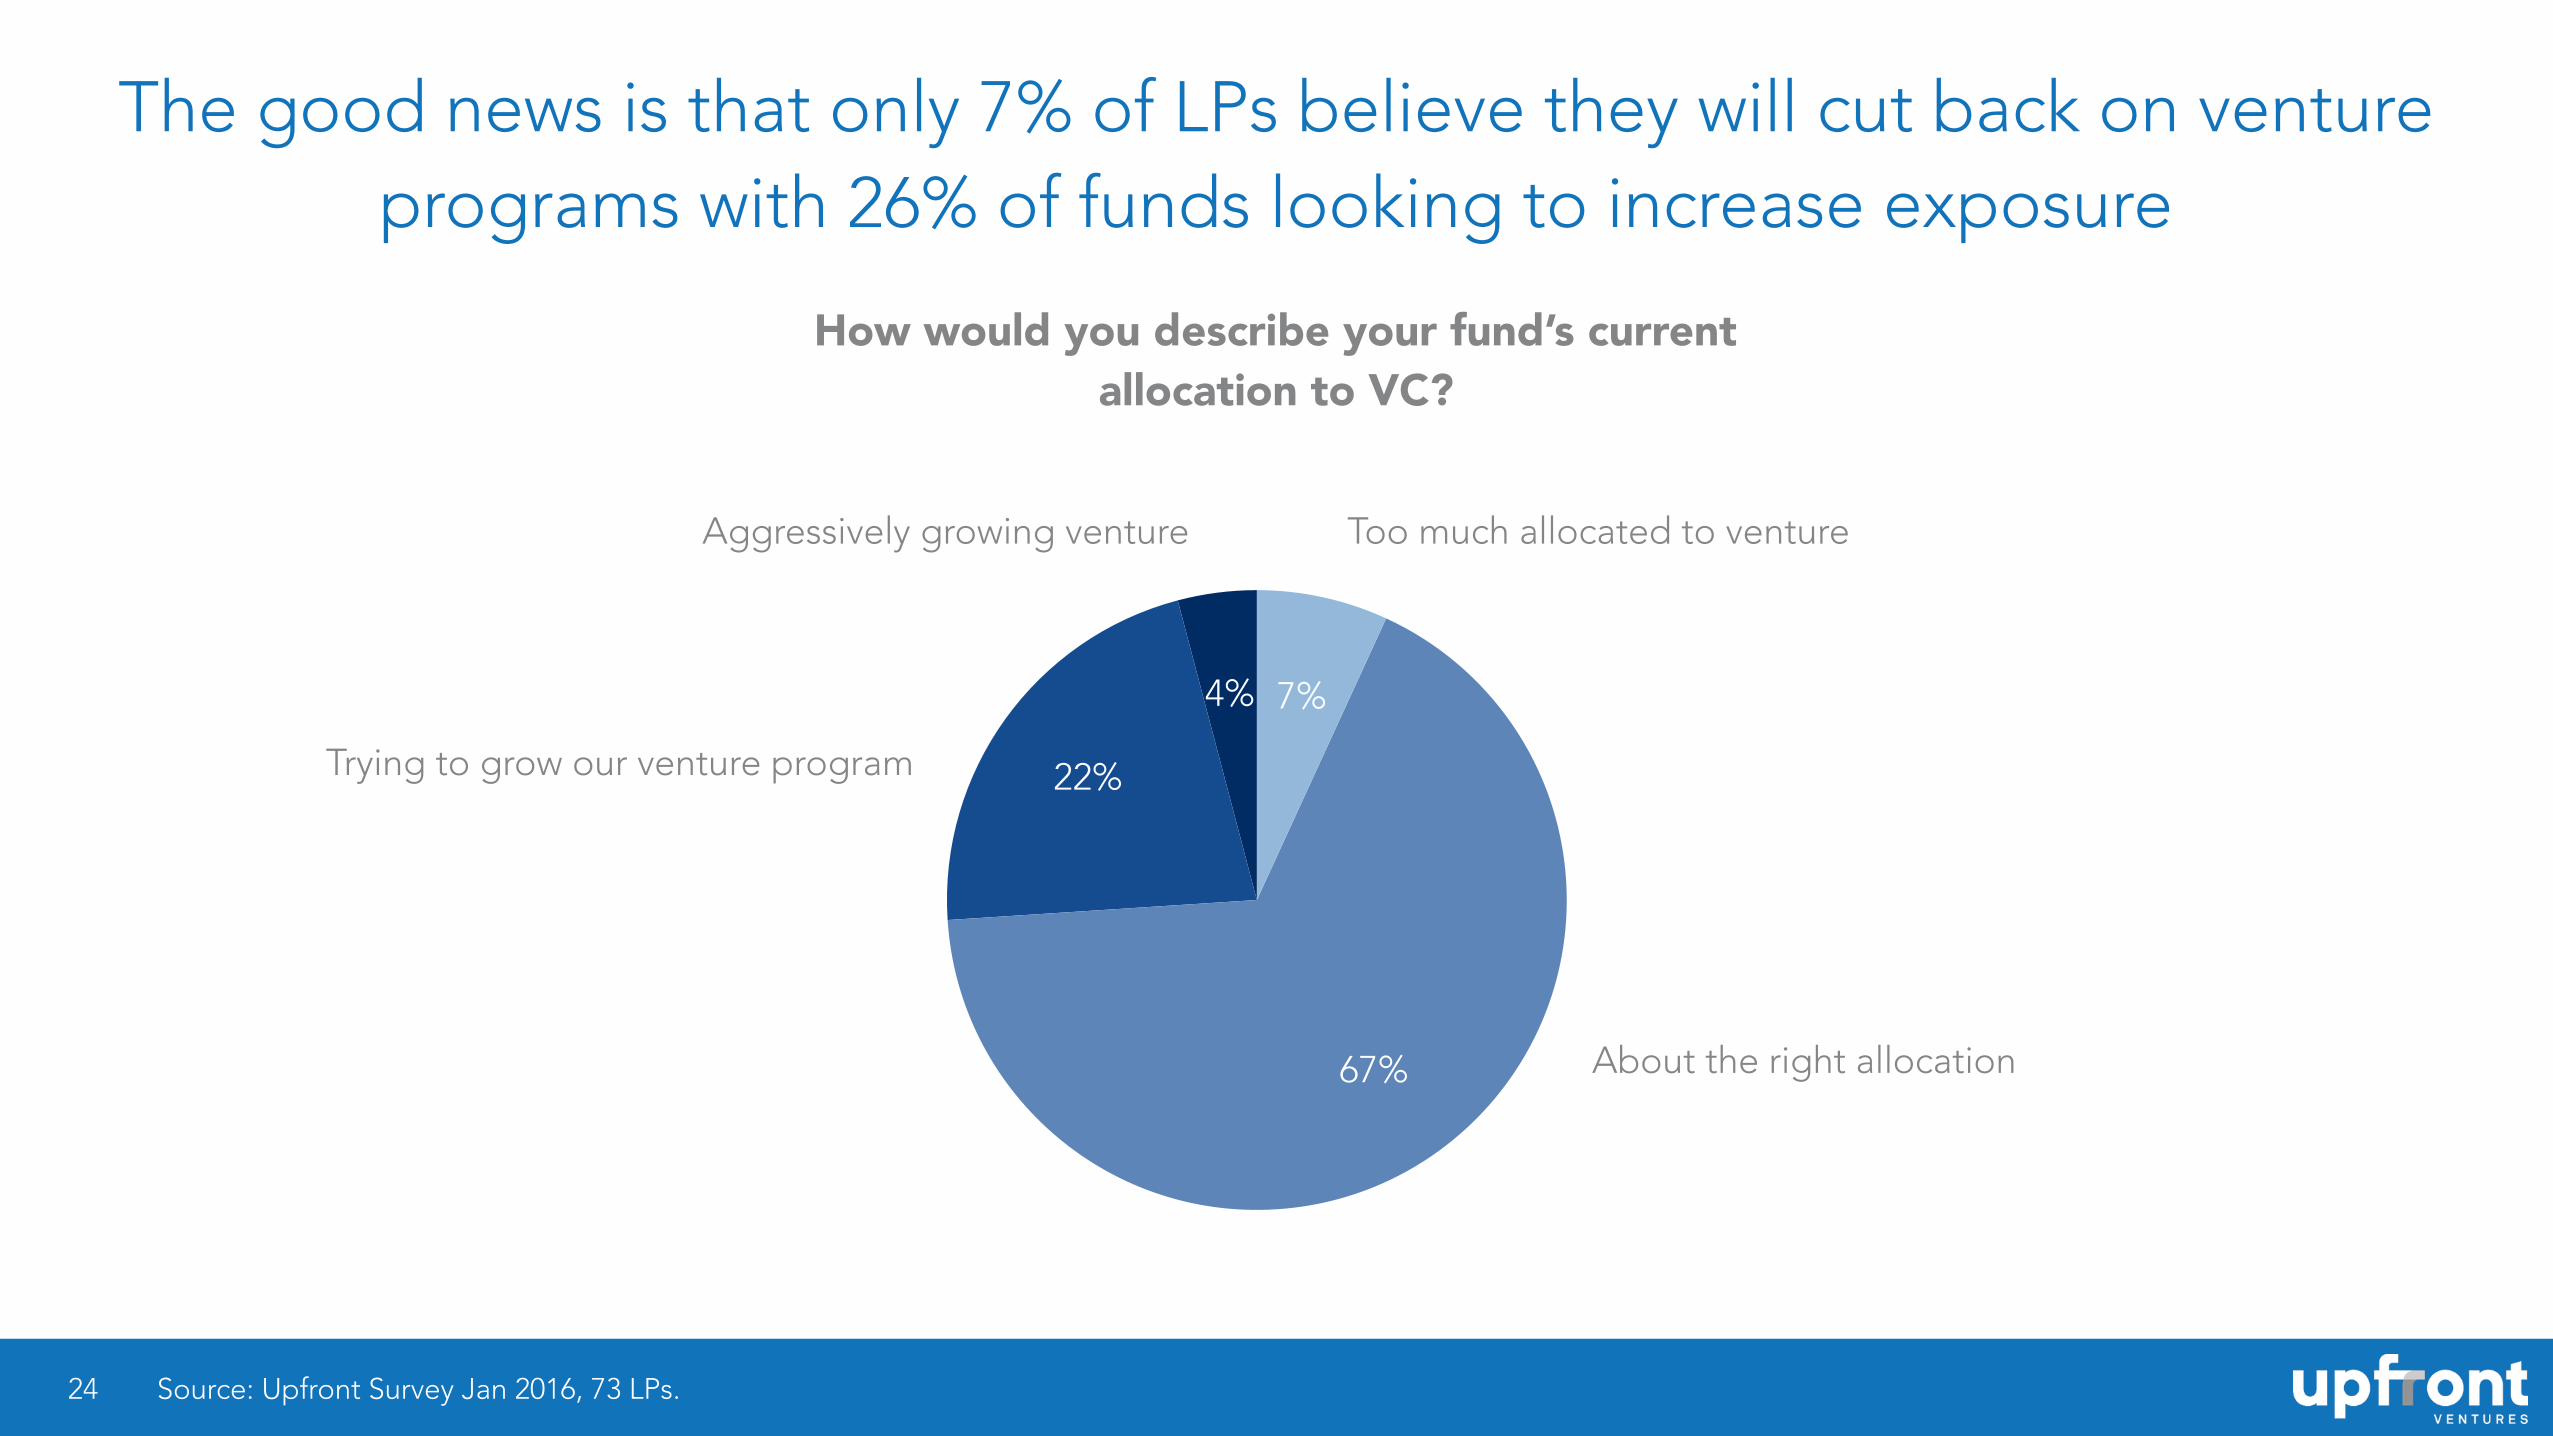
The good news is that only 7% of LPs believe they will cut back on venture programs with 26% of funds looking to increase exposure
24
4%
22%
67%
7%
Source: Upfront Survey Jan 2016, 73 LPs.
How would you describe your fund’s current allocation to VC?
About the right allocation
Aggressively growing venture Too much allocated to venture
Trying to grow our venture program
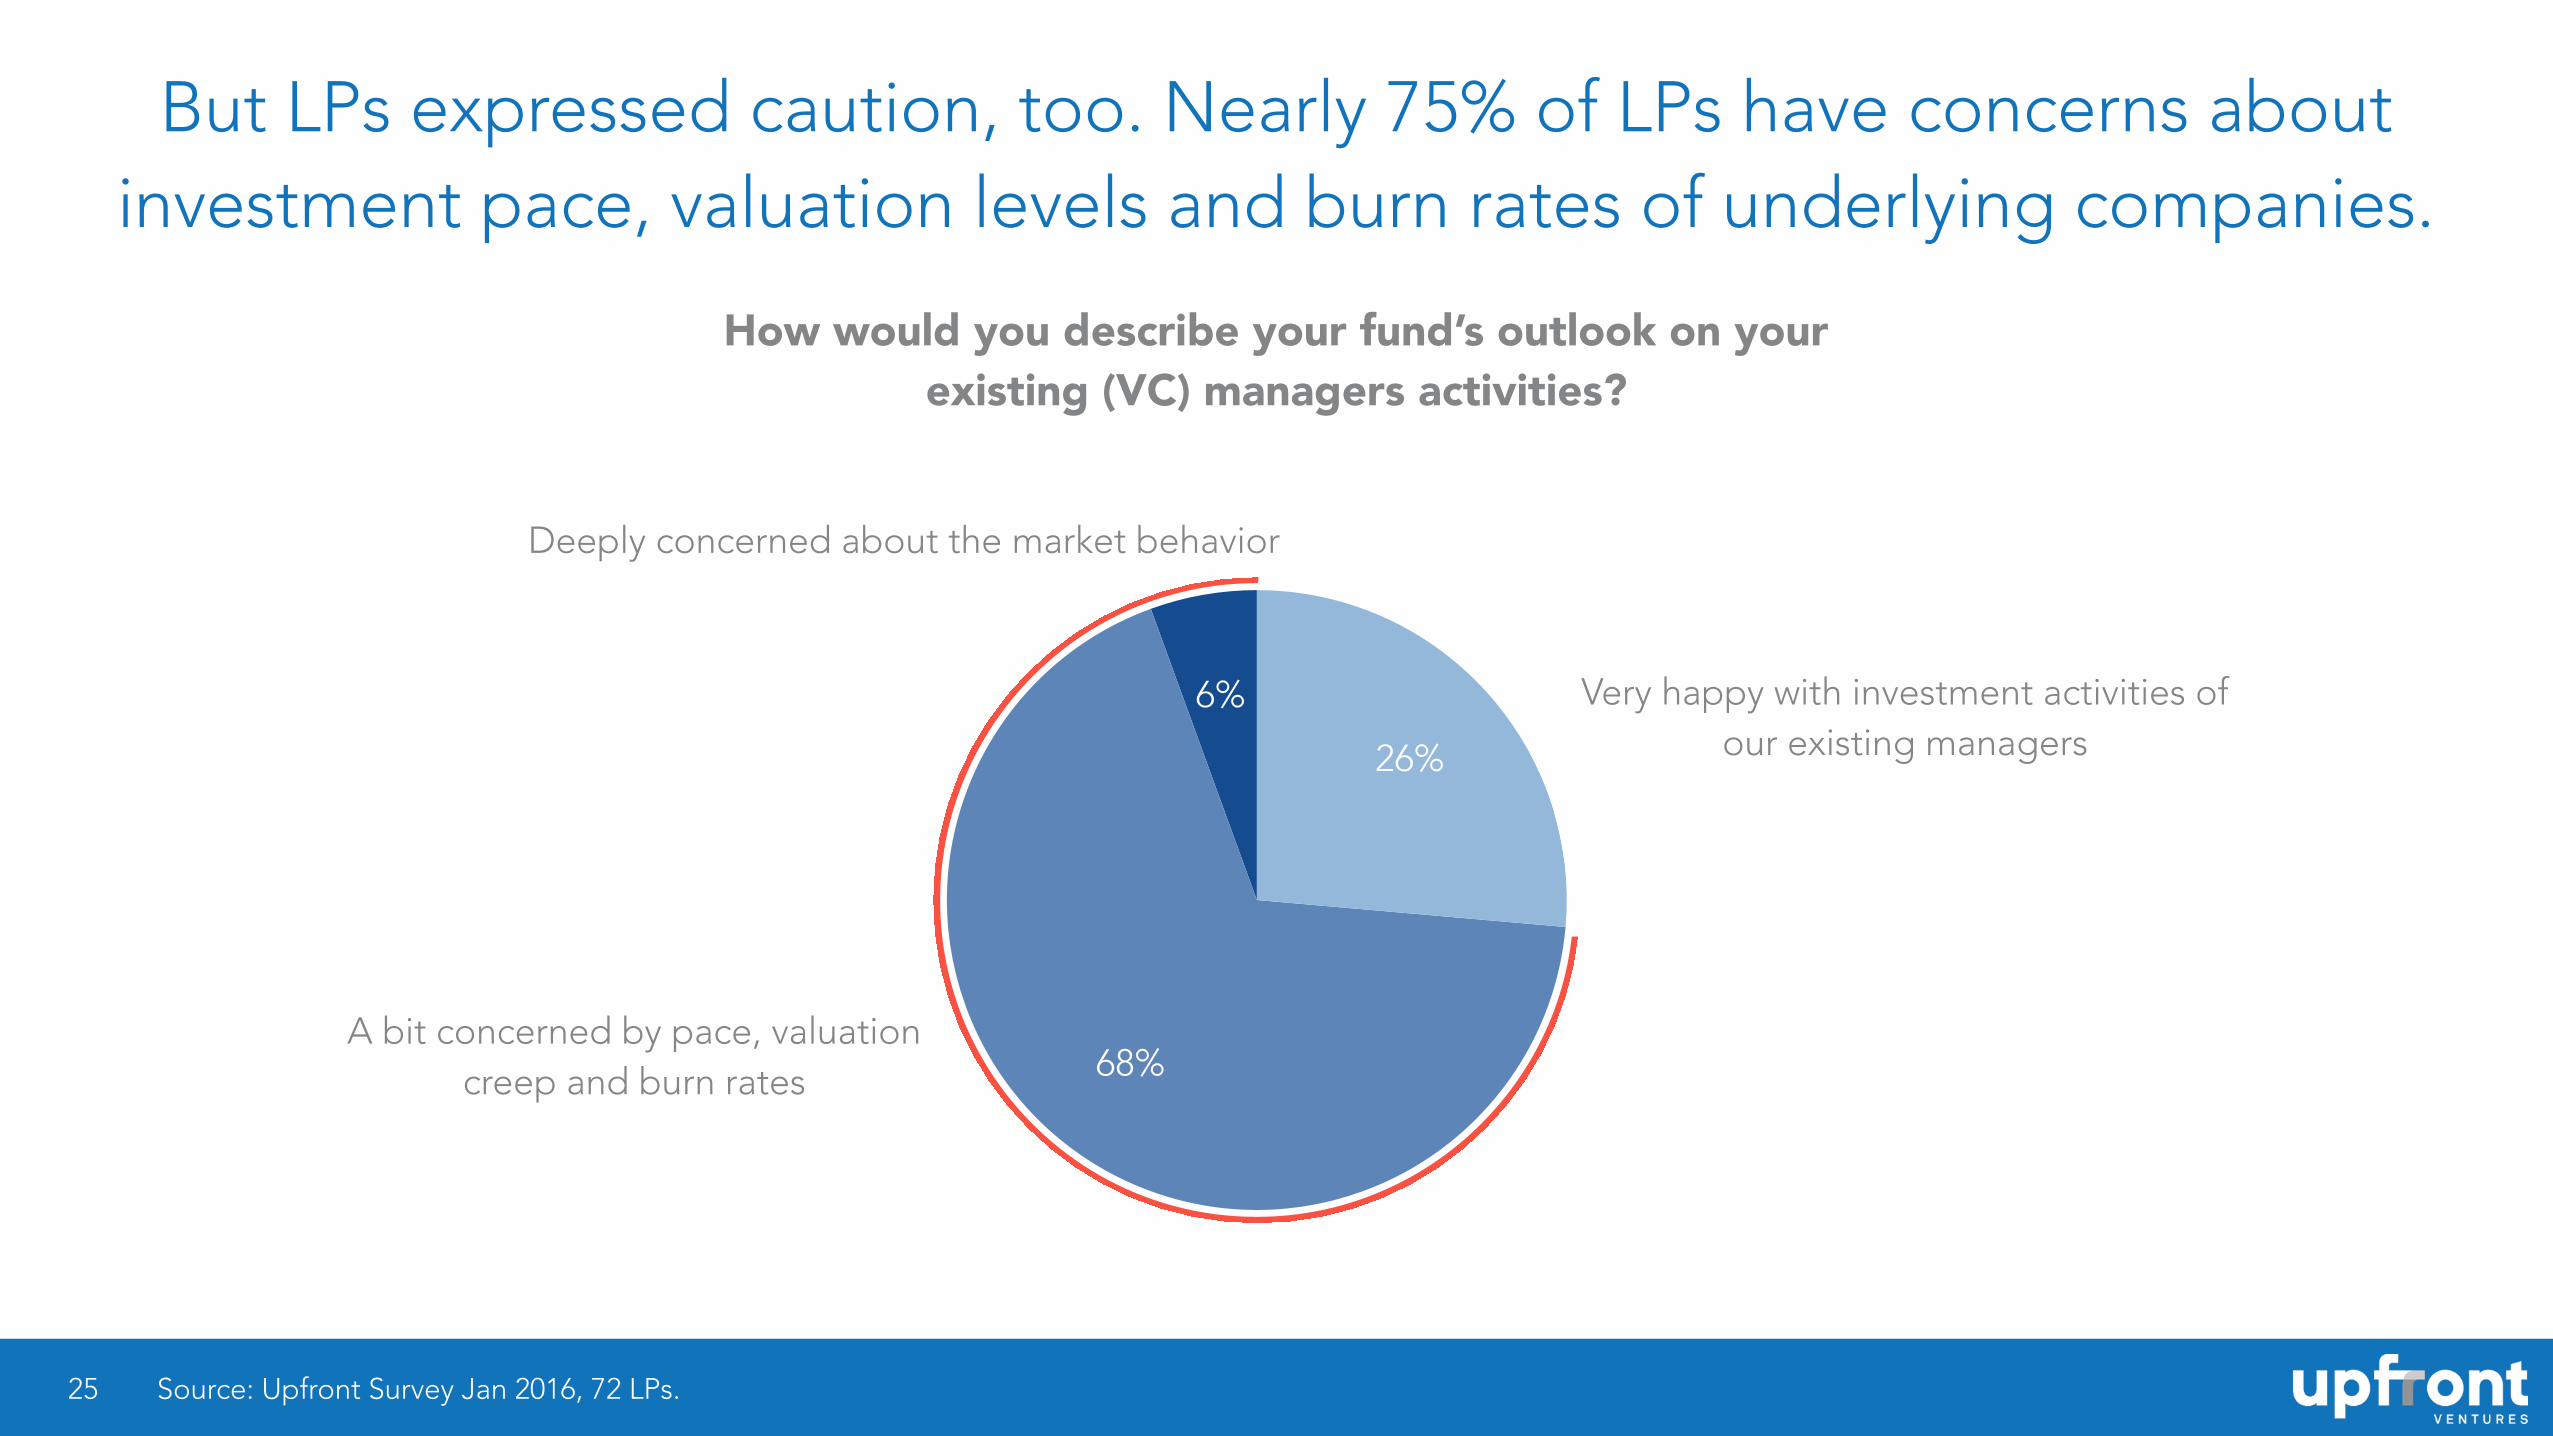
But LPs expressed caution, too. Nearly 75% of LPs have concerns about investment pace, valuation levels and burn rates of underlying companies.
25
6%
68%
26%
Source: Upfront Survey Jan 2016, 72 LPs.
How would you describe your fund’s outlook on your existing (VC) managers activities?
Very happy with investment activities of our existing managers
Deeply concerned about the market behavior
A bit concerned by pace, valuation creep and burn rates
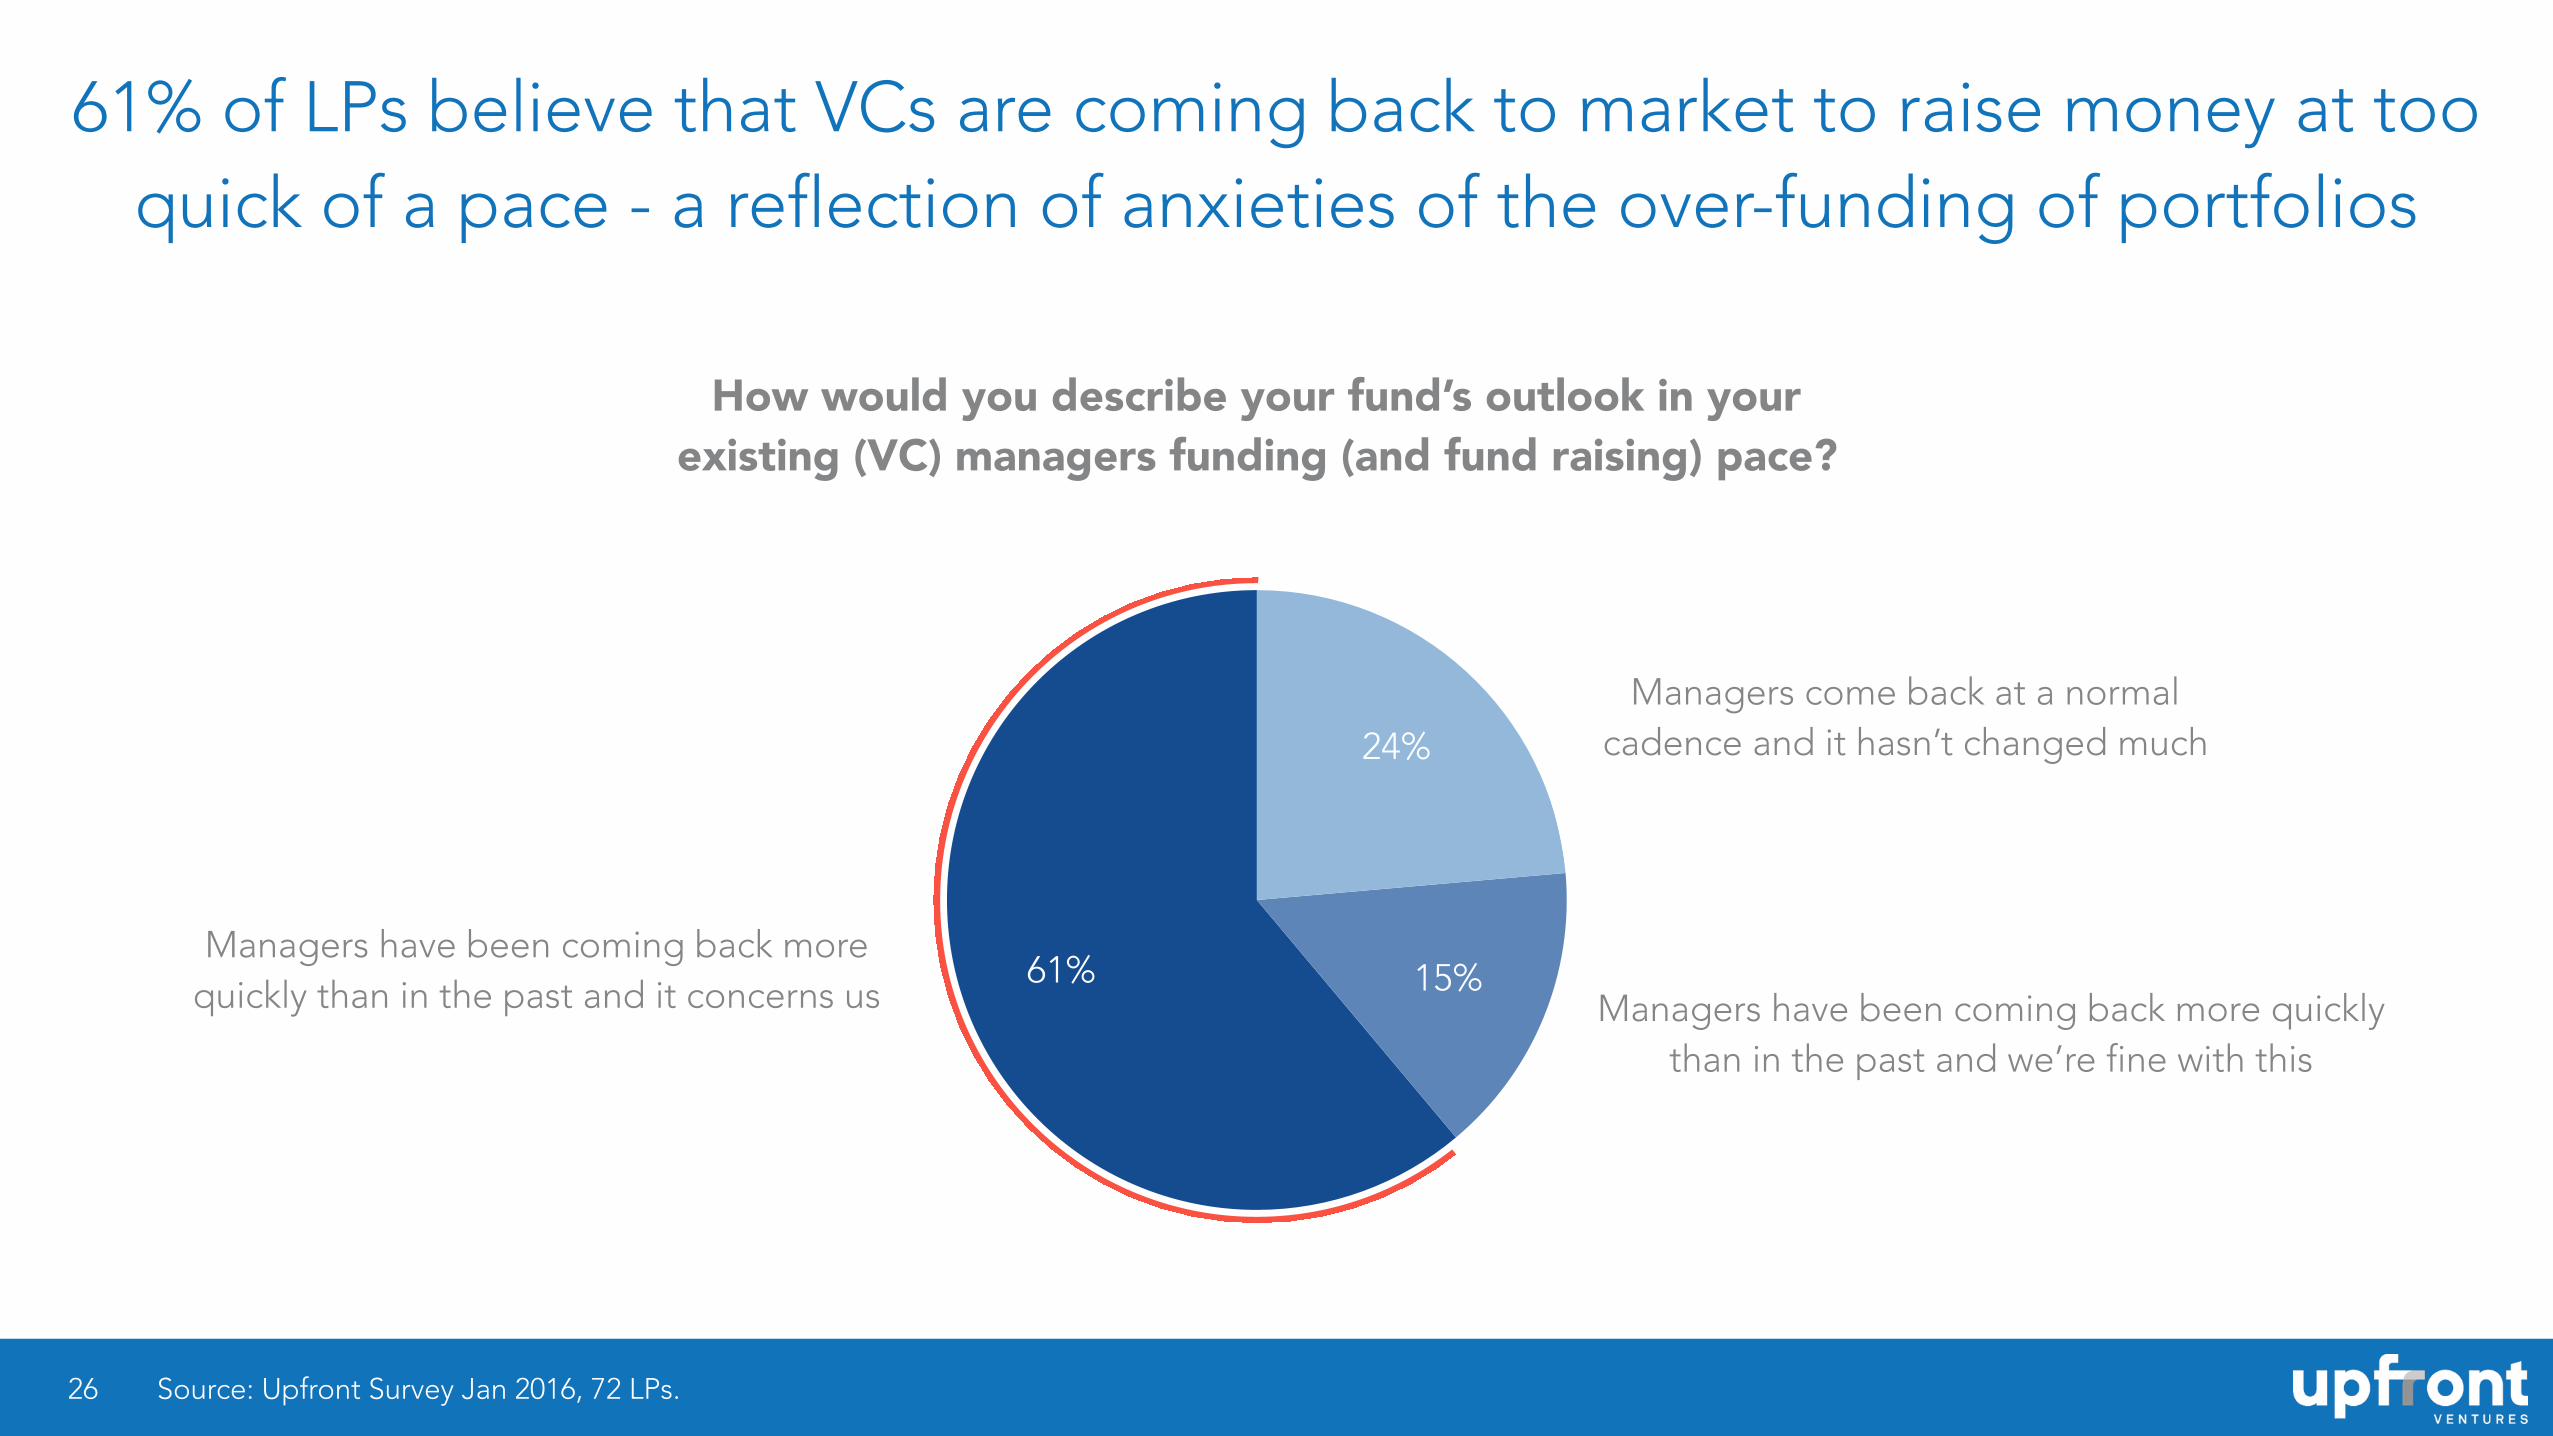
61% of LPs believe that VCs are coming back to market to raise money at too quick of a pace - a reflection of anxieties of the over-funding of portfolios
26
61% 15%
24%
Source: Upfront Survey Jan 2016, 72 LPs.
How would you describe your fund’s outlook in your existing (VC) managers funding (and fund raising) pace?
Managers come back at a normal cadence and it hasn’t changed much
Managers have been coming back more quickly than in the past and we’re fine with this
Managers have been coming back more quickly than in the past and it concerns us
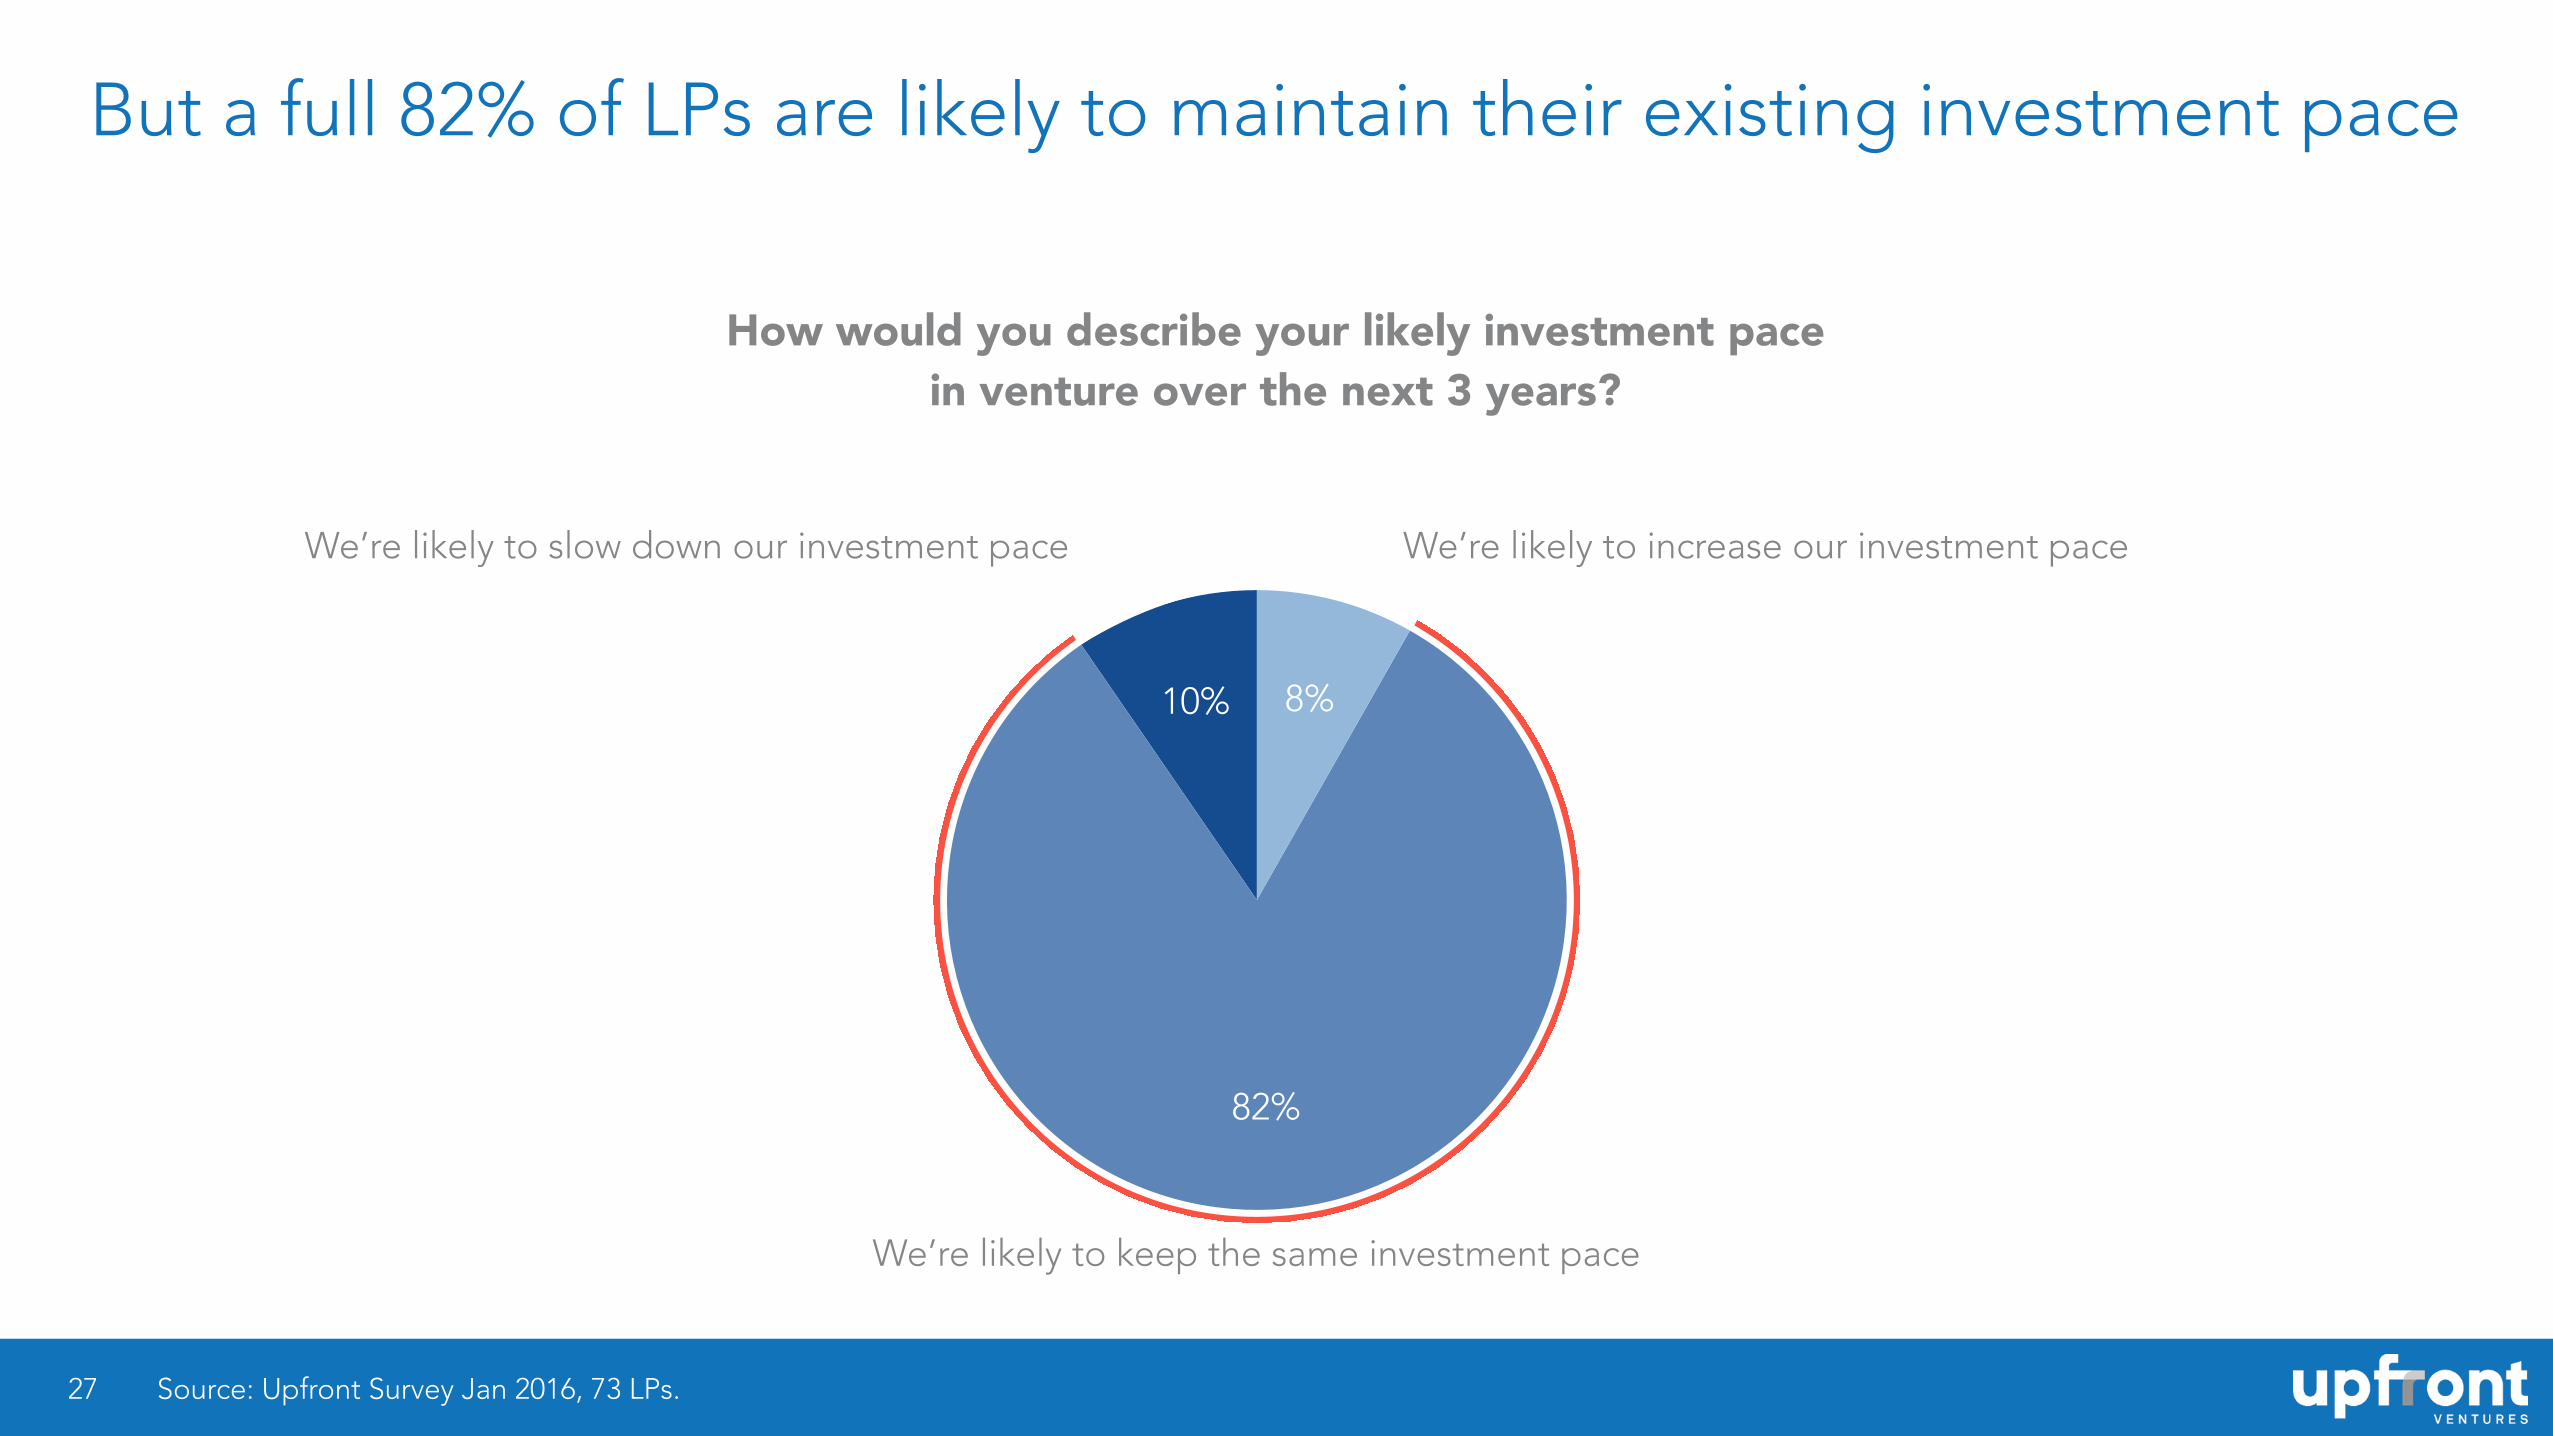
But a full 82% of LPs are likely to maintain their existing investment pace
27
10%
82%
8%
Source: Upfront Survey Jan 2016, 73 LPs.
How would you describe your likely investment pace in venture over the next 3 years?
We’re likely to increase our investment pace
We’re likely to keep the same investment pace
We’re likely to slow down our investment pace

While the market for Seed Funds grew enormously in the past 7 years, many LPs still express some concerns about capacity and market crowding
28
23%
66%
11%
Source: Upfront Survey Jan 2016, 70 LPs.
What is your fund’s outlook on the seed market?
Seed delivers the highest potential returns and we’ll continue to invest heavilyThere are too many seed funds and we’re worried they
won’t have enough capacity
We fund seed VCs but we’re very discerning on which ones we’ll fund
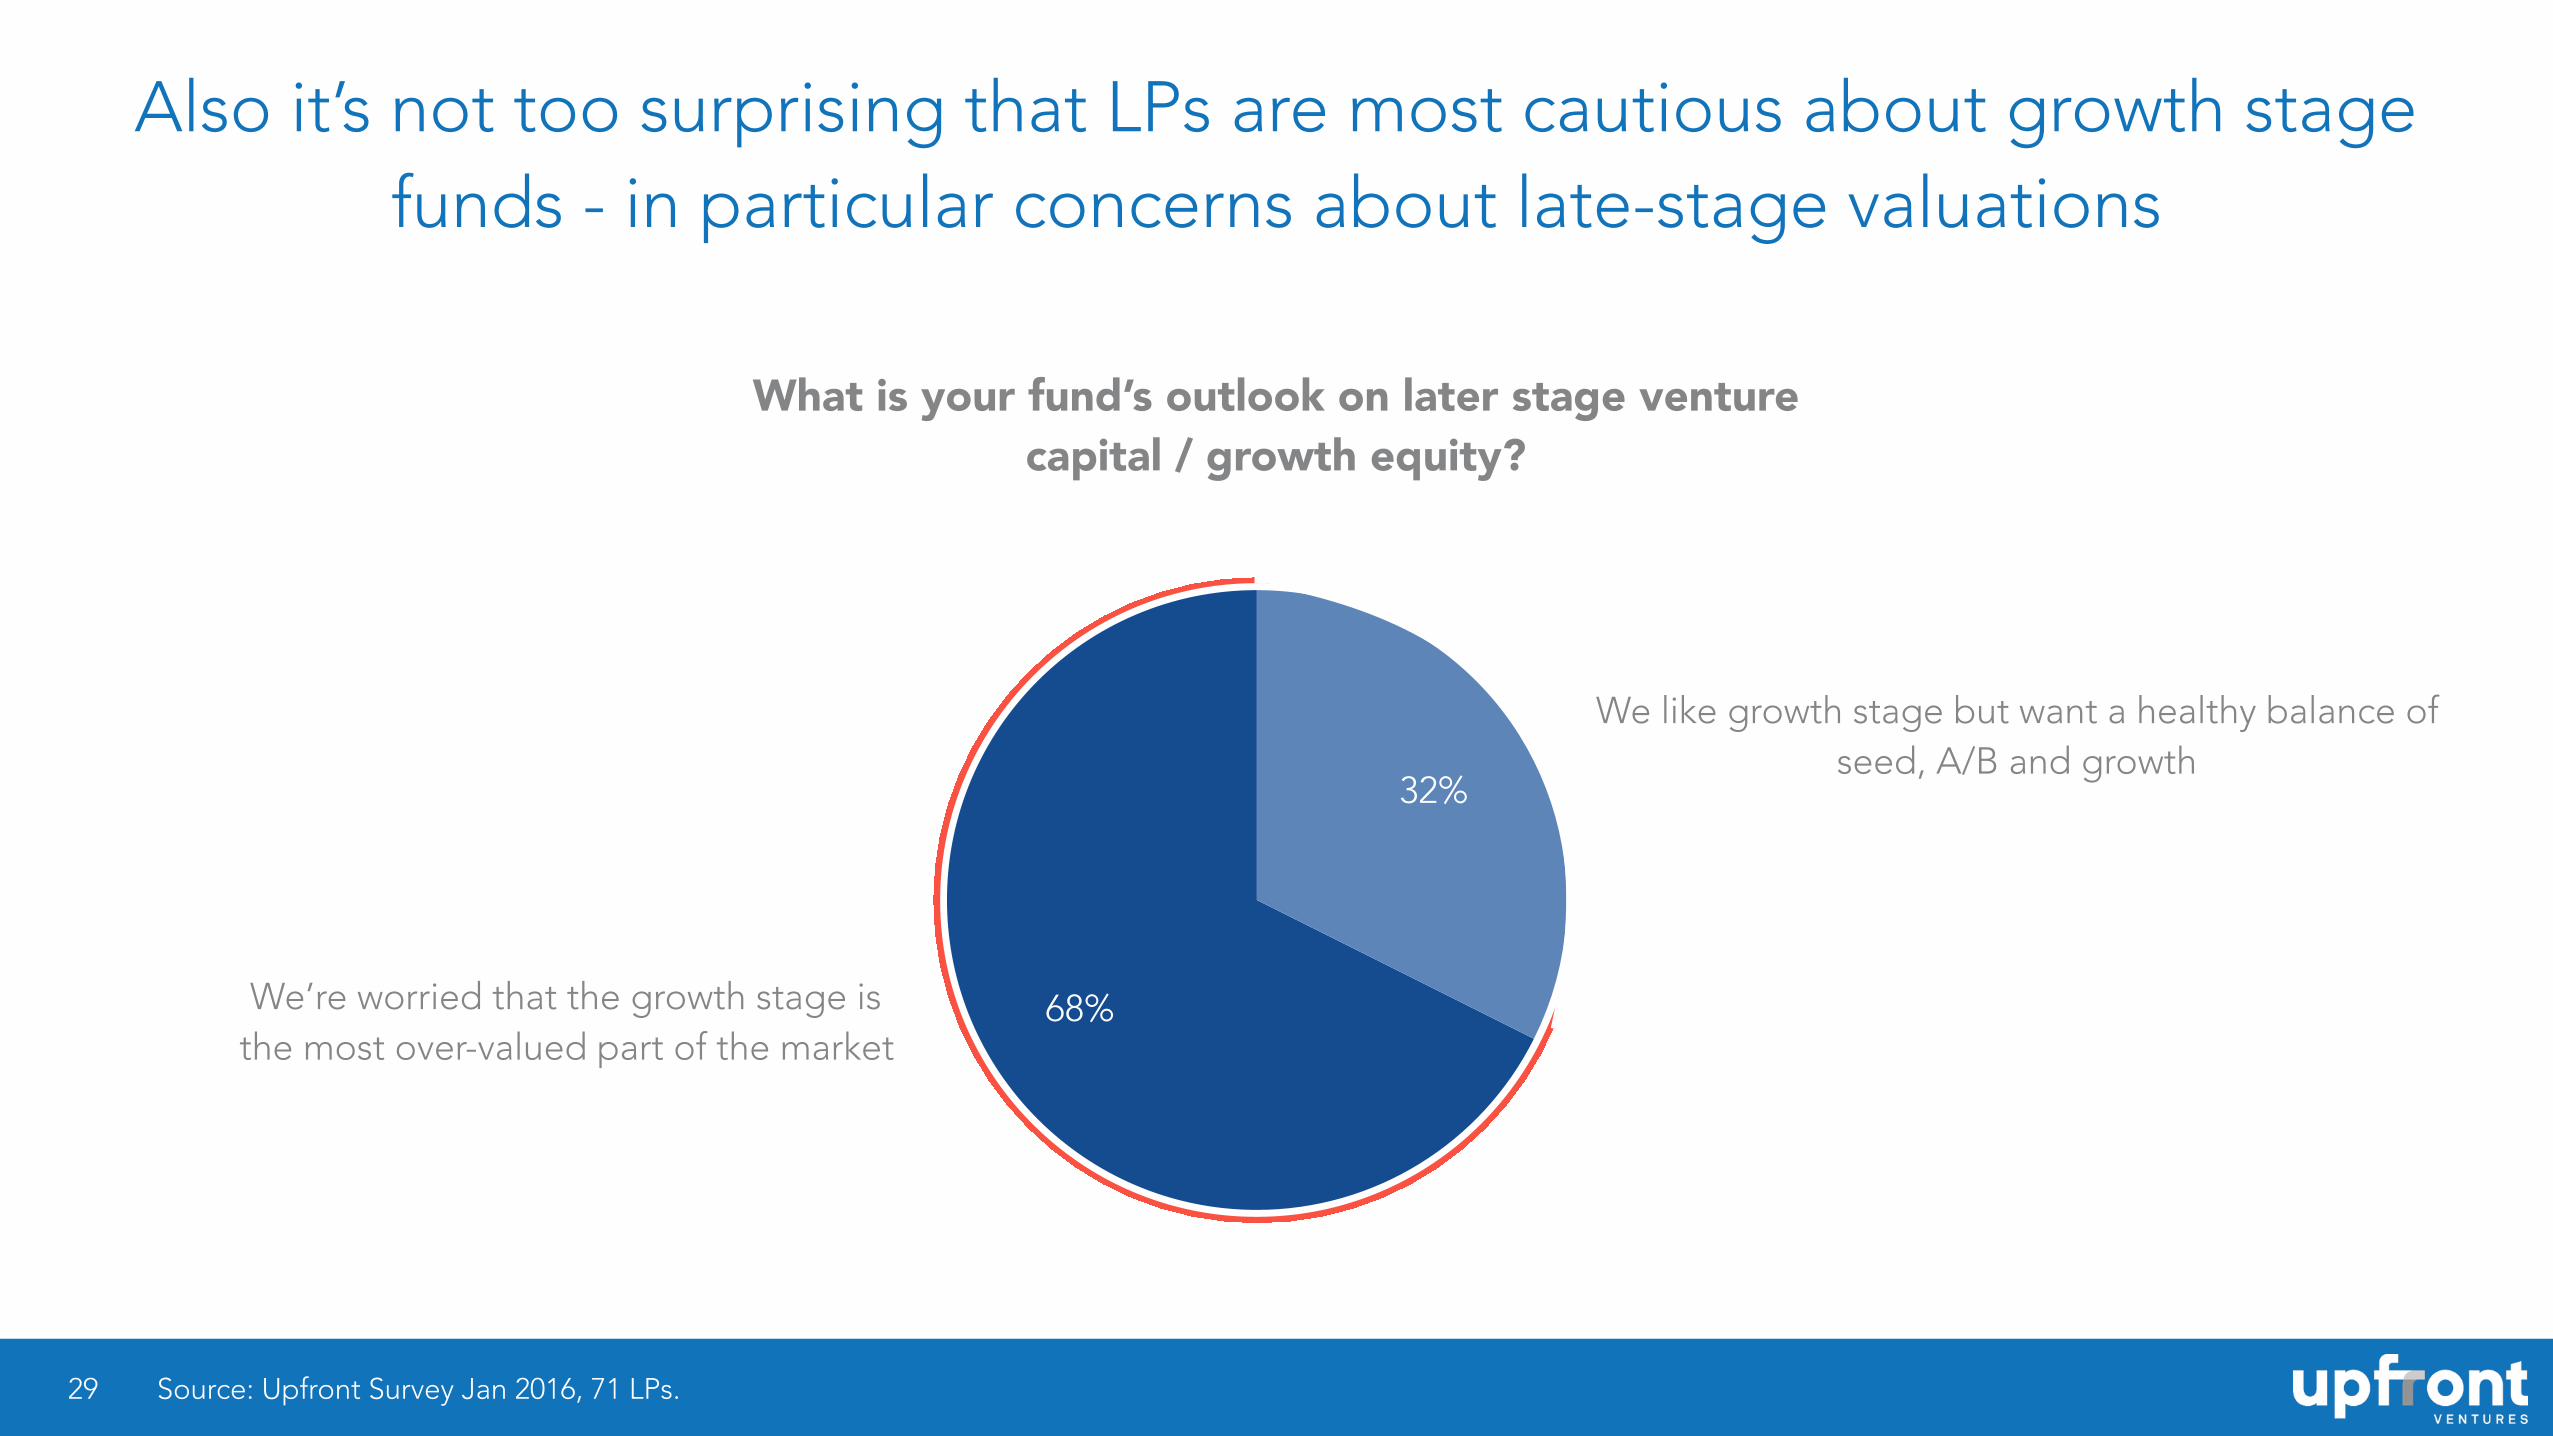
Also it’s not too surprising that LPs are most cautious about growth stage funds - in particular concerns about late-stage valuations
29
68%
32%
Source: Upfront Survey Jan 2016, 71 LPs.
What is your fund’s outlook on later stage venture capital / growth equity?
We like growth stage but want a healthy balance of seed, A/B and growth
We’re worried that the growth stage is the most over-valued part of the market

What to make of all of the uncertainty and potential change in the VC markets?
30
31
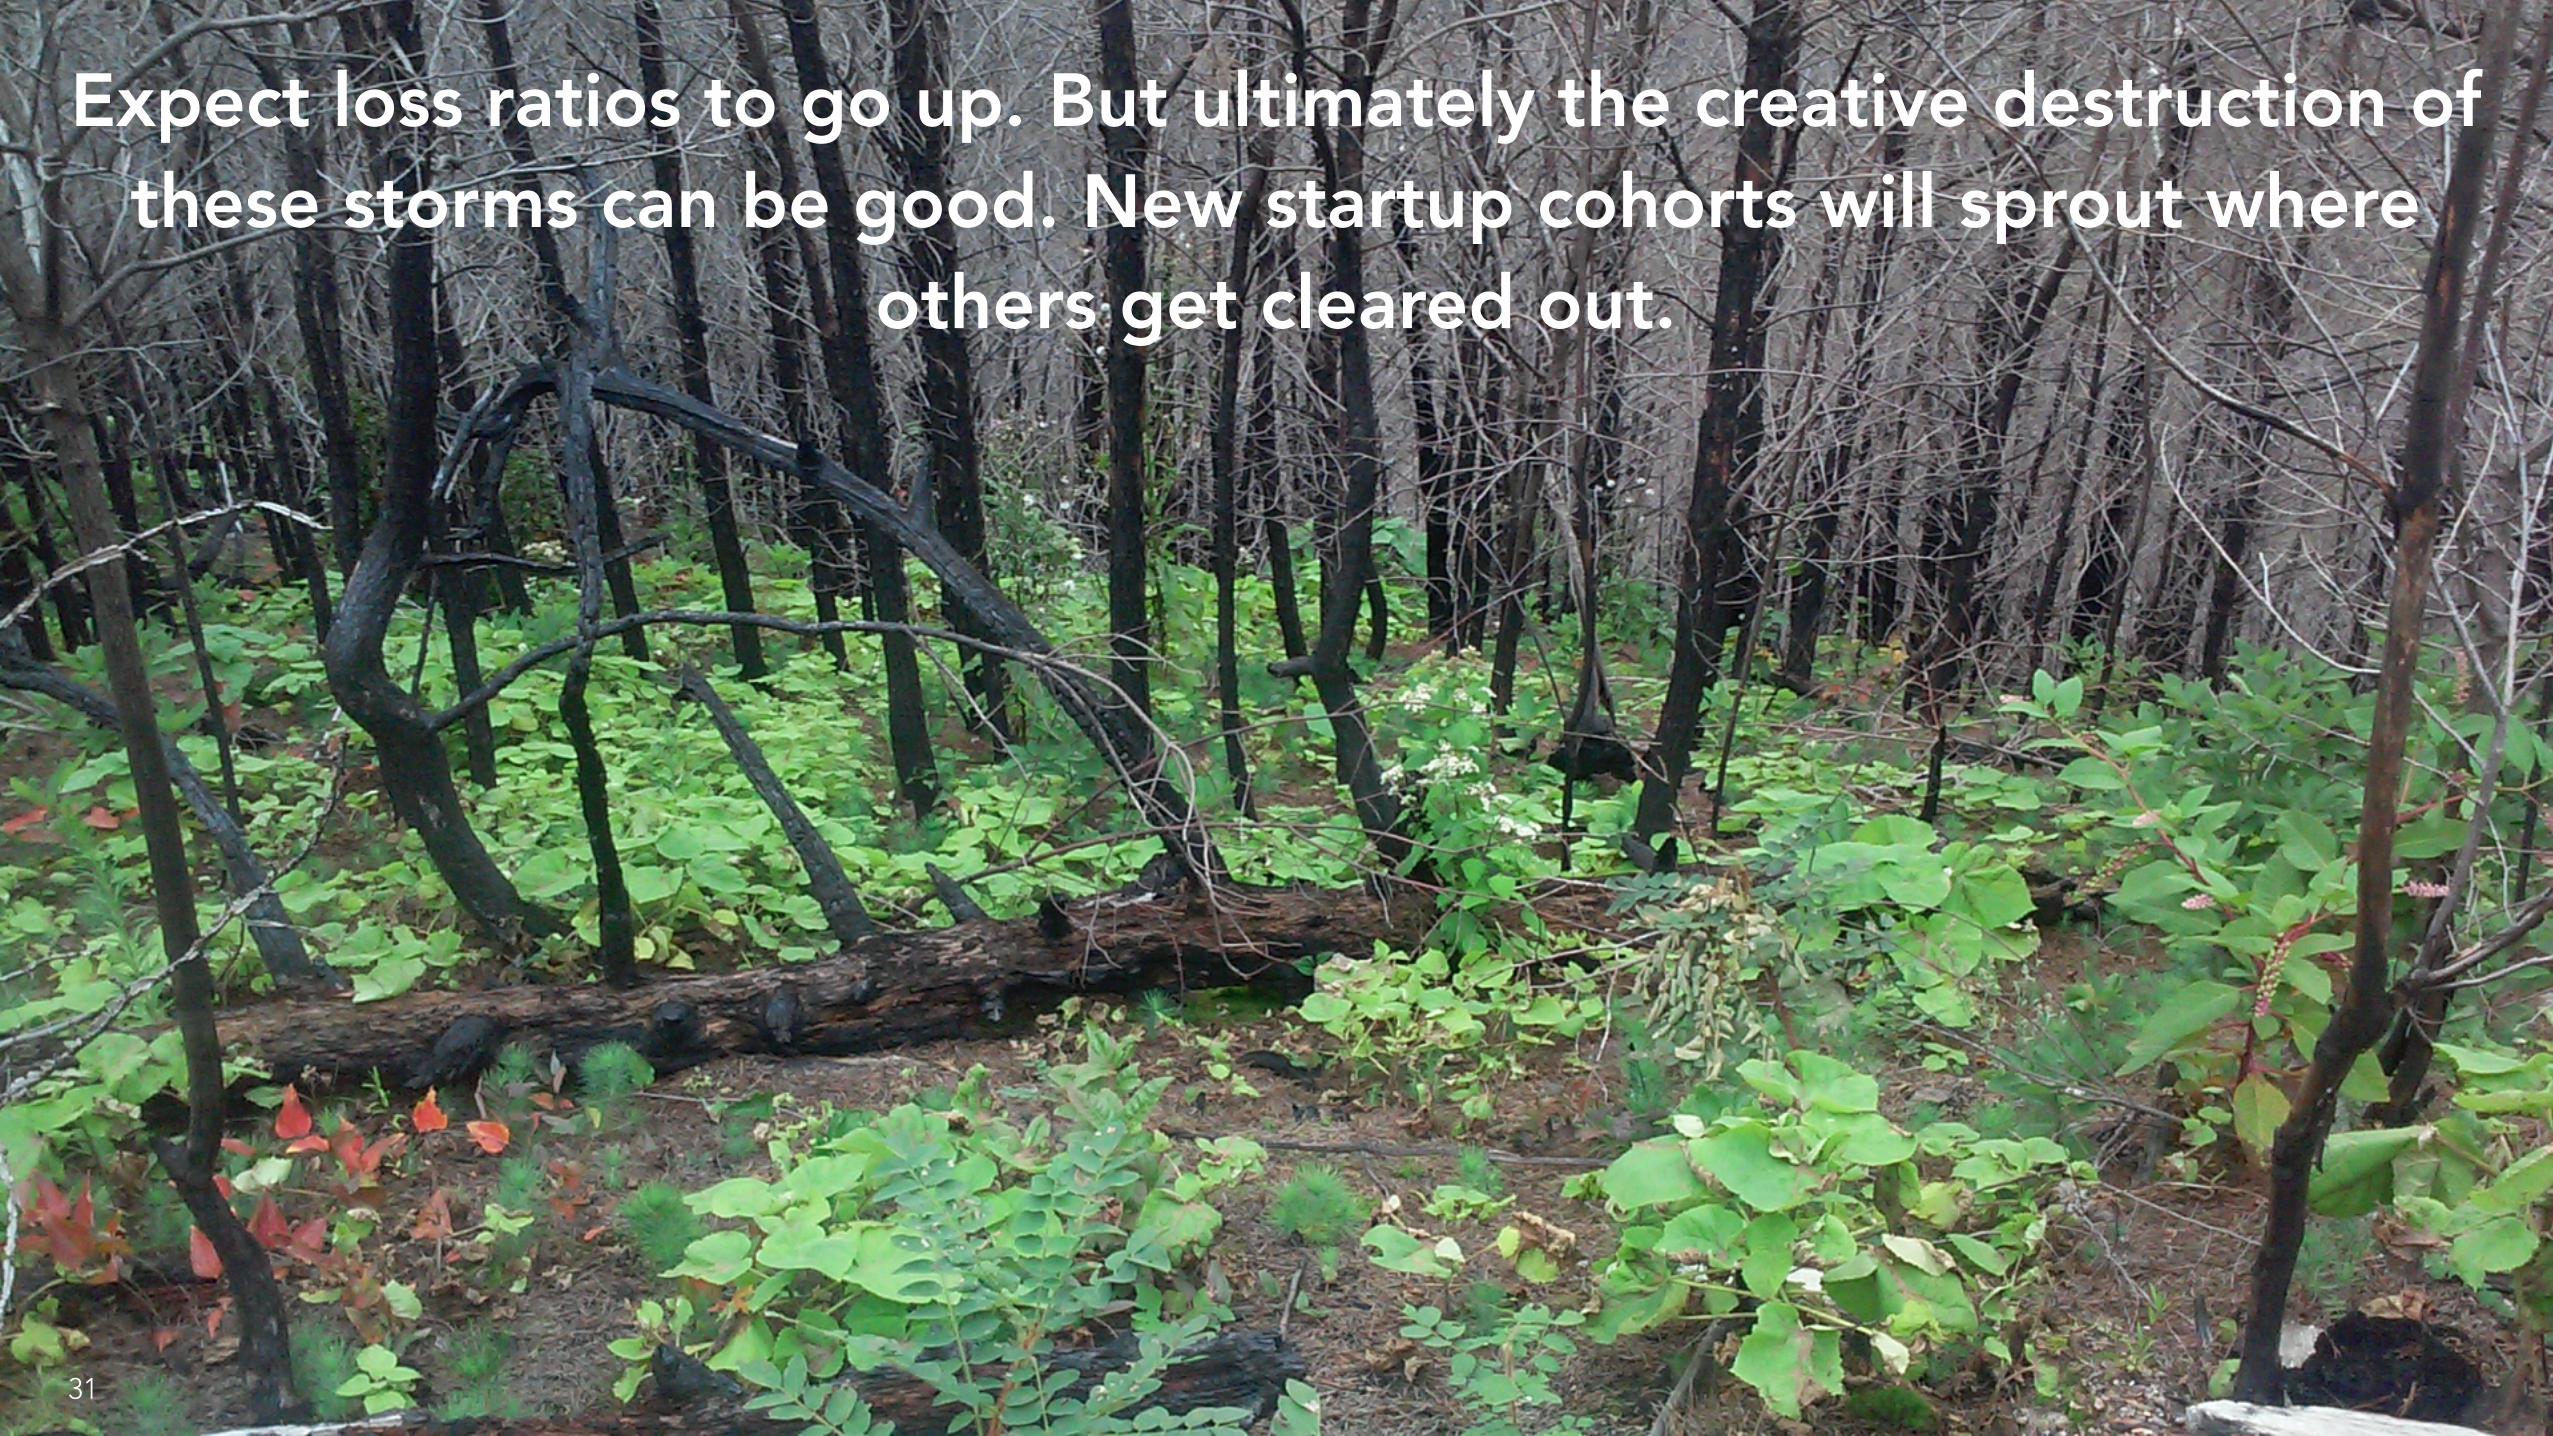
Expect loss ratios to go up. But ultimately the creative destruction of these storms can be good. New startup cohorts will sprout where
others get cleared out.

32
A slowing pace should be healthy for startups and for VC returns. We believe the
next 3 years will value patience over speed at all
costs.

33
And despite market concerns in the short-term, as an asset class we see so many industries ripe for innovation and disruption
Aerial & Space-techVR & ARTransportation Computational Biology Food & Agriculture

Venture Capital 2016Thank You.
34
Mark Suster @msuster
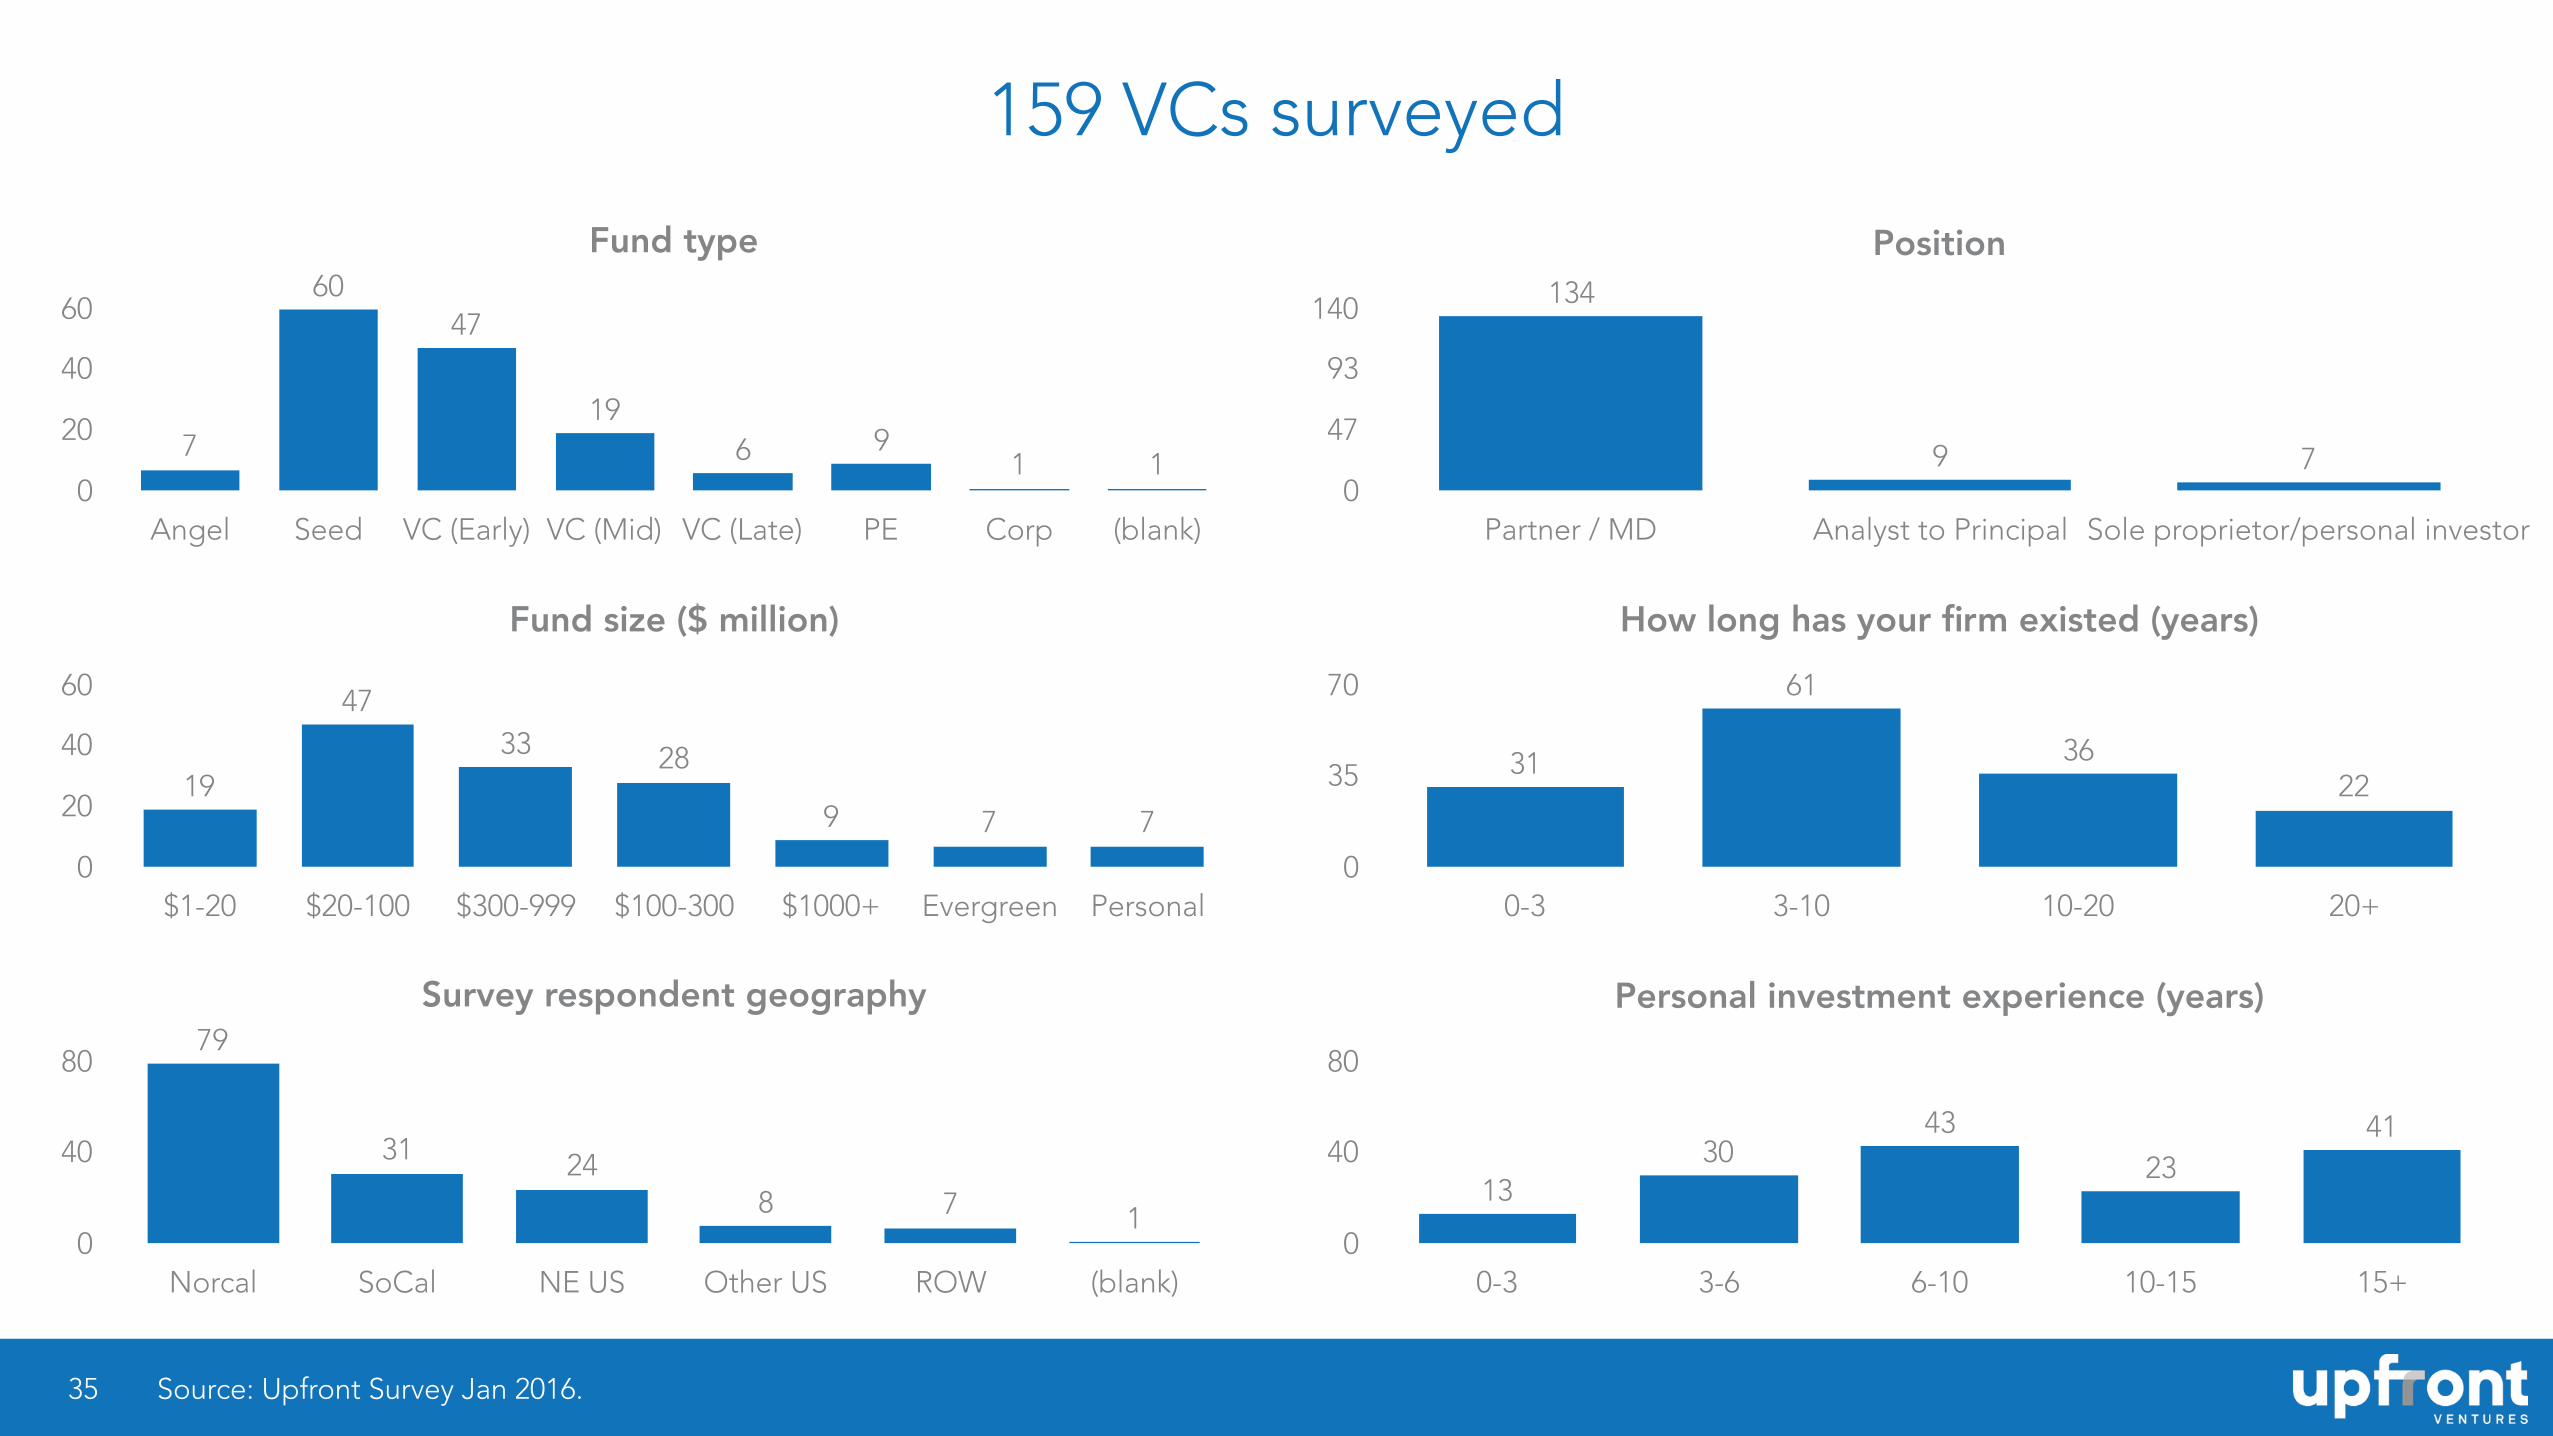
159 VCs surveyed
35
Fund type
0
20
40
60
Angel Seed VC (Early) VC (Mid) VC (Late) PE Corp (blank)
1196
19
4760
7
Source: Upfront Survey Jan 2016.
Fund size ($ million)
0
20
40
60
$1-20 $20-100 $300-999 $100-300 $1000+ Evergreen Personal
779
283347
19
Survey respondent geography
0
40
80
Norcal SoCal NE US Other US ROW (blank)
1782431
79
Position
0
47
93
140
Partner / MD Analyst to Principal Sole proprietor/personal investor
79
134
How long has your firm existed (years)
0
35
70
0-3 3-10 10-20 20+
2236
61
31
Personal investment experience (years)
0
40
80
0-3 3-6 6-10 10-15 15+
4123
4330
13
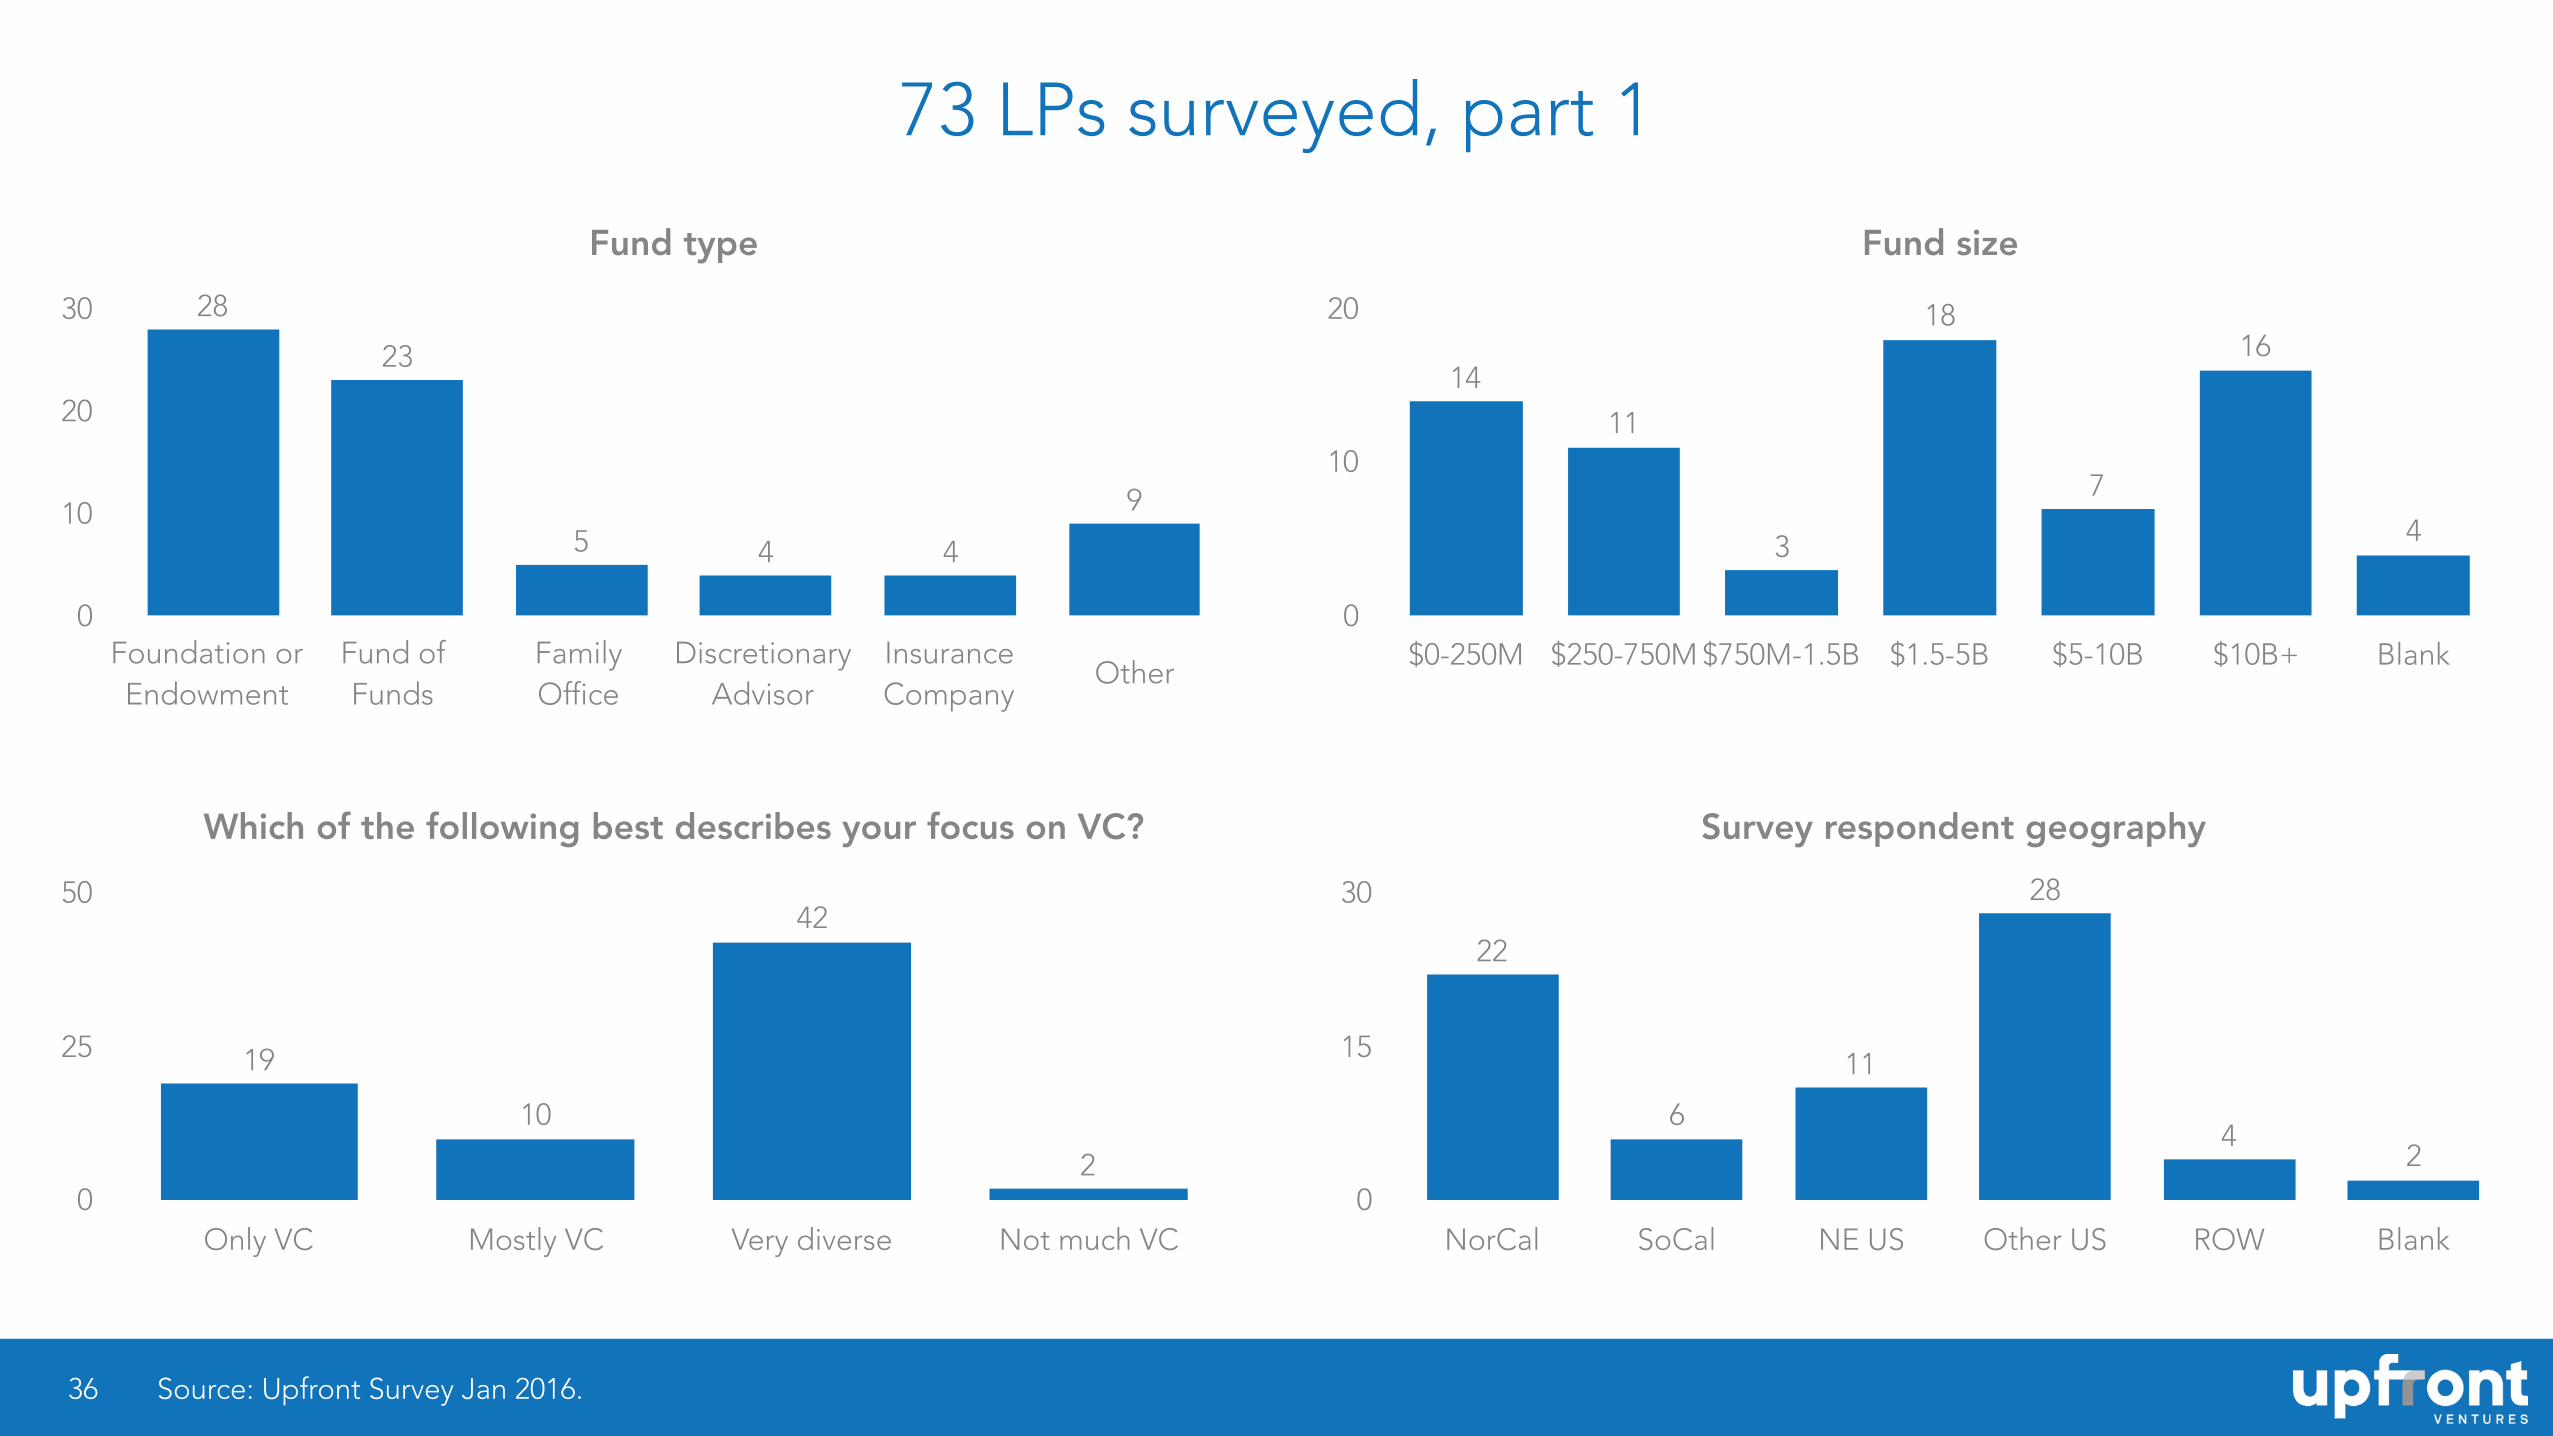
73 LPs surveyed, part 1
36
Fund type
0
10
20
30
9
445
23
28
Fund size
0
10
20
$0-250M $250-750M $750M-1.5B $1.5-5B $5-10B $10B+ Blank
4
16
7
18
3
11
14
Which of the following best describes your focus on VC?
0
25
50
Only VC Mostly VC Very diverse Not much VC
2
42
10
19
Foundation or Endowment
Fund of Funds
Family Office
Discretionary Advisor
Insurance Company
Other
Survey respondent geography
0
15
30
NorCal SoCal NE US Other US ROW Blank
24
28
11
6
22
Source: Upfront Survey Jan 2016.
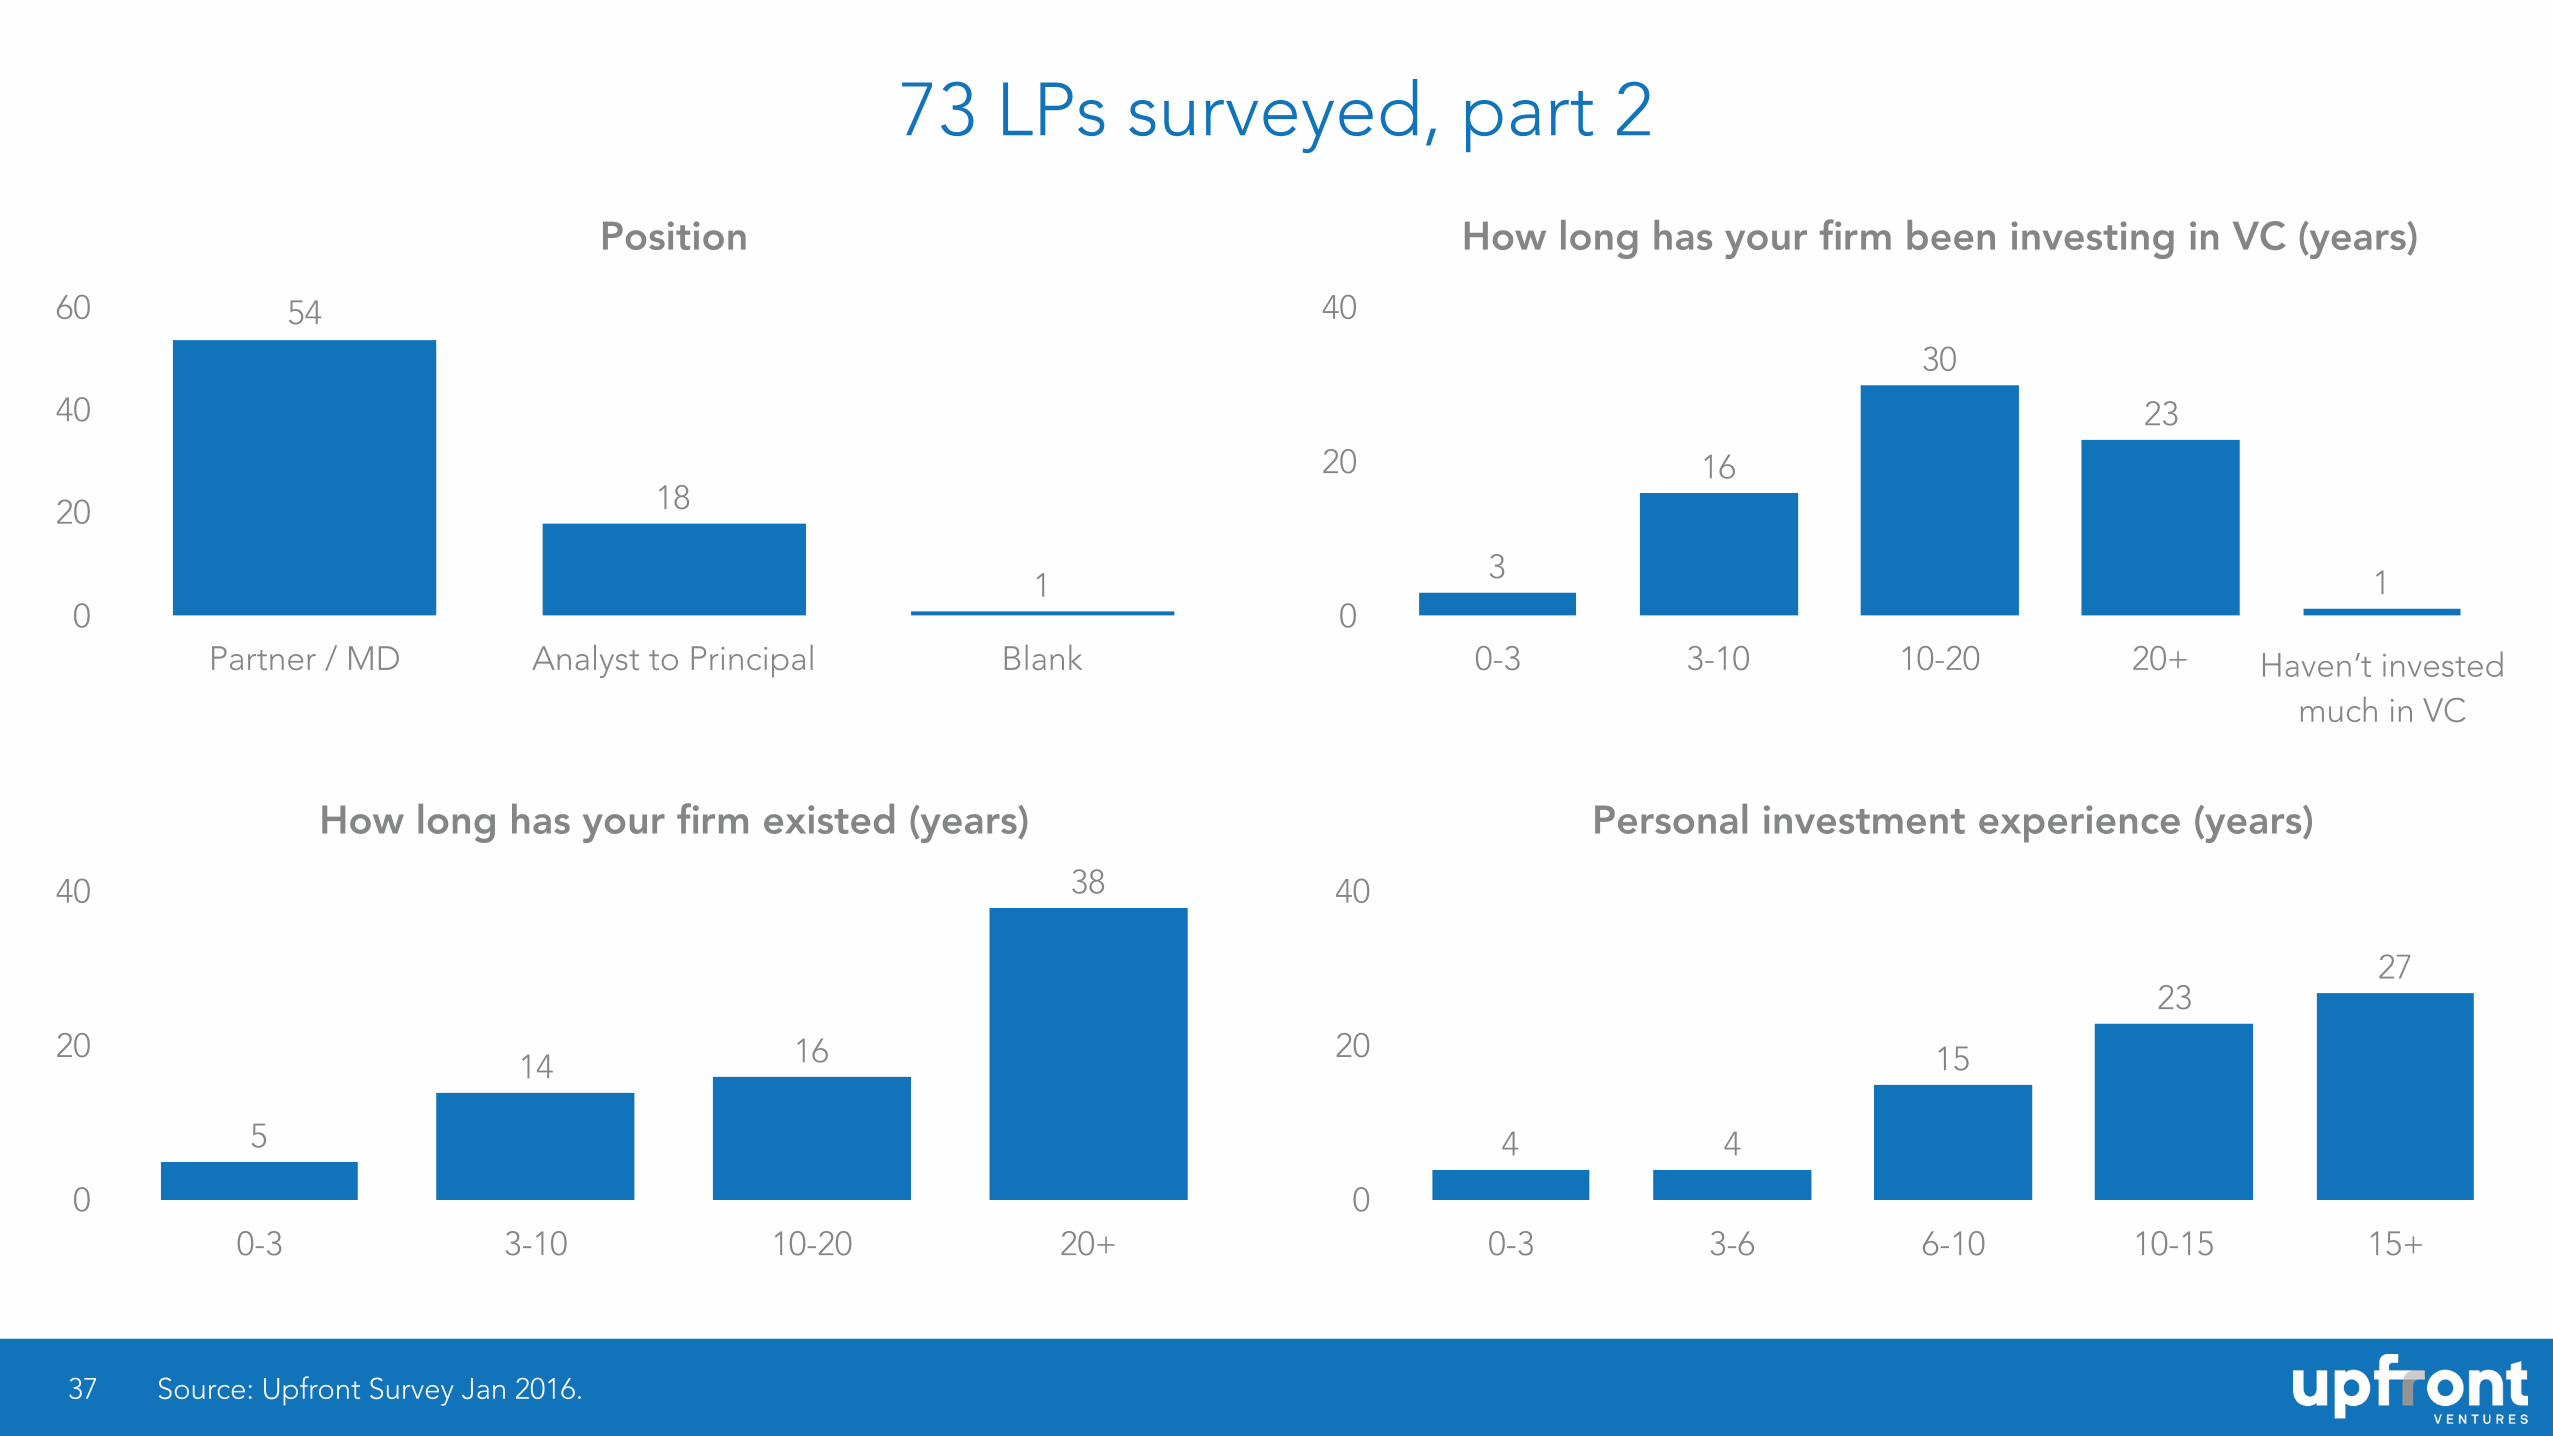
73 LPs surveyed, part 2
37
Position
0
20
40
60
Partner / MD Analyst to Principal Blank
1
18
54
How long has your firm been investing in VC (years)
0
20
40
0-3 3-10 10-20 20+
1
23
30
16
3
How long has your firm existed (years)
0
20
40
0-3 3-10 10-20 20+
38
1614
5
Personal investment experience (years)
0
20
40
0-3 3-6 6-10 10-15 15+
2723
15
44
Haven’t invested much in VC
Source: Upfront Survey Jan 2016.