what is a multilateral development bank? s. samuel tumiwa deputy representative north america...
TRANSCRIPT
What is a Multilateral Development Bank?
S. Samuel TumiwaDeputy Representative
North America Representative Office
Canada Business Opportunities SeminarHalifax – Montreal – Calgary – Saskatoon
September 20151

Multilateral Development Banks
2

Multilateral Development Banks
3
The Asian Development Bank
4
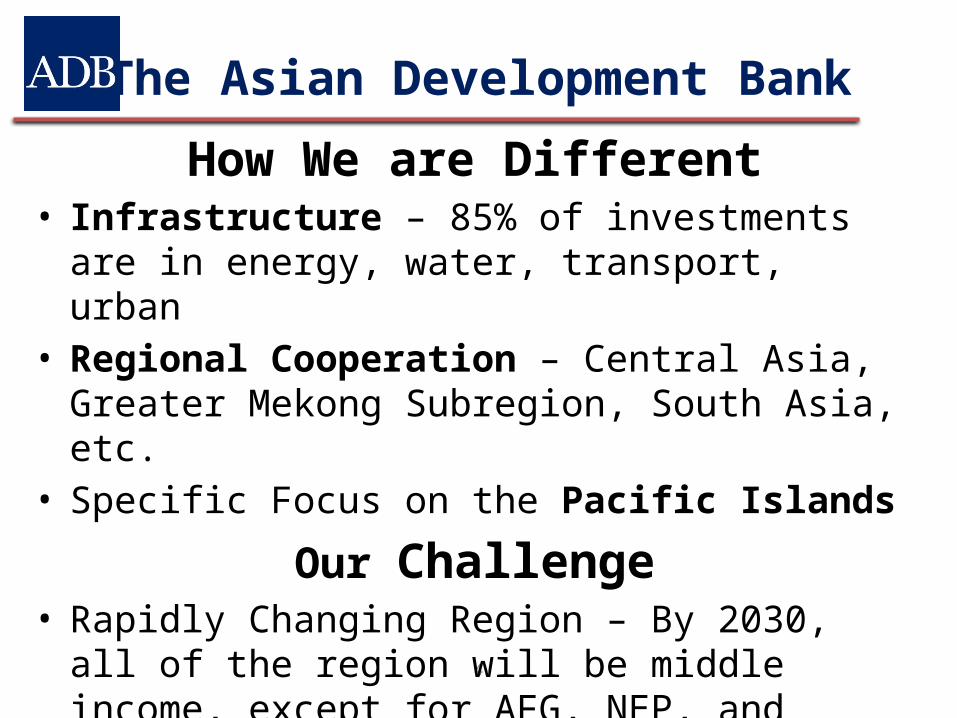
How We are Different• Infrastructure – 85% of investments are in energy,
water, transport, urban• Regional Cooperation – Central Asia, Greater Mekong
Subregion, South Asia, etc.• Specific Focus on the Pacific Islands
Our Challenge• Rapidly Changing Region – By 2030, all of the region will
be middle income, except for AFG, NEP, and • Not just about financing – Also about knowledge and
Partnership
Why Asia?
S. Samuel TumiwaDeputy Representative
North America Representative Office
Canada Business Opportunities SeminarHalifax – Montreal – Calgary – Saskatoon
September 2015
5

Why Asia?
6

Economic Outlook: DevelopingAsia extends steady growth…
7
f: forecast
2010 2011 2012 2013 2014 2015f 2016f0
2
4
6
8
10
9.37.3 6.2 6.5 6.3 6.3 6.3
GDP growth (%)
5-year average: 7.110-year average: 7.6
Asian Development Outlook 2015

…contributing the most to global growth
PRC India ASEAN US Japan Euro area0
10203040 31.2
11.8 7.9 9.61.8 1.6
Global cumulative GDP growth, 2009–2014 = 21.4%, annual growth=4.0%
8
Þ Asia accounts for about 60% of global growth; still fastest-growing region
PRC India ASEAN US Japan Euro area0
20
40 31.9
15.28.0
14.4
1.4 3.7
Global GDP growth, 2015 = 3.6%
Percentage contributions to global GDP growth
Asian Development Outlook 2015

High overall growth, but divergence across countries
East Asia South Asia Southeast Asia
Central Asia
The Pacific0
2
4
6
8
10
12 2014 2015f 2016f5-year ave. 10-year ave.
9
f: forecast Asian Development Outlook 2015
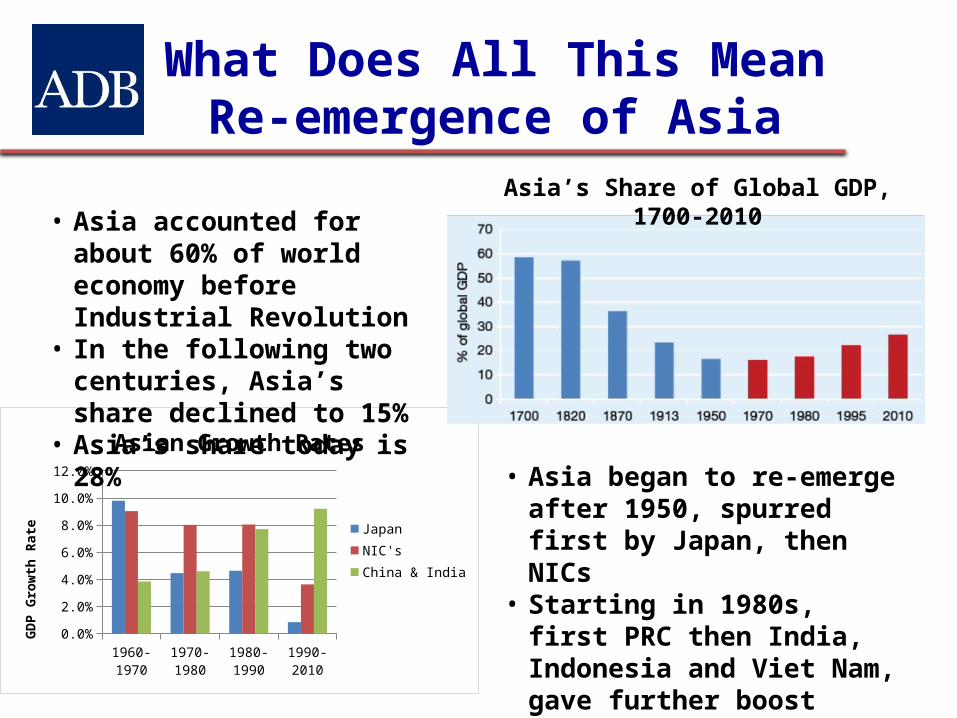
What Does All This MeanRe-emergence of Asia
1960-1970 1970-1980 1980-1990 1990-20100.0%
2.0%
4.0%
6.0%
8.0%
10.0%
12.0%
Asian Growth Rates
JapanNIC'sChina & India
GDP
Grow
th R
ate
• Asia began to re-emerge after 1950, spurred first by Japan, then NICs
• Starting in 1980s, first PRC then India, Indonesia and Viet Nam, gave further boost
• Asia accounted for about 60% of world economy before Industrial Revolution
• In the following two centuries, Asia’s share declined to 15%
• Asia’s share today is 28%
Asia’s Share of Global GDP, 1700-2010

The Asian Century
Asia; 52%
North America; 13%
Latin America & Caribbean; 10%
Europe, 18%
Sub Saharan Africa, 2%
Middle East & North Africa, 3%
Rest of World, 2%
Asian Century Scenario
Asia; 31%
North Amer-ica; 21%
Latin America & Car-ibbean, 9%
Europe, 28%
Sub Saharan Africa, 4%
Middle East & North Africa, 5%
Rest of World, 2%
Middle Income Trap Scenario
Asian GDP: $65 trillionAsian GDP per capita: $20,600
Asian GDP: $174 trillionAsian GDP per capita: $40,800
Asian century driven by Asia 7: India, Indonesia, Japan, Malaysia, PRC, Republic of Korea, and Thailand - projected to account for 90% of
Asia’s growth between 2010 and 2050
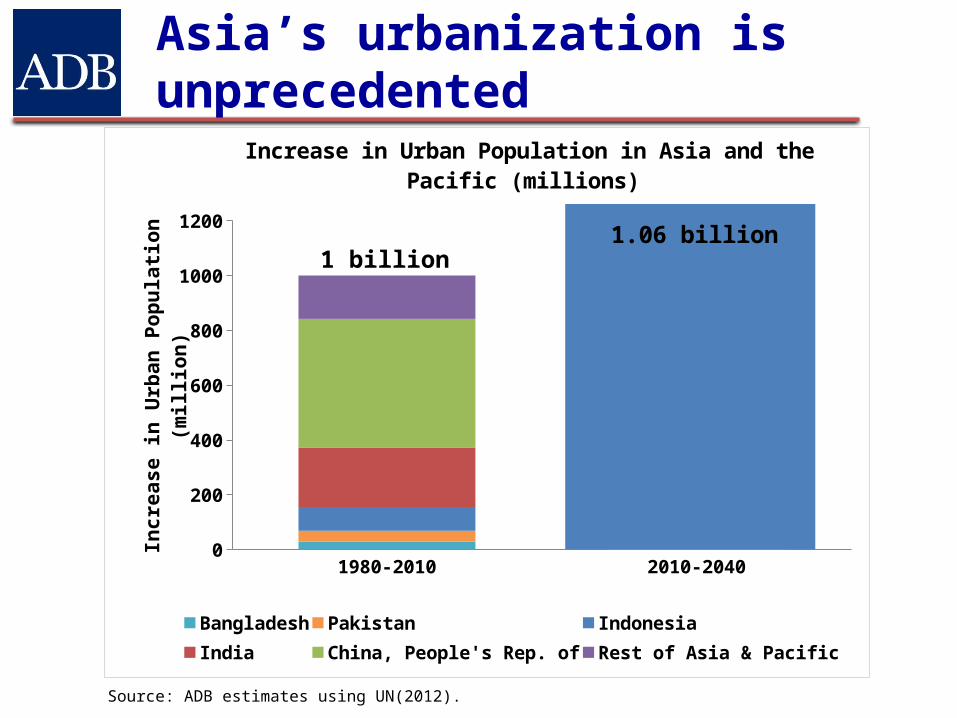
1980-2010 2010-20400
200
400
600
800
1000
1200
Increase in Urban Population in Asia and the Pacific (millions)
Bangladesh Pakistan Indonesia India China, People's Rep. ofRest of Asia & Pacific
Incr
ease
in U
rban
Pop
ulati
on (m
illio
n) 1.06 billion1 billion
Asia’s urbanization is unprecedented
Source: ADB estimates using UN(2012).
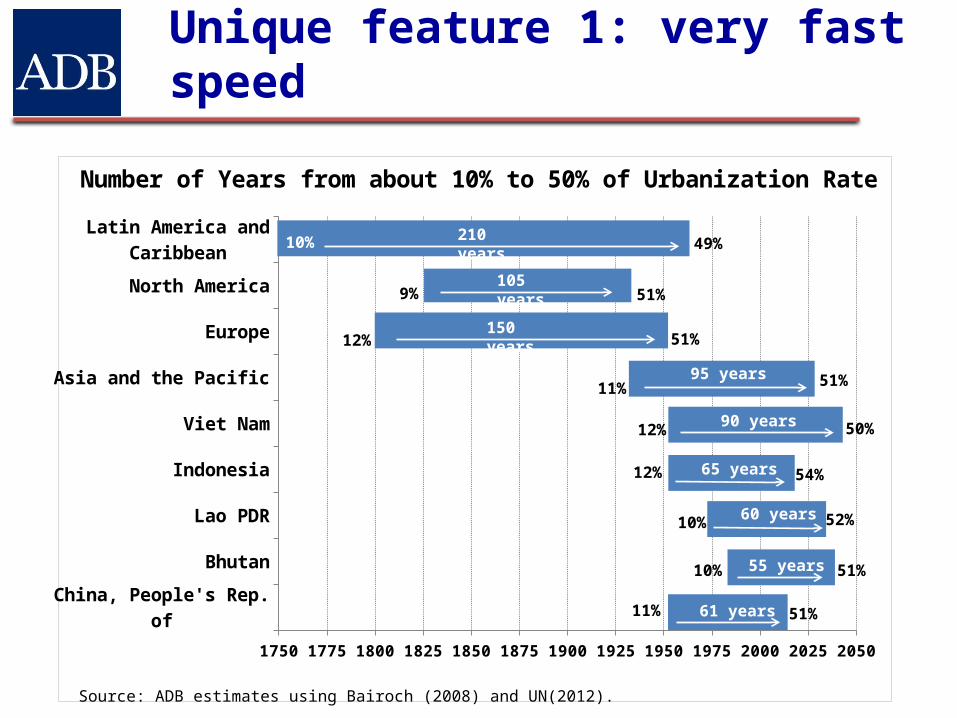
China, People's Rep. of
Bhutan
Lao PDR
Indonesia
Viet Nam
Asia and the Pacific
Europe
North America
Latin America and Car-ibbean
1750 1775 1800 1825 1850 1875 1900 1925 1950 1975 2000 2025 2050
Number of Years from about 10% to 50% of Urbanization Rate
10% 49%210 years
9% 51%105 years
12% 51%150 years
11% 51%95 years
12% 50%90 years
12% 54%65 years
10% 52%60 years
10% 51%55 years
11% 51%61 years
Unique feature 1: very fast speed
Source: ADB estimates using Bairoch (2008) and UN(2012).

Unique feature 2: highest densities in the world…
Mumbai
Kolkata
KarachiLa
gos
Shenzhen
Seoul/Inch
eon
Taipei,China
Chennai
Bogota
ShanghaiLim
a
BeijingDelhi
Kinshasa
Manila
Tehran
Jakarta
Tianjin
Bangalore
Ho Chi Minh City
Cairo
Baghdad
Shenyang
Hyderabad
São Paulo0
5000
10000
15000
20000
25000
30000
35000
Top 25 World's Cities Ranked by Density, 2007
Den
sity
(per
son/
m2)
Asia & the Pacific (17/25)AfricaEurope Latin America & CaribbeanMiddle East & North Africa
Source: www.citymayors.com

Unique feature 3: many megacities
Megacities, 2010
ASIA: 12/23
Note: The circles indicate population sizes ranging from (10 million) to (39 million). The circles do not reflect the physical extents of the cities and any overlap between them merely reflects their relative population sizes and not any official acceptance or endorsement of any geographical sovereignty.
Source: UN (2012).

Unique feature 4: low starting base
19501955
19601965
19701975
19801985
19901995
20002005
20102015
20202025
20302035
20402045
20500
10
20
30
40
50
60
70
80
90
100Level of Urbanization by Region (%)
Leve
l of U
rban
izati
on (%
)
52%
43%
67%
63%
Northern America
Europe
Latin Americ
a & Caribbean
WORLD
ASIA & PACIFIC
Africa
Source: ADB estimates using Bairoch (2008) and UN(2012).
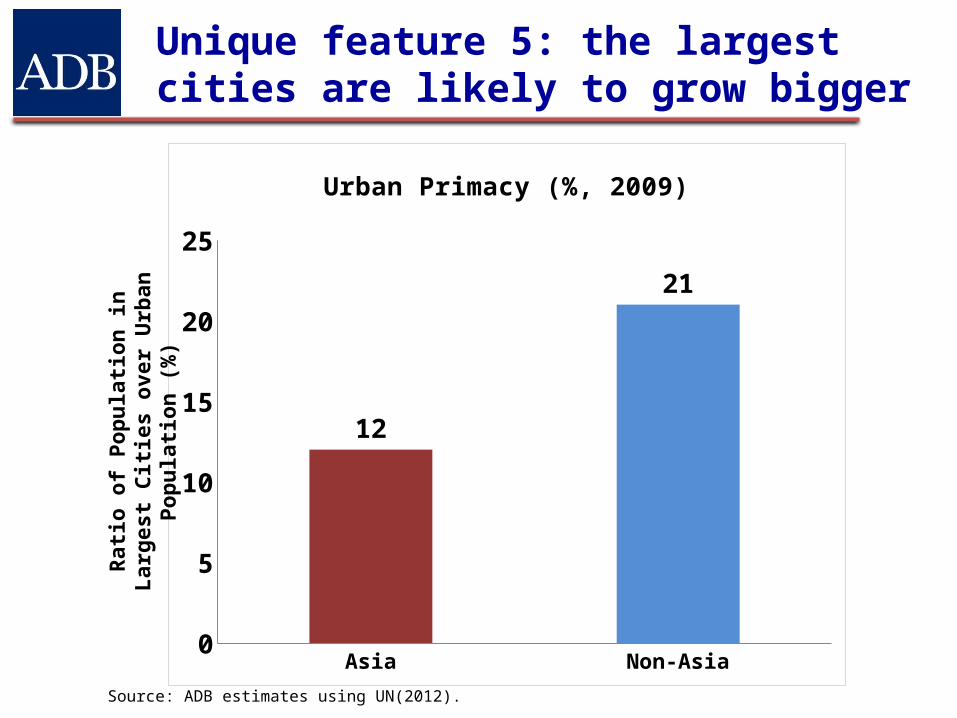
Asia Non-Asia0
5
10
15
20
25
12
21
Urban Primacy (%, 2009)
Rat
io o
f P
op
ula
tio
n in
Lar
ges
t C
itie
s o
ver
Urb
an P
op
ula
tio
n (
%)
Unique feature 5: the largest cities are likely to grow bigger
Source: ADB estimates using UN(2012).
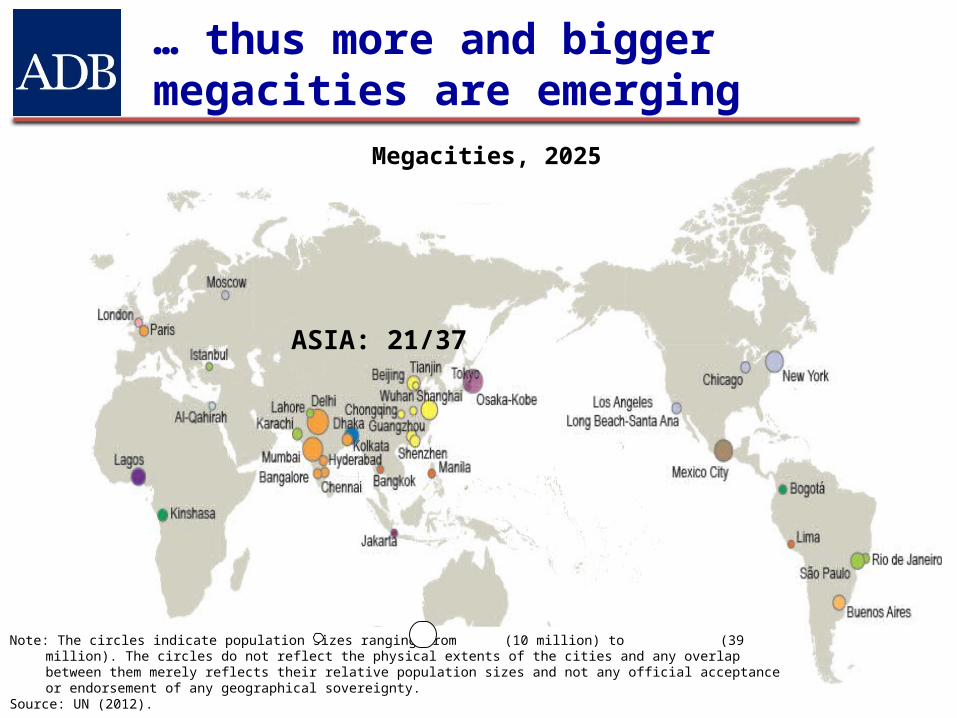
… thus more and bigger megacities are emerging
Megacities, 2025
ASIA: 21/37
Note: The circles indicate population sizes ranging from (10 million) to (39 million). The circles do not reflect the physical extents of the cities and any overlap between them merely reflects their relative population sizes and not any official acceptance or endorsement of any geographical sovereignty.
Source: UN (2012).

Asia’s financing requirements are huge
19
Source: ADB, 2009. Infrastructure for a Seamless Asia. Manila
Total of $8.3 trillion (2010–2020) or $750 billion/year

Source: Various reports compiled by ADB
In Asia the infrastructure gap means
People without Access to:
Water and Sanitation 900 million people
Electricity 800 million people
Roads 1.2 billion people
Internet 80% of Asia
20

Deep DiveSustainable Infrastructure
S. Samuel TumiwaDeputy Representative
North America Representative Office
Canada Business Opportunities SeminarHalifax – Montreal – Calgary – Saskatoon
September 2015 21
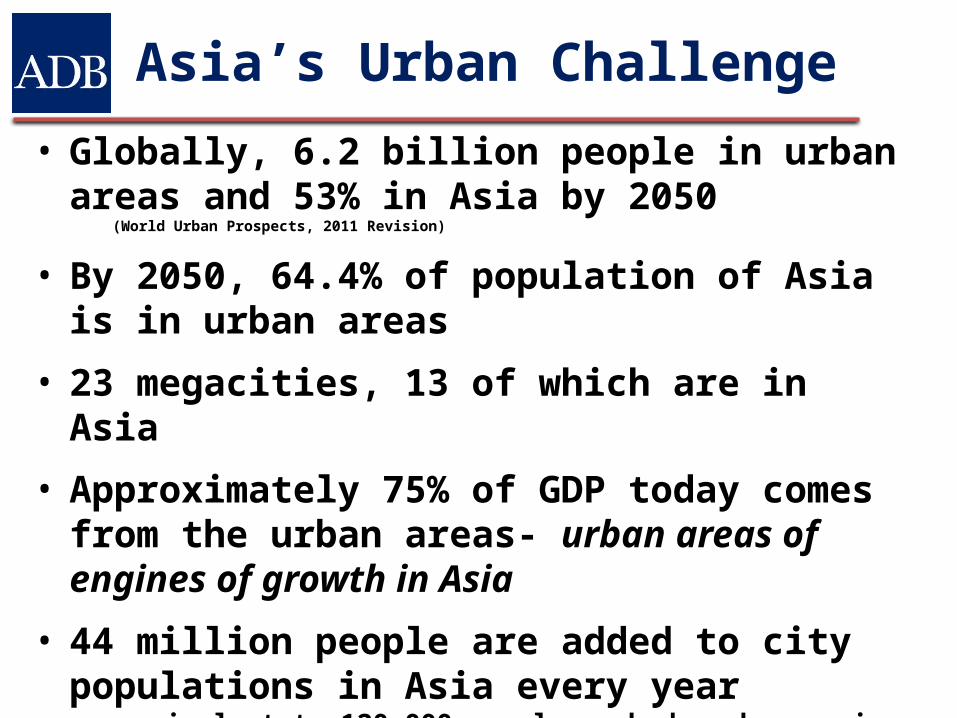
Asia’s Urban Challenge
• Globally, 6.2 billion people in urban areas and 53% in Asia by 2050
(World Urban Prospects, 2011 Revision)
• By 2050, 64.4% of population of Asia is in urban areas
• 23 megacities, 13 of which are in Asia
• Approximately 75% of GDP today comes from the urban areas- urban areas of engines of growth in Asia
• 44 million people are added to city populations in Asia every yearo equivalent to 120,000 people each day who require construction of
more than 20,000 new dwellings, 250 km of new roads and additional infrastructure to supply more than 6000 liters of potable water
23
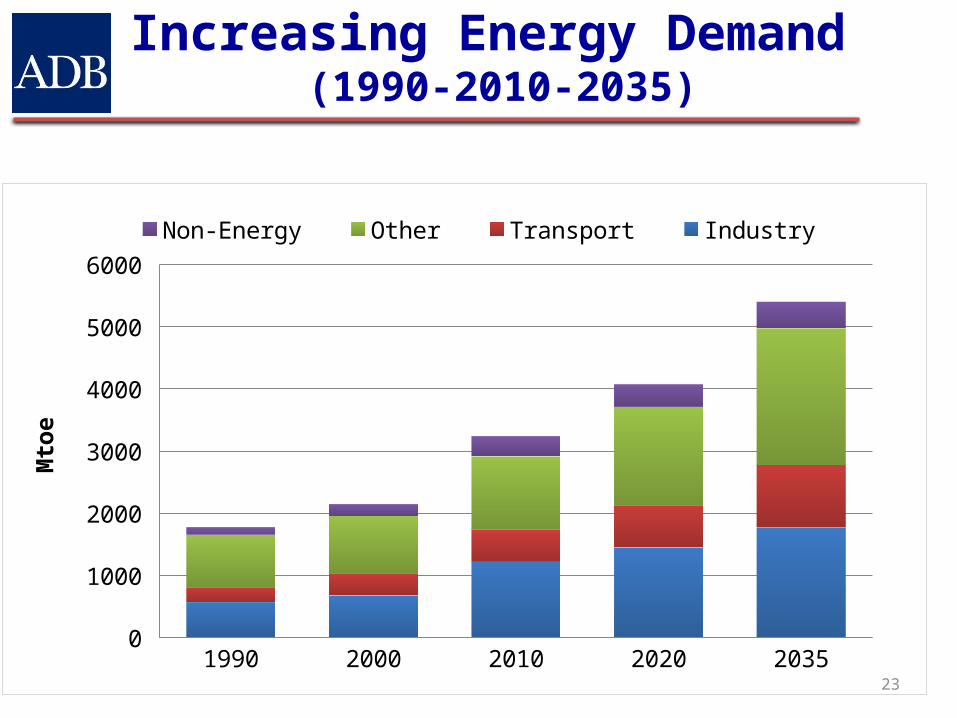
1990 2000 2010 2020 20350
1000
2000
3000
4000
5000
6000 Non-Energy Other Transport Industry
Mto
eIncreasing Energy Demand
(1990-2010-2035)

Road to Nowhere
24
Beijing, 2010

ADB’s Water Financing Program 2006-2020
Urban WaterRural Water Basin Water
• Rural water – rural water supply and sanitation; irrigation and drainage
• Urban water – urban water supply, sanitation and wastewater management
• Basin water – water resources development and management, flood management, wetlands and watershed protection, hydropower

How Does it Really Work?
S. Samuel TumiwaDeputy Representative
North America Representative Office
Canada Business Opportunities SeminarHalifax – Montreal – Calgary – Saskatoon
September 2015
26
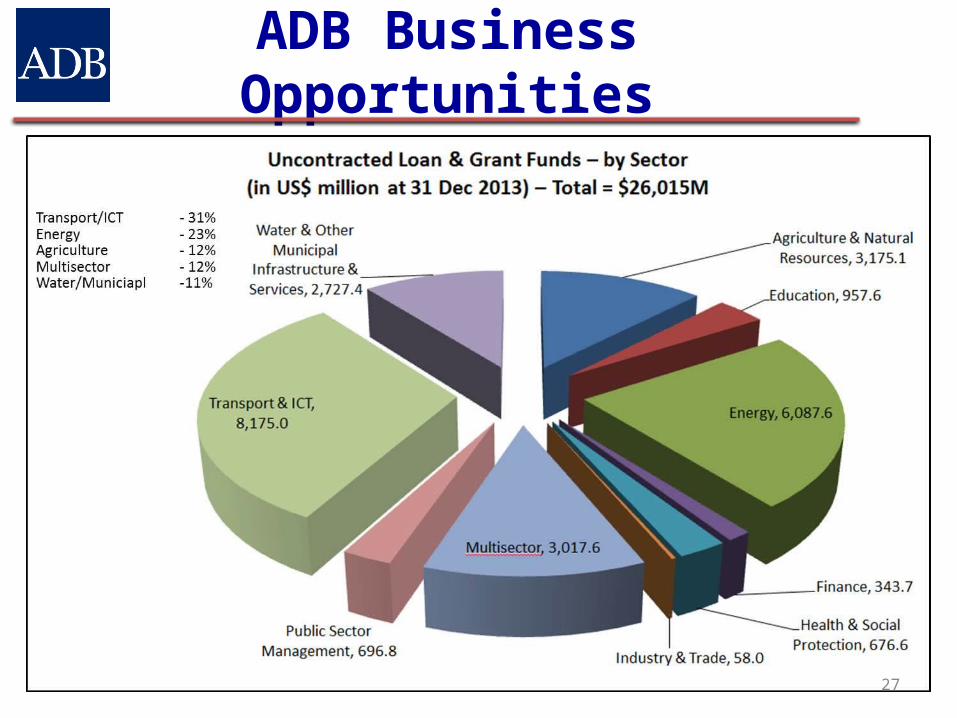
ADB Business Opportunities
27

ADB Business Opportunities
28
Almost all ADB
projects rely on
Consultants and
Contractors
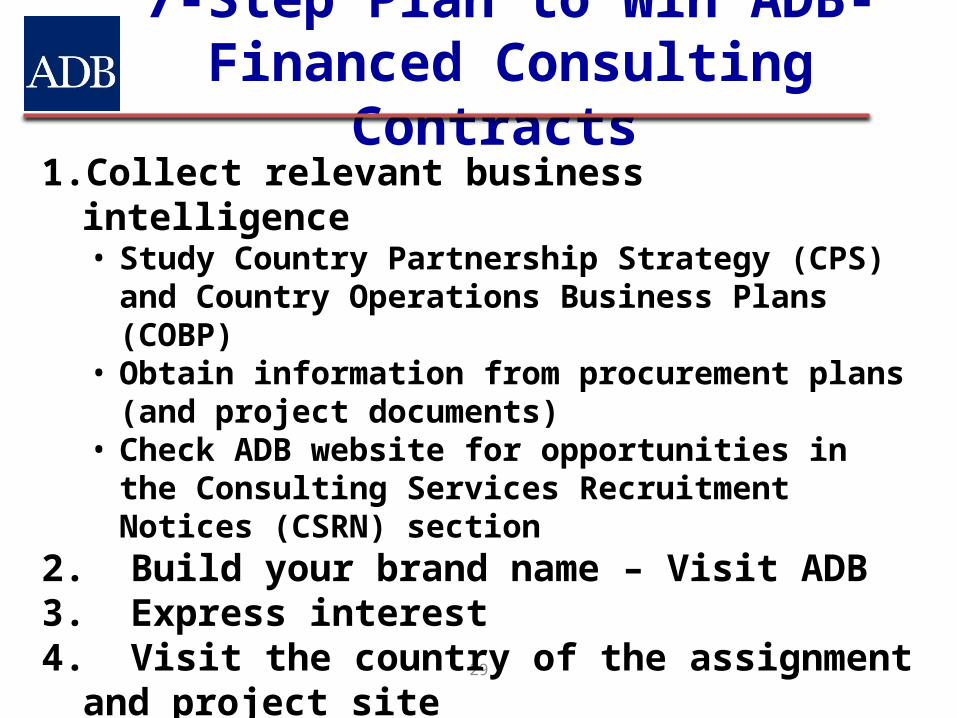
7-Step Plan to Win ADB-Financed Consulting Contracts
29
1. Collect relevant business intelligence • Study Country Partnership Strategy (CPS) and Country
Operations Business Plans (COBP) • Obtain information from procurement plans (and project
documents) • Check ADB website for opportunities in the Consulting
Services Recruitment Notices (CSRN) section 2. Build your brand name – Visit ADB3. Express interest 4. Visit the country of the assignment and project site 5. Offer partnership to firms likely to be shortlisted 6. Prepare a responsive and strong technical proposal 7. Do good work

Business Opportunities Fair and ADB’s Project Pipeline
30
ADB’s yearly Business Opportunities Fair - How to register
http://www.adb.org/news/events/6th-adb-business-opportunities-fair-2015
Background on the 2015 Business Opportunities Fair including Project Pipelines across countries and sectors
http://adbprocurementforum.net/?page_id=2362

Supplemental Slides
S. Samuel TumiwaDeputy Representative
North America Representative Office
Canada Business Opportunities SeminarHalifax – Montreal – Calgary – Saskatoon
September 2015
31

Vision An Asia and Pacific
region free of poverty
Strategic Agenda1. Inclusive Economic Growth2. Environmentally Sustainable3. Regional Integration
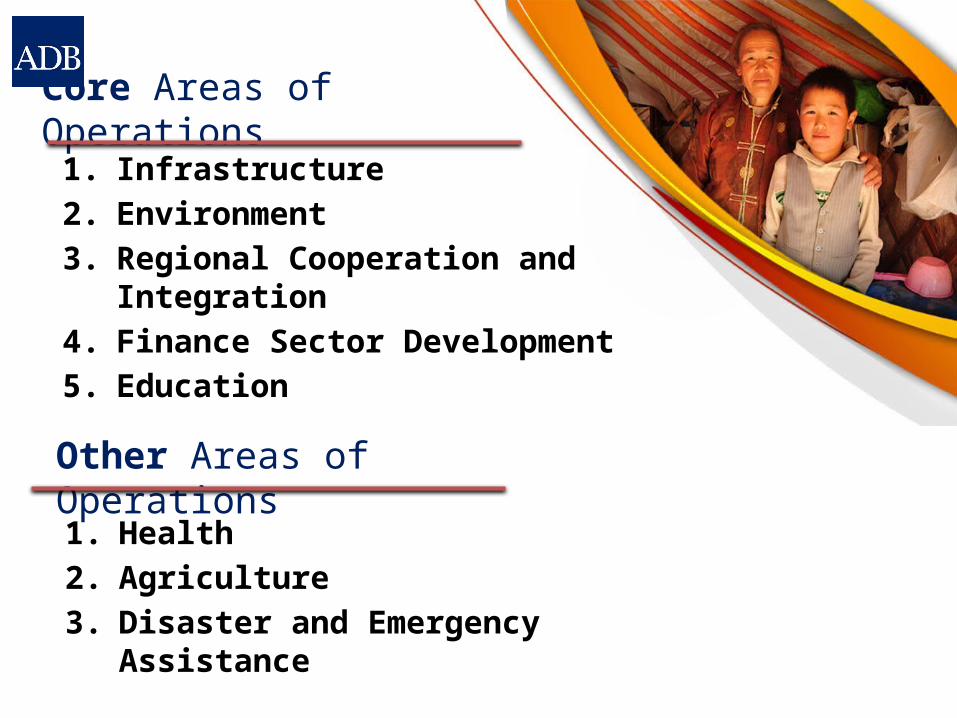
Core Areas of Operations
1. Infrastructure2. Environment3. Regional Cooperation and Integration4. Finance Sector Development5. Education
Other Areas of Operations
1. Health2. Agriculture3. Disaster and Emergency Assistance
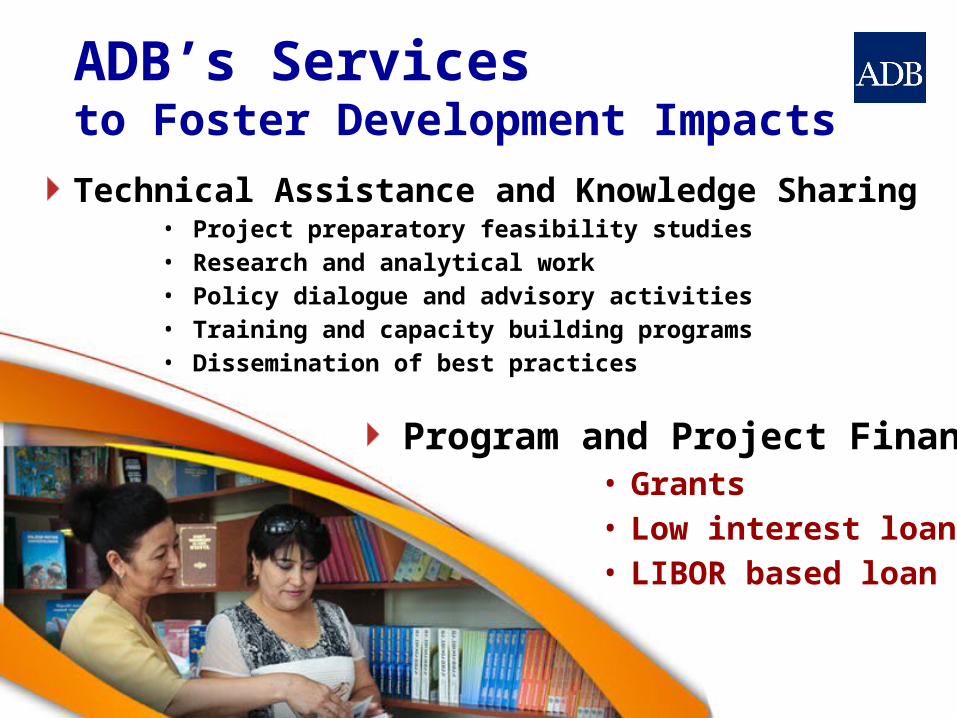
Technical Assistance and Knowledge Sharing• Project preparatory feasibility studies• Research and analytical work• Policy dialogue and advisory activities• Training and capacity building programs• Dissemination of best practices
ADB’s Services to Foster Development Impacts
Program and Project Financing• Grants• Low interest loan • LIBOR based loan

Samuel TumiwaDeputy Representative
North America Representative Office
900 17th Street, N.W. Suite 900Washington, DC 2006
202 728 [email protected]
35