what if your boss is a woman? work organization, work-life ... · what if your boss is a woman?...
TRANSCRIPT

What if your boss is a woman? Work
organization, work-life balance and gender
discrimination at the workplace
Claudio Lucifora∗1 and Daria Vigani†2
1UCSC and IZA2UCSC
June 10, 2015
Abstract1
In this paper we use EWCS data, covering up to 30 European countries for the period 1995-2010,to investigate the association between female leadership, work organization practices and genderdiscrimination reported by employees within firms. We find that having a female "boss" is associatedwith lower overall gender discrimination at work, which is reinforced by the presence of a betterbalance between work and life, and a supportive work environment. This effect, however, is shownto be different across gender: lower discrimination among female employees, and positive amongmale employees. The above results are shown to be consistent with theories of taste or statisticaldiscrimination. We also investigate the underlying mechanisms that shape gender discriminationwithin firms. We find evidence of a "women helping women" effect, whereby female leadershipgenerates spill-over effects which reduce discrimination and improve career prospects among women,while opposite effects are found among men particularly in female-dominated jobs. Flexible workingtime and female-friendly practices, particularly among women in high-skilled occupations, are shownto complement the effect of female leadership in reducing gender discrimination. The above resultsare robust to a number of specification changes and with respect to different sub-populations inour sample. To account for the potential endogeneity and selection issues arising from the non-random distribution of females in supervisory and managerial positions, we jointly estimate theselection process and the probability of experiencing discrimination, finding support for a causalinterpretation of our results.
JEL classification: J16, J70, J81Keywords: Gender discrimination, Female leadership, Work organization
∗Department of Economics and Finance, Università Cattolica, Largo Gemelli, 1 (20123) Milan.e-mail: [email protected]†Corresponding author: Department of Economics and Finance, Università Cattolica, Largo
Gemelli, 1 (20123) Milan. e-mail: [email protected] paper has been prepared for the Conference on "Reducing Inequality in Organizations:
What Works? What Doesn’t?" to be held in NY City on June 4-5 2015. EWCS data have beenprovided by Eurofound.
1

Introduction
Despite the remarkable increase, over the past decades, of female participation ineducation, labor market and political life, women are still paid less than men andare largely under-represented in supervisory, managerial and executive positions. Asreported in a recent study by the European Commission, even if women in Europeaccount for around 45 per cent of employment and over 55 per cent of people intertiary education, their proportion in high-level economic decision-making is stillvery low, as compared to men, with large differences across countries (between 15and 3 per cent, European Commission, 2012). Empirical studies show that, besidescultural factors, market imperfections and social norms, women segregation in lowerlayers of the occupational hierarchy also depends on work organization and equalopportunity practices adopted in organizations (Bertrand et al., 2014; Goldin, 2014).In particular, when the standards for pay rise, performance-related-pay bonuses andpromotions are centered on long working hours, rigid work schedule and seniority,women are less likely to close the wage gap with men and move up the companyhierarchy. Conversely, family-friendly work practices such as part-time work, flexibleworking time and parental leave arrangements make it easier for women with caringresponsibilities to balance work and life (OECD, 2007).
Along with the evidence showing the existence of a gender pay gap and therelative under-representation of women in leadership positions, a growing body ofliterature has investigated the existence of differences in behavioral characteristicsacross gender (Bertrand, 2011; Niederle, 2014). While the empirical evidence is stillcontroversial, different studies, using both experimental and survey-based methods,have shown that women tend to be less individually oriented and more likely to ex-hibit a cooperative behavior (Croson and Gneezy, 2009; Fortin, 2008). Women arealso generally considered more trust-worthy and oriented towards ethical behaviorand integrity (Dollar et al., 2001; Goldin, 2006), they often shy away from compe-tition, are more risk averse and behave more generously when faced with economicdecisions (Dohmen et al., 2011; Niederle and Vesterlund, 2007).
These differences in behavior across gender, particularly when considering highranked and leadership positions, may have important implications in terms of eco-nomic and social outcomes within organizations. Several contributions in the liter-ature have looked at the effect of gender in top management position, in terms ofmanagement style (Bertrand and Schoar, 2003; Matsa and Miller, 2013) as well asgender composition of the board (Ahern and Dittmar, 2012), on firms’ economic andfinancial performance.
Other studies have explicitly focused attention on the effect of gender, in leader-ship positions, on wage policies and equal opportunity practices within organizations(Flabbi et al., 2014; Fortin, 2008). While there is evidence that the introduction ofequal opportunity and equal treatment laws have contributed to reduce gender in-equalities in the labor market, the gender gap in both pay and access to high-rank oc-cupations is still remarkable (IMF, 2013; Weichselbaumer and Winter-Ebmer, 2007).
One aspect that has been less investigated in the economics literature is the directeffect of female leadership and organizational arrangements on gender inequality in
2

firms. Although the relationship between an employee and her supervisor or boss iscentral to the performance of the firm and the well-being of employees they oversee,still relatively little is known about whether having a female manager or supervi-sor makes a difference in terms of gender balance and discriminatory behavior atthe workplace, and if that differs for men and women (Artz et al., 2014; Booth andLeigh, 2010; Cardoso and Winter-Ebmer, 2007; Gagliarducci and Paserman, 2015;Lazear et al., 2012; Neumark and Gardecki, 1998).
In this paper, we take a step in this direction and investigate the associationbetween female leadership (i.e. having a female "boss"), work organization practicesand gender discrimination reported by employees within firms. We contribute todifferent strands of the literature. First, to the literature on discrimination whichhas mainly used indirect measures - such as gender differentials in wages, call-backrates, promotions, etc. -, while we rely on a direct measure of (gender) discrimina-tion experienced and reported by the individuals at the workplace. Second, to theliterature on the effect of leadership on employees outcomes, investigating the effectsof female leadership on gender discrimination at work, which we match with workorganization and work-life balance arrangements to assess whether female-friendlywork practices play a role. Third, we complement existing evidence from labora-tory or field experiments on the behavioral determinants of gender discrimination,using survey-based evidence on a large number of countries and over a long span oftime. Finally, we address the potential endogeneity and selection issues arising fromthe non-random distribution of females, across jobs and occupations, using both a(quasi) fixed-effects strategy as well as explicitly modeling the selection process insupervisory and managerial positions jointly with the probability of experiencingdiscrimination.
The paper is organized as follows. In section 2 we review the evidence on the linksbetween female leadership, work organization arrangements and discrimination at theworkplace. Section 3 describes the data and the main variables of interest. Section 4presents the empirical strategy and our baseline results. In section 5, we delve deeperinto the mechanisms that are at work in shaping the relationship between femaleleadership and gender discrimination. Section 6 and 7 address selection issues andpresent a number of robustness checks. In section 8 we discuss the main implicationsof our findings for company and public policy.
Female leadership, work organization and gender discrim-ination
There are several reasons why female leadership may have an effect on gender in-equalities within firms. First, if wage determination and career advancement are af-fected by taste-discriminatory behavior of (mainly male) supervisors and managers,a larger representation of women at the top of the occupational hierarchy is expectedto reduce the gender wage gap and provide more opportunities (for women) to be pro-
3

moted (Albrecht et al., 2003; Becker, 1957). Second, it has been argued that underimperfect information female managers might be better at inferring other womenunobserved productivity hence reducing statistical discrimination towards women(Aigner and Cain, 1977). In this respect, females are likely to receive higher wageswhen employed by a female manager rather than by a male, while lower wages arelikely to be paid to males by female managers, thus increasing discrimination amongmales. Third, on top of the effect on wages, female leadership may be expected toadopt a management style that is more favorable to women, such as female-friendlypolicies and balanced work-life practices. However, while this is expected to be ben-eficial for women and their well-being, it is less obvious what the effects on menwould be. Fourth, behavioral differences across gender - i.e. such as risk aversion,competitive attitude and gender identity - may affect the way women behave in pre-dominantly male work environment, as opposed to women who are in predominantlyfemale jobs. Finally, quite independently from gender attributes, work practices andpay policies within organization can influence both the share and the distribution ofwomen in the occupational hierarchy as well as the gender wage gap.
The above propositions have been extensively investigated in a number of papers,which have focused on specific segments of the labor market and on selected countries,reporting mixed evidence. Cardoso and Winter-Ebmer (2007) find evidence, forPortugal, that female executives increase women’s wages within the organization,while they lower men’s wages compared to male executives. Bell (2005) investigatesthe gender pay gap in executive positions in US firms and shows that the magnitudeof the gender pay gap is statistically related to the gender of the CEO, such thatfemale executives are found to promote more women and pay them more as comparedto male executives.
A recent study, by Flabbi et al. (2014), has looked at the effect of female lead-ership, among Italian CEO, on the entire distribution of wages. Their findings showthat females at the top (bottom) of the wage distribution receive higher (lower) wageswhen employed in a firm led by a female CEO; while the opposite holds for men (i.e.lower wages at the top and higher at the bottom). The idea is that female leadershipis able to reverse statistical discrimination against women, but the side effect is asimilar distortion on men’s wages. Another interesting implication is that a changefrom male to female leadership reduces gender pay inequalities at the top of the dis-tribution and increases them at the bottom, while there is virtually no effects on theaverage wage. These findings have been challenged in a paper by Gagliarducci andPaserman (2015), who study the effect of the gender composition of top managers inGermany on workplace arrangements and pay. They find no statistically significanteffect of female leadership, or the share of women in high-rank occupations, on thegender wage gap. A similar result is found by Bertrand et al. (2014), in the contextof Norwegian firms, who find no effect of female board members on the overall genderwage gap.
While, as discussed above, a female leadership is expected to organize work in
4
a way that is more female-friendly, evidence in this respect is scarce and rathercontroversial. Results show that the effect of female leadership is heterogeneousand depends on a number of factors, such as: the gender composition of lower layerswithin the organization, whether the occupation considered is predominantly male orfemale and how pay incentives are designed. Greater female representation at higherranks has been found to generate positive spillovers on women’s career advancementin Norway (Kunze and Miller, 2014); and in promoting female representation amongdirectors and executives in the US: a pattern that has been called "women helpingwomen" (Matsa and Miller, 2013). In an analysis of the propensity to hire andretain females among athletic directors, Bednar and Gicheva (2014), find instead noevidence that gender is strongly predictive of a supervisor’s female-friendliness.
Experimental and field studies have focused more on the role of behavioral traits.Women are shown to be more likely to enter competitive settings if surrounded byother women rather than men (Niederle and Vesterlund, 2007). Also women applyingto predominantly male jobs seem to experience lower levels of discrimination as com-pared to men applying to predominantly female jobs (Niederle, 2014). There is alsoevidence of a so-called "Queen bee syndrome" whereby women who have reached thetop ranks of the occupational hierarchy, particularly in male dominated occupations,often hinder the career progression of other females (Bagues et al., 2014).
Female leadership and a higher share of women in the firm are also frequentlyassociated with a more favorable work environment in terms of time flexibility andwork-life balance practices, with beneficial effects on wage inequalities and genderbalance in occupational attainment. Of course, working time flexibility, while beingof great value for women, it may also entail a cost for the firm. The traditionalview has always claimed that work-life balance practices are amenities introducedin organizations at the expense of efficiency, such that pay levels in more favorablework environment are expected to be lower. This literature argues that compensatingdifferentials and work practices can explain why there is a gender pay gap withinfirms, and why women tend to be concentrated in selected occupations. In particular,it has been argued that much of the existing gender gap in companies is due to howfirms select, reward and organize the work of their employees who have differentpreferences in terms of time flexibility and work-life arrangements (Goldin, 2014;Goldin and Katz, 2012).
Data and descriptive statistics
Sample selection and variables description
In this study we use four waves (1995, 2000, 2005 and 2010) of the European WorkingConditions Survey (EWCS), covering 30 countries (EU-28 plus Turkey and Norway).EWCS is a unique source of data combining a large coverage of countries with de-tailed information on employees demographics, job attributes, working conditionsand indicators of self-reported satisfaction, health and discrimination at the work-place. The survey is also very rich in terms of management and work organization
5

arrangements (Eurofound, 2012). Our sample includes workers, aged 15 to 65, em-ployed in the non-agricultural sector2. Overall, our final sample consists of 91, 842observations.
Gender discrimination in our dataset is assessed asking respondents to answerthe following question: "Over the past 12 months, have you been subjected at workto discrimination on the basis of your sex?" (yes/no). Hence, what we observe areepisodes of discrimination reported by employees, that are likely to originate froma gender imbalance in the allocation of tasks, a missed promotion or pay increasegranted instead to a co-worker of the opposite sex. In this sense our measure ofdiscrimination is likely to measure only a small share (though extremely relevant) ofthe overall gender discrimination experienced by workers at the workplace. In oursample, around 2% of respondents reported to have experienced gender discrimina-tion, this share goes up to almost 3% when we look at women only, while the shareof men reporting to be (gender) discriminated is lower.
Female leadership is measured through the question "Is your immediate boss aman or a woman?" (yes/no). Respondents whose immediate manager or supervisoris a woman account for 26% of the sample, and over 78% of employees with a femaleboss are women. The share of female bosses has been growing over time, it wasequal to 22% in the 1995 wave and 28% in 2010. It is worth noting that the abovedefinition of female leadership differs, in several ways, from the definition used inmost studies in the literature. First, it is directly reported by the worker and notindirectly inferred from occupational classifications or other external information,which in our case should reduce measurement error and missclassifications. Second,female leadership, in our study, is measured to encompass any leadership positionalong the whole hierarchical structure and not just female CEO or other executivepositions. In this respect, while women who have reached the very top of the or-ganizational hierarchy can certainly make a difference in contrasting discriminatoryattitudes within organization and in promoting more female-friendly work environ-ment, it is probably true that the immediate boss (whether manager or supervisor)is what matters most for gender imbalances and discriminatory behaviors at theworkplace in terms of allocation of workloads, discretionary pay increase and careeradvancement.
In the empirical analysis we include a large set of controls capturing individual,firm and job characteristics. Managerial policies and work organization practices,which may be relevant for gender inequalities within organizations (such as, work-life balance, flexible working time and other female-friendly arrangements), have alsobeen considered and can be grouped into 3 broad areas: work intensity (if the jobinvolves working at high speed or tight deadlines and whether the respondent hasenough time to get the job done), time flexibility (if working more than 40 hours aweek or more than 10 hours a day at least once a month and whether the workerhas the chance to take a break when wished), and work environment ( receiving
2Retired individuals, students in full-time education, self-employed and employees in the armedforce have been excluded.
6

support from colleagues and a measure of work-life balance). Further informationon other working conditions and social activities in which respondents are involvedoutside work are used to carry out robustness and sensitivity analyses. The full listof variables used and their means are reported in Table A1 in the Appendix.
While the information available in EWCS data are ideal to exploit the widedifferences in management, work organization and other gender-based institutionalarrangements across European workplaces, there are also some obvious limitations.Two in particular are worth mentioning: first it is not an employer-employee surveywhich makes impossible to identify employees that work in the same firm and accountfor their common unobserved characteristics; second, it does not allow to follow thesame individuals over time and control for time invariant unobserved heterogeneity.The trade-off, with respect to some existing studies which use employer-employeepanel data drawn from administrative data, is that those studies (with few excep-tions) have to rely on more limited or imprecise information on work practices andfirms attributes, and generally focus on a single country3. In our data the availabil-ity of detailed information on employees’ work tasks and firm’s work organizationpractices, allows us also to investigate the mechanisms through which female leader-ship and female-friendly arrangements are related to gender discrimination, withoutrelegating them to the fixed effects. Moreover, the coverage of up to 30 Europeancountries for nearly two decades, constitutes a clear advantage in terms of general-izability and external validity of our results (Bloom et al., 2009).
Descriptive statistics
Table 1 reports some summary statistics for our main variables of interest comparingjobs where the "boss" is a woman, and where the "boss" is a man. Women are morelikely to have a woman as a boss, while the opposite occurs with men, suggestingthat female leadership is more likely in predominantly female jobs. In general womenbosses, relative to men, are more prevalent in smaller firms and in public sector jobs,while there are no remarkable differences by age or education. Female leadershipis also more concentrated where working long hours (i.e. above 40 hours worked ina week, and more than 10 hours worked in a day) is less diffused, and the overallorganization of work is more female-friendly, that is a less intensive pace of workand better work-life balance arrangements. Notice that the higher concentrationof female-friendly work environments and a higher share of women in jobs with afemale leadership suggests the existence of some sorting of women across jobs andworkplaces on the basis of firms’ work organization practices.
3Cardoso and Winter-Ebmer (2007) use administrative data from the Ministry of Employmentin Portugal; Flabbi et al. (2014) match the Italian social security archive with two company surveys;Bertrand et al. (2014) used data from the Norwegian Registry Archives merged with the Register ofBusiness Enterprises and the Register of Company Accounts. Datta Gupta and Eriksson (2012) andGagliarducci and Paserman (2015) are able to match their employer-employee panel data (the firstfrom Statistic Denmark, the second from IAB and social security data for Germany) with ad-hocworkplace surveys with information on management and work organization practices similar to ourown.
7

Table 1 Descriptive statistics: female leadership, job and firm char-acteristics
Boss Boss Boss Bossman woman man woman
Demographics Job and Firmmale 65.26 21.19 private sector 75.49 56.72female 34.74 78.81 public sector 24.51 43.28
small firm <100 68.73 71.02Age large firm <100 31.27 28.98< 25 11.80 11.9025− 35 29.31 29.11 Work organization36− 55 51.35 50.92 pace of work 62.42 55.91> 55 7.55 8.07 enough time 84.20 83.93
long hours 39.71 29.27Education breaks at work 59.38 53.51compulsory 13.25 10.58 colleagues support 89.90 89.39secondary 52.94 50.26 work-life balance 68.62 74.40tertiary 33.82 39.16
Gender discriminationfemales 3.35 1.83males 0.53 1.49
Total 74.3 25.7N 66,249 22,889
Note: The figures reported in the table are percentages.
Gender discrimination also shows a lower incidence among females when theimmediate boss is a woman (almost 2% for females, 1.5 % for males), while theopposite occurs in jobs with a male boss (more than 3% of females report episodesof discrimination, while less than 1% of males).
On average, part-time is more diffused among women (26.5% as opposed to 6%men in part-time), while a larger fraction of men, as opposed to women, receivespiece-rate or performance-related-pay and reports expecting better career prospects.
In Figure 1, we further inspect the association between gender discrimination(separately for males and females) and the incidence of women (left panel) and theshare of bosses who are women (right panel) in selected occupations. The figure showsthat discrimination among women is highest in predominantly male occupations andit decreases as the share of women increases, conversely for men discrimination ishigher as the share of women in the occupation gets larger. A similar pattern isfound when the share of bosses who are women is used, that is discrimination amongwomen decreases as the share of women bosses increases, while the opposite is truefor men.
The similar trends with respect to gender discrimination between the share ofwomen in the job and having a woman as a boss are also indicative of a patternwhereby the presence of a woman as immediate boss is associated to a larger shareof women in the occupation and a lower gender discrimination for women, but higherfor men.
8

Figure 1 Gender discrimination, female share and female bosses across occupations
Empirical analysis: does having a female "boss" make adifference?
We investigate the relationship between female leadership, as opposed to male, andgender discrimination estimating a model where discrimination is a binary dependentvariable and having a woman as a boss is our variable of interest. Since, as shown inthe descriptive analysis, female leadership is more likely to be found in jobs wherewomen are over-represented and the organization of work is more female-friendly, toisolate the relationship between female leadership and gender discrimination fromother confounding (observable) factors, we control for the share of women in the job(i.e. whether the individual is in a predominantly female (or male) occupation), aswell as a number of work organization attributes. In practice, our baseline model isspecified as follows:
Pr(Discrijt = 1) = φ(α+ γbosswomanijt + δfemaleshareijt + β1WOijt + (1)
+ β2Xijt + cj + tt + εijt)
where Discrijt denotes the realization of the latent dummy variable that takesvalue 1 if individual i has experienced and reported gender discrimination at theworkplace, in country j, at time t. The variable bosswomanijt is a binary indicatorcapturing that the employee has a woman as immediate boss, femaleshareijt isthe share of females in the job4. WOijt is a vector of work organization variablesthat describe how workers perform their task (whether the job involves working athigh speed or tight deadlines, or not having enough time to get the job done), how
4Female share represents the average share of women in the job defined as: country-year-occupation-firmsize.
9

working time is structured (working more than 40 hours a week or more than 10hours a day, and the possibility of taking a break when wished), and whether thereis a good work environment (possibility to balance work schedules with family andsocial commitments, as well as receiving support from colleagues). Finally, Xijt isa vector of covariates, controlling for demographics (gender, age groups, educationalattainment and marital status), job-related characteristics (occupational dummies at2-digit ISCO-88) and other firm characteristics (industry dummies at 2-digit NACE,log of firm’s size and public sector). All estimations also include country (cj) andtime fixed effects (tt).
In some further specifications we include additional controls for the work environ-ment (such as employees’ satisfaction with working conditions, job security, favorablework environment and having friends at work), as well as information on individualattitudes (such as risk aversion5), and their social preferences (activities in whichthey are involved outside work).
Equation (1) is estimated as a simple probit on the pooled sample, as well asseparately for females and males to see whether women bosses have different attitudestoward female and male subordinates.
One fundamental problem in estimating equation (1) is that the presence ofwomen in supervisory and managerial positions within organizations is unlikely to berandomly distributed across jobs and workplaces. In other words, differences betweenjobs in which the boss is female and those where the boss is male might depend, ontop of some observed factors, also on unobserved job and workplace characteristics.Moreover, the likelihood of observing more females in some jobs, as well as morefemale bosses, may also depend on the lower propensity to discriminate againstwomen, such that reverse causation is also likely to affect our estimates. Whilewe do a good job in controlling for most factors that, in the gender discriminationliterature, have been shown to be relevant in explaining inequalities across genderat the workplace, still estimates obtained from equation (1) cannot be interpret ina causal way. To address the potential problems associated with the existence of aselection process driving females in leadership positions, we complement our analysiswith a (quasi) fixed effects strategy6, as well as estimating the selection process jointlywith the probability of reporting discrimination. In this case, the identificationstrategy is based on external information concerning institutional differences in thegenerosity of national parental leave systems (length of parental leave and associatedcash benefits), as well as other labor market institutions affecting the employmentand career opportunities of women (employment protection legislation).
5To measure employees’ risk aversion we exploit the following questions: "Does your job requirethe use of protective equipment?" and "Do you always use it when it’s required?" the latter ishowever available only in the 5th wave.
6Given the limited-dependent variable structure of the model to be estimated, the implementa-tion of a simple probit with fixed-effects it is not straightforward as it does not deliver consistentestimates of the parameters of interest.
10

Results
Table 2 reports the estimated coefficients of equation (1) under different specifica-tions. In column 1 we include the bosswoman dummy variable, the female dummyand the share of females in the job, while we always include the controls reportedat the bottom. In columns 2 to 4 additional variables are added for work intensity,time flexibility and work environment.
Table 2 Gender discrimination and female leadership
(1) (2) (3) (4)
bosswoman -0.158*** -0.177*** -0.177*** -0.181***(0.0524) (0.0522) (0.0522) (0.0528)
female (dummy) 0.699*** 0.720*** 0.753*** 0.756***(0.0572) (0.0580) (0.0599) (0.0613)
Work intensitypace of work 0.247*** 0.215*** 0.192***
(0.0500) (0.0506) (0.0522)enough time -0.298*** -0.244*** -0.195***
(0.0503) (0.0506) (0.0514)Time Flexibilitylong hours 0.246*** 0.193***
(0.0464) (0.0484)breaks at work -0.185*** -0.169***
(0.0431) (0.0437)Work Environmentcolleagues support -0.0997*
(0.0599)work-life balance -0.365***
(0.0538)
Demographics 3 3 3 3Industry and occupation 3 3 3 3Country Dummies 3 3 3 3Year Dummies 3 3 3 3
constant -2.591*** -2.449*** -2.500*** -2.146***(0.181) (0.193) (0.206) (0.222)
pseudo-R2 0.0827 0.1009 0.1106 0.1214N 66,249 65,332 64,821 63,318
* p < 0.1, ** p < 0.05, *** p < 0.01; robust standard errors in parentheses.Demographics include: 3 age classes, 2 dummies for educational attain-ment,dummy for the presence of a spouse or partner and share of females injob.Industry and occupation controls include: 7 dummies for occupation, 9 dum-mies for industry, log of firm size and a public sector dummy.
The estimated coefficient on the female dummy indicates that women alwaysreport higher gender discrimination at the workplace, as opposed to males. Othercontrols for demographic attributes (not reported in Table 2) show that discrimina-tion is lower for older workers and those in couple, while the share of women in thejob and educational attainment are never statistically significant7. The presence of afemale boss is statistically significant and negatively associated with gender discrim-ination, and the results do not change (see the estimated coefficient of bosswoman incolumns 2, 3 and 4) when we add variables on work organization practices, work-lifebalance and favorable work environment. In our preferred specification, reportedin column 4, work organization attributes show that high work intensity (in terms
7The full set of results is presented in Appendix Table A2.
11
of pace of work together with not having enough time to get one’s job done) arepositively correlated with gender discrimination, while time flexibility (in terms ofworking long hours and being able to take a break when needed) and a favorablework environment (work-life balance and support from colleagues) are negativelycorrelated with discrimination.
These findings suggest that female leadership is associated to lower reported gen-der discrimination at work, which is reinforced by the presence of a supportive workenvironment and a better balance between work and life. In terms of (average)marginal effects, shifting from a male to a female boss - ceteris paribus - implies anoverall reduction of 0.6 per cent in the likelihood of reporting gender discrimination.This is consistent with both taste and statistical theories of discrimination. In thefirst case, women managers and supervisor are found to have no (or at least lower)taste for gender discrimination, as opposed to male managers, which could be ratio-nalized in terms of prejudice, cultural factors and social norms (Bertrand, 2011). Inthe second case, women managers and supervisor are deemed to be better at assess-ing the (unobserved) productivity of women, thus improving the (gender) allocationof work and the rewards thereby reducing discrimination (Aigner and Cain, 1977).
An underlying hypothesis of the specification adopted in Table 2 is that, whilegender discrimination is found to be higher among women, the association of havinga woman as a "boss" (as well as other characteristics) with gender discriminationis restricted to be the same across males and females. However, as found in theliterature, the gender of a "boss" may be expected to play a role in shaping therelationship between discrimination, the work environment and leadership. To as-sess this, in Table 3, we replicate our preferred specification separately for male andfemale workers. Interestingly, the coefficient on the variable bosswoman shows anopposite sign across gender: female leadership, ceteris paribus, is found to be asso-ciated with a lower likelihood of gender discrimination among female workers, whilethe likelihood is higher among males.This finding supports earlier evidence from laboratory and field experiments showingthat women bosses tend to behave differently when dealing with female co-workers,as opposed to males, as well as when employed in predominantly female jobs com-pared to male-dominated jobs. In the context of statistical discrimination this alsoconfirms the earlier hypothesis that women bosses may have a comparative advan-tage in assessing females (unobserved) quality but not that of males, such that thelower gender discrimination reported by women may come at a cost of a higher dis-crimination reported by men. In terms of (average) marginal effects, a shift frommale to female boss is associated with a reduction in the probability of reportingdiscrimination among females of about 1.5 per cent, whereas it shows a 0.6 per centhigher probability of discrimination among males. While this effects may appearsmall in magnitude, it should be remembered that our indicator of gender discrimi-nation measures a "rare" event, that is an explicit episode of discrimination occurredto the individual over the past 12 months. Since the effect of discrimination cumu-lates over the working life of employees, a more meaningful estimate of the overallimpact of female leadership can be obtained multiplying the coefficient for the aver-
12

age tenure of employees with a female boss, that is -12, 75 for women and +5, 94 formen8.
Table 3 Gender discrimination and female leadership (by gender)
Females Males
(1) (2) (3) (4) (5) (6)
bosswoman -0.241*** -0.245*** -0.245*** 0.226** 0.226** 0.209**(0.0556) (0.0555) (0.0563) (0.0984) (0.0991) (0.0992)
Work intensity
pace of work 0.237*** 0.190*** 0.157*** 0.325*** 0.321*** 0.319***(0.0567) (0.0578) (0.0597) (0.0968) (0.0972) (0.0996)
enough time -0.281*** -0.225*** -0.180*** -0.339*** -0.294*** -0.240***(0.0624) (0.0630) (0.0651) (0.0853) (0.0829) (0.0805)
Time Flexibility
long hours 0.336*** 0.273*** 0.0824 0.0532(0.0554) (0.0567) (0.0805) (0.0870)
breaks at work -0.216*** -0.193*** -0.0928 -0.0934(0.0513) (0.0523) (0.0794) (0.0792)
Work Environment
colleagues support -0.128* -0.0271(0.0717) (0.120)
work-life balance -0.414*** -0.275***(0.0635) (0.0952)
Demographics 3 3 3 3 3 3
Industry and occupation 3 3 3 3 3 3
Country Dummies 3 3 3 3 3 3
Year Dummies 3 3 3 3 3 3
constant -1.522*** -1.549*** -1.108*** -2.850*** -2.884*** -2.729***(0.228) (0.238) (0.252) (0.383) (0.407) (0.446)
pseudo-R2 0.0671 0.0827 0.0963 0.1279 0.1288 0.1354N 32782 32549 31637 31463 31195 30624
* p < 0.1, ** p < 0.05, *** p < 0.01; robust standard errors in parentheses.Additional controls as in Table.2.
Work organization attributes also show interesting differences and similaritiesacross gender. Overall high work intensity, measured by the pace of work and nothaving enough time, is positively associated to reported gender discrimination forboth male and females, suggesting that the workload in the allocation of tasks con-tributes to gender imbalances within organizations. Conversely time flexibility, interms of working long hours and taking a break during working when needed, onlyaffects discrimination for female workers, having no effects on males. In line with thefindings of Goldin (2014) - who argues that part of the gender pay gap found in mostsectors and occupations can be explained by the presence of very high rewards to(long) hours worked - we find that long and rigid working time schedules contributeto gender inequalities among women but not among men.
In other words, since women typically value more working time flexibility thanmen, long hours of work impose a larger implicit cost and finally a higher perceived
8Average tenure is equal to 8.5 years for females and 9.9 years for males.
13

discrimination on women. Practices directed at improving employees work-life bal-ance are strongly and negatively associated with gender discrimination for both sexes,with an estimated (average) marginal effect significantly larger for females. Otheraspects of the work environment, such as getting colleagues’ support, are only weaklyassociated with a lower discrimination for females, while the relationship is not sta-tistically significant for men.
Overall, the above results confirm a number of stylized facts traditionally foundin the gender discrimination literature. First, the presence of women in leadershippositions is associated to a lower overall gender discrimination, both because it iswomen who mainly experience discrimination within workplaces and because theestimated marginal effect of the boss woman dummy is larger (and negative) forwomen as compared to men (where it is positive), suggesting that the effect on womenalways dominates that on men. Second, gender discrimination in organizations isgenerally associated to unfavorable work organization practices, while it is alleviatedby better work-life balance arrangements that are more diffused in predominantlyfemale jobs.
While the above findings are indicative of the role of women bosses and workorganization practices on gender inequalities and discriminatory behavior, they donot shed light on the channels through which female leadership and female represen-tation interact within workplaces. The next section is devoted to the investigationof the mechanisms that shape gender differences and discriminatory behavior in or-ganizations.
Mechanisms
There are several ways through which female leadership may influence gender imbal-ances and discrimination within firms. The fundamental hypothesis is that bossesgenerate spillovers on subordinates in terms of firms’ hiring, promotion and compen-sation policies, as well as work organization practices, and that the gender of theboss may shape the way these policies are implemented.
The women helping women hypothesis
In general, spillovers from female bosses are assumed to be effective in reducinggender imbalances, which is what justifies public policies to promote female leader-ship (such as affirmative action and quotas). However, as shown in the empiricalliterature, spillovers from (female) bosses are likely to be very heterogeneous accord-ing to the gender of the subordinate, the share of females in the occupation andother workplace attributes. Although the evidence from existing studies is mixed,the main findings suggest that female bosses are more likely to promote women andpay them more, as compared to male bosses, which should reduce gender inequalitiesand discrimination against females. Spillover effects often work in opposite directionwhen the subordinate is a male, suggesting that men may lose out when their boss iswoman, rather than a man (Cardoso and Winter-Ebmer, 2007; Flabbi et al., 2014).
14
Moreover, these effects are likely to differ in predominantly female (male) jobs, dueto behavioral differences across gender - such as risk aversion, competitive attitudeand gender identity -, as well as for compositional effects, since it is more difficult topromote a woman when women are the majority in a given layer of the occupationalhierarchy. Female leadership can also have negative spillovers on gender discrim-ination, when for example women in managerial or supervisory position use theirdiscretional power to prevent other women from receiving pay bonuses or progress-ing in the occupational hierarchy (Bagues et al., 2014).
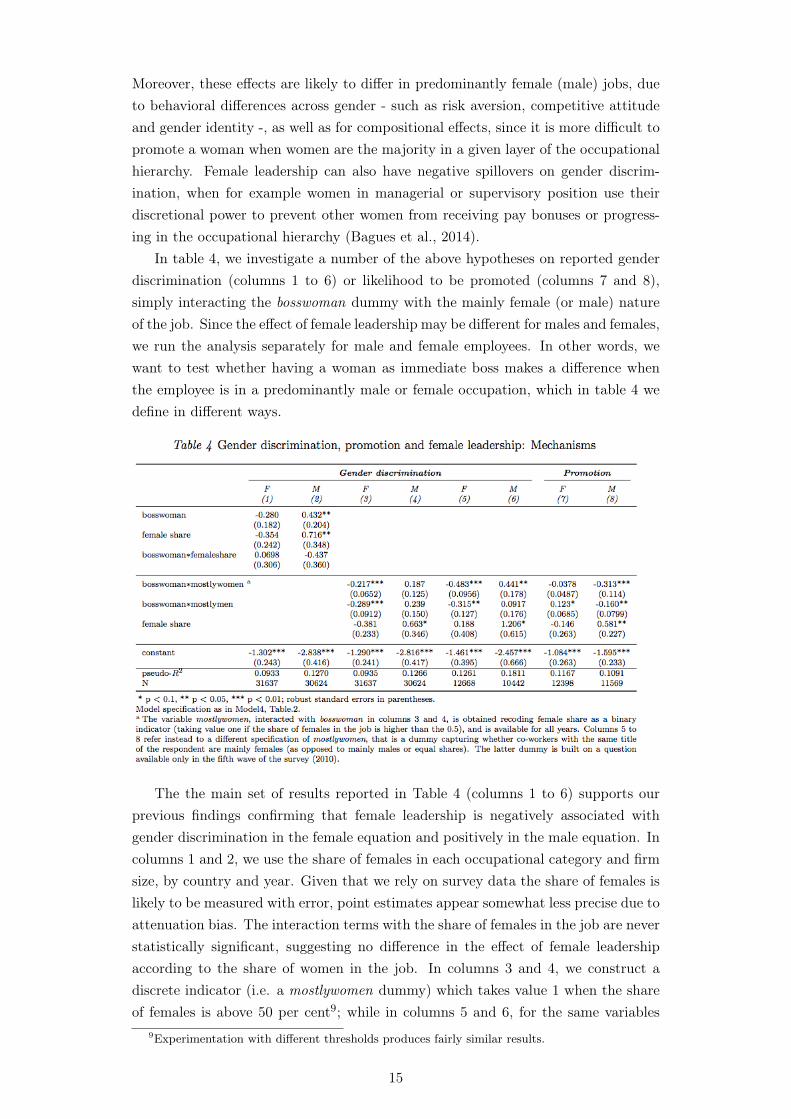
In table 4, we investigate a number of the above hypotheses on reported genderdiscrimination (columns 1 to 6) or likelihood to be promoted (columns 7 and 8),simply interacting the bosswoman dummy with the mainly female (or male) natureof the job. Since the effect of female leadership may be different for males and females,we run the analysis separately for male and female employees. In other words, wewant to test whether having a woman as immediate boss makes a difference whenthe employee is in a predominantly male or female occupation, which in table 4 wedefine in different ways.
The the main set of results reported in Table 4 (columns 1 to 6) supports ourprevious findings confirming that female leadership is negatively associated withgender discrimination in the female equation and positively in the male equation. Incolumns 1 and 2, we use the share of females in each occupational category and firmsize, by country and year. Given that we rely on survey data the share of females islikely to be measured with error, point estimates appear somewhat less precise due toattenuation bias. The interaction terms with the share of females in the job are neverstatistically significant, suggesting no difference in the effect of female leadershipaccording to the share of women in the job. In columns 3 and 4, we construct adiscrete indicator (i.e. a mostlywomen dummy) which takes value 1 when the shareof females is above 50 per cent9; while in columns 5 and 6, for the same variables
9Experimentation with different thresholds produces fairly similar results.
15

we rely on a specific question, that was asked only in the 2010 wave of the EWCSdata, which allows us to identify with greater precision the predominantly male orfemale nature of the job, in the firm of the respondent10. The estimated coefficients ofthe bosswoman dummy for mostlywomen and mostlymen jobs are always statisticallysignificant in the female equation (while the share of females is not). Conversely in themale equation it is the share of females, jointly with the bosswoman in mostlywomenjobs (column 6) that seem to be relevant for reported discrimination among maleemployees. In other words, men seem to experience and report more discriminationin female dominated jobs when the boss is also a woman, while there seems to be nodifference in terms of perceived discrimination in male-dominated job, whether theboss is a woman or a man.
Finally, in columns 7 and 8, we replicate the previous specification, using as de-pendent variable the employees’ prospects of career advancement in the firm11. Wefind that women expect to have better prospect of promotion with a female bossin jobs where women are not the majority, as chances of promotion are likely to belower when many women compete for the same job. Conversely, men expect to havelower chances of career advancement when their boss is a woman, but they perceivea higher chance of promotion when, irrespectively of the sex of their boss, they arein job in which the share of women is higher (Cardoso and Winter-Ebmer, 2007;Kunze and Miller, 2014). Overall, we find support for the hypothesis that femalesin executive and supervisory positions do help other women in subordinate layers ofthe occupational hierarchy, with beneficial effects on discriminatory behavior againstfemale employees and better chances of career advancement. We also find evidencethat men are adversely affected by having a woman as boss, however it is difficultto establish whether this is the result of women effectively reducing pay and careeropportunities for men, or simply a side effect of the reversal of taste and statisticaldiscrimination.
Work organization, female leadership and the "Goldin hypothesis"
Most of the studies that have investigated the effects of female leadership ongender inequality have mainly focused on the patterns between occupations, for ex-ample analyzing how female CEO and women in executive positions affect the genderpay gap or the promotion opportunities of men and women within firms (Cardosoand Winter-Ebmer, 2007; Flabbi et al., 2014), as well as asking why women tendto be segregated in selected occupations (Barbulescu and Bidwell, 2013; Bertrandet al., 2014). However, since a large part of gender inequalities and discriminationtakes place within occupations, the above explanations miss an important part ofthe story12.
10The exact wording of the question is: "At your place of work are workers with the same jobtitle as you" (Mostly women/Mostly men/More or less equal numbers of men and women).
11We use a direct question asking the respondent how much he/she agrees or disagrees (5-pointscale from strongly agree to strongly disagree) with the statement "my job offers good prospectsfor career advancement". We recoded the variable as a dummy taking value one if the respondentagrees or strongly agrees and zero otherwise.
12Goldin (2014) shows that saturating a traditional Mincerian wage equation with 3 digit occupa-
16
In this section, we investigate the implications of having a woman as immediateboss on gender discrimination within occupations, and show that there is relevantrole for females in managerial or supervisory positions all along the hierarchical struc-ture within organization13. We also relate gender discrimination by occupation tothe way firms organize the work of their female (male) employees who have differ-ent preferences in terms of time flexibility and work-life arrangements. Whilst inmost studies on gender discrimination work organization practices and other firmlevel attributes are often relegated to the (firms) fixed effects, here we investigatehow they interact with occupational attributes in explaining gender discriminationwithin firms. In particular, as argued in Goldin (2014), we test whether occupationsin which work is organized around long working hours, inflexible work schedules andwhere employees are not easily substitutable, pay and promotion probabilities ex-hibit non-linearities that disproportionately benefit those employees (mostly men)who are able (or prefer) to work under tight constraints, thus increasing genderinequalities. This is likely to be observed in high-rank, high-pay occupations thatinvolve high commitment and effort, and select employees through highly compet-itive rank-ordered tournament that disproportionately reward winners; as well asin occupations where the organization of work is rather inflexible and workers arenot substitutable. In these occupations the penalty attached to time flexibility andother job related amenities is very large and affects mostly women. Conversely, inoccupations where work is organized around more standardized tasks and flexibletime schedules, where responsibilities are more evenly shared among employees andpart-time work is more diffused, gender differences in pay and promotion are likelyto be less pronounced (Bloom et al., 2009; Datta Gupta and Eriksson, 2012). Werefer to this as the "Goldin hypothesis" (Goldin, 2014; Goldin and Katz, 2012).
In Table 5, we report results for eight different occupational categories (1 digitISCO-88 classification): one refers to executive directors and managers, four arerelated to white-collar occupations (Professionals, Technicians, Clerks and ServiceWorkers) and the last three cover different blue-collar skill levels (Craft and Trade,Plant operators and Elementary occupations). Although the above occupationalclassification is rather broad and is likely to hide substantial heterogeneity acrossskill levels and work tasks, it is expected to capture the main patterns that link gen-der discrimination to female leadership and work organization practices. For eachoccupational level, we report coefficient estimates of our variables of interest for thewhole sample and separately for males and females. We also report sample aver-ages for selected occupational characteristics (i.e. female share, share of part-timeand proportion of employees working long hours). Estimates of the female dummyconfirm that discrimination within each occupational group is mainly experiencedand reported by females. In terms of (average) marginal effects, the probability ofreporting discrimination for a female employee, as opposed to a male, is highest
tional dummies, or weighting equally male and females across occupations, the residual gender payinequality is reduced by less than 1/3 meaning that the other 2/3 depend on other factors. Goldinshows that a relevant part of the residual gender inequality is related to how the work is organizedand rewarded in firms, and how the tasks and responsibilities are allocated across gender.
13Given the definition of bosswoman, the interpretation of female leadership within each occupa-tions is necessarily narrower as compared to most existing studies.
17
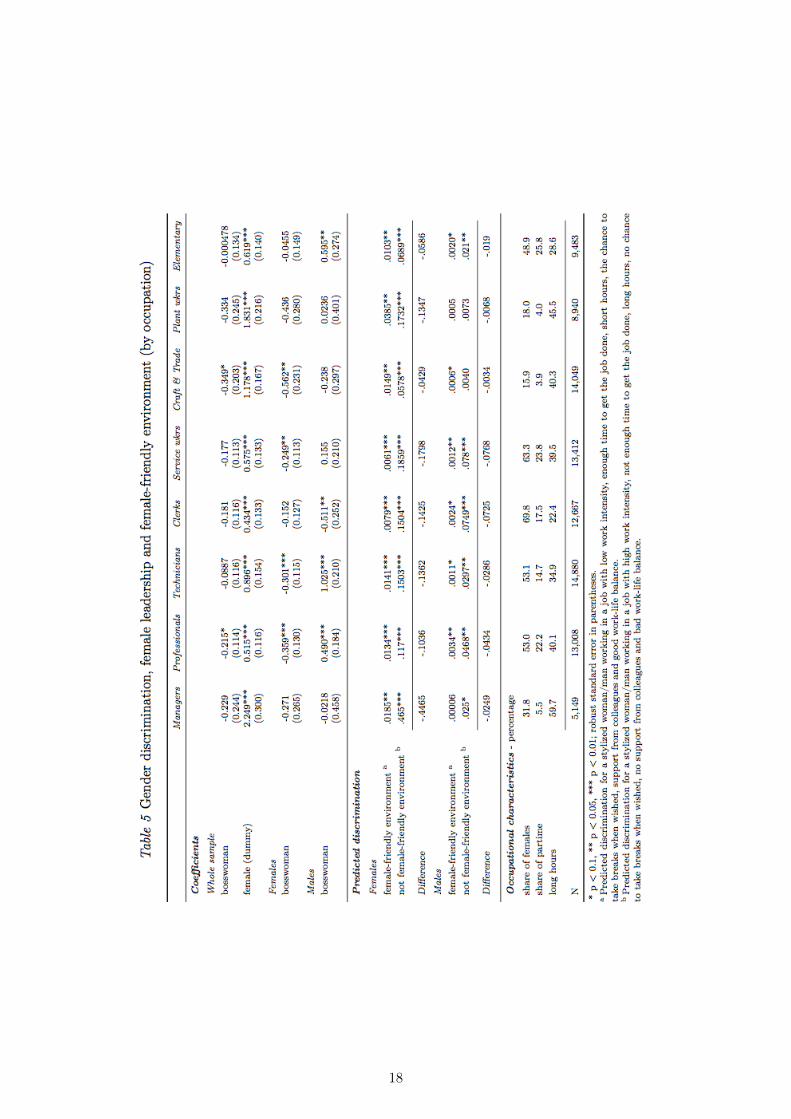
18

among Managers (9.2%), Craft and Trade (4.75%) and Plant workers (8.7%), whileit is lowest among Clerks (1.8%). Incidentally, the occupations in which gender dis-crimination is estimated to be high are all male-dominated and have in commonboth a low share of part-time workers and a high share of employees working longhours (see the bottom panel in Table 5). Conversely, in the low discrimination oc-cupations, perhaps not surprisingly, the share of female is higher and only a smallshare of employees work long hours. In other words, this pattern seems consistentwith the "Goldin hypothesis", suggesting that gender discrimination is high wherework is organized on tight working schedule and there is little working time flexibil-ity, while it is lower where part-time and work-life balance arrangements are morediffused. Moreover, when we fit separate equations by gender, we find that whilework intensity and "not" having enough time to do the job unambiguously increasegender discrimination for both male and females, the variable long hours is posi-tive and statistically significant almost exclusively in the female equation, while it isnever statistically significant in the male equation. Also, as might be expected, thevariables capturing a more female-friendly work environment (i.e. work-life balanceand support from colleagues) show a negative and statistically significant coefficienton gender discrimination in the female equation and generally not in the male one14.In male-dominated occupations, such as Managers and Blue-collars, a larger share offemales is associated with lower gender discrimination in the female equation, whilethis relationship is generally positive in the male equation15.
Coming to our main variable of interest, coefficient estimates on the bosswomandummy by occupations, in Table 5, confirm our previous findings always showing anegative association with gender discrimination in the female equation and a positiveor not statistically significant association in the male equation (with the only excep-tion of Clerks). For Managers, we find no statistically significant effect of femaleleadership on gender discrimination both for females and males. Given that in man-agerial occupations gender discrimination is reported to be highest, this may appearsurprising. However, as discussed in the literature, female managers who made it tothe top of the occupational hierarchy are likely to behave "like men" towards theirimmediate subordinates, if not also showing an aversion towards women that com-pete for a similar position to their own (i.e. the so-called "Queen-bee syndrome").
In high-skilled white-collar occupations, such as Professional and Technicians,we find a statistically significant effect of female leadership (in terms of average par-tial effect we find a 2% change in the probability of gender discrimination), whichis negative in the female equation and positive for male employees. In these occu-pations, where high-educated women are largely represented, the demand for morefemale-friendly policies is high, and female leadership can (and does) make a dif-ference in contrasting gender inequalities among women, while it has the oppositeeffect on men. As we move down towards less-skilled white-collar and blue-collar
14The whole set of results by gender is not reported in Table 5 but is available upon request withthe authors.
15Plant workers is an exception as the share of females bears a negative sign and is statisticallysignificant.
19
occupations, the pattern is similar with a negative effect for females and virtuallyno-effect for males. In this respect, it is interesting to note that the only two occu-pations in which the bosswoman dummy is not statistically significant in the femaleequation are Clerks and Elementary occupations, where the proportion of employeesworking long hours is lowest and part-time is relatively high. In other words, we findan additional mechanism that complements and reinforces the work organizationhypothesis à-la Goldin, whereby females may benefit from an additional discrimi-nation reducing effect, over and above the implementation of flexible working timeand female-friendly practices, coming from the fact that they have a woman as theirimmediate boss.
While certainly some care is needed in interpreting the above results, as someunobserved attributes may drive the sorting of employees and female bosses acrossjobs and occupations, it is interesting to note that the association of female-friendlywork organization practices and a higher representation of women among bosses aregenerally conducive to a lower gender discrimination among women16. To show this,we use our preferred specification (separately for males and females) to simulatethe extent of gender discrimination that would result from having a female-friendlywork environment, as opposed to not having such work environment. In practice,we compare two alternative situations in which the attributes of a job are set to bemore favorable in terms of work intensity, time flexibility and work-life balance, asopposed to a job where they are not. What we find is that, ceteris paribus, switchingfrom an unfavorable (non female-friendly) work environment to a more favorable(female-friendly) work environment, is very beneficial for females in terms of genderdiscrimination, while it makes little or no difference for males. The reduction in theshare of employees reporting gender discrimination, moving from unfavorable to morefavorable working conditions, is estimated to be highest among female managers (-0.44), where such practices are rare and large penalties are associated to more female-friendly work environment. Also, the gain from switching to more female-friendlypractices are shown to be larger for females in most white-collar occupations (from-0.17 to -0.12), as opposed to most blue-collar occupations. This is also consistentwith the evidence shown in Goldin (2014), who finds that the penalties in terms ofthe gender pay gap are generally larger for highly-educated workers.
Robustness checks
In order to test the robustness of our main findings, we performed a number of sen-sitivity tests. Table 7 reports the coefficients for the two main variables of interest(bosswoman and female) and the Wald-χ2 test for the joint significance of all predic-tors in each model. All tests are performed using our preferred specification (Model4 in Table 2) on the pooled sample. The reason for choosing the pooled sample asour reference for sensitivity analysis is two-fold: first, results from by-gender analysisshow that the presence of a female supervisor has opposite effects on the likelihood of
16In this respect, Goldin (2014) shows that, even accounting for possible selection mechanisms,still a significant fraction of wage differentials between men and women can be explained by occu-pational differences in time flexibility and its associated costs.
20

experiencing gender discrimination among females and males, so that the coefficientwe found on the pooled sample is likely to be an underestimation of the effect onfemale employees.
Table 6 Robustness checks
Estimated coefficients Wald-chi2
Bosswoman Female (p-value)
Different samples
1. Fulltime -0.157*** 0.794*** 573.29(0.0592) (0.0637) (0.000)
2. Part-time -0.246** 0.501*** 268.45(0.105) (0.184) (0.000)
3. Fulltime & high_edu -0.238*** .849*** 347.99(0.0797) (0.0952) (0.000)
4. Large firm(>=100) -0.333*** 0.797*** 311.92(0.0906) (0.107) (0.000)
5. Small firm (<100) -0.112* 0.766*** 480.99(0.0634) (0.0711) (0.000)
6. Public sector -0.263*** 0.715*** 349.12(0.0862) (0.102) (0.000)
7. Private sector -0.123* 0.799*** 482.42(0.0639) (0.0757) (0.000)
Different specifications
8. control for income -0.175*** 0.679*** 407.07(0.0648) (0.0731) (0.000)
9. control for satisfaction a -0.184*** 0.764*** 641.09(0.0537) (0.0611) (0.000)
10.control for social preferencesb -0.166*** 0.740*** 520.47(0.0645) (0.0711) (0.000)
11.control for psychosocial environment c -0.218*** 0677*** 499.52(0.0689) (0.0732) (0.000)
12. control for risk aversiond -0.363** 0.783*** 455.55(0.1420) (0.1497) (0.000)
Different estimations
13. Complementary log-log model -0.408*** 1.875*** 673.29(0.1289) (0.1657) (0.000)
14. Penalized likelihood model -0.439*** 1.706*** 1078.89(0.0741) (0.0880) (0.000)
15. Clustered std errors (country and year) -0.1814*** 0.756*** 9698.14(0.0615) (0.0751) (0.000)
* p < 0.1, ** p < 0.05, *** p < 0.01; robust standard errors in parentheses for column2 and 3, p-value for Wald-chi2 test in column 54.a Satisfaction with working conditions in the questionnaire is measured through a 4point-scale going from 1-very satisfied to 4- not-at-all satisfied. We recoded it as a dummytaking value 1 if the individual is not very satisfied or not at all satisfied.b Social preferences are measured through 4 dummies taking value 1 if the respondent isinvolved in voluntary activities, political/trade union activities, caring for children andsporting activities at least once or twice a week.c Additional controls for psychosocial environment include two binary indicators for jobsecurity and social relationships at the workplace (i.e. whether the respondents feels athome or has good friends). Such indicators are available from 2005 onward, so the testrefers to the restricted sample from the last two waves.d See footnote 5 for a definition of the variable risk aversion. The test refers to therestricted sample from 2010.The whole set of robustness is performed on our preferred specification, Model 4 in Tab.2.
21

If this coefficient is biased toward zero its robustness to the inclusion of addi-tional controls or to changes in the specification should provide evidence of overallrobustness of our results. Second, since we test the robustness of our results acrossdifferent sub-samples, further decompositions by gender might lead to small samplebiases in our estimates.
As a first step, we tested whether our results are robust to changes in the referencesample (rows 1 to 7). Since our previous results showed that working long hours andbe employed in larger establishments are positively associated with the probabilityof reporting gender discrimination, we repeated our exercise for employees workingfull-time, part-time, in large and in small firms.
Results show that the sign and significance of the coefficient of the female dummyis unaffected by the change in the selected sample and that the presence of a femaleboss (i.e. bosswoman) is negatively associated with the probability of reportinggender discrimination in each sample, with a slightly reduced statistical significanceof the coefficient for workers employed in small firms. The negative associationbetween female boss and gender discrimination is also found among full-time workerswith tertiary education, on those working in the public sector as well as in the privatesector.
Second, we checked whether our results are robust to the inclusion of additionalcontrols that may be relevant in predicting gender discrimination at the workplace. Inparticular, rows 8 and 9 report estimated coefficients from our preferred specification,augmented with the inclusion of controls for low income level (below the median)and low satisfaction with working conditions. Since evidence from experimental andfield studies has documented the importance of behavioral characteristics of men andwomen on discrimination and other labor-related outcomes (Bertrand, 2011; Dollaret al., 2001; Niederle and Vesterlund, 2007), in line 10 to 12 we augment our modelwith information on preferences for social activities outside work, psychosocial workenvironment (perceived job security and social relationships at the workplace) andattitudes toward risk (Dohmen et al., 2011)17.
Results presented in lines 8 to 12 show that the inclusion of these additionalcontrols does not alter the bosswoman and female coefficients.
Third, concerns about the limited incidence of non-zero outcomes in our depen-dent variable is addressed considering alternative estimation methods that are robustto the distribution implied by "rare" events, such as complementary log-log models("zero-inflated" model) and penalized likelihood techniques18. As shown in rows 13and 14, when we correct for the "rare" nature of our outcome, the coefficients of thetwo variables of interest remain strongly significant and with the expected sign.
17Detailed information on variables’ specification can be found in Table 6 footnote.18Recent literature in political and social sciences has raised the issue of the difficulty of explaining
and predicting rare events (i.e. binary dependent variables with much fewer ones than zeroes) withbinary choice models. Besides the bias due to small samples, recent studies (King and Zeng, 2001)have argued that in rare events data the biases in probabilities can be meaningful even with bigsample sizes and that these biases result in an underestimation of event probabilities. As presentedfrom section 4 onward, the coefficients for our variables of interest are strongly significant, but,for the sake of completeness, we performed additional estimations to correct for rare events biases,making use of both complementary log-log and penalized likelihood methods.
22

Further, given the cross-country time-series dimension of our dataset, we esti-mated our preferred specification using standard errors clustered at the country andyear level, in order to account for possible country and time specific heteroskedas-ticity.
Finally, one additional concern is that the coefficient of bosswoman might beaffected by reporting biases, namely female employee with a woman as a boss orworking in a female-friendly environment may feel more comfortable and thus under-report gender discrimination. Under these circumstances women should systemati-cally report lower or no discrimination also in other domains of discrimination suchas age, race or nationality. To check this, we replicate our preferred specificationon alternative measures of discrimination experienced by the worker, but find noevidence of reporting bias (see Table A3 in Appendix). In a similar exercise, weuse measures of perceived health or work hazards19, and also find no evidence ofreporting bias.
Selectivity
The overall pattern emerging from the empirical analysis discussed in previous sec-tions indicates the existence of a negative association between female leadership andoverall gender discrimination within workplaces. This effect has been found to dif-fer between female and male employees: typically strongly negative and statisticallysignificant for females and positive (or not statistically significant) for males, partic-ularly in female-dominated jobs. Given this opposite effect across gender, the overallnegative association that we get on the pooled specification (see Tables 2 and 6)might be taken as an indication that the effect on women always dominates that onmen. Moreover, the female-friendliness of the work environment, in terms of timeflexibility and work-life balance practices, has been found to play a relevant role infurther reducing gender discrimination.
However, since work organization practices are chosen by firms, and women arelikely to sort themselves in jobs where the work environment is more female-friendlyand career advancements more probable, it is difficult to discern whether the esti-mated effects of female leadership on gender discrimination are causal or capturesimple correlations. As already discussed, the estimated effect of female leader-ship could reflect the fact that in firms with more female-friendly work environment(mainly demanded by women), women are more likely to be promoted in managerialand supervisory positions and gender inequalities are expected to be lower. Whilecontrolling for a large set of workplace characteristics and work organization prac-tices should reduce the likelihood of a spurious correlation, we cannot exclude thatunobserved job and workplace characteristics (i.e. unobserved heterogeneity) or thelower propensity to discriminate against women (i.e. reverse causality) affect our es-timates. In all the circumstances described above, the endogenous selection process -
19We selected two questions available in each wave of the EWCS: "Do you think your health orsafety is at risk because of your work?" (yes/no) and "does your work effect your health? " (yes/no).
23
i.e. matching female-friendly job attributes and the presence of women in managerialand supervisory positions with lower gender discrimination - is likely to overestimatethe true effect of female bosses on gender discrimination.
In this section, to address the above problems, we complement our empiricalstrategy in two different ways: first, we estimate our model with a (quasi) fixed-effect estimator to control for unobserved heterogenity, and second we specify aselection equation for the probability of having a woman as boss and estimate itjointly with the probability of experiencing discrimination. As in the robustnesscheck section, to avoid a loss of precision in our point estimates due to small sam-ples, we implement the above estimation only on the pooled specification. Resultsare reported in Table 7. To implement the (quasi) fixed-effect approach, given thestructure of our data and the non-linearity of the estimated model, we saturate ourspecification with a large number of fixed-effects (column 1) obtained by interact-ing country, industry and firm-size dummies (a total of 660 dummies). Next, as anadditional check (column 2), we include country-specific time trends to control fortime-varying unobservables that change over time, such as changes in social normsor cultural attitudes towards women in leadership positions. Finally, to account forthe correlation between observed and unobserved characteristics, we implement theMundlak correction augmenting our baseline specification with the individual meansof time-varying characteristics (column 3) (Mundlak, 1978). In all the above estima-tions, the estimated coefficient on the bosswoman dummy shows a negative sign andis statistically significant.
The alternative approach to account for the endogeneity of the bosswoman dummyis based on the joint estimation of a selection equation (i.e. the probability of having awoman as immediate boss) and the discrimination equation. In practice we estimatea bivariate probit model allowing for the correlation in the error terms of the twoequations. Given the non-linearity of the assumed model, identification is achievedsimply by the functional form. However, we also include a set of instruments thatsatisfy the usual properties: are correlated with the probability of having a womanas immediate boss, and uncorrelated with the error term in the discrimination equa-tion. The inclusion of the instruments in our model allows for an over-identificationtest for the validity of the exclusion restrictions. Our instruments exploit informa-tion on the variation, across countries and over time, in the generosity of nationalparental leave systems, and in the stringency of employment protection legislation.In particular, we computed an index of generosity of parental leave systems thatincreases with the number of weeks available for maternity, parental and childcareleave, as well as with the associated cash benefits. The Employment ProtectionLegislation index draws on the OECD institutional dataset and increases with thestringency of the regulation for regular and temporary employment contracts20. Therationale behind the choice of these instruments is the following. The generosityof the welfare system with respect to parental leave, by increasing the attachmentof females to their job also increases their probability of being promoted to higherranks of the occupational hierarchy (Bøler et al., 2014). Conversely, the stringency of
20Detailed information on how we constructed of our instruments are provided in the Appendix.
24

employment protection regulations by protecting insiders and employees with higherseniority, mainly promotes the employment and career progression of males, ratherthan females (Cipollone et al., 2014). Hence, in the selection equation, we expect apositive association between the generosity index and the presence of female bosses,and a negative association with the employment protection index.
Moreover, since there are obvious complementarities between the above policies- i.e. low employment protection and high generosity being the best combination forthe career of women - we also include an interaction term between the two indices.Notice, however, that since the information on the above indices are available onlyfor a subset of the countries in our dataset (namely EU15 and Norway), the estimatesof the bivariate probit, reported in table 7, are based on the restricted sample. Forcomparison purposes, in column 4, we also re-estimated our baseline probit modelon the same restricted sample. In column 5, the joint model is estimated with bothgenerosity and employment protection indices as instruments, while in column 6 theirinteraction is also added.
Finally, in the lower panel of table 7, we report the coefficient estimates of theselection equation, as well as some statistics for the validity of the exclusion restric-tions. A simple χ2-test for the joint significance of the instruments in the selectionequations indicates that our instruments are not weak, while the Wald test for thecorrelation of the error terms across the two equations strongly reject the hypothesisof exogeneity. The test for the overidentifying restrictions of our instruments (i.e. achi-squared statistic of the joint significance of the variable that are excluded fromthe discrimination equation), confirms the validity of the instruments. Hence, themain results from the bivariate probit model confirm the robustness of our previousresults to the presence of selection effects. The coefficient of the bosswoman dummyshows a larger and statistically significant negative effect of female leadership on gen-der discrimination, which is consistent with a causal interpretation of the empiricalevidence presented in the previous sections.
25
Conclusions
This study presents evidence that women in leadership position can contribute toreduce gender inequality and discrimination within organization. We show that hav-ing a female as immediate boss is associated with a lower probability for employeesto experience discrimination on the job, and this effect differs by gender. Femaleleadership is associated to lower gender discrimination among female employees allalong the occupational hierarchy. This effect is reversed among male employeeswho report higher discrimination when their boss is a woman. When we investigatethe mechanisms underlying gender differences, we find evidence of a "women help-ing women" effect, whereby female leadership generates positive spillover effects interms of lower discrimination and better career prospects, particularly where womenare over-represented. Conversely, spillover effects among men are negative (higherdiscrimination) particularly in female-dominated jobs. We also find that the waywork is organized, in terms of flexible working time and female-friendly practices,matters for gender discrimination particularly among women in high-skilled occu-pations. The main findings are shown to be valid even when we explicitly modelthe potential endogeneity and selection issues arising from the non-random distri-bution of females in supervisory and managerial positions. The evidence reportedin this study is consistent with most of the existing literature on gender discrimi-nation which predicts that women in leadership positions have less discriminatorytastes, or better information to assess the productivity of other women, particularlyin predominantly female jobs. We also show that women who are in supervisory ormanagerial positions are an important complement to company’s practices that aremore friendly to female employees, resulting in a lower gender discrimination. Wefind no evidence, however, that any of the above effects holds among women at thevery top of the company occupational hierarchy (i.e. CEO or executive managers),which seems to suggest that women who are selected for those positions throughhighly competitive rank-ordered tournament do not behave differently from men insimilar positions. The implications of the above findings for gender discriminationat work are numerous. First, promoting a higher presence of women in leadershippositions, all along the occupational structure, is an effective way of reducing gen-der imbalances and discrimination towards women in workplaces. This has a direct(causal) effect, as well as an indirect (spill-over) effect on females subordinates inpredominantly female jobs. While there is evidence of an adverse effect on maleemployees in predominantly female jobs, it is difficult to say whether this is the re-sult of reversal of (taste or statistical) discrimination against women, or a genuinebehavioral effect of women discrimination towards men. Second, our results showthat when work is organized on long working hours and rigid work schedules, whichmake it difficult to balance work and life, women are more likely to be penalized, ascompared to men, in terms of pay and career advancement. Thus, promoting female-friendly work practices such as part-time work, flexible working time and parentalleave arrangements is another effective way to better balance work and life acrossgender, particularly for women (and men) with caring responsibilities. Whetherthis should be done through company’s welfare provided schemes, through public
26

subsidies for part-time work and child care facilities, or both is yet to be assessed.Conversely, any company or public policy that disproportionately rewards long andinflexible working time schedules, either through company bonuses or tax-breaks onovertime work, as well as career concerns that are centered on high work intensityand rank-ordered tournament are most likely to reduce equality of opportunities forwomen in organizations. While affirmative action and mandatory quotas may reversethis pattern, our results support other findings in the literature suggesting that ahigher representation of women at the top of the organizational hierarchy does nothave any tangible (statistically different from men) effect on gender discrimination.
References
Ahern, K. R. and Dittmar, A. K. (2012), ‘The changing of the boards: The impact on firm valuationof mandated female board representation’, Quarterly Journal of Economics 127(1), 137–197.
Aigner, D. J. and Cain, G. G. (1977), ‘Statistical theories of discrimination in labor markets’,Industrial and Labor relations review pp. 175–187.
Albrecht, J., Bjorklund, A. and Vroman, S. (2003), ‘Is there a glass ceiling in sweden?’, Journal ofLabor Economics 21(145-177).
Artz, B., Goodall, A. H. and Oswald, A. J. (2014), ‘Boss competence and worker well-being’, IZADiscussion Paper (No.8559).
Bagues, M., Sylos-Labini, M. and Zinovyeva, N. (2014), ‘Do gender quotas pass the test? evidencefrom academic evaluations in italy’, Scuola Superiore Sant’Anna, LEM Working Paper Series14.
Barbulescu, R. and Bidwell, M. (2013), ‘Do women choose different jobs from men? mechanisms ofapplication segregation in the market for managerial workers’, Organization Science 24(3), 737–756.
Becker, G. S. (1957), The economics of discrimination, University of Chicago press.
Bednar, S. and Gicheva, D. (2014), ‘Are female supervisors more female-friendly?’, American Eco-nomic Review 104(5), 370–375.
Bell, L. A. (2005), ‘Women-led firms and the gender gap in top executive jobs’, IZA discussionpaper (No.1689).
Bertrand, M. (2011), ‘New perspectives on gender’, Handbook of labor economics 4, 1543–1590.
Bertrand, M., Black, S. E., Jensen, S. and Lleras-Muney, A. (2014), ‘Breaking the glass ceiling? theeffect of board quotas on female labor market outcomes in norway’, National Bureau of EconomicResearch .
Bertrand, M. and Schoar, A. (2003), ‘Managing with style: The effect of managers on firm policies’,The Quarterly Journal of Economics 118(4), 1169–1208.
Bloom, N., Kretschmer, T. and Van Reenan, J. (2009), ‘Work-life balance, management practicesand productivity’, International differences in the business practices and productivity of firmspp. 15–54.
Bøler, E. A., Javorcik, B. and Ulltveit-Moe, K. H. (2014), ‘Globalization: A woman’s best friend?exporters and the gender wage gap’.
Booth, A. and Leigh, A. (2010), ‘Do employers discriminate by gender? a field experiment infemale-dominated occupations’, Economics Letters 107(2), 236–238.
27

Cardoso, A. R. and Winter-Ebmer, R. (2007), ‘Female-led firms and gender wage policies’, Industrialand Labor relations review 64(1), 143–163.
Cipollone, A., Patacchini, E. and Vallanti, G. (2014), ‘Women labor market participation in europe:Novel evidence on trends and shaping factors’, IZA Journal of European Labor Studies 3(18).
Croson, R. and Gneezy, U. (2009), ‘Gender differences in preferences’, Journal of Economic literaturepp. 448–474.
Datta Gupta, N. and Eriksson, T. (2012), ‘Hrm practices and the within-firm gender wage gap’,British Journal of Industrial Relations 50(3), 554–580.
Dohmen, T., Falk, A., Huffman, D., Sunde, U., Schupp, J. andWagner, G. G. (2011), ‘Individual riskattitudes: Measurement, determinants, and behavioral consequences’, Journal of the EuropeanEconomic Association 9(3), 522–550.
Dollar, D., Fisman, R. and Gatti, R. (2001), ‘Are women really the “fairer” sex? corruption andwomen in government’, Journal of Economic Behavior & Organization 46(4), 423–429.
Eurofound (2012), Fifth european working conditions survey - overview report, Technical report,Eurofound.
Flabbi, L., Macis, M., Moro, A. and Schivardi, F. (2014), ‘Do female executives make a difference?the impact of female leadership on gender gaps and firm performance’, CEPR Discussion Paper(No.10228).
Fortin, N. M. (2008), ‘The gender wage gap among young adults in the united states the importanceof money versus people’, Journal of Human Resources 43(4), 884–918.
Gagliarducci, S. and Paserman, D. (2015), ‘The effect of female leadership on establishment andemployee outcomes: Evidence from linked employer-employee data’, Research in Labor Economics41, 341–372.
Gauthier, A. H. (2002), ‘Family policies in industrialized countries: is there convergence?’, Popula-tion 57(3), 447–474.
Goldin, C. (2006), ‘The quiet revolution that transformed women’s employment, education, andfamily’, American Economic Review 96(2), 1–21.
Goldin, C. (2014), ‘A grand gender convergence: Its last chapter’, The American Economic Review104(4), 1091–1119.
Goldin, C. and Katz, L. F. (2012), ‘The most egalitarian of all professions: Pharmacy and theevolution of a family-friendly occupation’, National Bureau of Economic Research .
IMF (2013), Women, work, and the economy: Macroeconomic gains from gender equity, Technicalreport, International Monetary Fund.
King, G. and Zeng, L. (2001), ‘Logistic regression in rare events data’, Political analysis 9(2), 137–163.
Kunze, A. and Miller, A. R. (2014), ‘Women helping women? evidence from private sector data onworkplace hierarchies’, National Bureau of Economic Research (WP 20761).
Lazear, E. P., Shaw, K. L. and Stanton, C. T. (2012), ‘The value of bosses’, National Bureau ofEconomic Research (WP 18317).
Matsa, D. A. and Miller, A. R. (2013), ‘A female style in corporate leadership? evidence fromquotas’, American Economic Journal: Applied Economics 5(3), 136–169.
Mundlak, Y. (1978), ‘On the pooling of time series and cross section data’, Econometrica: journalof the Econometric Society pp. 69–85.
28
Neumark, D. and Gardecki, R. (1998), ‘Women helping women? role-model and mentoring effectson female ph. d. student in economics’, Journal of Human Resources, 33(1), 220–246.
Niederle, M. (2014), ‘Gender’, National Bureau of Economic Research (WP 20788).
Niederle, M. and Vesterlund, L. (2007), ‘Do women shy away from competition? do men competetoo much?’, Quarterly Journal of Economics 122(3), 1067–1101.
OECD (2007), Babies and bosses: reconciling work and family life: A synthesis of findings for oecdcountries, Technical report, OECD.
Weichselbaumer, D. and Winter-Ebmer, R. (2007), ‘The effects of competition and equal treatmentlaws on gender wage differentials’, Economic Policy 22(50), 236–287.
29
Appendix
Generosity of parental leave systems
Information on the generosity of parental leave systems in European Countriesare gathered from the dataset used in Gauthier (2002), whose sources are OECDand ILO statistics. Our index of generosity is constructed as a summary scale of 6items (normalized to [0, 1]): total number of paid weeks of maternal leave (includingweeks before and after childbirth), total number of weeks of childcare leave, totalnumber of weeks of parental leave, cash benefits received during maternity leave (asa percentage of female wages), cash benefits received during parental leave and cashbenefits received during childcare leave.
Employment Protection Legislation
EPL indexes refer to OECD summary indicators of Employment ProtectionLegislation, measuring the procedures and costs involved in dismissing individuals(www.oecd.org/employment/EPL).In particular, we used both the index of employment protection for regular workers,including additional provisions for collective dismissals, and the one for temporaryworkers, which measures the stringency of the regulation on the use of fixed-termand temporary work agency contracts.
30

Table A1 Description and means of the variables used
Variable Description Mean
All Females Malesdiscrimination_sex dummy= 1 if respondent subjected to 0.016 0.027 0.007
discrimination linked to sex
bosswoman dummy= 1 if respondent’s boss 0.257 0.439 0.101is a woman
Demographicsfemale dummy= 1 if female 0.462
Age Groups: dummies= 1 if in age group15− 24 0.118 0.117 0.11825− 35 0.291 0.287 0.29536− 55 0.513 0.524 0.50356+ 0.079 0.072 0.084partner dummy= 1 if respondent has a 0.697 0.685 0.706
partner/spouseEducationcompulsory 0.109 0.098 0.118secondary 0.554 0.549 0.559tertiary 0.337 0.353 0.323
female share share of females in 0.461 0.574 0.365country, year, occupation and firm dimension (large/small)
Firm and Job characteristicsOccupation 1-digit ISCO-88ISCO 1 - Managers 0.056 0.039 0.071ISCO 2 - Professionals 0.142 0.164 0.123ISCO 3 - Technicians 0.162 0.186 0.142ISCO 4 - Clerks 0.138 0.208 0.078ISCO 5 - Service workers 0.146 0.199 0.101ISCO 6 and 7 - Craft & Trade 0.153 0.052 0.240ISCO 8 - Plant & Machinery 0.104 0.039 0.148ISCO 9 - Elementary occupations 0.098 0.112 0.097
Industry 1-digit NACE rev.1.1Mining and Manufacturing 0.216 0.152 0.27Electricity, gas, and water supply 0.017 0.007 0.025Construction 0.077 0.022 0.124Wholesale and trade 0.146 0.169 0.126Hotels and restaurants 0.036 0.042 0.031Transport and communication 0.073 0.039 0.101Financial intermediation 0.035 0.038 0.033RE activities 0.067 0.065 0.069PA 0.08 0.082 0.079Other services 0.254 0.384 0.142
lndimension log of firm size 3.764 3.589 3.912pubsector dummy= 1 if respondent 0.292 0.359 0.235
works in the public sector
Work Organization
Work Intensitypace of work dummy= 1 if the job involves 0.604 0.567 0.637
-working at high speed-working with tight deadlines
enough time dummy= 1 if respondent has enough 0.842 0.843 0.841time to get the job done
Time flexibilitylong hours dummy= 1 if respondent works 0.372 0.27 0.46
->40 hours a week or->10 hours a day at least once a month
breaks at work dummy= 1 if respondent is able to 0.584 0.551 0.613Continues from previous page
31

... table A.1 continuedVariable Description Mean
All Females Malestake a break when wished
Work environmentcolleagues support dummy= 1 if respondent receives 0.894 0.884 0.903
support from collegueswork-life balance dummy= 1 if ”well” or ”very well” to 0.700 0.731 0.675
Do your working hours fit in withyour family or social commitments?
Additional Variablespartime dummy= 1 if respondent works 0.155 0.265 0.059
less than 30 hours a weeklow wage dummy= 1 if respondent’s wage 0.403 0.506 0.313
lies below mediansatisfaction dummy= 1 if respondent is very/satisfied 0.825 0.836 0.815
with working conditionspromotion dummy= 1 if respondent agrees or strongly agrees 0.315 0.289 0.337
with ”My job offers good prospects for career advancements”job security dummy= 1 if respondent strongly disagrees, 0.834 0.841 0.829
disagrees or neither agrees nor disagrees with”I might lose my job in the next 6 months”
favorable environment dummy= 1 if respondent agrees or strongly agrees 0.834 0.833 0.835- ” I feel at home in this organization”- ”I have very good friends at work”
riskaversion dummy= 1 if respondent always uses 0.928 0.94 0.922protective equipment when required
32

Table A2 Gender discrimination and female leadership- full specification for Table 2 and Table 3
Whole Sample Female Male
bosswoman -0.181*** -0.245*** 0.209**(0.0528) (0.0563) (0.0992)
female (dummy) 0.756***(0.0613)
age_2 0.00799 -0.0412 0.152(0.0757) (0.0908) (0.130)
age_3 -0.0440 -0.0881 0.0901(0.0760) (0.0898) (0.143)
age_4 -0.480*** -0.524*** -0.375(0.115) (0.134) (0.248)
partner -0.142*** -0.132*** -0.132(0.0444) (0.0511) (0.0905)
secondary educ -0.0999 -0.0745 -0.146(0.0786) (0.100) (0.133)
tertiary educ -0.0612 0.00819 -0.296**(0.0895) (0.115) (0.142)
female share -0.0303 -0.333 0.633**(0.194) (0.234) (0.320)
lndimension 0.0391*** 0.0240 0.0849***(0.0142) (0.0162) (0.0286)
public sector 0.0735 0.0628 0.0711(0.0626) (0.0733) (0.118)
pace of work 0.192*** 0.157*** 0.319***(0.0522) (0.0597) (0.0996)
enough time -0.195*** -0.180*** -0.240***(0.0514) (0.0651) (0.0805)
long hours 0.193*** 0.273*** 0.0532(0.0484) (0.0567) (0.0870)
breaks at work -0.169*** -0.193*** -0.0934(0.0437) (0.0523) (0.0792)
colleagues support -0.0997* -0.128* -0.0271(0.0599) (0.0717) (0.120)
work-life balance -0.365*** -0.414*** -0.275***(0.0538) (0.0635) (0.0952)
Industry and occupation 3 3 3Country Dummies 3 3 3Year Dummies 3 3 3
constant -2.146*** -1.108*** -2.729***(0.222) (0.252) (0.446)
pseudo-R2 0.1214 0.0963 0.1354N 63318 31637 30624
* p < 0.1, ** p < 0.05, *** p < 0.01; robust standard errors in paren-theses.Model specification as in Model 4, Table.2.
33

Table A3 Robustness checks- reporting bias onfemale sample
Perceived discrimination
Age Race Nationality
bosswoman 0.0451 0.216*** 0.176**(0.0522) (0.0836) (0.0758)
femaleshare 0.0884 -0.129 -0.195(0.251) (0.308) (0.303)
constant -1.132*** -1.729*** -2.087***(0.265) (0.356) (0.330)
pseudo-R2 0.0870 0.1039 0.1008N 31626 31649 31638
Placebo test on other subjective measuresHealth safety Work affects
Risk Health
bosswoman -0.0190 0.00825(0.0302) (0.0270)
femaleshare 0.0872 0.00294(0.136) (0.123)
constant -0.526*** 0.0884(0.151) (0.139)
pseudo-R2 0.1177 0.1505N 31132 31118
* p < 0.1, ** p < 0.05, *** p < 0.01; robust standard errorsin parentheses.Additional controls as in Table 2.
34