what if…
DESCRIPTION
What if…. Everyone had clean water? All countries were equal? No-one had to live in a slum? Trade was fair?. When your finished…. Write down what the game was trying to prove…. Development. To be able to describe the different measures of development. - PowerPoint PPT PresentationTRANSCRIPT

What if….• Everyone had clean water?
• All countries were equal?
• No-one had to live in a slum?
• Trade was fair?

When your finished…
• Write down what the game was trying to prove…

DevelopmentTo be able to describe the
different measures of development.
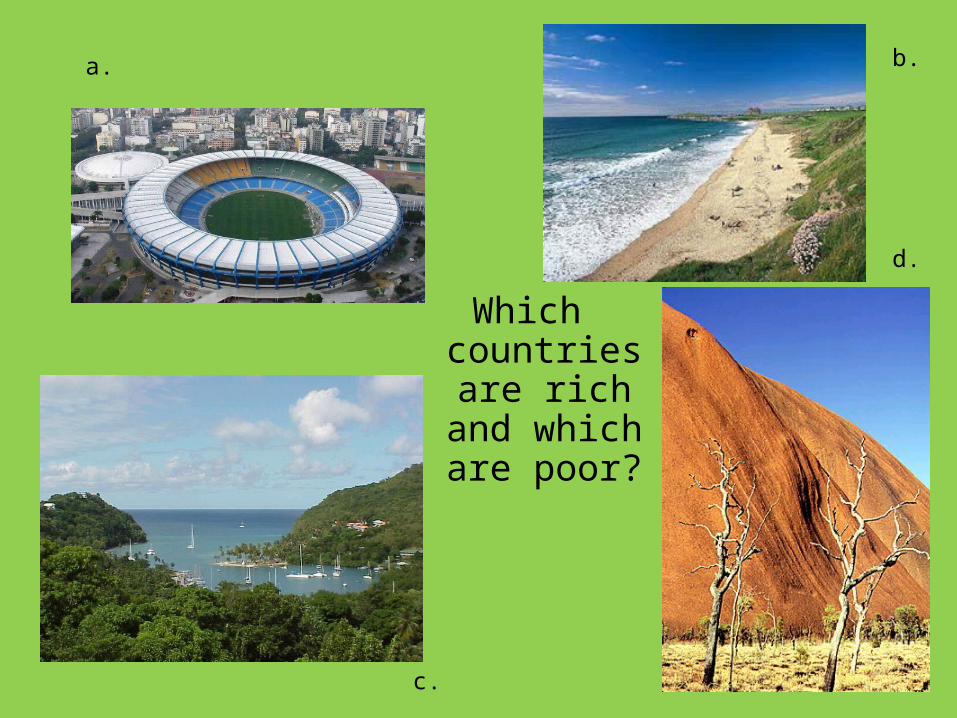
Which countries
are rich and which are
poor?
d.
b.
c.
a.

How do we know when a country is RICH or POOR?

What is development?
Development means change. Usually in Geography we mean change for the better.
Different factors affect a countries level and speed of development:
Environmental
Economic
Social
Political

Match up to the factors
Environmental
Economic
Social
Political
Natural hazards
Trade
Access to safe water
Government corruption
Earthquakes
DebtConflict
Education

Development indicatorsSocial measures Economic measuresBirth rate – This can indicatethat in developing countries the birth rate ishigh because people don’t have access toeducation / family planning. In developedcountries the birth rate is lower becausepeople have more access to these things.
Death rate
Infant mortality rate
Adult literacy rate
Doctor patient ratio
Life expectancy
Employment structure (primary, secondary, tertiary etc)
GDP ( total value of goods and services produced by a country in a year $)
GNI (gross national income- includes money earned overseas) $
Trade
For each measure of development, describe what it means AND explain how it can be used to show ‘development’.


Relative poverty
Absolute poverty

Development Indicators

Development Indicators
LO: to explain the impact of different development indicators
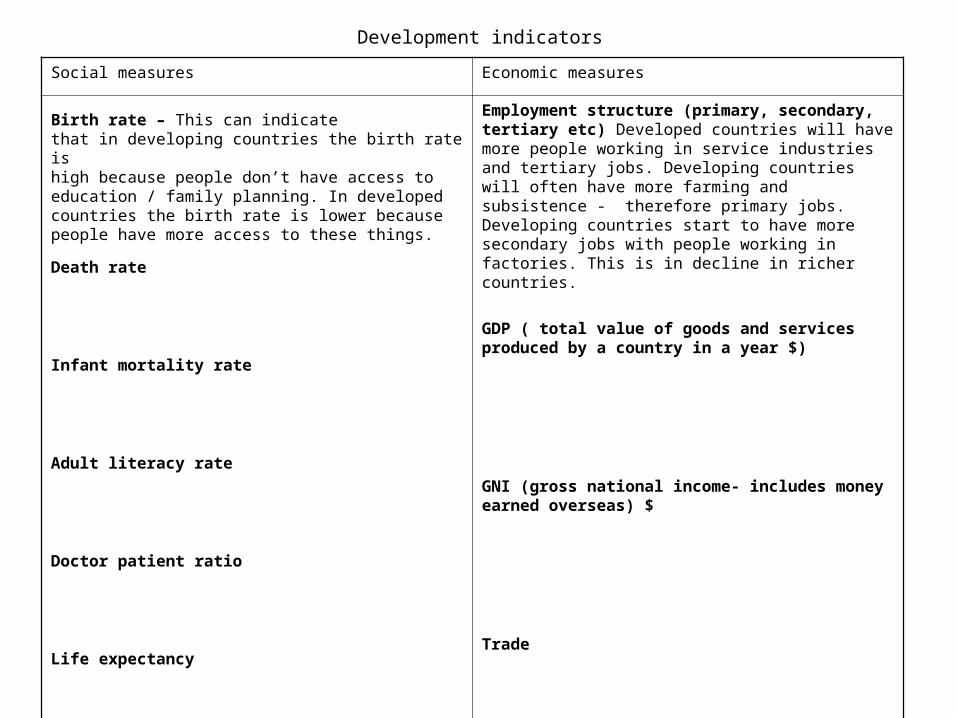
Development indicators
Social measures Economic measures
Birth rate – This can indicatethat in developing countries the birth rate ishigh because people don’t have access toeducation / family planning. In developedcountries the birth rate is lower becausepeople have more access to these things.
Death rate
Infant mortality rate
Adult literacy rate
Doctor patient ratio
Life expectancy
Employment structure (primary, secondary, tertiary etc) Developed countries will have more people working in service industries and tertiary jobs. Developing countries will often have more farming and subsistence - therefore primary jobs. Developing countries start to have more secondary jobs with people working in factories. This is in decline in richer countries.
GDP ( total value of goods and services produced by a country in a year $)
GNI (gross national income- includes money earned overseas) $
Trade

Example: Birth rate
Birth rate is the number of live births per
thousand people per year. This can indicate
that in developing countries the birth rate is
high because people don’t have access to
education / family planning. In developed
countries the birth rate is lower because
people have more access to these things.

What is this map showing?

Using the map describe the distribution of wealth / income that it shows
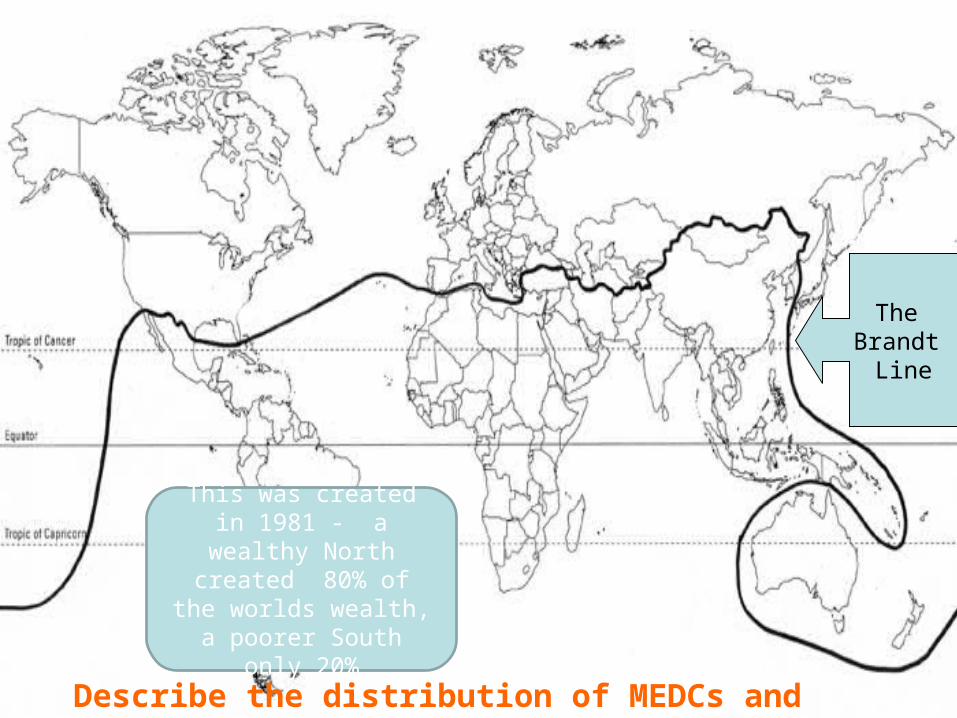
Describe the distribution of MEDCs and LEDCs
The Brandt
Line
This was created in 1981 - a wealthy North
created 80% of the worlds wealth, a poorer
South only 20%

Development indicatorsSocial measures Economic measures
Birth rate .
Death rate
Infant mortality rate
Adult literacy rate
Doctor patient ratio
Life expectancy
Employment structure
GDP
GNI
Trade

The Human Development Index HDI• Another way to look at measuring development is the
HDI - Life expectancy, education and GDP are taken into account.

GCSE Geography Homework Project - independent research
Due friday 16th May
Your task is to choose a country that is an LEDC. You must use the Human Development Index to think about which country you choose.
You will create a short 3 minute presentation on this country and what you have found out about it.
Include facts such as the development indicators we have looked at today.
You will present this on the 16th.

GCSE Geography Homework Project - independent research
Due 18th March
Your task is to choose a country that is an LEDC. You must use the Human Development Index to think about which country you choose. Use www.mrshbgeography.com as a guide
You will create a short 3 minute presentation on this country and what you have found out about it.
Include facts such as the development indicators we have looked at today.
You will present this on the 18th March.

http://www.worldmapper.org/display.php?selected=261
Infant mortality map – name the key places

A comparison of BR and GNI

Describe the correlation on both of these graphs.Explain why there is a correlation between the indicators
used.

11.2 Dividing up the world
Do you think HDI is a better way of measuring development than just income? Explain your answer