what financial resources do central banks have? · part b what financial resources do central banks...
TRANSCRIPT

BIS Papers No 71 – The finances of central banks 19
Part B What financial resources do central banks have?
In this part, we document how the main elements of financial resources observed in a representative group of BIS shareholding central banks evolved between 2005 and 2010, and set that against how risks to central bank finances changed. We describe risk-sharing arrangements that are purpose-built, and those that are embedded in surplus (profit) distribution schemes for these central banks. We use a sample of BIS shareholding central banks because much of the data required for our analysis needs to be generated anew from central bank information systems, and the burden can be large. Because these data are rarely published, we identify only a few central banks by name, with their agreement.
The first section provides a schematic overview of the financial stocks and flows we are concerned with. In the second part, data on changes in the size, composition and risk exposures of balance sheets of 14 central banks from 2005 to 2010 are presented, to illustrate why questions concerning the financial strength of central banks have attracted increasing interest. The following four sections describe step by step how changes in financial exposures come to affect the financial resources of these central banks: First, Section 3 shows how accounting policies shape the translation of underlying (or “economic”) exposures into accounting income. Section 4 presents the size and composition of financial buffers that are available for absorbing losses if risk exposures are realised, and Section 5 describes the impact of different valuation methods on some of these buffers. Section 6 discusses mechanisms available to some central banks to transfer specific risks to government before decisions on profit distributions are taken. Section 7 covers the last element of the chain – the rules governing how much of the distributable surplus will be transferred to government, and how much is retained by the central bank to rebuild or expand financial buffers for the future. In the last section, the step-by-step presentation is collapsed into brief case studies of the five central banks that have been identified by name in the preceding discussion.
1. Components of central bank finances: an overview
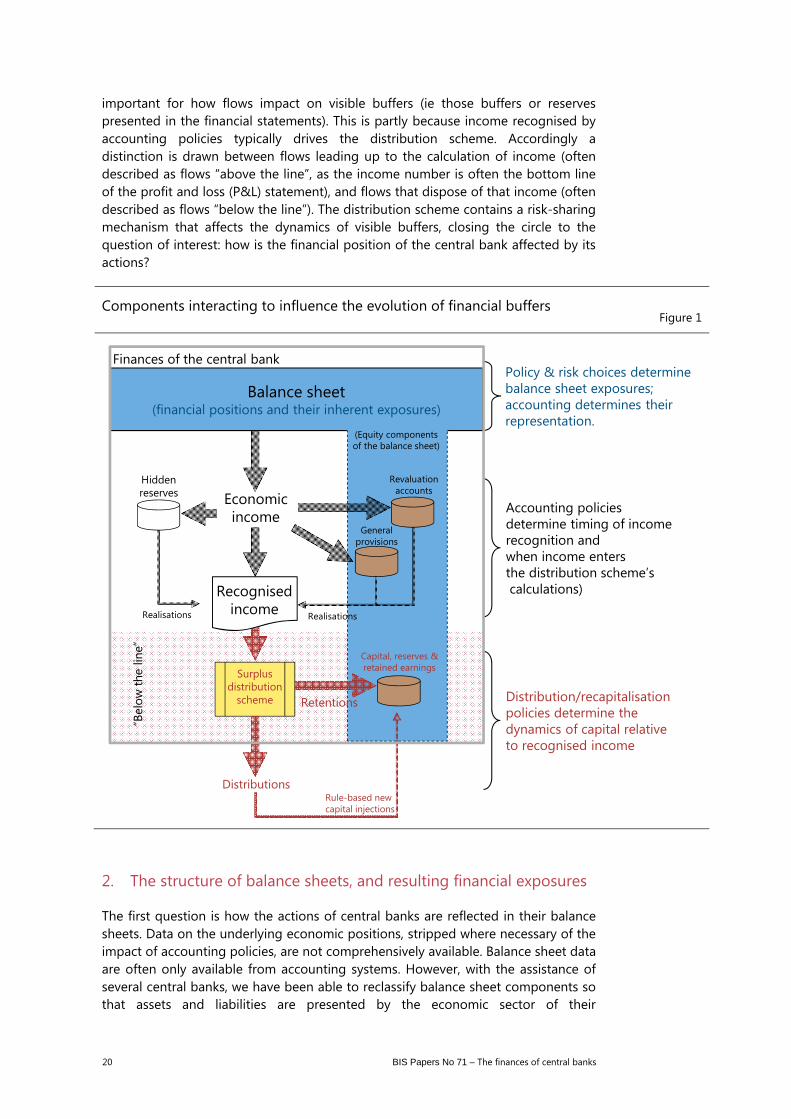
To show how actions by the central bank affect its own financial position, Figure 1 (see next page) provides an overview of the components discussed in this part of the paper.
As set out in Figure 1, a central bank’s policy and risk choices determine its financial positions and their inherent exposures, within a given economic environment. (In this paper we describe these inherent exposures as “economic exposures”, distinguishing them from “accounting exposures”.34) Understanding the feed-through to the financial position of the central bank requires an understanding of the flows (income) associated with the balance sheet positions adopted. This in turn requires an understanding of accounting policies, since they shape the representation in the financial statements of the underlying or “economic” balance sheet positions and their associated flows. Accounting policies are particularly
34 The relevance of this distinction will become clearer in the context of a discussion of accounting for
valuation changes, such as changes in the market value of bonds and other fixed interest investments (though it is also relevant to other sources of exposure). By “economic exposures” we are looking through the specific accounting treatment used and focusing on exposure to changes in market value, as if those changes were also changes in fair value.
20 BIS Papers No 71 – The finances of central banks
important for how flows impact on visible buffers (ie those buffers or reserves presented in the financial statements). This is partly because income recognised by accounting policies typically drives the distribution scheme. Accordingly a distinction is drawn between flows leading up to the calculation of income (often described as flows “above the line”, as the income number is often the bottom line of the profit and loss (P&L) statement), and flows that dispose of that income (often described as flows “below the line”). The distribution scheme contains a risk-sharing mechanism that affects the dynamics of visible buffers, closing the circle to the question of interest: how is the financial position of the central bank affected by its actions?
2. The structure of balance sheets, and resulting financial exposures
The first question is how the actions of central banks are reflected in their balance sheets. Data on the underlying economic positions, stripped where necessary of the impact of accounting policies, are not comprehensively available. Balance sheet data are often only available from accounting systems. However, with the assistance of several central banks, we have been able to reclassify balance sheet components so that assets and liabilities are presented by the economic sector of their
Components interacting to influence the evolution of financial buffers Figure 1
Balance sheet(financial positions and their inherent exposures)
Recognised income
Distributions
Retentions
Realisations
Capital, reserves & retained earnings
Revaluationaccounts
Realisations
Economicincome
“Bel
ow th
e lin
e”
Policy & risk choices determinebalance sheet exposures; accounting determines their representation.
Accounting policies determine timing of incomerecognition and when income entersthe distribution scheme’scalculations)
Distribution/recapitalisation policies determine the dynamics of capital relativeto recognised income
Generalprovisions
Hiddenreserves
Surplusdistribution
scheme
(Equity components of the balance sheet)
Rule-based new capital injections
Finances of the central bank
BIS Papers No 71 – The finances of central banks 21
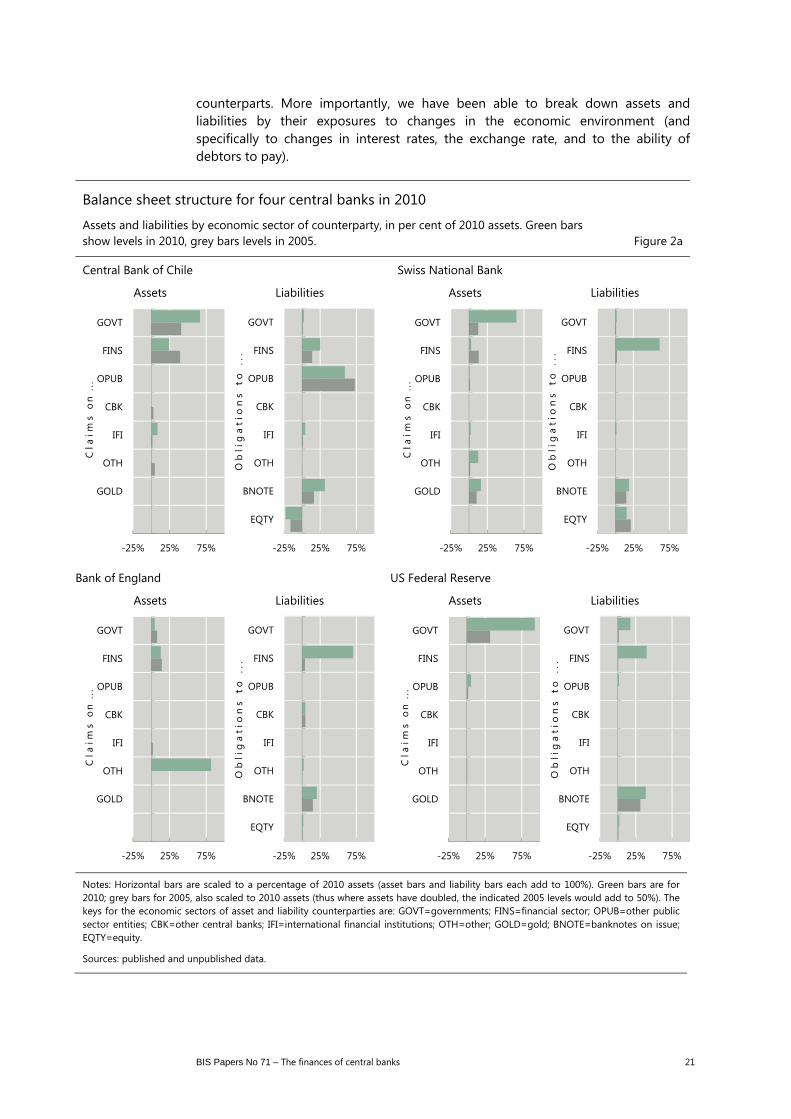
counterparts. More importantly, we have been able to break down assets and liabilities by their exposures to changes in the economic environment (and specifically to changes in interest rates, the exchange rate, and to the ability of debtors to pay).
Balance sheet structure for four central banks in 2010
Assets and liabilities by economic sector of counterparty, in per cent of 2010 assets. Green bars show levels in 2010, grey bars levels in 2005. Figure 2a
Central Bank of Chile Swiss National Bank
Assets Liabilities Assets Liabilities
Bank of England US Federal Reserve
Assets Liabilities Assets Liabilities
Notes: Horizontal bars are scaled to a percentage of 2010 assets (asset bars and liability bars each add to 100%). Green bars are for 2010; grey bars for 2005, also scaled to 2010 assets (thus where assets have doubled, the indicated 2005 levels would add to 50%). The keys for the economic sectors of asset and liability counterparties are: GOVT=governments; FINS=financial sector; OPUB=other public sector entities; CBK=other central banks; IFI=international financial institutions; OTH=other; GOLD=gold; BNOTE=banknotes on issue; EQTY=equity.
Sources: published and unpublished data.
-25% 25% 75%
GOVT
FINS
OPUB
CBK
IFI
OTH
GOLD
Cla
ims
on
...
-25% 25% 75%
GOVT
FINS
OPUB
CBK
IFI
OTH
BNOTE
EQTY
Ob
lig
ati
on
s t
o .
..
-25% 25% 75%
GOVT
FINS
OPUB
CBK
IFI
OTH
GOLD
Cla
ims
on
...
-25% 25% 75%
GOVT
FINS
OPUB
CBK
IFI
OTH
BNOTE
EQTY
Ob
lig
ati
on
s t
o .
..
-25% 25% 75%
GOVT
FINS
OPUB
CBK
IFI
OTH
GOLD
Cla
ims
on
...
-25% 25% 75%
GOVT
FINS
OPUB
CBK
IFI
OTH
BNOTE
EQTY
Ob
lig
ati
on
s t
o .
..
-25% 25% 75%
GOVT
FINS
OPUB
CBK
IFI
OTH
GOLD
Cla
ims
on
...
-25% 25% 75%
GOVT
FINS
OPUB
CBK
IFI
OTH
BNOTE
EQTY
Ob
lig
ati
on
s t
o .
..

22 BIS Papers No 71 – The finances of central banks
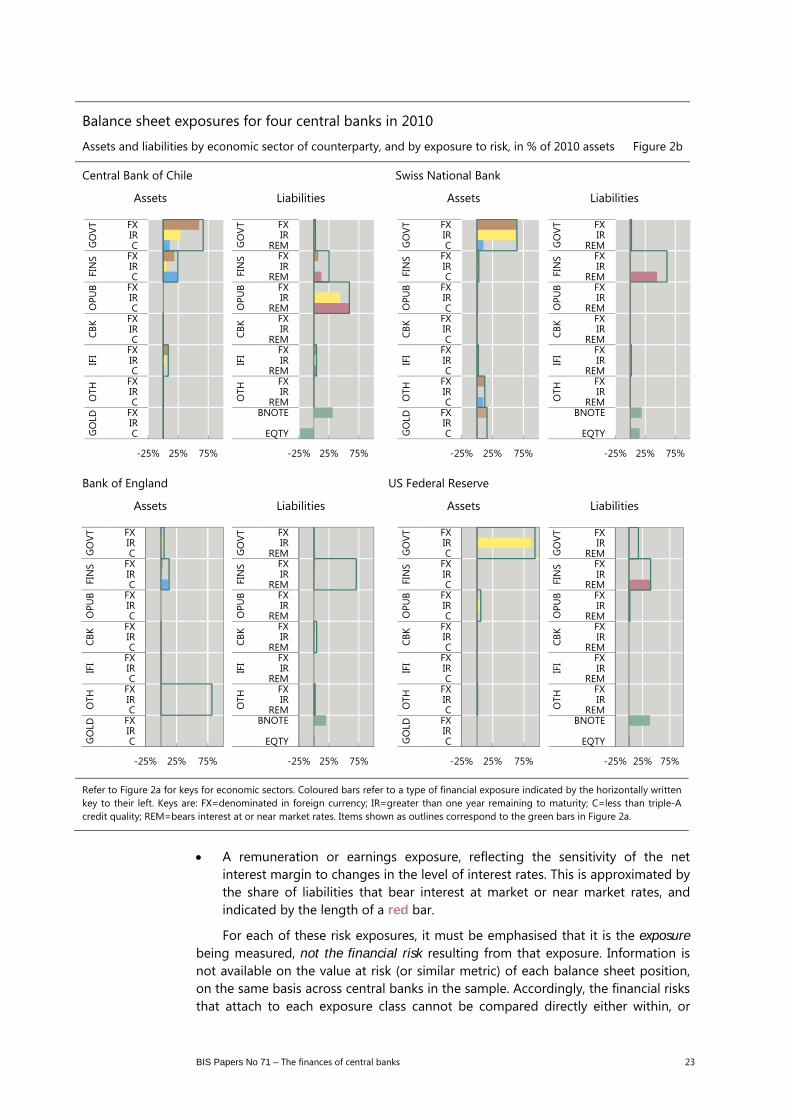
Figure 2a (previous page) shows the breakdown for four central banks (chosen to illustrate certain points) by economic sector of the counterparty, as at the end of 2010 (with corresponding 2005 positions indicated by vertical lines).
Three of the four central banks depicted in Figure 2a – the Bank of England, the US Federal Reserve, and the Swiss National Bank – all pursued strongly expansionary monetary policies over the latter part of the period 2005 to 2010, as indicated by the growth in total assets over the entire period. Yet the sectoral counterparts to that growth were rather different. For the Fed, asset growth mainly involved the purchase of government securities in exchange for domestic base money liabilities to financial institutions. For the Bank of England, asset growth occurred primarily through a subsidiary – the specially created Bank of England Asset Purchase Facility Fund Limited (BEAPFF) – which the Bank financed with loans. Hence the representation of the asset purchases associated with the asset exchange and quantitative easing programmes undertaken on each side of the Atlantic is very different, notwithstanding considerable similarities in their economic nature.
The Swiss National Bank’s asset purchases, in the meantime, appear at first glance to be very similar to those of the Fed, being concentrated in additional claims on governments, producing – as for the Fed and the Bank of England – a corresponding increase in financial institutions’ deposits at the central bank. Yet the SNB’s newly acquired assets were almost entirely denominated in FX, consistent with the policy actions being dominated by exchange rate intervention. Accordingly, to make sense of the differences in the financial implications of the different policy actions of these three central banks, one needs to examine the nature of the economic exposures acquired in the course of such balance sheet changes. Such a breakdown is provided in Figure 2b (following page), as follows:
The asset and liability positions from Figure 2a are repeated in outline, for ease of reference
Within these positions, we show the exposure to each of four kinds of risk.
The four possible risk exposures are:
Currency risk exposure, being the amount of that asset or liability class (measured as a proportion of total assets) that is denominated in foreign currency. This amount is indicated by the length of a brown bar.35
Interest rate risk exposure, which is approximated by assets and liabilities with residual maturities beyond one year, where that asset or liability is subject to changes in market or fair value (whether or not those changes in value are accounted for in the financial statements). This amount is indicated by the length of a bar.34
Credit risk exposure, which is approximated by the amount of the asset class that is below triple A36 (or its equivalent, if no rating is available), as indicated by the length of a bar.34 Credit enhancements or layoffs are taken into blueaccount.
35 If the coloured bar extends the entire length of the outline, the entirety of that asset or liability is
exposed to that risk. If the relevant coloured bar is absent, the asset or liability is not exposed to that risk at all.
36 By all major internationally active rating providers.
BIS Papers No 71 – The finances of central banks 23
A remuneration or earnings exposure, reflecting the sensitivity of the net interest margin to changes in the level of interest rates. This is approximated by the share of liabilities that bear interest at market or near market rates, and indicated by the length of a red bar.
For each of these risk exposures, it must be emphasised that it is the exposure being measured, not the financial risk resulting from that exposure. Information is not available on the value at risk (or similar metric) of each balance sheet position, on the same basis across central banks in the sample. Accordingly, the financial risks that attach to each exposure class cannot be compared directly either within, or
Balance sheet exposures for four central banks in 2010
Assets and liabilities by economic sector of counterparty, and by exposure to risk, in % of 2010 assets Figure 2b
Central Bank of Chile Swiss National Bank
Assets Liabilities Assets Liabilities
Bank of England US Federal Reserve
Assets Liabilities Assets Liabilities
Refer to Figure 2a for keys for economic sectors. Coloured bars refer to a type of financial exposure indicated by the horizontally written key to their left. Keys are: FX=denominated in foreign currency; IR=greater than one year remaining to maturity; C=less than triple-A credit quality; REM=bears interest at or near market rates. Items shown as outlines correspond to the green bars in Figure 2a.
-25% 25% 75%
FXIRC
FXIRC
FXIRC
FXIRC
FXIRC
FXIRC
FXIR
C
GO
VTFI
NS
OPU
BCB
KIF
IO
THG
OLD
-25% 25% 75%
FXIR
REMFXIR
REMFXIR
REMFXIR
REMFXIR
REMFXIR
REMBNOTE
EQTY
GO
VTFI
NS
OPU
BCB
KIF
IO
TH
-25% 25% 75%
FXIRC
FXIRC
FXIRC
FXIRC
FXIRC
FXIRC
FXIR
C
GO
VTFI
NS
OPU
BCB
KIF
IO
THG
OLD
-25% 25% 75%
FXIR
REMFXIR
REMFXIR
REMFXIR
REMFXIR
REMFXIR
REMBNOTE
EQTY
GO
VTFI
NS
OPU
BCB
KIF
IO
TH
-25% 25% 75%
FXIRC
FXIRC
FXIRC
FXIRC
FXIRC
FXIRC
FXIR
C
GO
VTFI
NS
OPU
BCB
KIF
IO
THG
OLD
-25% 25% 75%
FXIR
REMFXIR
REMFXIR
REMFXIR
REMFXIR
REMFXIR
REMBNOTE
EQTY
GO
VTFI
NS
OPU
BCB
KIF
IO
TH
-25% 25% 75%
FXIRC
FXIRC
FXIRC
FXIRC
FXIRC
FXIRC
FXIR
C
GO
VTFI
NS
OPU
BCB
KIF
IO
THG
OLD
-25% 25% 75%
FXIR
REMFXIR
REMFXIR
REMFXIR
REMFXIR
REMFXIR
REMBNOTE
EQTY
GO
VTFI
NS
OPU
BCB
KIF
IO
TH

24 BIS Papers No 71 – The finances of central banks
across, central bank balance sheets. However, for each central bank it is legitimate to observe changes in exposures through time, and significant differences in the structure of exposures between different central banks can also be observed validly.
Return to the comparison between the balance sheets of the SNB and the Fed. As mentioned, both saw large increases in claims on governments. Figure 2b (previous page) implies that both experienced substantial increases in interest rate risk exposures, in keeping with the long maturities of those increased claims. However, unlike the Fed, the SNB also apparently experienced a large increase in FX exposures, since essentially all of its elevated claims on governments are outside Switzerland. Further, as some of those governments were rated below triple A, there also appears to have been a corresponding increase in the SNB’s credit exposure. Meantime, the increases in SNB liabilities were concentrated in deposits of financial institutions, and in money market bills issued by the SNB. The latter are remunerated and thus bear remuneration risk. These differences are potentially very important for the dynamics of the finances of each central bank.37
As a further illustration, compare the structure and evolution of the combined balance sheet of the Bank of England with the others just discussed.38 The balance sheet expansion between 2005 and 2010 in the United Kingdom was even larger than in the other two cases, yet the asset and exposure composition of the expansion was dramatically different. The BoE’s subsidiary, the BEAPFF, is not consolidated with the main balance sheet(s) because the financial risks and rewards arising from BEAPFF’s activities belong entirely to the government, under an indemnity arrangement. The Bank’s balance sheet registers loans to the BEAPFF, but because the loans and the counterparty are fully indemnified, no economic exposure results. Notwithstanding a structure of asset purchases arising from monetary policy actions in the UK that is similar in many respects to that in the United States, in Figure 2b the BoE shows no change in credit and interest rate exposures.39
In these three cases, we thus have three very different examples of the financial exposures arising from what at heart could be considered to be similar monetary policy innovations: easing financial conditions by asset purchases that result in a boost to the monetary base of the financial system. The Central Bank of Chile, in contrast, showed little change in the size and structure of its balance sheet (Figure 2a), or of its exposures (Figure 2b), over the same period, again indicating the diversity of experiences among central banks.
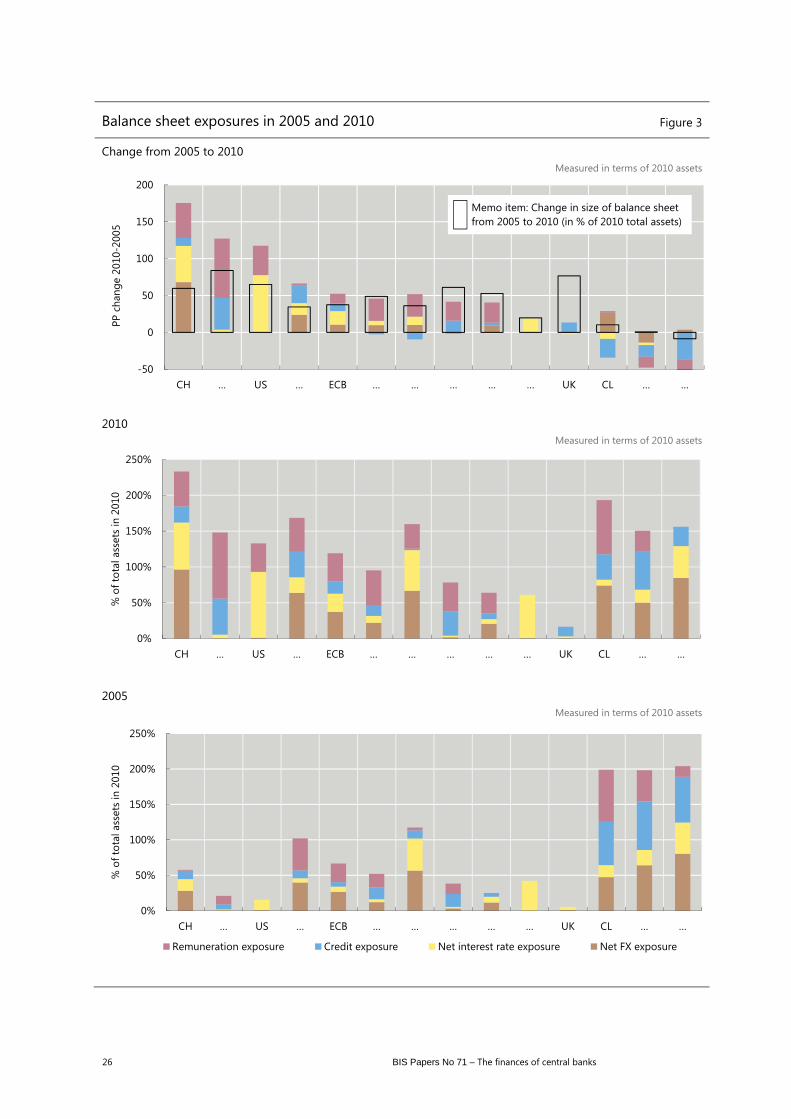
Diversity is further illustrated in Figure 3. Here we use the same method for calculating economic exposures and apply it across the wider sample. We sum
37 This paragraph refers to changes in exposures that are implied by the combination of the changes
in balance sheet components shown in Figure 2a and the resulting exposures shown in Figure 2b. Figure 3 on the following page presents changes in exposures between 2005 and 2010 across all balance sheet categories.
38 The Bank of England has two balance sheets, one representing the note-issuing function and the other representing all other functions, including the monetary policy function. Our representation combines the two (and excludes the BEAPFF).
39 The focus of this discussion is on the change in the balance sheet between the end of 2005 and the end of 2010. For around three months in 2008 and 2009 the Bank was exposed on emergency lending assistance to two large banks, only a small part of which was explicitly indemnified by the government. At peak, the Bank’s unindemnified exposure through ELA was in the order of £50 billion. By way of comparison, indemnified exposures via BEAPFF amounted to around £200 billion at the end of 2010 (and almost double that by the end of 2012).

BIS Papers No 71 – The finances of central banks 25
exposures using the common metric of a percentage of the balance sheet – even though 50% of the balance sheet exposed to FX may imply a different financial risk than 50% of the balance sheet exposed to interest rate risk (for example) – and show the changes between 2005 and 2010 (in coloured columns in the top panel), and compare these changes with the total change in assets over the period (in the open rectangles in the top panel).40 Again we note that we are using rough proxies for existence of economic exposures, not consistent measures of financial risk, and we caution against using our exposure measures to compare the financial riskiness of different central banks.
Three points about Figure 3 are especially notable:
The growth of economic exposures from 2005 to 2010 bears only a weak relationship to the growth of the balance sheet over the same period. The stacked coloured bars in the top panel representing summed changes in economic exposure visually show little correspondence with the outline bars representing the total change in assets. (The correlation between rank orders is 0.6.) Not only the Bank of England, but several other central banks registered large balance sheet growth without a similar-sized increase in their own economic exposures. Some of these cases are illustrations of financial risk-sharing devices, as for the Bank of England. The availability of such devices will be discussed further (though not necessarily with respect to the cases presented here).
Among the central banks that saw the biggest accumulation of exposures between 2005 and 2010, there is little similarity with respect to the types of exposure accumulated. But they share the feature that new exposures were accumulated over this period on more than one risk dimension (four, in the case of the Swiss National Bank).
The three central banks with the largest sum of exposures in 2005 saw the smallest growth of exposures from 2005 to 2010 (and, as it happens, the smallest balance sheet growth).
40 To make the elements in the top panel comparable, the change in balance sheet size from 2005 to
2010 (bar in outline format) is shown as a percentage of 2010 assets, in the same way as the change in exposures shown by the coloured bars.
26 BIS Papers No 71 – The finances of central banks
Balance sheet exposures in 2005 and 2010 Figure 3
Change from 2005 to 2010 Measured in terms of 2010 assets
2010 Measured in terms of 2010 assets
2005 Measured in terms of 2010 assets
-50
0
50
100
150
200
CH … US … ECB … … … … … UK CL … …
PP c
hang
e 20
10-2
005
Memo item: Change in size of balance sheetfrom 2005 to 2010 (in % of 2010 total assets)
0%
50%
100%
150%
200%
250%
CH … US … ECB … … … … … UK CL … …
% o
f tot
al a
sset
s in
201
0
0%
50%
100%
150%
200%
250%
CH … US … ECB … … … … … UK CL … …
% o
f tot
al a
sset
s in
201
0
Remuneration exposure Credit exposure Net interest rate exposure Net FX exposure

BIS Papers No 71 – The finances of central banks 27
3. Accounting policies: translating economic exposures into accounting income
Accounting policies do not change the economic reality of the financial risks acquired in the course of pursuing policy and operational objectives. Yet we will explain in section 3 of Part C that accounting policies matter in at least two ways: they change behaviour, and they affect financial strength through the operation of the surplus distribution schemes or other rules that depend on accounting measures.
There is no dominant generally accepted accounting framework for central banks (Figure 4, right-hand panel). Three types of framework are commonly used, namely IFRS (to a greater or lesser extent), the ESCB framework (used mainly by the central banks of the euro area), and home-grown frameworks embedded in central bank or other laws.
The points of differentiation between these accounting policies/frameworks in principle concern the measurement of changes in the value of financial instruments; when such changes are recognised as income; and whether general provisions can be made for potential losses. Unfortunately, statements of accounting policies do not always provide clarity on the quantitative significance of these points of differentiation, since a mapping of accounting policies to each balance sheet category is required, and such a mapping is not always available.
To obtain a better understanding of how accounting policies combine with central banks’ financial positions to affect their finances, we organised the balance
Accounting framework Figure 4
Selection of accounting framework Percentage of 16 central banks
Accounting framework used Percentage of 16 central banks
Source: BIS survey.
0% 50% 100%
CB law specifies accountingstandard
CB law mandates specific bodyto determine accounting
standard
ESCB member
Other
0% 50% 100%
IFRS
IFRS with departures
National IFRS
National IFRS with departures
National GAAP
National GAAP withdepartures
ESCB accounting policies
Special central bank standard
IFRS
Nat
iona
l GAA
PES
CBSp
ecia
l

28 BIS Papers No 71 – The finances of central banks
sheets of 16 central banks by the three standard methods used to value instruments and recognise income (see box below). The results are shown in Figure 5, on the basis of five-year averages (2006 to 2010).
The three combinations of valuation and income recognition shown in Figure 5 are (consistent with the terminology presented in the box):
The proportion of the total balance sheet that is treated according to fair value through P&L is shown by the proportion of blue (labelled “Revaluations go to P&L” in the key to the figure) in each central bank’s rectangle.41, 42
The proportion treated according to fair value through equity is shown in green (labelled ”Revaluations go to equity” in the key).41, 42
The proportion treated according to amortised cost (sometimes called “historic cost”) is shown in red (labelled “Not revaluing” in the key).41
Where one of the three accounting methods is not used at all, we insert a hairline-width placeholder.
41 The overall width of the rectangle depicted for each central bank is scaled to the sum of assets and
liabilities, except equity, of that central bank, averaged over the five years to 2010. The relative width of each coloured block within the rectangle is calculated from the average shares over the five years of the assets and liabilities that were subject to the corresponding accounting treatment.
42 For central banks using the ESCB accounting methodology, or similar asymmetric treatments of revaluation income, the proportions of the balance sheet shown as being treated as fair value through equity are overstated, and the proportions shown as fair value through P&L a correspondingly understated. This is because the asymmetric treatment routes part of the income (all gains) to revaluation accounts, and part (losses greater than the corresponding revaluation account buffer) to P&L. The proportions treated each way thus vary with circumstances. For simplicity, all assets and liabilities subject to asymmetric treatment are shown as being revaluing to revaluation accounts in equity.
Three common accounting treatments for income:
Accounting for income arising from financial positions involves choices on both the valuation of assets and liabilities, and the recognition of income arising from changes in value. There are three common combinations of valuation and income recognition. They are:
Fair value through Profit and Loss (P&L). Assets and liabilities are measured at “fair values” (often indicated by market values), and all changes in value as well as accruals are recognised as income (hence being reflected in the P&L statement).
Fair value through equity. Assets and liabilities are measured at fair value, but only accruals and realised gains and losses (from sales) are included in the P&L account. Unrealised changes in value are not recorded as profit/loss but are instead recorded either (i) directly in revaluation accounts (balance sheet items that effectively constitute part of equity) or (ii) in the statement of Other Comprehensive Income, which flows into the reporting entity’s equity. That these unrealised changes in value are considered equity items is consistent with the idea that such changes in value belong to the owners.
Amortised cost/face value. Assets and liabilities are not revalued but are instead recorded at their acquisition (or some other historic cost) or face value if appropriate, amortised for premiums paid or discounts received. There is thus no recognition of income from changes in market values (or other indicators of current value) – if such changes occur for the instrument being accounted.
In all three cases, regular contractual flows of interest payments and receipts (if applicable) are recorded as income.

BIS Papers No 71 – The finances of central banks 29
The predominant character of the accounting standard or framework used – consistent with the right panel of Figure 4 – is indicated to the left of Figure 5 (IFRS or IFRS-like, with fair value treatment of qualifying financial instruments; ESCB, for those using the eurosystem accounting approach; or Other).
In a nutshell, the more blue in Figure 5, the more that assets or liabilities are revalued with valuation changes going through P&L; the more green, the more that revaluation accounts are used; and the more red, the more assets and liabilities are held at an unchanging book value (eg at acquisition cost).
It is important to caution that the different accounting treatments for income under discussion here – in the box on the previous page, and shown in Figure 5 – relate to the treatment of price (or value) changes in the currency of denomination. The accounting treatment of changes in the local currency values of assets and liabilities denominated in foreign currencies, due to changes in exchange rates, is also highly relevant for central banks. The treatment of income arising from these exchange rate “(re)translation” effects is not always matched with the treatment of income arising from changes in the price (or value) of held assets and liabilities. This is shown in Annex 1, which goes into this territory in more detail.
Having made that caveat, the main takeaways are: first, the major part of the balance sheet, for the majority of central banks, is not subject to revaluation (red dominates.) Second, for items revalued as market prices change, revaluation gains and losses go to P&L and to revaluation accounts in about the same number of cases (blue and green are similarly represented). Third, the dominant accounting
Balance sheet composition by accounting treatment for price changes
(averages of financial years 2006-10) Figure 5
The combined width of the horizontal bars reflects total assets plus liabilities (not including equity)
Revaluations go to P&L Not revaluingRevaluations go to equity
Key
CBCIFRS
ECB
BOE
FED
SNBIFRSIFRS
IFRS
IFRS
IFRS
IFRS
IFRS
Other
Other
Other
ESCB
ESCB
ESCB
ESCB
ESCB
Accounting standard
used:

30 BIS Papers No 71 – The finances of central banks
framework used provides relatively little insight (by itself) into the valuation dynamics of the balance sheet.
On the third point, the accounting treatment of financial positions depends both on the accounting standard/framework being followed and the inherent nature of the position. A central bank’s liabilities may be dominated by banknotes on issue and the call deposits of financial institutions. Neither is subject to change in nominal value, being legally and practically fixed. Regardless of the chosen accounting treatment, there are no revaluations. A central bank’s assets may also be dominated by positions that are treated as fixed in nominal value under each of the standard accounting treatments, such as deposits and loans. Central banks such as the Bank of England (sixth from the bottom) comply fully with IFRS, but the great majority of assets and liabilities are in forms that are not revalued under IFRS (currency notes and deposits on the liabilities side; loans on the assets side).43 Another example of the interplay between accounting policies and the inherent nature of the positions is the Swiss National Bank (third from the top). Normally, all of the SNB’s assets are subject to revaluation, with gains and losses going to P&L. However, exceptionally, during the period covered by Figure 5, the SNB had claims on the UBS stabilisation fund which, due to their form, are not revalued under IFRS. (Annex 1 shows the asset and liability breakdown in more detail.)
The point that the essential business structure of a central bank may lead to inherent mismatches in the economic character of liabilities and corresponding assets, and hence to inherent mismatches in their accounting treatment, is crucial to a full understanding of its financial dynamics. Interest rate and exchange rate exposures are often much larger than would be contemplated by most types of commercial financial institution. If the accounting treatment registers those changes in value, the financial statements will reflect the inherent dynamics of the institution’s economic exposures. Annex 1 decomposes Figure 5 into assets and liabilities, and by currency of denomination. Substantial mismatches between the valuation treatments of assets and liabilities are revealed. In some cases, almost all assets are revalued, but liabilities are not. Likewise for the treatment of changes in value due to foreign exchange translation. Many central banks have substantial assets in foreign currency;44 only a few also have liabilities in foreign currency. Again, both underlying and accounting mismatches arise (the latter mostly between assets of a similar type, where those denominated in domestic currency are treated according to one accounting method, and those denominated in foreign currency to another).
4. Exposures and accounting treatment combined: impact on P&L
To make the interaction between economic exposures and accounting treatment more concrete, as a prelude to considering the consequent impact on financial buffers, in Table 2 (page 32) we present three contrasting cases: the Central Bank of Chile, the European Central Bank and the US Federal Reserve. For the sake of comparability the data are divided by the assets of each central bank; and for the sake of avoiding idiosyncratic outcomes, they are then averaged over the five years 2006 to 2010.
43 Likewise, intra-Eurosystem claims arising out of (for example) the allocation of euro banknotes are
not subject to market value changes. 44 Gold is treated as being denominated in foreign currency.

BIS Papers No 71 – The finances of central banks 31
The shaded areas of the table contain information on changes in the values of assets and liabilities that these central banks register by adjusting their book values. The shares of assets and liabilities that are revalued are shown in the third column (to avoid the need for the reader to refer back to Figure 5 and Figures A2 to A4 in Annex 1). For those revaluations and FX retranslations that are immediately recognised as income, the far right column captures the direct P&L impact. For those revaluations and FX retranslations that are taken instead to equity, the far right column captures mostly the P&L resulting from transactions that crystallise past valuation changes, transforming those valuation changes into “realised” or cash income.45 The main exception is for the ECB, where the revaluation accounts operate asymmetrically; for the ECB, the P&L effect is a mix of unbuffered revaluation losses and realisations of past valuation changes.
The unshaded areas of the table show P&L arising from sources other than revaluations and FX retranslations. Net operating income – primarily arising from net interest income and from the accrual of premiums and discounts on fixed interest assets and liabilities – is the main such source of P&L.
The three cases differ substantially. The CBC, with the largest FX exposure of the three (on average over this period 80% of assets and 12% of liabilities were denominated in foreign currencies), experienced by far the largest FX retranslation flows of the three cases. To some extent, larger exchange rate variance was also relevant. Despite being subject to such variance, the CBC takes FX retranslations straight to P&L. Accordingly, recognised income was swelled by more than 9% of assets on average over the years in which FX retranslations were positive, and reduced by 8.5% of assets on average in years when it was negative. As positive and negative years nearly balanced, the average effect on P&L over the five years was to reduce P&L by 1.3% of assets.
Contrast this for a moment with the ECB, where both FX exposures (34% of assets and 1% of liabilities) and exchange rate variance were much smaller, and such FX retranslation changes as occurred were largely absorbed by revaluation accounts, hence the somewhat lower net impact of valuation changes on P&L. Recall that in the ECB case, revaluations and FX retranslations are taken to the revaluation accounts if they are positive, and to P&L if they are more negative than the outstanding balance in the revaluation account for each currency and security.46 Accordingly, in addition to having smaller FX exposures than the CBC, by choosing to use revaluation accounts (asymmetrically) the ECB protects P&L from the sort of income variations that is a feature of the CBC’s finances.
And to drive home the point that both underlying exposures and accounting policies are relevant to the resulting variance in income, compare the situation of the CBC and the Federal Reserve. Both use the same accounting policy for FX retranslations, taking gains and losses directly to P&L. Yet the Fed experiences very small P&L variation as a result, since its FX exposures are themselves very small (2% of assets, and essentially 0% of liabilities).
45 Realisations resulting from transaction are not the only reason for transfers between revaluation
accounts and P&L, but are normally the main reason. 46 So some negative FX retranslations will have been taken to P&L. These are included in Net
Operating Profits.

32 BIS Papers No 71 – The finances of central banks
Impact of valuation methods on financial buffers (above the line)
Averages of the years 2006–2010; stocks and flows both expressed as a % of total assets Table 2
Central Bank of Chile Accounting treatment
(stock to which applied; assets/non-equity liabilities)
Associated revaluation and FX translation flows
Net impact on P&L
Average of +ve years
Average of –ve years Revaluations and FX retranslations that are …
…taken to P&L For price changes 93/61 +0.9 0.0 +0.6
For FX retranslations 80/12 +9.4 –8.5 –1.3
…taken to revaluation accounts in equity
For price changes 7/0 0.0 0.0 0.0
For FX retranslations 0/0 – –
Net operating income (profit/loss from interest, accruals, fees etc, net of operating costs) –1.9
Transfers between general risk buffers and P&L –
Total declared profit/loss –2.7
European Central Bank Accounting treatment
(stock to which applied; assets/ non-equity liabilities)
Associated revaluation and FX translation flows
Net impact on P&L
Average of +ve years
Average of –ve years Revaluations and FX retranslations that are …
…taken to P&L For price changes 0/0 – – –
For FX retranslations 0/0 – – –
…taken to revaluation accounts in equity
For price changes 27/0 +0.2 –0.2 –0.1
For FX retranslations 34/1 +2.4 –1.8
Net operating income (profit/loss from interest, accruals, fees etc, net of operating costs) +1.0
Transfers between general risk buffers and P&L –0.5
Total declared profit/loss +0.4
US Federal Reserve Accounting treatment (stock to
which applied; assets/ non-equity
liabilities)
Associated revaluation and FX translation flows
Net impact on P&L
Average of +ve years
Average of –ve years Revaluations and FX retranslations that are …
…taken to P&L For price changes 4/0 +0.2 –0.1 0.0
For FX retranslations 2/0 +0.1 0.0 +0.1
…taken to revaluation accounts in equity
For price changes 0/0 – – –
For FX retranslations 0/0 – –
Net operating income (profit/loss from interest, accruals, fees etc, net of operating costs) +3.1
Transfers between general risk buffers and P&L –
Total declared profit/loss +3.1
Note: A dash (–) rather than 0.0 means not applicable. The share of assets that are not revalued is not shown, but is approximately 100–(the shares of assets shown as revaluing). The share of liabilities that are not revalued is also not shown, but it can be deduced in the same way except for the case of the Central Bank of Chile, which had negative equity over the period). Transfers between revaluation accounts in equity and P&L, typically to account for the realisation of value gains and losses previously taken to equity. Includes revaluation losses that are unable to be charged to a revaluation account because of an insufficient balance – see text. A negative sign indicates that income was used to build general risk buffers prior to P&L being declared.
BIS Papers No 71 – The finances of central banks 33
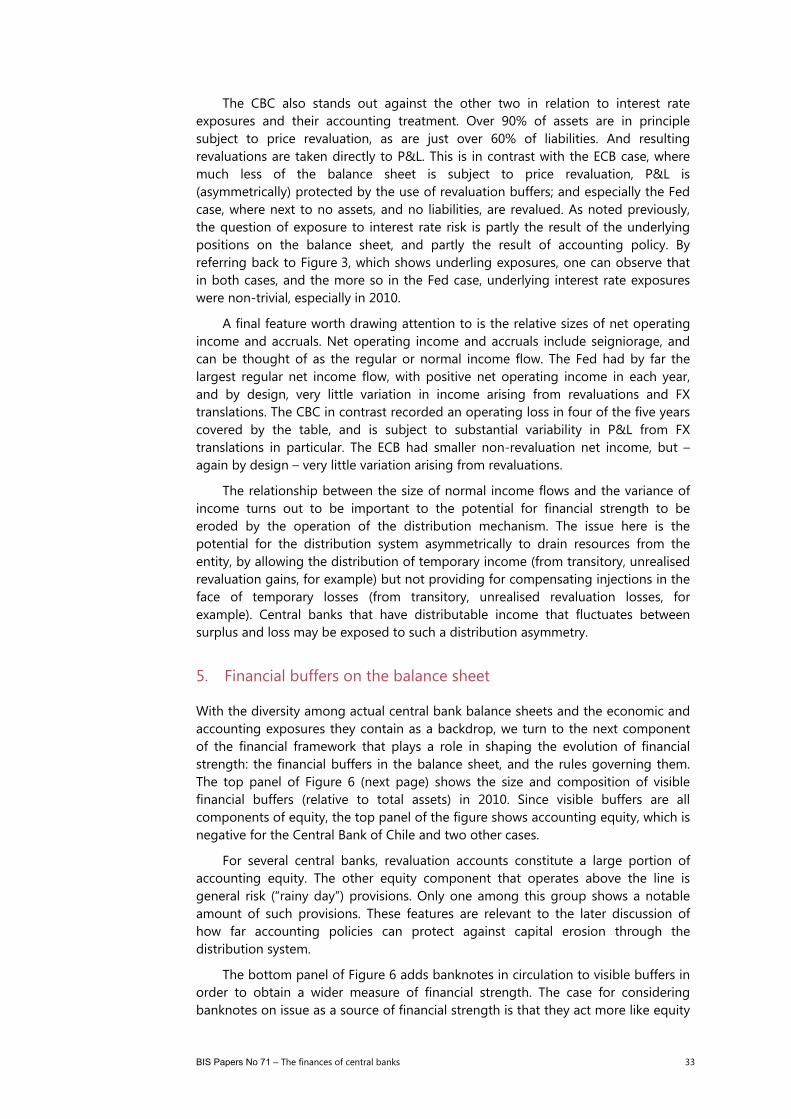
The CBC also stands out against the other two in relation to interest rate exposures and their accounting treatment. Over 90% of assets are in principle subject to price revaluation, as are just over 60% of liabilities. And resulting revaluations are taken directly to P&L. This is in contrast with the ECB case, where much less of the balance sheet is subject to price revaluation, P&L is (asymmetrically) protected by the use of revaluation buffers; and especially the Fed case, where next to no assets, and no liabilities, are revalued. As noted previously, the question of exposure to interest rate risk is partly the result of the underlying positions on the balance sheet, and partly the result of accounting policy. By referring back to Figure 3, which shows underling exposures, one can observe that in both cases, and the more so in the Fed case, underlying interest rate exposures were non-trivial, especially in 2010.
A final feature worth drawing attention to is the relative sizes of net operating income and accruals. Net operating income and accruals include seigniorage, and can be thought of as the regular or normal income flow. The Fed had by far the largest regular net income flow, with positive net operating income in each year, and by design, very little variation in income arising from revaluations and FX translations. The CBC in contrast recorded an operating loss in four of the five years covered by the table, and is subject to substantial variability in P&L from FX translations in particular. The ECB had smaller non-revaluation net income, but – again by design – very little variation arising from revaluations.
The relationship between the size of normal income flows and the variance of income turns out to be important to the potential for financial strength to be eroded by the operation of the distribution mechanism. The issue here is the potential for the distribution system asymmetrically to drain resources from the entity, by allowing the distribution of temporary income (from transitory, unrealised revaluation gains, for example) but not providing for compensating injections in the face of temporary losses (from transitory, unrealised revaluation losses, for example). Central banks that have distributable income that fluctuates between surplus and loss may be exposed to such a distribution asymmetry.
5. Financial buffers on the balance sheet
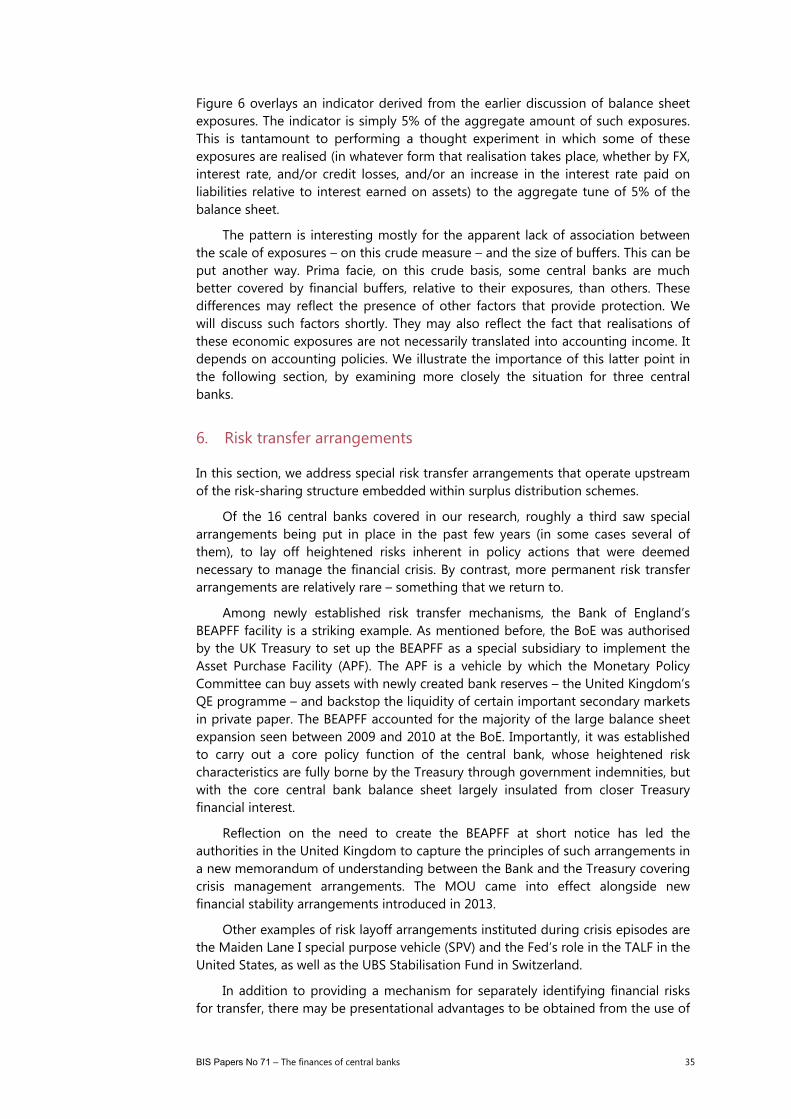
With the diversity among actual central bank balance sheets and the economic and accounting exposures they contain as a backdrop, we turn to the next component of the financial framework that plays a role in shaping the evolution of financial strength: the financial buffers in the balance sheet, and the rules governing them. The top panel of Figure 6 (next page) shows the size and composition of visible financial buffers (relative to total assets) in 2010. Since visible buffers are all components of equity, the top panel of the figure shows accounting equity, which is negative for the Central Bank of Chile and two other cases.
For several central banks, revaluation accounts constitute a large portion of accounting equity. The other equity component that operates above the line is general risk (“rainy day”) provisions. Only one among this group shows a notable amount of such provisions. These features are relevant to the later discussion of how far accounting policies can protect against capital erosion through the distribution system.
The bottom panel of Figure 6 adds banknotes in circulation to visible buffers in order to obtain a wider measure of financial strength. The case for considering banknotes on issue as a source of financial strength is that they act more like equity

34 BIS Papers No 71 – The finances of central banks
capital than debt obligations. As they bear no interest, and are perpetual in character, they provide a stable funding base for income generation. To the extent that net income can be retained when needed, a large share of banknote liabilities provides a base for rebuilding equity if it has been depleted by a negative shock. Clearly, the inclusion of banknotes makes a large difference to the sense of the scale of financial buffers available to central banks.
In order to obtain some sense of the relationship between the size of financial buffers available to central banks and their need for such buffers, the lower panel of
Financial buffers in the balance sheet in 2010 Figure 6
By equity component Per cent of total assets
Including banknotes in circulation Per cent of total assets
Note: Total exposures refer to the exposures depicted in Figure 3, middle panel (noting that the ordering of the central banks in the two figures differs).
… … ECB … CH … … US UK … … … … CL-30%
-20%
-10%
0%
10%
20%
30%
40%
Share capitalRetained earningsBuffers below the line, before distribution decisionsGeneral above the line provisionsRevaluation accounts
… … ECB … CH … … US UK … … … … CL-30%
0%
30%
60%
90%
Bank notes in circulation Total equity 5% of total exposures realised
BIS Papers No 71 – The finances of central banks 35
Figure 6 overlays an indicator derived from the earlier discussion of balance sheet exposures. The indicator is simply 5% of the aggregate amount of such exposures. This is tantamount to performing a thought experiment in which some of these exposures are realised (in whatever form that realisation takes place, whether by FX, interest rate, and/or credit losses, and/or an increase in the interest rate paid on liabilities relative to interest earned on assets) to the aggregate tune of 5% of the balance sheet.
The pattern is interesting mostly for the apparent lack of association between the scale of exposures – on this crude measure – and the size of buffers. This can be put another way. Prima facie, on this crude basis, some central banks are much better covered by financial buffers, relative to their exposures, than others. These differences may reflect the presence of other factors that provide protection. We will discuss such factors shortly. They may also reflect the fact that realisations of these economic exposures are not necessarily translated into accounting income. It depends on accounting policies. We illustrate the importance of this latter point in the following section, by examining more closely the situation for three central banks.
6. Risk transfer arrangements
In this section, we address special risk transfer arrangements that operate upstream of the risk-sharing structure embedded within surplus distribution schemes.
Of the 16 central banks covered in our research, roughly a third saw special arrangements being put in place in the past few years (in some cases several of them), to lay off heightened risks inherent in policy actions that were deemed necessary to manage the financial crisis. By contrast, more permanent risk transfer arrangements are relatively rare – something that we return to.
Among newly established risk transfer mechanisms, the Bank of England’s BEAPFF facility is a striking example. As mentioned before, the BoE was authorised by the UK Treasury to set up the BEAPFF as a special subsidiary to implement the Asset Purchase Facility (APF). The APF is a vehicle by which the Monetary Policy Committee can buy assets with newly created bank reserves – the United Kingdom’s QE programme – and backstop the liquidity of certain important secondary markets in private paper. The BEAPFF accounted for the majority of the large balance sheet expansion seen between 2009 and 2010 at the BoE. Importantly, it was established to carry out a core policy function of the central bank, whose heightened risk characteristics are fully borne by the Treasury through government indemnities, but with the core central bank balance sheet largely insulated from closer Treasury financial interest.
Reflection on the need to create the BEAPFF at short notice has led the authorities in the United Kingdom to capture the principles of such arrangements in a new memorandum of understanding between the Bank and the Treasury covering crisis management arrangements. The MOU came into effect alongside new financial stability arrangements introduced in 2013.
Other examples of risk layoff arrangements instituted during crisis episodes are the Maiden Lane I special purpose vehicle (SPV) and the Fed’s role in the TALF in the United States, as well as the UBS Stabilisation Fund in Switzerland.
In addition to providing a mechanism for separately identifying financial risks for transfer, there may be presentational advantages to be obtained from the use of

36 BIS Papers No 71 – The finances of central banks
an SPV. An SPV can be used to differentiate an unusual operation by the central bank from its normal business. Relatedly, transparency can actually be enhanced if separate reporting on the SPV is more extensive than the usual central bank standard with respect to normal operations. This was the case, for example, for the Maiden Lane I SPV. It is perhaps ironic that a vehicle that was widely abused by the private sector to hide information can in fact be the platform for better information for a central bank’s many stakeholders.
South Africa is one example where a risk transfer arrangement has been a longer-term feature of the central bank’s institutional design. While the SARB owns the bulk of South Africa’s foreign exchange reserves (currently about 88%), according to Section 28 of the central bank law (with details set out in an agreement with the government) the SARB records FX retranslations on a special revaluation account that is owned by the government: the Gold and Foreign Exchange Contingency Reserve Account (GFECRA). (By contrast, price changes on foreign currency denominated securities are recorded in P&L.) The role played by the GFECRA is striking – the declared P&L of the SARB varies little from year to year despite the SARB balance sheet containing a significant exchange rate exposure and the bank accounting for foreign currency assets and liabilities at closing exchange rates.
A second example of a long-standing risk transfer arrangement is to be found at the Reserve Bank of New Zealand (RBNZ), also relating to FX risk. Under the RBNZ’s law, the Minister of Finance may direct exchange rate policy and actions. Should the Minister do so, the law provides (Section 21) that ensuing exchange rate gains are paid to the government’s account at the RBNZ, and the Bank is compensated for ensuing losses out of that account without the need for Parliamentary appropriation. Gains and losses include both realised and unrealised components.
7. Distribution schemes and recapitalisation arrangements
The final factor shaping the dynamics of a central bank’s financial strength is the mechanism used to determine how much of the distributable (accounting) income is passed over to shareholders and/or to the beneficial owner, and how much of it is added to financial buffers of the central bank (see Figure 1 on page 20). In principle, such distribution mechanisms can allow for negative dividends whereby fresh capital is injected by the beneficial owner. Therefore, this section covers both distribution and recapitalisation arrangements.
Distribution schemes may be based on established rules, and/or feature discretionary decisions by the central bank, by shareholders, or jointly by the central bank and shareholders. These rule-based arrangements can be decomposed into four categories, not all of which need to be present at once: an ability to draw on external resources if negative dividends are required; targets for buffers (sometimes called capital targets); retention schemes; and dividend smoothing arrangements.
The key issue for the dynamics of the distribution scheme is how far the scale of retentions is conditional on the central bank’s financial state. Distribution schemes which require distributions even when equity is weak or negative may be exposed to a distribution asymmetry; those schemes in which distributions are strongly conditioned on the state of finances have an inbuilt mechanism that works to offset such an asymmetry.

BIS Papers No 71 – The finances of central banks 37
The first two categories of rule-based arrangements (the ability to call for fresh resources and the use of targets) are inherently conditional in character, but they can be slow or fast-acting, depending on the details. It may seem odd to discuss dividend payments as if they were not contingent in the first place. After all, for commercial entities the essential feature distinguishing dividends from debt service obligations is the former’s contingency on the financial health of the company. Yet in many central bank cases, laws and practice provide only limited or no scope for the central bank to withhold surpluses even where equity is already negative. For example:
The Bank of England is required to distribute to the Exchequer 100% of any Issue Department surplus and 50% of any Banking Department surplus, irrespective of the state of equity reserves.
The Central Bank of Ireland can only retain a maximum of 20% of any surplus, independent of the state of equity.47
Having calculated distributable income as a five-year smoothing of accounting income (adjusted for certain revaluation income), the Sveriges Riksbank must distribute 80%, irrespective of the equity situation.
The Bank of Japan may only retain 5% of surpluses by right. However, further retentions are possible with the authorisation of the Minister of Finance.
To obtain a sense of the range of distribution arrangements in use, we analysed those codified in laws and secondary legislation, for 16 central banks. Our interest was in the presence of features that buttress each central bank’s financial strength. We also evaluated judgmentally the power of these features. Distribution schemes that involve non-trivial targets for equity were ranked ahead of those that involve small targets (or simple non-negative targets), which were in turn ranked ahead of those with no targets (especially where some distribution is mandatory). Schemes where the central bank has discretion over the distribution were ranked ahead of those where there are joint negotiations, which were in turn ranked ahead of those where some distribution is mandatory or at the decision of shareholders. The ability to retain a large part, or all, of any surplus was ranked ahead of a capped retention. And the ability to call for fresh resources from shareholders to cover a year’s loss was scored highly. No cases of automatic and full recapitalisation were found; had they been, they would have ranked even higher as a mechanism for protecting financial strength through fresh capital.48
Annex Table A5 presents the raw material for this assessment. Figure 7, which stacks these features, shows the outcome, in a deliberately fuzzy manner. The greater the number of features that aid the retention of financial resources, and the greater their power, the longer the bar. Such an evaluation is necessarily subjective. Accordingly we use shades and diffuse boundaries to underscore that these
47 Such a situation potentially leaves the formal arrangements at odds with the 2012 Convergence
Report which states that “… financial independence also implies that an NCB should always be sufficiently capitalised. In particular, any situation should be avoided whereby for a prolonged period of time an NCB’s net equity is below the level of its statutory capital or is even negative, including where losses beyond the level of capital and the reserves are carried over” and “Profits may be distributed to the State budget only after any accumulated losses from previous years have been covered and financial provisions deemed necessary to safeguard the real value of the NCB’s capital and assets have been created.”
48 Although the Bank of Korea’s ability to have the government budget cover a year’s losses that exceed reserves comes very close, and is accordingly ranked highly.

38 BIS Papers No 71 – The finances of central banks
properties do not lend themselves to precise measurements. Some features of the assessment are:
Distribution schemes vary widely in the range and power of features that provide financial strength – or work against its erosion in the presence of income volatility (see the discussion on distribution asymmetries in Part C.3).
Targets are present in about half of the sample, but they are often implicit. Some targets are simply for non-negative general reserves: when general reserves become negative, more of the surplus can be retained than normal (the Bank of Mexico being one of several such examples). Some targets are for foundation capital. An example is a transitional measure that allows the Central Bank of Chile to retain all surpluses until equity recovers to the initial mandated level of capital (indexed to offset the effects of inflation). The Fed also has a small equity target that is indexed to assets of shareholders (member banks).
Components of distribution rules
Evaluated on a notional index of supportiveness of financial strength Figure 7
Source: BIS staff assessments.
…CH
ECB……………
CL………
US…………………………………………
UK
External resources to cover losses Type of target
Portion of surplus usable to reach target Retentions: Automatic, or CB decides
Joint decisions Discretion that works
Distribution smoothing Other

BIS Papers No 71 – The finances of central banks 39
Few have substantial targets for total equity or main components thereof. One that does is the Swiss National Bank. The first call on any surplus is to fund a reserve (the “currency reserves provision”) that follows a formula set by the SNB’s Council. The calculation of the yearly allocation to provisions is based on the average growth rate of nominal GDP. The resulting level of the target has been in the range of 15–30% of assets (prior to the most recent jumps in the size of assets).49
When the target condition is triggered, the amount of the surplus that is available to meet the target is usually very high – often all of the surplus being available for the purpose. But not always. In several cases, the funds available to achieving the target are limited to a certain proportion (eg 20%) of the available surplus.
An ability to draw on external resources is rare – only two central banks can do so in case of losses (one of them is the ECB).
Standard retention proportions are typically small (eg less than 10% of distributable surplus). Joint decisions by the central bank and the shareholder are just as common.
8. Adding up the parts
As indicated at the outset, assessing the financial position of a central bank and the implications for its financial strength requires several interacting components to be considered. We have discussed the relevance of the structure of central bank balance sheets and their attendant financial exposures; the role of accounting policies; the availability of formal financial buffers; the contribution of special-purpose risk transfer mechanisms; and finally, residual risk sharing through distribution schemes and recapitalisation arrangements. Notwithstanding that some further parts of the puzzle are still to be covered, we think it would be valuable to illustrate the nature of the interactions between the parts already discussed, by describing how those interactions work for five central banks that cover a wide range of possible arrangements:
First, the Swiss National Bank saw a very large increase in financial exposures in the period studied, taking exposures to a high level relative to existing buffers – which have themselves been falling from a high level. Combined with the use of fair value to P&L accounting, the scale of such exposures could in principle expose SNB to a distribution asymmetry problem. However the SNB’s distribution scheme provides considerable protection against a distribution asymmetry. The distribution scheme uses an equity target that is notably positive and growing, allows full retention of any surpluses when equity dips below target, and caps annual distributions thereafter. That equity was significantly positive – at more than 50% of assets (around 90% if banknotes on issue are counted as quasi-equity) – going into this turbulent period is testament to the effectiveness of this scheme. Baseline income is strong judging by the 2005–10 period, although assets have grown disproportionately in low-return areas, and there are now larger risks, most
49 With the dramatic recent increase in the size of the SNB’s balance sheet resulting from its FX
interventions to support the 1.20 euro floor, the target reserve has fallen sharply relative to assets, notwithstanding the indexation of the target (nominal GDP grew by about 7% between 2009 and 2012 while SNB assets more than doubled). Given this huge increase in assets, the SNB decided to increase the yearly allocation to provisions by doubling the amount calculated by the formula.
40 BIS Papers No 71 – The finances of central banks
predominantly FX risk but also credit risk. There is now also an exposure to the interest cost of liabilities rising relative to the income generated on corresponding assets should Switzerland’s inflation rate run higher than that of the countries in which assets are invested. But in structural terms, the distribution scheme would allow reasonably quick rebuilding of equity to again become an effective buffer; the variance in P&L allowed through by the accounting system has limited chance to undermine that process; and comprehensive net worth would likely remain a large positive number even if equity were to dip further or go negative.
The Fed has also seen a large increase in exposures, especially those relating to interest rate risk (FX risk continues to be almost absent). The Fed does not recognise changes in fair value of the main source of the exposure – holdings of Treasuries – themselves as income, but the risk to earnings remains since early and rapid normalisation of interest rates would mean either realisations, with attendant value losses, or (in effect) costlier servicing of the liabilities held against those assets. And by also not taking changes in fair value to equity, the opportunity to build revaluation buffers is not available. The Fed’s formal, visible buffers are relatively slim. By the end of 2010, the Fed’s holdings of assets subject to interest rate risk was about 40 times its conventional equity, implying that a change in asset values (or servicing costs thereon) of about 2.5% would be sufficient to deplete equity (assuming nothing else changed). The distribution mechanism provides some protection, in the sense that future surpluses can be fully captured until the (quite low) equity target is restored, and the Fed’s baseline (or normal-times) earnings are ample, implying that future surpluses should also be ample. The paucity of visible buffers compared with the scale of the increase in exposures seems to add up to a risk of negative equity over a short-run period, notwithstanding strong comprehensive net worth throughout (Table 1 on page 11 provides orders of magnitude). However, the Fed’s accounting policies allow for the capitalisation of future retentions of surpluses that are needed to rebuild equity. This accounting approach means that reported accounting equity would in fact remain positive even were income losses to exceed existing buffers. (We describe this approach in Part C.)
The ECB’s increase in exposures during 2005–10 was mostly in the form of FX and credit risk. The conventional equity position significantly covers the exposures, even though only a small portion of the capital increase decided at the end of 2010 was paid in by the end of that year. At the end of 2010, ECB holdings of claims on governments and private sector financial institutions amounted to 2.1 times its conventional equity.50 The major part of equity is revaluation account balances, which are available to absorb reductions in the values of specific assets for which a revaluation buffer has been accumulated on account of past revaluation gains – that is, they are not generic buffers. The capital increase decided in 2010 also permits an increase in the general reserve fund or the general risk provision, to the extent to which the capital increase is paid in. Compared with revaluation reserves, these equity components provide additional flexibility. However, capital (and by implication the sum of general reserves and non-specific provisions) has reached previously agreed limits.
Most of the ECB’s marketable assets are marked to market, whereas some – those relating to monetary policy operations, and including securities acquired
50 An important qualifier needs to be recorded. The ECB’s net claims on other central banks within the
Eurosystem – including those acquired as a result of the role that the ECB’s balance sheet plays in the TARGET2 settlement system – are left aside on the grounds that their risk profiles are highly situation-dependent.

BIS Papers No 71 – The finances of central banks 41
under the Securities Market Programme (SMP) and Covered Bonds Purchase Programme (CBPP) – were allocated to a Hold-To-Maturity (HTM) portfolio and are not revalued. For those revalued, the ECB’s asymmetric approach to revaluation buffers means that valuation losses can often be passed through the P&L, offsetting increases in dividends that may be associated with earnings on higher risk spreads (recognising that disproportionately risky securities typically provide higher risk income through expanded spreads, in compensation for possible valuation losses). But, as with the Fed, in the case of those securities that are not revalued there is the potential to continue to pay away risk income to shareholders without any offset even as their market values fall. In other words, the dividend can be boosted at the same time as the underlying value of assets is eroded. Whether this creates a vulnerability for the ECB depends in part on whether it continues to use to the full its ability to build general risk provisions to capture rather than pay away risk income. And it depends in part on its ability to continue to be paid in full on its holdings, notwithstanding restructurings or defaults of such instruments – the ECB was not impacted by the Greek government debt restructuring, and could thereby maintain expected cash flows through to maturity. As for the Fed, however, holding securities at unchanging values through to maturity does not eliminate their interest rate risk. Should the Fed need to withdraw liquidity at notably higher interest rates, an elevated financing cost will be incurred even as assets are held to maturity.
The ECB has a robust distribution scheme involving a substantial amount of authorised capital and reserves, and the ability to access fresh resources. Distributions are contingent on shortfalls of reserves relative to their authorised amount, with a slow-acting component in the sense that only 20% of surpluses can be appropriated to rebuild reserves at the ECB’s discretion. But there is also has a fast-acting component, in that there is no restriction on the rate at which general risk provisions can be built, and such provisions are substitutable for general reserves in terms of counting towards the authorised amount of reserves. The ability to access fresh resources to cover a loss, by appropriating the NCBs’ share of monetary income (with the agreement of the General Council), provides substantial financial strength. NCB monetary income averaged about €16 billion per year over the period under study, equal to about 90% of the ECB’s average net equity – a considerable backstop, although one that might be smaller when needed if hits to monetary income are the source of a loss. Moreover, comprehensive net worth is likely to be secure in most imaginable scenarios.51
The Bank of England is a special case of some interest. Its balance sheet growth was particularly large over this period – the largest of these five cases – but there was hardly any increase in exposures, and that increase was from a low starting point. The Bank has correspondingly small equity buffers – at the end of 2010, equity amounted to 1.7% of assets. The distribution system would be no help at all if equity were exposed (the whole of any surplus resulting from currency issuance activities – essentially, seigniorage – is automatically passed to the government, as is 50% of any surplus resulting from other central banking activities).52 The key to understanding the scale of balance sheet growth,
51 Table 1 on page 11 provides estimates of the comprehensive net worth of the Eurosystem, rather
than the ECB specifically. 52 As all seigniorage income is automatically passed to the government, the comprehensive net worth
numbers reported in Table 1 on page 11 do not represent estimates of financial strength for the Bank of England as a standalone entity. This is consistent with the special character of the Bank of England with respect to financial arrangements.

42 BIS Papers No 71 – The finances of central banks
notwithstanding limited financial strength, is the risk transfer arrangement. Its interplay with the location of decision authority for financially risky activities will be given more attention in Part C.
The Central Bank of Chile is also a special case of considerable interest. The CBC has been operating in recent years with negative equity and negative baseline earnings. Baseline earnings are projected to return to positive territory, so that accounting equity would also return to positive territory – albeit not for 25 years or so53 – helped by a distribution policy that (temporarily) allows the central bank to retain all surpluses. At the same time, the CBC carries large economic exposures and applies fair value accounting with revaluations being taken straight to P&L. In view of weak baseline earnings, this implies that an exposure to a distribution asymmetry would frequently be an issue were it not for the offsetting transitional measure that allows retention of all surpluses while capital is below target. Once equity has returned to target and assuming that the transitional measure is then terminated, a continuation of high volatility around a low trend path of baseline income could reintroduce a negative trend component into the equity path. This raises the importance of baseline income turning strongly positive.
In other contexts, uncertainty about the sign of comprehensive net worth would likely have raised doubts about the sustainability of the low inflation objective, doubts that would possibly in turn have impeded the effectiveness of policy (see next the discussion in Part C). That the CBC has been very effective in delivering and maintaining price stability through this period attests to the power of the credibility engendered by institutional arrangements in Chile, coupled with the strong fiscal position.
53 Restrepo et al (2009).