what explains the low profitability of chinese banks? · pdf filewhat explains the low...
TRANSCRIPT
WHAT EXPLAINS THE LOW PROFITABILITY OF CHINESE BANKS?
Alicia Garcia-Herrero, Sergio Gavilá and Daniel Santabárbara1
December, 2007
Abstract
This paper analyzes empirically what explains the low profitability of Chinese banks for the period 1997-2004. As one would expect, better capitalized and more efficient banks are found to be more profitable. Another key factor behind the low profitability is government intervention, as reflected by the negative impact of state ownership. Instead, more market oriented banks tend to be more profitable. These findings should not come as a surprise for a banking system which has long been functioning as a mechanism for transferring huge savings to meet public policy goals. The ongoing reform should ensure that government intervention is the banking system is reduced –by lowering the share of government ownership, improving the corporate culture and fully liberalizing the financial system. Keywords: China, bank profitability, bank reform JEL classification: G21, G28
1 At the time this article was written, Alicia Garcia-Herrero was affiliated with the Bank of International Settlements. She now works for BBVA. Sergio Gavilá and Daniel Santabárbara are affiliated with the Banco de España. The opinions expressed are those of the authors and not necessarily those of the Banco de España, the Bank of International Settlements or BBVA. We would like to thank Maitena Duce and Pablo Garcia-Luna for his excellent assistance with some of the data. We also thank comments received during our presentation at the ASSA meetings 2008 and, in particular, to John Bonin. We finally thank José Manuel Montero, Faribosz Moshirian, Daniel Navia, Jesús Saurina, Francisco Vázquez and three anonymous referees for their comments. All remaining errors are obviously ours.
1 Introduction
There is, by now, overwhelming evidence that a well-functioning financial system is important for economic growth. Indeed, financial intermediation determines, among other factors, the efficient allocation of savings as well as the return of savings and investment. China’s banking sector is the most important component of the financial system (with 66% of total financial assets in 2006) and yet it has long remained undercapitalized and saddled with non performing loans (NPLs). Furthermore, bank capitalization, solvency and profitability are still below international standards. In 1997, the government started a comprehensive banking reform with the objective of transforming banks into market-functioning and profitable institutions. The reform has so far focused on the restructuring of the largest banks, the 4 state-owned commercial banks (SOCBs) which had long served as lending arm of state-owned enterprises (SOEs). The restructuring has been conducted through capital injections and the carving out of NPLs.2 The rest of the banking system, with about 45% of total bank assets, has a much diversified structure. First, three state-owned development banks (so-called policy banks) are mainly in charge financing long-term projects, such as infrastructure. Second, thirteen partially private banks (so-called joint-stock commercial banks (JSCBs)) are generally the most market-oriented and are, to a larger or lesser extent, privately owned. Third, over one hundred city commercial banks (CCBs), created by restructuring and consolidating urban credit cooperatives, generally operate at provincial level although some have grown much larger. Fourth, more than fifty Trust and Investment Corporations (TICs) intermediate foreign funds to finance local government companies and infrastructure and construction projects. While still relevant, their role and number has been fading over time and they have diversified away. Foreign participation in the Chinese banking system has two different forms: greenfield investment and acquisition of a minority share. The former is very small in terms of market size and scattered in over 200 foreign affiliates. For the latter, 27 Chinese commercial banks have foreign shareholders but always without control. Three of the 27 are actually SOCBs after having launched their IPOs in Hong Kong Stock Exchange and, in one case, also in that of Shanghai.3 In parallel to the restructuring of the SOCBs, Chinese authorities are taking important steps to liberalize the banking system. This includes lifting the ceiling on lending rates and the floor on deposit rates, reducing the share of directed lending and slowly opening up the capital account. China’s bank reform is still ongoing so that it is hard to extract conclusions on how it may affect the functioning of the banking system. However, the success of the reform is so important for China’s economic development and, thereby, the rest of the world, that it is worth analyzing. Furthermore, such conclusions, even if very tentative, might serve as useful suggestions on the direction and speed of the ongoing reform.
2 Three of them have basically completed their restructuring while Agriculture Bank of China has yet to start. For more details on the reform, see Garcia-Herrero et al. (2006). 3 Chen, Li and Moshirian (2005) look into the effects of the first of these IPOs, that of Bank of China.
2
Among the different aspects of the banking system which could be analyzed, we focus on bank profitability. Healthy and sustainable profitability is vital in maintaining the stability of the banking system. Even if solvency is high, poor profitability weakens the capacity of a bank to absorb negative shocks, which will eventually affect solvency. In this vein, China’s transformation from a planned to a market economy implies that profitability will be increasingly relevant for Chinese banks. Profitability is a reflection of how banks are run given the environment in which banks operate. In fact, profitability should mirror the quality of a bank’s management and the shareholders’ behaviour, the bank’s competitive strategies, efficiency and risk management capabilities. High profitability is good but too high is dangerous. In fact, very high profitability could stem from strong market power and hamper the efficient intermediation of savings. In turn, very low profitability might discourage private agents from conducting banking activities. In as far as profitability considerations determines investors’ interest in financial institutions and, thus, the possibility to have enough capital to continue operating, too low profitability could imply that only poorly-capitalized banks intermediate savings, with the corresponding costs for sustainable economic growth. Between these two extremes, Chinese banks lie closer to the latter. In this paper we assess empirically which are the main factors behind the low profitability of Chinese banks. To that end, we use data for 87 banks, accounting for more than 80% of total assets, and for the longest relevant period: 1997 to 2004. Our results show that such low profitability is mainly explained by poor asset quality, low efficiency and scarce capitalization. We also find some evidence that the concentration of assets in a few large state-owned banks and the scarcity of private-ownership hamper profitability. The paper is divided into six sections. After this introduction, Section 3 reviews the existing literature on the determinants of bank profitability. Section 4 outlines the empirical methodology. Section 5 reports on the variables and data used and shows some stylized facts Section 6 concludes. 2 Literature review in the Chinese context
Given the importance of profitability for the good functioning of the banking system, the literature has devoted a lot of energy to understanding its main determinants. These can be classified in three groups of determinants: bank-specific (either intangible or tangible), macroeconomic and institutional ones. Intangible bank-specific factors are as important as hard to account for. A good example is the quality of managerial decisions (Berger and Mester, 1999). The quality of bank management is closely related to corporate governance (DeYoung and Rice, 2004). China finds itself in a peculiar situation in terms of corporate governance, inherited from its transition to a market economy. In fact, Chinese banks are subject – to a larger or lesser extent – to massive government intervention. In many cases they are not free to choose their asset structure – as credit is directly or indirectly controlled by the central and/or the local governments – or to set interest rates. The quality of corporate governance is specially the case of SOCBs, whose lending is still directed to loss-making SOEs and local government projects. SOCBs, however, are the banks which Chinese trust most because of their implicit government guarantee. Weak corporate governance, therefore, results is low asset quality and high liquidity, hampering profitability.
3
Among the different aspects of corporate governance, the property structure seems key for the Chinese case. In fact, the degree of government intervention is, to a large extent, a reflection of the property structure. Government-owned banks, such as SOCBs and policy banks, are subject to more government intervention than banks with a larger share of private ownership (such as JSCBs and several CCBs). In addition, government-owned banks may have objectives different than profitability, such as social or regional development. The existing evidence generally confirms that state-owned institutions are less efficient and have poorer asset quality (La Porta et al., 2002; and Barth et al., 2004). For the specific case of China, Yao and Jiang (2007) show that state-owned banks were 8-18% less efficient than non state-owned banks but no analysis has yet been conducted on profitability. Foreign investors also tend to be less dependent on the government. In this vein, foreign banks are generally found to be more profitable than domestic banks in emerging countries (Demirguc-Kunt and Huizinga, 1999; and International Monetary Fund, 2000). For the specific case of China, foreign ownership and minor size have been associated with higher efficiency (Berger et al., 2006). As for profitability, the only analysis which we are aware of is that of Fu and Heffernan (2005), who focus on the impact of market power. The are also bank-specific but tangible factors affecting profitability. A first one is bank capitalization. There are several reasons to believe that higher capitalization should foster profitability: First, capital can be considered a cushion to raise the share of risky assets, such as loans. When market conditions allow a bank to make additional loans with a beneficial return/risk profile, this should imply higher profitability. Second, banks with a high franchise value – measured in terms of capitalization – have incentives to remain well capitalized and engage in prudent lending. Third, although capital is considered to be the most expensive bank liability in terms of expected return, holding a relatively large share of capital is an important signal of creditworthiness. In fact, when depositors exert market discipline, banks with more capital should be able to lower their funding costs.4 Finally, a well capitalized bank needs to borrow less in order to support a given level of assets. This can be important in emerging countries when the ability to borrow is more subject to “sudden stops”. Berger (1995) and Goddard et al. (2004) provide empirical evidence of the positive relation between bank capitalization and profitability for the US and the European banking systems, respectively. Demirguc-Kunt and Huizinga (1999) generalize this evidence for 80 industrial and emerging countries. A second factor is asset quality. Poor asset quality should reduce profitability in as far as it limits the bank’s pool of loanable resources. Such a priori is generally confirmed in developed countries5 but not always in emerging countries. Brock and Suarez (2000), for example, show a negative relationship between bank spreads and NPLs over total loans for most Latin American banking systems. They argue that this is due to distortions caused by inadequate regulation that allow banks to report misstated loan losses. How to account appropriately for asset quality is an issue for emerging countries’ banking systems and even more so for China. A third tangible bank-specific factor is bank efficiency. A more efficient bank should be able to make a more effective use of its loanable resources and, fostering profitability. For example, Demirguc-Kunt and Huizinga (1999) estimate that 17% of banks’ overhead costs are passed on to depositors and lenders while the rest reduces profitability. Bank overhead costs, though, are a very rough measure of efficiency. More
4 Beyond the evidence for industrial countries, Martinez-Peria and Schmukler (1998) show that depositor market discipline exists for some emerging countries (namely Argentina, Chile and Mexico). 5 See Angbazo (1997) as an example.
4
recently, a more sophisticated measure, namely X-efficiency, has come to the forefront. It measures how a particular set of prices and quantities of inputs and outputs vary, in accordance with the banks’ chosen strategy, and how it impacts bank profitability. Berger (1995) finds that X-efficiency is consistently associated with higher profits for a large sample of banks. For the case of China, Berger et al. (2006) show that Chinese state-owned banks, in particular SOCBs, are the least efficient, and conclude that modernizing them would significantly improve China’s banking performance. The balance sheet structure of a bank is also bound to affect profitability. On the asset side, a larger share of loans to total assets should imply more interest revenue because of the higher risk. However, loans also have higher operational costs because they need to be originated, serviced and monitored. All in all, profitability should increase with a larger share of loans to assets as long as interest rates on loans are liberalized and the bank applies mark-up pricing. In this vein, Demirguc-Kunt and Huizinga (1999) report that banks with a relatively high share of non-interest earning assets are less profitable. In addition, government intervention can also affect the balance sheet structure. A very common example – also true for China – is administrative controls on the prices or the quantities of loans and deposits. Fry (1994) shows that administered lending and deposit rates result in the misallocation of credit. On the liability side, a larger proportion of deposits should, in principle, increase profitability as they constitute a more stable and cheaper funding compared to borrowed funds. However, they also require widespread branching and other expenses. Such related costs seem to weigh more than the benefits in emerging countries (Demirguc-Kunt and Huizinga, 1999). In the Chinese case, deposits are clearly a very cheap source of funding as interest rates on deposits are capped. In addition, how easy it is for a bank to access deposits will very much depend on whether it has an implicit deposit guarantee, which again will hinge on its ownership structure. Bank size is generally considered a relevant determinant of profitability but there no consensus on the direction of influence. On the one hand, a bank of a large size should reduce costs because of economies of scale. In fact, more diversification opportunities should allow to maintain (or even increase) returns while lowering risk. On the other hand, large size can also imply that the bank is much harder to manage or it could be the consequence of a bank’s aggressive growth strategy. The empirical evidence is also mixed. Goddard et al. (2004) and Garcia-Herrero and Vazquez (2007) show that very large banks in the industrial countries tend to be more profitable. Sitroh and Rumble (2006)’s findings point to the downside of size. In the Chinese case, a larger size is actually associated with government intervention in as far as the largest banks are the four SOCBs with a large share of government. Market power may also influence profitability, according to two well-known theoretical models. The first one is the structure-conduct-performance hypothesis, which asserts that a positive relationship between the interest rate margin and concentration (a proxy for market power) reflects non-competitive pricing behaviour. The second one is the efficient-structure hypothesis, for which a bank’s higher interest margin is attributable to more operational efficiency, better management or better production technologies. Since these banks will also gain a larger market share (another proxy for market power), the structure will become more concentrated due to efficiency gains (Berger, 1995). The policy implications of the two hypotheses go in opposite directions. Under the structure conduct theory, high profits stem from market power so that antitrust regulation is welcome to allocate resources more efficiently. By contrast, under the efficient-structure hypothesis, breaking up efficient banks, or forbidding them to grow, may raise social costs by leading to less favourable prices for consumers. The empirical evidence on concentration or market share and profitability is mixed. For the Chinese case, Fu and Heffernan (2005) test the structure-
5
conduct-performance and the efficient structure hypotheses and find that the former fits the Chinese case but only before economic and financial liberalization started, that is, before 1992. In other words, at least prior to the reform, very large banks did not seem to do any good to the performance of the Chinese banking system. As we shall show later, we reach a similar conclusion even in the latest years. Finally, the macroeconomic environment may also influence bank profitability through many different channels. Credit risk, for example, is influenced by economic growth, inflation and the level of real interest rates as they affect the borrower’s repayment ability and the value of collateral. Demirguc-Kunt and Huizinga (1999) show empirical evidence that rapid economic growth and high real interest rates increase profitability for a large number of countries. Inflation is generally associated with higher profitability as it implies additional earnings from float, which tend to compensate for the higher labour costs (Hanson and Rocha, 1986; Bourke, 1989; and Boyd et al. 2001). Higher real interest rates have also been found to foster profitability, especially in developing countries (Demirguc-Kunt and Huizinga, 1999). This may reflect the fact that demand deposits frequently pay zero or below market rates, even more so in developing countries. In the same vein, interest rate volatility generally implies higher interest margins as banks generally manage to transfer the higher risk to their clients (Ho and Saunders 1981, Maudos and Fernández de Guevara 2004). 3 Stylized facts
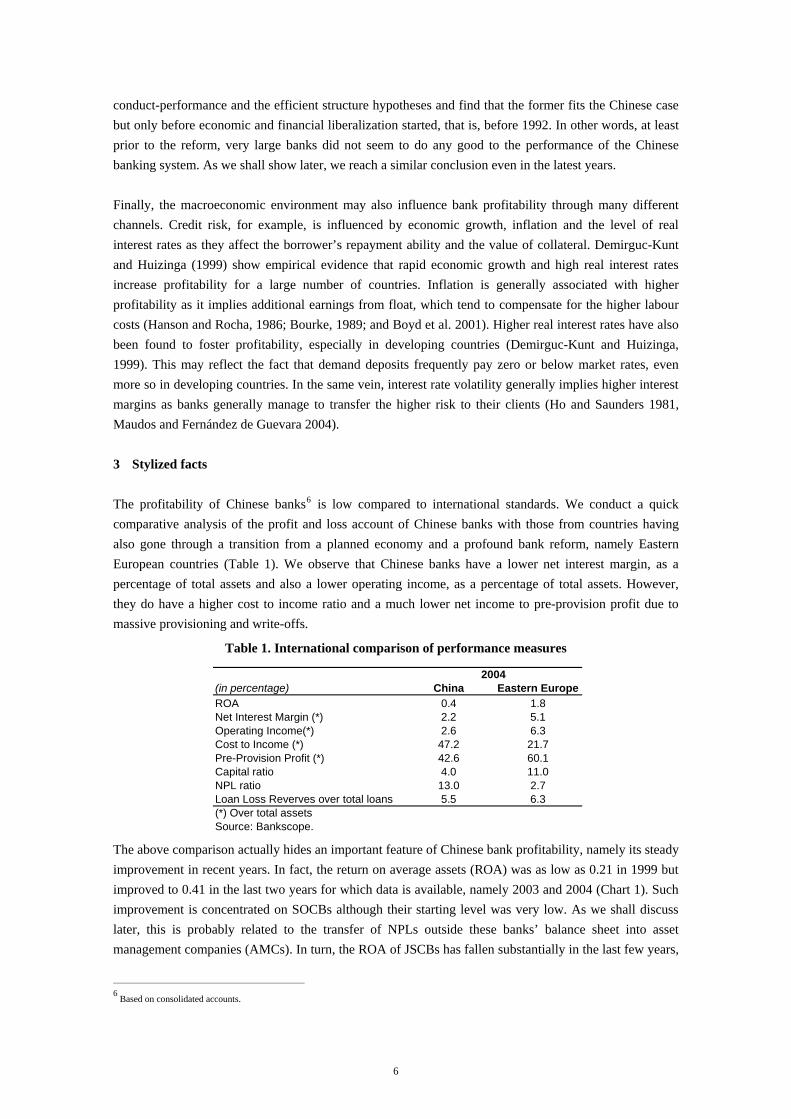
The profitability of Chinese banks6 is low compared to international standards. We conduct a quick comparative analysis of the profit and loss account of Chinese banks with those from countries having also gone through a transition from a planned economy and a profound bank reform, namely Eastern European countries (Table 1). We observe that Chinese banks have a lower net interest margin, as a percentage of total assets and also a lower operating income, as a percentage of total assets. However, they do have a higher cost to income ratio and a much lower net income to pre-provision profit due to massive provisioning and write-offs.
Table 1. International comparison of performance measures
(in percentage) China Eastern EuropeROA 0.4 1.8Net Interest Margin (*) 2.2 5.1Operating Income(*) 2.6 6.3Cost to Income (*) 47.2 21.7Pre-Provision Profit (*) 42.6 60.1Capital ratio 4.0 11.0NPL ratio 13.0 2.7Loan Loss Reverves over total loans 5.5 6.3(*) Over total assetsSource: Bankscope.
2004
The above comparison actually hides an important feature of Chinese bank profitability, namely its steady improvement in recent years. In fact, the return on average assets (ROA) was as low as 0.21 in 1999 but improved to 0.41 in the last two years for which data is available, namely 2003 and 2004 (Chart 1). Such improvement is concentrated on SOCBs although their starting level was very low. As we shall discuss later, this is probably related to the transfer of NPLs outside these banks’ balance sheet into asset management companies (AMCs). In turn, the ROA of JSCBs has fallen substantially in the last few years,
6 Based on consolidated accounts.
6
albeit from a higher starting level than SOCBs. When taking an alternative measure of profitability that excludes provisioning of NPLs, namely pre-provision profit over assets, we find a similar trend for SOCBs but a better one for JSCBs. This points to a massive provisioning policy for JSCBs. Chinese banks generally suffer from poor asset quality. The ratio of NPLs to total loans for the banking sector was around 13% in 2004, well above international standards (2.7% for Eastern Europe banks in the same year as shown in Table 1 above). Nonetheless, the different waves of restructuring carried out by the Chinese government since 1998 have reduced the NPL ratio to less than 10% at the end of 2005 from 30% in 1997. In any event, asset quality is still a problem, not only because the level of NPLs is still high, but also because of the ratio of provisioning to NPLs is well below international standards. In 2004, the ratio of loan loss reserves to gross loans was less than 5.5%, as compared to 6.2% in the Eastern Europe. The capitalization of Chinese banks, measured by the capital to assets ratio, is also lower than that of Eastern European banks. More specifically, the equity to assets ratio was 4% in 2004, as compared to 11%7 for Eastern European banks. Even more worrisome is that this ratio has fallen since 1998. The largest fall was concentrated in other commercial banks although the starting level was also much higher. JSCBs are now the least capitalized group, mainly because of their aggressive expansion without additional capital injections. The capital to assets ratio of SOCBs also fell somewhat since 1998 and not withstanding the several waves of recapitalizations. In sum, these stylized facts show that the low profitability which characterises the Chinese banking system comes hand in hand with poor asset quality and low capitalization. To reach firmer conclusions as to the importance of these factors, we move to the empirical section where other potential determinants of profitability will be controlled for.
7 Ibid.
7
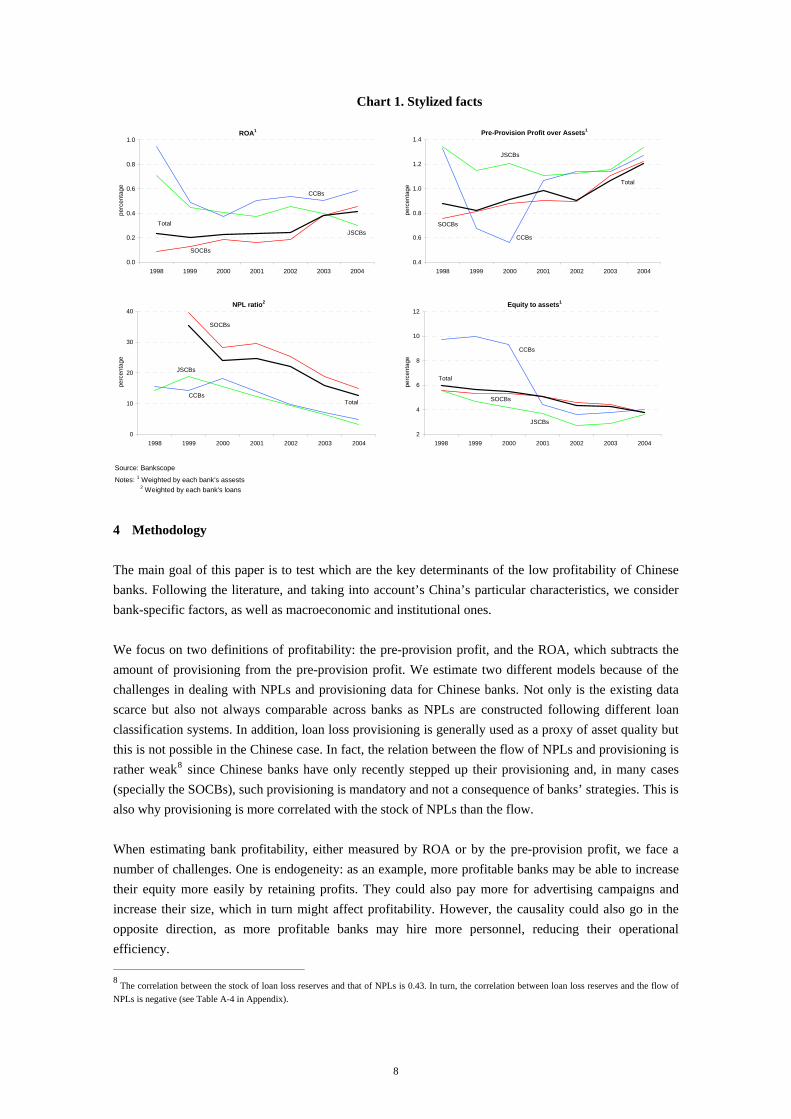
Chart 1. Stylized facts
Source: Bankscope
Notes: 1 Weighted by each bank's assests 2 Weighted by each bank's loans
ROA1
0.0
0.2
0.4
0.6
0.8
1.0
1998 1999 2000 2001 2002 2003 2004
perc
enta
ge
CCBs
JSCBs
SOCBs
Total
Pre-Provision Profit over Assets1
0.4
0.6
0.8
1.0
1.2
1.4
1998 1999 2000 2001 2002 2003 2004
perc
enta
ge
CCBs
JSCBs
SOCBs
Total
Equity to assets1
2
4
6
8
10
12
1998 1999 2000 2001 2002 2003 2004
perc
enta
ge
CCBs
JSCBs
SOCBs
Total
NPL ratio2
0
10
20
30
40
1998 1999 2000 2001 2002 2003 2004
perc
enta
ge
CCBs
JSCBs
SOCBs
Total
4 Methodology
The main goal of this paper is to test which are the key determinants of the low profitability of Chinese banks. Following the literature, and taking into account’s China’s particular characteristics, we consider bank-specific factors, as well as macroeconomic and institutional ones. We focus on two definitions of profitability: the pre-provision profit, and the ROA, which subtracts the amount of provisioning from the pre-provision profit. We estimate two different models because of the challenges in dealing with NPLs and provisioning data for Chinese banks. Not only is the existing data scarce but also not always comparable across banks as NPLs are constructed following different loan classification systems. In addition, loan loss provisioning is generally used as a proxy of asset quality but this is not possible in the Chinese case. In fact, the relation between the flow of NPLs and provisioning is rather weak8 since Chinese banks have only recently stepped up their provisioning and, in many cases (specially the SOCBs), such provisioning is mandatory and not a consequence of banks’ strategies. This is also why provisioning is more correlated with the stock of NPLs than the flow. When estimating bank profitability, either measured by ROA or by the pre-provision profit, we face a number of challenges. One is endogeneity: as an example, more profitable banks may be able to increase their equity more easily by retaining profits. They could also pay more for advertising campaigns and increase their size, which in turn might affect profitability. However, the causality could also go in the opposite direction, as more profitable banks may hire more personnel, reducing their operational efficiency.
8 The correlation between the stock of loan loss reserves and that of NPLs is 0.43. In turn, the correlation between loan loss reserves and the flow of NPLs is negative (see Table A-4 in Appendix).
8
Another important problem is unobservable heterogeneity across banks, which could be very large in the Chinese case given differences in corporate governance, which we cannot measure well. Finally, the degree of profitability could be very persistent for Chinese banks because of political interference. This is particularly the case for state-owned banks, which are imposed targets on asset quality and profitability. We tackle these three problems together by moving beyond the methodology currently in use in this empirical literature of bank profitability (mainly fixed or random effects)9. We employ the Generalized Method of Moments (GMM) following Arellano and Bover (1995). This methodology accounts for endogeneity, the GMM estimator uses lagged values of the dependent variable in levels and in differences, as well as lagged values of other regressors which could potentially suffer from endogeneity. We instrument for all regressors except for those which are clearly exogenous.10 The list of variables treated as endogenous instrumented is shown in italics in the result tables below. The GMM estimator also controls for unobserved heterogeneity and for the persistence of the dependent variable. All in all, this estimator yields unbiased estimations of the parameters. The estimated coefficients are also the most efficient since all possible instruments are considered. The last challenge is the risk of omitted variables. To that end, we follow a general to specific strategy by estimating an equation with all possible regressors according to the exiting literature and China’s specific characteristics. We, then, test – through a Wald test – the joint hypothesis that the coefficients of the variables that are not significant individually are equal to zero. If not rejected, we re-estimate the model only with the controls which were significant in the general regression. Otherwise, we test a less restrictive hypothesis but still trying to reduce the number of non-significant regressors to the maximum extent possible. We stop reducing the number of regressors when we can reject that the remaining set of coefficients of the control variables is equal to zero. The coefficients obtained in this way are even more efficient as the number of regressors is reduced to the minimum. All in all, and notwithstanding data limitations, the methodology followed – system GMM estimator – controls for potential endogeneity, unobserved heterogeneity and the persistence of the dependent variable, measuring profitability. This methodology should yield consistent estimators. In addition, all possible instruments are used and jointly not significant regressors are eliminated so as to obtain the most efficient estimators possible. We conduct a number of robustness tests. The most important is related to the nature of our sample: large N and small T, which does not allow the accurate estimation of N-invariant regressors (mainly macroeconomic ones). We, thus, introduce a second model where macroeconomic regressors are substituted by time dummies. In order to allow the comparison with other studies on bank profitability, we conduct robustness tests with more rudimentary methodologies for panel data, such as fixed effects and OLS. Results are relatively similar and are available upon request.11
9 The most recent studies use fixed or random effects (for example Maudos and Fernández de Guevara (2004) and Claeys and Vennet (2005). Previous ones, such as Angbazo (1997) and Demirguc-Kunt and Huizinga (1999) employ generalized least squares and weighted least squares, respectively. 10 In particular, we assume that strictly exogenous variables have no correlation to the individual effects, while the endogenous variables are predetermined. In addition, we exploit the assumption that the endogenous variable has a constant correlation with the individual effect to be able to use their differences as a valid instrument. 11 Such simple models also help account for the fact that a large sample is needed for the properties of the GMM estimator to hold asymptotically.
9
5 Variables and data issues
Our panel is composed of annual data for 87 Chinese banks over the period 1997-2004. This accounts for the main universe of Chinese banks holding more than 80% of total assets. Since not all banks have information for every year and banks have merged or closed, we opt for an unbalanced panel not to lose degrees of freedom. All in all, our sample contains 402 observations corresponding to a number of banks that varies from a minimum of 38 in 1998 to a maximum of 68 in 2003.12 It should be noted that the sample used is less than the total number of observations in the database because the information has been filtered using two criteria: (i) outliers13; and (ii) those observations without data for any of the variables necessary for estimating profitability and asset quality have been dropped. Table A-2 in the Appendix shows some descriptive statistics and Table A-3 the balance sheet and income statement of our sample. Bank-specific information was mainly obtained from the Bankscope database maintained by Fitch/IBCA/Bureau Van Dijk, which includes income statements and balance sheet information according to Chinese accounting standards. For the sake of accuracy, we contrasted the data with the original source, the Almanac of China’s Finance and Banking for those banks for which data were available (namely 13 out of the 87 in our sample).14 We use unconsolidated statements whenever possible, although in some cases we have to rely on consolidated ones because of data availability.15 Unconsolidated data is preferred to avoid relevant differences in profit and loss statements and balance sheets of headquarters and subsidiaries compensating each other. All the banks ratios are calculated based on the standardised global accounting format used by Bankscope. Bank profitability is proxied in many different ways in the empirical literature. One is the spreads between the contractual rate charged on loans and that paid on deposits. Albeit often used (given its availability for a large sample of countries), it is a very imperfect measure of profitability. In fact, it is simply an ex-ante measure which does not take into account how the bank is run. A second measure is the interest margin (i.e., the difference between banks’ interest revenues and their interest expenses). This can be regarded as an ex-post interest rate spread. If net, it also controls for the amount of assets each bank has, which gives an idea of how efficiently funds are intermediated. For the net interest margin to be a good measure of profitability, interest rate revenues and expenses should be closely related to banks’ behaviour, and not to government decisions. This makes it inappropriate for the Chinese case.16 Finally, the (pre-tax) ROA and the return on average equity (ROE) are more comprehensive measures of bank profitability as they include operational efficiency and loan loss
12 Mergers and closures explain that the total number of banks is 87 while the maximum number, within one single year, is 68. 13 We consider outlier values whose with accumulative frequency is under 1% or above 99% and its deviation from the mean is more than three times their standard deviation. 14 The Almanac of China’s Finance and Banking provides the profit and loss statements and balance sheets of SOCBs and six JSCBs (apart from the policy banks which are excluded from our study). Besides these banks, Bankscope provides the income statements and balance sheets of 4 JSCBs more and a good number of city commercial banks and credit cooperatives. For two JSCBs (Hua Xia Bank and China Minsheng Banking Corporation), there are differences between the break down of net income in interest income and non interest income but not in the total net income and the remainder items of the income statement and balance sheet. Furthermore, 2003 data for the China Construction Bank and the Bank of China include revisions in Bankscope but not in the Almanac of China’s Finance and Banking so we have preferred to maintain the most updated inversion (i.e., that of Bankscope) 15 For two SOCBs, Industrial & Commercial Bank of China and Bank of China, we have selected consolidated data because the number of NPLs data is higher than in unconsolidated data. 16 Fu and Heffernan (2005) also make this point.
10
provisioning. We consider the ROA more appropriate than the ROE for the Chinese case, as bank equity is abnormally low and it has suffered important artificial changes due to the recapitalization programs of the government. In any event, we estimate the same model for the ROE and the results are basically maintained.17 In addition to the ROA, we also explore the determinants of the pre-provision profit due to ad-hoc provisioning policy that most Chinese banks have followed during the last few years. As for the regressors, we include the bank-specific and macroeconomic factors previously reviewed in the literature section, as well as others related to China’s reform process. Among the bank-specific factors, corporate governance is as relevant as hard to measure, especially in the Chinese case. The lack of information on political intervention and government influence obliges us to use indirect measures.18 The first one is the type of bank, captured by a dummy. Given the structure of the Chinese banking system, the type of bank (SOCBs, policy banks, TICs, CCBs and JSCBs) should give some idea of the degree of government influence (certainly larger in the first two groups). Other measures related to corporate governance could be obtained from the bank’s balance sheet in as far as government intervention is reflected in the type of activity that a bank conducts. For example, state-owned banks (policy banks but also SOCBs) are known to be the major lenders of SOEs. Since there is not such a detailed breakdown of individual banks’ balance sheets, we have to use rougher measures, related to aggregate lending or deposits. On the asset side, we include the rate of growth in lending [loan growth]. and the share of loans as a percentage of total assets [loans over assets] in as far as the government can control the amount of lending through quotas and other means. On the liability side, we take the share of deposits to assets [deposits over assets] as a proxy of government intervention in as far as government-controlled banks are perceived as safer by depositors. As a robustness test, we also include each bank’s Financial Strength rating from Moody’s as a generally proxy of a bank’s quality and, thereby, of its management.19 Second, the stylized facts point to the importance of asset quality which, again, is hard to account for accurately, especially in the Chinese case. We consider three alternative measures: the flow of NPLs, the stock of NPLs and the ratio of NPLs to total loans20. The first should be the preferred proxy in the steady-state; i.e., when the stock of NPLs had been reduced to standard levels, which is not yet the case of China. In the Chinese case, though, the flow of NPLs has experienced large swings, mainly due to the transfer of NPLs to the AMCs21. The stock of NPLs, thus, seems more relevant for our case, together with the ratio of NPLs to total loans, which is the target set out by the Chinese supervisory authorities as part of the ongoing reform. We shall, thus, focus on those two.22 For NPLs, we use problem loans, defined as substandard, doubtful and loss loans under the 5-tier classification system and overdue, bad and dead under the old 4-tier procedure.23 This is because the
17 Results are available upon request. 18 Proxies, such as the share on loans to SOEs or to local governments are also not publicly available. 19 Results are available upon request. 20 In particular, the avoid that NPL ratio be fenced between 0 and 1, using this alternative measure log(NPL ratio/(1-NPL ratio)). 21 A robustness test, analyzing the potential determinants of the flow of NPLs, confirms this a-priori since the only significant determinant is the recapitalization of banks and the transfer of NPLs to AMCs, i.e., the restructuring measures taken under the ongoing reform. 22 The estimated determinants of the flow of NPLs are available upon request. 23 According to the five-tier classification system a substandard loan is when borrowers' abilities to service their loans are in question (borrowers cannot depend on their normal business revenues to pay back the principal and interest so losses may ensue, even when guarantees are invoked). Doubtful indicates that borrowers cannot pay back the principal and interest in full and significant losses will be incurred, even when guarantees are invoked. Loss means that the principal and interest of loans cannot be recovered or only a small portion can be recovered after taking all possible
11
Chinese accounting rules used for calculating NPLs differ among banks. SOCBs’ NPLs have started following international accounting rules (5-tier loan classification system) while other banks are still under the old 4-tier loan classification scheme. As a robustness test, we run the regressions only with the observations for which there is a homogeneous definition of NPLs and the results are maintained.24 This is the only definition available in the Bankscope database for a large enough number of banks. In addition, so as to reduce the number of missing observations, we add NPL data from Moody’s.25 We account for bank capitalization in a very rough way, namely as equity over total assets [equity over assets] due to the lack of risk-weighted measures for a large number of banks. Bank efficiency is measured in terms of X-inefficiency [rank of technical inefficiency]. This basically means that the level of cost efficiency of a bank is determined by comparing its actual costs to the best-practise minimum costs to produce the same output under the same conditions. There are clear advantages in using X-inefficiency, as opposed to more simple measures of bank efficiency. A very popular one is the cost to income ratio, which is quite distorted in the Chinese as lending and deposit rates are not yet fully liberalized. Another popular indicator, the ratio of operating expenses over total assets, is actually a component of the ROA, so that including it as a regressor would create identification problems. Among the different methodologies to estimate the cost function to measure X-efficiency, we opt for a parametric approach based on a translog functional form as in Berger at al. (2006). 26,27 Market power is proxied in two ways: first as market share with the usual definition (each bank’s total assets over those of the whole banking system [market share on assets]) and second, as concentration. For the latter, we opt for the Herfindahl-Hirschman index as it takes into account all banks and not only the largest ones. Furthermore, it also considers the inequality of market shares. This index is defined as the sum of the squared market shares of each bank’s assets for a given year; it is slightly greater than 0 for a perfectly competitive market and equals 1 in the case of a monopoly.
measures and resorting to necessary legal procedures. The old four tier classified NPLs into overdue (loans not repaid on maturity), bad (loans not repaid one year after maturity) and dead (loans unrecoverable). The major problem was that hides many problems of loan quality. For example, the assessment of loan quality according to the time of maturity allows borrowers to seek new loans to service old debts, thus turning NPLs into performing loans without actually lowering their risks. 24 Results are available upon request. 25 In particular, NPLs data for Agricultural Bank of China in 2001 and 2002. 26 Nonetheless, to avoid a potential bias derived to the inclusion of the X-efficiency measure as a regressor, we treat it as endogenous variable. In addition, for robustness, we run the regressions including alternative measures of efficiency: cost to income, operating expenses over assets and X-efficiency levels. The main findings hold. 27 In particular, we estimate the following cost function:
2 1 0 1 1 1 2 2 1 3 3 1 4 4 1
11 1 1 1 1 22 2 1 2 1 33 3 1 3 1
44 4 1 4 1 12 1
ln(C/w z ) = + ln(y /z ) + ln(y /z ) + ln(y /z ) + ln(y /z )+ ½ ln(y /z ) ln(y /z ) + ½ ln(y /z ) ln(y /z ) + ½ ln(y /z ) ln(y /z )+ ½ ln(y /z ) ln(y /z ) + ½ ln(y /
δ δ δ δ δδ δ δδ δ 1 2 1 13 1 1 3 1
14 1 1 4 1 23 2 1 3 1 24 2 1 4 1 34 3 1 4 1
1 1 2 11 1 2 1 2 1
z ) ln(y /z ) + ½ ln(y /z )ln(y /z )+ ½ ln(y /z ) ln(y /z ) + ½ ln(y /z ) ln(y /z ) + ½ ln(y /z ) ln(y /z )+ ½ ln(y /z ) ln(y /z )+ ln(w /w ) + ½ ln(w /w ) ln(w /w ) + ln
δδ δ δ δ
β β θ 1 1 1 2
2 2 1 1 2 3 3 1 1 2 4 4 1 1 2
it it
(y /z ) ln(w /w )+ ln(y /z ) ln(w /w ) + ln(y /z ) ln(w /w ) + ln(y /z ) ln(w /w )+ year dummies+ ln u + ln v θ θ θ
where C captures the bank’s total costs. The output (y) variables are total loans, total deposits, liquid assets and other earning assets. The two input prices(w) variables are interest expenses to total deposits and non-interest expenses to fixed assets. The fixed input (z) is total earning assets. The u term is a factor that represents a bank’s efficiency level and v is a random error. On the basis of the above formula, we calculate a rank ordering of each bank in each year. Such rank ordering is, then, converted into an ascending scale, over [0,1], the more cost efficient a bank is in year t.
12
The property structure is accounted for in three ways. We first introduce a different dummy for different Chinese banks, namely SOCBs, JSCBs, CCBs, TICs and Policy Banks. Second, the increasing role of privatization, and in particular diffused ownership, is assessed by including a dummy variable which takes the value of 1 when a bank is listed in the stock exchange [listed]. We also measure foreign ownership in a way which takes account the special characteristics of the Chinese banking system. In fact, while a bank is generally considered to be foreign-owned if at least 50% of the capital is in foreigners’ hands, such dummy would never have the value of one in the Chinese case, which does not mean that foreign ownership cannot have an impact on profitability. We, thus, opt for a dummy which takes the value of 1 if there is a foreign participation in the bank’s capital [foreign capital], independently of how large it is. The idea behind this is that foreign banks could still exert some influence in the way banks are run in as far as the control shareholders and managers are interested in learning from their foreign partners and/or give them a stake in the decision making process. The macroeconomic variables are drawn from official sources through the CEIC database. We include the real interest rate on loans, real GDP growth and inflation. Finally, there are a number of aspects specific to the Chinese case, which needs to be taken into account. One is the progress made in financial liberalization during the last few years. A particularly relevant aspect is the degree of interest rate liberalization. We, thus, include a variable that measures the maximum spread between loans and deposit rates according to existing regulations [maximum spread]. Other potentially important factors associated with the ongoing reform are the share of NPLs which have been transferred from three of the SOCBs to AMCs for their disposal [NPLs dispose of]. Finally, we include a dummy variable [recapitalized], which takes the value of one when a bank receives public funds either as capital or to reduce NPLs. 6 Results
We investigate empirically which are the determinants of bank profitability in China with annual panel data for a maximum of 87 banks during the period 1997 to 2004. We explore two complementary measures of bank profitability: pre-provision profits (Table 2) and ROA (Table 3). The advantages of measuring profitability in terms of the pre-provision profit for the Chinese case are twofold: First, it limits the problem of the non homogeneous data for provisioning across Chinese banks as well as the ad-hoc, government-directed provisioning that several large banks have recently conducted. Second, asset quality is partially accounted for or, at least, to the extent that provisioning is related to asset quality. Admittedly, the case of China is less than elsewhere as provisioning is not highly correlated with asset quality and, in particular, with NPLs (see Table A-8). Exploring the determinants of ROA is also interesting for two reasons: First, it is a more comprehensive measure of profitability and, second, it is widely used in the literature, which allows comparison with previous studies on China or other countries. Given the relevance of poor asset quality in understanding the situation of Chinese banks and the scarcity of NPL data – the most often used proxy for asset quality – we carry out a preliminary exercise: we estimate the determinants of NPLs for those banks and years were data is available and include the significant ones as additional regressors in the equation explaining bank profitability.
13
We, thus, look for the determinants of NPLs borrowing from the existing literature and China’s special characteristics.28 We run two different models: one for the ratio of NPLs to total loans and another for the stock of NPLs. For each model, we have two specifications: one including macroeconomic controls and another with time dummies instead, given our sample short time span (left and right columns, respectively). In addition two regressions are shown for each specification: one for the full set of regressors (columns 1 and 3) and another with the restricted set based on a Wald test of individual and joint insignificance (columns 2 and 4). The results for the stock and the ratio of NPLs are quite similar (See Table A-5 and Table A-6). First, low X-efficiency has a positive and significant influence on both measures of asset quality. Second, while a larger market share is associated to a higher NPL ratio, a higher concentration in the banking system increases the stock of NPLs. Third, listed banks (i.e., part of the ownership is private) tend to have a lower stock and NPL ratio. Instead, no such evidence can be found for foreign ownership, at least not in the way it is measured (through a dummy variable). An obvious result, given the massive transfer of NPLs to AMCs, is the significant and negative impact of such transfer on the ratio and the stock of NPLs. Finally, the volatility of interest rates contributes to raising the ratio and the stock of NPLs, while higher growth is found significant in reducing the ratio of NPLs but not necessarily the stock. This seems to indicate that economic growth fosters new lending and therefore washes out the asset quality problems, when measured in terms of an NPL ratio, as the Chinese authorities’ target. As before, the results are basically maintained when introducing time dummies instead of macroeconomic variables. We now move to estimating the pre-provision profit and the ROA but introducing, as additional regressors, the determinants of NPLs, which we were significant in the previous regressions.29 The results are shown in Table 2 below and follow the same structure as before (one specification with macroeconomic controls and one with time dummies instead and, for each, one with the full set of regressors and another with the restricted set). Starting with the pre-provision profit, as expected, a higher equity to assets ratio is found significant in increasing the pre-provision profit in all model specifications. Another expected result is that X-inefficiency lowers the pre-provision profit in a statistically significant way. An interesting result is found for bank concentration: the more concentrated the banking system, the lower the pre-provision profit. In the Chinese case, the degree of concentration is very much related to the weight of the four SOCBs in the banking system so that a reduction of their share in total bank assets seems to bode well for profitability. In addition, this result is true beyond the massive provisioning policies that these banks have been conducting. This is not the first paper which finds such a negative impact of Chinese largest banks (i.e., the SOCBs) on overall bank performance. Others are Berger et al. (2006) and Yao and Jiang (2007) although with a focus on bank efficiency. Another result pointing to the importance of government intervention in determining bank profitability is the negative and significant dummy for Policy Banks, which are fully state-owned. A mirror finding is the positive and significant coefficient for the dummies representing JSCBs and, to some extent, the TICs
28 Salas and Saurina (2002) 29
The regressions which follow do not include the transfers of NPLs to the AMCs. However, the results are the same when this variable is included and are available upon request.
14
although this is now a highly heterogeneous group.30 Finally, the fact that a bank is listed or whether it has foreign ownership does not seem to matter for the pre-provision profit.31 There may other reasons for these results, other than the irrelevance of private/foreign ownership: one is that the dummies distinguishing across types of bank, as well as other balance sheet characteristics may have already captured that information. The other is that the way in which private and foreign ownership is measured –through a dummy independently on the degree of private/foreign ownership – may not be accurate enough. In this line, Garcia-Herrero and Santabárbara (2008) use a more accurate measure of foreign ownership (the actual percentage over total capital) and find that foreign ownership does foster profitability. Two more results are worth noting. First, a larger share of deposits to assets appears to boost the pre-provision profit. This is consistent with the idea that deposits are the cheapest liability for Chinese banks, given the tight control on deposit rates which tend to be negative in real terms throughout our sample. Given that government-controlled banks are also those with a higher deposit to asset ratio, due to their implicit government guarantee, this helps improve their very low profitability. Another finding is the persistence of the pre-provision profits, marked by the very significant and also large coefficient of the lagged dependent variable. The existing literature considers the persistence of profitability as a signal of barriers to competition (the more so if the parameter approaches one).32 Our estimated parameter is statistically different from one but still quite large. Apart from the lack of competition, the persistence of the pre-provision profit could again reflect a high degree of government intervention. This is because banks are given yearly targets for asset quality and capitalization so that they cannot really change their business models, even if opportunities arise. Finally, from the macroeconomic variables included, higher real interest rates on loans and inflation appear to foster profitability while the volatility of interest rates reduces it. The latter is probably explained by the fact that Chinese banks are not used to managing interest rate risk so that they cannot really profit from such volatility. While interesting, these findings on macroeconomic variables should be treated with great care given the very small number of informative observations to estimate macroeconomic variables. One important aspect is that the results for the bank-specific variables are maintained when such macroeconomic variables are substituted by time dummies.
30 The very positive finding for TICs may be influenced by sample selection in as far as only large TICs are included in the Bankscope database. 31 It should also be noted that potential reverse causality between profitability and the ownership structure is accounted in as far as the two variables (listed and foreign capital) are instrumented for when estimating by GMM. 32 Mueller (1977) Berger et al. (2000) and Goddard, Molyneux, and Wilson (2002).
15
Table 2. Results for pre-provision profit over assets
-(1) -(2) -(3) -(4)
Dependent variable: Log of Pre-Provision Profit over Assets
Arellano-Bover Estimator
Arellano-Bover Estimator (jointly non-significant)
Arellano-Bover Estimator
Arellano-Bover Estimator (jointly non-significant)
Loan Growth -0.312* -0.253* -0.331** -0.255*(0.060) (0.078) (0.049) (0.092)
Log Loans over Assets 0.046 0.046(0.622) (0.612)
Log Deposits over Assets 0.086 0.110** 0.080 0.103**(0.138) (0.029) (0.177) (0.039)
Log Equity over Assets 0.190 0.186* 0.198* 0.197**(0.115) (0.071) (0.097) (0.037)
Rank technical inefficiency -0.432** -0.721*** -0.411** -0.704***(0.039) (0.001) (0.037) (0.001)
Foreign Capital -0.094 -0.123(0.475) (0.367)
Listed 0.093 0.101(0.505) (0.478)
Recapitalized -0.215 -0.170(0.417) (0.502)
Market Share on Assets -3.688 -3.531(0.299) (0.306)
Concentration (Herfindahl) -6.250 -4.774***(0.114) (0.003)
Real Interest on Loans (Reference) 18.503** 20.177**(0.045) (0.028)
Maximum spread -8.536(0.432)
Real GDP Growth -7.129(0.662)
Inflation 18.584* 16.886*(0.050) (0.066)
Volatility of Interest Rates -0.122*** -0.095**(0.008) (0.012)
SOCBs 0.645 0.626(0.308) (0.298)
JSCBs 0.234 0.156** 0.251 0.161**(0.324) (0.036) (0.280) (0.030)
TICs 0.327* 0.396** 0.297 0.364**(0.098) (0.020) (0.152) (0.040)
CCBs 0.061 0.074(0.774) (0.722)
Policy Banks -0.562* -0.777*** -0.529* -0.761***(0.094) (0.002) (0.087) (0.002)
Lag Log Pre-Provision Profit over Assets 0.478*** 0.398*** 0.500*** 0.411***(0.000) (0.003) (0.000) (0.003)
Constant -0.926 -2.452** -0.993* -1.308*(0.723) (0.018) (0.096) (0.051)
Observations 218 218 218 218Number of groups 56 56 56 56Hansen test (1.000) (1.000) (1.000) (0.995)Arellano-Bond test for AR(1) in first differences (0.001) (0.001) (0.000) (0.001)Arellano-Bond test for AR(2) in first differences (0.734) (0.852) (0.707) (0.994)Robust p values in parentheses* significant at 10%; ** significant at 5%; *** significant at 1%Variables in italics are instrumented through the GMM procedure following Arellano and Bover (1995)(1) Year dummies not reported
Macroeconomic approach Yearly Dummies approach (1)
We now investigate the determinants of the ROA. The results are very similar to those found for the pre-provision profit (Table 3). Banks with higher equity to assets and a relatively larger share of deposits tend to have a higher ROA. In turn, bank inefficiency and a higher market share tend to reduce the ROA. As before, JSCBs and TICs tend to have a higher ROA. The opposite is true for policy banks. As for the pre-provision profit, the ROA is found to be persistent and higher real interest rates and inflation tend to raise the ROA while the volatility of interest rates reduces it.
16
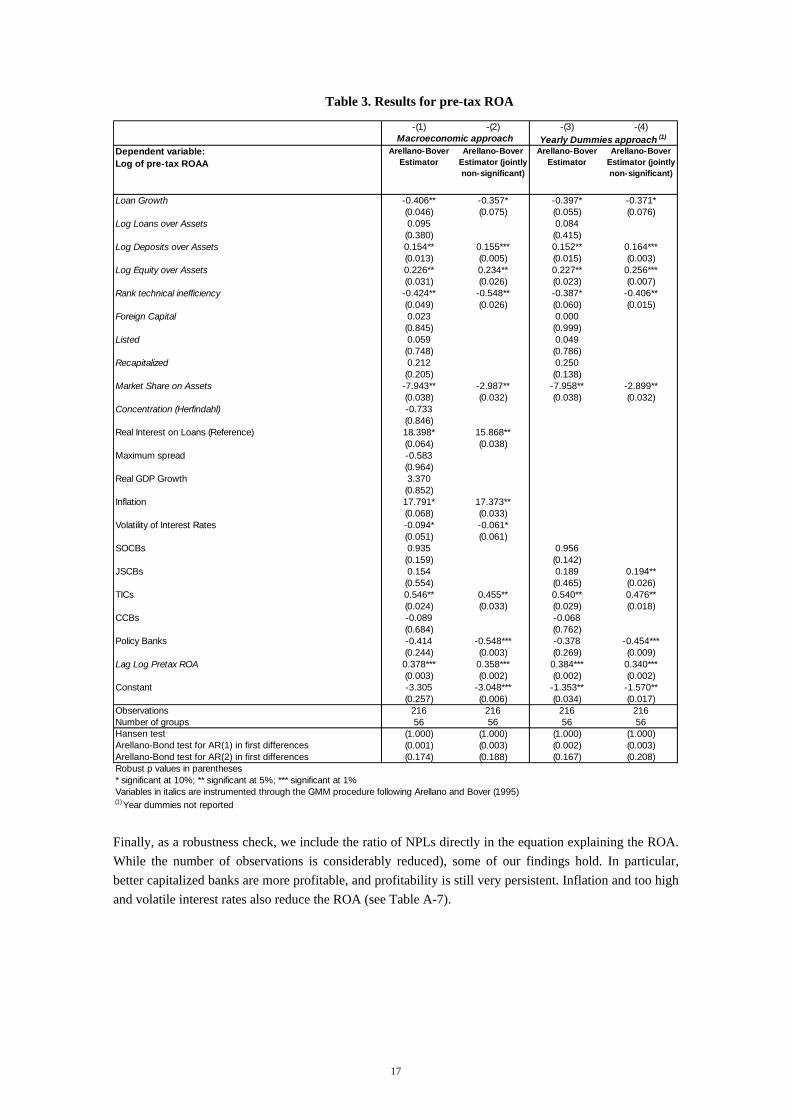
Table 3. Results for pre-tax ROA
-(1) -(2) -(3) -(4)
Dependent variable: Log of pre-tax ROAA
Arellano-Bover Estimator
Arellano-Bover Estimator (jointly non-significant)
Arellano-Bover Estimator
Arellano-Bover Estimator (jointly non-significant)
Loan Growth -0.406** -0.357* -0.397* -0.371*(0.046) (0.075) (0.055) (0.076)
Log Loans over Assets 0.095 0.084(0.380) (0.415)
Log Deposits over Assets 0.154** 0.155*** 0.152** 0.164***(0.013) (0.005) (0.015) (0.003)
Log Equity over Assets 0.226** 0.234** 0.227** 0.256***(0.031) (0.026) (0.023) (0.007)
Rank technical inefficiency -0.424** -0.548** -0.387* -0.406**(0.049) (0.026) (0.060) (0.015)
Foreign Capital 0.023 0.000(0.845) (0.999)
Listed 0.059 0.049(0.748) (0.786)
Recapitalized 0.212 0.250(0.205) (0.138)
Market Share on Assets -7.943** -2.987** -7.958** -2.899**(0.038) (0.032) (0.038) (0.032)
Concentration (Herfindahl) -0.733(0.846)
Real Interest on Loans (Reference) 18.398* 15.868**(0.064) (0.038)
Maximum spread -0.583(0.964)
Real GDP Growth 3.370(0.852)
Inflation 17.791* 17.373**(0.068) (0.033)
Volatility of Interest Rates -0.094* -0.061*(0.051) (0.061)
SOCBs 0.935 0.956(0.159) (0.142)
JSCBs 0.154 0.189 0.194**(0.554) (0.465) (0.026)
TICs 0.546** 0.455** 0.540** 0.476**(0.024) (0.033) (0.029) (0.018)
CCBs -0.089 -0.068(0.684) (0.762)
Policy Banks -0.414 -0.548*** -0.378 -0.454***(0.244) (0.003) (0.269) (0.009)
Lag Log Pretax ROA 0.378*** 0.358*** 0.384*** 0.340***(0.003) (0.002) (0.002) (0.002)
Constant -3.305 -3.048*** -1.353** -1.570**(0.257) (0.006) (0.034) (0.017)
Observations 216 216 216 216Number of groups 56 56 56 56Hansen test (1.000) (1.000) (1.000) (1.000)Arellano-Bond test for AR(1) in first differences (0.001) (0.003) (0.002) (0.003)Arellano-Bond test for AR(2) in first differences (0.174) (0.188) (0.167) (0.208)Robust p values in parentheses* significant at 10%; ** significant at 5%; *** significant at 1%Variables in italics are instrumented through the GMM procedure following Arellano and Bover (1995)(1) Year dummies not reported
Macroeconomic approach Yearly Dummies approach (1)
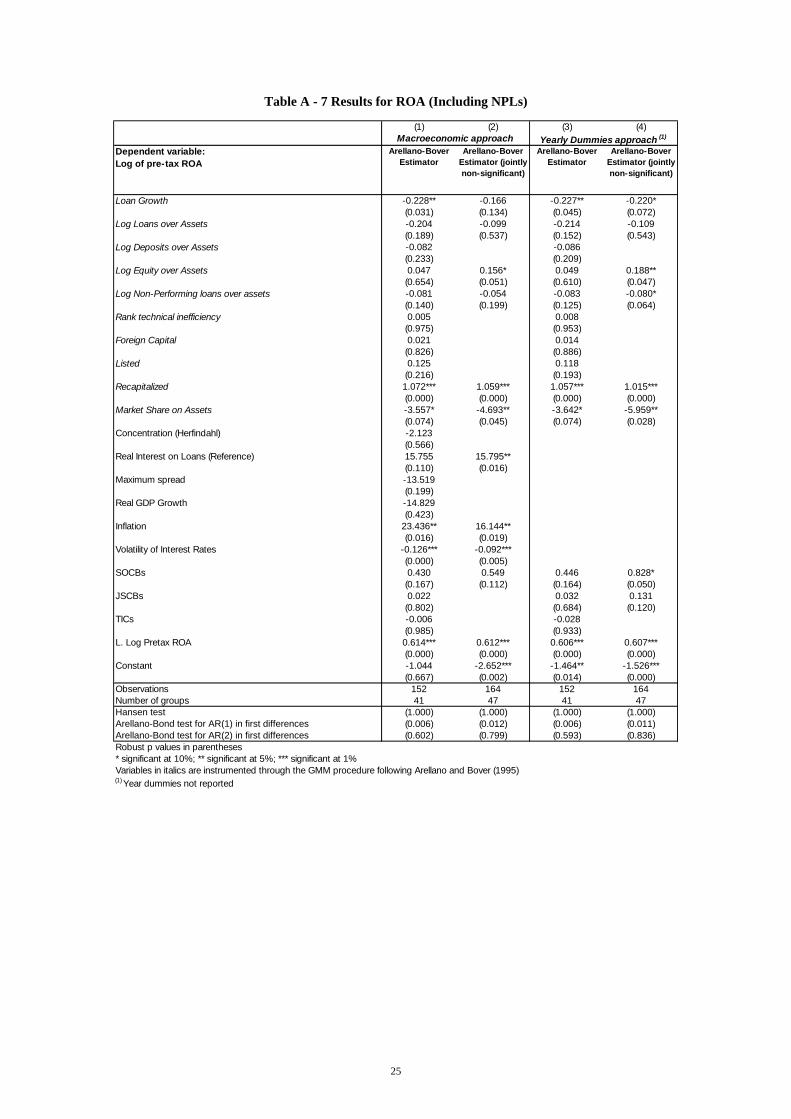
Finally, as a robustness check, we include the ratio of NPLs directly in the equation explaining the ROA. While the number of observations is considerably reduced), some of our findings hold. In particular, better capitalized banks are more profitable, and profitability is still very persistent. Inflation and too high and volatile interest rates also reduce the ROA (see Table A-7).
17
7 Conclusions
In the context of the ongoing bank reform in China, this paper analyzes empirically what are the main determinants of profitability for Chinese banks with panel data for 87 banks during 1997 to 2004. We measure profitability in two ways: the pre-provision profit and the ROA. Given the scarcity of NPL data – a potentially important determinant of profitability – we carry out a preliminary exercise. Namely, we estimate the determinants of NPLs for those banks and years were data is available and include the significant ones as additional regressors in the equation explaining bank profitability. In particular, low X-efficiency, a big market share, higher concentration are all associated with more NPLs. Listed banks, in turn, tend to have better asset quality. Finally, low economic growth and high and volatile interest rates are associated with more NPLs. We then, estimate the determinants of profitability and find a number of results which are quite robust across different definitions of profitability (pre-provision profit or ROA) and specifications. Better capitalized banks tend to be more profitable. The same is true for banks with a relatively larger of deposits and for more X-efficient banks. An interesting finding is that, a less concentrated banking system increases bank profitability, which basically reflects that SOCBs have been the main drag due to their size and performance. The negative and significant coefficient of the dummy for Policy Banks puts them in the same side as SOCBs, suggesting that government intervention does not bode well for profitability. Another piece of evidence in the same direction is the positive and significant coefficient for the dummies representing JSCBs and TICs. From the macroeconomic variables included, higher real interest rates on loans and inflation appear to foster profitability while the volatility of interest rates reduces it. Finally, profitability seems to be quite persistent in China, which probably signals barriers to competition but also a high degree of government intervention, as banks are given yearly targets for asset quality and capitalization. This is again shows how much profitability is influenced by government decisions. These findings should not come as a surprise for a banking system which has long been functioning as a mechanism for transferring huge savings to meet public policy goals. In fact, the government’s development strategy has implied using the banking system to keep inefficient SOEs afloat, among other public goals such as massive infrastructure investment. The ongoing reform will need to ensure that government intervention is the banking system is reduced – by lowering the share of government ownership, improving the corporate culture and fully liberalizing the financial system –. This specially relevant as profitability will be more sought after as Chinese banks become more market-oriented and face foreign competition.
18
REFERENCES
Angbazo (1997), “Commercial bank net interest margins, default risk, interest-rate risk, and off-balance sheet banking”, Journal of Banking & Finance 21, 55-87.
Arellano, M., and O. Bover (1995), “Another Look at the Instrumental-Variable Estimation of Error-Components Models”, Journal of Econometrics, Vol. 68, pp. 29-52.
Barth, J.R., Caprio Jr., G. & Levine, R. (2004) “Bank supervision and regulation: What works best?”, Journal of Financial Intermediation 13, 205–248.
Berger, A. N. (1995), “The Profit-Structure Relationship in Banking-Tests of Market-Power and Efficient-Structure Hypotheses”, Journal of Money, Credit and Banking, Vol. 27, No. 2. pp. 404-431.
Berger, A. N., Bonime, S. D., Covitz, D. M. y D. Hancock (2000): “Why are profits so persistent? The roles of product market competition, information opacity and regional macroeconomic shocks, Journal of Banking and Finance, 24, 1203-1235
Berger A. N. and Mester, L. J., (1999), “What Explains the Dramatic Changes in Cost and Profit Performance of the U.S. Banking Industry?” Center for Financial Institutions Working Papers from Wharton School Center for Financial Institutions, University of Pennsylvania
Berger, A. N., Hasan, I. and Zhou, M. (2006), "Bank Ownership and Efficiency in China: What will Happen in the World's Largest Nation?". Available at SSRN: http://ssrn.com/abstract=924246
Bourke, P. (1989), “Concentration and other determinants of bank profitability in Europe, North America and Australia” Journal of Banking and Finance 13: 65-79.
Boyd, J. H., Ross Levine and Bruce D. Smith, (2001) “The impact of inflation on financial sector performance”, Journal of Monetary Economics, vol. 47, issue 2, pages 221-28.
Brock and Suarez (2000), “Understanding the behaviour of bank spreads in Latin America”, Journal of Development Economics 47.
Chen, Z., Li, D. and Moshirian F. (2005), “China’s Financial Services Industry: The Intra-industry Effects of Privatization of the Bank of China Hong Kong”, Journal of Banking and Finance, 29. 2291-2324.
Claeys, S. and R. Vander Vennet (2005) ”Determinants of Bank Interest Margins in Central and Eastern Europe: A Comparison with the West” Working Paper, (Ghent University, Ghent), mimeo.
Demirguc, A. & Huizinga, H., (1999). ”Determinants of Commercial Bank Interest Margins and Profitability: Some International Evidence” World Bank Economic Review, Oxford University Press, vol. 13(2), pages 379-408.
DeYoung, R. & T. Rice (2004), “Noninterest Income and Financial Performance at U.S. Commercial Banks”, The Financial Review 39 (1), 101–127
Fry, M. (1994) “Money, Interest and Banking in Economic Development”, 2nd edition (Baltimore and London: The Johns Hopkins University Press)
Fu, X. and Heffernan, S. (2005), “China: The Effects of Bank Reform on Structure and Performance”, WP-FF-19-2005, Cass Business School, City University, UK.
19
Garcia-Herrero, A., Gavilá, S. and Santabárbara, D. (2006), “China's banking reform: an assessment of its evolution and possible impact”, CESifo Economic Studies, Oxford University Press, vol. 52, p. 304-363, June.
Garcia-Herrero, A. and Santabárbara, D. (2008), “Is the Chinese banking system benefiting from foreign investors?”, mimeo.
Garcia-Herrero, A. and Vázquez, F. (2007), “International diversification gains and home bias in banking”, forthcoming as IMF Working Paper.
Goddard, J., Molyneux, P. & J. Wilson (2004), “Dynamics of growth and profitability in banking.” Journal of Money, Credit and Banking 36, 1069-1090
Goldberg, L.G. & Saunders, A. (1981) “The determinants of foreign banking activity in the United States”, Journal of Banking and Finance 5, 17–32.
Hanson, J. and R. Rocha (1986), “High interest rates, Spreads and the Cost of Intermediation: Two Studies” World Bank Industry and Finance Series 18.
Ho and Saunders (1981), “The determinants of Banks Interest Margins: Theory and Empirical Evidence”, The Journal of Financial and Quantitative Analysis 16.
International Monetary Fund (2000). “International Capital Markets: Developments, Prospects, and Key Issues” International Monetary Fund, Washington, DC.
La Porta, R., Lopez-de-Silanes, F. and Shleifer, A. (2002), “Government ownership of banks”. Journal of Finance 57, 265–301.
Martinez-Peria, M. S. and S. Schmukler (1998), “Do depositors punish banks for bad behaviour? Market Discipline in Argentina, Chile and Mexico”, World Bank Paper 2058. Washington DC.
Maudos and Fernández de Guevara (2004), “Factors explaining the evolution of the interest margin in the banking sectors of the European Union”, Journal of Banking & Finance 28/9, 2259-2281.
Mueller, D. (1977) “The persistence of profits above the norm”, Economica, 44, 369-380;
Salas, V. and J. Saurina (2002), “Credit Risk in Two Institutional Regimes: Spanish Commercial and Savings Banks” Journal of Financial Services Research, Vol. 22, No. 3.
Stiroh, K. J. and A. Rumble, (2006) “The dark side of diversification: The case of US financial holding companies”, Journal of Banking & Finance, Volume 30, Issue 8, Pages 2131-2161.
Yao, S. and Jiang, C., (2007), “The Effects of Governance Changes on Bank Efficiency in China: A Stochastic Distance Function Approach”. Available at SSRN: http://ssrn.com/abstract=980935
20
APPENDIX
Table A - 1. Data sources
Variable Definition Type Units SourceROA Return on average assets before taxes Bank Specific Ratio BankscopeROE Return on average equity before taxes Bank Specific Ratio BankscopePre-Provision Profit over Assets
Operating Income minus Operating Expenses over assets Bank Specific Ratio Bankscope
NPL ratio Problem loans over total loans Bank Specific Ratio BankscopeStock of NPLs Stock of problem loans Bank Specific CNY Millions BankscopeFlow of NPLs Flow of problem loans in the year Bank Specific CNY Millions BankscopeLoans Total loans Bank Specific CNY Millions BankscopeLoan Growth Total loans annual growth rate Bank Specific BankscopeLoans over Assets Total loans over total assets Bank Specific Ratio BankscopeDeposits over Assets Total deposits over assets Bank Specific Ratio BankscopeEquity over Assets Book value of equity over total assets Bank Specific Ratio BankscopeRank technical inefficiency Rank of techincal inefficiency in uniform scale over [0,1] Bank Specific IndexForeign Capital 1 if a bank has foreign ownership at the end of the year; 0
otherwiseBank Specific Dummy García-Herrero et
al. (2005)Listed 1 if a bank has been listed at the end of the year; 0 otherwise Bank Specific Dummy García-Herrero et
al. (2005)Recapitalized 1 if a bank has been recapitalized by the government; 0 otherwise Bank Specific Dummy García-Herrero et
al. (2005)NPLs Dispose of NPLs transfered to AMCs Bank Specific CNY Millions García-Herrero et
al. (2005)Financial Strength Rating Financial Strength Rating (1 worst-12 best) Bank Specific Index Moody'sMarket Share on Assets Each bank total assets over banking system total assets Bank Specific Bankscope, CEICConcentration (Herfindahl) Sum of the squared market shares of each bank assets Macroeconomic BankscopeReal GDP Growth Annual growth rate of real GDP Macroeconomic CEICInflation CPI annual inflation rate Macroeconomic CEICReal Interest on Loans One year real reference interest rate on loans Macroeconomic CEICMaximum spread between loan and deposit rates
Maximum spread between one year reference real interest rate on loans and one year reference real interest rate on deposits
Macroeconomic CEIC, García-Herrero et al.
(2006)Volatility of Interest Rates Standard deviation of monthly average of interbank interest rate. Macroeconomic CEIC
System Credit Growth Total banking sector credit growth Macroeconomic CEIC
Table A - 2. Descriptive statistics
Name Obs. MeanSd.
Deviation Min Perc. 1% Perc. 99% MaxReturn on Average Assets (ROA) 368 0.01 0.01 -0.01 -0.01 0.05 0.07Return on Average Equity (ROE) 368 0.09 0.08 -0.20 -0.07 0.37 0.50Pre-Provision Profit over Assets 368 0.01 0.01 -0.01 0.00 0.06 0.11NPL ratio 200 0.20 0.37 0.00 0.00 2.38 3.66Stock of NPLs (a) 200 54729 167259 0.4 0.5 776398 831725Flow of NPLs (a) 152 -5374 30528 -242198.5 -195917.2 24399 26078Loans (a) 371 213042 546346 1.2 1.7 2688877 3705274Loan Growth 308 0.33 1.89 -0.98 -0.55 2.60 32.54Loans over Assets 371 0.50 0.18 0.00 0.01 0.96 0.98Deposits over Assets 359 0.73 0.24 0.00 0.00 0.95 0.97Equity over Assets 371 0.13 0.19 0.01 0.01 0.96 0.98Rank technical inefficiency 268 0.50 0.30 0 0 1 1Foreign Capital 371 0.05 0.23 0 0 1 1Listed 371 0.06 0.25 0 0 1 1Recapitalized 371 0.01 0.12 0 0 1 1NPLs Dispose of 371 4512 37786 0 0 267400 407700Financial Strength Rating (1 worst-12 best) 131 2.89 1.21 1 1 5 5Market Share on Assets 371 0.02 0.05 0.00 0.00 0.22 0.26Concentration (Herfindahl) 371 0.14 0.03 0.09 0.09 0.17 0.17Real Interest on Loans 371 0.05 0.02 0.01 0.01 0.08 0.08Maximum spread between loan and deposit rates 371 0.05 0.01 0.03 0.03 0.07 0.07Real GDP Growth 371 0.08 0.01 0.07 0.07 0.10 0.10Inflation 371 0.01 0.02 -0.01 -0.01 0.04 0.04Volatility of Interest Rates 371 0.44 0.48 0.07 0.07 1.53 1.53System Credit Growth 371 0.15 0.05 0.06 0.06 0.23 0.23(a) Units: CNY Millions
21
Table A - 3. Balance Sheet and Income Statement
CNY bn 1997 1998 1999 2000 2001 2002 2003 2004AssetsLoans 5729 6410 6855 9827 10100 11800 13900 14400Other Earning Assets 2687 2962 3526 5693 5982 6821 7819 8349Total Earning Assets 8416 9372 10382 15519 16082 18621 21719 22749Total Assets 9041 10200 11200 16800 17300 19600 22800 23600Liabilities & EquityDeposits & Short term funding 7546 8341 9089 14000 14400 17400 20000 20900Other Funding 506 633 767 881 958 189 202 291Other (Non-Interest bearing) 551 551 720 922 953 903 1447 1446Total Liabilities 8603 9525 10576 15803 16311 18492 21649 22638Equity 410 610 636 922 881 858 979 893
CNY bn 1997 1998 1999 2000 2001 2002 2003 2004
Net Interest Revenue 172 186 188 287 301 335 419 476Other Operating Income 61 50 44 53 60 86 98 69Total Operating Income 233 236 232 340 361 421 518 544Total Operating Expenses 133 152 144 196 197 254 291 274Pre-provision profit 100 83 87 144 163 167 226 271Loan Loss Provisions 19 25 31 58 85 83 87 110Profit before Tax 81 59 56 85 78 84 139 161Tax 42 36 35 50 41 40 59 67Net Income 40 22 21 36 38 44 81 94
Number of banks 40 38 41 46 41 53 68 53
BALANCE SHEET
INCOME STATEMENT
Table A - 4. NPLs cross correlation
Loan Loss Reserve (Stock)
Loan Provisons
(Flow) Flow of NPLsFlow of NPLs
(-1)Stock of
NPLsStock of NPLs (-1)
Loan Loss Reserve (Stock) 1Loan Provisons (Flow) 0.49 1Flow of NPLs -0.47 -0.44 1Flow of NPLs (-1) -0.33 -0.41 0.20 1Stock of NPLs 0.43 0.81 -0.26 -0.31 1Stock of NPLs (-1) 0.49 0.84 -0.42 -0.33 0.99 1
22
Table A - 5. Results for NPL ratio
-(1) -(2) -(3) -(4)
Dependent variable: log (npl ratio/1-npl ratio)
Arellano-Bover Estimator
Arellano-Bover Estimator (jointly non-significant)
Arellano-Bover Estimator
Arellano-Bover Estimator (jointly non-significant)
-0.211 -0.194(0.234) (0.296)
Log Loans over Assets -0.018 -0.043(0.974) (0.939)0.177 0.177(0.324) (0.327)
Rank technical inefficiency 0.264 0.688** 0.307 0.526(0.425) (0.027) (0.350) (0.138)
Foreign Capital 0.053 0.043(0.730) (0.781)
Listed -0.305 -0.554** -0.302 -0.580**(0.101) (0.010) (0.109) (0.015)
Recapitalized -0.682* -0.642* -0.711* -0.673*(0.095) (0.089) (0.085) (0.072)
Log NPLs Dispose of -0.049*** -0.047*** -0.051*** -0.056***(0.007) (0.001) (0.004) (0.002)
Market Share on Assets 3.487 1.864*** 3.023 2.166***(0.192) (0.007) (0.249) (0.001)1.757(0.742)
Real Interest on Loans -2.255(0.864)
Maximum spread 6.178(0.719)
Real GDP Growth -13.864 -27.383***(0.565) (0.000)
Inflation -3.137(0.838)
Volatility of Interest Rates 0.143* 0.119***(0.052) (0.003)-0.130 -0.056(0.799) (0.912)
JSCBs 0.157 0.171(0.395) (0.365)
TICs 0.893** 0.230 0.916** 0.220(0.048) (0.759) (0.047) (0.779)
Lag Log (npl ratio/1-npl ratio) 0.694*** 0.638*** 0.700*** 0.657***(0.000) (0.000) (0.000) (0.000)
Constant 0.503 1.290*** -0.212 -0.616(0.888) (0.000) (0.806) (0.150)
Observations 115 144 115 144Number of groups 32 41 32 41Hansen test (1.000) (0.995) (1.000) (0.997)Arellano-Bond test for AR(1) in first differences (0.048) (0.009) (0.047) (0.030)Arellano-Bond test for AR(2) in first differences (0.038) (0.066) (0.036) (0.046)Robust p values in parentheses* significant at 10%; ** significant at 5%; *** significant at 1%Variables in italics are instrumented through the GMM procedure following Arellano and Bover (1995)(1) Year dummies not reported
Yearly Dummies approach (1)
Log Equity over Assets (-1)
SOCBs
Loan Growth (-1)
Concentration (Herfindahl)
Macroeconomic approach
23
Table A - 6 Results for Stock of NPLs
-(1) -(2) -(3) -(4)
Dependent variable: Log of the Stock of Non-Performing Loans
Arellano-Bover Estimator
Arellano-Bover Estimator (jointly non-significant)
Arellano-Bover Estimator
Arellano-Bover Estimator (jointly non-significant)
0.310** 0.344*** 0.309** 0.360***(0.021) (0.000) (0.022) (0.001)
Loan Growth -0.078 -0.079(0.770) (0.768)
Loan Growth (-1) -0.154 -0.151(0.345) (0.357)
Log Loans over Assets 0.285 0.266(0.523) (0.548)
Log Equity over Assets (-1) 0.212 0.218(0.173) (0.170)
Rank technical inefficiency 0.241 0.545* 0.261 0.597**(0.382) (0.062) (0.356) (0.044)
Foreign Capital 0.029 0.022(0.806) (0.854)
Listed -0.216 -0.380* -0.206 -0.390*(0.111) (0.073) (0.124) (0.051)
Recapitalized -0.616 -0.726 -0.635 -0.685(0.115) (0.102) (0.112) (0.123)
-0.044*** -0.052*** -0.045*** -0.055***(0.003) (0.002) (0.002) (0.004)
Market Share on Assets 0.818 0.698(0.742) (0.776)
Concentration (Herfindahl) 5.070 7.564*** 147.001(0.151) (0.000) (0.116)
Real Interest on Loans -17.866*(0.092)
Volatility of Interest Rates 0.114* 0.090***(0.080) (0.005)
Inflation -19.256(0.105)
Real GDP Growth -4.963(0.734)
System Credit Growth -0.813(0.409)
SOCBs -0.002 0.032(0.997) (0.947)
JSCBs 0.100 0.108(0.534) (0.505)
TICs 0.522 -0.144 0.517 -0.137(0.177) (0.803) (0.189) (0.813)
Lag Log Non-performing loans 0.709*** 0.707*** 0.708*** 0.693***(0.000) (0.000) (0.000) (0.000)
Constant 0.974 -2.229*** 0.053 -26.285*(0.546) (0.001) (0.948) (0.096)
Observations 115 144 115 144Number of groups 32 41 32 41Hansen test (1.000) (1.000) (1.000) (0.996)Arellano-Bond test for AR(1) in first differences (0.021) (0.009) (0.020) (0.013)Arellano-Bond test for AR(2) in first differences (0.384) (0.138) (0.396) (0.124)Robust p values in parentheses* significant at 10%; ** significant at 5%; *** significant at 1%Variables in italics are instrumented through the GMM procedure following Arellano and Bover (1995)(1) Year dummies not reported
Log Loans
Log NPLs Dispose of
Macroeconomic approach Yearly Dummies approach (1)
24
25
(1) (2) (3) (4)
Dependent variable: Log of pre-tax ROA
Arellano-Bover Estimator
Arellano-Bover Estimator (jointly non-significant)
Arellano-Bover Estimator
Arellano-Bover Estimator (jointly non-significant)
Loan Growth -0.228** -0.166 -0.227** -0.220*(0.031) (0.134) (0.045) (0.072)
Log Loans over Assets -0.204 -0.099 -0.214 -0.109(0.189) (0.537) (0.152) (0.543)
Log Deposits over Assets -0.082 -0.086(0.233) (0.209)
Log Equity over Assets 0.047 0.156* 0.049 0.188**(0.654) (0.051) (0.610) (0.047)
Log Non-Performing loans over assets -0.081 -0.054 -0.083 -0.080*(0.140) (0.199) (0.125) (0.064)
Rank technical inefficiency 0.005 0.008(0.975) (0.953)
Foreign Capital 0.021 0.014(0.826) (0.886)
Listed 0.125 0.118(0.216) (0.193)
Recapitalized 1.072*** 1.059*** 1.057*** 1.015***(0.000) (0.000) (0.000) (0.000)
Market Share on Assets -3.557* -4.693** -3.642* -5.959**(0.074) (0.045) (0.074) (0.028)
Concentration (Herfindahl) -2.123
Real
Max
Real
Inflat
Vola
SOC
JSC
TICs
L. Log P
Con
ObsNumbHansArellArellRobu* sigVaria(1) Ye
Macroeconomic approach Yearly Dummies approach (1)
(0.566) Interest on Loans (Reference) 15.755 15.795**
(0.110) (0.016)imum spread -13.519
(0.199) GDP Growth -14.829
(0.423)ion 23.436** 16.144**
(0.016) (0.019)tility of Interest Rates -0.126*** -0.092***
(0.000) (0.005)Bs 0.430 0.549 0.446 0.828*
(0.167) (0.112) (0.164) (0.050)Bs 0.022 0.032 0.131
(0.802) (0.684) (0.120)-0.006 -0.028(0.985) (0.933)
retax ROA 0.614*** 0.612*** 0.606*** 0.607***(0.000) (0.000) (0.000) (0.000)
stant -1.044 -2.652*** -1.464** -1.526***(0.667) (0.002) (0.014) (0.000)
ervations 152 164 152 164er of groups 41 47 41 47
en test (1.000) (1.000) (1.000) (1.000)ano-Bond test for AR(1) in first differences (0.006) (0.012) (0.006) (0.011)ano-Bond test for AR(2) in first differences (0.602) (0.799) (0.593) (0.836)st p values in parentheses
nificant at 10%; ** significant at 5%; *** significant at 1%bles in italics are instrumented through the GMM procedure following Arellano and Bover (1995)ar dummies not reported
Table A - 7 Results for ROA (Including NPLs)
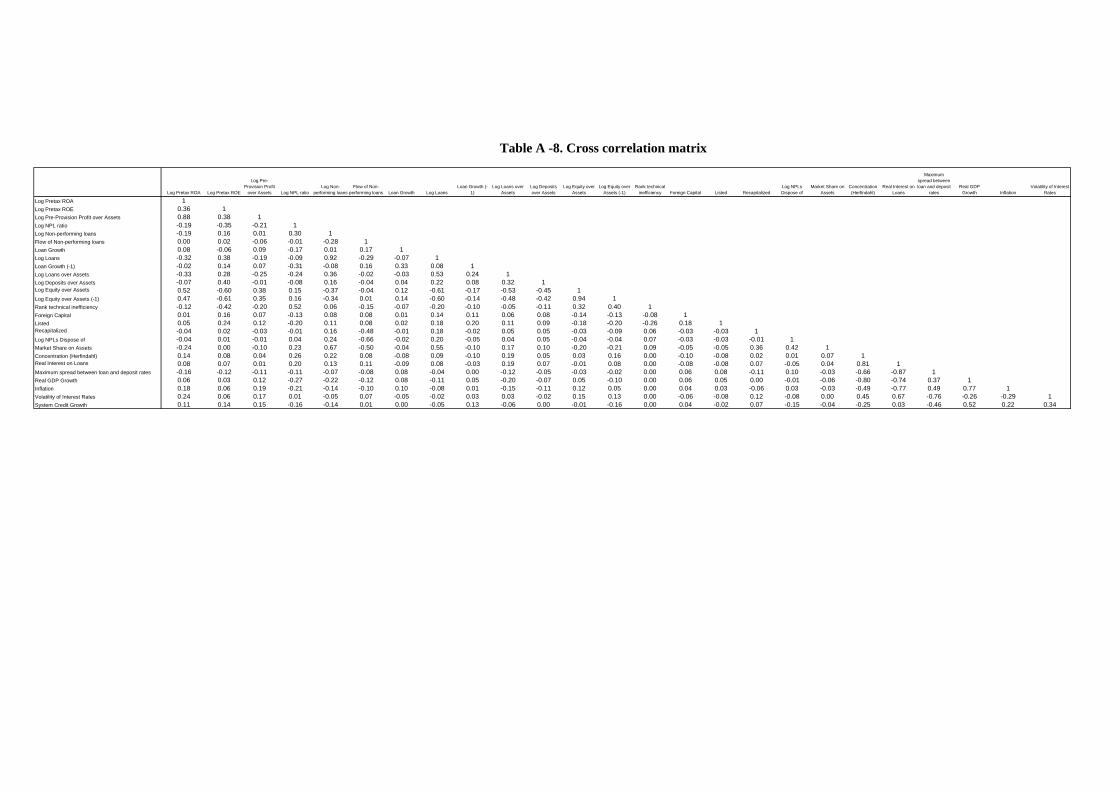
Table A -8. Cross correlation matrix
Log Pretax ROA Log Pretax ROE
Log Pre-Provision Profit
over Assets Log NPL ratioLog Non-
performing loansFlow of Non-
performing loans Loan Growth Log LoansLoan Growth (-
1)Log Loans over
AssetsLog Deposits over Assets
Log Equity over Assets
Log Equity over Assets (-1)
Rank technical inefficiency Foreign Capital Listed Recapitalized
Log NPLs Dispose of
Market Share on Assets
Concentration (Herfindahl)
Real Interest on Loans
Maximum spread between loan and deposit
ratesReal GDP
Growth InflationVolatility of Interest
Rates
Log Pretax ROA 1Log Pretax ROE 0.36 1Log Pre-Provision Profit over Assets 0.88 0.38 1Log NPL ratio -0.19 -0.35 -0.21 1Log Non-performing loans -0.19 0.16 0.01 0.30 1Flow of Non-performing loans 0.00 0.02 -0.06 -0.01 -0.28 1Loan Growth 0.08 -0.06 0.09 -0.17 0.01 0.17 1Log Loans -0.32 0.38 -0.19 -0.09 0.92 -0.29 -0.07 1Loan Growth (-1) -0.02 0.14 0.07 -0.31 -0.08 0.16 0.33 0.08 1Log Loans over Assets -0.33 0.28 -0.25 -0.24 0.36 -0.02 -0.03 0.53 0.24 1Log Deposits over Assets -0.07 0.40 -0.01 -0.08 0.16 -0.04 0.04 0.22 0.08 0.32 1Log Equity over Assets 0.52 -0.60 0.38 0.15 -0.37 -0.04 0.12 -0.61 -0.17 -0.53 -0.45 1Log Equity over Assets (-1) 0.47 -0.61 0.35 0.16 -0.34 0.01 0.14 -0.60 -0.14 -0.48 -0.42 0.94 1Rank technical inefficiency -0.12 -0.42 -0.20 0.52 0.06 -0.15 -0.07 -0.20 -0.10 -0.05 -0.11 0.32 0.40 1Foreign Capital 0.01 0.16 0.07 -0.13 0.08 0.08 0.01 0.14 0.11 0.06 0.08 -0.14 -0.13 -0.08 1Listed 0.05 0.24 0.12 -0.20 0.11 0.08 0.02 0.18 0.20 0.11 0.09 -0.18 -0.20 -0.26 0.18 1Recapitalized -0.04 0.02 -0.03 -0.01 0.16 -0.48 -0.01 0.18 -0.02 0.05 0.05 -0.03 -0.09 0.06 -0.03 -0.03 1Log NPLs Dispose of -0.04 0.01 -0.01 0.04 0.24 -0.66 -0.02 0.20 -0.05 0.04 0.05 -0.04 -0.04 0.07 -0.03 -0.03 -0.01 1Market Share on Assets -0.24 0.00 -0.10 0.23 0.67 -0.50 -0.04 0.55 -0.10 0.17 0.10 -0.20 -0.21 0.09 -0.05 -0.05 0.36 0.42 1Concentration (Herfindahl) 0.14 0.08 0.04 0.26 0.22 0.08 -0.08 0.09 -0.10 0.19 0.05 0.03 0.16 0.00 -0.10 -0.08 0.02 0.01 0.07 1Real Interest on Loans 0.08 0.07 0.01 0.20 0.13 0.11 -0.09 0.08 -0.03 0.19 0.07 -0.01 0.08 0.00 -0.08 -0.08 0.07 -0.05 0.04 0.81 1Maximum spread between loan and deposit rates -0.16 -0.12 -0.11 -0.11 -0.07 -0.08 0.08 -0.04 0.00 -0.12 -0.05 -0.03 -0.02 0.00 0.06 0.08 -0.11 0.10 -0.03 -0.66 -0.87 1Real GDP Growth 0.06 0.03 0.12 -0.27 -0.22 -0.12 0.08 -0.11 0.05 -0.20 -0.07 0.05 -0.10 0.00 0.06 0.05 0.00 -0.01 -0.06 -0.80 -0.74 0.37 1Inflation 0.18 0.06 0.19 -0.21 -0.14 -0.10 0.10 -0.08 0.01 -0.15 -0.11 0.12 0.05 0.00 0.04 0.03 -0.06 0.03 -0.03 -0.49 -0.77 0.49 0.77 1Volatility of Interest Rates 0.24 0.06 0.17 0.01 -0.05 0.07 -0.05 -0.02 0.03 0.03 -0.02 0.15 0.13 0.00 -0.06 -0.08 0.12 -0.08 0.00 0.45 0.67 -0.76 -0.26 -0.29 1System Credit Growth 0.11 0.14 0.15 -0.16 -0.14 0.01 0.00 -0.05 0.13 -0.06 0.00 -0.01 -0.16 0.00 0.04 -0.02 0.07 -0.15 -0.04 -0.25 0.03 -0.46 0.52 0.22 0.34