what explains the evolution of productivity and
TRANSCRIPT

IESE Business School-University of Navarra - 1
WHAT EXPLAINS THE EVOLUTION OF PRODUCTIVITY AND COMPETITIVENESS? THE INNOVATION LINK
Jordi Jaumandreu
IESE Business School – University of Navarra Av. Pearson, 21 – 08034 Barcelona, Spain. Phone: (+34) 93 253 42 00 Fax: (+34) 93 253 43 43 Camino del Cerro del Águila, 3 (Ctra. de Castilla, km 5,180) – 28023 Madrid, Spain. Phone: (+34) 91 357 08 09 Fax: (+34) 91 357 29 13 Copyright © 2009 IESE Business School.
Working PaperWP-804 July, 2009

IESE Business School-University of Navarra
The Public-Private Center is a Research Center based at IESE Business School. Its mission is to develop research that analyses the relationships between the private and public sectors primarily in the following areas: regulation and competition, innovation, regional economy and industrial politics and health economics.
Research results are disseminated through publications, conferences and colloquia. These activities are aimed to foster cooperation between the private sector and public administrations, as well as the exchange of ideas and initiatives.
The sponsors of the SP-SP Center are the following:
• Accenture • Ajuntament de Barcelona • Caixa Manresa • Cambra Oficial de Comerç, Indústria i Navegació de Barcelona • Consell de l’Audiovisual de Catalunya • Departamento de Economía y Finanzas de la Generalitat de Catalunya • Departamento de Innovación, Universidades y Empresa de la Generalitat de Catalunya • Diputació de Barcelona • Endesa • Fundació AGBAR • Garrigues • Mediapro • Microsoft • Sanofi Aventis • VidaCaixa
The contents of this publication reflect the conclusions and findings of the individual authors, and not the opinions of the Center's sponsors.
IESE Business School-University of Navarra
WHAT EXPLAINS THE EVOLUTION OF PRODUCTIVITY AND COMPETITIVENESS? THE INNOVATION LINK*
Jordi Jaumandreu1
Abstract This paper addresses the recent evolution of productivity and competitiveness in Catalonia and their links with the innovation activity of firms. Firstly, it summarizes the evolution of productivity, competitiveness, firms' strategies and the state of innovation. A slowdown in productivity growth and increasing revealed difficulties in some world markets are real, and the weakness of innovation may be a reason. The paper then quantifies some of the links between innovation, productivity and competitiveness. Innovation has a positive impact on productivity and competitiveness. First of all, innovation expenditures induce cost advantages and these cost advantages are a significant explanation for firms' exports. Furthermore, product innovation helps exports, too. Moreover, R&D activities in Catalonia benefit from high spillovers, and productivity impact is even higher when firms develop R&D activities outside as well. Despite all this, the current level of innovation expenditure is comparatively low and shows signs of lack of dynamism. Firms need to switch from the current equilibrium to the requirements of the coming years.
Keywords: Labor productivity, Competitiveness, Innovation, Cost.
* The author thanks Jordi Vidal-Robert for excellent assistance, Laia Castany for data and discussions, Xiao-Jing Hu for help, as well as useful comments by Xavier Vives, Bruno Cassiman, Jordi Ollé Garmendia, all participants at the “Catalonia competitiveness” and Xulia Gonzalez, Lourdes Moreno, Diego Rodríguez and Marian Vidal-Fernández.
1 Professor, Financial Management, PricewaterhouseCoopers Chair of Finance, IESE

IESE Business School-University of Navarra
WHAT EXPLAINS THE EVOLUTION OF PRODUCTIVITY AND COMPETITIVENESS? THE INNOVATION LINK
1. Introduction It has become commonplace to stress the worrying recent relative deceleration of Catalan and Spanish labor productivity growth with respect to the average of European countries, while European countries themselves lag with respect to the evolution of labor productivity in the United States. When one focuses attention on the performance of Catalonia in international markets as an indicator of the competitiveness of its products, the situation also depicts a complex scenario. Many firms may be gaining and retaining markets because they are quite dynamic in product design and improvement, but the global relative weight of low to medium technological goods in Catalan exports is in any case very big, and the dynamism of the exports of these goods has been seriously reduced in many cases. Cost and non-cost advantages of the products of firms are linked to their innovative capacities in processes and products, and it should be explored to what extent the symptoms of productivity and competitiveness are linked to the weaknesses of the innovation activities of firms. Catalan firms have traditionally shown a slight advantage in the effort to innovate and in the output of such innovation, but the level of innovation of the whole system is comparatively very low and the extent of these advantages may be small compared with the change that both Catalan and Spanish firms should make in order to retain and then improve their world position in the coming years.
This paper addresses the evolution of productivity and competitiveness in Catalonia during the first decade of this century and their links with the innovation activity of firms. It has two parts. The first part, which goes from sections 2 to 6, is a descriptive summary of the recent evolution of productivity and competitiveness, as well as a characterization of the main traits of the innovation efforts of firms. In the second part, section 7 and its subsections, a more formal exploration of the links between productivity, competitiveness and innovation is started and an attempt is made at quantifying a few relationships.
The first part uses many recently produced documents to assess firstly the evolution of productivity, even at the industry level, and then export and import data to complete the picture with the evolution of the advantages revealed in trade. I then take a look at the evolution of firms' strategies using a sample of firms coming from the ESEE and divided into a sample of Catalan firms, other Spain firms and a specific, more comparable subset of Madrid firms. I also explore the basic facts and figures of the innovation activity, using the many recent documents produced on the subject. Some new evidence, based on the ESEE sample of

2 - IESE Business School-University of Navarra
firms, turns out to be important for assessing both the advantages of Catalan firms and the recent weaknesses shown by all of the firms' innovative activities. A few words about the role of public support are added.
In the second part, I start to address three questions. The first and very basic question is: does innovation activity really impact the productivity of the firms and by how much? As the answer to the first question must be presumed to be positive, and this is a study focused on a geographic area, the second question concerns the geographical location of the activities of the firms. In particular, does the geographical location of the innovation activities impact their productivity and, if so, how? Third, increased productivity means lower costs, but this is only one of the ingredients for competitiveness. The following question concerns what we can say, with the data at hand, about the more general relationship between innovation and revealed competitiveness, taking into account both the impact of innovation on cost (productivity) and the firms' efforts for product innovation. I conclude with a brief summary and conclusions.
2. A Slowdown of Productivity Growth Since the mid-1990's European labor productivity growth (the growth of output minus the growth of the employed labor) seems to be lower than the growth of productivity in the United States, both in the whole economy and the key sectors of manufacturing and services. And the growth of labor productivity in Catalan and Spanish economies has been clearly lower than the average growth in European countries. The specific figures can change according to the sources, but the phenomenon seems to be well established. Table 1 documents this fact with numbers for the period 1995-2003 and Table 2 gives, with some more detail, the figures for 2000-2006.1 When one looks with more detail at the differences between labor productivity within the countries of the European Union (see Table 3, Fernández and Montolio, 2006, and Montolio, 2008), one discovers that the average labor productivity of the (until recently) 25 members has been growing at a slightly higher pace than the productivity of the 15 former members. Correspondingly, the difference in the level of productivity between these two groups had been reduced to only 6.5% by 2005. Catalonia, which maintained a tiny advantage on the EU-15 average in the mid-1990's, has lost this advantage and by 2005 had its productivity located in between the productivity levels of the two aggregates. Spain, which initially maintained only a weak advantage with respect to the EU-25 aggregate, showed a level of labor productivity slightly lower by 2005.
Table 3 also documents how Catalonia and Spain have nonetheless created employment at significant growth levels. The difference with respect to what has happened to employment in the average of the rest of the European countries is so important that some have suggested a relationship between the slowdown in the growth of productivity and the creation of jobs in
1 Labor productivity figures give an average growth of 0.9% for the period 2000-2003 in Table 1 and an (implicit) average growth close to 0.2% in Table 2. The reason is that the labor productivity growth of Table 1 is computed by OECD as GDP per hour worked and the labor productivity growth of Table 2 is computed from Eurostat sources as GDP per employee. These numbers imply that employment would have been growing at a higher pace than total hours of work during the period. That is, average working hours would have been falling. In fact, using total hours worked from EU KLEMS database to compute labor productivity growth from Eurostat GDP figures produces quite similar results as the OECD computations.

IESE Business School-University of Navarra - 3
low productivity industries, particularly construction and services. However, labor reallocation by itself can hardly explain the slowdown in productivity growth.2
There are available manufacturing estimates of the level of labor productivity at the beginning of the new decade by industries, as well as an estimate of the productivity growth of these industries in Catalonia during the period 1995-2005 (see Table 4 and Amarelo, 2006). The comparison of productivity levels shows that there was a small productivity difference in the aggregated level of productivity for manufacturing between Catalonia and the EU-25 and a slightly greater difference between Catalonia and Spain. Amarelo (2006) performs a shift share analysis which shows that part of the difference between Catalonia and Spain can be attributed to the difference of industry structures (around 1/3), and that the different structures explain almost none of the difference with respect to Europe (only a 5% of the difference). From these level estimates, it is important to remember that the industries in which Catalonia shows a higher productivity relative to the EU-25 levels are, significantly enough, industries usually classified as low-technology sectors (Non-metals, Textile, Food).
The most striking fact shows up when one relates the Catalonia/EU-25 productivity differences by industries in 2001-2002 to the average growth rates of productivity in these industries for the whole period 1995-2005. Figure 1 depicts the relationship.3 Productivity growth is clearly higher in the industries in which Catalonia shows an advantage in productivity and lower in most of the industries which show some disadvantage in productivity (namely Chemicals, Machinery, Electrical goods, Metals, Transport equipment, Rubber and plastic). The exceptions are the Paper and Wood industries, which have a productivity disadvantage and high productivity growth. This framework suggests a rather non-convergent growth, which may have tended to keep the differences instead of blurring them.
The most problematic part of this fact is that all sectors with high productivity growth (some of them with high productivity advantages) are sectors usually classified as low-technology sectors, while all sectors with smaller growth (and some productivity disadvantages) are sectors usually classified as medium to high-technology sectors.
In summary, since the mid-1990's, labor productivity in Catalonia, as in the rest of Spain, has shown a slowdown that has deteriorated its relative position with respect to the average labor productivity in European Union countries. Productivity growth in Catalonia has in addition been relatively high in sectors of low technology content, many of which have a productivity advantage, and has been more modest in sectors of higher technological content.
2 In fact, shift share analyses using national accounts data tend to show positive effects of the reallocation of labor on productivity, because value added labor productivity of services is higher than value added labor productivity in the industries with employment losses.
3 Cassiman and Golovko (2008) find a more positive productivity growth for Chemicals. This fits well with the positive commercial role that we find later for this sector. In general, it should be taken into account that the sources for many data considered here, the periods covered and the methods used for computation are quite different.

4 - IESE Business School-University of Navarra
3. The Evolution of Revealed Trade Advantages This section complements the description of productivity with the account of revealed trade advantages. This description more broadly outlines the state of competitiveness, which may be based on both productivity advantages and the degree of the presence of other product advantages such as novelty, quality and design. That is, on the one hand, looking at revealed relative trade advantages is an indirect way to assess the impact of the evolution of productivity. Relative productivity gains imply greater cost reductions than do competitors' products. If passed on to prices, cost reductions imply a better competitive position in international markets. But, on the other hand, revealed trade advantages are also the result of the relative position in terms of the products themselves and their characteristics other than price. The impact of product characteristics is especially important in markets which possess a high degree of product differentiation, as markets of goods of high technological content usually do.
To look at the state of trade, I will use numbers from the detailed description given by Parellada and Alvarez, 2007 (see also Fernandez, 2007). Catalonia accounts for an important fraction of Spanish exports (around 27% in 2005), and has a non-negligible world export share that has increased up to 0.5%. Foreign exchange has mainly an intra-industry character, and has 70% of exports concentrated in the EU and 80% in Europe. Imports are intense and concentrated as well, and the degree of openness to trade as measured by exports plus imports over value added has reached 67.4%, 20 percentage points more than in Spain. The latest years covered by the trade data show some evidence of deterioration of the competitive position, apparent in examples such as the inability to penetrate the rapidly increasing Asian market and the deterioration of the balance in consumer durables. Let's focus the attention on the evolution of both the structure of exports and the relative commercial advantage (computed as exports-imports over the sum of exports and imports) with products classified according to their technological content. Table 5 reports the evolution of these aspects (structure and advantage) during the broad period that ranges from 1994 to 2005.
Catalonia has a non-negligible portion of exports of products of high technological content, consisting mainly of electronics and pharmaceuticals. With the growth of exports of these products over time, their joint share in exports has increased up to 12% while the trade deficit has diminished. This is the most dynamic part of exports. It must also be said, however, that the trade deficit in electronics has remained virtually the same since the intermediate year 2000.
Notwithstanding, more than half of Catalan exports are goods of medium-high technological content. Most of these products are vehicles and chemicals, which together constitute almost 40% of total exports. The exports of chemicals have increased in relative terms continuously over time and the trade deficit has shrunk. The share of vehicles has slightly decreased while a trade deficit has replaced what was almost the only surplus of the 1990's. The evidence on the export behavior of other goods in this technological category is also mixed. Significant shares of machinery and electrical goods have decreased over time while the deficit has increased. Precision instruments and other transport, with small shares, present more positive evolutions. Other less important products show sundry behaviors.
During the same period, exports of goods of low technological content decreased from a quarter to one fifth of total exports. The exports of textiles decreased in relative terms while the trade deficit grew. The exports of foods, instead, grew to 9% of total exports while the deficit in food

IESE Business School-University of Navarra - 5
products decreased, at least until 2000. The evidence on other, less important goods of low technological content is mixed (paper more positive, wood more negative).
Globally, it seems clear that exports of low technological content are shrinking in relative terms (textiles) despite good behavior of some exports (food), and that exports with a high technological content (electronics, pharmaceuticals) are increasing their share in total exports despite the extreme weaknesses in some high-tech areas (computing). The bulk of exports, concentrated in traditional exports of goods of medium-high technological content, have split their behavior in good (chemicals) and not so good (vehicles, electrical, machinery). Many other smaller components of export have experienced different behaviors too.
A look at the trade situation depicts a more complex scenario than that of productivity. This is reflected in Figure 2, which relates advantages and productivity growth.4 First of all, in some industries, firms may be retaining and even gaining markets based on their dynamism in product design and adaptation, despite the modest evolution of productivity and hence costs. Indeed, some industries improve their commercial position despite their poor record in productivity (pharmaceuticals, chemicals, electronics and other transport). The graph also shows the industries that have seen their positions deteriorate despite their high productivity growth (non-metals, textiles, wood). The reason is likely to be that, in these industries, which all share a low technology content, competition has become at the same time quite cost oriented and very tough. Maybe it is extremely difficult to do better in these products given current world competition. The figure also shows that other industries have their productivity gains and competitiveness more aligned (food and paper for good, vehicles for bad).
In summary, Catalonia seems to have a quite small fraction of very dynamic exports of goods with a high technical content and a shrinking but still bigger fraction of goods of low technological content subject to tough cost competition. In the middle, exports tend to be concentrated in medium-high technological goods whose export dynamism has been heterogeneous. Some cases seem to point to a competitive effort in product characteristics that has overridden the evolution of productivity and hence cost. In other cases, an increase in the trade deficit accompanied by a low productivity performance seems to point directly to a deterioration of the competitive position of firms.
4. Firms' Strategies to Enhance Competitiveness Once productivity and revealed advantages have been described, it seems natural to check the evolution of firms’ strategies for enhancing competitiveness. Genescà and Salas (2007), henceforth “GS", perform an analysis of the competitiveness of Catalan firms over the period from the mid-1990's to the early years of the new millennium. They mostly use firm-level data from the ESEE (Encuesta Sobre Estrategias Empresariales)5 because it is the only source that allows them to follow and compare a wide range of strategies over time. In what follows, I adapt their analysis to an enlarged ESEE sample that covers the period 1990-2006.
4 As the available industry breakdown is finer for commercial advantages than for productivity growth, I attribute the same productivity growth to different subsectors of a given industry.
5 The “Encuesta Sobre Estrategias Empresariales” is a firm-level survey of Spanish manufacturing, sponsored by the Ministry of Industry, who started to collect data in 1990.
6 - IESE Business School-University of Navarra
In the competitive environment of the 1990's, after the full integration of the Spanish and Catalan economies into the EU, firms had to adapt their strategies to compete in a highly open and competitive environment. It is true that a few macroeconomic events helped firms to sustain competitiveness after the crisis of 1993, such as the devaluations of 1993 and 1995, but firms struggled to restructure their activities and reshape their instruments of competition, as GS and the data that follow clearly show. I am going to examine how macro facts and firm actions resulted in some key changes. I will briefly consider the evolution of firms' costs and profitability, actions to differentiate their products, investments in human capital and adoption of technology. The analysis of innovative activities is left for the next section. Table 6 first presents details on the evolution of the sample of Catalan firms and then shows a comparison in the final year (2006) with other subsamples.6
We use an unbalanced panel sample including more than 4,000 firms in total, subdivided into three subsamples: Catalonia, the rest of Spain and, a subset of the latest sample, Madrid. Statistics are always given separately for firms with fewer than 200 workers (small firms) and 200 or more workers, as the ESEE design requires. A firm is ascribed to Catalonia or Madrid if half or more of the industrial employment (in the given year) is located in the corresponding autonomous community.7 Appendix A explains the previous checks carried out with the whole ESEE sample to ensure the soundness of the numbers and summarizes the characteristics of the particular sample used in the exercise as well as the definition of the variables. The subsample numbers are reported in Table A1, which also reports the average size as given by the number of workers, the investment per worker, the proportion of exporters and the intensity of exports. The average size of small and big firms does not show acute differences across subsamples and the most notable difference is the much bigger and increasing proportion of exporters among small Catalan firms. The composition by industries of the samples of Catalonia and Madrid is given in Table A2. Catalonia shows a much higher proportion of firms in food, textile and chemicals; Madrid in paper. A note of caution in analyzing the results: the (not reported) high variance of the estimates should be taken into account not to exaggerate small differences.
Profitability of firms increased rapidly during the 1990's from negative values to a sensible positive profitability, as the estimation for the return on assets minus the opportunity costs of GS with CB data showed (Central de Balances del Banco de España). This is the same as our data on price cost margins and cost of funds show, extending the improvement in profitability until 2006. Price cost margins tend to be remarkably stable over time years and quite similar for all firms (by size and subsamples). But the yearly cost of funds, which is based on the data reported by firms on the current nominal rates paid for the debt with cost, shows a continuously decreasing trend. The evolution of the rate of profitability can be roughly assessed by multiplying the price cost margin by an average estimate of the sales/assets ratio (1.5-2, say) and subtracting a conventional depreciation rate (0.10, say) and the cost of funds. Profitability is likely to have evolved from values around -6/0 to values about 4/10.
6 Although the sample data start in 1990 I prefer to report statistics from 1991. The first year survey results are affected by a few non-comparabilities which can distort the homogeneity of some series over time.
7 A comparison of many firm-level variables, partly in 2005 and partly of the evolution 1995-2005, also performed with ESEE data, can be found in the document Generalitat de Catalunya (2008). Unfortunately, this study uses too loose a definition of a Catalan firm, taking as Catalan any firm that has an industrial establishment in Catalonia.

IESE Business School-University of Navarra - 7
Furthermore, labor unit costs show stability for small firms and a continuous sharp reduction for big firms in both cases despite the increase of nominal wages over time. Therefore, behind the sound profitability, both capital and labor costs show a sensible evolution, which seems to exclude cost-related shocks such as constraints to competitiveness. The devaluations may have helped additionally to transform these costs into particularly competitive prices in foreign markets, but it would be an exaggeration to attribute the good export behavior simply to this fact.
There is an effort to improve the penetration of products through differentiation, and the data seem to show that it has been greater for small firms. There is a reduction of the number of firms that identify their products as standard over time, important in the case of small firms and probably more modest for big firms. And there is a significant increment of the proportion of small firms that advertise their products (without a similar trend in the big firms). Advertising intensity may be considered roughly constant over time for small and big firms, with the latest doubling the proportion of revenue spent on advertising.
The two indicators of firm efforts to improve human capital show a continuous increase. There is a change at the beginning of the new millennium in the number of firms that use temporary contracts and especially a big change in the proportion that this type of contract accounts for in the employment of the firms that use them. It is true that changes in the regulation of this type of contract triggered these changes, but this does not render the firms' reaction less significant. In addition, there is a continuous increase in the number of small firms that employ graduates and a remarkable increase in the proportion of graduates employed in all firm types. Notice, by the way, that the proportion of graduates is roughly the same for small and big firms.
Adoption of new technology is an indicator of how rapidly firms adapt to the new market improvements available for technological processes. They give a measure of how updated and technologically sophisticated a firm may be considered, but it is not a direct measure of its innovation efforts or innovativeness (innovation indicators are explored in the next section). These indicators show a relatively quick pace of adoption, more pronounced in the case of the smallest firms, which start from more modest and heterogeneous values (more use of digitally controlled machine tools and fewer robots). Nothing indicates that this adoption effort may be insufficient.
The main message resulting from the comparison of strategies of Catalan firms with non-Catalan and Madrid firms is that there are no dramatic differences. There are, of course, some different values and, in general, Catalan firms more closely resemble the subset of Madrid firms. For example, it is clear that firms in Catalonia and Madrid pay higher wages, although Catalan firms show slightly lower unit labor costs. Catalan firms of all sizes also seem more advertising-intensive and less prone to temporary employment. Small firms use more skilled labor and show slightly higher levels of technology adoption. But most of the differences are likely to be more related to the composition of the samples and sampling variance than to differing strategies. This is also the conclusion when one looks at the variable values over the entire period, despite additional noticeable differences.
To summarize, costs, product differentiation, investment in human capital and new technology adoption seem to have followed positive paths that should have been able to enhance productivity and competitiveness. This pattern shows a significant reduction of capital and labor costs, a quick adoption of new available technology, a clear investment in the human
8 - IESE Business School-University of Navarra
capital attached to firms and a positive, although slightly less pronounced, change in the effort for product differentiation. One critical dimension of firms' efforts is still left: innovative activities. A brief global look at these activities is the object of the next section.
5. Innovation Activity They are just the indicators of R&D and innovation activity of firms which show the most critical values for Catalonia and Spain, especially when they are compared with the values reached in other European countries.8 This is why there is a broad consensus on one of the main reasons for the slowdown of productivity and the competitive problems of Catalan and Spanish firms (for Catalonia see, for example, the recent Busom collective evaluation, 2006; the Busom and Garcia-Fontes chapter, 2007; or the Fernández and Montolio document, 2006).9 Let me briefly summarize the main facts, with a particular stress on the activities of the firms. I will expand the evidence on those activities using the sample presented in the previous section.
The efforts on R&D and innovation have, in fact, continuously increased in Catalonia and Spain since the mid-1990's, however they are measured (in terms of inputs or outputs), but their levels remain clearly far from the levels reached in comparable European countries and regions. Table 7 shows the evolution of the most used indicator, R&D expenditures as a percentage of GDP, until the latest year for which there are comparable data for all the instances of interest. Innovation expenditures show a similar pattern. Catalonia shows higher levels of relative expenditure than Spain as a whole, which has evolved in parallel, but the effort still remains far from the indicators for the EU-15 and even the EU-25.10 This expenditure indicator also seems to suggest a better position of Catalonia in privately financed R&D and a better position of Spain in publicly financed R&D.
Obviously, R&D expenditures as a percentage of GDP is only an aggregate indicator, the analysis of whose values should be accompanied by an exhaustive exploration of all environmental factors that may determine the development of innovative activities and their efficiency: infrastructures, science system, human capital, degree of competition, regulation (with special emphasis on the aspects of firm creation and the treatment of failures), and public support. Spain – and especially Catalonia – may lag in some infrastructures, the science system may be evolving only slowly into “excellence” and industry-oriented systems, and regulation of industry entry and exit shows much rigidity in practice, but the degree of competition has sharply increased, human capital seems quite developed in many aspects, and public support (subsidies, fiscal advantages) apparently constitutes one of the most generous systems, albeit quite uncoordinated (on all of this, see Busom, 2006). None of these factors in isolation nor the combination of them seem to provide a clear explanation for the weakness of the firm- level activities.
8 For example, the European Innovation Scoreboard 2006, using an index based on 7 indicators referring to 2003, and considering 208 European Regions, assigned the 82nd position in the ranking to Catalonia (after the Spanish regions of Madrid, the Basque Country and Navarra).
9 Additional descriptive evidence can be found in ACC1Ó CIDEM/COPCA (2008).
10 Busom (2006) contains a comparative analysis with other comparable European regions, and the conclusion of this analysis is a lower Catalan effort.

IESE Business School-University of Navarra - 9
The European innovation data allow for some detailed comparison of the activities of Spanish firms with the activities of firms in similar European countries.11 Let me briefly summarize some results from a comparison at the beginning of the new millennium with the manufacturing firms of France, Germany and the United Kingdom. Spanish firms combine different activities (intramural R&D, subcontracted R&D, technological payments) heterogeneously, as happens everywhere, with an important difference in the level at which these activities are performed. The proportion of firms that undertake innovative activities is clearly lower than in any other country, and the occasional performers are more numerous. The levels of expenditure relative to sales or innovation effort of firms that perform innovative activities are also low. The structure of the industry plays a minor role in that it is industry to industry where the proportion of firms with R&D employment is lower and the expenditure efforts are smaller. Strikingly, the number of innovations that firms get from these activities, measured by the proportion of innovators, seems roughly similar to the number obtained in other countries, but there is a much lower propensity to patent the innovations. Technological cooperation is clearly weaker than in the rest of the countries. These traits seem to have hardly changed since then.
Table 8 provides some firm level indicators of R&D and innovation activities that come from the ESEE sample. This time the table includes comparable time data for the three subsamples: Catalonia, the rest of Spain, Madrid. The table reports the proportion of firms with R&D expenses, the intensity of such expenses for the performing firms, and the proportion of firms introducing process and product innovations each year. It is worth noticing that the R&D effort of the smallest performers tends to be systematically higher than the effort of the corresponding big firms. This is a sign of the importance of the set up and fixed costs associated with innovative activities, reflected heavily in the relative expenditures of the firms with relative small-scale sales (see, for example, González, Jaumandreu and Pazo, 2005).
The table reflects a couple of worrying trends, which have affected all firms. Firstly, it seems true that effort has tended to decrease since 2000, at least in the big firms, and that the proportion of R&D performers seems at best stabilized. Secondly, the proportion of firms introducing process and product innovations has also tended to decrease quite consistently this decade.12 The reasons for this lack of dynamism of R&D investments and outputs in a period of high growth of firms' sales constitute a puzzle, especially taking into account the state of weakness of innovative activities and the symptoms of productivity and competitiveness effects.13
11 However, there have been only a few international comparisons that exploit these data. Abramovsky, Jaumandreu, Kremp and Peters (2004) is a comparison of some firm-level indicators for 2000 in France, Germany, Spain and the United Kingdom, based on the elaboration of CIS3 data contained in IEEF (2004). Cotec (2004) discusses the comparison results. García-Fontes (2006) also includes some comparisons based on CIS data for 2003.
12 Huergo and Moreno (2006), in a regression analysis up to 2002, already picked up some of this inflection by means of time dummies. But the ESEE sample, which started a process of deterioration just at this time, has made it difficult until now to distinguish if this was a true underlying trend or a data problem. Of course more research on this point is highly desirable.
13 It is true that high sales may be part of the explanation, i.e., R&D has not grown at the same pace as sales and this implies a lower effort. Also a slight decrease of effort has characterized many European countries since the beginning of the current decade. In Catalonia and Spain the strangest thing is that this happens despite the low initial level of effort.

10 - IESE Business School-University of Navarra
The table also reflects at least three important facts from the point of view of Catalonia firms' activities. First, the proportion of firms with R&D expenses is higher in Catalonia than elsewhere and much higher in the case of small firms (in particular compare the proportion of firms with R&D expenses in Catalonia and Madrid). Second, the average R&D effort of Catalan firms is, however, unequivocally smaller than the effort of the Madrid performers in the case of big firms and even lower than the effort of the firms of the rest of Spain in the case of small firms. Third, Catalonia does not seem to be an exception to the stagnation of effort and the diminishing introduction of process and product innovations, which remain slightly higher for Catalan firms.
In summary, efforts in R&D and innovation have continuously increased in Catalonia and Spain since the mid-1990's but their levels remain clearly far from the levels reached in comparable European countries. The proportion of firms that undertake innovative activities is lower, the occasional performers are more numerous, the innovation efforts of firms that perform innovative activities and technological cooperation are low as well, and none of this is explained by an industry composition effect. Firms seem to produce innovations at a significant rate but there is a much lower propensity to patent the innovations. Two worrying trends have recently affected all firms: effort has been at best stagnant during the first decade of the new millennium, and the proportion of firms introducing process and product innovations has tended to decrease.
Catalan firms have enjoyed an advantageous position until now, both in the number of firms performing innovative activities and in the introduction of process and product innovations, but in a context of weak general activity. And this is accompanied by a much lower innovative effort in the firms that perform these activities, perhaps in part because of the particular composition of activities. In any case, Catalonia also shows signs of a lack of dynamism during the first decade of the new millennium.
6. Support of Innovation In all developed countries, governments adopt an active role in the stimulation of innovation. In particular, public policy channels significant amounts of money towards reinforcing innovation activities of firms. There is a practical reason, the widespread conscience of the importance of innovation for growth, and there is an economic justification, as well: the positive impact R&D investments have on welfare greatly surpasses their cost, but only a small part of this positive impact is appropriable privately in the form of revenue. Hence, private investments tend to be suboptimal. There are two main forms of public support of innovative activities, subsidies to the firms that apply for them at the relevant agencies, and fiscal advantages, in principle available to any firm with accounting expenses on innovation. There is an increasing body of literature that has taken seriously the task of understanding and evaluating the effects of these programs; something important given the desirability of their presumed impact and the level of expenses involved (see Jaumandreu, 2007).
Do these incentives stimulate investments by firms? Getting a convincing answer to this question is a difficult task because of the many methodological problems involved. Firms granted by agencies are generally doubly selected: they autoselect themselves at the time of applying and they are then selected by agencies. In addition, the funds that they receive are likely to be highly correlated with their ability to perform innovation. It is then very difficult to
IESE Business School-University of Navarra - 11
argue that one has been econometrically able to separate the additional R&D done in response to support from the extra support just obtained because the firm is especially able. In fact, many international studies using supposedly up-to-date methodologies get suspiciously high effects of subsidies that are likely to be the effect of endogeneity problems. Similar problems appear in the analysis of the role of tax allowances.
Spain and Catalonia share a fiscal system that tries to provide incentives to innovate, especially after the significant reform introduced at the end of the 1990's, and a set of subsidies available to firms through different state and autonomous community agencies. Fiscal advantages and exemptions, as well as subsidies, are costly policy instruments, and countries engage in recurring debates on their effectiveness and hence desirability. The Spanish economic authorities, for example, have recently expressed their intention to reduce a big part of the current fiscal allowances in the near future. The main questions involved in the assessment of the economic support of innovation are whether firms are really stimulated to undertake research projects that would not have been undertaken in its absence, how important these effects are, and whether the policy instruments are adequately designed and work efficiently enough to achieve the potential effects. I am going to briefly summarize the Spanish evidence on these points, treating the impact of subsidies first and then the impact of tax allowances.
In Spain, Busom (2000), with firm-level data from the CDTI agency, gave only a partially positive answer to the primary question, suggesting replacement of private funds (“crowding out”) for a high fraction of subsidies. More recently, González, Jaumandreu and Pazo (2005), in a study carried out with ESEE data, which describes the state of Spanish subsidies during the 1990's, try to answer the same question. They use a tighter theoretical model, including set-up costs of R&D, and highly sophisticated econometric methods. Subsidies are allowed to have effects in two dimensions: the stimulation of expenses by firms that otherwise would not incur R&D investments, and the enlargement of the investments of firms that would have carried them out in any case.
The study measures both actual and potential effects. On the side of actual effects it finds: 1) that R&D expenditures of some fraction of small firms are actually dependent on subsidies, in the sense that these firms would stop performing R&D in the absence of them; 2) no "crowding out" or substitution of public funds for private funds, and even a (modest) increase in the private expenses that the firm had dedicated to the investment in the absence of subsidies. A complementary significant estimate is that, according to the current practices, a high proportion of subsidies go to firms that would have performed the innovative activities anyway. This is probably only the result of a proper selection of applicants with strict risk aversion practices, but suggests an important neglect on the part of public policy towards the inducing dimension of public support.
On the side of potential effects, the study estimates some counterfactuals: 1) almost half of the non-performer large firms could be induced to do so if they received financing of 10% or less of the likely expenses they would incur; 2) significant fractions of small non-performing firms could also be induced to perform R&D by funding slightly higher percentages of their expenses. The suggestion is, therefore, that current public expenditures could be both usefully enlarged and used more efficiently.
A striking fact, which affects fiscal allowances, is that a significant number of the firms “ignore” and/or do not apply the possible fiscal deductions for their innovative activity (see Corchuelo and Martínez-Ros, 2008). This phenomenon is especially extended among the

12 - IESE Business School-University of Navarra
smallest firms. The word “ignorance” is likely to reflect the lack of serious interest in applying and lack of interest in the details more than ignorance of the deductions. The “know but do not apply” answers probably reflect a more careful consideration of the pros and cons. Expert evidence as well as the work quoted above suggest that many firms anticipate that the costs of participating would be higher than the implied benefits. Small and medium firms are likely to be deterred by the costs of formalizing the accounting needed to access the support, including the necessary matches between engineers and accountants to define innovative expenses, barriers to be added to the start up and fixed costs of innovative activities.
An econometrically sensible evaluation of the effects of tax allowances during the 1990's is Corchuelo (2006). The study is cast in the traditional approach of evaluating the elasticity of R&D investments with respect to the cost of capital; this variable embodying the tax reductions. The study takes into account the likely double effect of the incentives: the effect on the decision of performing R&D and the effect on the effort, trying to give account of the endogeneity problems. It finds a positive effect of the expected reductions in the cost of capital in the decision to start the innovation activities. And it calculates an elasticity of the R&D effort with respect to the cost of capital bigger than unity, which increases with the presence of firm liquidity constraints. There are still no studies using more recent data which use the suitable econometric tools for this type of assessment.
In summary, both tax deductions and subsidies seem to have played a role, even if modest, in the stimulation of R&D investments. The reasons for the weak results seem to lie in their cost of implementation in the case of fiscal deductions, and their conservative application in the case of subsidies. Studies point out that there is a role for the increase of resources dedicated to such policies as well as for a more efficient application of the incentives involved.
7. Innovation, Productivity and Competitiveness: A Look into their Links Let's perform a few exercises with recent data to assess the current links between these three variables. These exercises take advantage of the recent release of a new firm-level database for innovative activities (PITEC). The data come from the combination of the old R&D and Innovation-specific surveys conducted by the statistical office INE. It is being consciously constructed as a panel database, and includes an enormous amount of information related to the innovation activities perfectly comparable with the microdata on the innovation of many other European countries. The total sample consists of several subsamples, from which the most important are the subsample of firms with 200 workers and more, and the subsample of firms of any size performing R&D. Both subsamples have quite a broad coverage. I use the recently released data for the period 2003-2006 (see details in Appendix B). This gives a total sample of almost 10,000 firms and more than 33,000 observations with an important overrepresentation of firms with innovative activities but with a significant fraction of non-performers, too (about 15%).
Recall from the introduction that the exercises address three questions. The first and very basic is: does innovation activity really impact the productivity of the firms and by how much? The second refers to the geographical location of the activities: does the geographical location of the innovation activities affect their productivity? Third, increased productivity means lower costs, but this is only one of the ingredients for competitiveness. The following question concerns what we can say about the relationship between innovation and revealed

IESE Business School-University of Navarra - 13
competitiveness, taking into account both the impact of innovation on cost (productivity) and the firm's efforts for product innovation.
7.1. Innovation and Productivity
Measuring the impact of innovation expenditures on productivity has been a standard exercise since Griliches (1979) introduced the basic framework. The production function (usually a standard Cobb-Douglas function) is augmented in an input which represents the efforts made by the firm to increase the relevant information, the “knowledge capital”. Knowledge capital is usually computed from the accumulation of R&D/innovation expenditures over time, conveniently depreciated as they relate to earlier moments of time. The impact of this “capital” gives us the measure of the impact of innovation in multifactor productivity (productivity once the contribution of all the other factors is taken into account). Two recent trends depart from this tradition. First, as direct information on outputs of innovation have become available (innovation counts, patents, etc.), researchers have started the use of more complex modelizations in which innovation expenditures enhance innovation outputs and innovation outputs influence productivity. See Griffith, Huergo, Mairesse and Peters, 2007, for a nice example.14 Second, researchers have started to relax the strict assumptions on linearity and certainty which characterize the knowledge capital model, allowing for more general impacts of innovation measurable in the context of the recent advances for the estimation of production functions (see Doraszelski and Jaumandreu, 2007). Here I am going to use the simplest version of the old modeling as a quick legitimate way to assess the impact of innovative expenditure.
Let's measure multifactor productivity by a Cobb-Douglas function in logs, including firm-level physical capital and labor, splitting multifactor productivity into two parts: firstly, the part attributable to influences other than innovation activity, picked up by industry deviations with respect to the constant and time evolution of productivity with respect to the first year;15 and secondly, the part attributable to innovation as picked up by the coefficient representing the elasticity of output with respect to “knowledge capital” multiplied by the value of the log of this capital. That is, let the production function be
y = consM + consS + industrydummies + timedummies + αk + βl + εc + u
where the small letters y, k, l and c represent natural logarithms of output, capital, labor and “knowledge capital”, respectively; consM and conss are constants for manufacturing and services, and u is an uncorrelated disturbance.
As there is no information on materials, the materials/sales ratio is assumed to be constant (and absorbed by the relevant constant) and the elasticities should be interpreted as value-added elasticities. K and C, the two capitals, are constructed for each firm by cumulating the corresponding investments (physical investment, innovation expenditures), starting from a presample capital estimate and using a depreciation rate equal to 0.1. The presample capital is constructed by assuming that the firm has always been investing at a rate equal to the average
14 An extension of this approach consists of measuring the impact of innovation on other firm outcomes. Harrison, Jaumandreu, Mairesse and Peters (2008) find important positive effects of innovation on firm employment.
15 Below we include another variable in the regression and this set.
14 - IESE Business School-University of Navarra
rate that is observed. This is a particularly rough approximation in the case of C but it is known that estimations are not very sensitive to this type of computation. We only use firms observed for at least two years, i.e., the unbalanced panel consists of firms with 2, 3 or 4 time observations. I include 29 industry dummies for the manufacturing industries and 20 for the services industries.
Table 9 shows the results of the estimation. The production function coefficients look sensible even if the relative magnitude of labor and capital coefficients could probably be balanced by treating endogeneity. Returns to scale seem to be constant in manufacturing and somewhat decreasing in services. Productivity results are not likely to be very sensitive to these aspects of the estimation.
When the entire sample is used (regression 1), the elasticity of C looks small. When only performers are included, the elasticity is multiplied by 3 (regression 2). This just happens because of the exclusion of non-performers in regression 2 (less than 15% of the sample). It turns out that non-performers tend to have a surprisingly bigger productivity than performers, even if innovation expenditures clearly enhance the productivity of performers. Regression 3 improves the estimate of the elasticity by finding and including a partial explanation for this fact in the equation. Non-performers that belong to a group of firms (firms are asked in the survey if they belong to a conglomerate of firms) show a high “unexplained” productivity. This shows how important it is to be careful at this firm-level analysis: forms of vertical integration of firms can produce levels of productivity as high as own innovation expenditures give, only apparently unrelated to innovation. The reason for this productivity is probably the “level of innovativeness” of the “parent” firm. Regressions 4 and 5 show the results for performers in manufacturing and services. The role of innovation in enhancing productivity seems even higher in services than in manufacturing.
The main lesson that can be drawn from this first exercise is that innovation expenditures and activity strongly influence total factor productivity. Even controlling for detailed industry-level productivity effects, products of firms show a high elasticity with respect to the R&D expenditures embodied in the “knowledge capital of the firm”. This elasticity is similar or even higher than the elasticity with respect to physical capital. One can argue that a better control of endogeneity (i.e., the reverse relationship by which we should expect higher R&D investments in the most productive firms) could modify the specific value of this coefficient, but the result is by no means important and aligned with the results of more refined estimates.
7.2. The Geographical Location of Innovation
Given a criterion and enough data, it seems relatively easy to establish the “nationality” or “multinationality” of a firm. We can alternatively look at the nationality and relative shares of the shareholders, the country where the headquarters are located, the composition of the board of directors, etc. It is much less easy to give a location where knowledge is produced. Innovative knowledge seems to come in a big part from spillovers of others' innovative activities, even if the absorption of these spillovers needs specific activities and expenditures. Spillovers can travel long distances, but they seem to be clearly reinforced by the proximity of similar innovative activities or, more generally, the accumulation of innovative resources. A recent paper by Griffith, Harrison and Van Reenen (2006) has shown that those United Kingdom multinationals that locate some R&D activities in the United States in order to gain access to spillovers from a more advanced technological environment show a higher total factor

IESE Business School-University of Navarra - 15
productivity. Literature has suggested that location of R&D activities is strategic and has called the action of looking for favorable environments “sourcing”.
Unfortunately, we have no detailed data on the firm's world location of establishments or even on the dependent relationships of parent companies that can have a similar effect. A crucial input for the assessment of innovativeness of firms with location of part of their production in Catalonia would be to know the extent to which they can enjoy some sourcing around the world. We have some data on the location of the R&D activities of firms throughout Spanish territory. Hence, we can try to assess the presence of spillovers at this limited level. This is important because it can give us a much broader idea of what we need to understand by innovation as a source of productivity. Let's consider a model in the Griliches (1986) tradition by which the previous “knowledge capital” framework can be extended to ask whether different types of R&D (private vs. federal, or basic vs. applied) are equally “potent” in generating productivity growth. In particular, let's consider the following effective “knowledge capital”
C* = C0 + CC (1+ δ + δM sM ) + CM (1+ δ + δC sC )
where Cc represents expenditure located in Catalonia, CM expenditure located in Madrid and Co
expenditure located elsewhere, and the s's stand for shares of expenditure, i.e., with
. The idea is that innovation activities located in Catalonia or Madrid have an
extra impact on productivity, presumably because of the concentration of spillovers in these
two places. But, in addition, a firm locating expenditures in both places at the same time is
likely to enjoy mutual spillovers from the activities.16 We have
lnC* ≈ lnC + δ(sC + sM ) + (δC + δM )sC sM
and the model can be tested by including the sum and the product of the firm expenditure shares in Catalonia and Madrid in the regression.
Of course the model is too simple and, in the absence of different costs, the optimal location of a firm with innovation activities in Catalonia and Madrid would be to split them half and half.
An interesting alternative would be to consider the enlarged model with a term in sCαsM
1−α, but
this is left for future research.
The data include the detailed distribution of R&D personnel across autonomous communities, so we are going to split C according to the proportion of R&D in each location. In the global sample, there are 29.5% observations with R&D employment in Catalonia, 15.8% in Madrid and 59.6% elsewhere. Therefore, Catalonia and Madrid together concentrate 45.3% of the observations of R&D employment. About 73 firms (281 observations) show simultaneous R&D employment in Catalonia and Madrid.
Table 10 summarizes the results. There is an enormous difference of performing innovative expenditures in Catalonia, Madrid or elsewhere. The impact of innovation expenditure doubles if expenditure is performed in Catalonia or in Madrid (regressions 1 and 2). But, in addition, there is evidence of mutual spillovers from performing expenditures in the two places at the
16 An alternative, quite similar model, can be obtained by replacing sC and sM with CC and .MC
sC = CC
C C = C0 + CC + CM

16 - IESE Business School-University of Navarra
same time (regressions 3 and 4). Estimates are not very precise because of the small number of observations and, perhaps, the roughness of the model. But the evidence seems incontestable. One could perhaps argue that it is not fully structural, in the sense that we do not know which part should be attributed to the most productive firms choosing to locate R&D activities in both places. But any model for this should just start by recognizing the incentives to do that.
To summarize, there are enormous geographical differences in the productivity impact of innovation. The impact of innovation expenditure doubles if expenditure is performed in Catalonia or Madrid and there is evidence of mutual spillovers from performing expenditures in the two places at the same time. The general lesson is that R&D activities can have a very different impact on productivity according to its location, presumably due to spillovers, and that firms' sourcing (strategic location decisions to absorb spillovers) may be important in enhancing productivity. In particular, although we have no direct data to test for the relevance of international outsourcing, our evidence on geographical spillovers at the state level suggests that the weakness of this aspect may determine a negative impact on the productivity of Spanish and Catalan firms. One may also ask why, given the evidence of spillovers, the number of firms with simultaneous activities in Catalonia and Madrid is not higher.
7.3. Does Innovation Reinforce Competitiveness?
Is innovation related to competitiveness and, if so, to what extent? We can try to obtain some insights on this question by performing a simple exercise that relates the exports of firms to the innovation effects estimated in the previous equations. I am going to suppose that any productivity and hence cost advantage is a price advantage (this can be a strong assumption because firms may use productivity advantages to keep prices higher). From the first exercise, we can construct an estimate of the percentage cost advantage of each firm not related to innovation (non-innovation cost advantages) and an estimate of the percentage cost advantage of each firm that may be attributed to innovation (innovation-related cost advantages).
I construct them as the predicted values of expected total productivity conditioned in the non-innovation-related and the innovation-related variables, respectively. In the first conditioning set, we mainly have the industry and time dummies. In the second set, we have knowledge capital and spillovers. Both advantages are measured in percentage points with respect to the mean and with respect to the absence of innovation, respectively. We can presume that exports are related to these two types of advantages and, in addition, to the attractiveness of products reached by means of product innovation. I am going to see how far a model relating the exports of the firms to these three variables goes. Specifically, I use the model
Exports = exp(β0 + β1Non − innovationc.a.+ β2Innovation − relc.a.
+β3 productInnovationdummy + β4 lnSize + u)
where β1 and β2 coefficients can be interpreted as semi-elasticities, which measure how many percentage points of increase in exports we get by one additional percentage point in the measured advantage. Product innovation is a dummy and hence β3 directly measures the
E(y −αk − βl − cons)
IESE Business School-University of Navarra - 17
average percentage increase in exports attributable to the presence of product innovation.17 The regression also includes a variable to control for the size of the firm (the logarithm of the number of workers). Its coefficient β4 is simply an elasticity. Regressions are carried out in Manufacturing, where exports are important and best defined.
Regression 1 of Table 11 differs a little from the model above and is mainly carried out to check the consistency with the results in Cassiman and Golovko (2007). I estimate a simple model of linear probability for exporting where the coefficients should be interpreted as giving the increase in the probability of exporting associated to each variable. Results tell us that there is a high association between innovation activities and propensity to export. The probability of exporting for firms that have recently carried out product innovations is 9% higher. Similarly, the coefficient on the innovation-related cost advantages allows us to compute that 9% is also approximately the additional probability for firms that have an R&D-related cost advantage of about 40%.
Regressions 2 to 5 of Table 11 present the results of the above model. They firstly show that all cost advantages together with product innovation explain a big proportion of the variance of exports (around 50%). The innovation-related cost advantages have an important impact on exports, much stronger than non-innovation cost advantages. Additionally, firms with product innovation tend to have, on average, 24% more exports. When both innovation-related cost advantages and product innovation are included together, the impact of product innovation tends to become smaller and non-significant. This probably means that, conditional on exporting, firms increase exports mainly through the cost advantages embodied in their products, even the innovative products.
The interaction of the main model parameters with a dummy indicating R&D activities located in Catalonia seems to say that the relevant model is not very different for Catalan firms. It can be said, however, that Catalan firms seem to rely somewhat less on the non-innovation related advantages.
To summarize, cost advantages, cost advantages related to innovation, and product innovations all explain significant portions of variance of exports across firms. The advantages of product innovations, however, tend to fade when included at the same time as the measured cost advantages acquired through innovation. This suggests that successful product innovations of the firms that export have been associated with simultaneous process innovations that improve the cost of the products. At the same time, cost advantages linked to innovation have a bigger impact on exports than any other cost advantage.
8. Conclusions The current level of innovation expenditure is comparatively low and shows signs of lack of dynamism. This sharply contrasts with the apparent effort of firms to become more competitive, and may have consequences on the evolution of productivity and competitiveness. Perhaps the explanation is that firms have felt comfortable for some time in an equilibrium characterized by
17 I only consider the product innovations of firms larger than 20 workers; product innovation of the firms with fewer than this number of workers seems to show some anomalies.

18 - IESE Business School-University of Navarra
a mild technological content, a pattern of world intra-industry specialization, which required only modest innovation. Only a small proportion of firms are in activities of a high technological content. In addition, many commercial partnerships developed after full European integration may have allowed exports to develop based on the specialization of Catalan and Spanish firms in applying the other's technology more than developing it. This may well explain why there is even a fringe of firms that, as of today, do not even feel the need to innovate. Finally, the available resources and cumulated ability may have also favored process innovation over product innovation, and even small product developments not worthy of patenting.
Despite this, Innovation expenditures are found to have a big impact on productivity and competitiveness. Cumulated R&D expenditures determine a big part of productivity and hence cost advantages of firms. R&D activities of firms seem to access intense spillovers when located in the geographical places that concentrate innovative activities. And product differentiation as well as cost advantages impact competitiveness, explaining a big part of the differences in firm exports. This reinforces the idea that the present equilibrium is far from exploiting all the impact that investment in innovative activities may have.
The incentives to switch from the current situation to the requirements of the coming years will for sure come from market pressure but can also be reinforced by a conscious support of the activities oriented in the right direction. Catalonia needs more firms oriented to activities of high technological content; innovation activities of firms oriented to more radical and patentable innovations and an extra effort in the development of new products and differentiated products without abandoning the constant innovation in process. There are several ways to achieve that, and the role of the environmental system of science-technology is important. But one key is the development of a fraction of firms equipped with the will to become international players that actively practice “sourcing” at the best international sources of technology with the aim of reinforcing their own developments. Coordination of efforts and absorption of spillovers at the state level is also a step towards this. Economic policy should be able to support all this actively, keeping help available for any innovative activity but also actively making more ambitious specific projects cheaper despite their risks. Sensible proposals would be the enlargement of funds to be allocated to support risky innovative projects, giving priority to product innovation, sourcing plans and investments abroad, as well as the transformation of the current tax reductions in a system that is much more simple and certain.
IESE Business School-University of Navarra - 19
Appendix A The “Encuesta sobre Estrategias Empresariales” (ESEE) survey is a firm-level survey of Spanish manufacturing sponsored by the Ministry of Industry. The unit surveyed is the firm, not the plant or the establishment. At the beginning of this survey in 1990, 5% of firms with up to 200 workers were sampled randomly by industry and size strata. All firms with more than 200 workers were asked to participate, and more or less 70% of all firms of this size chose to respond. Some firms vanish from the sample, due to both exit and attrition, but the two reasons can be distinguished, and attrition has remained within acceptable limits. To preserve representativeness, samples of newly created firms were added to the initial sample every year.
This survey provides the unique long-term data source at the firm level on decision variables and, in particular, data about the firms' innovative activities. At the beginning of the new millennium, the continuity of the survey was put into question and subsequent data collection went through some sampling shocks and weakened control, so they may show some relative quality problems. An obvious question is whether the results on a given variable may be considered a good representation of what happened in manufacturing or have been influenced by fluctuations in representativeness. To check that this is not the case in the variables used in this study, we proceeded as follows.
The total number of firms taking part in the ESEE survey from 1990 to 2006 is 4,357, giving an unbalanced panel with a total of 30,827 time observations. Some firms, however, do not answer specific questions. A list of basic variables was then decided (slightly longer than the list below), and the subset of observations with values for each of the variables in the list was selected. Dropping a few anomalous values, this produced a set of 4,017 firms with a total of 27,392 time observations. Two subsamples were then selected from this sample: the subset consisting of the firms that remain in the sample a minimum of 14 consecutive years (the most critical values for the continuity of the series may be the years from 2001 to 2003, always included in this selection), and the subset of firms which remain in the sample all 17 years from 1990 to 2006. The first sample consists of 436 firms and 7,078 observations (25%) and the second sample has 261 firms and 4,437 observations (16%). Both samples produced surprisingly similar patterns in the evolution of all variables with respect to the whole sample.18 This result implies that there is no apparent selection-induced difference and hence that the whole sample can be safely used for inference. If there is some bias in the results, it should be a bias determined from the initial ESEE sampling.
The total sample of 4,017 firms has been subdivided into three subsamples: Catalonia, the rest of Spain and Madrid. A firm is ascribed to Catalonia or Madrid if half or more of the industrial employment (in the given year) is located in the corresponding autonomous community. The subsample numbers are reported in Table A1, where the average size as given by the number of workers, the investment per worker, the proportion of exporters and the intensity of exports are also reported.
In what follows, we explain the variables employed to construct the means reported in the tables:
No. of workers = Average number of workers during the year.
18 The three samples also show quite a similar structure by industries.
20 - IESE Business School-University of Navarra
Investment per worker (thousand Euros) = Investment in equipment divided by the number of workers.
Proportion of firms with exports = Dummy variable that takes the value 1 when the firm has non-zero exports.
Export intensity (Exports/Sales) = Value of exports over sales.
Price Cost Margin = Value of production minus variables costs (wage bill plus intermediate consumption) over the value of production.
Cost of funds = Weighted sum of the cost of the firm values for two types of long-term debt: long-term debt with banks and other long-term debt.
Wage (thousand Euros) = Wage bill divided by the number of workers.
Labor unit cost = Wage bill divided by output.
Product is standard = Dummy variable that takes the value 1 when the firm reports that the product is standard (as opposite to specifically designed).
Sales through own sales network = Proportion of sales done through the own sales network.
Proportion of firms that advertise = Dummy variable that takes the value 1 when the firm has non-zero advertising expenditures.
Advertising expenditure over sales (0/00) = Advertising expenditures divided by sales and multiplied by 1,000.
Proportion of firms with temporary workers = Dummy variable that takes value 1 when the firm has non-zero temporary workers.
Temporary workers proportion = Number of temporary workers over total employment.
Proportion of firms with graduates = Dummy variable that takes the value 1 when the firm has a non-zero number of graduates.
Proportion of graduates = Number of graduates over total employment.
Use of digitally controlled machine tools = Dummy variable that takes the value 1 when the firm uses digitally controlled machine tools.
Use of CAD = Dummy variable that takes the value 1 when the firm uses CAD.
Use of robots = Dummy variable that takes the value 1 when the firm uses robots.
Proportion of firms with R&D expenses = Dummy variable that takes the value 1 when the firm has non-zero R&D expenditures.
R&D expenses/Sales (0/00) = R&D expenses divided by sales and multiplied by 1,000.
Firms introducing process innovations = Dummy variable that takes the value 1 when the firm reports the accomplishment of product innovations.
Firms introducing product innovations = Dummy variable that takes the value 1 when the firm reports the introduction of a process innovation in its productive process.
IESE Business School-University of Navarra - 21
Appendix B The Technological Innovation Panel (PITEC) is a statistical instrument for studying the innovation activities of Spanish firms over time. The database is being constructed by the INE (National Statistics Office), which counts on advice from a group of researchers and the sponsorship of FECYT and Cotec. The project started in 2004 and its final aim is to improve the statistical information available on firms' innovation activities and the conditions for scientific research on this topic. PITEC is designed as a panel survey, consisting of repeated observations of the same firms over time. The database is placed at the disposal of researchers on the FECYT web site, http://sise.fecyt.es/estudios. The data is available in a set of coordinated files, i.e., a file for each year (2003, 2004, 2005 and 2006 as of today) and fully documented (see, e.g., FECYT, 2007). The file corresponding to the last collection of data is added when it becomes available, and the files of earlier years could be updated due to corrections in the data. Here I am using the set of files as it was at the release of the year 2006.

22 - IESE Business School-University of Navarra
References
Abramovsky, L., J. Jaumandreu, E. Kremp, and B. Peters (2004), “National differences in innovation behavior: facts and explanations,” available at http://eco.uc3m.es/IEEF.
ACC1Ó CIDEM/COPCA (2008), Informe Anual de l'R+D i la Innovació a Catalunya, Generalitat de Catalunya.
Amarelo, C. (2006), “L'evolució del sector industrial català al llarg de la darrera dècada: productivitat i competitivitat”, Direcció General d'Anàlisis i Politica Econòmica, Departament d'Economia i Finances, Generalitat de Catalunya.
Busom, I. (coord.) (2006), “La situació de la innovació a Catalunya,” CIDEM, Departament de Treball i Indústria, Generalitat de Catalunya.
Busom, I (2006), “Catalunya en el context europeu”, in Busom, I. (coord.), “La situació de la innovació a Catalunya,” CIDEM.
Busom, I. (2000), “An empirical evaluation of the effects of subsidies”, Economics of Innovation and New Technology, 9, pp. 111-148.
Busom, I. and W. García-Fontes (2007), “Investigación, desarrollo e innovación en Cataluña,” in “Economía catalana: retos de futuro,” Generalitat de Cataluña and BBVA.
Cassiman, B. and E. Golovko (2008), “International exposure, (product) innovation and productivity in Catalunya,” mimeo, IESE.
Castany, L. and R. Xifré (2008), “Productividad, competitividad e innovación en España: Comparación internacional por sectores,” mimeo, COTEC.
Corchuelo, B. (2008), “Incentivos fiscales en I+D y decisiones de innovación,” Revista de EconomÍa Aplicada, 40, PP. 5-34.
Corchuelo, B. and E. Martinez-Ros (2006), “Aplicación de los incentivos fiscales a la inversión en I+D en las empresas españolas,” forthcoming in Hacienda Pública Española.
COTEC (2004), “Libro Blanco 2004. El sistema español de innovación.”
Doraszelski, U. and J. Jaumandreu (2007), “R&D and productivity: Estimating production functions when productivity is endogenous”, mimeo, Universidad Carlos III de Madrid.
FECYT (2007), “The Technological Innovation Panel (PITEC),” document available at http://sise.fecyt.es/estudios.
Fernández, T. (2007), “La rellevància dels mercats català, espanyol i estranger per a les empreses industrials catalanes en el període 1993-2004”, Direcció General d'Anàlisis i Política Econòmica, Departament d'Economia i Finances, Generalitat de Catalunya.
Fernández, T. and D. Montolio (2006), “R+D+I, creixement i productivitat de Catalunya en el context europeu,” Direcció General d'Anàlisis i Política Econòmica, Departament d'Economia i Finances, Generalitat de Catalunya.
IESE Business School-University of Navarra - 23
GarcÍa-Fontes, W. (2006), “Innovació i empreses,” in Busom, I. (coord.), “La situació de la innovació a Catalunya,” CIDEM.
Generalitat de Catalunya (2008), “Les estratègies empresarials a Catalunya 2005,” Departament d'Innovació, Universitats i Empresa.
Genescà, E. and V. Salas (2007), “La competitividad de la empresa catalana,” en “Economía catalana: retos de futuro,” Generalitat de Cataluña and BBVA.
Gonzalez, X., J. Jaumandreu, and C. Pazo (2005), “Barriers to innovation and subsidy effectiveness,” Rand Journal of Economics, 36, pp. 930-950.
Griffith, R., R. Harrison and J. Van Reenen (2006), “How special is the special relationship? Using the impact of US spillovers on UK firms as a test of technological sourcing,” American Economic Review, 96, 5, pp. 1985-1875.
Griffith, R., E. Huergo, J. Mairesse, and B.Peters (2007), “R&D, innovation and productivity in four European countries (France, Germany, Spain and United Kingdom),” Oxford Review of Economic Policy, pp. 483-498.
Griliches, Z. (1986), “Productivity, R\&D and basic research at the firm level in the 1970's,” American Economic Review, 76, 1, pp. 141-154.
Harrison, R., J. Jaumandreu, J. Mairesse, and B. Peters (2008), “Does innovation stimulate employment? A firm-level analysis using comparable micro data from four European countries,” mimeo, NBER WP14216.
Huergo, E. and L. Moreno (2006), “What explains the deceleration of productivity growth in recent years? Some evidence for Spanish manufacturing firms,” mimeo, Universidad Complutense de Madrid.
IEEF (2004), “Basic CIS3 statistics on four European countries (France, Germany, Spain and the United Kingdom),” available at http://www.eco.uc3m.es/IEEF.
Jaumandreu, J. (2007), “El impacto de los incentivos a la I+D: evaluación microeconométrica,” mimeo, UC3M.
Montolio, D. (2008), “El model català enfront de les darreres experiències d'èxit en creixement econòmic a Europa,” Direcció General d'Anàlisis i Politica Econòmica, Departament d'Economia i Finances, Generalitat de Catalunya.
Parellada, M. and M. Alvarez (2007), “El comercio de Cataluña con el extranjero”, in “Economía catalana: retos de futuro,” Generalitat de Cataluña y BBVA.

24 - IESE Business School-University of Navarra
Table 1 Labor productivity growth in Spain, European Union and United States 1995-2003 (average rates in %)
1995-2000 2000-2003
Spain
EU-15
United
States
Spain
EU-15
United
States
Manufacturing 1.0 2.6 2.8 1.8 3.6 7.1
Services -0.3 1.3 2.4 0.1 1.2 3.1
Economy 0.4 1.9 2.2 0.9 1.9 3.5
Productivity computed as GDP per hour of work.
Source: Castany and Xifré (2008), OCDE STAN data, Table 1.
Table 2 Labor productivity growth in Spain, European Union and United States 2000-2006 (rates and average rates in %)
2001 2002 2003 2004 2005 2006 2001-2006
Spain 0.4 0.3 0.0 -0.2 -0.5 0.2 0.1
EU-15 0.5 0.4 0.7 1.6 0.8 1.3 0.9
United States 0.8 1.9 1.6 2.5 1.4 1.0 1.6
Productivity computed as GDP per employee.
Source: Eurostat, computed from National Accounts and Labor Market Statistics.
Table 3 Labor productivity inside the EU
Source: Fernández and Montolio (2006), Eurostat and INE data, Tables 3 and 1, and Montolio (2008), same sources, Table 1.
Level wrt EU-25
Growth rate (average rate, %)
Employment growth rate (average rate, %)
1995 2000 2005 2000-2006 2000-2006
EU-25 100.0 100.0 100.0 1.0 0.6
EU-15 109.3 108.3 106.5 0.8 1.2
Spain 103.7 97.9 97.3 0.1 3.3
Catalonia 111.7 102.0 104.6 0.2 3.0

IESE Business School-University of Navarra - 25
Table 4 Labor productivity by industries in Catalonia, Spain and the EU
Level 2001-2002 (Thousand Euros)
Growth 1995-2003 (average rate, %)
Catalonia Spain EU-25 Catalonia
Food 44.3 41.9 41.6 2.4
Textile 28.4 22.7 23.6 1.8
Wood 24.7 24.8 26.6 2.4
Paper 47.0 45.8 53.0 2.4
Chemicals 74.3 72.3 84.1 0.8
Rubber and plastic 41.3 43.1 43.3 1.3
Non-metals 55.9 48.8 43.9 2.8
Metals 37.6 38.0 40.1 1.7
Machinery 41.9 41.1 46.7 1.3
Electrical goods 43.5 41.3 46.7 1.4
Transport equipment 53.0 47.7 54.7 0.5
Miscellaneous 32.1 25.4 29.8 2.6
Manufacturing 44.0 41.5 45.3 1.6
Source: Amarelo (2008), Eurostat and Encuesta Industrial-INE, Tables 4 and 9.
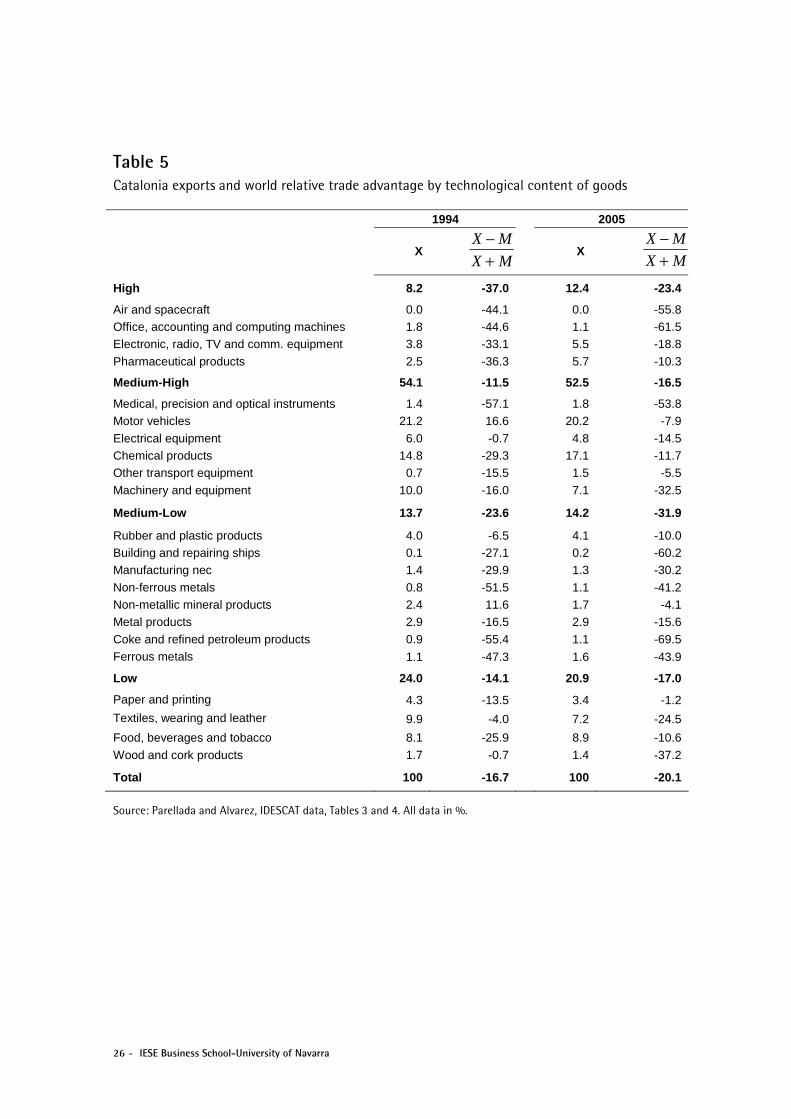
26 - IESE Business School-University of Navarra
Table 5 Catalonia exports and world relative trade advantage by technological content of goods
1994 2005
X
X
High 8.2 -37.0 12.4 -23.4
Air and spacecraft 0.0 -44.1 0.0 -55.8 Office, accounting and computing machines 1.8 -44.6 1.1 -61.5 Electronic, radio, TV and comm. equipment 3.8 -33.1 5.5 -18.8
Pharmaceutical products 2.5 -36.3 5.7 -10.3
Medium-High 54.1 -11.5 52.5 -16.5
Medical, precision and optical instruments 1.4 -57.1 1.8 -53.8 Motor vehicles 21.2 16.6 20.2 -7.9
Electrical equipment 6.0 -0.7 4.8 -14.5 Chemical products 14.8 -29.3 17.1 -11.7 Other transport equipment 0.7 -15.5 1.5 -5.5
Machinery and equipment 10.0 -16.0 7.1 -32.5
Medium-Low 13.7 -23.6 14.2 -31.9
Rubber and plastic products 4.0 -6.5 4.1 -10.0 Building and repairing ships 0.1 -27.1 0.2 -60.2 Manufacturing nec 1.4 -29.9 1.3 -30.2
Non-ferrous metals 0.8 -51.5 1.1 -41.2 Non-metallic mineral products 2.4 11.6 1.7 -4.1 Metal products 2.9 -16.5 2.9 -15.6
Coke and refined petroleum products 0.9 -55.4 1.1 -69.5 Ferrous metals 1.1 -47.3 1.6 -43.9
Low 24.0 -14.1 20.9 -17.0
Paper and printing 4.3 -13.5 3.4 -1.2
Textiles, wearing and leather 9.9 -4.0 7.2 -24.5
Food, beverages and tobacco 8.1 -25.9 8.9 -10.6
Wood and cork products 1.7 -0.7 1.4 -37.2
Total 100 -16.7 100 -20.1
Source: Parellada and Alvarez, IDESCAT data, Tables 3 and 4. All data in %.
X − M
X + M
X − M
X + M
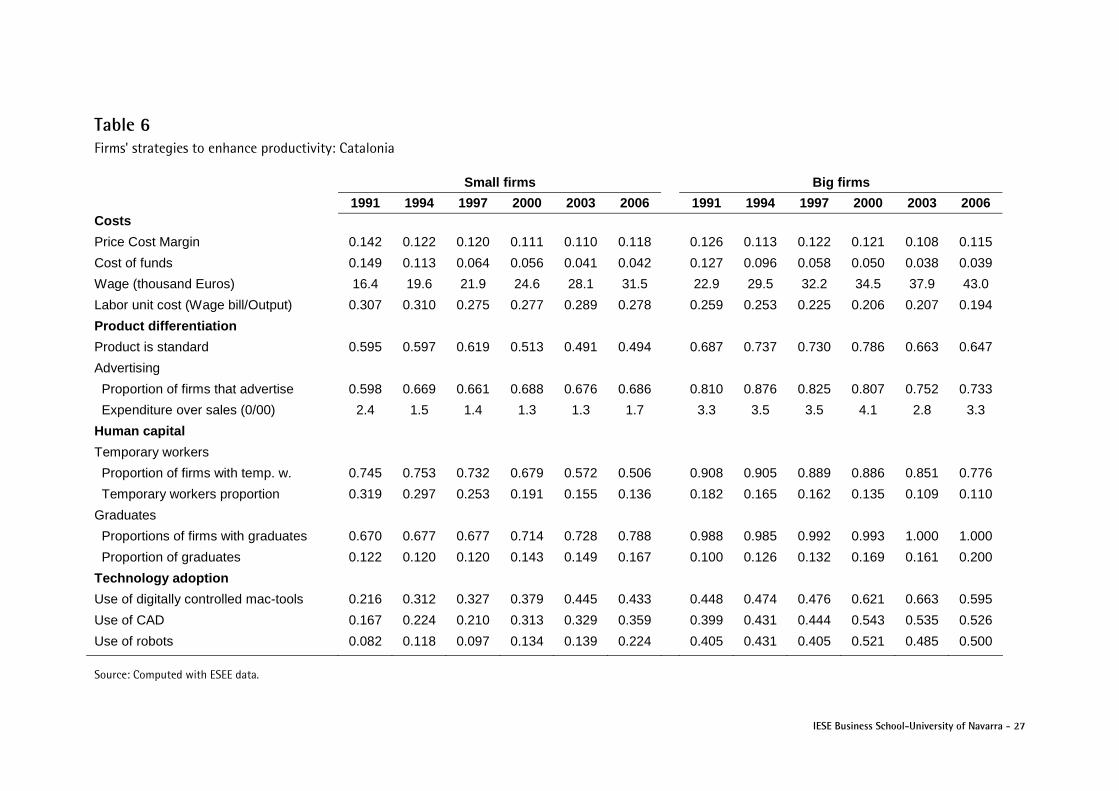
IESE Business School-University of Navarra - 27
Table 6 Firms' strategies to enhance productivity: Catalonia
Small firms Big firms
1991 1994 1997 2000 2003 2006 1991 1994 1997 2000 2003 2006 Costs
Price Cost Margin 0.142 0.122 0.120 0.111 0.110 0.118 0.126 0.113 0.122 0.121 0.108 0.115
Cost of funds 0.149 0.113 0.064 0.056 0.041 0.042 0.127 0.096 0.058 0.050 0.038 0.039
Wage (thousand Euros) 16.4 19.6 21.9 24.6 28.1 31.5 22.9 29.5 32.2 34.5 37.9 43.0
Labor unit cost (Wage bill/Output) 0.307 0.310 0.275 0.277 0.289 0.278 0.259 0.253 0.225 0.206 0.207 0.194
Product differentiation
Product is standard 0.595 0.597 0.619 0.513 0.491 0.494 0.687 0.737 0.730 0.786 0.663 0.647
Advertising
Proportion of firms that advertise 0.598 0.669 0.661 0.688 0.676 0.686 0.810 0.876 0.825 0.807 0.752 0.733
Expenditure over sales (0/00) 2.4 1.5 1.4 1.3 1.3 1.7 3.3 3.5 3.5 4.1 2.8 3.3
Human capital
Temporary workers
Proportion of firms with temp. w. 0.745 0.753 0.732 0.679 0.572 0.506 0.908 0.905 0.889 0.886 0.851 0.776
Temporary workers proportion 0.319 0.297 0.253 0.191 0.155 0.136 0.182 0.165 0.162 0.135 0.109 0.110
Graduates
Proportions of firms with graduates 0.670 0.677 0.677 0.714 0.728 0.788 0.988 0.985 0.992 0.993 1.000 1.000
Proportion of graduates 0.122 0.120 0.120 0.143 0.149 0.167 0.100 0.126 0.132 0.169 0.161 0.200
Technology adoption
Use of digitally controlled mac-tools 0.216 0.312 0.327 0.379 0.445 0.433 0.448 0.474 0.476 0.621 0.663 0.595
Use of CAD 0.167 0.224 0.210 0.313 0.329 0.359 0.399 0.431 0.444 0.543 0.535 0.526
Use of robots 0.082 0.118 0.097 0.134 0.139 0.224 0.405 0.431 0.405 0.521 0.485 0.500
Source: Computed with ESEE data.

28 - IESE Business School-University of Navarra
Table 6 (continued) Firms' strategies to enhance productivity: Comparisons 2006
Catalonia Rest of Spain Madrid
Small firms Big firms Small firms Big firms Small firms Big firms Costs Price Cost Margin 0.118 0.115 0.118 0.123 0.112 0.137 Cost of funds 0.042 0.039 0.043 0.041 0.041 0.045 Wage (thousand Euros) 31.5 43.0 25.8 39.0 30.0 44.5 Labor unit cost (Wage bill/Output) 0.278 0.194 0.295 0.201 0.315 0.226 Product differentiation Product is standard 0.494 0.647 0.574 0.620 0.483 0.556 Advertising Proportion of firms that advertise 0.686 0.733 0.711 0.728 0.730 0.689 Expenditure over sales (0/00) 1.7 3.3 1.3 2.2 1.6 2.1 Human capital Temporary workers Proportion of firms with temp. w. 0.506 0.776 0.618 0.866 0.526 0.800 Temporary workers proportion 0.167 0.110 0.244 0.164 0.157 0.125 Graduates Proportions of firms with graduates 0.788 1.000 0.677 1.000 0.687 1.000 Proportion of graduates 0.167 0.200 0.150 0.178 0.164 0.318 Technology adoption Use of digitally controlled mac-tools 0.433 0.595 0.429 0.670 0.422 0.600 Use of CAD 0.359 0.526 0.329 0.534 0.361 0.467 Use of robots 0.224 0.500 0.186 0.555 0.130 0.511
Source: Computed with ESEE data.
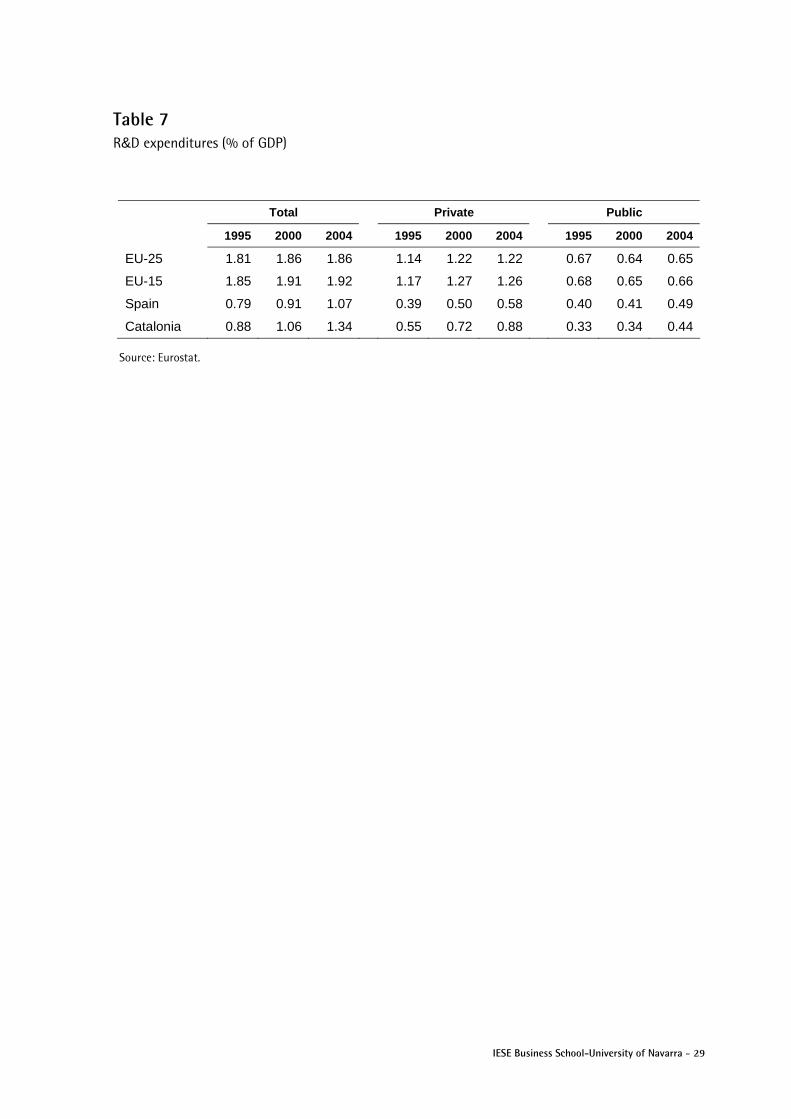
IESE Business School-University of Navarra - 29
Table 7 R&D expenditures (% of GDP)
Total Private Public
1995 2000 2004 1995 2000 2004 1995 2000 2004
EU-25 1.81 1.86 1.86 1.14 1.22 1.22 0.67 0.64 0.65
EU-15 1.85 1.91 1.92 1.17 1.27 1.26 0.68 0.65 0.66
Spain 0.79 0.91 1.07 0.39 0.50 0.58 0.40 0.41 0.49
Catalonia 0.88 1.06 1.34 0.55 0.72 0.88 0.33 0.34 0.44
Source: Eurostat.

30 - IESE Business School-University of Navarra
Table 8 R&D and innovation at the firm level
Small firms Big firms
1991 1994 1997 2000 2003 2006 1991 1994 1997 2000 2003 2006
Catalonia
Proportion of firms with R&D expenses 0.307 0.300 0.296 0.313 0.283 0.355 0.798 0.796 0.778 0.700 0.743 0.776
R&D expenses/Sales (0/00) 2.6 2.3 2.1 2.1 1.4 2.3 1.6 1.9 1.7 1.7 1.7 1.6
Firms introducing process innovations 0.294 0.346 0.311 0.326 0.208 0.278 0.552 0.628 0.516 0.614 0.426 0.534
Firms introducing product innovations 0.235 0.255 0.245 0.246 0.191 0.204 0.423 0.482 0.389 0.543 0.416 0.371
Rest of Spain
Proportion of firms with R&D expenses 0.148 0.159 0.182 0.173 0.165 0.186 0.644 0.690 0.681 0.691 0.660 0.670
R&D expenses/Sales (0/00) 2.6 2.4 2.2 2.4 2.6 2.4 1.6 1.7 1.7 1.4 1.4 1.6
Firms introducing process innovations 0.257 0.246 0.289 0.268 0.168 0.203 0.527 0.499 0.543 0.564 0.365 0.393
Firms introducing product innovations 0.184 0.195 0.206 0.185 0.122 0.130 0.385 0.391 0.454 0.428 0.302 0.356
Madrid
Proportion of firms with R&D expenses 0.159 0.208 0.231 0.177 0.156 0.196 0.701 0.758 0.787 0.655 0.711 0.511
R&D expenses/Sales (0/00) 3.4 3.3 2.9 2.1 2.3 3.1 3.0 2.7 3.0 2.2 2.2 2.0
Firms introducing process innovations 0.210 0.198 0.347 0.298 0.176 0.196 0.517 0.484 0.557 0.466 0.400 0.378
Firms introducing product innovations 0.203 0.217 0.247 0.189 0.141 0.139 0.437 0.387 0.607 0.500 0.400 0.289
Source: Computed with ESEE data.

IESE Business School-University of Navarra - 31
Table 9 Innovation and productivity: Estimating the impact of innovation
Dependent variable: ln Sales; Sample period: 2003-2006
Estimated method: OLS
1 2 3 4 5
All Performers All Manufac. perf. Services perf.
consM 4.21 3.786 4.103 3.818
(0.048) (0.056) (0.047) (0.056)
consS 3.860 3.430 3.737 3.461
(0.046) (0.054) (0.046) (0.096)
NoR & D × group 0.717
(0.043)
k 0.177 0.131 0.160 0.114 0.143
(0.007) (0.008) (0.007) (0.008) (0.015)
l 0.799 0.786 0.787 0.880 0.710
(0.008) (0.009) (0.008) (0.014) (0.013)
c 0.055 0.162 0.092 0.125 0.187
(0.004) (0.008) (0.004) (0.009) (0.014)
Industry dummies yes yes yes yes yes
Time dummies yes yes yes yes yes
R2 0.81 0.82 0.82 0.82 0.81
No. Firms 9,850 8,413 9,850 5,343 3,070 No. Observations 33,001 27,805 33,001 17,982 9,823
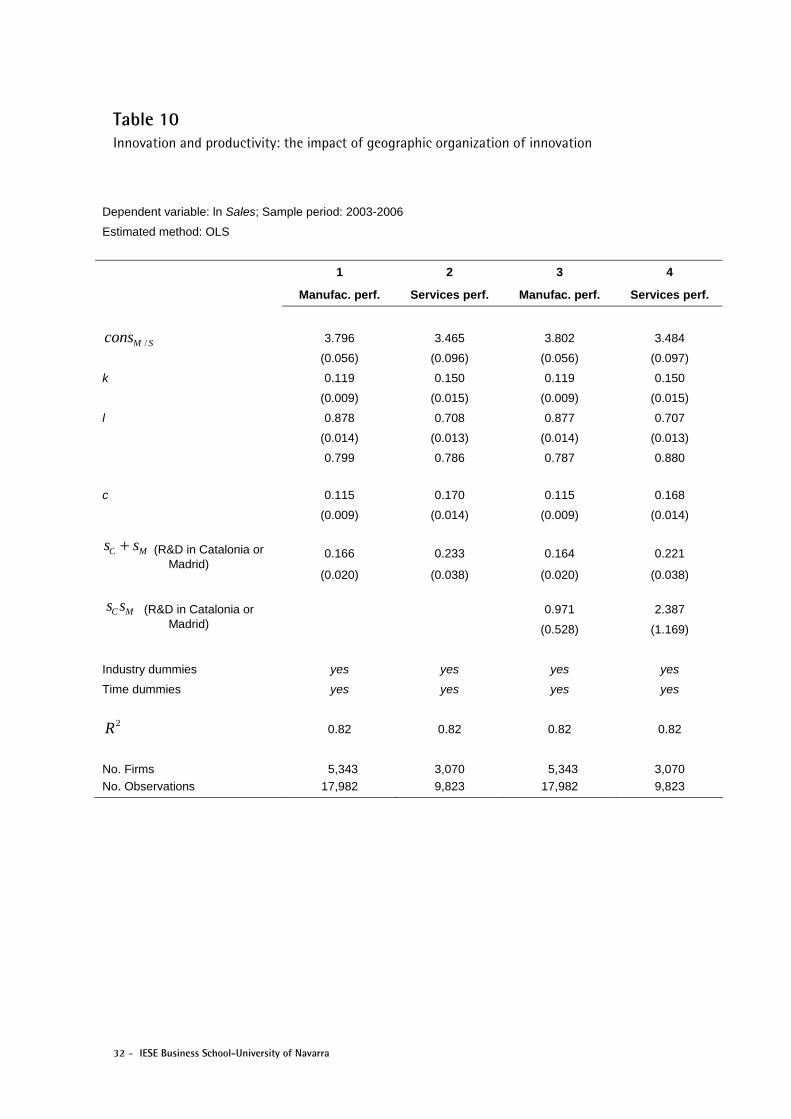
32 - IESE Business School-University of Navarra
Table 10 Innovation and productivity: the impact of geographic organization of innovation
Dependent variable: ln Sales; Sample period: 2003-2006
Estimated method: OLS
1 2 3 4
Manufac. perf. Services perf. Manufac. perf. Services perf.
consM / S 3.796 3.465 3.802 3.484
(0.056) (0.096) (0.056) (0.097)
k 0.119 0.150 0.119 0.150
(0.009) (0.015) (0.009) (0.015)
l 0.878 0.708 0.877 0.707
(0.014) (0.013) (0.014) (0.013)
0.799 0.786 0.787 0.880
c 0.115 0.170 0.115 0.168
(0.009) (0.014) (0.009) (0.014)
0.166 0.233 0.164 0.221 (R&D in Catalonia or Madrid)
(0.020) (0.038) (0.020) (0.038)
0.971 2.387 (R&D in Catalonia or Madrid) (0.528) (1.169)
Industry dummies yes yes yes yes
Time dummies yes yes yes yes
R2 0.82 0.82 0.82 0.82
No. Firms 5,343 3,070 5,343 3,070 No. Observations 17,982 9,823 17,982 9,823
sCsM
sC + sM
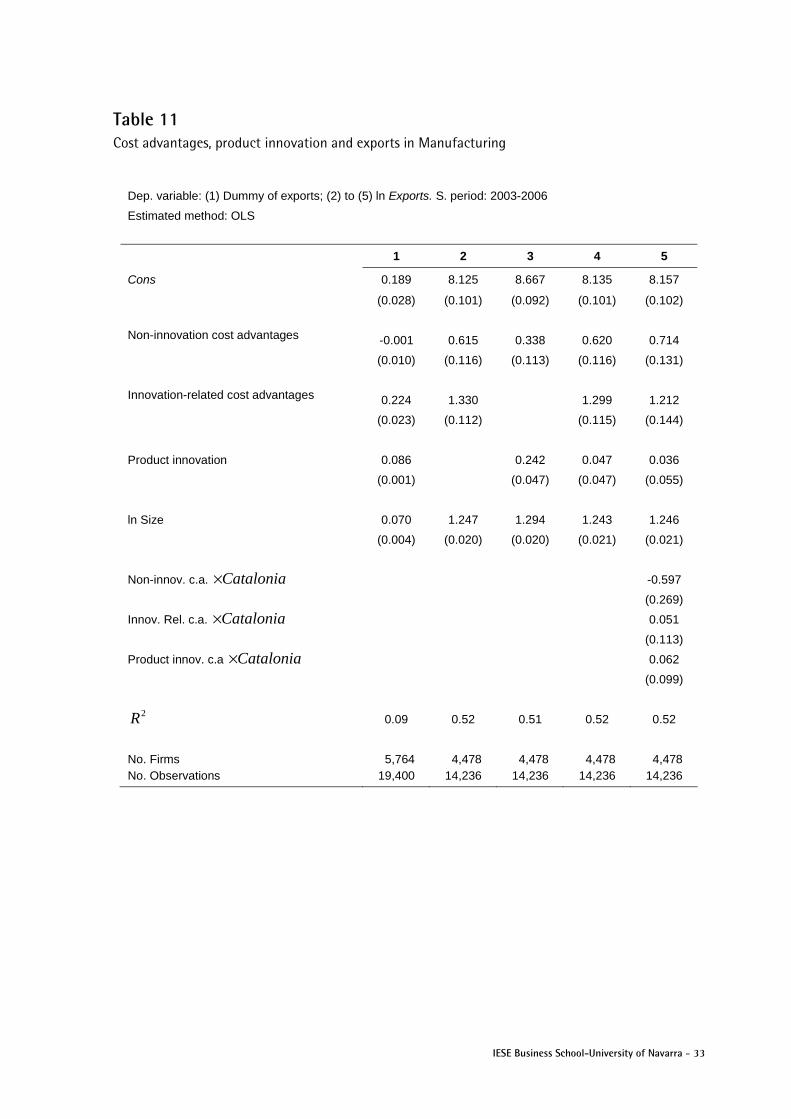
IESE Business School-University of Navarra - 33
Table 11 Cost advantages, product innovation and exports in Manufacturing
Dep. variable: (1) Dummy of exports; (2) to (5) ln Exports. S. period: 2003-2006
Estimated method: OLS
1 2 3 4 5
Cons 0.189 8.125 8.667 8.135 8.157
(0.028) (0.101) (0.092) (0.101) (0.102)
-0.001 0.615 0.338 0.620 0.714 Non-innovation cost advantages
(0.010) (0.116) (0.113) (0.116) (0.131)
0.224 1.330 1.299 1.212 Innovation-related cost advantages
(0.023) (0.112) (0.115) (0.144)
Product innovation 0.086 0.242 0.047 0.036
(0.001) (0.047) (0.047) (0.055)
ln Size 0.070 1.247 1.294 1.243 1.246
(0.004) (0.020) (0.020) (0.021) (0.021)
Non-innov. c.a. ×Catalonia -0.597
(0.269)
Innov. Rel. c.a. ×Catalonia 0.051
(0.113)
Product innov. c.a ×Catalonia 0.062
(0.099)
R2 0.09 0.52 0.51 0.52 0.52
No. Firms 5,764 4,478 4,478 4,478 4,478 No. Observations 19,400 14,236 14,236 14,236 14,236
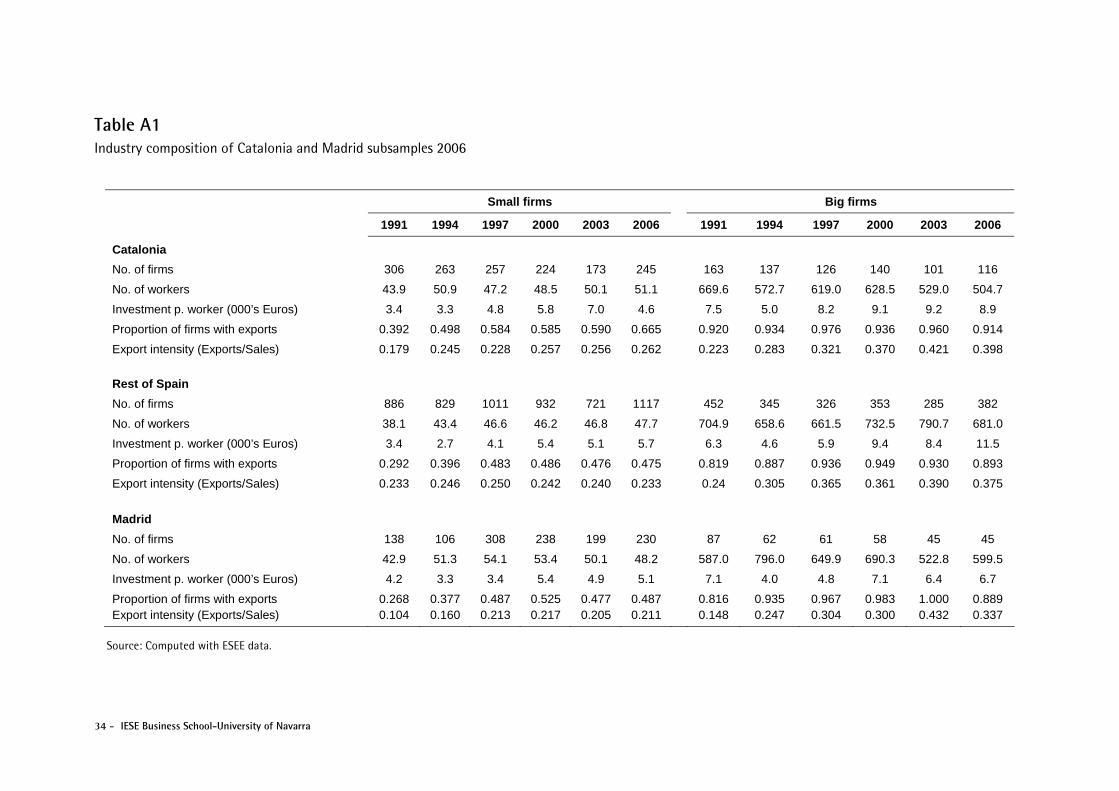
34 - IESE Business School-University of Navarra
Table A1 Industry composition of Catalonia and Madrid subsamples 2006
Small firms Big firms
1991 1994 1997 2000 2003 2006 1991 1994 1997 2000 2003 2006
Catalonia
No. of firms 306 263 257 224 173 245 163 137 126 140 101 116
No. of workers 43.9 50.9 47.2 48.5 50.1 51.1 669.6 572.7 619.0 628.5 529.0 504.7
Investment p. worker (000’s Euros) 3.4 3.3 4.8 5.8 7.0 4.6 7.5 5.0 8.2 9.1 9.2 8.9
Proportion of firms with exports 0.392 0.498 0.584 0.585 0.590 0.665 0.920 0.934 0.976 0.936 0.960 0.914
Export intensity (Exports/Sales) 0.179 0.245 0.228 0.257 0.256 0.262 0.223 0.283 0.321 0.370 0.421 0.398
Rest of Spain
No. of firms 886 829 1011 932 721 1117 452 345 326 353 285 382
No. of workers 38.1 43.4 46.6 46.2 46.8 47.7 704.9 658.6 661.5 732.5 790.7 681.0
Investment p. worker (000’s Euros) 3.4 2.7 4.1 5.4 5.1 5.7 6.3 4.6 5.9 9.4 8.4 11.5
Proportion of firms with exports 0.292 0.396 0.483 0.486 0.476 0.475 0.819 0.887 0.936 0.949 0.930 0.893
Export intensity (Exports/Sales) 0.233 0.246 0.250 0.242 0.240 0.233 0.24 0.305 0.365 0.361 0.390 0.375
Madrid
No. of firms 138 106 308 238 199 230 87 62 61 58 45 45
No. of workers 42.9 51.3 54.1 53.4 50.1 48.2 587.0 796.0 649.9 690.3 522.8 599.5
Investment p. worker (000’s Euros) 4.2 3.3 3.4 5.4 4.9 5.1 7.1 4.0 4.8 7.1 6.4 6.7
Proportion of firms with exports 0.268 0.377 0.487 0.525 0.477 0.487 0.816 0.935 0.967 0.983 1.000 0.889 Export intensity (Exports/Sales) 0.104 0.160 0.213 0.217 0.205 0.211 0.148 0.247 0.304 0.300 0.432 0.337
Source: Computed with ESEE data.

IESE Business School-University of Navarra - 35
Tables A2 Industry composition of Catalonia and Madrid subsamples 2006
Catalonia Madrid
Small firms Big firms Small firms Big firms
Food 0.069 0.120 0.061 0.022
Textile 0.179 0.069 0.065 0.044
Wood 0.057 0.017 0.074 0.044
Paper 0.098 0.112 0.183 0.311
Chemicals, rubber and plastic 0.147 0.268 0.087 0.155
Non-metals 0.037 0.034 0.043 0.044
Metals, machinery 0.309 0.138 0.308 0.133
Electrical goods 0.037 0.103 0.100 0.133
Transport equipment 0.049 0.112 0.043 0.111 Miscellaneous 0.016 0.026 0.035 0.000
Source: Computed with ESEE data.
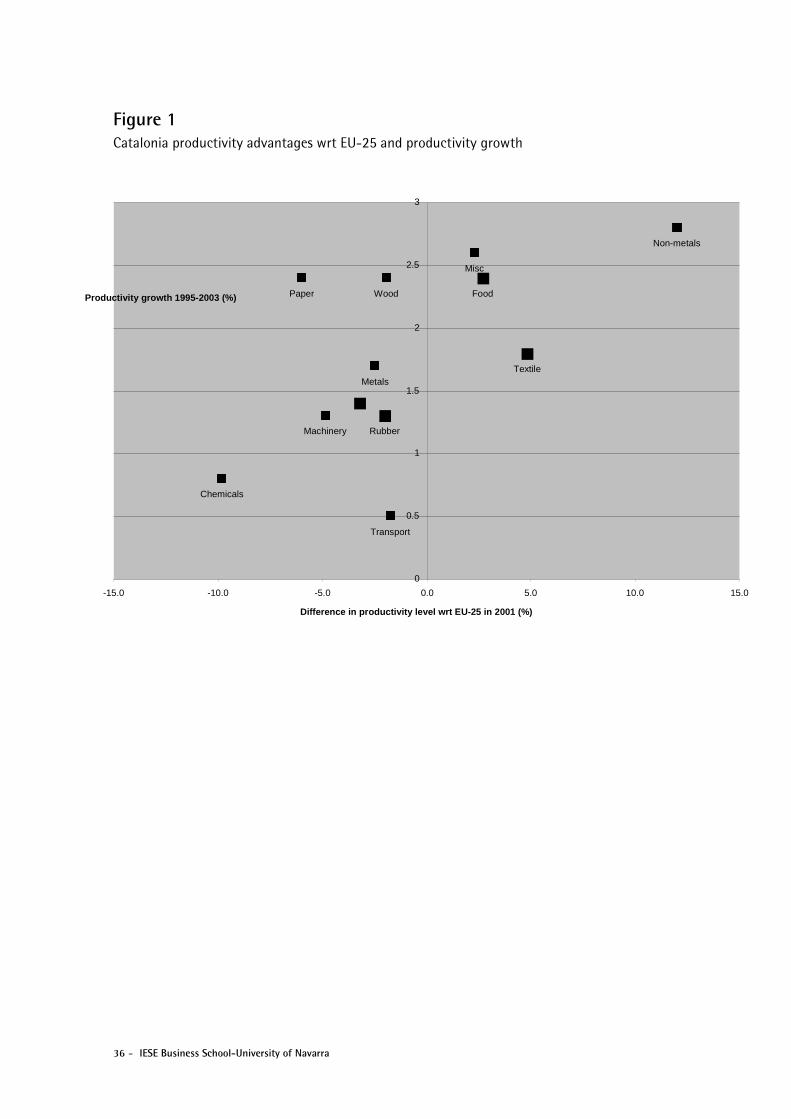
36 - IESE Business School-University of Navarra
Figure 1 Catalonia productivity advantages wrt EU-25 and productivity growth
Food
Textile
WoodPaper
Chemicals
Rubber
Non-metals
Metals
Machinery
Transport
Misc
0
0.5
1
1.5
2
2.5
3
-15.0 -10.0 -5.0 0.0 5.0 10.0 15.0
Difference in productivity level wrt EU-25 in 2001 (%)
Productivity growth 1995-2003 (%)

IESE Business School-University of Navarra - 37
Figure 2 Revealed world advantages by productivity growth
Electronics
Pharmaceuticals
Instruments
Vehicles
Electrical
Chemicals
Other transport
Machinery
Rubber and plastic
Ships
Misc.
Non-ferrous
Non-metals
Metals
Ferrous
Paper
Textile
Food
Wood - 40
- 30
- 20
- 10
0
10
20
30
0 0.5 1
1.5 2 2.5
Productivity growth 1995-2003 (%)