what drives the unification of multiple voting class shares? papers... · what drives the...
TRANSCRIPT

What drives the unification of multiple voting class shares?
Abstract
Deviation from one share - one vote by issuing superior voting class shares is common
around the world. This paper explores the reasons why an increasing number of firms in
continental Europe are deciding to unify their shares into a single class, and the
consequences of this restructuring. The main factor affecting the probability of
unification is the need to raise the share value. The probability of unification is positively
related with new equity issues, number of acquisitions and industry growth opportunities
– situations when the gains from increased share value are particularly high. The paper
also shows that higher value of control rights (for example, high separation between
control and cash flow rights) significantly reduces the likelihood of unification.
JEL Classification: G32; G34
Key words: Corporate Governance; Dual class; One share - one vote

2
1. Introduction
Firms with dual-class shares1 are rather common in Europe (Faccio and Lang,
2002), and in many countries around the world, including the United States. A growing
literature emphasizes that the asymmetry between cash flow and voting rights created by
dual-class ownership allows the controlling parties to receive a disproportionate amount
of corporate benefits (so-called private benefits2) (see e.g., Grossman and Hart, 1988;
Harris and Raviv, 1988). As a result, corporate valuation can decrease, cost of capital can
increase, and a firm can face investment constraints (see e.g., La Porta et al., 1997, 2002;
Claessens et al., 2002; Cronqvist and Nilsson, 2003). On the other hand, there is a fair
amount of theoretical and empirical work showing that, under certain conditions, dual-
class shares can benefit shareholders (see e.g., DeAngelo and DeAngelo, 1985; Fischel,
1987; Burkart et al., 1998; Dimitrov and Jain, 2003).
Shleifer and Wolfenzon (2002) show theoretically that firms with weaker
shareholder protection have lower valuations because investors take into account that
some of the profits can be diverted. If market participants believe that profit diversion is
more prevalent in dual-class firms than in single-class firms, they will pay less for the
former. We can call it a “dual-class” equilibrium: controlling shareholders enjoy the
private benefits, and minority shareholders pay for what they get – the expected cash flow
1 Throughout the paper, dual-class shares means that the firm has more than one share class (except
American Depository Receipts) with different voting rights. There can be more than two share classes, but
all the analysis can be easily generalized to such cases.
2 Examples of such benefits are the power to elect the board members and the CEO, the power to build
business empires, the ability to consume perquisites at the expense of the firm, and the ability to transfer
assets to private corporate entities.

3
after the extraction of private benefits. This begs the question of why, suddenly, some
dual-class companies choose to deviate from this "equilibrium”.
This papers studies the determinants of the decision to unify the shares with
different voting rights into a single share class. Throughout the paper, I refer to this event
as the unification. The factors driving the probability of unification are inferred both from
ex ante and ex post characteristics of the companies that unified their shares. The main
prediction is that the goal of the unification is to raise the company’s share price. The
share price is expected to increase after the unification for several reasons. First, the
unification is a commitment to reduce the potential profit diversion. Second, the liquidity
should go up (for example, if only one share class was traded before the unification),
which may have a positive effect on firm value. Finally, the unification improves investor
recognition. Shares become available to a wider pool of investors, which according to
Merton (1987) may improve the share value.
The determinants of the unification are explored using a panel data set of 493
publicly traded firms in seven European countries (Denmark, Finland, Germany, Italy,
Norway, Sweden, and Switzerland) where dual-class share structures are widely used. A
total of 108 of the firms unified the dual-class shares in the period 1996-2002. I call these
firms the event group. The other 385 firms remained dual-class within the same period. I
call these firms the control group.
I find that the probability of unification is positively related with a planned new
equity issue (seasoned equity offering, SEO). The data show that the event firms are more
active in raising new equity. Moreover, the SEOs tend to occur in the same year as the
unification. If a firm plans to raise new equity, the likelihood of unification increases by 3

4
% a year. More than one third (36 %) of the event firms issued equity in the same year
when they unified the dual-class shares. I also find that the firms that unify their shares
are more active in acquiring other companies. Higher acquisition activity suggests that
the firm may want to use stock to pay for other companies’ shares. The interpretation of
these results is that low share value is not much of a concern, the minority shareholders
pay a fair price taking into account the potential expropriation, unless the firm wants to
do any transactions with stock.
The likelihood of the unification decreases substantially if the firm’s controlling
shareholders enjoy high private benefits of control. I show that all the variables that proxy
for the level of private benefits have the expected signs and are significant. In particular,
the event firms are characterized by: a) a smaller difference between the votes and equity
held by the largest shareholder, b) a lower voting premium (the price difference between
high and low voting shares), c) a more frequent presence of a financial investor among
the largest shareholders, and d) a higher number of firms cross-listed in the U.S.
Moreover, the importance of the new equity issues as a determinant of the unification is
linked to the private benefits of control argument. The expansion of equity capital is
likely to dilute the control, hence the value of control is expected to decrease, and the
controlling shareholders are more likely to accept the unification.
The prediction that the unification is intended to increase the share price can be
tested alternatively from the ex post consequences of the unification. The results suggest
that firms indeed reach their goal of increasing the market value, and the effect is rather
persistent. The difference between the firm’s market-to-book ratio and the respective
average ratio of single class firms in the same industry jumps from around –0.5 to 0 in the

5
year of the unification. In other words, the ex-dual-class firm achieves the same value as
an average single-class firm in the industry. Moreover, it keeps moving up, reaching 0.4
(significantly different from zero) one year after the unification, and then drops back to 0
in the two subsequent years. The value effect remains robust after controlling for sales
growth and operating performance. Other ex post consequences of the unification are
higher sales growth, higher capital expenditure, and lower leverage.
This paper relates to a broader literature on dual-class shares: the value of control
measured by the voting premium (Bergström and Rydqvist 1990, 1992; Nenova, 2003),
the IPO under-pricing in dual-class firms (Smart and Zutter, 2003), the dual-class share
introductions, the switch from a single to dual-class share structure (Partch, 1987; Jarrel
and Poulsen, 1988; Millon-Cornett and Vetsuypens, 1989), and the effect of certain
policy changes on dual-class firms (Smith and Amoako-Adu, 1995; Robinson et al.,
1996; Hoffmann-Burchardi, 1999; Bennedsen and Nielsen, 2002; Berglöf and Burkart,
2003).
This is not the first paper to study the unification of dual-class shares. Amoako-
Adu and Smith (2001) find that the most common factors leading 56 firms on the Toronto
Stock Exchange to eliminate dual class equity were to meet the terms of a debt
restructuring agreement, to facilitate the sale of a control block, and to increase
institutional appeal for stock prior to a seasoned offering. These factors are derived from
the statements made by the companies. Using data on 67 Israeli stock unifications,
Hauser and Lauterbach (2003) estimate the value of voting rights from compensation
paid on high voting shares for giving up some of the votes. All the Israeli unifications
soared after the Tel-Aviv Stock Exchange introduced a new regulation (in 1989) which

6
banned new issues of inferior-voting shares. With this regulation, firms that wanted to
raise new equity were effectively forced to unify the dual-class shares.
The paper that is closest to this one in its study of the effects of voluntary dual-
class share unifications is Dittmann and Ulbricht (2003). Using data on 89 dual-class
shares in Germany, Dittmann and Ulbricht find that a company is more likely to abolish
the dual-class structure if the expected future growth is high, if the firm is large, or if the
largest block of voting shares is small. The data used in this paper differ from the German
data in several respects. First, this paper studies seven countries, allowing some cross-
country comparisons. Second, a wider pool of control firms allows to find more precise
matches for the event firms, and to detect the differences in firm characteristics. Third, I
use a sample of shareholder approved unifications (in German data, out of 29 announced
unifications, 4 companies eventually did not unify their shares). Finally, and most
importantly, this study explores not only the determinants of the unification but also the
ex post consequences of it. To my knowledge, this is the first paper that explores firm
characteristics after the unification, and explicitly documents the effect on share value
beyond a short term announcement effect.
The paper proceeds as follows. Section 2 describes the data. Based on the
theoretical arguments and previous findings, Section 3 presents several testable
hypotheses. Section 4 analyzes the ex ante determinants of the unification decision.
Section 5 studies the ex post consequences of the unification. Section 6 discusses some
alternative, less formal tests of the hypotheses, and Section 7 concludes.

7
2. Data
2.1. Sample
The main sample for empirical investigation consists of 493 companies in seven
European countries (Denmark, Finland, Germany, Italy, Norway, Sweden, and
Switzerland), in which deviation from one share - one vote is allowed and widely used.
The seven European countries use different types of dual voting class shares (see
Appendix A). Companies in Denmark, Finland, and Sweden use dual-class share system
in which, for example, one share class has one vote per share, and the other – ten votes
per share. In Norway, the restricted share class usually carries no voting rights. The most
common restricted share class in Germany is preference shares (Vorzugsaktien) which
carry no (or limited) voting rights, but has priority for dividends. In Italy, companies can
issue nonvoting savings shares (azioni di risparmio), and preferred shares that carry
limited or no voting rights. Companies in Switzerland can issue one or more classes of
shares (registered (namen) or bearer (inhaber)) with one vote but different nominal value
per share. In all sample countries, both share classes are treated equally for tax purposes,
i.e., there is no tax advantage on low voting shares as, for example, is the case of bank
issued trust preferred stock in the U.S.
A sample firm complies with the following criteria: The firm is present in
Moody’s/ Mergent International Company Database (1996-2002 Manuals), is not a
commercial bank or credit institution (two-digit SIC code 60 and 61), had a dual class
share structure at the end of 1995, and is still listed on the stock exchange at the end of
2002. The sample construction is presented in Panel A of Table 1. Out of 601 firms that
satisfied all the criteria above except the last one, the listing at the end of 2002, for

8
various reasons we drop 108 firms. Ten percent of firms were taken over or merged with
another firm. Four percent of firms were delisted because the ownership became too
concentrated (no or very little free float). Other four percent of firms were dropped due to
data unavailability. It leaves us 493 firms (82 %). Out of this sample, 108 firms (22 %)
now have single share class (event group), and 385 firms (78 %) still have dual-class
shares (control group). If we compare the number of unifications with the total initial
dual-class firm sample (including the firms that dropped out during 1996-2002), the event
group represents 18 %. These numbers show that the unification of share classes is an
important event among the dual-class shares and the market in whole.
Panel B of Table 1 tracks the initial sample of dual-class firms by country. The
lowest unification activity has been in Sweden, where only five percent of the initial
sample (7 out of 136 firms) switched to one share - one vote. In Denmark, the respective
figure is 11 % (10 out of 88 firms). The highest unification activity has been in Norway,
Germany, and Switzerland (30 %, 29 %, and 25 %, respectively). It is interesting to note
that Sweden and Denmark have the highest fraction of mergers and takeovers among
dual-class firms. In Sweden, 18 % of the initial sample of dual-class firms (25 out of 136
firms) merged or were taken over during 1996-2002. In Denmark, the respective number
is 16 %. Panel C of Table 1 shows that the number of unifications has been increasing
over sample years – from 8 events per year in 1996 to 23 in 2000 and 2001. The highest
number of unifications is observed in Germany (41 firm) and Switzerland (26 firms).
Panel A of Table 2 shows that the fraction of dual-class firms among all firms has
decreased since 1995, but it is still substantial at the end of 2001. The largest fraction of
dual-class firms is in Sweden (46 %), and the lowest in Norway (7 %) and Germany (11

9
%). We should note that there are large and important market players among the dual-
class firms. The event group consists of mainly large and medium size companies,
including such famous names as, for example, ABB, Lufthansa, and Nokia. The control
group includes, for example, BMW, Carlsberg, Ericsson, and Fiat.
Panel B of Table 2 presents evidence that the fraction of dual-class firms among
newly listed domestic companies has been steadily decreasing from 22 % in 1996 to only
4 % in 2002. Sweden appears as a striking outlier; 71 % of all new dual-class listings in
seven sample countries during 1996-2002 happened in Sweden.
2.2. Summary Statistics
Table 3 contains summary statistics for 3451 firm-years – 493 companies and
seven years (1996-2002). The number of observations vary due to data availability
constraints. The first group until the dividing line presents variables with annual data,
while the second group shows data that are assumed constant over sample years. All the
variable definitions are provided in Appendix B.
The main data sources used in this study are as follows. Financial data is from
Worldscope database. Information on different share class characteristics (voting power,
dividend rights, listing, etc.) comes from Moody’s/ Mergent International Company
Database, Datastream, company annual reports, and Lexis-Nexis. Ownership data are
from Faccio and Lang (2002) and company annual reports. Data source for acquisitions is
Securities Data Corporation Platinum database.
Panel A of Table 3 shows that the median firm in the whole sample has a market-
to-book (MTB) ratio of 1.53, an industry adjusted market-to-book ratio of –0.98, a size
(log of sales) of 5.54, a return on assets of 5 %, a return on equity of 10 %, a debt to

10
capital ratio of 24 %, capital expenditures of 19 % of net property, plant, and equipment,
and annual sales growth of 6 %. The industry MTB is the average MTB for publicly
traded single share class firms in the seven sample countries in the same industry
(measured by two-digit SIC code) in each year. In terms of ownership structure, the
median firm in the sample has the largest shareholder with 40 % of votes and 24 % of
equity. Forty percent of all firms have only one of the share classes listed on the stock
exchange, 11 % of firms have their shares cross-listed in the U.S., 41 % of firms have a
family as the largest shareholder, 11 % of firms have a financial institution as the largest
shareholder, and 42 % of firms have a second shareholder with at least 10 % of votes.
In Panel B and Panel C of Table 3, the summary statistics are presented separately
for the event group, and the control group. In Panel B, the statistical significance of the
univariate analysis between the event group and the control group variables is shown.
The firms that switched to a single share class compared to other dual-class firms are
characterized by higher market-to-book ratios, larger size, lower relative trading days,
higher number and size of new equity issues, and higher number of acquisitions.
3. Determinants and consequences of unification: discussion and hypotheses
In this section, different theories and findings about dual-class shares are
summarized to form a set of testable predictions about the variables affecting the
probability of unification (ex ante effects) and the likely consequences of it (ex post
effects). This way of differentiating between ex ante and ex post effects is borrowed from
Pagano et al. (1998) who study the question of why companies go public.
11
3.1. Stylized facts about dual-class shares
Consider a firm with two classes of shares – high voting shares and low voting
shares. The two share classes, as well as the dual-class firms vs. single-class firms may
differ with respect to the three main factors: 1) security benefits, 2) liquidity, and 3)
control benefits. In many firms (e.g., in Scandinavia), both share classes carry the same
dividend and liquidation rights, i.e., the shares differ only with respect to voting rights.
While in other firms (e.g., as set by law in Germany and Italy), the low voting shares
have preferential rights with respect to dividends. In my sample, about 40 % of firms
actually paid higher dividends on low voting shares than on high voting shares. When
security benefits differ, other things equal, the high voting shares have a lower price than
low voting shares. When compared with single share class firms, there is evidence that
security benefits in dual-class firms should be lower because of lower share valuations
(Shleifer and Wolfenzon, 2002; Claessens et al., 2002). Dual-class structures can be seen
as an anti-takeover measure that helps managers or controlling shareholders to extract
rents that are not shared with other shareholders. Hence, the market may assign lower
valuations on these firms than on similar single-class firms. This finding is supported by
the data in our sample. From Table 3 we see that the average INDUSTRY ADJUSTED
MTB, the difference between the dual-class firm’s MTB and the average MTB in the
single-class firms in the same industry, is significantly negative. The lower valuations can
also reflect the fact that dual-class firms may forgo a positive growth opportunity when it
arises. Wurgler (2000) shows that better shareholder protection increases the efficiency of
capital allocation, i.e., there is higher correlation between investment opportunities and
actual investments.
12
The liquidity of high and low voting shares may differ due to foreign ownership
restrictions (e.g., at some point, on registered shares in Switzerland), block holdings
(large part of high voting shares can be held in a block and are not traded), or an unlisted
share class (i.e., only one of the shares is listed on the stock exchange). Table 3 offers
some evidence. Turnover ratio of low voting shares is on average (median) 6.4 (2.3)
times higher than on high voting shares. Number of days the share is traded is on average
(median) 2.4 (1.0) times higher for low voting shares than for high voting shares. These
ratios are estimated using firms in which both share classes are listed (60 % of all firms in
our sample). When comparing with single-class firms, there is some evidence that dual-
class firms have a smaller investor base (Giannetti and Simonov, 2002). Using Swedish
data, Giannetti and Simonov show that certain investor groups are reluctant to hold stocks
in companies in which the extraction of private benefits is expected to be larger.
Moreover, the investor base could be narrower because dual-class structures are
unavailable to certain investor groups (e.g., investment funds) due to legal restrictions.
The valuations of high and low voting shares differ if there is some value attached
to the voting rights. The value of voting rights can represent the expected premium that
an outside raider would offer to acquire control over firm’s decisions (Lease, McConnell,
and Mikkelson, 1983; Stulz, 1988; DeAngelo and DeAngelo, 1985). When there is a
takeover attempt, a higher price could be paid for a high voting share because it carries
more votes. Without institutional restrictions (on equal treatment of both share classes),
the raider is willing to pay “per vote” and not “per share”. The value of voting rights is
commonly measured by a voting premium (e.g., Levy, 1983; Zingales, 1994, 1995).
Table 3 shows that the average (median) voting premium in our sample is 16 (5) %,

13
which is significantly different from zero. When comparing with single-class firms,
several authors have argued that private benefits are higher in firms with dual-class shares
(DeAngelo and DeAngelo, 1985; Grossman and Hart, 1988). Higher separation between
ownership (fraction of capital) and control (fraction of votes) can create the wrong
incentives, when those in control become entrenched at the expense of minority
shareholders3. The private benefits can take the form of excess salaries, beneficial
transfer pricing to controlling shareholders’ privately held firms, subsidized personal
loans, etc. Alternatively, Holmen and Högfeldt (2003) claim that in Sweden private
benefits of control are arising from status, prestige, and social recognition rather than
from expropriation of minority shareholders, and thus are not value destroying.
3.2. Main disadvantage of unification: loss of control
The main disadvantage of the unification from the controlling shareholders’ point
of view is the loss of control. Previous studies have shown (Faccio and Lang, 2002;
Claessens et al., 2002), and the data in this study confirm that the controlling shareholders
use the benefits of dual-class structure by investing in high voting shares, and having
lower capital participation relative to the voting power. The average (median) difference
between the votes and equity stake in our sample is 13 (9) %. The highest difference is 67
%: the largest shareholder holds all votes, but only 33 % of equity capital. Obviously, the
3 One should note that dual-class share structure is just one of the ways to create separation between control
rights and cash flow rights. There are also pyramids and cross-holdings of companies (Bebchuk et al.,
2000). However, dual-class shares is the most common method in Europe. From Faccio and Lang (2002)
data set we can estimate that on average 32 % of firms in the seven countries used in this study have dual-
class shares, compared with 20 % of firms using pyramids and 2 % – cross-holdings.

14
unification can substantially decrease the voting power of the controlling shareholder,
because after the unification the voting rights are just equal to the equity rights.
We should expect that a controlling shareholder with lower value of control and
lower private benefits is more likely to accept the unification. Measuring the private
benefits of control is not trivial. Claessens et al. (2002) show that high separation
between ownership and control can be a sign of entrenchment. The prediction would be
that the wedge between control rights and equity rights is lower in firms that abandon
dual-class share system. Voting premium is another way of measuring the value of
control. We should expect a negative correlation between the probability of unification
and the voting premium. The type of the owner, e.g., a family vs. financial investor, can
matter, too. Financial investors can have lower incentives for private benefit extraction
(see e.g., McConnell and Servaes, 1990), and they can be less concerned about the “free”
control benefits, namely status, prestige, and social recognition. Reese and Weisbach
(2002) and Doidge (2003) argue that cross-listing in the U.S. is a bonding mechanism
that improves the protection afforded to minority investors and decreases the private
benefits of control4. Following this reasoning, we should expect that the dual-class firms
which are cross-listed in the U.S., other things equal, are more likely to unify their shares.
The private benefits could also decrease because of changes in corporate
governance legislation. Over the sample period (1996-2002) the corporate governance
regulations have improved5. As shareholder protection improves, the controlling party’s
4 There is, however, a countervailing argument by Siegel (2003), who suggests that cross-listing in the U.S.
is a reputational bonding rather than a legal bonding. When it comes to implementation, American
governance rules affecting U.S. listed foreign firms are much stricter in formal writing than in practice.
5 See a summary of regulatory issues related to dual-class shares in Appendix A.

15
easiness to extract private benefits could decrease. This is obviously one of the reasons
for higher incidence of unifications in the last few years (see Panel C of Table 1), as well
as for overall decrease in the fraction of dual-class firms (Table 2). However, in neither of
the sample countries the regulatory changes related to dual-class shares have been such
that make the switch to one share - one vote compulsory. The unification decision is still
left at the discretion of the firm, and there are many firms that have remained dual-class.
The main question is what are the benefits that make firms (the controlling
shareholders) to accept the unification. In the next sections, we focus on the advantages
of unification. The discussion is directly linked to the stylized facts presented before, in
particular, to the comparison between dual-class and single-class firms.
3.3. Increase share value
Dual-class firms can decide to unify the shares with an intention to increase the
share price, by committing not to expropriate minority shareholders. One support for the
commitment story is the fact that the controlling shareholders in several dual-class firms
had the same fraction of votes and equity, i.e., they did not “use” the dual-class system,
prior to the unification. One would presume that the market does not treat these firms as
dual-class, and there should be no difference in valuation. The market, however, can
discount the firm value because of the option to use the dual-class structure in the future.
Therefore, the unification of share classes is an obvious commitment not to use the dual-
class system also in the future. Main implication of this hypothesis, which can be tested
using ex post data, is higher market valuation (MTB ratio) after the unification.
The question arises, Why suddenly firm cares about higher valuation? The chance
to raise the share price should be particularly appealing for companies that plan to issue
16
new equity and to make acquisitions using stock. The stock price may not bother the
controlling shareholders as long as there are no stock transactions to the “outside”, e.g.,
the expansion is financed with cash or debt, but it becomes more of an issue when the
firm has to approach the equity markets and/ or use the stock in acquisitions. We should
expect that the likelihood of unification increases if a firm is issuing substantial amounts
of new equity. This prediction is related to Ehrhardt and Nowak (2002) who find that the
firms that issued dual-class shares at the IPO stage are less likely to return to capital
markets for a seasoned equity offering.
Firms with better growth opportunities, in general, should have higher incentives
to unify the shares. Even if a firm is not issuing new equity right after the unification, it
may need to raise substantial amount of capital for investments and expansion in the
future, for example to attract a strategic investor. Simplifying the share structure can
make the process easier. Moreover, when the current controlling shareholders are cash
constrained, in times of rapid expansion, the dilution of control is inevitable. As a result,
the value of control decreases, and the controlling shareholders are more likely to accept
the unification. As a proxy for firm’s future growth opportunities, we use the average
MTB of public single-class companies in the same two-digit SIC industry. The
hypothesis that the unification is a way to ease the expansion can be tested using ex post
data: firms that unified shares should increase their investment (measured by capital
expenditure over property, plant and equipment), and the sales should rise.
A controlling shareholder could be tempted to boost the stock price before selling
the shares to a new shareholder, assuming that the new shareholder is not interested (or

17
able) to extract private benefits and thus not ready to pay the full value of control. In this
case, we should expect to see a change of controlling shareholder after the unification.
3.4. Increase share liquidity
Another potential reason to unify the share classes is to raise the liquidity of
company’s shares. The motives why firm needs to increase liquidity are similar to the
motives why firm needs to raise stock price. In particular, liquidity becomes important
when firm is expanding and has to attract new investors, to issue new equity, to make
acquisitions using stock, or when the controlling shareholders want to sell their stakes.
3.5. Investor recognition
The dual-class firms can have a smaller investor base due to unavailability (or
unfamiliarity) of dual share structure to certain investor groups. According to Merton’s
(1987) model, an increase in the relative size of the firm’s investor base reduces the
firm’s cost of capital and increases the market valuation. When the firm’s stock price and
liquidity is important, the unification can help to increase the investor base and hence to
raise the market valuation. Unlike in Giannetti and Simonov (2003), there is no clean way
to test the hypothesis about the investor base in my data. One implication of this
hypothesis, which can be tested using ex post data, is higher market-to-book ratio after
the unification. High MTB can alternatively indicate that there is simply lower extraction
of private benefits. It is hard to discriminate between these two hypotheses. The
discussion about investor recognition is addressed in Section 6.
The unification can also act as a positive “free” advertisement for the company.
The switch to one share - one vote is boldly regarded as a step towards improved
18
corporate governance, and normally gets significant media attention. This prediction is
closely related to Demers and Lewellen (2003) who find that there are marketing benefits
associated with IPO under-pricing. We should expect that firms with good growth
opportunities and planned new equity issues are the ones that gain the most from positive
publicity around the unification event.
3.6. Other issues
Zingales (1995) and Nenova (2003) have shown that preferential dividends for
low voting shares reduces the value of control (the voting premium). One of the
advantages of unification is that high voting share holders can receive higher dividends
after the unification. We should expect a positive correlation between the probability of
unification and the presence of preferential dividends on low voting shares.
In the event of unification, some firms can compensate the loss of control with
additional stocks or cash. In my sample, there are 9 firms, predominantly in Italy and
Norway, that offered some kind of compensation for high voting shareholders. The
compensation would arguably make the unification more attractive to the controlling
shareholders, but it can face strong opposition from the low voting shareholders. The low
number of compensation cases does not allow us to make any statistically meaningful
tests. Moreover, the decision about the compensation is of a second-order after the
proposal to unify the shares has been made6.
6 There are exceptions, however. In Swedish company Ericsson, the talks on the issue of the compensation
for high voting shareholders have taken nearly two years, and have seriously hindered the acceptance of the
reform that would cut the difference in voting rights on high and low voting shares from 1,000-to-one to

19
In several dual-class firms, the high voting shares can be converted into the low
voting shares. This option gives an extra benefit to high voting shareholders, and should
decrease the incentives to give up these shares. In practice, it is not very common to use
the conversion option. Nenova (2003) shows that the convertibility does not explain the
price difference between dual-class shares. Suspecting that the conversion option has no
effect on the unification decision, the data on share convertibility were not collected.
3.7. Hypotheses summarized
The main testable hypotheses about the ex ante determinants of the unification
and the ex post consequences of the unification are as follows. The probability of
unification should be higher in firms with: 1) low difference between control rights and
equity rights held by the largest shareholder, 2) low voting premium, 3) financial investor
as the largest shareholder, 4) cross-listing of shares in the U.S., 5) preferential dividends
for low voting shares, 6) planned new equity issues, 7) planned acquisitions of other
companies, and 8) high growth opportunities. These predictions are tested in the next
section. The expected consequences after the unification are: 1) higher market-to-book
ratio, 2) higher sales growth, 3) higher capital expenditure over property, plant and
equipment, and 4) change of the controlling shareholder. These predictions are tested in
Section 5.
10-to-one (Financial Times, February 19, 2004). Ericsson case does not classify as a unification according
to the definition used in this paper, because the company still keeps the dual-class share system.

20
4. Ex-ante determinants of unification
In this section, the firm characteristics which increase the likelihood of unification
are estimated. Section 4.1 presents the results using the panel data discrete choice model
(probit). Alternative methods are presented as a robustness check in Section 4.2 and 4.3.
4.1. Main model
A pooled probit model of the probability of dual-class share unification is used (as
in Pagano et al., 1998). On the basis of the discussion in previous section, I estimate:
Pr(Unifyit=1) = F(α1(Equity Issueit) + α2(Acquisitionsit) + α3SIZEit +
α4INDUSTRY MTBit + α5(Private benefitsi) + α6YEARt + α7COUNTRYi), (1)
where Unifyit is a variable that equals 1 if the company i switched to a single-class
share system in year t and 0 if it remained dual-class in this year (a firm is dropped from
the sample after it unifies the shares), F(.) is the cumulative distribution function of a
standard normal variable. Different specifications of the explanatory variables are
described in the following paragraphs. The predicted signs of the variables were
discussed in the previous section. The only explanatory variable that was not discussed is
SIZE. The costs of keeping a controlling block are higher in large companies, which
would predict positive relation between size and the likelihood of unification. On the
other hand, having control of a big company has more positive effect on owner’s social
status, and hence lower incentives to give up the control. The prediction on the sign of the
size variable is therefore unclear.
Table 4 reports the maximum likelihood estimates of the probit model, as well as
the standard errors, using a fully robust variance-matrix estimator that allows for within-
cluster (firm) correlation and heteroscedasticity. The robust estimator assumes for no

21
particular kind of within-cluster correlation nor a particular form of heteroscedasticity.
This specification relaxes the independence assumption required by the probit estimator
to being just the independence between the clusters (firms). This specification yields very
similar results to random-effects regression (not reported), which controls for possible
unobserved firm-specific effects.
The variables that measure the equity issue and acquisitions activity are
contemporaneous because they proxy for the planned new equity issues and acquisitions.
The reverse causality (from unification to new equity issues and acquisitions) is ruled out,
because usually these decisions take time. It is not plausible to assume that the firm made
a unification, observed a share price increase, and immediately (within a few months)
decided to issue new equity and make acquisitions. It is quite common that the decisions
about new equity issue and unification are taken at the same annual (or extraordinary)
meeting. SIZE and INDUSTRY MTB are lagged one year in order to measure the
situation before the unification. The variables that proxy for private benefits (e.g.,
ownership) are fixed; they measure the situation before the unification in the event firms
and the average situation in the control firms in the period 1996-20027.
We hypothesized that controlling shareholders in a firm that expands through new
equity issues and acquisitions are more likely to face control dilution and decrease in
private benefits. Moreover, raising additional equity capital and acquiring new firms
increases the importance of boosting the stock price. The results reported in Table 4
strongly confirm these predictions. Regression (1) shows that the probability of
7 This is due to lack of data. Collecting past ownership data for 493 firms from 7 countries over 7 years is
not very feasible.
22
unification significantly increases in the years when firm plans to issue new equity. A
planned new equity issue raises the probability of unification by 2.9 % a year. Regression
(2) reports that the size of new equity issue proceeds scaled by book value of equity
significantly increases the likelihood of unification. A one standard deviation increase in
EQUITY ISSUE PROCEEDS/ EQUITY raises the probability of unification by 0.8 % a
year. Regression (3) reports the results of the acquisitions effect. A one standard
deviation increase in ACQUISITIONS/ SIZE raises the likelihood of unification by 0.6 %
a year. The data do not allow us to distinguish between the acquisitions with cash and
stock. Higher acquisitions activity is expected to measure the fact that the firm may want
to use stock in at least some of the acquisitions. In Regression (4) both, equity issues and
acquisitions, effects are included in one model. The estimates remain highly significant.
All the regressions in Table 4 show that SIZE has a negative (but insignificant)
effect on the probability of unification. INDUSTRY MTB which is a proxy for future
growth opportunities has a positive relation with the probability of unification, as
predicted (the coefficients are significant at the 10 % level in two out of five regressions).
All the proxies for the value of control and private benefits are significant and
have the predicted signs. The most significant is a dummy variable that takes a value of 1
if the difference between the control and cash flow rights held by the largest shareholder
is above the median separation in firms where control and cash flow rights differ
(CONTROL EXCEEDS OWNERSHIP, HIGH). If the controlling shareholder moves
from high separation between ownership and control to low separation, the likelihood of
unification raises by 1.5 % a year. If the largest shareholder is a financial investor, the
probability of unification increases by 2.3 % a year. This result can mean that the

23
financial investors have lower incentives for private benefit extraction. Alternatively, the
financial investors are more concerned about the stock price of the companies they have
invested in, as their performance is mostly valued by the return of investment made. As
predicted, the U.S. cross-listing is positively related to the likelihood of unification. If US
CROSS-LISTING DUMMY changes from zero to one, the odds of unification increase
by 2.6 % a year. We do not differentiate between Level 1, 2, 3 and Rule 144A ADRs, but
most of them are traded as Level 2 and Level 3 (capital raising issues that trade on the
NYSE or NASDAQ). There are 19 cross-listed firms among the event group. All but 4 of
them were cross-listed before the unification, 2 tapped the US market in the same year as
the unification took place (a couple of months after it), and 2 firms cross-listed in the US
one and two years after the unification. Coding these 4 firms as not cross-listed slightly
reduces the significance of this variable (to the 10 % level).
Regression (5) shows the results when an interaction term between EQUITY
ISSUE DUMMY and INDUSTRY MTB is included. This specification attempts to
measure whether there is any effect of future growth opportunities if a firm is not
planning to issue equity in the nearest future. The coefficient on INDUSTRY MTB is
positive and significant at the 10 % level. It means that among firms that do not plan to
issue equity in the nearest future, the presence of growth opportunities raises the
likelihood of unification. For firms that did issue new equity, INDUSTRY MTB does not
have any additional explanatory power. The sum of coefficients on the interaction term
and INDUSTRY MTB is not different from zero (p-value 0.5).
Several alternative specifications are tested (not reported). If we include industry
dummies instead of INDUSTRY MTB, the results on equity issues and acquisitions, as

24
well as on private benefits proxies do not change. Firm MTB is not significant when
INDUSTRY MTB is included. This means that the positive effect of firm’s MTB is
driven by industry growth opportunities. Past SALES GROWTH and past CAPEX (as
proxies for growth opportunities) are not significant, suggesting that the event firms are
associated with high expected growth rather than high current growth. Excluding
financial industry (SIC 62-67) does not change the results. Excluding years of lower
unification activity (1996 and 1997) does not change the results. The proxies for firm’s
equity dependence as suggested by Kaplan and Zingales (1997) – LEVERAGE, CASH
FLOW/ ASSETS, CASH BALANCE/ ASSETS, CASH DIVIDENDS/ ASSETS – are not
significant. These variables have only indirect effect on unification as they have some
power in explaining the likelihood of new equity issues. A firm with higher leverage and
lower cash resources is not more likely to unify the shares unless it actually plans to issue
new equity. MULTIPLE BLOCKHOLDER DUMMY has a negative effect on the
probability of unification, and it is significant at the 10 % level in only one out of five
regressions in Table 4. One may argue that preferred stock (with preferential dividend) is
introduced for different reasons than pure multiple voting stock (with equal dividend
rights). All regressions were re-run separately for firms that have preferential dividend on
low voting shares and for firms that do not have them. The main results remain
unchanged suggesting that firms with preferred stock for the purposes of this study (as
well as for many previous studies) bear similar characteristics to other dual-class firms.
The pooled probit ignores the possible effect of unobserved firm-specific factors
which might be correlated with the explanatory variables. For example, majority owner’s
family tradition to keep control might affect the resistance to issue new equity, the wish

25
to keep higher separation between votes and equity, as well as the resistance to abandon
dual class shares. To control for these unobserved firm-specific effects, we also estimate
fixed effects logit model (not reported). The advantage of this model is that it is possible
to obtain a consistent estimator without any assumptions about how the unobserved firm
effects are related to the explanatory variables. The disadvantage though is that we can
only include the variables that vary over time at least for some firms. All the signs on the
main time-varying variables, EQUITY ISSUE DUMMY, EQUITY ISSUE PROCEEDS/
EQUITY, ACQUISITIONS/ SIZE, and INDUSTRY MTB, remain as predicted. The new
equity issues lose significance (p-value is 0.2), acquisitions remain significant (at the 1 %
level), and industry growth opportunities are significant (at the 5 % level), too. The
results suggest that keeping unobserved firm effects fixed, increase in respective
industry’s growth opportunities and acquisition activity raises the likelihood of
unification. The reason why new equity issues variable loses significance in the within
model is related to the previous result that even if a firm is not issuing equity in the
current year, high growth opportunities increase the likelihood of unification. The firm
may want to issue equity in the subsequent years (since the firm is dropped from the
sample after the unification, we cannot capture the effect of future issues).
4.2. Robustness check: Cross-sectional analysis
Table 5 presents the results of a probit model on the probability to unify dual-
class shares using average (cross-sectional) data on 493 firms. This model specification
asks the question: What are the average characteristics of firms that unify their shares? In
this model, time-varying variables are averaged according to the following algorithm.
The equity issue and acquisitions variables are averaged over all the sample years 1996-

26
2002 to measure the average equity issuance and acquisitions activity in this period. SIZE
and INDUSTRY MTB are averaged over two years prior to the unification for event
firms, and over 1994-2001 for control firms. This way of averaging attempts to capture
the situation in the dual-class firms prior to a potential unification. The results are largely
the same if the averaging for event firms is done over 1994 to one year prior to the
unification. The proxies for private benefits are not time-varying, so no averaging is
needed. One variable is added if compared with the previous specifications, namely a
dummy variable which takes a value of 1 if there has been at least one new equity issue in
period 1996-2002. The average of EQUITY ISSUE (ADJUSTED) DUMMY is used
instead of simple EQUITY ISSUE DUMMY to avoid overstating equity issuance activity
if the firm does not report the proceeds from new equity issues in years when there have
been no issues.
The results in Table 5 largely confirm my previous findings. All equity issue and
acquisitions variables are significant. If a firm has made a seasoned equity offering at
least once during 1996-2002, the probability of unification in this period increases by 17
%. A one standard deviation increase in EQUITY ISSUE PROCEEDS/ EQUITY
(AVERAGE) raises the likelihood of unification by 5 %, and a one standard deviation
increase in ACQUITIONS/ SIZE (AVERAGE) by 4 %. INDUSTRY MTB is highly
significant, too (at the 1 % level), a one standard deviation increase in this variable raises
the likelihood of unification by 7 %. Equity issues, acquisitions and industry MTB remain
significant if they are included one by one (not reported). High separation between
ownership and control remains negative and highly significant. The effect of financial
investor and U.S. cross-listing is positive but less significant. The results suggest that the

27
firms that unified their shares in 1996-2002 were on average more active in issuing new
equity and making acquisitions, and had substantially higher growth opportunities than
other dual-class firms.
A source of concern both in cross-sectional model and panel data is that the equity issue
and acquisitions variables are endogenous. It is difficult to find a good instrument for
these variables to carry out the instrumental variables models or a bivariate probit. As a
robustness, I did a test of endogeneity using continuous endogenous explanatory
variables method (described in e.g., Wooldridge, 2002) treating EQUITY ISSUE
DUMMY (AVERAGE) as an endogenous variable. I use LEVERAGE (AVERAGE) as
an instrument for equity issues. Leverage is clearly correlated with new equity issues.
High leverage is one of the reasons why companies need to approach the equity markets,
and there is no evidence why it should be directly correlated with the unification decision.
However, we can only rely on the results of this test if we believe that the average
leverage is exogenous (one can argue that it is hard to change leverage quickly and
dramatically). If one disagrees with this assumption, the following test does not make
sense. So, for those who believe… In the first step, average EQUITY ISSUE DUMMY is
regressed on INDUSTRY MTB, LEVERAGE, SIZE, and country dummies. Indeed,
LEVERAGE has a significant positive impact on the new equity issues, and so does
INDUSTRY MTB. In the second step, probit regression is estimated including the
residuals from the first-step regression. The t-statistic on the residuals is a direct test of
null hypothesis of endogeneity of the proceeds variable. The t-statistic is 0.68 (not
significant). The average EQUITY ISSUE DUMMY remains significant.
28
4.3. Robustness check: Matching sample
One way to deal with the problem of endogeneity of equity issues and acquisitions
variables is to construct a matching sample of firms, where the matching is based on the
most likely suspects for endogeneity. I match firms on size, industry and market-to-book,
and check whether there is still substantial difference in new equity issues and
acquisitions (and other variables) between the event group and the control group.
The combination of Loughran and Ritter (1997) and Barber and Lyon (1997)
matching algorithms is used to find the closest match for each event firm. The firms are
matched on industry, size (log of sales), and market-to-book ratios. All 493 main sample
dual-class firms are divided into 108 groups: 12 industries times 3 size categories times 3
MTB categories. The two-digit SIC codes are combined into 12 larger industry groups
following Campbell (1996)8. Size and MTB categories are High (75th percentile and
upward), Medium (25th to 75th percentile), and Low (25th percentile and downward).
Market-to-book data at the end of the year preceding the unification is missing for seven
event firms, which are therefore excluded. We proceed with finding the closest match for
101 event firm. The matching is done based on the firm characteristics at the end of the
year preceding the unification. If there are more than one dual-class firm in the same
group as the event firm, the firm with the closest MTB is chosen. If there is no matching
8 Basic industry (SIC 10, 12, 14, 24, 26, 28, 33), Capital goods (SIC 34-35, 38), Construction (SIC 15-17,
32, 52), Consumer durables (SIC 25, 30, 36, 37, 39, 50, 55, 57), Financial/ real estate (excluding banks)
(SIC 62-69), Food and tobacco (SIC 1, 20, 21, 54), Leisure (SIC 27, 58, 70, 78-79), Petroleum (SIC 13,
29), Services (SIC 72-73, 75-76, 80, 82, 87, 89), Textiles and trade (SIC 22-23, 31, 51, 53, 56, 59),
Transportation (SIC 40-42, 44-45, 47), and Utilities (SIC 46, 48, 49).

29
firm in the same group (there are 3 such cases), the firm from the same industry with the
closest MTB ratio from the next closest size category is taken.
Panel A of Table 6 reports the comparison of means of different variables in the
two matched groups three, two, and one year prior to the unification. The table reports the
t-Statistic of testing the equality of means. The results are largely the same if we use the
z-Statistic testing the equality of distributions between the event firms and control firms
using the Wilcoxon matched-pairs signed-rank test. The results provide strong support for
the hypothesis that the value of control (private benefits) is lower in firms that decide to
unify the shares. In particular, in the event firms, CONTROL EXCEEDS OWNERSHIP,
HIGH is significantly lower (at the 1 % level), there are more firms with preferential
dividends on low voting shares, and the VOTING PREMIUM three, two, and one year
prior to the unification is significantly lower. Regarding the voting premium, one could
argue that one year prior to the unification, the market expects the unification and
therefore the voting premium goes down. It is though difficult to argue that the market
predicts the unification already three years prior to the event. Therefore the significant
difference in VOTING PREMIUM three years prior to unification should be a good
proxy for private benefits of control associated with a particular controlling shareholder.
The results on the relative liquidity between the two share classes (measured by
RELATIVE TURNOVER and RELATIVE TRADING DAYS) are inconclusive. There is
not much difference between the event and control group. The interpretation is that the
simple fact that the high voting shares trade significantly less frequently and in lower
volumes than the low voting shares, and the fact that in 37 % of firms only one share
class is traded is the reason for unification. By unifying, the firms can raise the trading
30
volume to at least the level of low voting shares, and can raise the trading activity by
having more shares listed on the market.
The comparison between the matching sample strongly corroborates the finding
that the firms that issue new equity and make acquisitions are the ones that are more
likely to unify their shares (see Panel B of Table 6). The difference between the equity
issue and acquisitions variables in year zero (the unification year) is statistically
significant. Thirty six percent of event firms issued equity compared to only 19 % of the
matched control firms, and average ACQUISITIONS/ SIZE was 0.23 in the event firms
compared to 0.11 in the matched control firms.
The results show that the INDUSTRY ADJUSTED MTB prior to the unification
is consistently higher in the event firms, but the difference is not significant. The event
firms appear to pay lower cash dividends prior to the unification. Also cash flow is lower
and the leverage higher (not significant). The only explanation for these results is the
Kaplan and Zingales (1997) equity dependence story, namely the cash constraints raise
the need for new equity capital and hence the likelihood of unification. Keeping growth
opportunities constant, the event firms are the ones that are more dependent on equity
capital. All the equity issue and acquisitions variables are consistently higher in the event
group in all three years prior to the unification (though the difference is significant only at
the 10 % level in two cases), again suggesting higher equity capital dependence.
The probit model regressions using the panel data of the matched 202 firms (not
reported) provide qualitatively similar findings to the ones presented before. In particular,
the new equity issues and acquisitions in the year of unification, and high separation
between votes and equity remain highly significant. This result means that keeping

31
growth opportunities fixed, the firms that actually issue new equity, make acquisitions,
and have lower value of control are more likely to unify their shares.
A rather novel methodology suggested for matching samples in financial studies
is the propensity score algorithm. The algorithm has been proposed by Dehejia and
Wahba (2002), and has been used in several recent studies (e.g., Villalonga, 2002; Hillion
and Vermaelen, 2003). As a robustness check, I implement this method. The method
involves the following steps:
1) Estimating the propensity to unify. The unification probability is modeled using
the probit model on averages (cross-section): Pi = PROB(Di=1| Xi,), for i=1,..N. Xi is a
vector of characteristic observed for firm i. The characteristics are average SIZE, average
INDUSTRY MTB, average LEVERAGE, CONTROL EXCEEDS OWNERSHIP, HIGH,
FINANCIAL INVESTOR DUMMY, US CROSS-LISTING DUMMY, and COUNTRY.
Averages are taken over years 1994-2001 for dual-class firms that did not unify, and over
two years prior to the unification for firms that unified.
2) Computing the propensity scores for event and control group firms as the
predicted values from the model of step 1.
3) Matching each event firm to the control firm with the closest propensity score.
In this way, a sample of “nearest-match” control firms is created.
The idea of this specification is to test whether event firms issue more new equity
and have more acquisitions once we control for all the other relevant characteristics, in
particular, the industry growth opportunities and proxies for private benefits. The beauty
of the method is that it allows to reduce the dimensionality of the matching problem.

32
Table 7 reports the results. It remains the case that the firms that unified their
shares are characterized by higher level of new equity issues and acquisitions.
5. Ex-post consequences of unification
In this section two methods are used to estimate the possible consequences of the
unification: a fixed-effects regression using dummy variables for the year of unification,
and a comparison of variables between the event group and the matched control group.
The discussion about changes of ownership after the unification is also presented here.
5.1. Fixed-effects
The consequences of unification are first estimated using fixed-effects regressions
in which the effect of unification is captured by dummy variables for the year of the
unification and the three subsequent years (as in Pagano et al., 1998):
yit=α+UNIt+UNIt-1+UNIt-2+UNIt-3+ui+dt+εit, (2)
where yit is the variable of interest in firm i in year t, ui and dt are respectively a
firm-specific and calendar year-specific effect, UNIt-j are dummy variables equal to one if
year t-j was the year of the unification. In this model, a firm before the unification is used
as a control for itself after the unification. The different variables can be affected not only
by the unification decision but by some fundamental changes in the firm. To control for
these fundamental effects, we include the most applicable control variables. The
estimates of other variables are not reported, but are discussed where appropriate.
Table 8 presents the results. The INDUSTRY ADJUSTED MTB increases
significantly in the year of unification and the two consecutive years. The joint test shows
that the sum of coefficients for the two years after the unification is significantly positive

33
(at the 1 % level). The result remains significant when we control for lagged sales growth
and return on equity. The result holds also when we include only firms that issued equity
in the same year as the unification. This finding provides evidence that firms actually
reach their goal of increasing the share value by switching to one share - one vote system.
LEVERAGE decreases significantly in the first and second year after the
unification. CAPEX increases in all years following the unification, but the effect is not
significant. SALES GROWTH increases significantly following the unification. The joint
test shows that the sum of coefficients for the two and three years after the unification is
significantly positive (at the 5 % level). The effect on operating performance is mixed;
there is no change in ROA, while ROE slightly decreases (not significant). CASH
FLOW/ ASSETS, CASH BALANCE/ ASSETS, and CASH DIVIDENDS/ ASSETS all
increase after the unification, but the result is slightly significant only for cash dividends.
EQUITY ISSUE PROCEEDS/ EQUITY and ACQUISITIONS/ SIZE remain
positive on the year of unification. The equity issues decrease in the year following the
unification (not significant). It is not surprising since firms rarely issue new equity every
year. If there has been an issue in the unification year, it is likely that the firm will not
issue in the following year. The result suggests that if a firm has decided to issue new
equity, the equity issue is timed together with the unification to mask the negative signal
of a SEO. Previous research has shown that the SEOs are followed by lower market
valuations (Loughran and Ritter, 1995; Levis, 1995) and performance (Loughran and
Ritter, 1997). The unification, in turn, creates a positive publicity that the firm is
improving its corporate governance. In firms that issued equity in the unification year,
34
INDUSTRY ADJUSTED MTB increases following the unification suggesting that the
positive signal of the unification is stronger than the negative signal of a SEO.
5.2. Matching sample
Following the matching on industry, size, and market-to-book introduced in
Section 4.3, we compare the financial ratios in the event group and the matched control
group one to three years after the unification. The results are presented in Panel B of
Table 6.
The comparison of means between the event firms and the matched control firms
corroborates the result of increased market valuation after the unification. INDUSTRY
ADJUSTED MTB in the event firms is higher in all three years after the unification. The
difference is the highest (significant at the 5 % level) in the next year after the unification.
Interestingly, the sign of the variable changes: average INDUSTRY ADJUSTED MTB
becomes positive for event firms in the first and second year after the unification, while it
remains negative for the control firms. The result confirms that the firms succeed in their
aim to increase the market value by unifying shares.
Operating performance (ROA and ROE) in the years following the unification
tends to be lower in the event group, but the result is not significant. The results on
CAPEX and SALES GROWTH are mixed and not significant. Interestingly, once we
keep growth opportunities fixed, the firms that unified their shares are not growing faster
and investing more than similar firms that have kept the dual-class structure.
LEVERAGE is lower in the event group following the unification. We may observe that
the difference arises because of increased leverage in the control group and slightly
decreased leverage in the event group. Given the fact that the control firms are the closest

35
matches by growth opportunities, it can be interpreted that the event firms have chosen to
finance the growth with equity, while the control firms – with debt.
5.3. Ownership changes
Table 9 summarizes the changes in ownership structure after the unification in 71
event firm (where the data was available). This summary attempts to shed some light on
the hypothesis that the unification is more likely if the controlling shareholder is planning
to sell her stake, i.e., is eager to increase the share price before the sell-out.
Panel A of Table 9 shows that the controlling shareholder (before the unification)
does not have a block of shares (10 % of total stock) after the unification in 28 % of cases
(20 out of 71 firm). It is a weak support to the hypothesis that the controlling
shareholder’s willingness to sell out may be one of the reasons for unification. However,
in most of the cases (66 %), the controlling shareholder keeps some control by holding at
least 10 % of total stock. Therefore, it is hard to argue that the controlling shareholder’s
willingness to sell her stake is one of the main drivers for the unification.
In Panel B of Table 9, we observe that on average the controlling shareholder’s
voting power decreases from 39 % to 23 %, while the equity stake stays virtually the
same. The decrease in voting power is mainly the consequence of the unification (the
alignment of control and ownership stakes) rather than from selling the shares.
In sum, it is more plausible that the controlling shareholder is ready to accept the
unification of shares because of the expected dilution of control arising from planned new
equity issues, and not because she is planning to sell her shares.

36
6. Other evidence
An obvious question arises of what companies themselves are saying about the
unification, why they do it. Table 10 presents a brief summary of statements made by
several of the event companies. Explicit statements about the reasons for unification were
found in about one-fifth of the event companies. The most common reasons mentioned
by company representatives are classified into eight groups. Four of the reasons –
increase liquidity, increase share value, pay for acquisitions using stock, and support
growth – have already been discussed, and were strongly supported by formal tests in the
previous two sections. For two of the reasons – financial flexibility and take-over defense
– there is not much to comment. The statement about augmenting financial flexibility
seems too general. The unification as a defense for take-over was mentioned only in the
case of Nokia, and is not a very standard one since in most of the companies the share
structure does not become dispersed after the unification (see Table 9). Here I would like
to focus on the investor recognition argument.
The arguments for increasing investor recognition can be (subjectively) divided
into “rational” and “behavioral” ones. The rational arguments, for example, (16) and (17),
state that the dual-class shares are not available to certain investor groups (in particular,
investment funds) due to legal restrictions. In the U.S. and other countries, certain
investment funds are not allowed to invest in dual-class shares. This is clearly a rational
argument for why the investor base is lower in the dual-class firms. The arguments
summarized under the “behavioral” ones, (18) to (21), suggest that the company believes
that the investor base is lower because the dual-class firms are not familiar to certain
investor groups (mostly, foreign investors), which “do not understand this division of

37
shares”. Statement (21) is very close to the idea that investors tend to invest in certain
categories of shares (Barberis and Shleifer, 2003). In this case, the company believes that
there is a disadvantage of being in the “Not Luxus category with two share classes”.
Statements (18) and (20) show that there are cases when the majority owner keeps
effective control after the unification. In these cases, it is hard to argue that the level of
private benefit extraction would change, and that investors would immediately assign a
higher valuation on the share. Again it may suggest that the company thinks that it may
benefit from simply moving out of the dual-class firm category.
Statement (21) points towards the competition for capital story. When there are
more single-class shares around, a dual-class firm can find it more difficult to attract
investors. This argument is also supported by the fact that we observe much less
unifications in Sweden where there are still many dual-class firms and many dual-class
IPOs (see Table 2). Swedish investors do not have choice between so many single-class
firms; moreover, they are more familiar with such capital structures, hence invest in dual-
class firms. As a result, Swedish dual-class firms may find it easier to raise capital
without unification as they have less competition from the single-class issuers.
There are other arguments why we observe significantly less unifications and
higher incidence of dual-class firm takeovers in Sweden. In particular, Holmen and
Högfeldt (2003) argue that in Sweden strong founding family control may be pivotal for
the firm as it brings entrepreneurial knowledge, social network, and the urge to keep
prestige and social recognition for being a good “father/mother of the firm”. Still this
explanation is conditional on the fact that firm’s market valuation is shaped by domestic

38
investors. For a foreign investor, it is presumably harder to distinguish which family cares
about prestige and which cares about monetary benefits from diverting profit.
7. Conclusions
This paper argues that the unification of dual-class shares is carried out with an
aim to increase the firm’s share value. The data show that firms that unify their dual-class
shares are more active in issuing new equity, make more acquisitions, and have higher
industry growth opportunities – the firm characteristics that are associated with
substantial gains from higher share value. The results hold after including various
controls and they are robust to different methodologies. Further, the ex post analysis of
the unification show that the firms reach their goal. The average market-to-book ratios
that are constantly lower in dual-class firms jump to the average level of single-class
firms in the same industry right after the unification.
An important precondition for the unification to happen is approval by the
controlling shareholders. I find that higher value of control rights significantly reduces
the probability of unification. In particular, the event firms have weaker separation
between voting rights and cash flow rights, lower voting premium on high voting shares,
stronger presence of a large financial investor, higher frequency of preferential dividends
on low voting shares, and higher frequency of cross-listing in the U.S.
A survey of press releases and newspaper articles shows that many firms find it
important to appeal to certain investor groups (particularly, foreign investors and
investment funds), and perceive the unification as a tool to boost investor recognition. By
timing the unification with a seasoned offering, the firms also seem to exploit the

39
marketing benefits of greater media attention. The positive publicity related to the switch
to one share - one vote arguably is a good advertisement that raises investor recognition.
Consistent with Amoako-Adu and Smith (2001), I argue that the dual-class shares
are temporary structures until the point when the firm needs new equity capital for further
expansion and growth. For some firms it may take few years, for others it may never
happen. By comparing dual-class firms with ex ante similar growth opportunities, the
results show that there is no difference in ex post sales growth and capital expenditure
between the firms that unified shares and those that stayed dual-class. There is a
difference in how the two groups finance growth. The ones that unify are more equity
capital dependent, and find it optimal to boost the stock price. The ones that stay dual-
class finance growth with retained earnings or debt, and do not worry that the share price
is lower than that of single-class firms in the industry. In sum, the paper suggests that all
dual-class firms should not be forced by law to switch to one share - one vote. The firms
that need to approach equity markets for capital will sooner or later be forced by the
market to unify their shares.

40
Appendix A.
Voting arrangements
Country Most common votingarrangement
Most characteristicswitch
Regulatory and other issues related to dual-classshares
Denmark High voting shares have10 times the votingrights of low votingshares.
Abandoningmultiple voting rightshares.
One of the recommendations by the NørbyCommittee’s (which was set up in March 2001)report on Corporate Governance in Denmark is: “It isrecommended that there is proportionality betweencapital investments and voting rights and that theboard refrains from countering takeover bids on itsown”. The Copenhagen Stock Exchange hasrecommended the listed companies to relate to theNørby Committee’s recommendations for goodcorporate governance in their annual reports andaccounts.
Finland High voting shares have10-20 times the votingrights of low votingshares.
Abandoningmultiple voting rightshares.
The change in the Companies Act (in effect from 1September 1997) stipulates that a 2/3 majority isrequired in every share class for certain importantcorporate decisions to be made. This changeeffectively increased the capital needed to securecontrol.
Germany Ordinary shares haveone vote. Preferenceshares are nonvoting.Maximum allowablenon-voting preferenceshare capital is one half.Law prescribes a prioritydividend for preferenceshares.
Changingpreference sharesinto ordinaryshares.
Stock market index compilers have been urgingcompanies to standardize shares through abolishingpreference shares in order to make indices moretransparent and accurate. Following the re-evaluation of the Dax and M-Dax indices on June,2002, only one type of share is permitted forinclusion in the index (i.e., either ordinary orpreference share of the company). Preferenceshares are not allowed to be listed on Neuer Markt(established in 1997).
Italy Ordinary shares haveone vote. Savingsshares are nonvoting.Non voting (and limitedvoting) capital may notexceed 50% of stockcapital. Nonvotingshares (savings shares)are entitled to aminimum dividend equalto 5% of the par value.
Abandoning (non-voting right)savings shares andlimited voting rightshares.
In 1998, legal protection for investors was improvedwith the so called Draghi’s law. If evaluated in termsof the index of shareholder protection developed byLa Porta et al. (1998), the impact of this law was animprovement in shareholder protection from 1 to 5.The threshold to call a shareholder meeting wasreduced to 10 %. The loopholes in the takeover lawwere corrected. Minority shareholders were givenmore rights to voice their opinions. See Aganin &Volpin (2003). Only ordinary shares are allowed tobe listed on Nuovo Mercato (established in 1999).
Norway A shares have one vote.B shares are nonvoting.Special governmentpermission required forissuing dual-classshares.
Abandoningmultiple voting rightshares.
Eierforum is an informal group that represents thelargest institutional investors in Norway. The grouphas produced guidelines for good shareholderaccountability, which suggest that “The board shouldpositively encourage all activities which strengthenliquidity in the company's shares, and should ensurethat such activities are based on the principle of oneshare - one vote.”
Sweden High voting shares have10 times the votingrights of low votingshares.
Abandoningmultiple voting rightshares.
There have been proposals since long to change thelaw that allows the differentiation between votingpower of A and B shares. Since 1997, shares canbe issued only at a maximum ratio of 1:10 votes(previously, up to 1:1000 was allowed).
Switzerland Each share has onevote, but differentclasses are allowed tohave different nominalvalue, i.e., in principle,different voting power.
Changing bearershares (inhaber)into registered(namen), singlenominal valueshares.
The current trend toward converting bearer sharesinto registered shares has mainly two sources: anincreasing awareness of the importance of investorrelations and technological developments enablingcompanies to handle extensive shareholderregisters in electronic form.
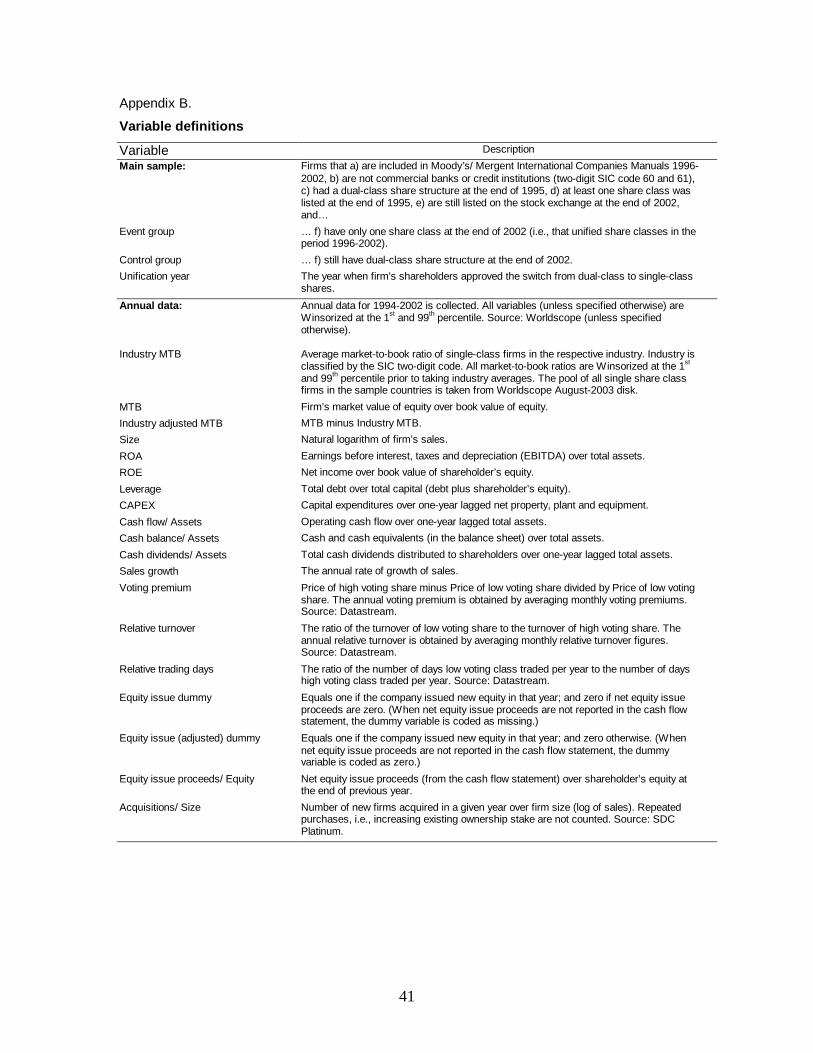
41
Appendix B.
Variable definitions
Variable Description
Main sample: Firms that a) are included in Moody’s/ Mergent International Companies Manuals 1996-2002, b) are not commercial banks or credit institutions (two-digit SIC code 60 and 61),c) had a dual-class share structure at the end of 1995, d) at least one share class waslisted at the end of 1995, e) are still listed on the stock exchange at the end of 2002,and…
Event group … f) have only one share class at the end of 2002 (i.e., that unified share classes in theperiod 1996-2002).
Control group … f) still have dual-class share structure at the end of 2002.
Unification year The year when firm’s shareholders approved the switch from dual-class to single-classshares.
Annual data: Annual data for 1994-2002 is collected. All variables (unless specified otherwise) areWinsorized at the 1st and 99th percentile. Source: Worldscope (unless specifiedotherwise).
Industry MTB Average market-to-book ratio of single-class firms in the respective industry. Industry isclassified by the SIC two-digit code. All market-to-book ratios are Winsorized at the 1st
and 99th percentile prior to taking industry averages. The pool of all single share classfirms in the sample countries is taken from Worldscope August-2003 disk.
MTB Firm’s market value of equity over book value of equity.
Industry adjusted MTB MTB minus Industry MTB.
Size Natural logarithm of firm’s sales.
ROA Earnings before interest, taxes and depreciation (EBITDA) over total assets.
ROE Net income over book value of shareholder’s equity.
Leverage Total debt over total capital (debt plus shareholder’s equity).
CAPEX Capital expenditures over one-year lagged net property, plant and equipment.
Cash flow/ Assets Operating cash flow over one-year lagged total assets.
Cash balance/ Assets Cash and cash equivalents (in the balance sheet) over total assets.
Cash dividends/ Assets Total cash dividends distributed to shareholders over one-year lagged total assets.
Sales growth The annual rate of growth of sales.
Voting premium Price of high voting share minus Price of low voting share divided by Price of low votingshare. The annual voting premium is obtained by averaging monthly voting premiums.Source: Datastream.
Relative turnover The ratio of the turnover of low voting share to the turnover of high voting share. Theannual relative turnover is obtained by averaging monthly relative turnover figures.Source: Datastream.
Relative trading days The ratio of the number of days low voting class traded per year to the number of dayshigh voting class traded per year. Source: Datastream.
Equity issue dummy Equals one if the company issued new equity in that year; and zero if net equity issueproceeds are zero. (When net equity issue proceeds are not reported in the cash flowstatement, the dummy variable is coded as missing.)
Equity issue (adjusted) dummy Equals one if the company issued new equity in that year; and zero otherwise. (Whennet equity issue proceeds are not reported in the cash flow statement, the dummyvariable is coded as zero.)
Equity issue proceeds/ Equity Net equity issue proceeds (from the cash flow statement) over shareholder’s equity atthe end of previous year.
Acquisitions/ Size Number of new firms acquired in a given year over firm size (log of sales). Repeatedpurchases, i.e., increasing existing ownership stake are not counted. Source: SDCPlatinum.

42
Appendix B (Continued)
Fixed data:
US cross-listing dummy Equals one if company’s shares (at least one class) is cross-listed in the US at the endof 1995 through an ADR (American Depository Receipt) program (not differentiatingbetween various types of listing). Sources: Datastream, Moody’s/ Mergent Manuals.
Both shares listed dummy Equals one if all shares with different voting rights are listed on the stock exchange; andzero otherwise. Sources: Datastream, Moody’s/ Mergent Manuals.
Dividend dummy Equals one if low voting shares received higher dividend than high voting shares in atleast one year during 1990 and 2001. Equals one half if low voting shares have aminimum dividend requirement set in the bylaws, but in practice both shares havereceived the same dividend since 1990 (e.g., because the dividend was above theminimum required). Equals zero if both shares have equal dividend rights. Sources:Moody’s/ Mergent Manuals, Datastream, annual reports, Lexis-Nexis.
Ownership data: For control group, the ownership data come from Faccio and Lang (2002), from theannual reports and Worldscope (for Denmark, which is not covered in Faccio and Lang).Faccio and Lang data is from 1996 for Germany, Italy, and Switzerland; from 1998 - forSweden and Norway; and from 1999 - for Finland. For event group, the ownership datacome from the annual reports one year prior to the unification, Worldscope, or Lexis-Nexis. The ownership data after the unification for event firms come from the annualreports and Lexis-Nexis.
Control Fraction of the firm’s voting rights owned by the largest shareholder (ranked by votes).
Ownership Fraction of the firm’s capital (cash flow) rights owned by the largest shareholder (rankedby votes).
Control minus Ownership The difference between control rights and cash flow rights.
Control exceeds Ownership, high Equals one if control rights (Control) are higher than cash flow rights (Ownership), and ifthis separation is higher than the median separation in corporations where control andownership differ, and zero otherwise.
Family owner dummy Equals one if the largest shareholder (ranked by votes) is a family (a private person orindividuals with the same surname or a family trust); and zero otherwise.
Financial investor dummy Equals one if the largest shareholder (ranked by votes) is a financial institution; andzero otherwise.
Multiple blockholder dummy Equals one if the fraction of votes controlled by the second largest shareholder (rankedby votes) is more than ten percent; and zero otherwise.

43
References
Aganin, A., Volpin, P., 2003. History of corporate ownership in Italy. ECGI Working paper 17/2003.
Amoako-Adu, B., Smith, B.F., 2001. Dual class firms: capitalization, ownership structure andrecapitalization back into single class. Journal of Banking and Finance 25, 1083-111.
Barber, B.M., Lyon, J.D., 1997. Firm size, book-to-market ratio, and security returns: a holdout sample offinancial firms. Journal of Finance 52, 875-883.
Barberis, N., Shleifer, A., 2003. Style investing. Journal of Financial Economics 68, 161-199.
Bebchuk, L., Kraakman, R., Triantis, G., 2000. Stock pyramids, cross-ownership, dual class equity: thecreation of agency costs of separating control from cash flow rights. In: Morck, R.K. (Ed.), Concentratedcorporate ownership. University of Chicago Press, Chicago.
Bennedsen, M., Nielsen, K., 2002. The impact of a break-through rule on European firms. Unpublishedworking paper. Copenhagen Business School.
Berglöf, E., Burkart, M., 2003. European takeover regulation. Economic Policy 18 (Issue 36), 171-213.
Bergström, C., Rydqvist, K., 1990. Ownership of equity in dual-class firms. Journal of Banking andFinance 14, 255-69.
Burkart, M., Gromb, D., Panunzi, F., 1998. Why higher takeover premia protect minority shareholders. TheJournal of Political Economy 106, 172-204.
Campbell, J.Y., 1996. Understanding risk and return. Journal of Political Economy 104, 298-345.
Claessens, S., Djankov, S., Fan, J., Lang, L, 2002. Disentangling the incentive and entrenchment effects oflarge shareholdings. Journal of Finance 57 (Issue 6), 2741-2771.
Cronqvist, H., Nilsson, M., 2003. Agency costs of controlling minority shareholders. Journal of Financialand Quantitative Analysis 38, 695-719.
DeAngelo, H., De Angelo, L., 1985. Managerial ownership of voting rights. Journal of FinancialEconomics 14, 33-69.
Dehejia, R.H., Wahba, S., 2002. Propensity score matching methods for non-experimental causal studies.Review of Economics and Statistics 84, 151-161.
Demers, E., Lewellen, K., 2003. The marketing role of IPOs: evidence from internet stocks. Journal ofFinancial Economics 68, 413-437.
Dimitrov, V., C. Jain, P.C., 2003. The effect of dual class recapitalization on long-run stock returns.Unpublished working paper. Available on SSRN.
Dittmann, I., Ulbricht, N., 2003. When do firms abolish dual-class stocks. Unpublished working paper.Available on SSRN.
Doidge, C., 2003. U.S. cross-listings and the private benefits of control: evidence from dual class firms.Journal of Financial Economics (forthcoming).
Ehrhardt, O., Nowak, E., 2002. Private benefits and minority shareholder expropriation – empiricalevidence form IPOs of German family-owned firms. CFS Working Paper No. 2001/10.
Faccio, M., Lang, L.H.P., 2002. The ultimate ownership of western European corporations. Journal ofFinancial Economics 65 (Issue 3), 365-395.
Fischel, D.R., 1987. Organized exchanges and the regulation of dual class common stock. Chicago LawReview 54, 119-152.
Giannetti, M., Simonov, A., 2002. Which investors fear expropriation? Evidence from investors’ stockpicking. Unpublished working paper. Stockholm School of Economics.
Grossman, S., Hart, O., 1988. One share - one vote and the market for corporate control. Journal ofFinancial Economics 20, 175-202.
Harris, M., Raviv, A., 1988. Corporate control contests and capital structure. Journal of FinancialEconomics 20, 55-86.
Hauser, S., Lauterbach, B., 2003. The value of voting rights to majority shareholders: evidence from dualclass stock unifications. Review of Financial Studies (forthcoming).
Hillion, P., Vermaelen, T., 2003. Death Spiral Convertibles. Journal of Financial Economics (forthcoming).

44
Hoffmann-Burchardi, U., 1999. Corporate governance rules and the value of control – a study of Germandual-class shares. LSE Financial Markets Group Discussion Paper, No.315.
Holmen, M., Högfeldt, P., 2003. A law and finance analysis of initial public offerings. Journal of FinancialIntermediation (forthcoming).
Jarell, G., Poulsen, A., 1988. Dual-class recapitalizations as anti-takeover mechanisms: the recent evidence.Journal of Financial Economics 20, 129-152.
Kaplan, S.N., Zingales, L., 1997. Do investment cash flow sensitivities provide useful measures offinancing constraints. The Quarterly Journal of Economics 112, 169-215.
La Porta, R., Lopez-de-Silanes, F., Shleifer, A., Vishny, R.W., 1997. Legal determinants of externalfinance. Journal of Finance 52, 1131-1150.
La Porta, R., Lopez-de-Silanes, F., Shleifer, A., Vishny, R.W., 1998. Law and finance. Journal of PoliticalEconomy 106, 1113-1155.
La Porta, R., Lopez-de-Silanes, F., Shleifer, A., Vishny, R.W., 2002. Investor protection and corporatevaluation. Journal of Finance 57, 1147-1170.
Lease, R., McConnell, J., Mikkelson, W., 1983. The market value of control on publicly tradedcorporations. Journal of Financial Economics 11, 439-71.
Levis, M., 1995. Seasoned equity offerings and the short and long-term performance of initial publicofferings in the U.K.. European Financial Management 1, 125-146.
Levy, H. 1983. Economic evaluation of voting power of common stock. Journal of Finance 38, 79-93.
Loughran, T., Ritter, J.R., 1995. The new issues puzzle. Journal of Finance 50, 23-51.
Loughran, T., Ritter, J.R., 1997. The operating performance of firms conducting seasoned equity offerings.Journal of Finance 52, 1823-1850.
McConnell, J., Servaes, H., 1990. Additional evidence on equity ownership and corporate value. Journal ofFinancial Economics 27, 595-612.
Merton, R.C., 1987. A simple model of capital market equilibrium with incomplete information. Journal ofFinance 42, 483-510.
Millon-Cornett, M., Vetsuypens, M., 1989. Voting rights and shareholder wealth: the issuance of limitedvoting common stock. Managerial and Decision Economics 10 (3), 175-88.
Nenova, T., 2003. The value of corporate voting rights and control: a cross-country analysis. Journal ofFinancial Economics 68, 325-351.
Pagano, M., Panetta, F., Zingales, L., 1998. Why do companies go public? An empirical analysis. Journalof Finance 53, 27-63.
Partch, M., 1987. The creation of a class of limited voting common stock and shareholder wealth. Journalof Financial Economics 18, 313-39.
Reese, W.A., Jr., Weisbach, M.S., 2002. Protection of minority shareholder interests, cross-listings in theUnited States, and subsequent equity offerings. Journal of Financial Economics 66, 65-104.
Robinson, C., Rumsey, J., White, A., 1996. Market efficiency in the valuation of corporate control:evidence from dual class equity. Canadian Journal of Administrative Sciences 13, 251-63.
Siegel, J., 2003. Can foreign firms bond themselves effectively by renting U.S. securities laws? Journal ofFinancial Economics (forthcoming).
Shleifer, A., Wolfenzon, D., 2002. Investor protection and equity markets. Journal of Financial Economics66, 3-27.
Smart, S.B., Zutter, C.J., 2003. Control as a motivation for underpricing: a comparison of dual- and single-class IPOs. Journal of Financial Economics 69, 85-110.
Smith, B., Amoako-Adu, B., 1995. Relative prices of dual class shares. Journal of Financial andQuantitative Analysis 30 (2), 223-39.
Stulz, R., 1988. Managerial control of voting rights: financing policies and the market for corporate control.Journal of Financial Economics 20, 25-54.

45
Villalonga, B., 2002. Does diversification cause the “diversification discount”? Unpublished workingpaper. Harvard Business School.
Wooldridge, J.M., 2002. Econometric Analysis of Cross Section and Panel Data. The MIT Press.
Wurgler, J., 2000. Financial markets and the allocation of capital. Journal of Financial Economics 58, 187-214.
Zingales, L., 1994. The value of the voting right: a study of the Milan stock exchange experience. TheReview of Financial Studies 7, 125-48.
Zingales, L., 1995. What determines the value of corporate control. Quarterly Journal of Economics 110,1047-1073.

46
Table 1.
Sample characteristics
Panel A describes the procedure of constructing the main sample of 493 companies used in this paper. In Panel B,sample construction is subdivided by country. Panel C shows the distribution of number of companies that switched fromdual-class to single-class shares in the period from 1996 to 2002, by years and countries.
Panel A: Sample construction
601 100% Dual class firms (excluding banks and credit institutions, SIC2 60 and 61) available in Moody's/Mergent manuals (1996-2002) which were listed on the stock exchange at the end of 1995.
- 63 10% Merged or taken over during 1996-2002.- 22 4% Delisted by stock exchange order or voluntarily (because of too little free float) during 1996-2002.- 7 1% Delisted, not clear why.- 8 1% Not traceable.- 8 1% Data not available in Worldscope.
493 82% Main sample. The firms that were still listed on the stock exchange at the end of 2002.out of which:
108 18% Firms that unified their shares in 1996-2002 (event group).385 64% Firms that stayed dual-class throughout 1996-2002 (control group).
Panel B: Sample construction by country
Event Control Merged or T/O Delisted Other Total
Denmark 10 55 14 6 3 88
Finland 6 30 4 1 1 42
Germany 41 88 9 2 1 141
Italy 12 45 3 8 1 69
Norway 6 9 2 3 - 20
Sweden 7 99 25 3 2 136
Switzerland 26 59 6 6 8 105
Total 108 385 63 29 16 601
Panel C: Unifications by country and year
1996 1997 1998 1999 2000 2001 2002 Total
Denmark - 1 1 1 1 2 4 10
Finland - 1 1 3 - 1 - 6
Germany 6 1 7 7 9 8 3 41
Italy - 1 1 2 3 2 3 12
Norway - - - 1 1 4 - 6
Sweden - - 1 - 3 2 1 7
Switzerland 2 3 6 3 6 4 2 26
Total 8 7 17 17 23 23 13 108
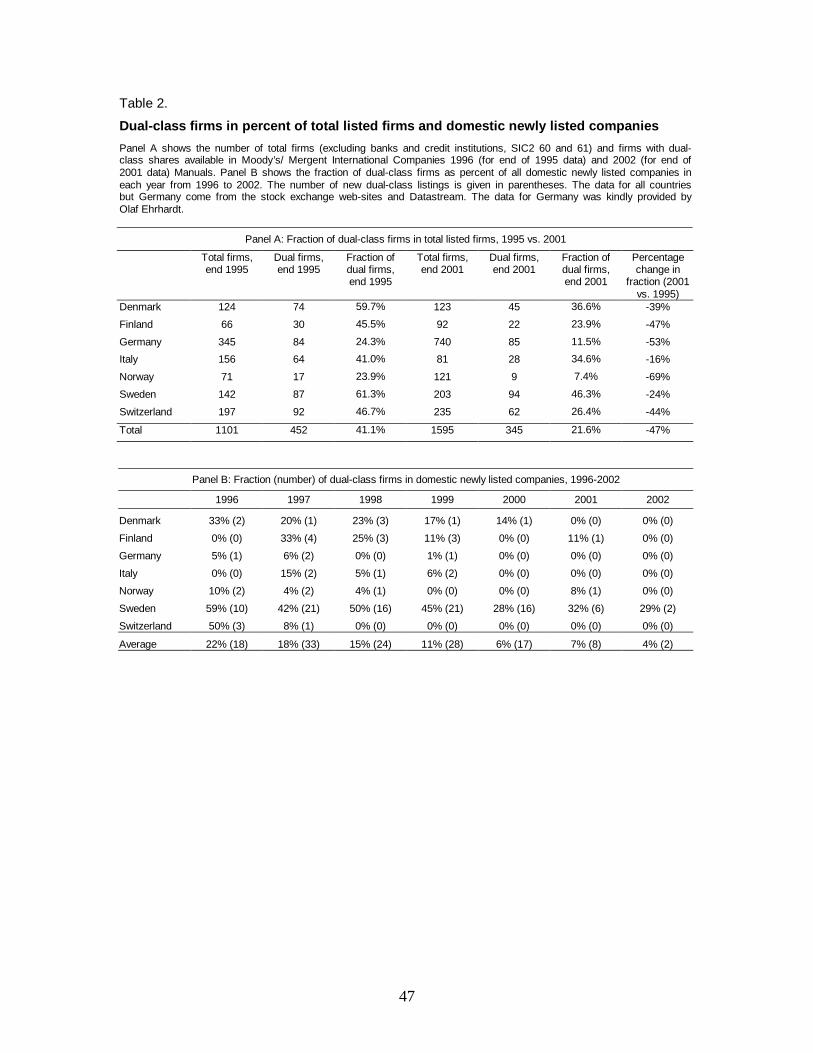
47
Table 2.
Dual-class firms in percent of total listed firms and domestic newly listed companies
Panel A shows the number of total firms (excluding banks and credit institutions, SIC2 60 and 61) and firms with dual-class shares available in Moody’s/ Mergent International Companies 1996 (for end of 1995 data) and 2002 (for end of2001 data) Manuals. Panel B shows the fraction of dual-class firms as percent of all domestic newly listed companies ineach year from 1996 to 2002. The number of new dual-class listings is given in parentheses. The data for all countriesbut Germany come from the stock exchange web-sites and Datastream. The data for Germany was kindly provided byOlaf Ehrhardt.
Panel A: Fraction of dual-class firms in total listed firms, 1995 vs. 2001
Total firms,end 1995
Dual firms,end 1995
Fraction ofdual firms,end 1995
Total firms,end 2001
Dual firms,end 2001
Fraction ofdual firms,end 2001
Percentagechange in
fraction (2001vs. 1995)
Denmark 124 74 59.7% 123 45 36.6% -39%
Finland 66 30 45.5% 92 22 23.9% -47%
Germany 345 84 24.3% 740 85 11.5% -53%
Italy 156 64 41.0% 81 28 34.6% -16%
Norway 71 17 23.9% 121 9 7.4% -69%
Sweden 142 87 61.3% 203 94 46.3% -24%
Switzerland 197 92 46.7% 235 62 26.4% -44%
Total 1101 452 41.1% 1595 345 21.6% -47%
Panel B: Fraction (number) of dual-class firms in domestic newly listed companies, 1996-2002
1996 1997 1998 1999 2000 2001 2002
Denmark 33% (2) 20% (1) 23% (3) 17% (1) 14% (1) 0% (0) 0% (0)
Finland 0% (0) 33% (4) 25% (3) 11% (3) 0% (0) 11% (1) 0% (0)
Germany 5% (1) 6% (2) 0% (0) 1% (1) 0% (0) 0% (0) 0% (0)
Italy 0% (0) 15% (2) 5% (1) 6% (2) 0% (0) 0% (0) 0% (0)
Norway 10% (2) 4% (2) 4% (1) 0% (0) 0% (0) 8% (1) 0% (0)
Sweden 59% (10) 42% (21) 50% (16) 45% (21) 28% (16) 32% (6) 29% (2)
Switzerland 50% (3) 8% (1) 0% (0) 0% (0) 0% (0) 0% (0) 0% (0)
Average 22% (18) 18% (33) 15% (24) 11% (28) 6% (17) 7% (8) 4% (2)

48
Table 3.
Summary statistics
In Panel A, the summary statistics refer to the firm-years of the whole sample of 493 companies, in Panel B – to the firm-years of companies that unified their shares in 1996-2002, and in Panel C – to the firm-years of companies that stayeddual-class throughout 1996-2002. T-Statistics and (two-sided) significance levels of testing the equality of means betweenthe event group and the control group are presented. *, **, and *** indicate statistical significance at the 10%, 5%, and 1%levels. Appendix B provides definitions for the variables.
Variable Mean Median Std. Dev. Min Max Obs. t-statistic Sig.
Panel A: The Whole Sample
Industry MTB 2.93 2.80 1.33 0.74 13.86 3438
MTB 2.43 1.53 2.91 0.27 28.26 3020
Industry adjusted MTB -0.57 -0.98 2.76 -12.49 25.10 3007
Size 5.50 5.54 0.95 0.48 7.96 3145
ROA 0.05 0.05 0.10 -0.61 0.50 3070
ROE 0.09 0.10 0.28 -1.93 1.87 3039
Leverage 0.25 0.24 0.18 0.00 0.82 3146
CAPEX 0.33 0.19 0.54 0.00 4.39 2964
Cash flow/ Assets 0.07 0.07 0.09 -0.59 0.39 2686
Cash balance/ Assets 0.12 0.08 0.13 0.00 0.84 3149
Cash dividends/ Assets 0.02 0.01 0.02 0.00 0.20 3078
Sales growth 0.10 0.06 0.28 -0.50 1.32 3065
Voting premium 0.16 0.05 0.33 -0.88 1.60 1186
Relative turnover 6.41 2.28 13.53 0.03 130.45 1012
Relative trading days 2.43 1.00 6.16 0.05 72.00 1027
Equity issue dummy 0.23 0.00 0.42 0.00 1.00 2554
Equity issue (adjusted) dummy 0.17 0.00 0.37 0.00 1.00 3451
Equity issue proceeds/ Equity 0.06 0.00 0.25 0.00 1.84 2535
Acquisitions/ Size 0.11 0.00 0.21 0.00 1.10 3145
US cross-listing dummy 0.11 0.00 0.31 0.00 1.00 493
Both shares listed dummy 0.60 1.00 0.49 0.00 1.00 467
Dividend dummy 0.42 0.00 0.48 0.00 1.00 354
Control 0.42 0.40 0.24 0.00 1.00 378
Ownership 0.28 0.24 0.22 0.00 1.00 364
Control minus Ownership 0.13 0.09 0.14 -0.40 0.67 363
Control exceeds Ownership, high 0.39 0.00 0.49 0.00 1.00 363
Family owner dummy 0.41 0.00 0.49 0.00 1.00 379
Financial investor dummy 0.11 0.00 0.31 0.00 1.00 379
Multiple blockholder dummy 0.42 0.00 0.49 0.00 1.00 363
Panel B: Event group
Industry MTB 3.03 2.83 1.35 0.74 9.76 744 2.400 **
MTB 2.97 1.87 3.43 0.33 28.26 680 5.524 ***
Industry adjusted MTB -0.25 -0.82 2.99 -8.31 23.82 668 3.408 ***
Size 5.63 5.70 0.92 2.29 7.50 700 3.899 ***
ROA 0.05 0.05 0.10 -0.61 0.50 688 1.159
ROE 0.09 0.12 0.33 -1.93 1.87 680 0.403
Leverage 0.25 0.24 0.18 0.00 0.82 701 0.107
CAPEX 0.34 0.20 0.54 0.00 4.39 668 0.567
Cash flow/ Assets 0.07 0.07 0.09 -0.38 0.39 615 1.669 *
Cash balance/ Assets 0.13 0.08 0.13 0.00 0.84 701 0.208
Cash dividends/ Assets 0.02 0.01 0.02 0.00 0.17 685 0.402
Sales growth 0.12 0.07 0.30 -0.50 1.32 687 1.321

49
Table 3 (Continued)
Variable Mean Median Std. Dev. Min Max Obs. t-statistic Sig.
Panel B: Event group
Voting premium 0.14 0.07 0.29 -0.63 1.49 207 -0.821
Relative turnover 8.06 1.72 20.34 0.03 130.45 156 1.664 *
Relative trading days 1.29 1.00 1.07 0.06 7.65 156 -2.511 **
Equity issue dummy 0.29 0.00 0.45 0.00 1.00 593 4.447 ***
Equity issue (adjusted) dummy 0.23 0.00 0.42 0.00 1.00 756 5.214 ***
Equity issue proceeds/ Equity 0.10 0.00 0.33 0.00 1.84 588 3.986 ***
Acquisitions/ Size 0.14 0.00 0.24 0.00 1.10 700 4.181 ***
US cross-listing dummy 0.18 0.00 0.38 0.00 1.00 108 2.712 ***
Both shares listed dummy 0.65 1.00 0.48 0.00 1.00 106 1.227
Dividend dummy 0.52 0.50 0.47 0.00 1.00 94 2.334 **
Control 0.40 0.36 0.23 0.06 0.99 97 -0.860
Ownership 0.26 0.22 0.19 0.00 0.93 83 -1.066
Control minus Ownership 0.12 0.09 0.12 0.00 0.48 82 -0.917
Control exceeds Ownership, high 0.29 0.00 0.46 0.00 1.00 82 -1.971 **
Family owner dummy 0.39 0.00 0.49 0.00 1.00 98 -0.617
Financial investor dummy 0.19 0.00 0.40 0.00 1.00 98 3.207 ***
Multiple blockholder dummy 0.39 0.00 0.49 0.00 1.00 83 -0.639
Panel C: Control group
Industry MTB 2.90 2.79 1.33 0.75 13.86 2694
MTB 2.27 1.44 2.73 0.27 28.26 2340
Industry adjusted MTB -0.67 -1.04 2.69 -12.49 25.10 2339
Size 5.47 5.49 0.96 0.48 7.96 2445
ROA 0.05 0.05 0.10 -0.61 0.50 2382
ROE 0.09 0.10 0.27 -1.93 1.87 2359
Leverage 0.25 0.24 0.18 0.00 0.82 2445
CAPEX 0.33 0.19 0.54 0.00 4.39 2296
Cash flow/ Assets 0.06 0.07 0.09 -0.59 0.39 2071
Cash balance/ Assets 0.12 0.08 0.13 0.00 0.84 2448
Cash dividends/ Assets 0.02 0.01 0.02 0.00 0.20 2393
Sales growth 0.10 0.06 0.27 -0.50 1.32 2378
Voting premium 0.16 0.04 0.34 -0.88 1.60 979
Relative turnover 6.10 2.33 11.87 0.03 130.45 856
Relative trading days 2.63 1.01 6.65 0.05 72.00 871
Equity issue dummy 0.20 0.00 0.40 0.00 1.00 1961
Equity issue (adjusted) dummy 0.15 0.00 0.36 0.00 1.00 2695
Equity issue proceeds/ Equity 0.05 0.00 0.22 0.00 1.84 1947
Acquisitions/ Size 0.10 0.00 0.20 0.00 1.10 2445
US cross-listing dummy 0.09 0.00 0.28 0.00 1.00 385
Both shares listed dummy 0.58 1.00 0.49 0.00 1.00 361
Dividend dummy 0.38 0.00 0.48 0.00 1.00 260
Control 0.43 0.41 0.24 0.00 1.00 281
Ownership 0.29 0.25 0.23 0.00 1.00 281
Control minus Ownership 0.14 0.10 0.15 -0.40 0.67 281
Control exceeds Ownership, high 0.41 0.00 0.49 0.00 1.00 281
Family owner dummy 0.42 0.00 0.49 0.00 1.00 281
Financial investor dummy 0.08 0.00 0.27 0.00 1.00 281
Multiple blockholder dummy 0.43 0.00 0.50 0.00 1.00 280
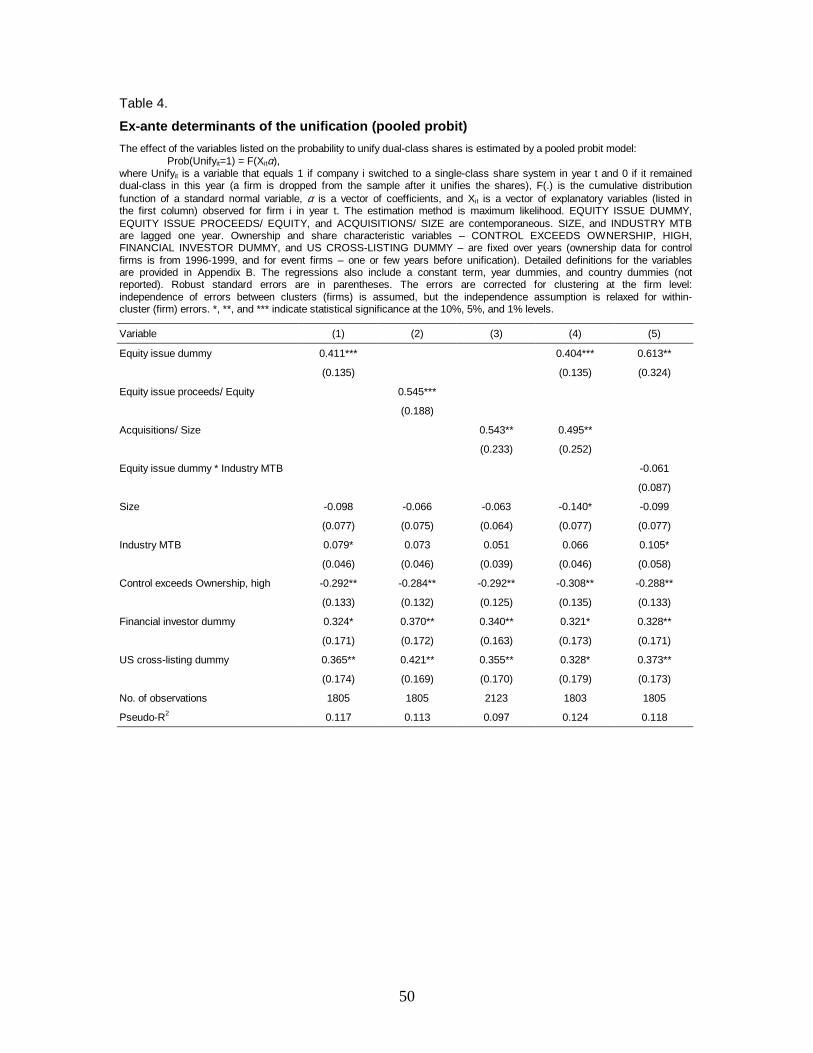
50
Table 4.
Ex-ante determinants of the unification (pooled probit)
The effect of the variables listed on the probability to unify dual-class shares is estimated by a pooled probit model:Prob(Unifyit=1) = F(Xitα),
where Unifyit is a variable that equals 1 if company i switched to a single-class share system in year t and 0 if it remaineddual-class in this year (a firm is dropped from the sample after it unifies the shares), F(.) is the cumulative distributionfunction of a standard normal variable, α is a vector of coefficients, and Xit is a vector of explanatory variables (listed inthe first column) observed for firm i in year t. The estimation method is maximum likelihood. EQUITY ISSUE DUMMY,EQUITY ISSUE PROCEEDS/ EQUITY, and ACQUISITIONS/ SIZE are contemporaneous. SIZE, and INDUSTRY MTBare lagged one year. Ownership and share characteristic variables – CONTROL EXCEEDS OWNERSHIP, HIGH,FINANCIAL INVESTOR DUMMY, and US CROSS-LISTING DUMMY – are fixed over years (ownership data for controlfirms is from 1996-1999, and for event firms – one or few years before unification). Detailed definitions for the variablesare provided in Appendix B. The regressions also include a constant term, year dummies, and country dummies (notreported). Robust standard errors are in parentheses. The errors are corrected for clustering at the firm level:independence of errors between clusters (firms) is assumed, but the independence assumption is relaxed for within-cluster (firm) errors. *, **, and *** indicate statistical significance at the 10%, 5%, and 1% levels.
Variable (1) (2) (3) (4) (5)
Equity issue dummy 0.411*** 0.404*** 0.613**
(0.135) (0.135) (0.324)
Equity issue proceeds/ Equity 0.545***
(0.188)
Acquisitions/ Size 0.543** 0.495**
(0.233) (0.252)
Equity issue dummy * Industry MTB -0.061
(0.087)
Size -0.098 -0.066 -0.063 -0.140* -0.099
(0.077) (0.075) (0.064) (0.077) (0.077)
Industry MTB 0.079* 0.073 0.051 0.066 0.105*
(0.046) (0.046) (0.039) (0.046) (0.058)
Control exceeds Ownership, high -0.292** -0.284** -0.292** -0.308** -0.288**
(0.133) (0.132) (0.125) (0.135) (0.133)
Financial investor dummy 0.324* 0.370** 0.340** 0.321* 0.328**
(0.171) (0.172) (0.163) (0.173) (0.171)
US cross-listing dummy 0.365** 0.421** 0.355** 0.328* 0.373**
(0.174) (0.169) (0.170) (0.179) (0.173)
No. of observations 1805 1805 2123 1803 1805
Pseudo-R2 0.117 0.113 0.097 0.124 0.118

51
Table 5.
Ex-ante determinants of the unification (averages)
The effect of the variables listed on the probability to unify dual-class shares is estimated by a probit model:Prob(Unifyi=1) = F(Xiα)
where Unifyi is a variable that equals 1 if company i switched to a single-class share system in period 1996-2002 and 0 ifit remained dual-class in this period, F(.) is the cumulative distribution function of a standard normal variable, α is a vectorof coefficients, and Xi is a vector of explanatory variables (listed in the first column) observed for firm i. The estimationmethod is maximum likelihood. In this specification, the focus is on cross-sectional variation between the main sample offirms. AT LEAST ONE EQUITY ISSUE, DUMMY is a dummy variable that takes a value of 1 if the firm has had at leastone new equity issue in period 1996-2002. EQUITY ISSUE (ADJUSTED) DUMMY, EQUITY ISSUE PROCEEDS/EQUITY, and ACQUISITIONS/ SIZE are averaged over 1996-2002. SIZE and INDUSTRY MTB are averaged over 1994to 2001 for control group, and over two years prior to the unification for the event group. Detailed definitions for thevariables are provided in Appendix B. The regressions also include a constant term, and country dummies (not reported).Robust standard errors are in parentheses *, **, and *** indicate statistical significance at the 10%, 5%, and 1% levels.
Variable (1) (2) (3) (4) (5)
At least one equity issue, dummy 0.679***
(0.175)
Equity issue (adjusted) dummy (average) 0.950*** 0.913***
(0.322) (0.322)
Equity issue proceeds/ Equity (average) 0.527*
(0.297)
Acquisitions/ Size (average) 0.849* 0.660
(0.562) (0.570)
Size (average) -0.026 -0.001 0.035 0.006 -0.037
(0.096) (0.098) (0.106) (0.103) (0.104)
Industry MTB (average) 0.293*** 0.269*** 0.271*** 0.262*** 0.261***
(0.082) (0.080) (0.084) (0.080) (0.070)
Control exceeds Ownership, high -0.527*** -0.525*** -0.527*** -0.517*** -0.529***
(0.185) (0.181) (0.186) (0.181) (0.182)
Financial investor dummy 0.391 0.455* 0.556** 0.492** 0.466*
(0.244) (0.249) (0.258) (0.247) (0.247)
US cross-listing dummy 0.346 0.292 0.452* 0.365 0.241
(0.247) (0.256) (0.249) (0.251) (0.258)
No. of observations 357 357 337 357 357
Pseudo-R2 0.172 0.154 0.151 0.138 0.157
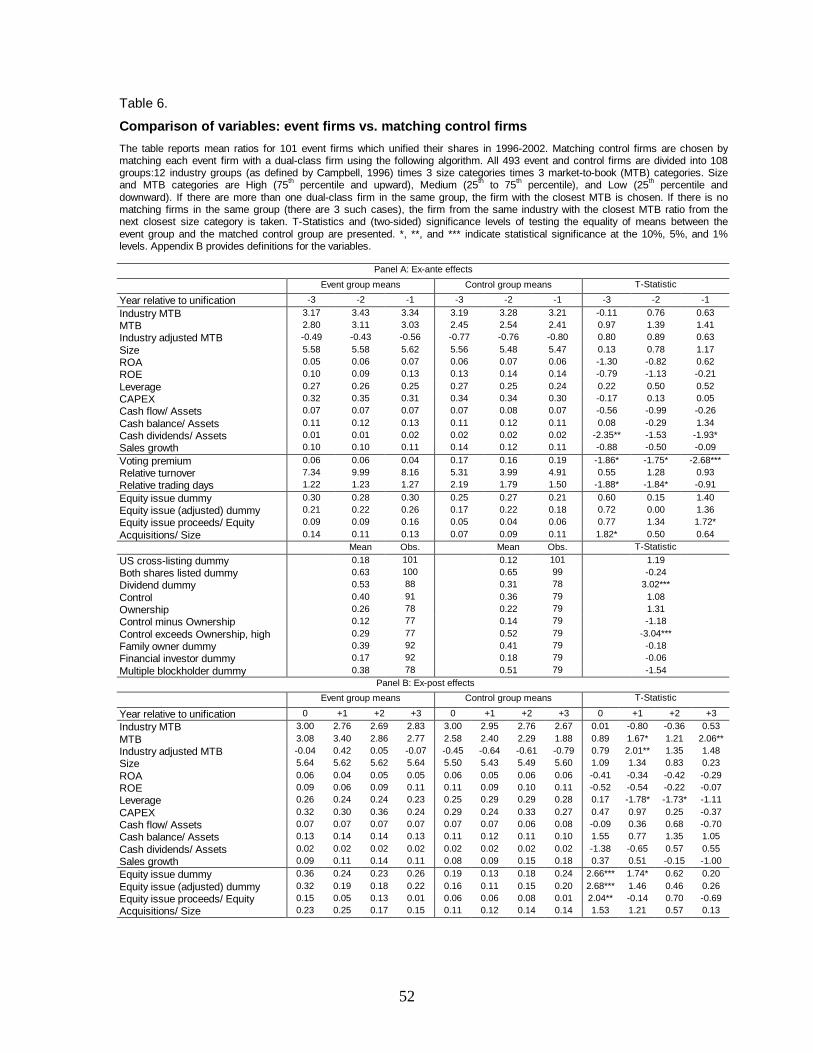
52
Table 6.
Comparison of variables: event firms vs. matching control firms
The table reports mean ratios for 101 event firms which unified their shares in 1996-2002. Matching control firms are chosen bymatching each event firm with a dual-class firm using the following algorithm. All 493 event and control firms are divided into 108groups:12 industry groups (as defined by Campbell, 1996) times 3 size categories times 3 market-to-book (MTB) categories. Sizeand MTB categories are High (75th percentile and upward), Medium (25th to 75th percentile), and Low (25th percentile anddownward). If there are more than one dual-class firm in the same group, the firm with the closest MTB is chosen. If there is nomatching firms in the same group (there are 3 such cases), the firm from the same industry with the closest MTB ratio from thenext closest size category is taken. T-Statistics and (two-sided) significance levels of testing the equality of means between theevent group and the matched control group are presented. *, **, and *** indicate statistical significance at the 10%, 5%, and 1%levels. Appendix B provides definitions for the variables.
Panel A: Ex-ante effects
Event group means Control group means T-Statistic
Year relative to unification -3 -2 -1 -3 -2 -1 -3 -2 -1
Industry MTB 3.17 3.43 3.34 3.19 3.28 3.21 -0.11 0.76 0.63
MTB 2.80 3.11 3.03 2.45 2.54 2.41 0.97 1.39 1.41
Industry adjusted MTB -0.49 -0.43 -0.56 -0.77 -0.76 -0.80 0.80 0.89 0.63
Size 5.58 5.58 5.62 5.56 5.48 5.47 0.13 0.78 1.17
ROA 0.05 0.06 0.07 0.06 0.07 0.06 -1.30 -0.82 0.62
ROE 0.10 0.09 0.13 0.13 0.14 0.14 -0.79 -1.13 -0.21
Leverage 0.27 0.26 0.25 0.27 0.25 0.24 0.22 0.50 0.52
CAPEX 0.32 0.35 0.31 0.34 0.34 0.30 -0.17 0.13 0.05
Cash flow/ Assets 0.07 0.07 0.07 0.07 0.08 0.07 -0.56 -0.99 -0.26
Cash balance/ Assets 0.11 0.12 0.13 0.11 0.12 0.11 0.08 -0.29 1.34
Cash dividends/ Assets 0.01 0.01 0.02 0.02 0.02 0.02 -2.35** -1.53 -1.93*
Sales growth 0.10 0.10 0.11 0.14 0.12 0.11 -0.88 -0.50 -0.09
Voting premium 0.06 0.06 0.04 0.17 0.16 0.19 -1.86* -1.75* -2.68***
Relative turnover 7.34 9.99 8.16 5.31 3.99 4.91 0.55 1.28 0.93
Relative trading days 1.22 1.23 1.27 2.19 1.79 1.50 -1.88* -1.84* -0.91
Equity issue dummy 0.30 0.28 0.30 0.25 0.27 0.21 0.60 0.15 1.40
Equity issue (adjusted) dummy 0.21 0.22 0.26 0.17 0.22 0.18 0.72 0.00 1.36
Equity issue proceeds/ Equity 0.09 0.09 0.16 0.05 0.04 0.06 0.77 1.34 1.72*
Acquisitions/ Size 0.14 0.11 0.13 0.07 0.09 0.11 1.82* 0.50 0.64Mean Obs. Mean Obs. T-Statistic
US cross-listing dummy 0.18 101 0.12 101 1.19
Both shares listed dummy 0.63 100 0.65 99 -0.24
Dividend dummy 0.53 88 0.31 78 3.02***
Control 0.40 91 0.36 79 1.08
Ownership 0.26 78 0.22 79 1.31
Control minus Ownership 0.12 77 0.14 79 -1.18
Control exceeds Ownership, high 0.29 77 0.52 79 -3.04***
Family owner dummy 0.39 92 0.41 79 -0.18
Financial investor dummy 0.17 92 0.18 79 -0.06
Multiple blockholder dummy 0.38 78 0.51 79 -1.54Panel B: Ex-post effects
Event group means Control group means T-Statistic
Year relative to unification 0 +1 +2 +3 0 +1 +2 +3 0 +1 +2 +3
Industry MTB 3.00 2.76 2.69 2.83 3.00 2.95 2.76 2.67 0.01 -0.80 -0.36 0.53
MTB 3.08 3.40 2.86 2.77 2.58 2.40 2.29 1.88 0.89 1.67* 1.21 2.06**
Industry adjusted MTB -0.04 0.42 0.05 -0.07 -0.45 -0.64 -0.61 -0.79 0.79 2.01** 1.35 1.48
Size 5.64 5.62 5.62 5.64 5.50 5.43 5.49 5.60 1.09 1.34 0.83 0.23
ROA 0.06 0.04 0.05 0.05 0.06 0.05 0.06 0.06 -0.41 -0.34 -0.42 -0.29
ROE 0.09 0.06 0.09 0.11 0.11 0.09 0.10 0.11 -0.52 -0.54 -0.22 -0.07
Leverage 0.26 0.24 0.24 0.23 0.25 0.29 0.29 0.28 0.17 -1.78* -1.73* -1.11
CAPEX 0.32 0.30 0.36 0.24 0.29 0.24 0.33 0.27 0.47 0.97 0.25 -0.37
Cash flow/ Assets 0.07 0.07 0.07 0.07 0.07 0.07 0.06 0.08 -0.09 0.36 0.68 -0.70
Cash balance/ Assets 0.13 0.14 0.14 0.13 0.11 0.12 0.11 0.10 1.55 0.77 1.35 1.05
Cash dividends/ Assets 0.02 0.02 0.02 0.02 0.02 0.02 0.02 0.02 -1.38 -0.65 0.57 0.55
Sales growth 0.09 0.11 0.14 0.11 0.08 0.09 0.15 0.18 0.37 0.51 -0.15 -1.00
Equity issue dummy 0.36 0.24 0.23 0.26 0.19 0.13 0.18 0.24 2.66*** 1.74* 0.62 0.20
Equity issue (adjusted) dummy 0.32 0.19 0.18 0.22 0.16 0.11 0.15 0.20 2.68*** 1.46 0.46 0.26
Equity issue proceeds/ Equity 0.15 0.05 0.13 0.01 0.06 0.06 0.08 0.01 2.04** -0.14 0.70 -0.69
Acquisitions/ Size 0.23 0.25 0.17 0.15 0.11 0.12 0.14 0.14 1.53 1.21 0.57 0.13

53
Table 7.
Equity issuance and acquisitions: event firms vs. matching control firms (matched onpropensity score)
The table reports mean and median ratios for 76 event firms that unified their shares in 1996-2002. Matching control firmsare chosen by matching each event firm with a dual-class firm using the propensity score algorithm. 1) Estimate thepropensity to unify Pi, using the probit function Pi = PROB(Di=1| Xi,), for i=1,..N. Xi is a vector of characteristic observed forfirm i. The characteristics are average Size, average Industry MTB, average Leverage, Control exceeds Ownership, high,Financial investor dummy, US cross-listing dummy, and Country dummy. Averages are taken over years 1994-2001 fordual-class firms that did not unify, and over two years prior to unification for firms that unified. 2) Match each event firm tothe dual-class firm with the closest propensity score to form a sample of nearest-match control firms. Column 3 presents t-statistics and (two-sided) significance levels of testing the equality of means between the event group and the matchedcontrol group. The last column presents z-statistics testing the equality of distributions between the event firms and the“nearest-match” control firms using the Wilcoxon matched-pairs signed-rank test. *, **, and *** indicate statisticalsignificance at the 10%, 5%, and 1% levels. Appendix B provides definitions for the variables.
Eventmean
“Nearest-match”controlmean
t-statistic Eventmedian
“Nearest-match”controlmedian
z-statistic
Acquisitions/ Size (average) 0.177 0.081 2.193** 0.098 0.072 2.307**
Equity issue proceeds/ Equity (average) 0.130 0.056 2.376** 0.012 0.000 2.882***
Equity issue (adjusted) dummy (average) 0.263 0.197 1.469 0.286 0.000 1.961*

54
Table 8.
Ex-post effects of unification
For each of the variables listed the following specification is estimated:yit=α+UNIt+UNIt-1+UNIt-2+UNIt-3+ui+dt+εit,
where ui and dt are respectively a firm-specific and calendar year-specific effect, UNIt-j are dummy variables equal toone if year t-j was the year of the unification. By using a fixed effect model each company before the unification is usedas a control for itself after the unification. The table only reports the coefficients on the unification and post-unificationdummy variables. Standard errors are reported in the parentheses. The second to last column reports the p-value ofthe hypothesis that the sum of the coefficients of Year-1 and Year-2 dummies are equal to zero. The last columnreports the p-value of the hypothesis that the sum of the coefficients of all the three post-unification dummies is equalto zero. *, **, and *** indicate statistical significance at the 10%, 5%, and 1% levels. Appendix B provides definitions forthe variables.
Year 0 Year -1 Year -2 Year -3 F-test(2 years)
F-test(3 years)
MTB 0.252 0.034 -0.146 -0.420 0.807 0.776
(0.335) (0.359) (0.399) (0.423)
Industry adjusted MTB 0.632** 0.843** 0.473 -0.328 0.031 0.258
(0.318) (0.340) (0.379) (0.402)
Size 0.015 0.028 -0.016 0.031 0.977 0.909
(0.026) (0.028) (0.032) (0.033)
ROA 0.010 -0.006 0.005 -0.010 0.901 0.669
(0.014) (0.015) (0.017) (0.018)
ROE -0.010 -0.049 -0.024 -0.008 0.295 0.513
(0.038) (0.039) (0.044) (0.046)
Leverage 0.000 -0.031** -0.034** 0.011 0.009 0.033
(0.013) (0.014) (0.015) (0.016)
CAPEX 0.053 0.019 0.115 0.000 0.265 0.438
(0.062) (0.067) (0.074) (0.079)
Cash flow/ Assets 0.001 0.008 0.006 0.002 0.472 0.566
(0.011) (0.011) (0.013) (0.013)
Cash balance/ Assets 0.009 0.011 0.003 -0.005 0.485 0.742
(0.010) (0.011) (0.012) (0.013)
Cash dividends/ Assets -0.004 0.003 0.006* 0.001 0.108 0.182
(0.003) (0.003) (0.003) (0.003)
Sales growth 0.046 0.082* 0.079 0.085* 0.040 0.027
(0.041) (0.044) (0.050) (0.052)
Equity issue proceeds/ Equity 0.017 -0.067 0.035 -0.095 0.619 0.211
(0.039) (0.042) (0.046) (0.048)
Acquisitions/ Size 0.069** 0.043 0.026 -0.003 0.212 0.399
(0.029) (0.031) (0.035) (0.036)
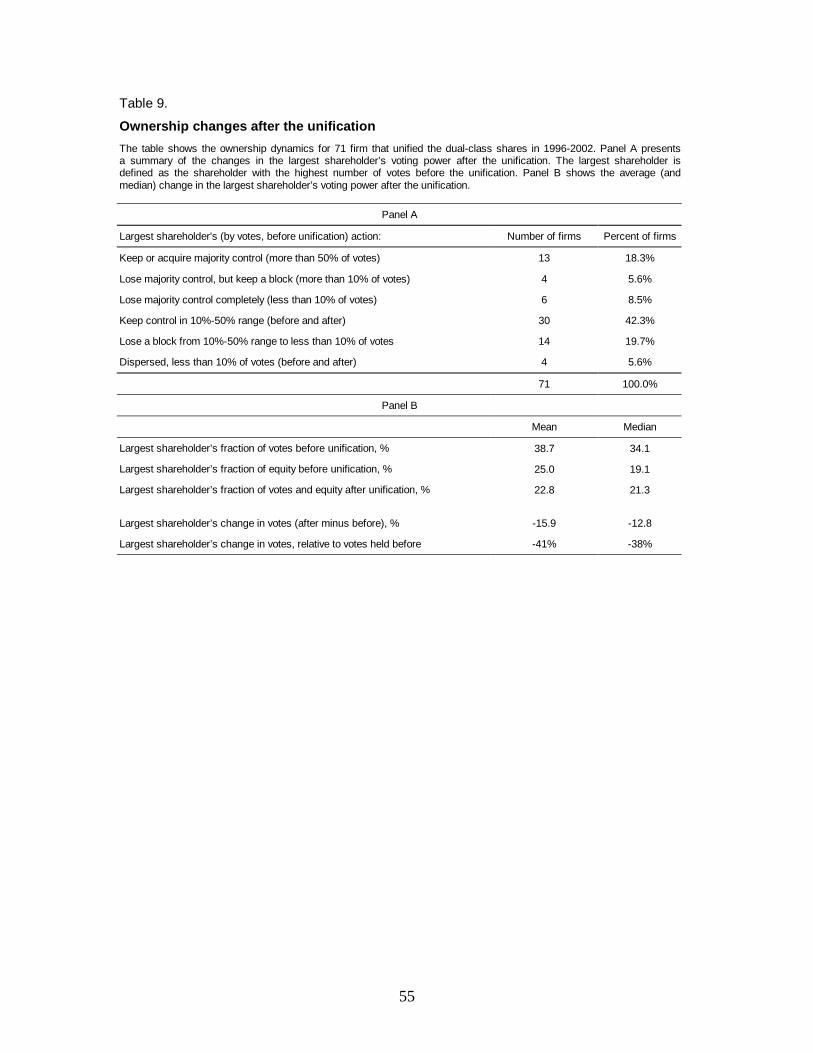
55
Table 9.
Ownership changes after the unification
The table shows the ownership dynamics for 71 firm that unified the dual-class shares in 1996-2002. Panel A presentsa summary of the changes in the largest shareholder’s voting power after the unification. The largest shareholder isdefined as the shareholder with the highest number of votes before the unification. Panel B shows the average (andmedian) change in the largest shareholder’s voting power after the unification.
Panel A
Largest shareholder's (by votes, before unification) action: Number of firms Percent of firms
Keep or acquire majority control (more than 50% of votes) 13 18.3%
Lose majority control, but keep a block (more than 10% of votes) 4 5.6%
Lose majority control completely (less than 10% of votes) 6 8.5%
Keep control in 10%-50% range (before and after) 30 42.3%
Lose a block from 10%-50% range to less than 10% of votes 14 19.7%
Dispersed, less than 10% of votes (before and after) 4 5.6%
71 100.0%
Panel B
Mean Median
Largest shareholder’s fraction of votes before unification, % 38.7 34.1
Largest shareholder’s fraction of equity before unification, % 25.0 19.1
Largest shareholder’s fraction of votes and equity after unification, % 22.8 21.3
Largest shareholder’s change in votes (after minus before), % -15.9 -12.8
Largest shareholder’s change in votes, relative to votes held before -41% -38%

56
Table 10.
WHY UNIFY? # Statements by companies and analysts (about the unification)
IncreaseLIQUIDITY
(1)(2)(3)(4)(5)(6)(7)
- … enhance the liquidity of shares (ABB).- … resolve the problem concerning the liquidity of the shares (Amer Group).- … the amalgamation of shares has increased the level of trading in the company’s shares (Rieber & Son).- … improve demand in international capital markets. … we expect increased share liquidity (Sudzucker).- … will further increase the liquidity of Company’s shares (MLP).- … improve liquidity (HERLITZ).- … improved stock liquidity (Recordati).
Increase SHAREVALUE
(8)(9)
(10)(11)
- … positive impact on shareholder value… the share value is expected to increase (HERLITZ).- … the company will raise its capital over the next three years. “… we would prefer our share price to lookbetter” [this was said 3 month before the unification] (Fag Kugelfischer Georg Schafer).- … improved market capitalization (Recordati).- … placement of Company’s shares [right after the unification] was considered to be a success given therecent weakness of international markets and considering that during May some 70 initial public offeringswere cancelled (Finmeccanica).
INVESTORRECOGNITION(“rational”)
(12)
(13)(14)(15)(16)(17)
- …make it easier for outside investors to invest in the company. …a strong European investor wouldstrengthen the company’s position (DSV).- …attract a wider spread of domestic and foreign shareholders (PUMA).- … will satisfy Italian and foreign institutional investors (COFIDE).- … increase interest in Company’s shares in the US (Amer Group).- … making shares more attractive particularly to institutional investors (MLP).- … the group will boost the interest of foreign investors in Company’s shares to internationalize theshareholder structure. … also enables investment funds to then invest in Company’s shares (Gerry Weber).
INVESTORRECOGNITION(“behavioral”)
(18)
(19)
(20)
(21)
- …making the stock more attractive to international investors. Yet, while SAP's three founders, includingthe co- chief executive and supervisory board chairman, dilute their voting rights, effective control stays intheir hands. (SAP).- In international capital markets one-share-one-vote system dominates. The non-voting preference sharesare widely unknown abroad, and are loosing importance also in Germany (Sudzucker).- Founder families hold 63 per cent of the votes. After the transaction, they will hold 47 per cent of thevotes (MLP).- The stock market – particularly, the foreign investors – do not understand this division of shares, andbetter buy clear and simple value. It is “downright grotesque” that Herlitz remains in this “Not Luxus”category with two share classes, while renowned companies (Fielmann, Metro, and Lufthansa) areabandoning preference shares. When one reads the stock quotes in the newspaper, Herlitz is soon to be theonly company with two share classes. (HERLITZ).
Pay forACQUISITIONSusing stock
(22)
(23)(24)
(25)
- It is very difficult to pay for a US acquisition with shares if your management owns a majority of thevoting rights. (Merrill Lynch analyst)- …could increase its leeway to pay for acquisitions with shares (SAP).- … this will allow to handle acquisitions and strategic alliances by using shares in addition to debtfinancing (ABB).- German capital market law restricts preference shares that can be issued in proportion to ordinary shares,making it difficult for a company to increase its capital for an acquisition.
SupportGROWTH
(26)(27)
(28)(29)(30)
- …establishing basis for new, profitable growth (KVAERNER).- … will have increased freedom in procuring additional capital. Company is currently in a dynamicemergence phase (ASCOM).- … CEO expects the dynamic growth of the Company (Disetronic Holding).- … create good basis for the future international growth of the Company (MLP).- … to support future growth (Recordati).
FINANCIALFLEXIBILITY
(31)(32)(33)
- … enhance financial flexibility (ABB).- … to be able to act flexibly (ASCOM).- … augment considerably Company’s financial flexibility (Olivetti).
DEFEND TAKE-OVER
(34) - … the move has been seen as a tactical maneuver meant to defend the Company against foreign attemptsto take over. With the power shares gone, a 10 per cent vote in Nokia would now cost SEK 73bn (NOKIA).
Sources: Lexis-Nexis, company home-pages.