what does global expansion of higher education mean for
TRANSCRIPT

NBER WORKING PAPER SERIES
WHAT DOES GLOBAL EXPANSION OF HIGHER EDUCATION MEAN FOR THEUS?
Richard B. Freeman
Working Paper 14962http://www.nber.org/papers/w14962
NATIONAL BUREAU OF ECONOMIC RESEARCH1050 Massachusetts Avenue
Cambridge, MA 02138May 2009
The views expressed herein are those of the author(s) and do not necessarily reflect the views of theNational Bureau of Economic Research.
NBER working papers are circulated for discussion and comment purposes. They have not been peer-reviewed or been subject to the review by the NBER Board of Directors that accompanies officialNBER publications.
© 2009 by Richard B. Freeman. All rights reserved. Short sections of text, not to exceed two paragraphs,may be quoted without explicit permission provided that full credit, including © notice, is given tothe source.

What Does Global Expansion of Higher Education Mean for the US?Richard B. FreemanNBER Working Paper No. 14962May 2009JEL No. J01,J2,J24
ABSTRACT
This study documents the rapid spread of higher education around the world and the consequent reducedshare of the US in the world's university students and graduates. It shows that the proportion of youngpersons who go to college has risen in many advanced countries to exceed that in the US while humancapital leapfrogging in the huge populous developing countries has produced massive increases intheir university educated work forces. One result of the expansion of higher education overseas isthat the US has come to rely extensively on the immigration of highly educated persons to maintaina lead position in science and technology. International students make up roughly half of universitygraduate immigrants to the US, which makes policies toward those students a key determinant in thecountry’s success in attracting immigrant talent.
Richard B. FreemanNBER1050 Massachusetts AvenueCambridge, MA [email protected]
2
University education, once the privilege of a modest number of well-to-do persons in
high-income countries, spread massively throughout the world in the latter part of the 20th
century and beginning of the 21st century (Shofer and Meyer, 2005). Between 1970 and 2006
the number of students enrolled in institutions of higher education increased from 29 million to
over 141 million. The numbers studying science and engineering, where the content of courses
is relatively similar around the world, increased commensurately. The global expansion of
higher education eroded the US position as the country with the most highly educated work force
and potentially endangers the US lead in science and technology. In the 2000s diverse business
and academic groups issued reports that warned that the faster growth of the supply of science
and engineering students overseas than in the US risked national competitiveness and national
security (National Academy of Science, 2006; Council of Competitiveness, 2007).
In which countries has university education spread rapidly? Why have so many more
students gone on to higher education outside the US and why have so many countries expanded
their higher education system in the past 30 or so years? What are the implications for the US?
How might the country best respond to the rest of the world closing the higher education gap
with the US?
This study examines these questions in two stages.
Part I documents the global expansion in university training in terms of: the increased
proportion of young persons enrolled in university in advanced countries; the increased absolute
number of young persons obtaining university training in developing countries; the influx of
women into higher education which has brought the female share above 50 percent of university
students in many advanced countries; and the growing number of international students from

3
developing countries. The bottom line of part I is that the US will continue to lose its
quantitative edge in higher education, including science and engineering, in the foreseeable
future.
Part II examines the implications of this development for the US labor market, university
system, and economy writ large. With respect to the labor market, the expansion of higher
education overseas and the influx of international students in the US have contributed to the
growing supply of highly educated immigrants to the country. Because the US higher
educational system is the world leader, in the short and medium run it benefits from the
increased supply of students worldwide, as many of the world's best and brightest seek a US
education and later seek jobs US universities. But as the quality of higher education improves in
other countries, their universities will invariably become more competitive with the American
institutions in attracting students and faculty. The globalization of higher education should
benefit the US and the world economy by accelerating the rate of technological advance
associated with science and engineering and speeding the adoption of best practices around the
world, which will lower the costs of production and prices of goods. But the increased number
of graduates in other countries threatens US comparative advantage in graduate-intensive sectors
of production, particularly if the graduates cost much less than comparable US workers. The
US has responded to the great increase of university graduates overseas by “importing” highly
educated workers through immigration. US firms have also off shored work to highly educated
workers overseas. I conclude this essay by examining the benefits and costs of these two
alternatives and considering government and university policies that might enhance the net
benefits to the US from the global expansion of higher education.

1. Expansion of Higher Education
Exhibit 1 presents estimates of the number of persons enrolled in higher education
worldwide and the US proportion of world enrollees in selected years from 1970 to 2006. The
data are from the UNESCO Institute for Statistics, which reports enrollments in “tertiary”
education for most countries over this period1. The figures are best viewed as giving orders of
magnitudes rather than precise statistics. One reason is that definitions of tertiary education and
counts of students vary across countries. Another reason is that UNESCO does not report data
annually for every country, so that to get numbers for some countries in a given year I used data
from the nearest surrounding year. Even with a large window to find a near year with data (going
back to 2000 in a few cases to obtain estimates for 2006), data for some countries was still
missing (such as Sri Lanka, Syria, and Serbia, among others). Finally, the UNESCO database
lacks information for the ex-Soviet Union, ex-Yugoslavia, and the two Germanys from 1970 to
1997.2 To deal with this problem, I used enrollment figures from the Banks Cross National Time
Series Archives3. While it is likely that data from national sources are more accurate than
UNESCO figures, for consistency I use the UNESCO data for all countries, including the US.
The exhibit shows that in 1970 approximately 29% of the world’s college students were
in the US, although the country had approximately 6% of the world's population.4 Thereafter, the
1 http://stats.uis.unesco.org/TableViewer/tableView.aspx?ReportId=47
2 http://www.uis.unesco.org/en/stats/centre.htm; http://www.uis.unesco.org/pagesen/DBGTerIsced.asp 3 Cross National Time Series Data Archive, 2004 Arthur S. Banks, ttp://www.databanks.sitehosting.net/www/faq.htm
4 The US had such a large proportion because it developed the first mass higher education system in the
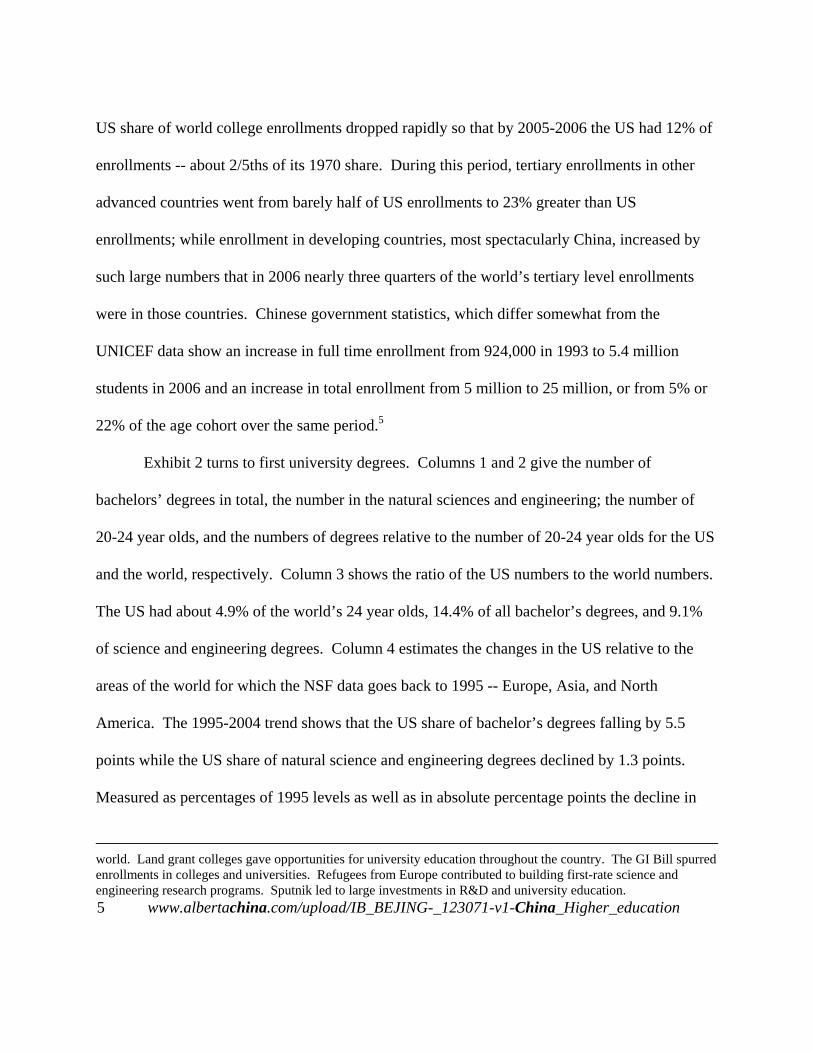
US share of world college enrollments dropped rapidly so that by 2005-2006 the US had 12% of
enrollments -- about 2/5ths of its 1970 share. During this period, tertiary enrollments in other
advanced countries went from barely half of US enrollments to 23% greater than US
enrollments; while enrollment in developing countries, most spectacularly China, increased by
such large numbers that in 2006 nearly three quarters of the world’s tertiary level enrollments
were in those countries. Chinese government statistics, which differ somewhat from the
UNICEF data show an increase in full time enrollment from 924,000 in 1993 to 5.4 million
students in 2006 and an increase in total enrollment from 5 million to 25 million, or from 5% or
22% of the age cohort over the same period.5
Exhibit 2 turns to first university degrees. Columns 1 and 2 give the number of
bachelors’ degrees in total, the number in the natural sciences and engineering; the number of
20-24 year olds, and the numbers of degrees relative to the number of 20-24 year olds for the US
and the world, respectively. Column 3 shows the ratio of the US numbers to the world numbers.
The US had about 4.9% of the world’s 24 year olds, 14.4% of all bachelor’s degrees, and 9.1%
of science and engineering degrees. Column 4 estimates the changes in the US relative to the
areas of the world for which the NSF data goes back to 1995 -- Europe, Asia, and North
America. The 1995-2004 trend shows that the US share of bachelor’s degrees falling by 5.5
points while the US share of natural science and engineering degrees declined by 1.3 points.
Measured as percentages of 1995 levels as well as in absolute percentage points the decline in
world. Land grant colleges gave opportunities for university education throughout the country. The GI Bill spurred enrollments in colleges and universities. Refugees from Europe contributed to building first-rate science and engineering research programs. Sputnik led to large investments in R&D and university education. 5 www.albertachina.com/upload/IB_BEJING-_123071-v1-China_Higher_education
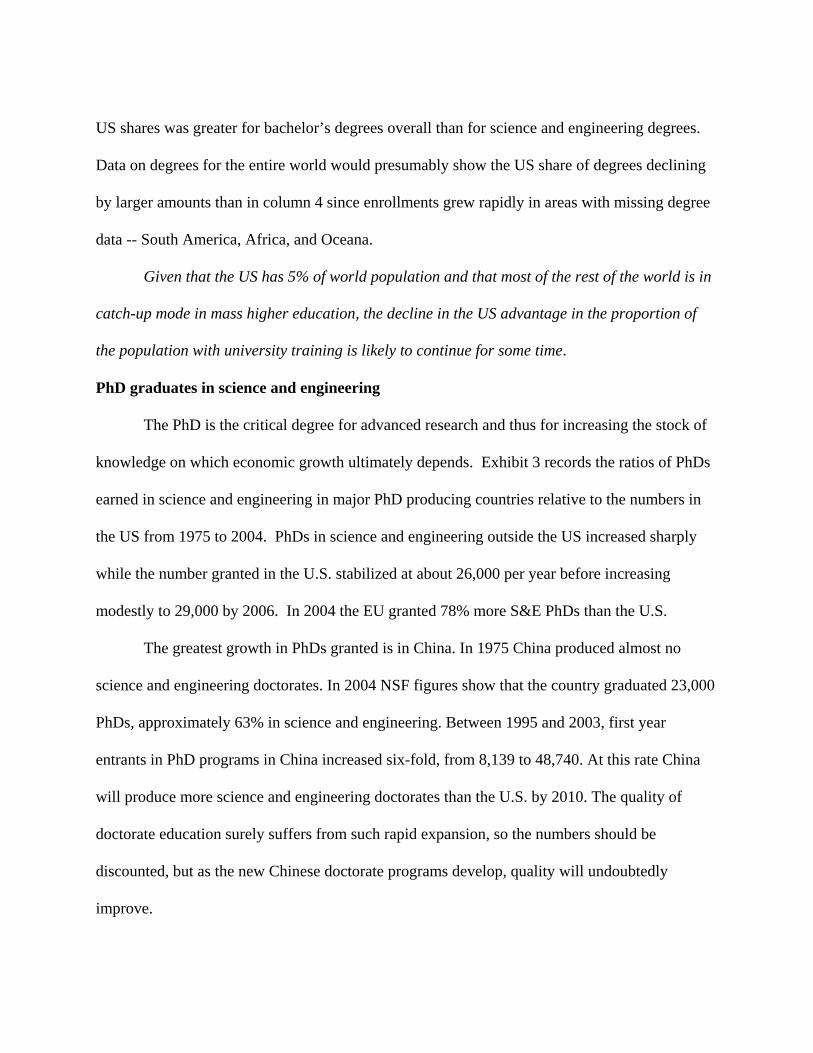
US shares was greater for bachelor’s degrees overall than for science and engineering degrees.
Data on degrees for the entire world would presumably show the US share of degrees declining
by larger amounts than in column 4 since enrollments grew rapidly in areas with missing degree
data -- South America, Africa, and Oceana.
Given that the US has 5% of world population and that most of the rest of the world is in
catch-up mode in mass higher education, the decline in the US advantage in the proportion of
the population with university training is likely to continue for some time.
PhD graduates in science and engineering
The PhD is the critical degree for advanced research and thus for increasing the stock of
knowledge on which economic growth ultimately depends. Exhibit 3 records the ratios of PhDs
earned in science and engineering in major PhD producing countries relative to the numbers in
the US from 1975 to 2004. PhDs in science and engineering outside the US increased sharply
while the number granted in the U.S. stabilized at about 26,000 per year before increasing
modestly to 29,000 by 2006. In 2004 the EU granted 78% more S&E PhDs than the U.S.
The greatest growth in PhDs granted is in China. In 1975 China produced almost no
science and engineering doctorates. In 2004 NSF figures show that the country graduated 23,000
PhDs, approximately 63% in science and engineering. Between 1995 and 2003, first year
entrants in PhD programs in China increased six-fold, from 8,139 to 48,740. At this rate China
will produce more science and engineering doctorates than the U.S. by 2010. The quality of
doctorate education surely suffers from such rapid expansion, so the numbers should be
discounted, but as the new Chinese doctorate programs develop, quality will undoubtedly
improve.

Within the US, moreover, international students have come to earn an increasing
proportion of S&E PhDs. In 1966, universities awarded 23% of science and engineering PhDs to
the foreign-born; 71% to US-born males and 6% to US-born females. In 2006, universities
awarded 48.2% of science and engineering PhDs to the foreign-born; 26.3% to US-born males
and 25.5% to US-born females.6 Looking among fields, the foreign-born received 23.2% of all
doctorates awarded in the social and behavioral sciences, 32.3% in the life sciences, 50.6% in the
physical sciences, and 63.6% in engineering. Since few US students earn S&E PhDs overseas,
the ratio of S&E PhDs earned by US citizens or residents to those earned by citizens of other
countries fell more rapidly than the ratio of degrees granted by US universities to degrees
granted by foreign universities. If we add the number of S&E PhDs granted to Chinese students
in the US and other countries to the numbers granted in China, the ratio of Chinese degrees to
US PhDs granted less those given to the Chinese rose to 0.71 in 2001. But since many Chinese
who gain PhDs in the US remain in the US, it is more appropriate to count them as part of the
US supply than of the supply of S&E PhDs in China.
Propensity to enroll and graduate: advanced countries
The OECD and NSF provide data on the proportions of young persons enrolling and
graduating university. Exhibit 4 displays the rank of the US in “entry rates” into tertiary
education and in first time graduation relative to the relevant age group in 1992 and 2005 from
the OECD data.7 In 1992 the US was 2nd (to Canada) in entry rates and 3rd in graduation rates
among the 20 or so OECD countries that reported data. In 2004 the US was 7th and 13th, 6 The 1966 figures are from Freeman, Jin, and Shen (2004); the 2006 from NSF 2008. 7 These are cumulated entry rates for countries so that if 20% of 20 year olds enter tertiary education and 21% of 21 years olds enter, the rate is 41%

respectively. The lower ranking of the US in graduation rates than in entry rates reflects what the
OECD calls the low “survival rate” of students in the US where a smaller proportion of entrants
to higher education graduate with four year degrees than in other advanced countries. The
exhibit also displays the rank of the US in bachelor’s graduates overall and in the natural
sciences and engineering relative to the age group in 1992 and 2004 (based on NSF data). The
US has a lower rank in natural science and engineering degrees per 24 year old than in all
bachelor’s degrees per 24 year old because Americans are less likely to major in science and
engineering than students in other countries.
Comparing the proportion of workers with college degrees across cohorts/age groups
provides another way to document the declining relative position of the US in higher education.
Since most graduates obtain their degree in their twenties, the share of persons with degrees in
different age groups reflects the share of young persons earning degrees when the age group was
in their twenties at different time periods. OECD data on higher educational attainment by age
group show that in all of the advanced countries save the US the proportion with university
education is much higher in younger than older age groups. In the US there is little difference in
the graduate shares by age. The implication is that the college share of young persons stabilized
in the US while growing among other advanced countries over this period.8
It is natural, at least for labor economists, to wonder if the differences in the shares or
changes in the shares of young persons investing in higher education across countries are related
8 See, OECD, Education at a Glance, 2005, Table A1.3a. Regressions of the ln of the college share of each age group and a trend indicator for when the group was in the age group of the youngest cohort, 25-34 years old (4 for age 25-34; 3 for age 35-44, 2 for age 45-54 and 1 for age 55-64) give a 0.028 coefficient on time in the US with a standard error nearly as large. By contrast, the coefficient on the time indicator for the other countries was 0.19 with a standard error 1/4th the size.

to cross-country differences in the economic payoff to higher education. Within countries,
college going appears to respond to differences in returns, measured in various ways (Freeman,
1975, 1976; Edin and Topel, 1997). To see if there is a similar relation between returns and
college-going across countries, I display the proportions of young persons graduating university
and OECD estimates of the ln wage differential between university graduates and secondary
school graduates in Exhibit 5A and the proportion of young persons graduating and estimated
internal rates of return to investing in higher education that take account of costs of tuition,
among other factors in Exhibit 5B (Baorini and Strauss, 2007). Because recent graduates make
up only a small proportion of the overall college graduate population, the relative earnings or
rates of return for all university graduates should be largely exogenous to the supply of the
youngest group. Put differently, the earnings differentials for the stock of graduates would be
determined by the interaction of current demand conditions with the supply of all graduates set
years or decades earlier per the “cobweb type” models of the market for graduates (Freeman,
1971). Thus, the relation between the flow of new graduates and earnings differentials or rates
of return should largely reflect supply behavior and thus be positively related.
Exhibit 5A shows that indeed there is a modest positive correlation (r = 0.19) between the
earnings differentials and the influx of young graduates relative to the population among the
OECD countries. One reason the correlation is modest is that consistent with its high level of
earnings inequality the US has the largest coefficient on higher education in the ln earnings
equation, but only a moderate rate of college going. Another reason the correlation is modest is
that at the other end of the spectrum countries with narrow distributions of earnings and low
college/high school wage differentials such as Sweden have high enrollment ratios despite their
low earnings differentials. Sweden graduates approximately three times as many PhDs in
science and engineering relative to the age group as does the US despite having a lower return to
post-bachelor’s education!
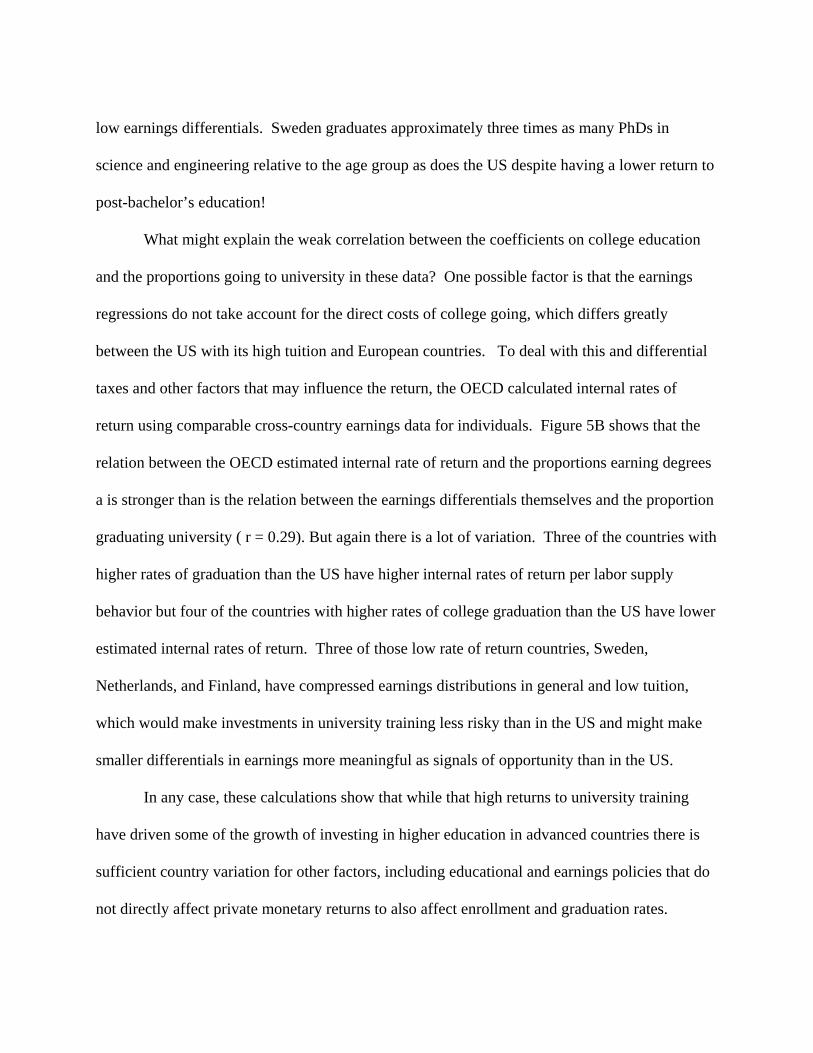
What might explain the weak correlation between the coefficients on college education
and the proportions going to university in these data? One possible factor is that the earnings
regressions do not take account for the direct costs of college going, which differs greatly
between the US with its high tuition and European countries. To deal with this and differential
taxes and other factors that may influence the return, the OECD calculated internal rates of
return using comparable cross-country earnings data for individuals. Figure 5B shows that the
relation between the OECD estimated internal rate of return and the proportions earning degrees
a is stronger than is the relation between the earnings differentials themselves and the proportion
graduating university ( r = 0.29). But again there is a lot of variation. Three of the countries with
higher rates of graduation than the US have higher internal rates of return per labor supply
behavior but four of the countries with higher rates of college graduation than the US have lower
estimated internal rates of return. Three of those low rate of return countries, Sweden,
Netherlands, and Finland, have compressed earnings distributions in general and low tuition,
which would make investments in university training less risky than in the US and might make
smaller differentials in earnings more meaningful as signals of opportunity than in the US.
In any case, these calculations show that while that high returns to university training
have driven some of the growth of investing in higher education in advanced countries there is
sufficient country variation for other factors, including educational and earnings policies that do
not directly affect private monetary returns to also affect enrollment and graduation rates.

China and India
The huge and increased numbers of university graduates in China and India have
attracted attention as part of the discussion of the off shoring of computer programming and
multinational corporate investments in research in those countries. In 2005 top executives from
high tech firms reported that China graduated as many as ten times the number of engineers as
the US and that India also graduated more engineers than the US to call for policies to increase
the supply of science and engineering graduates in the US. More detailed investigation,
however, found that part of the reported China/India to US gap in engineering degrees reflected
comparisons of numbers with different definitions of degrees (Duke, 2005, Wadwha, et al,
2008). Chinese and Indian data included graduates from short courses comparable to US two-
year degree programs while the US data excluded computer science degrees that the other
countries counted with engineering. Adjusting the numbers for comparability brings the US,
China, and India numbers closer but does not overturn the trend growth of degrees in China and
India compared to the US. It simply displaces the increase in four year comparable degree
production 2-3 years behind the publicized figures.
The massive growth of university graduates in China in the 2000s created a major
problem in the Chinese job market even before the world economy fell into the most devastating
recession since the 1930s. The Chinese government estimated that approximately 1.5 million
graduates of the graduating class of 2008 was unable to find unemployed over a year later – for
an unemployment rate of over 20%. 9 With 6.1 million graduates coming onto the labor market
9 Jamil Anderlini China battles unemployment to deter unrest, Financial times, December 21 2008;

in 2009 Chinese President Wen Jiabao declared that employment of higher education graduates
was a priority for the government. The state encouraged graduates to find jobs at the urban and
rural grassroots in poorer western regions and in small- and medium-sized businesses rather than
sitting jobless in big coastal cities. 10
The extent to which the huge supplies and joblessness of graduates in China and other
developing countries will create problems for university graduates in the US depends in part of
the quality of the education received in those countries. In an effort to determine the
qualifications of new graduates in developing countries, the McKinsey Global Institute (2005)
asked recruiters for multinational firms to estimate the proportion of graduates from different
countries that might be suitable candidates for their firm in terms of skills and language and
potential mobility. The recruiters estimated that in engineering 10% of graduates from China and
25% of graduates from India were so qualified (McKinsey Global Institute, 2005, exhibit 2, p 8)
and gave figures for graduates from most other developing countries in the same range. But it is
difficult to know how to assess these estimates. The McKinsey survey did not ask whether
graduates could perform successfully for subcontractor firms in their local area in their own
language. It did not explore whether the lower pay of graduates in developing countries would
compensate for the lower qualifications so that, while multinational firms might not hire them
directly, those firms would subcontract work to firms with the less qualified but cheaper
graduate in the developing countries. Finally, the study never asked for the proportion of
graduates from US engineering schools that recruiters viewed as qualified.
10 Reuters, China pushes to ease grim graduate unemployment Jan 7, 2009 http://www.reuters.com/article/worldNews/idUSTRE5062AD20090107

Surge of Women into Higher Education
Underlying the increase in university enrollments and degrees has been a huge movement
of women into higher education.
Exhibit 6A shows the ratio of the proportion of females of college age attending
university to the the proportion of males of college age attending university in advanced
countries, as reported by the OECD and by the UN for 2004. When the ratio of female to male
enrollment rates is 1.0 the same proportion of the relevant age group is in university. When the
ratio is below 1.0 there are more men than women enrolled relative to the age group and
conversely when the ratio is above 1.0. For most of the post-world war II period and in earlier
decades, university students consisted disproportionately of men. Beginning roughly in the
1970s enrollments of women began to increase more rapidly than enrollments of men in virtually
all advanced countries so that by 2004 women made up a majority of university students in 21 of
the 25 advanced countries in the exhibit. The surge of women into higher education in the US
increased the ratio of female to male enrollments to above 1.0 at the bachelors, master’s level
(which includes many school teachers) and just a bit below 1.0 for law, PhDs and Mds
enrollments as of 2006 (US Statistical Abstract 2008). Among doctorates granted to the US
born, the ratio of female to male PhDs rose to 1.03. In 2004 22% more women than men were
granted Graduate Research Fellowships by the National Science Foundation, implying that the
female to male ratio among PhDs in science and engineering will continue to rise.
Exhibit 6B turns from female to male enrollments in the advanced countries to the female
to male enrollments in the entire world. It shows the ratio of female to male enrollments in the

world, for advanced and developing countries as a group, and in selected countries from 1988 to
2005. Worldwide, the number of female to male enrollees increased by over 40 points in the
period, putting the ratio above 1.0 in 2005. The developing countries had lower ratios of female
to male enrollments than the advanced countries but also had greater increases in the ratios. In
China female to male enrollments jumped from 0.55 to 0.95. In Brazil, 32% more women than
men were university students in 2005. While in many countries in Africa, Latin America, and in
the Arab world, the ratios are still noticeably below one, the direction of change is clear:
feminization of higher education is proceeding rapidly around the world. As women contribute
an increasingly large supply of new university students, companies and countries whose
institutions and policies (family friendly policies, most likely) allow them to attract and use
female graduates efficiently are likely to have an edge in the market place.
International Students
The proportion of students who study in countries other than their own has also been
increasing rapidly since at least the mid 1970s. The first column of Exhibit 7 shows that from
1975 to 2005 the number of international students increased from 0.6 million to 2.7 million –
nearly fivefold. The second column shows that the number of international students to the US
increased somewhat more slowly over the whole period from 0.15 million to 0.58 million – a bit
less than fourfold. The third column shows the US share of international students rising in the
1970s and then dropping in the late 1990s-2000s. Although the the US share of international
students fell in the latter period, the growth growth rate was of international students in the US
was still sufficient to increase the international student share of US enrollments.
Countries differ in the extent to which they recruit and/or attract international students at

the undergraduate or graduate level. Some countries like Australia and to a lesser extent the UK
specialize in undergraduate education for international students, whose tuition payments help
fund higher education institutions that receive relatively modest government support and lack the
endowments of US private universities. By contrast, exhibit 8 shows that the US intake of
international students consists disproportionately of graduate students, many in PhD programs.
In addition, the US attracts many international post-doctorate students/workers. Most of US
international students are from Asia, with India and China being the largest source countries.
The foreign-born share of enrollments and degrees is particularly high in graduate science and
engineering and increased greatly in those areas from 1985 to 2005.
Although the foreign-born make up a much smaller share of undergraduate than of
graduate students, they are an important source of immigrant scientists and engineers. There are
three reasons. First, because the undergraduate student population is much larger than the
graduate student population, the absolute number of foreign-born undergraduates is of similar
magnitude to the absolute number of foreign-born graduate students. Second, foreign-born
undergraduates are for more likely to do graduate work in the US foreign-born undergraduates
educated outside the country. In 1993, 36.6% of foreign-born residents who obtained a master’s
degree in science and engineering had a US bachelor’s degree (over half of them also had a US
secondary school degree). Multiplying this by the 24.7% of S&E master’s degrees going to the
foreign-born in that year, approximately 9.7 % of all S&E master’s degrees were awarded to
foreign born persons with US bachelor’s degrees. This is 2.5 times the foreign-born share of US
bachelor’s degrees in science and engineering. At the doctorate level 19.1% of foreign-born
residents with a science/engineering PhD had a US bachelor’s degree (with nearly half also

having graduated from a US secondary school). Given that the foreign-born had 40.6% of S&E
PhDs in that year, about 10% of all S&E PhDs were awarded to foreign born persons with US
bachelor’s degrees. This is 2.8 times the foreign-born share of US bachelor’s degrees in science
and engineering. 11
What these statistics suggest is that attracting international students at the bachelor’s
level (and the high school level) raises the probability that those students continue their studies at
US institutions and eventually remain in the country to work. But the statistics do not establish
that the relation is causal. It could be that the foreign-born undergraduates are selectively drawn
from a population of persons who would end up working in the US regardless of where they
were educated. To determine whether studying in the US or any other country leads to further
study and immigration to the country of study requires some independent variation in
opportunities to study in a foreign country, of the type that I discuss in section II. To presage
that discussion, there does indeed appear to be a causal link: attract students to study in a country
induces them to study and work later on.
In the aftermath of 9/11 the academic and research communities feared that tightened
visa requirements would reduce the number of international students in the US. The State
Department rejected more students applying for visas than in the past, particularly from China,
and made it more difficult for international students to travel outside the US. The number
international students applying to and enrolling in US universities fell from 2002/03 through
2005/06, breaking an upward trend that stretched back at least from 1959/60. But the State
Department responded to complaints about the difficulties faced by international students and 11 The 1993 estimates are from Mark Regets, “Foreign Students in the US” power point presentation, June 27, 2005 Brussels Dialogue Meeting on Migration Governance, OECD
remedied many of the problems (National Academy of Sciences, 2005). Even with the post 9/11
drop the US attracted 560,000 or so international students in 2003-2005, and the number
increased from 2005/06 to 2006/07.
What factors lie behind the huge increase in international students and their choice of
countries in which to study? Using a cross-section regression design, Rosenzweig (2006) found
that the number of US students obtaining visas in the early 2000s from different countries was
larger the larger the population in the country of origin and the closer the distance to the US and
was also larger the greater the number of universities in the students home country and level of
GDP per capita. He also reported that the number of visas was inversely related to the return to
skills in the home country: the higher the skills in the home country the less likely were students
to come to the US. The implication is that many come to the US with the intention of remaining
to work in the US, which fits well with that at least in science and engineering a huge proportion
of those who study in the US do indeed immigrate to the country. But Hwang (2008) finds that
analyses that look at changes in student visas by country are positively related with earnings
differentials in the students country, which implies that many may have chosen to study in the
US because returns to higher education are high in their home country (though they may later
decide to remain in the US).
The university sector
The supply of university students and graduates is only part of the story of the growth of
higher education around the world. The other part relates to the increased number or scale of the
institutions of higher education that employ faculty and other staff to “produce” graduates. In
many countries the central government determines the number of places in departments to which
students apply, so that the distribution of graduates among fields depends on government
policies. In the US state governments have been the major force in expanding the number of
institutions of higher education, though student choices determine the distribution of graduates.
In yet other countries – Korea, Philippines – much of the expansion of higher education has
come through the private sector. Australian universities actively recruit for international
students, largely because the national government has reduced public funding (Marginson,
Welch).
Expansion of higher education in the US between 1960 and 2005 first took the form of
large increases of enrollments in existing institutions and then of large increases in the number of
institutions. Between 1960 and 1980 enrollments in institutions of higher education in the US
nearly tripled, from 3.3 million students to 12.1 million students. The number of institutions
increased more modestly, from 2,008 to 3,231 (including 2 year institutions), so that
approximately 2/3rds of the 1960 to1980 expansion took the form of increased enrollments at
existing institutions.12 Between 1980 and 2005 enrollments increased from 12.1 to 17.5 million
– a 45% increase; while the number of institutions increased to from 3231 to 4276, by 32%. In
this period, 86% of the expansion took the form of increased numbers of institutions13 -- a lagged
response to the huge growth of enrollments in the 1960s and 1970s.
What about the expansion of higher education worldwide? The International Association
of Universities provides information on over 16,000 institutions of higher education around the
12 Calculated using ln metric, the growth of enrollments was 1.30 ln points while the growth of the number of institutions was 0.48 ln points. 13 Calculated using ln metric, the growth of enrollments was 0.37 ln points while the growth of the number of institutions was 0.32 ln points.

world (IAU, 2003, 2008). In addition, several Internet sites provide data on universities outside
the US during the 1990s period of rapid enrollment growth (http://univ.cc/;
www.braintrack.com/about.htm). These data provide potentially detailed information on the
development of mass higher education around the world that goes beyond this study,14 but
which gives some insight into the incredible expansion of the university sector worldwide.
Exhibit 11 records the names and years of founding (or of changes in the nature of an institution
into a university) in two developing countries: Bangladesh and Chile. Many of the institutions in
both countries were developed in the 1990s. In Bangladesh the new institutions were public
sector, but in Chile there was an expansion of private sector colleges and universities.
Bangladesh has an Open University. The universities in both countries report connections with
universities in advanced countries.
PART II—Implications
The globalization of higher education has implications for supply and demand in the
labor market, for the US university system, and for the economy writ large.
Immigration and labor force
Increased numbers of foreign-born university graduates trained outside the US and
increased numbers obtaining degrees as international students in the US provide new growing
sources of highly educated workers for US firms. By coming to the US these immigrants
strengthen the country’s comparative advantage in high tech and university workforce intensive
sectors. At the same time, however, by augmenting the supply of highly educated workers in
the US and worldwide, the greater number of highly educated foreign-born persons reduces the 14 The IAU data are in computer form but not publicly available as of 2008 but earlier data may exist only in paper form. I am currently trying to get all of these data organized in research-friendly forms.

payoff to investing in higher education in the US. The supply of highly able programmers from
India and other developing countries willing to work at lower pay than Americans has dampened
the growth of the supply of programmers in the US. Looking at PhDs Borjas (2009) finds the
increased number of foreign-born S&E graduates in the US reduces the employment
opportunities and earnings of US-born S&E graduates (Borjas, 2009), which presumably lowers
US supply.
The 1990s economic boom provides striking evidence of the extent to which immigrant
scientists and engineers can increase the total labor supply of graduates in the US in times of
great demand. Census data show that from 1990 to 2000 the foreign born share of bachelor’s
science and engineering graduates increased from 11% to 17%, that the foreign-born share of
master's degree science and engineering graduates increased from 19% to 29% and that the
foreign born share of doctorate science and engineering graduates increased from 24% to 38%
while the foreign-born share of those aged less than 45 nearly doubled from 27% to 52%.
Nearly 60% of the growth in the number of PhD scientists and engineers in the country in the
1990s came from the foreign born. Data from the Current Population Survey for the 2000s show
that the foreign-born share remained in ensuing years as well. In 2005 the foreign born made up
18% of bachelor’s S&E workers, 32% of master’s S&E workers, and 40% of the PhD S&E
workforce and continued to supply over half of doctorate scientists and engineers under the age
of 45. Looking at all college graduates, in 2007 the foreign born were 18% of the US college
graduate work force and 28% of the growth of college graduates from 2000 to 2007.15
15 The 2007 data are from the Bureau of Labor Statistics, Foreign Born Workers: labor force characteristics in 2007 .(http://www.bls.gov/news.release/pdf/forbrn.pdf). The 2000 data are from the Migration Policy Institute http://www.migrationinformation.org/Feature/feb05_spotlight_table1.cfm

As intimated in the earlier discussion of international students, a huge proportion of
immigrant scientists and engineers come to the US first as students.16 Exhibit 10 shows that
nearly 60% of all foreign-born scientists and engineers working in the US obtained their degrees
in the US. The proportion of US degree recipients among the foreign-born was larger at the PhD
and master’s level than at the bachelor’s level, though even among bachelor’s graduates half of
foreign-born S&E workers in the US were US university-educated. The proportions obtaining
degrees in the US versus in their home or in other countries does, however, differ markedly by
country. Many S&E workers from India, the Philippines, the former Soviet Union, and the
United Kingdom were educated outside the US whereas the majority of foreign-born S&E
workers from China, Taiwan, South Korea, Mexico, and Germany were educated in the US.
Since the US accounts for about 10% of all S&E degrees granted in the world (about 8.5% of
bachelor’s degrees compared to 17.6% of PhDs), if the country of degree was unrelated to the
likelihood of working in the US, 10% of the foreign born scientists and engineers in the US
would have been US-educated compared to the 60% who in fact were US-educated.
What is the actual probability that US educated foreign-born scientists and engineers end
up working in the US? To estimate this statistic I compare NSF estimates of the stock of
foreign-born S&E workers with highest degrees in the US in the country to the cumulated
number of the foreign-born who obtained a US degree in the preceding 30 or so years at the
16 Neither the CPS nor the Census ask where someone earned their degree, so they do not distinguish between international students who stay in the US and immigrants who come with foreign degrees. The 2000 Census reported a much higher number of foreign-born S&E workers than did the NSF’s SESTAT data system, because the latter counts foreign-born recipients of US degrees but not immigrants with overseas degrees between Census years. The New American Community Survey asks an open-ended question about the specific major of bachelor’s degree receipients.

doctorate, master’s and bachelor’s levels. The NSF (2008, appendix table 3-8) reports that in
2003 the US had 1.34 million foreign-born S&E workers with a highest degree in the US, of
whom 176,000 had a PhD from the US, 438,000 had a US master’s as their highest degree, and
723,000 had a US bachelor’s degree as their highest degree. These statistics are the numerator
for my estimates.
To estimate the number of foreign-born persons who obtained PhDs in science and
engineering doctorates from whom the 176,000 foreign-born but US trained doctorates came, I
use the number of PhDs granted to persons where were not US-born nor permanent residents
from the Survey of Earned Doctorates between 1970 and 2003.17 There were about 250,000
such persons. Dividing the 176,000 estimated stock in 2003 by 250,000 suggests that about 70%
of the PhDs in the thirty-three year period were in the US in 2003. This statistic is of the same
order of magnitude as Survey of Earned Doctorates data that shows that 70% to 75% of foreign
doctoral recipients plan to stay in the US after they graduate (NSF, Indicators, table 2-33) and
with Michael Finn’s (2007) estimates that in the 2001 PhD graduates cohort, 66% of foreign-
born doctorates were working in the United States for at least 2 years and that 62% of the 1995
graduates were still working in the US ten years later.
For masters’ graduates, I estimate that about 600,000 non-citizens, non-permanent
residents obtained a degree between 1965 and 2003, a slightly longer period due to their being
younger than doctorate graduates. Dividing the 438,000 estimated stock in 2003 by this number
suggests that around 2/3rds stayed to work in the country. For bachelor’s graduates, I estimate
17 There is a problem with using temporary residents since the US gave permanent resident status to Chinese students following Tiananmen Square incident, and those students would be counted with US citizens/permanent residents.

that on the order of 550,000 non-citizens and non-permanent residents obtained S&E degrees in
the US from 1960 to 2003 (again a bit longer to allow for the younger age of these graduates). In
this case the 2003 stock of 723,000 exceeds the estimated number of foreign born persons with a
US S&E bachelors highest degree. While this comparison suggests that there are some serious
problems with the bachelor's graduate statistics, it does not gainsay the conclusion that a huge
proportion of international students who obtain US degrees end up working in the country years
later.
Turning to foreign-born S&E graduates who obtain degrees overseas, the NSF estimates
that in 2003 there were 0.9 million foreign born S&E workers with their highest degree outside
the country. On the basis of estimates of the number of bachelor’s and higher graduates outside
the US and the proportion of those who studied science or engineering, there were about 31
million university-educated S&E workers outside the country.18 Dividing the 0.9 million
foreign-educated S&E workers in the US by the 31 million degree recipients, I estimate that
approximately 3% of foreign-born S&E workers with highest degrees outside the country
immigrated to the country.
18 My estimate is based on NSF estimates that 26% of the stock of university graduates in the world was in the US in 2000 “or most recent year” (NSF, Science and Engineering Indicators 2008, figure 3-52). In 2003 50 million persons aged 25 and over had 4 or more years of higher education in the US (Statistical Abstract, 2003, table 214). The supply of university graduates outside the US was thus on the order of 150 million persons. From the statistics in exhibit 2 of this study, I estimate that 27% of bachelor’s graduates outside the US are in science and engineering. This gives an estimate of 31 million science and engineering graduates outside the US.
To what extent might the huge difference between the likelihood that foreign-born S&E
graduates with US highest degrees end up working in the US and the likelihood that a foreign
born graduate earning an S&E degree outside the country migrates to the US reflect the causal
impact of being an international student on immigration behavior, as opposed to selectivity of
persons with greater desire to move to the US? Lacking experimental or pseudo-experimental
variation in studying in the US to answer this question, I seek an answer in estimates of the
causal impact of international study on a graduate’s future location of work from analyses of the
European Union’s Erasmus program (http://en.wikipedia.org/wiki/ERASMUS_programme).
This program provides financial incentives to students to study outside their country for one or
two terms. Comparing cohorts of students before and after introduction of the program and
groups eligible and ineligible due to the timing of their university’s involvement with the
program, Parey and Waldinger estimated causal impacts on location decisions on the order of 20
percentage points – far below the huge difference in the proportion of international students who
immigrate to the US and the proportion of non-US trained graduates who migrate to the US
given above. Other studies of student migration and employment in the EU (Oosterbeck and
Dinand, 2006; De Grip, Fourage and Sauerman, 2008; Dreher, Axel and Poutvaara, 2008) find
similar orders of magnitude for the impact of being an international student and future work in a
foreign country. As to the mechanism by which study abroad causally affects working abroad,
Parey and Waldinger (2008, table 11) find that social factors in the form of a partner are
important in leading former international students to work outside their home country and that
assessments of career prospects also influence the decision to work overseas, presumably by
linking the students to potential future employers.

The estimated causal impact of foreign study on immigration decisions from the Erasmus
program is likely to understate the causal impact of being an international student in the US on
migration behavior. The reason is that the Erasmus program is a smaller treatment than 4-6 or
so years of study for a degree in the US, during which time the student could very well build up
job and social connections that could make returning home more like immigration than
remaining to in the US. In addition, whereas students in the Erasmus program move between
countries with roughly similar standards of living, most US international students are from
developing countries such as China and India rather than from comparable advanced countries.
The rates of staying for PhD graduates are much higher for persons from lower income countries
than for those from higher income countries.
The increased number of university graduates overseas and of international students who
return to their homeland will also create competition for highly educated US workers.
Increasing their stock of university graduates improves the ability of other countries to compete
with the US in high tech and other sectors that use highly educated workers. With large numbers
of graduates outside the US multinationals are more likely to locate research and development
work and other activities that require university-education overseas. Consistent with this
between 1994 and 2004 R&D employment increased by 94% in the majority owned foreign
affiliates of US multinationals while employment in the parent firm increased by 39%.19
The impact of globalization of higher education on the US university system
19 In 1994 RD employment was: 92,400 in majority-owned foreign affiliates of US MNCs and 591,200 in US parent firm http://www.bea.gov/scb/account_articles/international/1296iid/table17.htm. In 2004 it was 179,300 in majority-owned foreign affiliates and 818,7000 in parent firm (Yorgason, 2007, tables 1 and 3).

The growing number of students and universities in other countries impacts the US
university system in several ways. Increased numbers of bachelor’s graduates from other
countries raises demand for places in US graduate and professional schools. If US universities
treat foreign and domestic applications equally, the increased share of bachelor’s degrees outside
the US will reduce the proportion of US graduates admitted to particular programs. In 2008 the
bright US graduate from, say, Haverford must compete for admission to Berkeley, Harvard,
Michigan, or MIT with students from China, Brazil, India, France, Germany and so on as well as
with top graduates from Texas, Syracuse, Dartmouth etc. In July 2008 the Chronicle of Higher
Education reported that the three leading major undergraduate institutions for US PhD programs
were Tsinghua, Beijing, and Seoul National University.20 Given that the top US graduate and
professional schools have not increased the number of graduate slots much (Freeman, Jin, Chen)
the chances of graduates of US institutions gaining admission to these programs has been and is
likely to continue to fall.
But this does not mean that overseas applicants push students from US bachelor’s
programs out of post-graduate education. The US has a large number of universities that have
expanded graduate enrollments. The expansion of US-born women into graduate programs
occurred more or less simultaneously with increased foreign student enrollments. Many foreign-
born graduate students enrolled at less prestigious universities, which enabled those institutions
to improve their graduate programs (Freeman, Jin, Chen). To the extent that the supply of US
students to graduate programs diminishes due to the increased attraction of MBA or law
programs, bachelor’s graduates from overseas will keep some graduate programs in business. 20 http://chronicle.com/news/article/4822/graduates-of-chinese-universities-take-the-lead-in-earning-american-phds

International ratings of universities place US institutions at the top of the world tables.
The Institute of Higher Education, Shanghai Jiao Tong University rates eight of the top ten
universities as American, nine of the next ten, and 37 of the top 50
(http://ed.sjtu.edu.cn/rank/2005/ARWU2005_Top100.htm). In its league tables, the Times of
London places more UK universities among the top but the UK numbers still fall far short of
those for the US (http://www.timesonline.co.uk/tol/life_and_style/education/article502890.ece).
Associated with the dominance of the US university system is its ability to attract outstanding
foreign-born scientists and engineers, many of whom first came to the country as international
students, as noted. In 2003 a large proportion of full-time doctoral instructional faculty in
research institutions in the physical sciences/math/ computer sciences/engineering were foreign-
born -- 47% of compared to 38% in 1992 (NSF, 2008, appendix table 5-21).
Over time foreign universities will improve their quality, so that the expansion of higher
education outside the US will create greater competition for American universities in attracting
international students. For American students and faculty, the benefit will be a greater number
of quality universities at which to obtain an education or a job. The challenge to US universities
will be to remain world centers of excellence in spite of increased overseas competition. This
presumably requires that they innovate in various ways, taking advantage of their “brand
names”, culture of openness, ties with business, and so on. Some US institutions have developed
overseas branch campuses to increase enrollments in particular countries (for instance, Carnegie
Mellon in the Qatar). This may work in some countries but not in others. In the early 1990s
about 40 US universities had branches in Japan, but the Japanese educational authorities did not
accredit them and all but 3 have shut down.
Foreign universities, particularly from Australia and the UK, have been more active than
US universities in seeking international students as undergraduates. Some Australian universities
award degrees to students who do part of their education at lower cost universities in their home
country. The Australian government gives preference in immigration to graduates from
Australian institutions. British universities have more branches overseas than American
universities, particularly in Commonwealth countries. In non-English speaking countries many
universities have switched their education into English, which increases their attractiveness for
international students. Among the developing countries, China’s Project 985 policy for creating
a number of first-rate universities of international advanced standing represents perhaps an
extraordinary bold effort to leapfrog a low income country to the forefront of higher education.
It involved providing sizable financial grants to nine universities -- Beijing Fudan, and Nanjing
among traditional universities and to Tsinghua and five other institutions oriented primarily to
science and technology. In 2004 the government expanded financial support to an additional 30
institutions. While it will take time, and perhaps increased democratization of China for these
universities to challenge the very best American universities, the Chinese university system has
greatly improved its attractiveness to faculty and students worldwide. In fall 2008 the Chronicle
of Higher Education reported that China had become the fifth top college destination for
international students, particularly attracting those from Asia (Hvistendahl, 2008).
In the face of global competition it is difficult to imagine the US maintaining the
dominance it has had in the latter part of the 20th century (just as it is difficult to imagine the US
maintaining its dominance of the global economy). But barring some horrific policies or events I
would expect US universities to continue to among the world’s leader in higher education into

the foreseeable future and thus to keep attracting high skill immigrants to the country.
Impacts on the economy
The increased number of science and engineering and highly educated workers around
the world has two major positive impacts on the economy. First, it should accelerate the growth
of scientific and technological knowledge and the economic progress that flows from this
knowledge. One does not have to be a devotee of “the singularity” view of technological
progress21 to believe that having three or so times as many university graduates, particularly in
science and engineering, than a quarter century ago, the Internet to spread knowledge, and
computers to perform calculations unimaginable two or so decades ago could produce a golden
age for humanity. We benefit from advances in our understanding in biology or nano-
technology or robotics or economics for that matter regardless of whether the increased
knowledge comes from the US or other places, or from US-born persons or foreign-born
persons. To the extent that taxpayers in some other country fund research and education, we win
without paying for it. Second, the increased number of highly educated workers overseas
should raise productivity in foreign countries, which in turn should reduce the cost of their
exports to the US. This will benefit all Americans who do not compete in producing those
goods. If Romanian scientists and engineers figure out ways to improve the production of shoes,
the price of shoes on the global market will fall, and the US as a major importer of shoes will
benefit.
But there is a negative side. The increased supply of university graduates in other
countries will enhance their ability in the high tech sectors that employ relatively many college
21 http://en.wikipedia.org/wiki/Technological_singularity

graduates, where the US has comparative advantage. In the context of the North-South model of
trade in which the advanced North does the R&D that produces innovative products and the
developing South produces products based on low wage labor, this competition will squeeze US
earnings and job opportunities. With more highly educated workers, developing countries
should be able to increase their rate of innovation and their rate of imitation. The prices of US
exports in high tech and other university graduate intensive sectors should decline, with adverse
consequences for the workers in those sectors and for workers with similar skills elsewhere.
In some cases, given the lower cost of labor, the US may lose its position as the major
producer of high tech goods or of the research and development on which they are based. NSF
(2008) data show that China has in fact increased its share of export markets in high tech goods.
The Georgia Tech index of the technical prowess of countries based on a variety of statistics
shows a huge rise in the position of China's prowess. The index will surely show increases in the
position of other developing countries in the next decade or two.
In response to the growth of highly educated workers worldwide, the US can seek to
attract international students on the notion that many will stay in the country as immigrants and
can encourage high skilled immigrants to come to the country. Given that the multinational
firms in the forefront of technology can locate activities in the US or offshore activities overseas,
the policy issue for the US would seem to be whether it is better to attract immigrant specialists ,
or to have the multinationals offshore an increasing proportion of their work overseas. Which is
better for the US – off shoring or immigration? Grossman-Rosi-Hansberg (2006) make a case for
off shoring. Assuming that wages in the developing countries are lower for similar work than
wages in the US off shoring costs less than the same work done by immigrants in the US. Off
shoring is equivalent to an improved technology that allows US workers to do their tasks better.
Foreign-born workers compete on the off shorable tasks but not on other activities with
Americans for whom they are substitutes. By contrast, immigrants compete with Americans in
all sorts of jobs, including those in non-traded sectors. Taking a broadly similar approach Jones
and Ruffin argue that under some conditions it is even desirable to give our best technology to
the low wage foreign countries, because we will then get the products back at the lowest cost. In
the case of science or engineering, better to have an inventor doing their work overseas at lower
cost than doing it in the US at higher cost.
But can the same person do as good work in a developing country as in the US? There is
diverse evidence that the huge pay and productivity difference between workers in the US and in
developing countries cannot be explained by human capital or capital/labor ratios or any other
observable measure, for that matter. Analyzing research papers, Macgarvie and Khan (2008)
show that the number of papers written is higher for nominally similar international students in
the US than for those whose fellowships make them return to their native countries. The
implication of these findings is that the same person working with the same capital produces
more in the US than in most other countries. Why? One possible reason is the US's business
and work culture, which is difficult to replicate, but whatever the reason, the greater productivity
in the US implies that immigration raises output more than off shoring and thus is to be preferred
on that criterion.
Does the productivity of US workers benefit more from immigration or offshoring?
Working in direct contact with someone would appear to raise productivity more than buying
their goods, because of the greater likelihood of learning about work activity from them.

Kremer and Maskin's model of the mixing of low and high skilled workers does not deal with
immigration and off shoring per se but it gives conditions for the sorting of workers between
advanced and developing countries that shows that the answer to the productivity question will
depend on relative numbers and productivities of skilled and less skilled workers outside and
within the US as well as on the strength of complementarity reflected in the production function.
Conclusion
This paper has documented the spread of higher education around the world. It has
shown that the rising proportion of young persons going to college in advanced countries, which
have risen above those in the US in some countries, and in the huge populous developing
countries has greatly diminished the US's share of the world's university students and graduates.
Because international students make up roughly half of university graduate immigrants, the
ability of US universities to attract the world's best and brightest international students has
important consequences for its success in attracting immigrant talent.
The growing number of foreign-born persons getting PhDs outside the US as well as in
US universities will undoubtedly diminish the gap between US universities and those in other
countries. The world ranking of top universities in 2020 is likely to include many more from
other countries. Increasingly, new knowledge will come from workers outside the country, but
there is much the US can gain from this. We do not know whether the US will do better through
immigration or through off shoring of some university graduate-level work overseas. My guess
is that by educating some of the best students in the world, attracting some to stay in the country
and positioning the US as an open hub of ideas and connections for university graduates
worldwide, the country will be able to maintain excellence and leadership in the "empire of the

mind" and in the economic world more so than if it views the rapid increase in graduates
overseas as a competitive threat.

References
Aoki, Kumiko Japanese Higher Education Institutions in the 21st Century The Challenge of Globalization and Internationalization electronic journal of contemporary japanese studies Discussion Paper 7 (http://www.japanesestudies.org.uk/discussionpapers/2005/Aoki.html) Aslambeigui, Hahid Veronica Montecinos 1998 “Foreign Students in US Doctoral Programs” Journal of Economic Perspectives, vol 12 no 6 Summer, pp 171-82 Boarini, Romina and Hubert Strauss "The Private Internal Rates of Return to Tertiary Education New Estimates for 21 OECD Countries" OECD Working paper No. 591, 20/12/2007 Bennell, P and T. Pearce “The Internalisation of Higher Education: exporting education to developing and transitional economies” International Journal of Educational Development 23(2003) 215-232 Constant, A. F. and D'Agosto, E. (2008). Where do the brainy Italians go?, IZA Discussion Paper 3325, Institute for the Study of Labor (IZA), Bonn. Dreher, Axel & Poutvaara, Panu (2005), .Student Flows and Migration: An Empirical Analysis., IZA DP (1612). Duke University, Master of Engineering Management Program “Framing the Engineering Outsourcing Debate: placing the United States on a Level Playing Field with China and India” (Duke University, Dec 12, 2005) Edin Per Anders and Robert Topel, “Wage Policy and Restructuring: The Swedish Labor Market since 1960” in The Welfare State in Transition: Reforming the Swedish Model (editors Richard Freeman, Robert Topel and Birgitta Swedenborg); 1997 University of Chicago Press Finn, Michael “Stay Rates of Foreign Doctorate Recipients from U.S. Universities,” 2005 Oak Ridge Institute for Science and Education 2007 Freeman, Richard Does Globalization of the Scientific/Engineering Workforce Threaten U.S. Economic Leadership?” NBER Working Paper No. 11457 July 2005 Freeman, Richard, Emily Jin, and Chia-Yu Shen “Where Do New US-Trained Science-Engineering PhDs come from?” NBER Working Paper No. 10554 June 2004 Freeman, Richard “Overinvestment in College Training?" Journal of Human Resources Summer 1975.
Freeman Richard The Over-educated American. New York: Academic Press, 1976.
Freeman, Richard B. The Market for College-Trained Manpower (Harvard, 1971)
Guellec, Dominique & Cervantes, Mario (2001), International Mobility of Highly Skilled Workers: From Statistical Analysis to Policy Formulation, in .InternationalMobility of the Highly Skilled., OECD, pp. 71.98. Hvistendahl, Mara “China Moves Up to Fifth as Importer of Students” The Chronicle of Higher Education, Sept 19,2008, Healey Nigel M “Is Higher Education really internationalising?” Higher education, 2008. 55: 333-355- Hwang, Jane, 2008 undergraduate research paper, Harvard University Jahr, Volker & Teichler, Ulrich (2000), Employment and Work of Former ERASMUS Students, in U. Teichler, J. Gordon & F. Maiworm, eds, .Socrates 2000 Evaluation Study., Study for the European Commission, chapter 5, pp. 99.117. King,R. and Ruiz-Gelices, E 2003). International student migration and the European\yearabroad": effects on European identity and subsequent migration behavior, International Journal of population Geography 9:229{252 Lowell,B.Lindsay (2007),.Trends in International Migration Flows and Stocks,1975- 2005.,OECD Social,Employment and Migration Working Papers(58). MacGarvie, Megan and Shulamit Khan Labor Mobility and International Knowledge Diffusion: Evidence from the Foreign Fulbright Program, NBER spring 2008 Marginson, Simon “The Global Market in Foreign Higher Education: The Case of Australia” Association for Studies in Higher Education (ASHE) 26th Annual Conference, 15-18 November 2001 Richmond, Virginia’ Marginson, Simon “Dynamics of National and Global Competition in Higher Education” Higher education, 2006. 52: 1-39 McKinsey Global Institute, 2005, The Emerging Global Labor Market: Part I, white paperss, 2005-06-01 National Academy of Sciences, Policy Implications of International Graduate Students and Postdcoctoral Scholars in the US (NAS Press, 2005) National Science Foundation, Science and Engineering Indicators 2004

OECD, Education at Glance 2005 OECD , Internationalisation and Trade in Higher Education: Opportunities and Challenges, OCED, 2004 Oosterbeek, Hessel & Webbink, Dinand (2006),.Does studying abroad induce a brain drain?.,CPB Discussion Paper 64. Parey,M and F.Waldinger (2008):“Studying abroad and the effect of international labor market mobility: evidence from the introduction of ERASMUS: IZA discussion paper 3430 Rosenzweig, Mark 2006 “Global Wage Differences and International Student Flows, Brookings Trade Forum Schofer Evan and John W. Meyer” Worldwide Expansion of Higher Education”Center on Democracy, Development, and The Rule of Law , Stanford Institute on International Studies Working paper 32, Jan 20, 2005. Song, Weiguo and Zhaohui Xuan (2004) “Preliminary Analysis of China's Doctorate Education” OECD Careers of Doctorates Workshp, September Spilimbergo, Antonia “Democracy and Foreign Education” CEPR discussion paper 5934, Nov 2006 US National Center for Education Statistics US Statistical Abstract, 2006 US Statistical Abstract, 2008 Wadwha, Vivek, Gary Gereffi, Ben Rissing, Ryan Ong, Getting the Numbers Right: International Engineering Education in the United States, China, and India “ Journal of Engineering Education, Vol. 97, No. 1, pp. 13-25, 2008 Welch, Anthony, “Going Global? Internationalizing Australian Universities in a Time of Global Crisis” Comparative Education Review, vol. 46, no. 4.2002 Yonezawa, Akiyoshi “Japanese Flagship Universities at a Crossroads” Higher Education, 2007. 54. 483-499 Yorgason, Daniel “Research and Development Activities of US Multinational Companies” Survey of Current Business, March 2007, pp 22-39.

Web sites referenced http://ed.sjtu.edu.cn/rank/2005/ARWU2005_Top100.htm http://en.wikipedia.org/wiki/Technological_singularity http://www.moe.edu.cn/edoas/website18/info7901.htm http://www.moe.edu.cn/edoas/website18/info14477.htm http://stats.uis.unesco.org/TableViewer/tableView.aspx?ReportId=47 http://www.uis.unesco.org/en/stats/centre.htm http://www.uis.unesco.org/pagesen/DBGTerIsced.asp Cross National Time Series Data Archive, 2004 Arthur S. Banks, http://www.databanks.sitehosting.net/www/faq.htmhttp://ed.sjtu.edu.cn/rank/2005/ARWU2005_Top100.htm http://en.wikipedia.org/wiki/Technological_singularity http://www.moe.edu.cn/edoas/website18/info7901.htm http://www.moe.edu.cn/edoas/website18/info14477.htm http://stats.uis.unesco.org/TableViewer/tableView.aspx?ReportId=47 http://www.uis.unesco.org/en/stats/centre.htm http://www.uis.unesco.org/pagesen/DBGTerIsced.asp CrossNationalTimeSeriesDataArchive,2004ArthurS.Banks,http://www.databanks.sitehosting.net/www/faq.ht
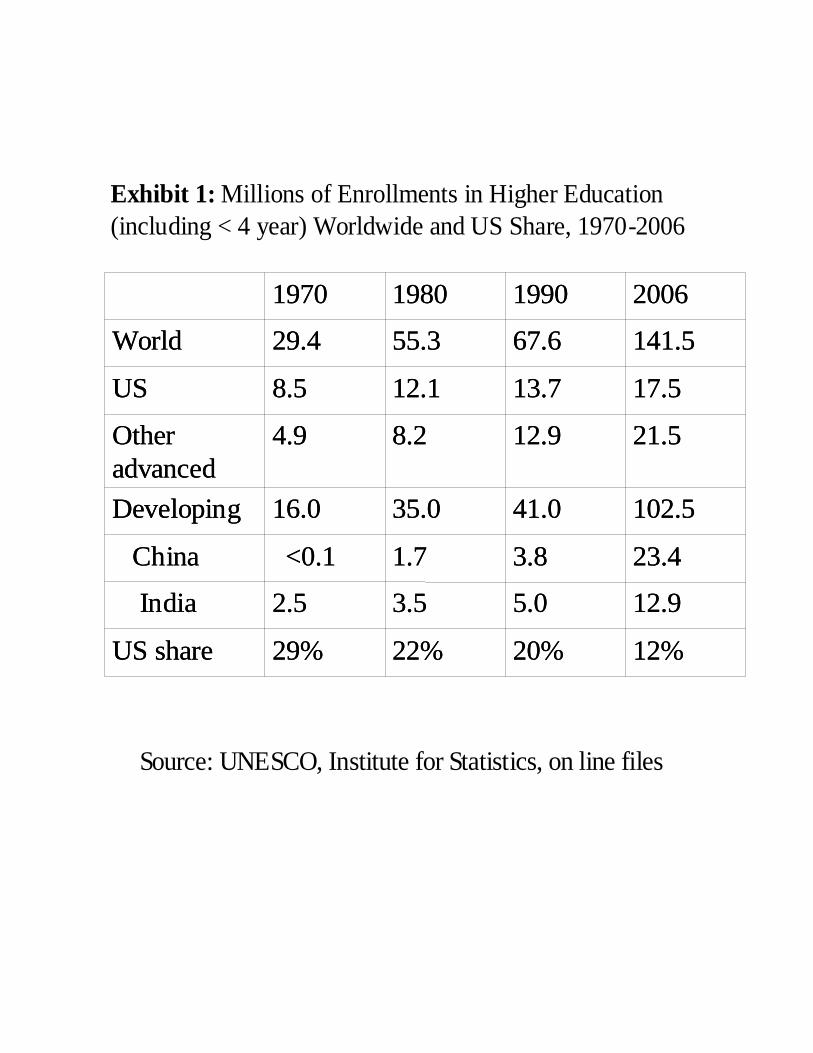
Exhibit 1: Millions of Enrollments in Higher Education (including < 4 year) Worldwide and US Share, 1970-2006
12%20%22%29%US share
12.95.03.52.5India
23.43.81.7<0.1China
102.541.035.016.0Developing
21.512.98.24.9Other advanced
17.513.712.18.5US
141.567.655.329.4World
2006199019801970
12%20%22%29%US share
12.95.03.52.5India
23.43.81.7<0.1China
102.541.035.016.0Developing
21.512.98.24.9Other advanced
17.513.712.18.5US
141.567.655.329.4World
2006199019801970
Source: UNESCO, Institute for Statistics, on line files

Exhibit 2: Millions of First University Degrees, Natural S&E Degrees, 24 year olds, ~2004 and ) ~1995-2004
-0.711.743.5%6.1%Nat S&E /24 yr
-1.302.6413.8%36.5%First/24 yr old
-0.54.9%79.3633.85124 yr old
-2.88.5%2.3950.219Nat S&E
-5.5 12.9%10.9261.407First Degree
Change in % pts, 1995-2004*
US/World2004
World2004
US2004
-0.711.743.5%6.1%Nat S&E /24 yr
-1.302.6413.8%36.5%First/24 yr old
-0.54.9%79.3633.85124 yr old
-2.88.5%2.3950.219Nat S&E
-5.5 12.9%10.9261.407First Degree
Change in % pts, 1995-2004*
US/World2004
World2004
US2004
Source: NSF 2008, appendix table 2 -37 and 2006 table 2-37 for 24 year olds; NSF 1998 for 1995; * 1995-2004 for US/(Asia+Europe+ North America)

Exhibit 3: Ratio of S&E PhDs from Foreign Universities to US Universities and US share of World S&E PhDs, 1975-2010
0.72Chinese ‘diaspora’/ US c
1.92
1.26
2010
17.6%22.3%US Share of World S&E PhDs
1.781.541.220.93All Advanced EU b
1.021.070.840.64EU major (Fr, Germ, UK) 0.290.290.160.11Japan0.570.320.05naChina1.230.960.480.22Asia major nations a
2004200119891975
0.72Chinese ‘diaspora’/ US c
1.92
1.26
2010
17.6%22.3%US Share of World S&E PhDs
1.781.541.220.93All Advanced EU b
1.021.070.840.64EU major (Fr, Germ, UK) 0.290.290.160.11Japan0.570.320.05naChina1.230.960.480.22Asia major nations a
2004200119891975
Sources: Science & Engineering Indicators – 2008 , table 2-40; 2002, table 2-36; Weigo &Zhaohui National Research Center for S&T Development (China) – private communication; a
China, Japan, India, Korea ; b Includes Norway, Switzerland, excludes new EU entrants, extrapolation to 2010; cdiaspora’ includes estimates of Chinese doctoral graduates from UK, Japan, and US (with temporary visas). US natives = citizens and permanent residents

Graduation Data from OECD/NSF 1992 2005
“Tertiary A” graduation rates (OECD) 2 of 15 13 of 20Bachelor’s Degrees/24 yr old (NSF)* 2 of 21 14 of 23Nat Science & Engineering/24 yr old (NSF) 3 of 21 19 of 23Phd or equivalent graduation rates (OECD) --- 9 of 20 All Science Grads/ 25-34 yr olds (OECD) --- 12 of 20
Enrollment data from OECD 1995 2005
first time entry as % of age group 2 of 15 7 of 20Enrollment % of 20-29 yr olds 9 of 20 12 of 20
Survival Rates from OECD for advanced countriesGraduation/new entrants for type A 2004 17tie out of 18
Exhibit 4: US Rank in Propensity for University Training, 1992-2005
OECD, Education at a Glance, NSF, Science and Engineering Indica tors

Exhibit 5A: OECD Estimated Ln Wage Coefficient and Proportion of 24 yr olds Getting Bachelor's Degree (r=0.19)
US
UkPorFrIt IrAu FinCaDkGe Sz
AusNeBe
Gr
SwSp0.2
0.250.3
0.350.4
0.450.5
0.550.6
0.650.7
0 10 20 30 40 50 60
NSF Degrees/24 yr olds 2002
Ln W
age
Coe
ffici
ent
Exhibit 5B OECD Estimated Internal Rate of Return to College Degree and Proportion of 24 yr olds Getting
Bachelor's Degree (r=0.39)
Sp
SwGrBe
Ne
AusSz
Ge
DkCa Fin
Au
Ir
It
Fr
PorUk
US
456789
10111213
0 10 20 30 40 50 60
NSF Degrees/24 yr olds 2002
Inte
rnal
Ret
urn

Exhibit 6A: Enrollment Ratios of Women/Men in higher education, by age group, advanced countries, 2004
Country OECD UN Norway 1.54 1.38
Iceland 1.78 1.82 Australia 1.23 1.14 Ireland 1.28 1.28 Sweden 1.55 1.47 Canada 1.36 -- US 1.39 1.27 Netherlands 1.08 1.17 Finland 1.20 1.26 Luxembourg 1.18 --
Portugal 1.32 -- Germany .. 0.97 Japan 0.89 0.73 Switzerland 0.80 0.97 Korea, 0.61 0.87 Belgium 1.21 1.06 Austria 1.19 1.24 Denmark 1.42 1.58 France 1.28 1.47* Italy 1.34 1.27 UK 1.37 1.17 * Spain 1.22 1.41 NZ 1.41 1.41 Israel 1.33 -- Greece 1.17 1.23
Source: OECD, Education Statistics at a Glance United Nations,

Exhibit 6B: Ratio of Female to Male Tertiary enrollment rates
Source: UNESCO
Group/Country 1988 2005WORLD 64 105Advanced 106 121
116 140
81 108All developing countries 54 91
82 96
87 131Most populous developing countries
47 70
55 95
-- 79
106 132
46 88
25 53-- 55
66 99-- 123
--
US
Netherlands
Chile
Malaysia
India
China
Indonesia
Brazil Pakistan
Bangladesh Nigeria Mexico Philippines
Vietnam 71

Exhibit 7: International Students Worldwide, and in the US and US share, 1975-2005 Year Millions of International Students US Share
Total US 1975 0.6 0.15 25% 1980 0.8 0.29 36% 1985 0.9 0.39 38% 1990 1.2 0.45 33% 1995 1.3 0.51 35% 2000 1.9 0.57 26% 2005 2.7 0.58 22%
Source: OECD, Education at a Glance, 2007, Box c3.1 and IIE, International Students and Mobility http://exchanges.state.gov/universitysummit/mobility_report.pdf
NB: Project Atlas reports somewhat smaller numbers: “In 2006, UNESCO estimated that over 2.5 million students were being educated at the tertiary level in countries other than their homes, up from an estimated 1.7 million in 2000” (http://www.atlas.iienetwork.org/?p=46572)
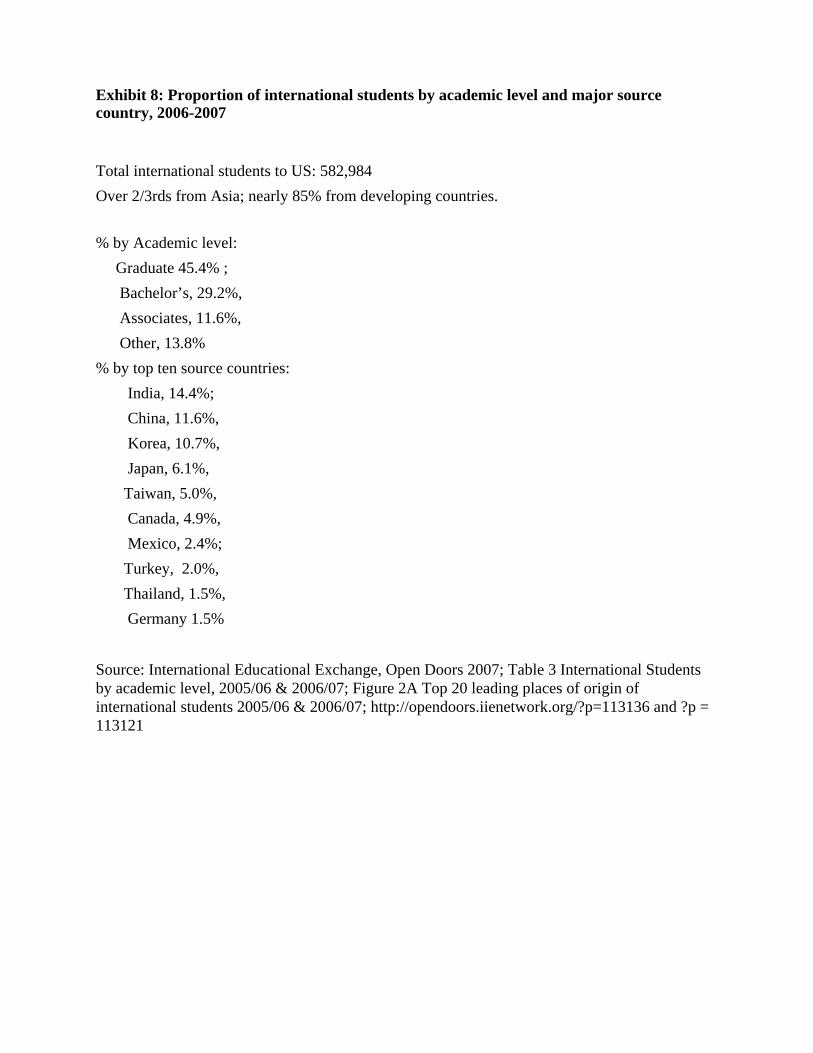
Exhibit 8: Proportion of international students by academic level and major source country, 2006-2007
Total international students to US: 582,984 Over 2/3rds from Asia; nearly 85% from developing countries. % by Academic level: Graduate 45.4% ; Bachelor’s, 29.2%, Associates, 11.6%, Other, 13.8% % by top ten source countries: India, 14.4%; China, 11.6%, Korea, 10.7%, Japan, 6.1%, Taiwan, 5.0%, Canada, 4.9%, Mexico, 2.4%; Turkey, 2.0%, Thailand, 1.5%, Germany 1.5%
Source: International Educational Exchange, Open Doors 2007; Table 3 International Students by academic level, 2005/06 & 2006/07; Figure 2A Top 20 leading places of origin of international students 2005/06 & 2006/07; http://opendoors.iienetwork.org/?p=113136 and ?p = 113121

Exhibit 9: Share of US degrees to non-citizens/permanent residents, 1985-2005 ALL Natural S &E Engineering
1985 2005 1985 2005 1985 2005
Bachelor’s 3.0 3.1 5.4 5.2 7.2 8.0 Master’s 9.4 12.8 27.2 38.6 26.2 39.7
Doctorate 25.3 39.3 33.1 50.9 59.6 68.8
Source: Degrees, NSF, Science and Engineering Indicators, 2008, chapter 2, Tables 2-28. 2-30, 2-31; Post-docs, Enrollments, grad, table 2-22.
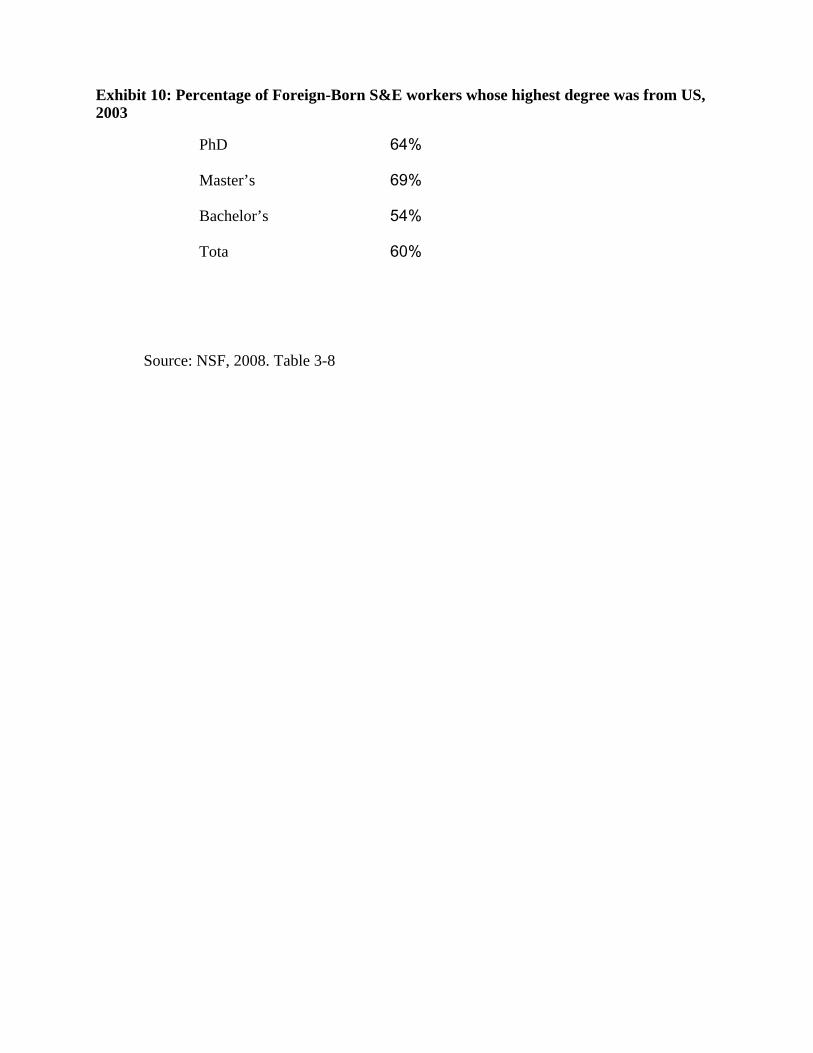
Exhibit 10: Percentage of Foreign-Born S&E workers whose highest degree was from US, 2003
PhD 64%
Master’s 69%
Bachelor’s 54%
Tota 60%
Source: NSF, 2008. Table 3-8
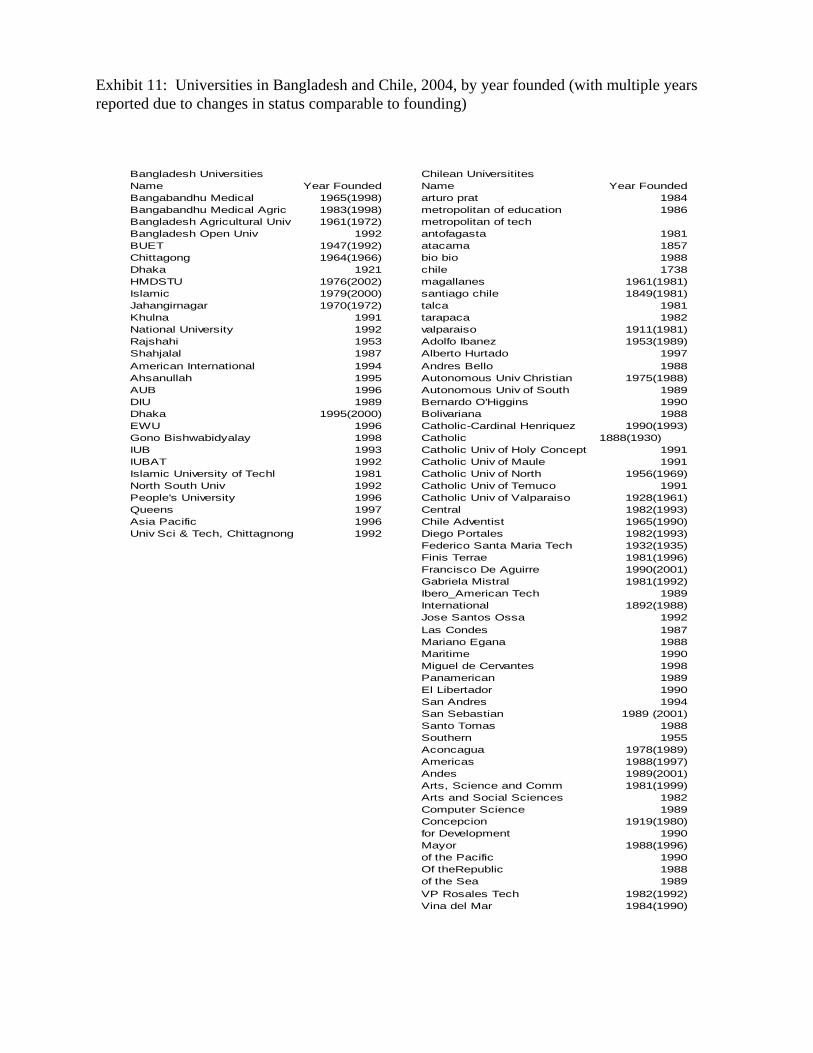
Exhibit 11: Universities in Bangladesh and Chile, 2004, by year founded (with multiple years reported due to changes in status comparable to founding)
Bangladesh Universities Chilean UniversititesName Year Founded Name Year FoundedBangabandhu Medical 1965(1998) arturo prat 1984Bangabandhu Medical Agric 1983(1998) metropolitan of education 1986Bangladesh Agricultural Univ 1961(1972) metropolitan of techBangladesh Open Univ 1992 antofagasta 1981BUET 1947(1992) atacama 1857Chittagong 1964(1966) bio bio 1988Dhaka 1921 chile 1738HMDSTU 1976(2002) magallanes 1961(1981)Islamic 1979(2000) santiago chile 1849(1981)Jahangirnagar 1970(1972) talca 1981Khulna 1991 tarapaca 1982National University 1992 valparaiso 1911(1981)Rajshahi 1953 Adolfo Ibanez 1953(1989)Shahjalal 1987 Alberto Hurtado 1997American International 1994 Andres Bello 1988Ahsanullah 1995 Autonomous Univ Christian 1975(1988)AUB 1996 Autonomous Univ of South 1989DIU 1989 Bernardo O'Higgins 1990Dhaka 1995(2000) Bolivariana 1988EWU 1996 Catholic-Cardinal Henriquez 1990(1993)Gono Bishwabidyalay 1998 Catholic 1888(1930)IUB 1993 Catholic Univ of Holy Concept 1991IUBAT 1992 Catholic Univ of Maule 1991Islamic University of Techl 1981 Catholic Univ of North 1956(1969)North South Univ 1992 Catholic Univ of Temuco 1991People's University 1996 Catholic Univ of Valparaiso 1928(1961)Queens 1997 Central 1982(1993)Asia Pacific 1996 Chile Adventist 1965(1990)Univ Sci & Tech, Chittagnong 1992 Diego Portales 1982(1993)
Federico Santa Maria Tech 1932(1935)Finis Terrae 1981(1996)Francisco De Aguirre 1990(2001)Gabriela Mistral 1981(1992)Ibero_American Tech 1989International 1892(1988)Jose Santos Ossa 1992Las Condes 1987Mariano Egana 1988Maritime 1990Miguel de Cervantes 1998Panamerican 1989El Libertador 1990San Andres 1994San Sebastian 1989 (2001)Santo Tomas 1988Southern 1955Aconcagua 1978(1989)Americas 1988(1997)Andes 1989(2001)Arts, Science and Comm 1981(1999)Arts and Social Sciences 1982Computer Science 1989Concepcion 1919(1980)for Development 1990Mayor 1988(1996)of the Pacific 1990Of theRepublic 1988of the Sea 1989VP Rosales Tech 1982(1992)Vina del Mar 1984(1990)
