what does elsevier count? use measures for electronic resources: theory & practice alcts...
TRANSCRIPT

What does Elsevier count?Use Measures for Electronic Resources:
Theory & PracticeALCTS Program, ALA, Chicago
Daviess MenefeeDirector, Library Relations, AmericasDate: June 27, 2005

2
My Agenda for today Part 1: Some history on usage reporting with
ScienceDirect
Part 2: Present some of the business aspects of usage from a publisher’s point of view
Part 3: Look at a couple of interesting results on usage and its reporting from our internal studies

3
Not too long ago….
ScienceDirect usage reports were: Word Documents Derived by processing logfiles on a PC, over a
single weekend Provided only the barest of data Began with 6 insisting customers Delivered via email by the assigned Account
Manager Never detailed what was not used.

4
Did we know what we were doing? We thought so. Some internal concern over the potential impact of
usage reports on subscriptions No standard or benchmarks to follow Navigating in the dark Had high hopes to advance the “science” of usage
reporting and analysis. But we didn’t know what that was.
Usage reporting grew organically from the demands of the market as well as the business.
5
And then we made some mistakes.
Usage reporting and transactional downloads were not fully reconcilable. Two different systems in play.
Not including 0 usage in the reports caused a degree of unreliability in the reports.
Trying to define sessions in a session-less state was not very productive.

6
But then we did some good things.
Published a white paper indicating that we were reducing the number of downloads based on user behavior. (Our sales staff were not pleased.)
Invested heavily in designing and implementing a state of the art system that could provide reports directly to the customer.
Supported the establishment of Counter.

7
Did we learn anything?
Yes, about customer reporting. We have improved as an industry in defining and delivering them. We have come a long way.
We have created a trusted third party group to monitor and audit the reports.
We continue to study user behavior and try to understand it better.

8
Part 2: Why does Elsevier count usage?
Data for business information such as Trends Product Performance Return On Investment
Need Data for Informed decisions Determine Future Directions, ex: Pricing
9
Elsevier Management Reports
Produced Monthly Summarize Key Performance Indicators Indicators: Major Areas
Content System Customers Other (Links, trials, Web Editions, etc.)

10
Performance Indicators for SD Content Indicators
Number of Journals Number of Abstracts Number of full-text articles available
System Performance Number of Page Requests Total Full-text articles downloaded, PDF/HTML Total Articles incl. SD On Site Total Searches

11
Performance Indicators, 2
Customers Number of Contracts Number of Registered Accounts Number of Active Accounts Estimated number of user sessions Number of Active Users (cookie based)
12
More on Performance Indicators
“Other areas” measured: Trial Customers Guest Usage
Esp. Article downloads (PPV) Web Editions (limited to customer base
statistics) Promotional Usage Scirus (no. of searches and indexed pages) Linking Indicators
13
What is the point?
Company has set target numbers for most areas of the KPI’s.
Change our thinking from traditional publishing to how to grow an electronic journals--books business.
Enables the setting of objectives and priorities.
Publishing units now have usage goals.
14
Product Management Reports
Opportunity for product managers to review and comment on trends or explain why a number is out of proportion.
Examples: Usage of abstracts decreased during the month
but the number of guests users increased. MathML increased this month over last month
and points to a trend of continuing growth.

15
Data is converted to graphs
ScienceDirect Usage--One MonthHome Page
Subject corners
Journal issues / TOC pages
Articles
Database abstracts
Search result lists
Search activity
Gateway entries
Other
Journal/Book homepage visits
Journal/Book/MRW lists

16
What’s worth counting?
Just about everything that involves end users and content.
Full-text Articles are the norm but Elsevier also continues to monitor browsing behavior especially from guest users (a possible new market).
Important to look at changes and how that effects any usage (training, system changes, etc.)

17
Part 3: Some Internal Studies
1. Referring URL Study Who is sending us the traffic? What are the subject areas where users
come into the product?
2. Usage on Usage Study Are these reports really being used? Who is using them? What triggers use?

18
Traffic Referrals to SD
Major Sites (95%): Customers’ OPACs PubMed Elsevier Site – Cell Press Cross Ref ChemPort Search Engines (Scirus)

19
Referrals as a Chart
Customer
PubMed
Elsevier
Cross Ref
ChemPort
Search Engines
20
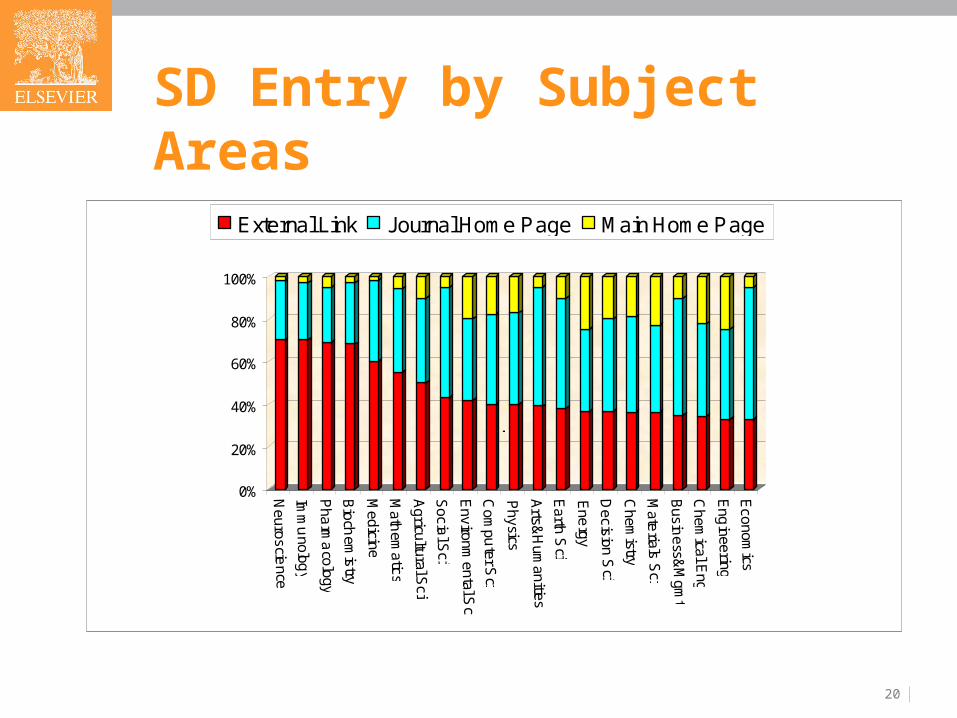
SD Entry by Subject Areas
0%
20%
40%
60%
80%
100%
Neuroscie
nceIm
mu
nology
Pha
rma
cologyB
iochem
istry
Medicine
Math
ematics
Agricultural S
ciS
ocial S
ci
Environm
ental Sci
Com
puter S
ci
Physics
Arts&
Hum
anitiesE
arth Sci
Ene
rgy
Decision S
ci
Chem
istry
Mate
rials Sci
Busin
ess&M
gmt
Chem
ical Eng
Eng
ineeringE
conomics
External Link Journal Home Page Main Home Page
j
21
Some Analysis on Subject Entry
Life Science end users prefer to come into ScienceDirect from 3rd party sources, namely the A&I databases
Humanities and Social Scientists prefer the Journal Home Page on ScienceDirect
For some areas there appears no difference: Energy, Chemical Engineering, Mat Sciences and Engineering.

22
2. Usage of Usage Reports
Internal Elsevier Study of use of ScienceDirect usage reports
Who uses usage reports? Asia/Pacific Librarians lead the list
What triggers use of these reports Email Alerts Asia/Pacific has the most alerts set up 63% customers use the reports when they have
an alert as opposed to 30% without the alert.

23
Effect of Alerts
Percentage of active accounts and percentage of accounts with alerts
0%
10%
20%
30%
40%
50%
60%
70%
80%
90%
% of accountsusing the reports
% accounts withalerts using the
reports
% accounts w/oalerts using the
reports
% accounts withalerts
APAC
Americas
EMEA
Total
24
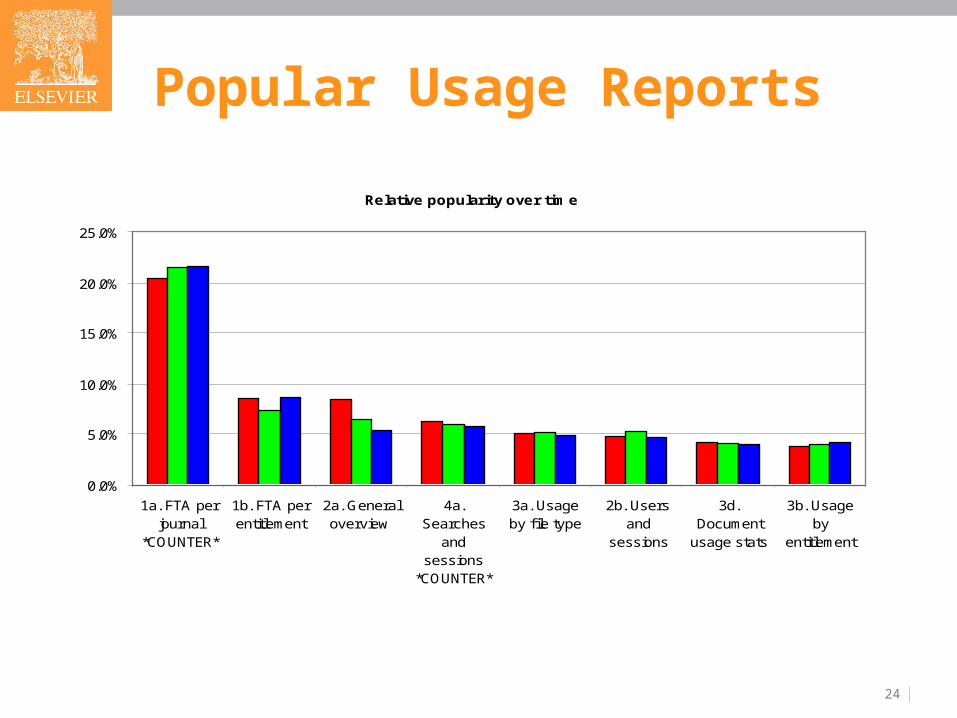
Popular Usage Reports
Relative popularity over time
0.0%
5.0%
10.0%
15.0%
20.0%
25.0%
1a. FTA perjournal
*COUNTER*
1b. FTA perentitlement
2a. Generaloverview
4a.Searches
andsessions
*COUNTER*
3a. Usageby file type
2b. Usersand
sessions
3d.Document
usage stats
3b. Usageby
entitlement

25
Number of Reports over time
0.0
2.0
4.0
6.0
8.0
10.0
12.0
14.0
16.0F
eb
-03
Ma
r-0
3
Ap
r-0
3M
ay-
03
Jun
-03
Jul-
03
Au
g-0
3
Se
p-0
3O
ct-0
3N
ov-
03
De
c-0
3Ja
n-0
4
Fe
b-0
4M
ar-
04
Ap
r-0
4M
ay-
04
Jun
-04
Jul-
04
Au
g-0
4S
ep
-04
Oct
-04
No
v-0
4
De
c-0
4Ja
n-0
5
0
200
400
600
800
1000
1200
1400
1600
reports per id
active ids
26
Usage Reports: did we over build?
ScienceDirect data may indicate such. But the data may be useful some day and
probably best to keep it at hand for now. Are there more functional reports that
should be developed, e.g. factor in cost of content for performance measure?

27
To really end this presentation- We still do not know enough about user
behavior and how that affects the numbers. We do know that the users are disparate
and have different usage patterns in their respective subjects.
Open question: what are meaningful numbers and in what context. Answer may be a local solution.
Publishers don’t have all the answers either.