what determines productivity? - oecd.org session 2 - syverson... · 100017 xxxp41 en99999994 ac...
TRANSCRIPT

What Determines Productivity?
Chad Syverson
University of Chicago Booth School of Business
and NBER
Presentation at OECD
November 5, 2012
An Explosion of Data
The past 20 years have seen a massive infusion of
detailed data on firms’ production activities
Statistical agencies’ microdata
E.g., U.S. Economic Census
U.K., Denmark, France, Colombia, Chile, Turkey,
Ghana, China, India, Indonesia…
Firms’ own data distributed via agreement
A Key Focus: Productivity
Much of the research using this data has focused on
businesses’ productivity
Productivity: How much output (physical units, quality
adjusted units, or dollars) a producer obtains from each
unit of inputs
Efficiency in production
ProductivityOutput
Inputs
Productivity Dispersion is Everywhere
There are very large productivity differences across
producers, even within narrowly defined industries
Researchers (including me) have found this in every
country, industry, and time period they’ve looked
Productivity Dispersion is Everywhere
What does “narrowly defined” mean?
Saw blade manufacturing
White pan bread bakeries
Ready-mixed concrete
Bookstores
Manufactured ice
Productivity Dispersion is Everywhere
What do “large productivity differences” mean?
Typical 90-10 percentile total factor productivity ratio
within 4-digit industries in U.S. mfg. is 2-to-1 or higher
What this implies:
Line up industry producers from least to most productive;
the 90th percentile producer obtains twice as much output
from the same measured inputs (capital, labor, energy,
materials) as the 10th percentile producer
China: 3-to-1 ratio India: 5-to-1

Productivity Is Persistent
High-productivity businesses this year are likely to be next year as well
Even after 5 years, 1/3 of businesses in top 20 percent are still there
Those that aren’t are more likely to be in second 20 percent than anywhere else
Etc.
Low-productivity businesses are likely to stay that way, too…unless they shut down (which they do, a lot)
Productivity Is Literally a Matter of Survival for Businesses
Higher productivity is tied to “good news” about business prospects
More likely to survive
Lowest 20 percent of manufacturers 2.5X more likely to go out of business within five years than those in highest 20 percent
Faster future growth
Productivity is good for workers (higher wages) and consumers (lower prices) too
Examples of Productivity Research across Fields
Macro
Dissect aggregate productivity growth
Build models of productivity-driven fluctuations
Test models of growth, convergence, and technology spillovers
Industrial Organization
Effects of competition
Size of sunk entry costs
Role of organizational structure
Examples of Productivity Research across Fields
Development
Effects of shifts from informal to formal sector
Entrepreneurship decisions
Input cost shocks in crises
Labor
Role of human capital in productivity growth
Effects of incentive pay and other HR practices
Test models of social interactions among workers

Examples of Productivity Research across Fields
Finance
Effects of mergers and acquisitions
Span-of-control issues (e.g., diversification discount)
Trade
Heterogeneous-productivity frameworks have
become dominant paradigm
Productivity effects of openness
Measurement of Productivity
Typical measure is total factor productivity (TFP)
Standard treatment of TFP as shifter of PF
E.g., Cobb-Douglas PF:
Remember: TFP is, at its heart, a residual—sort of
a measure of our ignorance. The literature is
trying to put faces on that residual

Measurement of Productivity
Standard ways to measure productivity
1. Index number (a la Solow residual)
2. Residual of production function estimation
Every method requires assumptions; some are more
comfortable in certain settings
Fortunately, productivity patterns usually quite robust
to particulars of measurement
So What Determines Productivity?
Two broad sets of factors:
1. Things that, at least in concept, are within a
businesses’ control—“levers”
2. Aspects of the operating environment—“external
factors”

“Levers”
1. Managerial practices/talent
2. Higher-quality labor and capital
3. IT and R&D
4. Learning-by-doing
5. Product innovation
6. Firm structure decisions
Managerial Practices/Talent
Until recently, as a source of productivity
differences, management held highest ratio of
speculation to actual evidence
Recent efforts to collect broad and consistent data
on management practices
E.g., World Management Survey—detailed
discussions with plant managers from around the
world, codified into management practice scores

Management Scores across Countries
•Source: World Management Survey website (www.worldmanagementsurvey.org) , 10 Dec 2010.
Management Scores across Firms
•Source: World Management Survey website (www.worldmanagementsurvey.org) , 10 Dec 2010.
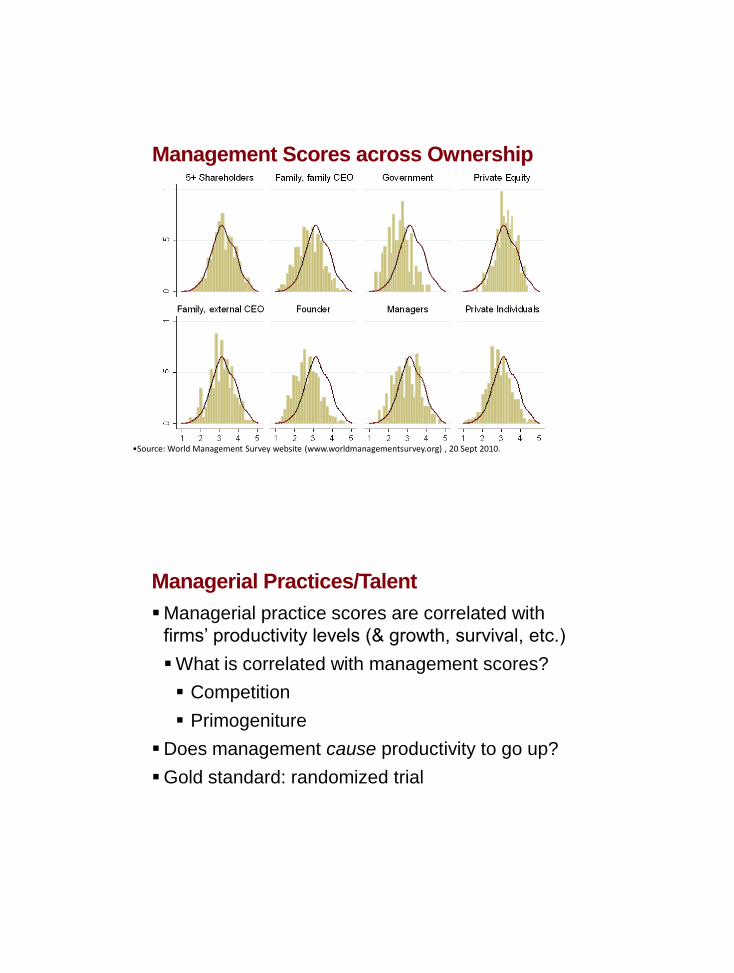
Management Scores across Ownership
•Source: World Management Survey website (www.worldmanagementsurvey.org) , 20 Sept 2010.
Managerial Practices/Talent
Managerial practice scores are correlated with
firms’ productivity levels (& growth, survival, etc.)
What is correlated with management scores?
Competition
Primogeniture
Does management cause productivity to go up?
Gold standard: randomized trial

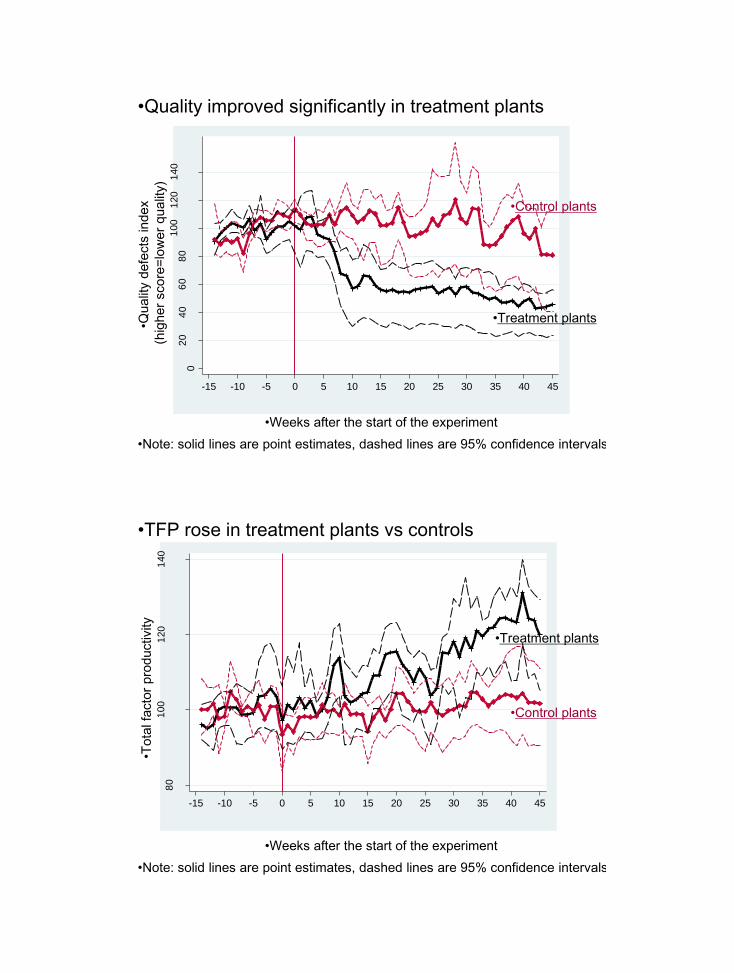
Management Practices in Indian Textiles
Experiment run on 20 cotton fabric plants (average 300 employees and $7m sales) in Mumbai
Randomized “treatment” group plants—5 months of management consulting intervention
Control group—received 1 month (need to set up data collection)
Consulting offered on 38 specific practices tied to factory operations, quality and inventory control
Collect weekly data on all plants from 2008 to 2010
Months after the diagnostic phase
.2
.3
.4
.5
.6
-10
-8
-6
-4
-2
0
2
4
6
8
10
12
Treatment plants
Control plants
Share
of
38 p
ractices a
dopte
d
Non-experimental plants
in treatment firms
Months after the start of the diagnostic phase
Adoption of 38 Mgmt. Practices
02
04
06
08
01
00
120
140
-15 -10 -5 0 5 10 15 20 25 30 35 40 45
•Quality improved significantly in treatment plants
•Control plants
•Treatment plants
•Weeks after the start of the experiment
•Qualit
y d
efe
cts
index
(hig
her
score
=lo
wer
qualit
y)
•Note: solid lines are point estimates, dashed lines are 95% confidence intervals
80
100
120
140
-15 -10 -5 0 5 10 15 20 25 30 35 40 45
•TFP rose in treatment plants vs controls
•Control plants
•Treatment plants
•Weeks after the start of the experiment
•Tota
l fa
cto
r pro
ductivity
•Note: solid lines are point estimates, dashed lines are 95% confidence intervals

Management Practices in Indian Textiles
All totaled, the average plant should save about $200-300K per year due to the changes
This includes ongoing costs of data collection and monitoring
Learning-by-Doing
Learning-by-doing (LBD): the efficiency gains
achieved via the very act of producing
Study the mechanisms behind LBD in an auto
assembly plant during a production year
About 200,000 cars
See each of the several hundred processes
Know when defects happen

Raw Factory Information System Data
Vin Model Dcode Descr Dept Zone Teamop Day Month Hr Min Defect
100017 XXXP41 VS--QBUY01 QBUY-VIN SCRIBE REQUIRED 9150 T5 VS01 18 4 10 9 0
100017 XXXP41 BS99999968 AC LINE TO SHOCK TOWER LOOSE 9150 T5 T4M4 18 4 10 45 1
100017 XXXP41 EN99998139 AC LINE SHY 9150 T5 T4M4 18 4 10 45 1
100017 XXXP41 EN99999994 AC LINE NOT SEATED TO BLOCK 9150 T5 T4M4 18 4 10 45 1
100017 XXXP41 QVST9QVL12 LT A-POST PLUG-SHY (L10) @YEL 9150 TQV1 18 4 11 31 1
100017 XXXP41 CPTS-F0-T1 CPTS-FUEL TANK ASSY TRACE @SCANT1 F0 ATT1BUG,BRR 9170 C3 C317 18 4 11 48 0
100017 XXXP41 TE99998983 HEATER HOSE TO FIREWALL N/C 9170 C3 C323 18 4 11 52 1
100017 XXXP41 STJ8RESULT ROLL MOUNT/MASS DAMPER SECURE 9170 C1 STJ8 18 4 11 59 0
100017 XXXP41 STJ8QBUY01 QBUY-ROLL MOUNT/MASS DAMPER BOLT #1 TORQ 9170 C1 STJ8 18 4 11 59 0
100017 XXXP41 STJ8QBUY02 QBUY-ROLL MOUNT/MASS DAMPER BOLT #2 TORQ 9170 C1 STJ8 18 4 11 59 0
100017 XXXP41 SCANQBUY03 SCAN-SCAN FRONT SUSPENSION VIN @RED@BN 9170 C1 C134 18 4 12 3 0
100017 XXXP41 CPTS-21-P2 CPTS - ROLL MOUNT PART# REQUIRED 9170 C1 C135 18 4 12 3 0
Overall LBD Patterns
010
20
30
40
50
60
70
80
90
Ave
rage D
efe
cts
per
Car
W34/Y1 W42/Y1 W50/Y1 W6/Y2 W14/Y2 W22/Y2 W30/Y2
Production Week/Year

Starting a New Shift
010
20
30
40
50
60
70
80
90
Ave
rage D
efe
cts
per
Car
W34/Y1 W42/Y1 W50/Y1 W6/Y2 W14/Y2 W22/Y2 W30/Y2
Production Week/Year
Shift 1 Shift 2
Starting a New Model
010
20
30
40
50
60
70
80
90
Ave
rage D
efe
cts
per
Car
W34/Y1 W42/Y1 W50/Y1 W6/Y2 W14/Y2 W22/Y2 W30/Y2
Production Week/Year
Model 1 Model 2
Model 3
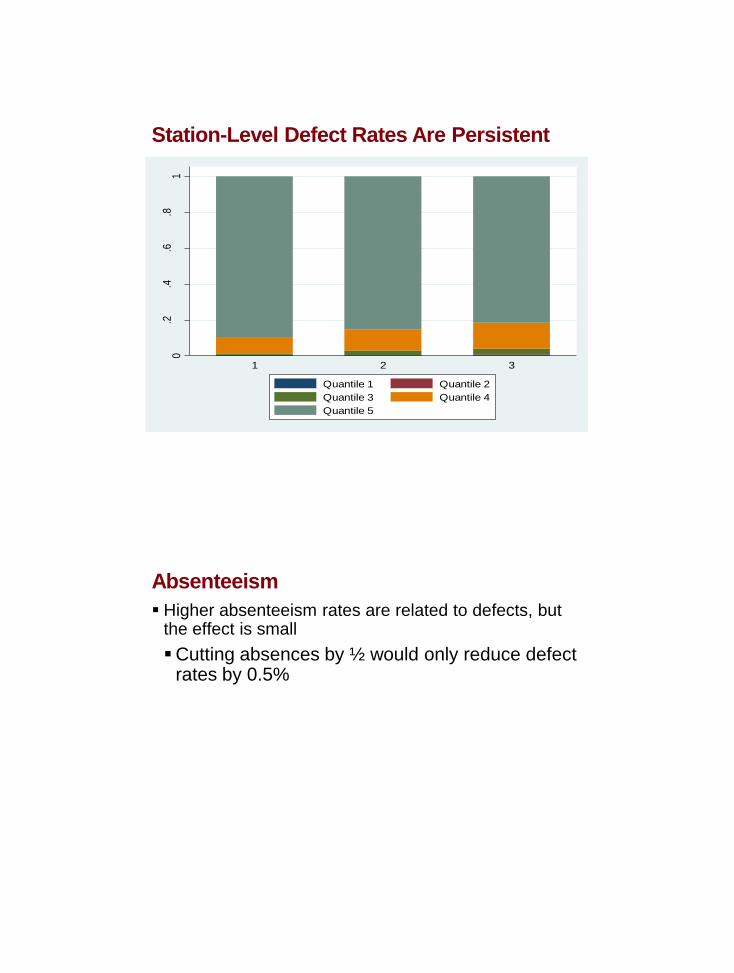
Station-Level Defect Rates Are Persistent
0.2
.4.6
.81
Fra
ctio
n of
Tot
al D
efec
ts
1 2 3
Quantile 1 Quantile 2
Quantile 3 Quantile 4
Quantile 5
Absenteeism
Higher absenteeism rates are related to defects, but the effect is small
Cutting absences by ½ would only reduce defect rates by 0.5%

Warranty Payments
Each defect tied to an average warranty cost of 42¢ over the first 9 months of car’s life
Applied to 70 defect-per-car drop in average defect rates over production year: ~$28 per car savings
Applied to the 200K cars: $5.5 million in warranty claims savings
Clearly lower bound: only early warranty claims, doesn’t measure effect on consumers’ willingness to pay for quality
Bottom Line on Mechanism
No relearning with new shift
Absences have small effects
Station-level defect rates are correlated across shifts
LBD is embodied in physical or organizational capital rather than individual workers

Firm Structure
Plants in vertically structured firms have higher productivity than those in other firm structures (single-industry horizontal, conglomerate)
This is also true if we just compare new plants
Plants that will become part of vertically structured firms already have higher productivity than their peers
So does vertical integration lead to higher productivity?
Firm Size Distributions by Firm Structure
Single-industry horizontal
Conglomerate
Vertically integrated

Firm Structure
If we compare productivity levels of plants in vertically integrated firms to those in firms that have a different structure but are the same size, most of the productivity gap disappears
Good firms get big and have good plants
Sometimes, they get big vertically, but that may be incidental to their productivity
External Factors
1. Productivity spillovers
2. Competition—both intra-market and through trade
3. Regulatory environment
4. Input market flexibility

Competition and Productivity
Even monopolist minimizes costs, so why does competition matter to productivity?
Minimizing costs may not be—probably isn’t—free
Ever-changing market conditions mean best-practice
efficiency is a moving target
Lack of competition dulls incentive to keep up with
target
Competition shifts activity away from less productive
firms and toward more productive ones
Competition and Productivity: Two Mechanisms
Competition can drive productivity improvements through a combination of two mechanisms
Existing businesses spurred to be more efficient
“Selection” / Darwinian survival: inefficient shrink or go out of business, efficient enter and grow
Both mechanisms matter, but their relative importance varies across industries
Manufacturing: 50-60% of productivity growth among existing producers
Retail: Almost all growth through selection

Competition and Productivity: Ready-Mixed Concrete
Concrete is concrete, so what limits competition?
Transport costs
Markets where producers are located close together offer more options for customers
It’s harder to be inefficient and survive in such mkts
Competitiveness determined by construction density
Market A Market B
Competition and Productivity: Concrete

Competition and Productivity: U.S. Iron Ore
0
5
10
15
20
25
30
35
40
45
1970
1972
1974
1976
1978
1980
1982
1984
1986
1988
1990
1992
1994
1996
1998
2000
2002
2004
Pri
ce p
er
To
n (
$)
0
1
2
3
4
5
6
7
To
ns p
er
Wo
rke
r-H
our
Brazil Price US Price US Tons/Hour
Productivity doubles
in 5 years No productivity
change in 12 years
Competition and Productivity: U.S. Iron Ore
•Repair hours drop from
50% to 25% of total hours

Regulation and Productivity
Regulatory policies may impose barriers to efficiency
or affect incentives to change productivity
But—The Porter Hypothesis: regulation can force a
reckoning that leads to new efficiencies
Study of U.S. Clean Air Act Amendments
About 5% total TFP drop of polluting plants in
nonattaining counties
$21 billion per year in lost manufacturing output
But there are benefits, too
Regulation and Productivity: U.S. Sugar Act
Sugar Act—New Deal program lasted 1934-74
Gave subsidies to farmers based on “sugar-in-beet”
Paid for subsidies by taxing sugar companies on
refined sugar
Let sugar companies collude in exchange

Regulation and Productivity: U.S. Sugar Act
Incentives
Farmers: maximize “sugar-in-the-beet”
Grow giant, but low quality, beets
Little sugar per pound of beet, hard to refine
Sugar companies: because of collusive agreements,
little incentive to get much sugar out of raw stock
Expected outcome—low refining productivity (little
sugar per ton of beets)
Regulation and Productivity: U.S. Sugar Act Refined Sugar Recovered per Ton of Raw Beets
Sugar Act
Begins
Sugar Act
Ends

Productivity and Market Flexibility
Productivity growth through Darwinian selection relies
on the ability to reallocate resources to higher-
productivity producers
Product market flexibility (i.e., competition)—
consumers can easily switch suppliers
Labor mkt. flexibility—workers can move to more
efficient operations
Capital mkt. flexibility—capital flows to efficiency
Summary measure of reallocation at work is
correlation between productivity and market share
Productivity and Market Flexibility
0
0.1
0.2
0.3
0.4
0.5
0.6
Ger
man
yUK
Argen
tina
Net
herla
nds
Franc
e
Portu
gal
Chi
le US
Taiwan
Korea
Correlation between Productivity and Market Share

Productivity and Market Flexibility
Correlation between Productivity and Market Share
What Determines Firm Performance: Open Questions
What is the importance of demand?
What is the role of (or hope for) government policies
that encourage productivity growth?
Which productivity drivers matter most?
What factors determine whether selection or within-
producer growth is more important in a
market/sector/industry?

What Determines Firm Performance: Open Questions
What is the role of misallocation as a source of
variation in emerging economies?
What is the importance of higher variance in
productivity outcomes?
Can we predict innovation based on market
conditions?
What is the nature of intangible capital?
Is it management or managers?
Finally—A Plea for Data
Virtually everything discussed we now know because
detailed data on production practices was available
Most of this data was originally collected by statistical
agencies for the purpose of constructing aggregates
Their insights into productivity is in many ways a
happy externality
Now that we know the value of such data, let’s make
more directed efforts to measure business-level
production practices

Finally—A Plea for Data
Examples of new data
Management practices (MOBS in ASM)
Micro-level prices
Input quality measures
Proxies for intangible capital
Non-R&D innovation spending
Collecting such data is costly and will involve tradeoffs
for statistical agencies or a willingness of researchers
to pay private companies for the collection efforts
Yet it’s clear there is much to gain