what determines ipo underpricing ? evidence from a ... · the approval process is lengthy. listing...
TRANSCRIPT

Munich Personal RePEc Archive
What determines IPO underpricing ?
Evidence from a frontier market
Boudriga, Abdelkader and Ben Slama, Sarra and Boulila,
Neila
University of Tunis, ESSEC Tunis, DEFI
2009
Online at https://mpra.ub.uni-muenchen.de/18069/
MPRA Paper No. 18069, posted 14 Nov 2009 12:52 UTC

1
���
�������������� �����������������
�����������������������������
�
Sarra BEN SLAMA ZOUARI Abdelkader BOUDRIGA
Neila BOULILA TAKTAK �
�������������
��� ���������
!"#$ %#�
This paper empirically analyzes the short run performance of Tunisian initial public offerings (IPO).
It sheds light on the determinants of IPO’s in a context of a frontier market characterized by high
information asymmetry, low information efficiency, thin trading and the presence of “noise” traders.
Using a sample of 34 Tunisian IPO’s from the period 199262008, we find that the average market
adjusted initial return for the first three trading days is about 17.8 percent. The level of underpricing
is related to retained capital, underwriter’s price support, oversubscription, listing delay and the offer
price. Age of the firm, its size and the size of the offer do not seem to reduce the amount of money
left on the table by issuers. It appears also that underpricing is driven by irrational investors (ipoers)
seeking for short6run capital gains. These results remain unchanged after controlling for the presence
of institutional investors and the existence of liquidity contract.
&�'��$�"�
Initial public offerings; Short6run underpricing; Underwriter’s price support.
(�)�%*����������+�,-.�/�,0��

2
-1 2#$��3%# �2�
Several empirical studies documented the existence of the initial underpricing phenomenon for newly
listed firms during the early days of trading across many countries and capital markets. Early studies
examined the performance of IPOs on the US market. Ibbotson (1975) find an average abnormal
return of 11.4. Loughran and Ritter (1995) based on their survey of papers on the IPO underpricing
report average initial returns of 10.0 per cent. More recently, Purnanandam and Swaminathan (2004)
find returns ranging from 14.0 to 50.0 per cent depending on the matching criteria used. At the
international level, most researchers have found mixed results compared to American findings. On
the German market, Ljungqvist (1997) using a sample of 189 firms over the period 197061993 find
an initial underpricing of about 10.9 per cent. In France, Jacquillat and MacDonald (1974) and
Dubois (1987) report an initial underpricing respectively about 4.2 per cent and 19.0 per cent.
In the context of emerging markets, several studies highlighted that Chinese IPO’s enjoy the world’s
highest initial returns. Among others, Mok and Hui (1998), Tian (2003) Chan et al. (2004) and Larry
et al. (2008) report underpricing ranging between 1006300 per cent. These levels are much higher
than the average level of 60 per cent in other emerging markets (Jenkinson and Ljungqvist, 2001).
For example, Yong and Isa (2003) report an average initial yield of 80.3 per cent for Malaysian IPOs
over the period 198061991. More recently, Agarwal et al. (2008) find average initial returns of 20.8
per cent for Hong Kong IPO’s. Finally, Kiymaz (2000) documents an average 13.6 per cent
underpricing over the period 199061995 for a sample of Turkish IPO’s.
This paper extends the international literature on IPO’s by examining the IPO’s on the Tunis Stock
Exchange (TSE), a frontier market characterized by high information asymmetry, low information
efficiency, thin trading and the presence of “noise” traders. This study thus sheds light on the
determinants of IPO’s in an insufficiently investigated context. In fact, a limited number of studies
have examined IPO’s underpricing on the context of frontier market. Particularly, on the TSE most

3
of the conducted studies have highlighted the phenomenon without explaining it. For instance, Ben
Naceur and Ghanem (2001) find an average underpricing of 27.8 per cent for issues conducted over
the period between 1990 and 1999. Gana and Ammari (2008) studied the incidence of shares
transfers by the original shareholders on the degree of the initial underpricing. Using a sample of
Tunisian candidates companies over the 199262006 period, they find an initial underpricing of about
19.2 per cent, which mainly depends on the original and controlling shareholders.
In this paper, we examine the main determinants of initial IPO’s performance based on a sample of
34 IPO’s listed on the Tunisian Stock Exchange (TSE) over the period 199262008. We find an
average initial return of about 16.0, 16.8 and 17.8 per cent respectively for the first, second and third
day of trading. The level of underpricing is related to retained capital, underwriter’s price support,
oversubscription, listing delay and the offer price. Age of the firm, its size and the size of the offer
do not seem to reduce the amount of money left on the table by issuers. The results of the regression
remain unchanged after controlling for the presence of institutional investors and the existence of
liquidity contract.
The remainder of this paper is organized as follows. Section 2 provides a brief description of
Tunisian equity market. Evidence on short run underpricing is presented in the section 3. Section 4
investigates the determinants related to the level of short term underpricing and discusses the results
of the analysis. The final section presents the conclusion.
�
�1 #4�� ���5 $&�#� 2�#32 " �
The Tunis Stock Exchange (TSE) was established in 1969. During the first three decades, the Tunis
stock market has not played a significant role in funding private growing companies. Since then,
several reforms were undertaken mainly during the 1990s aimed at developing the market financing
of the economy.

4
As in most emerging markets, the TSE had imposed ceilings since 1994. The purpose of this
regulation is to protect the stock market and the investors from market irregularities and from
speculative attacks that might be caused by the vulnerable environment of this emerging market. The
regulation was first applied to all the stocks from their first day of trading. The listed stock prices can
fluctuate between ± 5.0 per cent1. When a stock price reaches the ceiling of ± 5.0 per cent, the stock
price is fixed until the demand and the stock price falls below +5.0 per cent or the supply and the
stock price rises above 65.0 per cent at the same day. However, we have noted varying levels of the
margins of fluctuations in the TSE across the years, particularly for the first days of trading. Ceiling
was sometimes removed during the first three days of new firm listing. In other circumstances, the
ceilings were increased to ± 18.0 per cent for the three first days of trading. These changes aimed at
allowing the market to freely evaluate the price of the newly introduced shares; especially it may
impact the underpricing for the first day.
To be listed in the main market, the company must free float at least 10 per cent of its outstanding
share capital to the public2 with a minimum of 200 shareholders3. The listed firm must have at least
two years of profit and at least one dividend paid.
The approval process is lengthy. Listing of already existing firms (ordinary procedure), or new public
issues (offers for sale and beading procedure) are the three recognised methods for IPO’s in Tunisia.
An application is submitted for approval to the Tunisian Financial Market Council (FMC) after a
firm and its underwriter has agreed on the price of the issue. The FMC evaluates the company,
examines its forecast profits and the quality of its internal controls and its information disclosure.
Once the FMC have approved the application, a prospectus is filled by the issuer, the underwriter
and an independent auditor. The prospectus must include detailed historical financial accounting
1 ± 3% for the less liquid shares.
2 Individual investors with a maximum participation of 0.5% and institutional investor having less than 5% of the
capital. 3 Before 2005, the free float was set to a minimum of 20% and the number of public shareholders to 500.

5
information about the firm, along with details on the company's operating history, management
team, prospects, risks, uses to which the new issue monies will be applied, its controlling
shareholders and its subsidiaries. The final share issue price is set by the underwriter (pricer) and is
announced to the public.
The mechanism for allocating IPO shares in Tunisia is done through a quotas procedure. Issuing
firms and underwriters distribute shares randomly and equally across application orders collected in
the subscription period. However, in recent years shares are often classified into different categories:
institutional investors, foreign investors, and local subscribers. Each category is allocated a pre6
specified percentage of the issued shares in order to ensure a better diffusion of the shares amongst
various categories of shareholders and hence to reduce underpricing and speculation.
Table 1 exhibits the number of listed companies and market capitalisation in Tunisia from 1990 to
2008. The number of listed firms increased from 13 firms (mostly from the financial sector) in 1990
to 52 firms in 2008. Following the privatization program initiated by the Tunisian government during
the 1990s going public was used also as a process of privatization for the state owned enterprises.
#�6*��-��2�6������*������������+�-�������7�
1990 1995 1999 2002 2003 2004 2005 2006 2007 2008
Number of listed companies 13 26 44 46 45 44 45 48 51 52
Capitalisation in million dinars4 448 3967 3326 2842 2976 3085 3840 5491 6527 6063
Source: TSE and BVMT annual reports
The number of IPO’s varied sharply across the period 199262008 (figure 1). The year 1999 recorded
the highest number of listings, with 6 newly public offerings. This is mainly due to the privatization
of four state owned companies following the commitment of the Tunisian government move toward
4 Over the period 1990-2006, the Tunisian Dinar (TND) has ranged from 1 USD to 0.8 USD.

6
a market6based economy. The lowest figures are exhibited by the years 2000, 2003 and 2004 with no
IPO’s. For the year 2000, this may be due to the large number of IPO’s conducted in 1999. On the
other hand, it seems that due to unfavourable market conditions (crisis of confidence and of
liquidity) no new public offerings were recorded for the years 2003 and 2004.
������-: Number of listing by year (1992—2008)
0
1
2
3
4
5
6
7
1992 1993 1994 1995 1996 1997 1998 1999 2000 2001 2002 2003 2004 2005 2006 2007 2008
01 "4�$#�$32�32��$�$ % 2,�
��������������� � ���
The sample consists of 345 new listings of ordinary shares which are accompanied by the selling of
shares6, on the Tunisian stock exchange from the January 1992 to December 2008. Post6IPO
performance data (on the closing prices and the market Index) are obtained form the TSE online
database (www.bvmt.com.tn). Only Batam, a retail company, was de6listed due to bankruptcy in
2002. This does not alter our analysis given that the company was first listed in 1997, five years
before delisting.
5 We considered only the IPO motivated by opening capital decision
6 IPO’s with no selling of shares are excluded (ordinary procedure).

7
Consistent with previous studies (Aggarwal et al., 1993; Chi and Padget, 2005), we use the following
methodology to measure the underpricing of IPO’s. The return of stock �� at the end of the first
trading day is calculated as:
10
11 −=
i
ii S
PR
(1)
where ��1 is the closing price of the stock � on the first trading day, and ��0 is the subscription price
and ��0 is the raw first6day return on the stock.
As the issue price of the share� � is fixed at the prospectus date, the return between the price at the
end of the first day's trading and the issue price will depend, in part, on changes in market conditions
facing companies.
To account for the impact of the substantial delay between pricing and listing, underpricing is
measured as the market6adjusted abnormal return for each IPO on the first trading day and it is
computed as:
111 mim RRMAR −= (2)
The return on the market index at the same time period is:
10
11 −=
m
mm P
PR
(3)
where �1 is the closing market index value on first trading day, �0 is the closing market index value
on the last day of subscription period of the IPO, and �0 is the first day’s comparable market return.
In this study, we use the BVMT index (the market capitalisation weighted index for the TSE) as a
proxy for the market index.
As expressed in (2), the market adjusted abnormal return 1mMAR supposes that the systematic risk of
the IPO’s is equal to one. A number of studies (Ibbotson, 1975; Spiess and Affleck6Graves, 1995)
demonstrate that the average beta of newly listed firms is higher than the systematic risk of the

8
market portfolio. Thus, this measure of the abnormal return provides a somehow upwardly biased
estimate on the initial performance of the IPO relative to the market.
To account for the ceiling imposed on trading at the TSE, several short6run returns are computed in
order to capture the effective underpricing mtMAR (t=1, 2, 3) in an analogous manner to 1mMAR ���
As noted by Ljungqvist et al. (2006), it seems appropriate to measure the underpricing over a longer
window in less developed markets where aftermarket prices may take more to reach equilibrium.
������������� ���� �������������������
We now proceed to apply the methodology outlined above to estimates the return of the IPO in our
sample. Table 2 reports summary descriptive statistics of underpricing for the 34 IPO’s conducted
during the period 199262008. The degree of underpricing in the sample ranges from 64.4 per cent to
65.0 per cent. The average initial return amounted 16.0 per cent, 16.8 per cent and 17.8 per cent
respectively for the first, second and third trading day. This underpricing is significantly different
from zero at the 1 per cent level, for all cases. The percentiles exhibit the same patterns for MAR1,
MAR2 and MAR3, confirming the underpricing. On the other hand, the median in all cases is lower
than the mean, which indicates that the series of initial returns are skewed to the right.
Our results are very close to those obtained by Gana and Ammari (2008), who reported initial
underpricing of about 19.2 per cent for the sample of IPO’s listed from 1992 to 2006. Yet, these
results contrast somewhat with those found by earlier studies examining short run underpricing of
IPO’s of the TSE. For instance, Ben Naceur and Ghanem (2001) reported a short run underpricing
of 27.8 per cent over a longer period from 1990 to 1999.
7 We calculate also the underpricing for the days four to 10 after listing. We note that beyond the 3rd day of listing,
underpricing remains relatively flat and stable. Hence, in the remaining of this work, we limit the analysis to the first
three days after listing.

9
#�6*����������������������������5 $��������-��/���������0����8��9-�������7: 5�� 5�;� 5���� 5����� "��
MAR 1 60.044 0.640 0.160 0.108 0.172
MAR 2 60.048 0.607 0.168 0.110 0.168
MAR 3 60.033 0.650 0.178 0.113 0.181
� � � � � �
�������*��� -�<� �=<� =�<� >=<� ��<�
MAR 1 0.0024 0.0296 0.1087 0.2484 0.3909
MAR 2 0.0024 0.0297 0.1087 0.2484 0.3909
MAR 3 0.0048 0.0439 0.1137 0.2819 0.5012
����������������������"�����+��������?���*��*�����
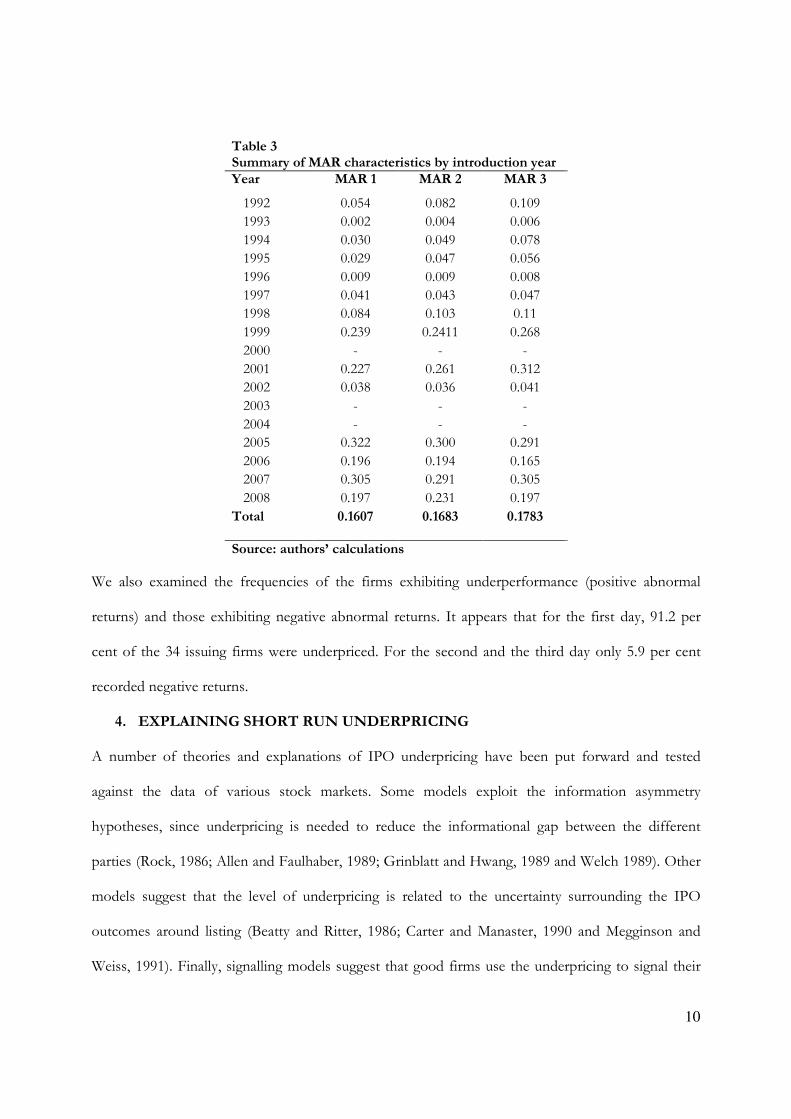
Table 3 reports the mean short6run underpricing (MAR) respectively of the first, second and third
day for each year. The highest underpricing is exhibited by the IPO’s of the year 2005 (32.2 per cent).
The lowest figure is recorded in 1993 (0.2 per cent).
The analysis of these results suggests the existence of two sub6periods. The first sub6period includes
the period 199261998 and the year 2002 with low levels of underpricing. For 199261998 period, this
weak underpricing can be attributed to the fact that the stock market was not well developed and
known by the public. For 2002, the poor short6term performance of IPO’s can be explained by the
impact of the year 2001 (due especially to geopolitical tensions). The second sub6period includes the
years 1999, 2001 and the period 200562008. This high level of performance during these years may
be explained by the outstanding performance of the Tunisian economy and by the growing interest
of international investors to the TSE since 2005.
10
#�6*��0��"���8����5 $���������������68������������8����
'���� 5 $�-� 5 $��� 5 $�0�
1992 0.054 0.082 0.109
1993 0.002 0.004 0.006
1994 0.030 0.049 0.078
1995 0.029 0.047 0.056
1996 0.009 0.009 0.008
1997 0.041 0.043 0.047
1998 0.084 0.103 0.11
1999 0.239 0.2411 0.268
2000 6 6 6
2001 0.227 0.261 0.312
2002 0.038 0.036 0.041
2003 6 6 6
2004 6 6 6
2005 0.322 0.300 0.291
2006 0.196 0.194 0.165
2007 0.305 0.291 0.305
2008 0.197 0.231 0.197
#���*� �1-@�>� �1-@70� �1->70�
"�����+��������?���*��*�����
We also examined the frequencies of the firms exhibiting underperformance (positive abnormal
returns) and those exhibiting negative abnormal returns. It appears that for the first day, 91.2 per
cent of the 34 issuing firms were underpriced. For the second and the third day only 5.9 per cent
recorded negative returns.
.1 �A�) 2 2,�"4�$#�$32�32��$�$ % 2,�
A number of theories and explanations of IPO underpricing have been put forward and tested
against the data of various stock markets. Some models exploit the information asymmetry
hypotheses, since underpricing is needed to reduce the informational gap between the different
parties (Rock, 1986; Allen and Faulhaber, 1989; Grinblatt and Hwang, 1989 and Welch 1989). Other
models suggest that the level of underpricing is related to the uncertainty surrounding the IPO
outcomes around listing (Beatty and Ritter, 1986; Carter and Manaster, 1990 and Megginson and
Weiss, 1991). Finally, signalling models suggest that good firms use the underpricing to signal their

11
quality in order to raise funds in the future with more favourable conditions through seasoned equity
offerings (Allen and Faulhaber, 1989; Grinblatt and Hwang, 1989 and Brennan and Franks, 1997).
However, no single theory can explain the initial performance of newly listed firms during the first
days of trading (Jenkinson and Ljungqvist, 2001; Ritter and Welch, 2002).
To examine the determinants of short6run underpricing in the TSE, we investigate various
explanations proposed by previous research. The variables examined include the retained capital,
underwriter price support, oversubscription rate, listing time, offer price, age of the issuing firm, size
of the issuing firms, and size of the issue. �
Data used are collected from two sources: the FMC and the TSE. We collect information’s on IPO
firm characteristics around the listing period and relating to the operation of introduction itself. All
these information’s are collected from hard copies of prospectus published by the issuers and
available at the FMC documentary service8 and from the ����������������� of the TSE.
�
����� ���������������� �������
����������������
The relation between the level of the retained capital insiders and the firm value has been highlighted
by many authors (Downes and Heinkel, 1982; Allen and Faulhaber, 1989). From an agency theory
point of view, a high level of retained capital serves to align the interest of firm owners (managers)
with those of new shareholders. This will lead to a higher value of the firm (Jensen and Meckling,
1976). Furthermore, firms with a diffuse capital structure observe more earning management than
more concentrated firms, which reduce the cash flows and consequently the firm value (Ritter, 1984).
On the other hand, the more the owners/executives are confident on the future perspectives of the
IPO firm the more they will retain a high proportion of capital. Thus, the level of retained capital by
8 Since 2005, electronic copies of IPO prospectus are available online cmf.org.tn.
12
existing owners will send a signal to the potential investors about the true value of the firm. This will
contribute to lower the underpricing as the company is able to set higher price for the offer
(Mroczkowski and Tanewski, 2004).�
However, high levels of retained capital may be associated with higher risks of cash flow minority
rights expropriation (Bozzolan and Ipino, 2007). In such circumstances, potential investors will only
buy the share when it is severely underpriced.
!���"���������������� ���
Early studies relate underwriter reputation to initial underperformance of IPO’s and document a
negative relationship (Logue, 1973; Beatty and Ritter, 1986; Johnson and Miller, 1988). This view is
also confirmed by more recent works (Booth and Chua, 1996; Johnson and Miller, 1988; Kim and
Ritter, 1999; Chang and al, 2008). This stems from the fact that prestigious underwriters will reduce
agency costs experienced by firms around IPO. On the other hand, firms with favourable
information tend to choose high quality underwriters to signal the quality of the new issue (Titman
and Trueman, 1986). Others attribute this negative relationship to the certification role played by
reputable underwriters. In fact, they contribute to reduce information asymmetry between owners
and potential investors.
However, underwriter’s reputation might be associated with high level of underpricing. In fact, they
are likely to care more about the perceived reputation amongst potential investors, which seek to
realize benefits and with whom underwriters may maintain ongoing relations (Spiess and Pettway;
1997). On the other hand, as noted by Loughran and Ritter (2002), reputable underwriters may be
forced to severely underprice due to the increasing of financial analyst coverage of IPO’s.
As noted by several authors, underwriters may be motivated to support share prices after the firm
going public, as they are concerned by their own reputation they will support IPO’s with low

13
performance (less than the average) after listing (Schultz and Zaman, 1994). Empirically, evidence of
price support is documented by Ruud (1993), Hanley (1993) and Schultz and Zaman (1994) on the
NYSE and by Xu and Wu (2002) on the Shangai Stock Exchange.
In this study, we don’t examine the impact of reputation due to the lack of information and to the
relative short experience of the majority of underwriters which prevented us from adequately assess
their prestige. However, in the TSE evidence of price support by underwriters are widely reported by
both professionals and investors. In order to account for the variable reputation, we constructed a
dummy variable taking the value of one if the underwriter is known to support its own IPO’s and 0
otherwise. To classify the underwriters, we surveyed 10 financial professionals and we asked them to
classify underwriters in two groups: price supporters and no price supporters. The classification led
to consider two underwriters as belonging to the first group.
�
�#����$������� �������
Theoretically, the demand for the IPO, proxied by the oversubscription ratio, is considered to
positively impact the level of underpripcing. Michaely and Shaw (1994) argue that the level of
underpricing depends on the information heterogeneity amongst investors. Based on the Rock’s
‘winner curse’ model (1986), they show that underpricing is more needed with the decrease of
information homogeneity. They assume that the level of heterogeneity increases with the demand for
the firm’s shares, as both informed and uninformed will bid in “good” IPO’s, whereas “bad issues”
attract only uninformed investors. Alternatively, Chowdhry and Sherman (1996) argue that
potentially highly underpriced IPO’s may attract more investors looking for high potential capital
gains. They explain that when price is disclosed before the end of biddings, it is likely that a
substantial information leakage take place, which leads to an increase in the demand for the firm’s
shares, particularly when investors realize that the offer price is low.

14
Empirically, several authors used the oversubscription rate to explain the magnitude of the first
listing day abnormal returns of IPO’s (Allen and Faulhaber, 1989; Chowdhry and Sherman, 1994;
Booth and Chua, 1996). Hanley (1993) find a positive relationship between the subscription ratio and
the magnitude of the initial performance on a sample of American IPO’s. Kandel et al. (1999) find
similar results on the Tel Aviv Stock Market. Agarwal et al. (2008) examine a sample of IPO’s on the
Hong Kong Stock Market and find a positive relationship on the short run but a negative association
on a longer horizon. They explain these results by investor’s overreaction on the short run.
�����������
According to Chowdhry and Sherman (1996), the listing delay affects the underpricing level. On one
hand, longer time of listing is associated with more uncertainty on the offer. On the other hand,
before listing, there are no share price signals and investors must be compensated for this high level
of illiquidity with share pricing discounts. When a firm takes too long to be listed, the market may
revise its expectations about the future value of the firm and hence impact the subsequent level of
underpricing. Mok and Hui (1998) and Su and Fleischer (1999) find a positive relationship between
the average initial returns of IPO’s and the listing time for the Shangai Stock Exchange. Megginson
and Tian (2006) find that one day’s delay of the flotation increases the initial returns by 0.4 percent in
China. They argue that this may be explained by the unusual long delays of listing in China (over 10
months).
However, the time lag of listing can be attributed to an unintended underpricing that is not wanted
by the issuer. This argument is first highlighted by Uddin (2008) who advocates that to the extent
that the listing delay is not known to the issuers, it seems hard to believe that they will intentionally
lower the offer price.

15
In the TSE, the delay between the closing of the offer and the listing is mainly due to the type of
offerings (direct registration, minimum price, firm price, open price) and to regulatory clearances and
controls. Referring to the specific case of the Tunis Stock Exchange, it is obvious that any relation
between listing delay and underpricing is more likely to be unintended, as there is no ex post
information about how long it will take an IPO to be listed. It appears also that, as the delay of listing
gets longer, investors are discouraged to trade actively in the market. This will reduce their
irrationality and hence the aftermarket performance of the IPO.
�����������
The initial price of an IPO offering may also indicate the extant of underpricing although its level
seems to have little economic significance (Fernando et al., 1999). Firms do not set the offer price in
an arbitrary way. In fact, when the aim of the IPO is to encourage the participation of the retail
investors, the issuers set a relatively low price to encourage potential small investors. This will
systematically lead to an excessive demand for the security and hence larger underpricing. Besides,
Daily et al. (2003) suggest that higher offer prices are associated with lower uncertainty regarding the
future performance of the firm.
Conversely, firms looking to attract institutional investors tend to set high offer prices. In fact,
institutional are known to avoid low price shares (Gompers and Metrick, 1998). The presence of
institutional might lead to higher underpricing as they need to be compensated for the valuable
information they provide to better marketing the IPO (Benveniste and Spindt, 1989). Furthermore,
Jain and Kini (1999) argue that a low offer price may indicate little demand, little value, or both and
hence are associated with lower short6term performance.
Empirical evidence provides mitigated results regarding the relation between the offer price and
underpricing. Ibbotson et al. (1988) find that firms offered with very low prices usually record high

16
levels of underpricing. They argue that low priced6offers exhibit higher risks and are subject to
speculative trading. Fernando et al. (1999) report a U6shaped association.
%��� ������������������
Age of the firm is hypothesized to have a negative impact on the level of underpricing following the
IPO. First, newly created firms, as opposed to old ones, exhibit higher ex6ante uncertainty. This is
due to the fact that less6seasoned firms are less likely to have been followed by financial analysts (and
so well assessed) as they do not have enough historical published financial data. Second, the
availability of information on firms operating for several years contributes to reduce the information
asymmetry around the IPO (Ritter, 1984 et 1991; Hensler et al., 1997). This uncertainty about the
future perspectives of the candidate company will be reflected in higher underpricing (Bilson et al.,
2003).
��&�� �������������������
The size of the firm is usually negatively associated to its risk. Larger firms have better access to
investment capital, have more diversified products lines, are well monitored and have better access to
resources crucial for firm profitability and survival (Finkle, 1998). These factors contribute to
reducing the uncertainty around the IPO of large firms for potential investors (Kiymaz, 2000; Bhabra
and Pettway, 2003). However, the inverse relation between risk and firm size is robustly supported in
many studies (Titman and Wessels, 1988; Schultz, 1993). Empirically, several studies have reported a
negative link between firm size and short run underpricing (Ibbotson et al., 1994 ; Carter et al.,
1998).
��&�� ������������

17
The size of the IPO offer measured by the total gross proceeds raised from the market is supposed
to be negatively related to the underpricing level. According to Miller and Reilly (1987), Clarkson and
Simunic (1994), the size of the offerings indicates the uncertainty about IPO firms. Larger IPO’s are
usually offered by well known firms with several operating years and better records. This contributes
to reduce the perceived risk of the IPO from the side of potential investors (Carter et al., 1998 ; Jain
and Kini, 2000). Carter and Manaster (1990) document that, besides the uncertainty surrounding the
IPO, investors will take into account its size to value the performance of IPO’s.
Empirically, several studies report evidence for this negative relationship between the amount of
raised funds and the level underpricing (Chalk and Peavy, 1990 and Clarkson and Merkley, 1994).
�����'����$��������
All variables used in our study are summarized in table 4.
#�6*��. )�������;�*������8�����6*���
Variables Proxies Measure Expected sign
Retained Capital %������ 16percentage of shares raised to total outstanding
shares +/6
Underwriter’s price
support 3���" Dummy variable takingoneif the underwriter is
known to support its own IPO’s and 0
otherwise.
+/6
Oversubscription ratio ����� The number of demanded shares over the number
of shares offered +
Listing delay ��*� The number of days separating the closing of
subscriptions and the first day of trading +
Offer price ����� The natural logarithm of the price set by the issuer 6
Firm age ��� The natural logarithm of the number of years
between the year of creation and the IPO 6
Firm size �"B�� The natural logarithm of total assets at the end of
the year preceding the IPO of the issuing firm 6
Offer size �"B��� The natural logarithm of the number of offered
shares * offer price 6

18
The characteristics of the main variables used in this study are reported in table 5. The retained
capital for the 34 offered shares averages 76.1 per cent, with a minimum of 51.0 per cent and a
maximum of 90.0 per cent. Oversubscription averages 4.5 for our sample, with a minimum of 0.6
and a maximum of 18.6. These levels are comparable to oversubscription rates observed in other
developed and emerging markets. In our sample of 34 IPO’s, firms take in average 18 days to be
listed. The listing delay varies across IPO’s ranging from a minimum of four days to a maximum of
56 days. The average price for the Tunisian IPO’s is 15.75 dinars9, the minimum offer price is 2.55
dinars and the highest price was set to 43 dinars. Among professionals, a price less than five dinars is
considered to be a low price, whereas a share offered above 20 dinars is considered to be very high.
The average and the median age of firms which conducted IPO’s in the TSE are about 22 years. The
minimum number of years of operation is one year and the maximum is 77 years. It seems also that
in recent years, the IPO market attracted well established firms with long experience and mature
organisations. The average total asset is 27.9 million dinars, with a minimum of 0.98 and a maximum
of 80.9. The sample is dominated by medium size companies (half of IPO firms with less than 30
million dinars total assets). The total funds raised by firms listed in the TSE averaged 8.7 million
dinars. The minimum gross proceeds amounted 0.75 and the highest capital raised 43.6 millions. This
relatively small amount of raised funds, compared to other international emerging markets, is due to
the low capitalisation level of IPO candidate companies and to the fact that Tunisian companies are
historically bank oriented. However during the last years gross proceeds from IPO’s reached higher
levels with more than 43 million dinars raised from the market for each of the two IPO’s conducted
during the year 2008.
9 One Tunisian dinar ranged between 0.8 to 1 USD over the study period.

19
#�6*��=
"���8���� ������*����������������
Mean Median Min Max SD
Capret 0,76 0,73 0,51 0,90 0,10
Over 4,52 3,50 0,61 18,61 4,30
Del 18,38 17,00 4,00 56,00 10,51
Price 15,75 15,00 2,55 43,00 8,95
Age 21,94 21,50 1,00 67,00 15,58
FSize* 65 ,3 27,9 0,98 80,9 141,2
OSize* 8.7 5.5 0.75 43.6 10.2
%����� is the retained capital, ���� is the oversubscription ratio measured by the number of demanded shares over the number of shares offered, *��* is the listing time calculated as the natural logarithm of number of days separating the closing of subscriptions and the first day of trading, *���� is calculated as the natural logarithm of the offer price by the issuer,��* �� is the issuing firm age measured as the natural logarithm of the number of years between the year of creation and the IPO, �"B� is the firm issuing size measured by the total assets at the end of the year preceding the IPO of the issuing firm, and �"B� is the funds raised measured by the number of offered shares x offer price. * In millions of dinars (approximately 1 TND = 0.85 D)
The correlation matrix of the variables used is presented in Table 6. Parametric and nonparametric
correlation matrix show no correlation between different explanatory variables

20
#�6*��@��������������������������������*��������;�
Capret Over lDel lPrice lAge FSize OSize
Capret -1��� 0.20 60.01 60.06 60.19 0.21 60.09
Over 0.22 -1��� 0.10 60.23 0.16 0.27 0.26
lDel 60.09 0.21 -1��� 0.23 0.06 60.15 0.09
lPrice 60.05 60.37* 0.33 -1��� 0.18 60.17 60.09
lAge 60.08 60.02 0.04 0.20 -1��� 0.06 0.31
FSize 0.24 60.01 60.26 60.06 60.08 -1��� 0.23
OSize 60.12 0.10 0.03 60.03 0.28 0.27 -1���
%����� is the retained capital, ���� is the oversubscription ratio measured by the number of demanded shares over the number of shares offered, *��* is the listing time calculated as the natural logarithm of number of days separating the closing of subscriptions and the first day of trading, *���� is calculated as the natural logarithm of the offer price by the issuer,��* �� is the issuing firm age measured as the natural logarithm of the number of years between the year of creation and the IPO, �"B� is the firm issuing size measured by the natural logarithm of total assets at the end of the year preceding the IPO of the issuing firm, and �"B� is natural logarithm of the funds raised measured by the number of offered shares x offer price.
�
����(� � ������ �����������������������
We use multiple linear regression models to examine the determinants of IPO underpricing. The
dependent variable is the market6adjusted initial return.
The regression model retained is as follow:
( ) ( ) ( ) ( ) ( )0 1 2 3 4 5
( ) ( ) ( )6 7 8
M A R capret undrep over ldel lp ricem ilage F size O size
β β β β β β
β β β ε
= + + + + + +
+ + + + + con tro l variab les
(4)
where miMAR is the degree of short run underpricing for i=1, 2 and 3 (market adjusted initial returns
of IPO),� %����� is the ownership retained, ���� is the oversubscription ratio measured by the
number of demanded shares over the number of shares offered, *��* is the listing time calculated as

21
the natural logarithm of number of days separating the closing of subscriptions and the first day of
trading, *���� is calculated as the natural logarithm of the offer price by the issuer,� � * �� is the
issuing firm age measured as the natural logarithm of the number of years between the year of
creation and the IPO, �"B� is the firm issuing size measured by the natural logarithm of the total
assets at the end of the year preceding the IPO of the issuing firm, and �"B� is the funds raised
measured by the natural logarithm of the number of offered shares x offer price.
Two control variables are also introduced: �*C is a dummy variable taking one if there is a liquidity
contract in the IPO and 0 otherwise, and ��� is a dummy variable taking one if there is a part of
IPO reserved to institutional and 0 otherwise.
We regress the initial returns measures on all explanatory variables supposed to affect the IPO
underpricing in Tunisia. The regression models use the market adjusted returns for the three first
days of trading (miMAR ) of all 34 IPO’s. Table 7 presents the results of coefficient estimates.

22
#�6*��>���������������������������
5 $�-� 5 $��� 5 $�0�
5���*�-� 5���*��� 5���*�-� 5���*��� 5���*�-� 5���*���
� Coef Prob Coef Prob Coef Prob Coef Prob Coef Prob Coef Prob
%������ 6.393 0.017** 6.392 0.019** 6.371 0.020** 6.371 0.022** 6.408 0.018** 6.411 0.020**
3���"� .223 0.000*** .220 0.000*** .218 0.000*** .216 0.000*** .206 0.001*** .210 0.001***
����� .004 0.186 .005 0.115 .007 0.037** .008 0.022** .008 0.043** .009 0.033**
)��*� .102 0.006*** .103 0.005*** .095 0.013** .096 0.010*** .128 0.014** .125 0.012**
)����� 6.086 0.014** 6.090 0.013** 6.075 0.030** 6.080 0.023** 6.081 0.025** 6.091 0.017**
)���� 6.021 0.422 6.022 0.380 6.029 0.256 6.031 0.221 6.030 0.239 6.038 0.183
�"B�� 6.006 0.624 6.005 0.612 6.009 0.462 6.008 0.459 6.012 0.402 6.009 0.487
�"B�� 6.011 0.507 6.003 0.882 6.008 0.641 6.000 0.995 6.023 0.258 6.019 0.450
%*C� 6 6 .001 0.972 6 6 6.008 0.864 6 6 6.050 0.333
���� 6 6 6.041 0.554 6 6 6.037 0.557 6 6 6.009 0.880
%����1� 0.671 0.081 .553 0.217 .659 0.083 .552 0.211 .911 0.040 .889 0.072
�
$�� 0.7050 0.7133 0.7074 0.7176 0.6760 0.6947
)%�� is the degree of short run underpricing for i=1, 2 and 3 (market adjusted initial returns of IPO),�%����� is the retained capital, ���� is the oversubscription ratio measured by the number of demanded shares over the number of shares offered, *��* is the listing time calculated as the natural logarithm of number of days separating the closing of subscriptions and the first day of trading, *���� is calculated as the natural logarithm of the offer price by the issuer,��* �� is the issuing firm age measured as the natural logarithm of the number of years between the year of creation and the IPO, �"B� is the firm issuing size measured by the natural logarithm of total assets at the end of the year preceding the IPO of the issuing firm, and �"B� is natural logarithm of the funds raised measured by the number of offered shares x offer price. * In millions of dinars (approximately 1 TND = 0.85 D), �*C is a dummy variable taking one if there is a liquidity contract in the IPO and 0 otherwise, and ��� is a dummy variable taking one if there is a part of IPO reserved to institutional and 0 otherwise.
*, **, and *** denote statistical significance at the 10%, 5%, and 1% level, respectively.
The regression results show that retained capital (Capret), underwriter price support (UndPS), delay
listing (lDel) and offer price (lPrice) are statistically significant and have the expected signs for all
initial return measures (MAR 1, 2 and 3). The estimated coefficient for the variable oversubscription
rate is positive and statistically significant for MAR 2 and MAR 3. The other explanatory variables

23
(firm age, firm size and the size of the issue) do not seem to have any impact on the level of
underpricing.
The fraction of capital held by the controlling shareholders (Capret) is negatively correlated with
underpricing. This result is consistent with both the “agency costs” and the “signalling” hypothesis.
However we privilege the signalling hypothesis channel. In fact, the Tunisian exchange market is
characterized by both a high level of informational asymmetry and a lack of transparency. In such
circumstances investors lean mainly on side signals to assess the true value of the firm. Retaining
capital by original owners is thus considered as a strong indicator of the future perspectives of the
IPO firms. On the other hand, diffusing a high proportion of capital amongst small minority
shareholders is often considered, by investors, as a mean to share risks (in the future) or disengage
progressively from the firm.
Our results show also a strong evidence of underwriters’ price support. The coefficient estimate of
the variable (UndPS) is significantly positive at the 1 per cent level. This result is consistent with the
findings of Schultz and Zaman (1994) on the NYSE, Xu and Wu (2002) on the Shangai stock
exchange and Uddin (2008) on the Indian stock exchange. The result confirms the widespread view
amongst professionals on the existence of price support practices on the TSE. We believe that price
support practices are used by some brokers for mainly two reasons. First, they might be motivated
by their “reputation” on the market as leading successful IPO’s. Second, due to the thinness of the
Tunisian exchange market, underwriters as they also act as brokers gain money also from trading
activities on the post6IPO market, they have incentives to support their own IPO’s to maximize their
potential profit from other investors trading.
The demand for the firm’s shares seems to be positively related to the degree of undepricing. We
believe that this positive coefficient estimate of the variable oversubscription indicates primarily the
expectations of potential investors on the future sort6run performance of the IPO. The Tunisian

24
market is known to attract investors that participate in the stock exchange only during IPO’s said to
be “ipoers”, whom are motivated by short run profits. They exploit information leakage made by
institutional investors or more “strategic investors” to subscribe to highly underpriced IPO’s.
The positive sign of listing delay (lDel) is consistent with the findings by Chowdhry and Sherman
(1996) on the UK market and by Megginson and Tian (2006) on the Chinese market. However, we
do not advance the same explanation as it is hard to advocate that candidate firm’s intently
underprice when listing delays get longer. We support the point view that underpricing is more likely
to be unintended. In fact, listing delays lead to increased information leakage about the true value of
the offered share. Rationed investors looking for short run profits, particularly “ipoers”, will thus try
to catch up and will add to the buy side pressure on post6IPO trading. This might lead to an
overreaction of share prices during the first days of listing.
Our findings show a negative relationship between offer price (lPrice) and underpricing. This may
be attributed either to higher demand for low price IPO’s or to the lower uncertainty surrounding
IPO’S offered at high prices. We tend to support the first explanation as price and oversubscription
rate are negatively and significantly correlated (60.37). Besides, when the offer price is low,
subscribers are more likely to be rationed. This rationing will add to the pressure on the buy side in
the post6IPO trading and will thus lead to an increase in the short run performance of offered share.
The other explanatory variables included in the regression do not seem to have any impact on the
level of underpricing. This indicate that age, firm size and the offer size are not used by investors to
assess the information asymmetry and thus to reduce ex ante uncertainty about the issuing firm.
Tunisian investors seem to rely mainly on side information (retained capital, underwriter, demand
level and listing delay) rather than on companies characteristics disclosed on IPO’s prospectus. On
the contrary, Gasbarro et al. (2003) examining a sample of Mauritius IPOs find that information

25
disclosed in the prospectus, such cash flow and sales, positively impact the level of initial
underpricing.
On one hand, this may be attributed to the presence of a high number of ipoers who are only
interested in short run performance of the share. On the other hand, it appears that Tunisian
investors are sceptical about the value of information disclosed on IPO’s prospectus. In fact, firms,
particularly in Tunisia, are known to intensively proceed to window dressing prior to going public.
To investigate the robustness of our results, we introduced two control variables to account for the
possible impact of the participation of institutional investors in IPO’s and the existence of liquidity
contracts on the level of underpricing. First, the direction and significance of the coefficient
estimates for the basic model (model 1) remain unchanged for the three measures of initial
underpricing. Second, the presence of institutional investors does not seem to act as a sort of
“certification” of the value of the company, reducing uncertainty and therefore producing a lower
level of underpricing. Our results are inconsistent with those of Ljungqvist et al. (2006).
The existence of a liquidity contract is found to be unrelated to the level of underpricing indicating
that providing a protection against market illiquidity does not contribute to reduce ex ante
uncertainty and hence to lower the amount of the money left on the table by issuing firms.
=1 %�2%)3" �2�
This paper examined the initial underpricing for a sample of 34 Tunisian IPO’s from the period
199262008. Besides the presence of ceiling constraints it appears that the level underpricing is
captured over the first three days of trading. The average initial return is about 17.8 per cent (for the
third day). However, we highlighted varying level underpricing across the years. The average
underpricing for the sample IPOs is comparable to other international studies but very different
from those of the Chinese market.

26
We also examined the relation between the degree of underpricing and a set of exogenous variables
hypothesized to impact the underpricing. Estimation based on multivariate regression analysis show
that retained capital (Capret), oversubscription rate (Over), listing delay (lDel) and offer price (lPrice),
significantly affect the underpricing level of the sample IPO’s. It appears also that the Tunisian IPO
market is dominated by irrational investors (Ipoers) who rely on side information and rumours to
subscribe to potentially “good” IPOs. Our results highlight also a strong evidence of underwriter’s
price support (UndPS).
Finally, it seems that the participation of institutional investors to the IPO and the existence of
liquidity contracts (two features of the Tunisian market) did not play any role in reducing the level of
information asymmetry nor the uncertainty surrounding IPOs.
�
�
�
�

27
�
$���$�2%�"�
Aggarwal, R.., R. Leal and L. Hernandez (1993), ‘The aftermarket performance of initial public
offerings in Latin America’, Financial Management, (Spring) : 42–53.
Agarwal, S., C. Liu and S.G. Rhee (2008), ‘Investor demand for IPO’s and aftermarket performance:
Evidence from the Hong Kong stock market’, Journal of International Financial Markets,
Institutions and Money, 18 (2): 176619
Allen, F. and G. Faulhaber (1989), ‘Signaling by underpricing in the IPO market’, Journal of
Financial Economics, 23: 3036323.
Beatty, R. P. and J. R. Ritter. (1986), ‘Investment banking, reputation, and the underpricing of initial
public offerings’, Journal of Financial Economics, 15(1/2): 2136232.
Benveniste, Lawrence M. and P. A. Spindt (1989), ‘How investment bankers determine the offer’
Journal of Financial Economics, 24 (2): 3436361.
Ben Naceur, S. and H. Ghanem (2001), ‘The Short and Long6run Performance of New Listings in
Tunisia’, International Review of Finance, (4): 2356246.
Ben Naceur, S. and A. Omri (1997), ‘Sous6évaluation des Sociétés Introduites sur la Bourse
Emergente de Tunis (199161995)’, Revue Monde en développement, (25) : 33644.
Bhabra, H. S. and R. H. Pettway (2003), ‘IPO prospectus information and subsequent performance’,
Financial Review, (38): 3696397.
Bilson, C., R. Heanry, J. G. Powell and J. Shi (2003), ‘The Decision to Voluntary Provide an IPO
Prospectus Earnings Forecast: Theoretical Implication and Empirical Evidence’, Working paper,
Australian National University.
Booth, J. and L. Chua (1996), ‘Ownership dispersion, costly information, and IPO underpricing’,
Journal of Financial Economics, (41): 291−310.

28
Bozzolan, S. and E. Ipino (2007), ‘Information Asymmetries and IPO Underpricing: The Role of
Voluntary Disclosure of Forward6Looking Information in the Prospectus’, working paper.
Brennan M.J. and J. Franks (1997) ‘Underpricing, ownership and control in initial public offerings of
equity securities in the UK’, Journal of Financial Economics, 45 (3) : 3916413
Carter R., F. Dark and A. Singh (1998), ‘Underwriter reputation, initial returns, and the long6run
performance of IPO stocks’, The Journal of Finance, 53: 2856311.
Carter R. and S. Manaster (1990), ‘Initial public offerings and underwriter reputation’, Journal of
Finance, 45: 104561068.
Chalk A.J. and J.W. Peavy (1987), ‘Initial Public Offerings: Daily Returns, Offering Types and the
Price Effect’, Financial Analysts Journal, 43: 65669.
Chan K.L., K.J. Wei and J.B. Wang (2004), ‘Underpricing and long6term performance of IPO’s in
China’, Journal of Corporate Finance, 10: 4096430.
Chang X., A.F. Gygax, E. Oon and H.F. Zhang (2008), ‘Audit quality, auditor compensation and
initial public offering underpricing’, Accounting and Finance, 48 (3): 391 6 416�
Clarkson, P. M., and D. Simunic (1994), ‘The association between audit quality, retained ownership,
and firm6specific risk in U.S. and Canadian IPO markets’, Journal of Accounting and Economics, 17:
2076228.
Clarkson, P. M. and J. Merkley (1994), ‘Ex Ante Uncertainty and the Underpricing of Initial Public
Offerings: Further Canadian Evidence’, Canadian Journal of Administrative Sciences, II(1): 54667
Chi, J. and C. Padgett (2005), ‘Short6run underpricing and its characteristics in Chinese initial public
offering (IPO) markets’, Research in International Business and Finance, 19 (1) : 71693
Chowdhry, B. and A. Sherman (1996), ‘The winner’s curse and international methods of allocating
initial public earnings’, Pacific6Basin Finance Journal, 4: 15630.

29
Daily, C.M., S.T. Certo, D.R. Dalton, and R. Roengpitya (2003), ‘IPO underpricing: a meta6analysis
and research synthesis’, Entrepreneurship: Theory and Practice, 27 (3) : 271–295
Dawson, S.M. (1987), ‘Secondary stock market performance of initial public offers, Hong Kong,
Singapore and Malaysia’ Journal of Business Finance and Accounting, 14(1) : 65676.
Downes, D. and R. Heinkel (1982), ‘Signaling and the valuation of unseasoned new issues’, Journal
of Finance, 37: 1–10.
Fernando, C., S. Krishnamurthy and P. A. Spindt (1999), ‘Offer Price, Target Ownership Structure
and IPO Performance’, Working paper.
Finkle, T.A. (1998), ‘The relationship between boards of directors and initial public offerings in the
biotechnology industry’, Entrepreneurship Theory and Practice, 22: 5–29.
Gana M.R. and A. EL Ammari (2008), ‘Initial Underpricing and Transfer of Shares on the Tunisian
Stock Exchange’, Journal of Corporate Ownership and Control, 5 (3): 4346444.
Gompers, P. and A. Metrick (1998), ‘How are large institutions different from other investors ? Why
do these differences matter?’, Working paper, Harvard Business School.
Hanley, K. W. (1993), ‘Underpricing of initial public offerings and the partial adjustment
phenomenon’, Journal of Financial Economics, 34: 231–250.
Gasbarro Dominic, Bundoo Sunil and Zumwalt J. Kenton (2003) : “Underpricing and Aftermarket
Performance of IPO Firms in Mauritius” Journal of Emerging Market Finance, Vol. 2, No. 3, 3156
335 (2003)
Grinblatt, M. and .C.Y, Hwang (1989), ‘Signalling and the pricing of new issues’, Journal of finance,
Journal of Finance 44, 3936420.
Hensler, D. A., R. C. Rutherford and T. M. Springer (1997) ‘The survival of initial public offerings in
the aftermarket’, Journal of Financial Research, 20: 936110.

30
Ibbotson, R.G. (1975), ‘Price performance of common stock new issues’, Journal of Financial
Economics, 2: 2326272.
Ibbotson, R. G., J. Sindelar, and J. Ritter (1994), ‘The market's problems with the pricing of initial
public offerings’, Journal of Applied Corporate Finance, 7: 66674.
Jain, B.A. and O. Kini (1999), ‘The life cycle of initial public offering firms’, Journal of Business
Finance and Accounting, 26: 128161307.
Jain, B. A. and O. Kini (2000), ‘Does the presence of venture capitalists improve the survival profile
of IPO firms?’ Journal of Business Finance and Accounting, 27: 113961176.
Jacquillat, B. and J. G. Mac Donald (1974), ‘L’efficacité de la procédure française d’introduction en
Bourse’, Revue Banque, 31–39.
Jacquillat, B., J. G. Mac Donald and J. Rolfo (1978), ‘French auctions of common stock: New issues’,
Journal of Business Finance, 2: 305–322.
Jensen, M. C. and H.W. Meckling (1976), ‘Theory of the Firm: Managerial Behavior, Agency Costs,
and Ownership Structure’, Journal of Financial Economics, 3 (4): pp. 3056 360.
Jenkinson, T.J., Ljungqvist, A.P., 2001. Going Public: The Theory and Evidence on How Companies
Raise Equity Finance. 2nd ed. Oxford University Press.
Johnson, J.M. and R.E. Miller (1988), ‘Investment banker prestige and the underpricing of initial
public offering’, Financial Management, (17):19–29.
Kandel, S., O. Sarig and A. Wohl (1999), ‘The demand for stocks: an analysis of IPO auctions’,
Review of Financial Studies, 12: 227–247.
Kim, M. and J.R. Ritter (1999), ‘Valuing IPO’s”, Journal of Financial Economics’, 53:409−437.
Kiymaz, H. (2000), ‘The initial and aftermarket performance of IPO’s in an emerging market:
evidence from Istanbul Stock Exchange’, Journal of Multinational Financial Management, 10: 2136
227.

31
Larry Li , John Fowler and Tony Naughton (2008): “ Short Term Equity Returns of Chinese IPOs,
1999 to 2004 Excess Demand, Social Policy and Wealth Effects” 6 Journal of Emerging Market
Finance, Vol. 7, No. 2, 1976214 (2008)
Loughran, T. and J. Ritter (1995), ‘The new issues puzzle’, Journal of Finance, 50: 23652.
Loughran, T. and J. R. Ritter (2002), ‘Why dont issuers get upset about leaving money on the table in
IPO’s?’, Review of Financial Studies, 15: 4136443.
Ljungqvist, A.P. (1997), ‘Pricing initial public offerings: further evidence from Germany’, European
Economic Review, 41: 130961320.
Ljungqvist, .A, V. Nanda and R. Singh (2006), ‘Hot Markets, Investor Sentiment, and IPO Pricing’,
The Journal of Business, 2006 6 Chicago Press
Megginson, W.L. and K.A. Weiss (1991), ‘Venture capitalist certification in initial public offerings’,
Journal of finance, 46: 879-903.
Megginson, W.L and L. Tian (2006), ‘Extreme underpricing: determinants of Chinese IPO initial
Returns’, working paper, Peking University and the University of Oklahoma.
Michaely, R. and W. H. Shaw (1994), ‘The Pricing of Initial Public Offerings: Tests of Adverse
Selection and Signaling Theories’, Review of Financial Studies, 7: 2796315.
Miller, R. E. and F. Reilly (1987), ‘An examination of mispricing, returns, and uncertainty for initial
public offerings’, Financial Management, 16: 33–38.
Mok H.M.K. and Y.V. Hui (1998) ‘Underpricing and aftermarket performance of IPO’s in Shanghai,
China’, Pacific6Basin Finance Journal, 6: 4536474.
Mroczkowski, N. A. and G. Tanewski (2004), ‘Using accounting standards to delineate family and
non6family controlled firms. Caulfield East, Victoria, Australia: Working Paper, Faculty of Business
and Economics, Monash University.
32
Purnanandam, A.K., and B. Swaminathan (2004), ‘Are IPO’s really underpriced?’, Review of
Financial Studies, 17(3): 811-848.
Ritter, J. R. (1991), ‘The long6run performance of initial public offerings’, Journal of Finance, 42:
3656394.
Ritter, J. R. (1984), ‘Signalling and the valuation of unseasoned new issues: A comment’, Journal of
Finance, 39: 123161237.
Ritter, J. R. and I. Welch (2002), ‘A review of IPO activity, pricing, and allocations’, Journal of
Finance, 57: 179561828.
Rock, K. (1986), ‘Why new issues are underpriced’, Journal of Financial Economics, 5: 187–212.
Ruud, J. S. (1993), ‘Underwriter Price Support and the IPO Underpricing Puzzle’, Journal of
Financial Economics, 34: 1356152.
Schultz, P. (1993), ‘Unit initial public offerings’, Journal of Financial Economics, 34: 1996229.
Schultz.P.H and M.A. Zaman (1994), “Aftermarket support and underpricing of initial public
offerings”, Journal of Financial Economics, 35 (2): 1996219
Spiess, D.K. and R.H. Pettway (1997), ‘The IPO and first seasoned equity sale: Issue proceeds,
owner/manager wealth, and the underpricing signal’, Journal of Banking and Finance, 21: 967–988.
Spiess, D.K and J. Affleck6Graves (1995), ‘Underperformance in long6run stock returns following
seasoned equity offerings’, Journal of Financial Economics, 38(3): 2436267.
Su, D. and B. M. Fleischer (1999), ‘An Empirical Investigation of Underpricing in Chinese IPO’s’,
Pacific6Basin Finance Journal, 7: 1736202.
Tian, G.L. (2003), ‘Financial Regulations, Investment Risks, and Determinants of Chinese IPO
Underpricing’, Working paper, Peking University Management School and London.
Titman, B. and B. Trueman (1986), ‘Information quality and the valuation of new issues’, Journal of
Accounting and Economics, 8: 1596172.

33
Titman, S. and R. Wessels (1988), ‘The determinants of capital structure choice’, Journal of Finance,
(43): 1619.
Uddin, M.H (2008), ‘An Empirical Examination of Intended and Unintended IPO Underpricing in
Singapore and Malaysia’, International Research Journal of Finance and Economics, (20): 56674.
Xu, X. and W.Y. Wu (2002), ‘The impact of underwriters' support on initial return of new issues’,
Modern Economic Science, (24): 80–86.
Yong, O. and Z. Isa (2003), ‘Initial performance of new issues of shares in Malysia’, Applied
Economics, 8: 9196930.
Welch, .I (1989), ‘Seasoned offerings, imitation costs and the underpricing of initial public offerings’,
Journal of finance 44, 4216449.