what controls ice sheet growth? ice sheets exist when ice sheets exist when growth > ablation ...
Post on 20-Dec-2015
218 views
TRANSCRIPT
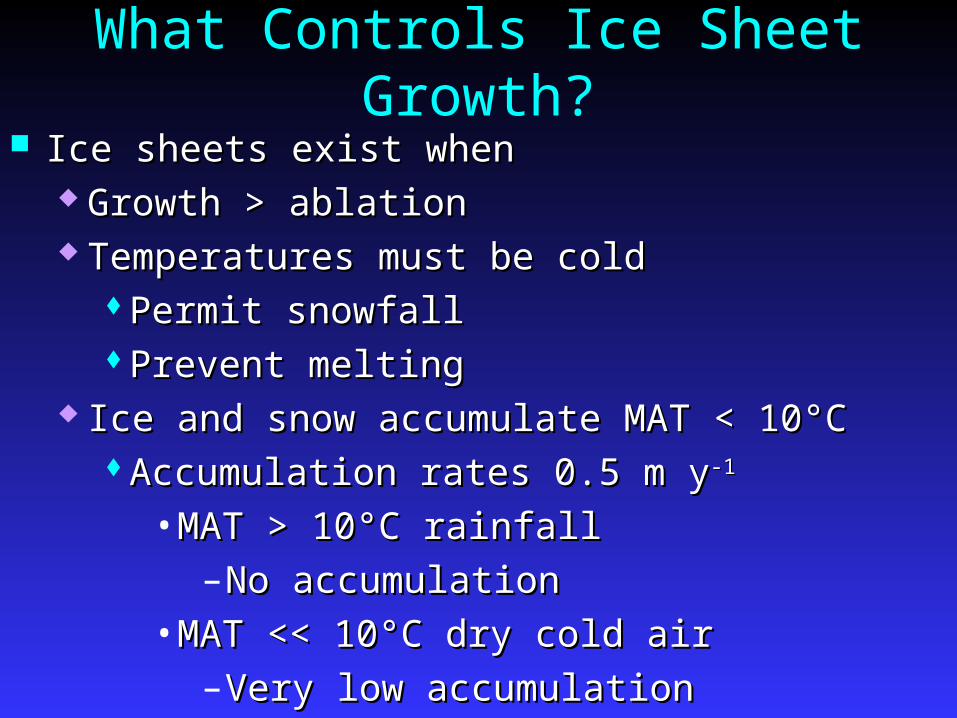
What Controls Ice Sheet Growth? Ice sheets exist whenIce sheets exist when
Growth > ablationGrowth > ablation Temperatures must be coldTemperatures must be cold
Permit snowfallPermit snowfallPrevent meltingPrevent melting
Ice and snow accumulate MAT < 10°CIce and snow accumulate MAT < 10°CAccumulation rates 0.5 m yAccumulation rates 0.5 m y-1-1
•MAT > 10°C rainfallMAT > 10°C rainfall– No accumulationNo accumulation
•MAT << 10°C dry cold airMAT << 10°C dry cold air– Very low accumulationVery low accumulation
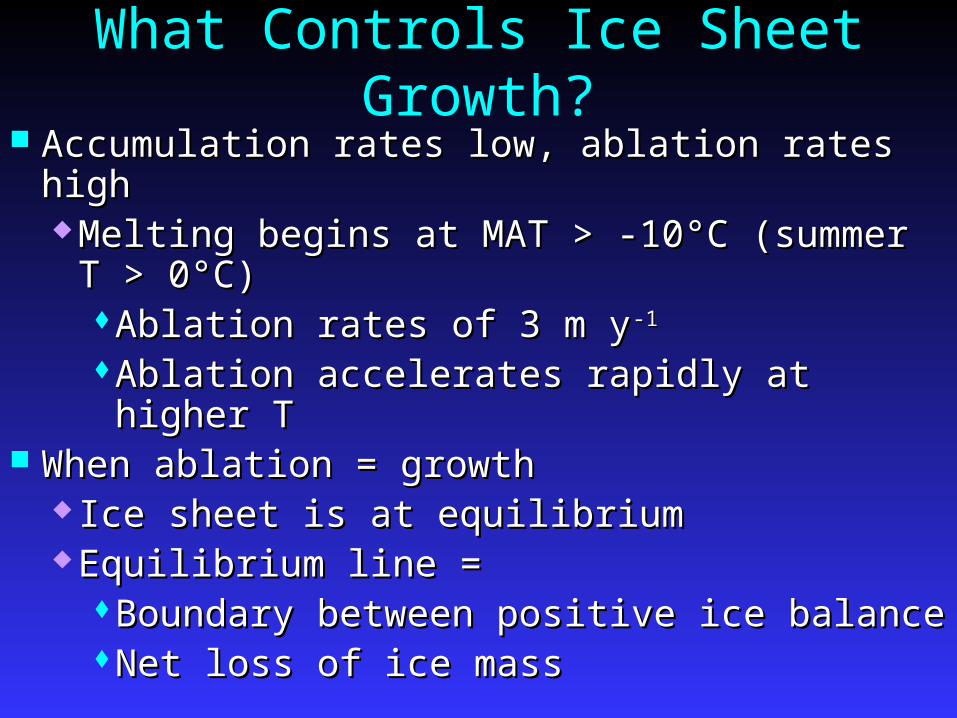
What Controls Ice Sheet Growth? Accumulation rates low, ablation rates highAccumulation rates low, ablation rates high
Melting begins at MAT > -10°C (summer T Melting begins at MAT > -10°C (summer T > 0°C)> 0°C)Ablation rates of 3 m yAblation rates of 3 m y-1-1
Ablation accelerates rapidly at higher TAblation accelerates rapidly at higher T When ablation = growthWhen ablation = growth
Ice sheet is at equilibriumIce sheet is at equilibrium Equilibrium line =Equilibrium line =
Boundary between positive ice balanceBoundary between positive ice balanceNet loss of ice massNet loss of ice mass
Temperature and Ice Mass Balance
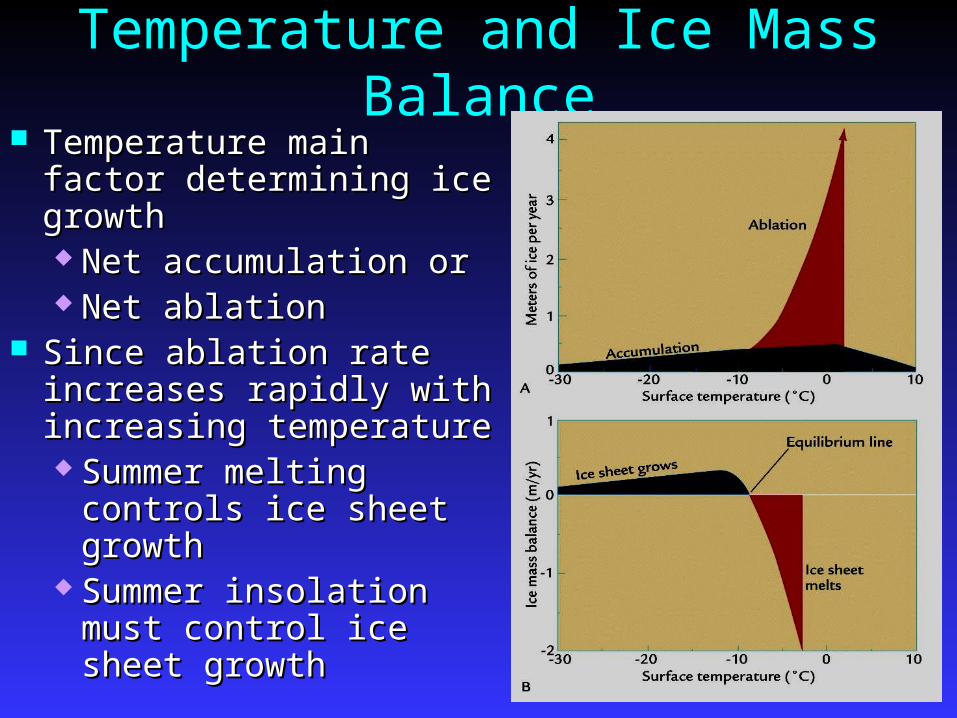
Temperature main Temperature main factor determining ice factor determining ice growthgrowth Net accumulation orNet accumulation or Net ablationNet ablation
Since ablation rate Since ablation rate increases rapidly with increases rapidly with increasing temperatureincreasing temperature Summer melting Summer melting
controls ice sheet controls ice sheet growthgrowth
Summer insolation Summer insolation must control ice must control ice sheet growthsheet growth
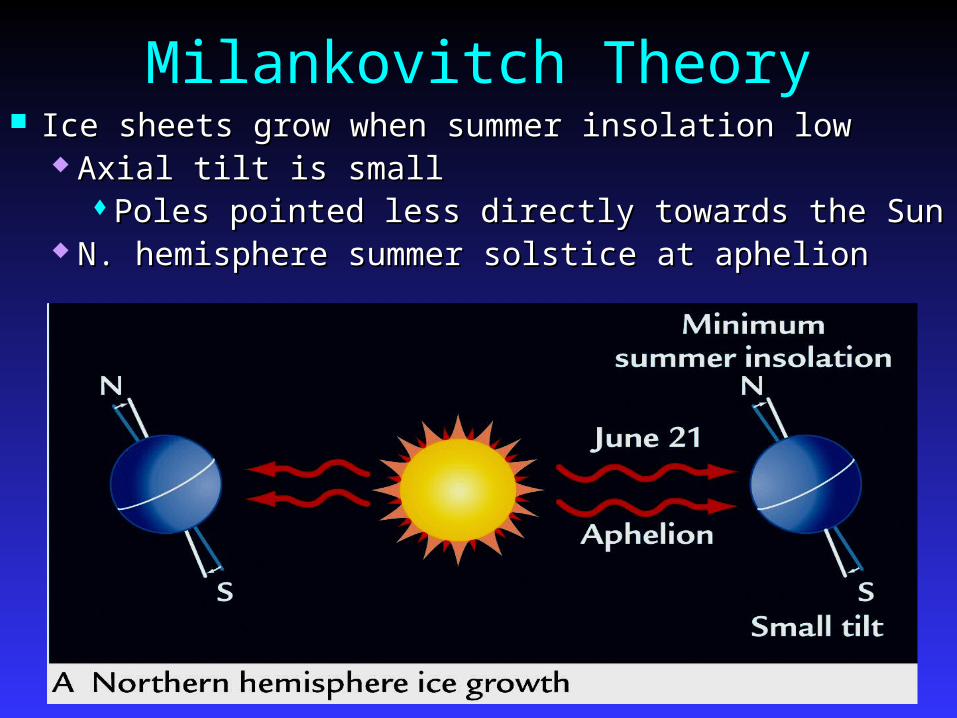
Milankovitch Theory Ice sheets grow when summer insolation lowIce sheets grow when summer insolation low
Axial tilt is smallAxial tilt is smallPoles pointed less directly towards the SunPoles pointed less directly towards the Sun
N. hemisphere summer solstice at aphelionN. hemisphere summer solstice at aphelion
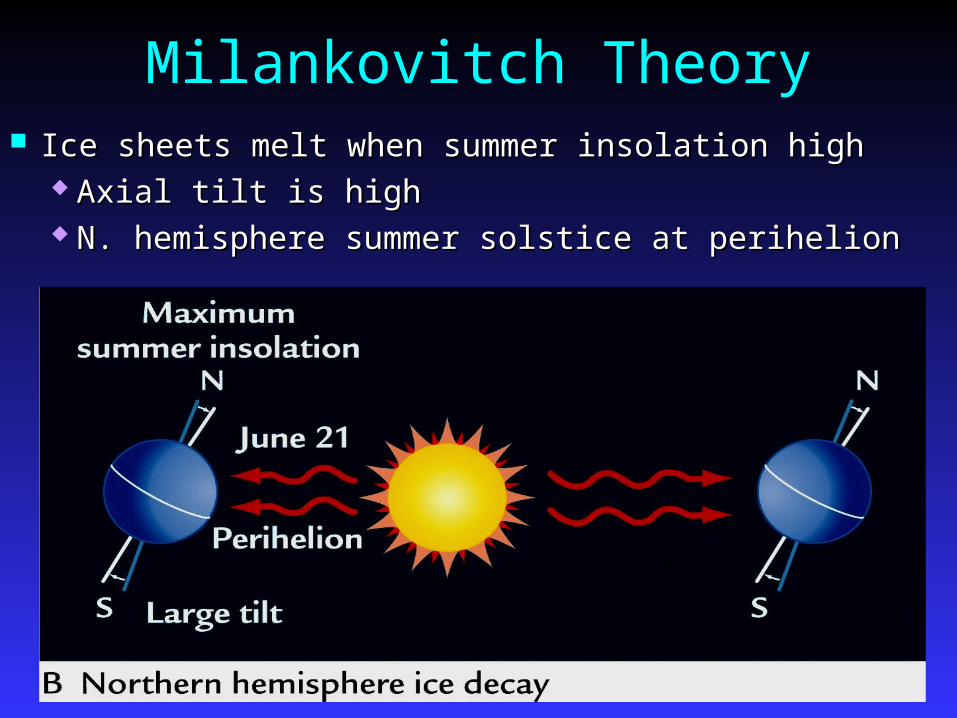
Milankovitch Theory Ice sheets melt when summer insolation highIce sheets melt when summer insolation high
Axial tilt is highAxial tilt is high N. hemisphere summer solstice at perihelionN. hemisphere summer solstice at perihelion
Milankovitch Theory Recognized that Earth has greenhouse effectRecognized that Earth has greenhouse effect
Assumed that changes in solar radiation Assumed that changes in solar radiation dominant variabledominant variable
Summer insolation strongSummer insolation strong More radiation at high latitudesMore radiation at high latitudes
Warms climate and accelerates ablationWarms climate and accelerates ablation•Prevents glaciations or shrinks existing Prevents glaciations or shrinks existing
glaciersglaciers Summer insolation weakSummer insolation weak
Less radiation at high latitudesLess radiation at high latitudesCold climate reduces rate of summer Cold climate reduces rate of summer
ablationablation•Ice sheets growIce sheets grow
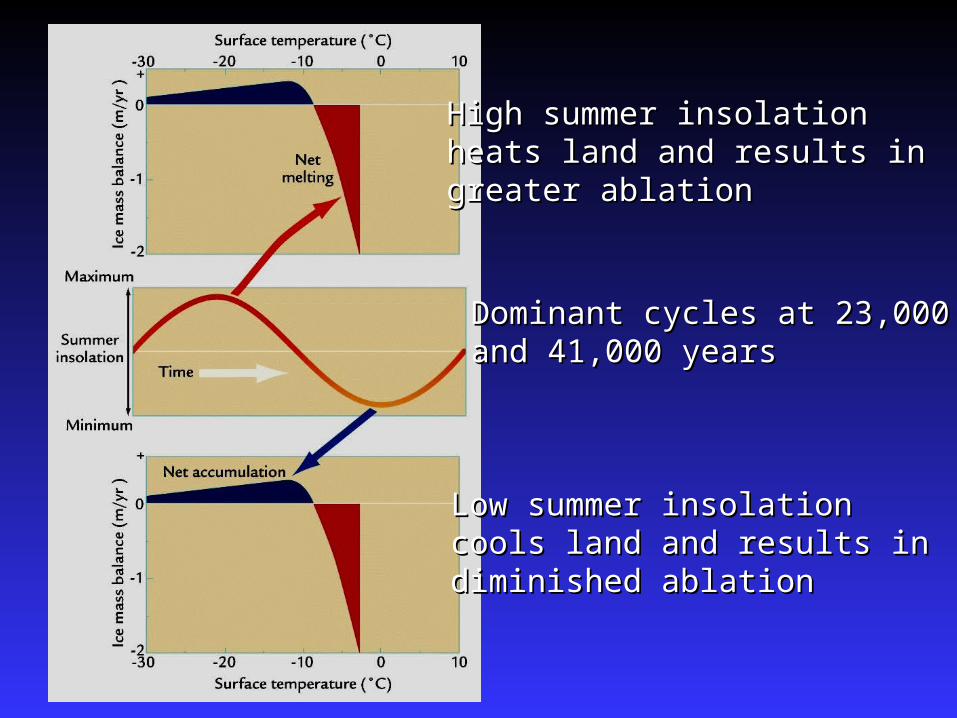
High summer insolationHigh summer insolationheats land and results inheats land and results ingreater ablationgreater ablation
Low summer insolationLow summer insolationcools land and results incools land and results indiminished ablationdiminished ablation
Dominant cycles at 23,000Dominant cycles at 23,000and 41,000 yearsand 41,000 years
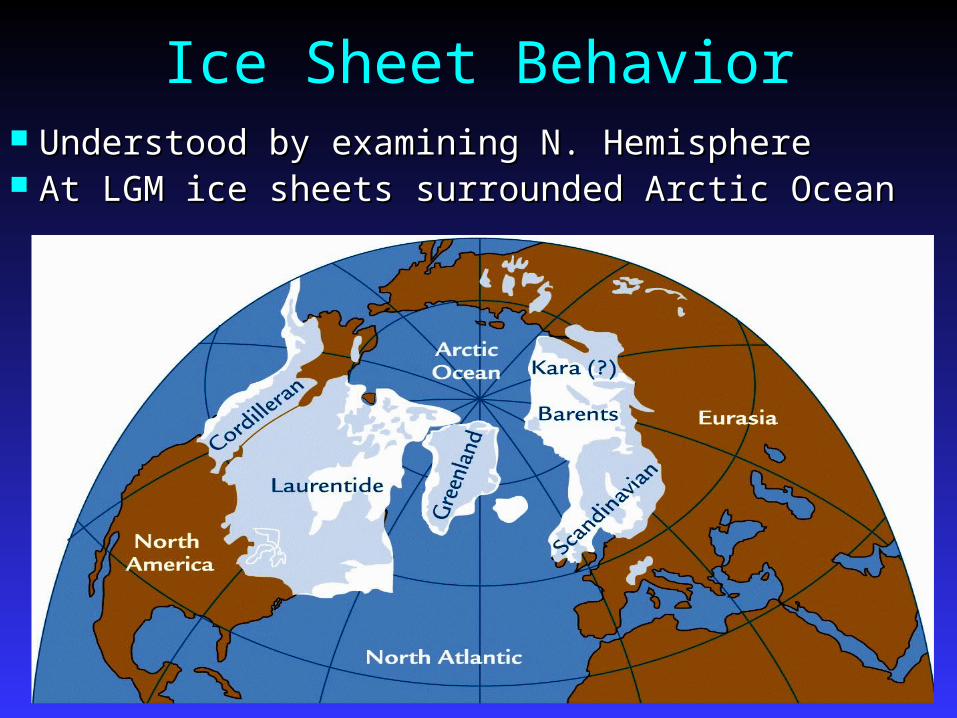
Ice Sheet Behavior Understood by examining N. HemisphereUnderstood by examining N. Hemisphere At LGM ice sheets surrounded Arctic OceanAt LGM ice sheets surrounded Arctic Ocean
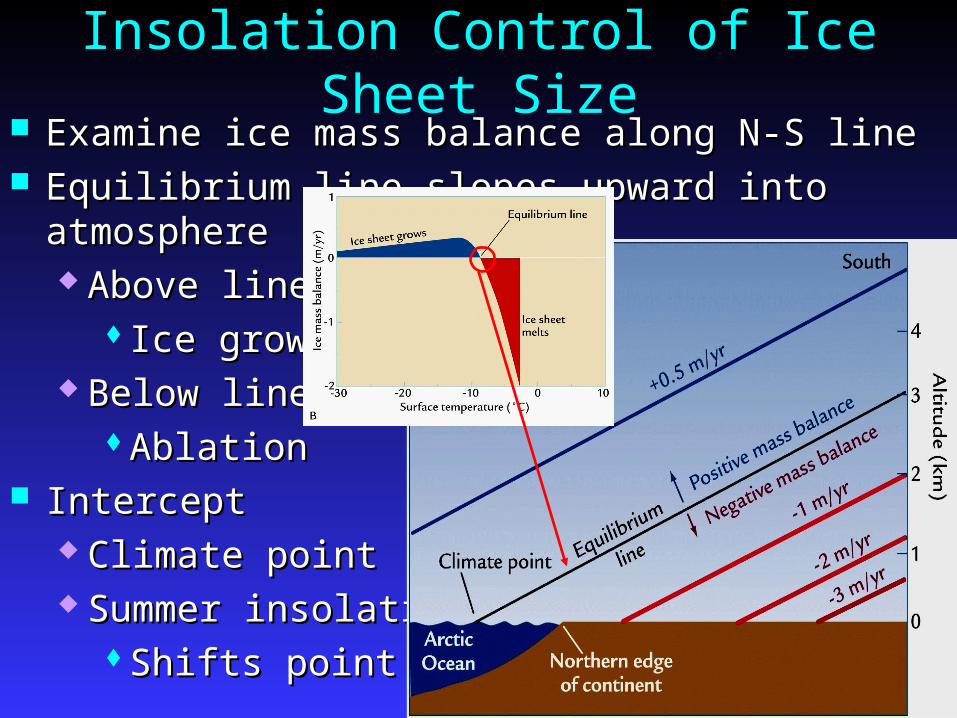
Insolation Control of Ice Sheet Size Examine ice mass balance along N-S lineExamine ice mass balance along N-S line Equilibrium line slopes upward into atmosphereEquilibrium line slopes upward into atmosphere
Above lineAbove line Ice growthIce growth
Below lineBelow lineAblationAblation
InterceptIntercept Climate pointClimate point Summer insolationSummer insolation
Shifts pointShifts point

Insolation Changes Displace Equilibrium Line
Orbital-scale variations in Orbital-scale variations in summer insolationsummer insolation Drive climate pointDrive climate point N-S shifts proportional N-S shifts proportional
to insolation strengthto insolation strength Variations shift locus of Variations shift locus of
ice sheet growthice sheet growth Ice sheets on land formIce sheets on land form
Low summer Low summer insolation brings insolation brings climate point onto a climate point onto a continentcontinent
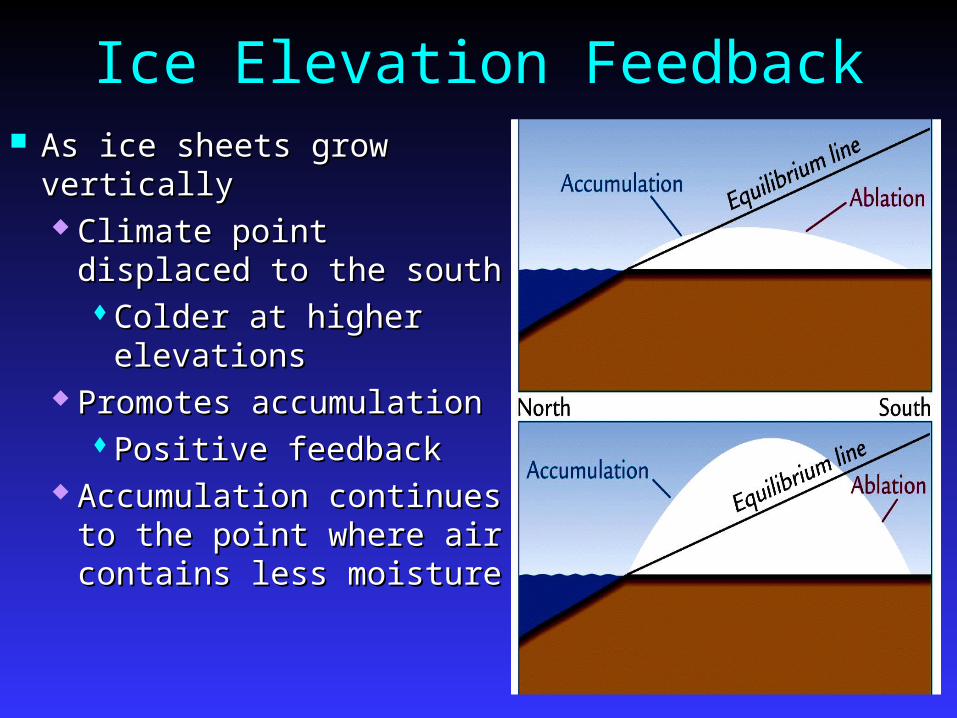
Ice Elevation Feedback As ice sheets grow As ice sheets grow
verticallyvertically Climate point Climate point
displaced to the southdisplaced to the southColder at higher Colder at higher
elevationselevations Promotes Promotes
accumulationaccumulationPositive feedbackPositive feedback
Accumulation Accumulation continues to the point continues to the point where air contains less where air contains less moisturemoisture
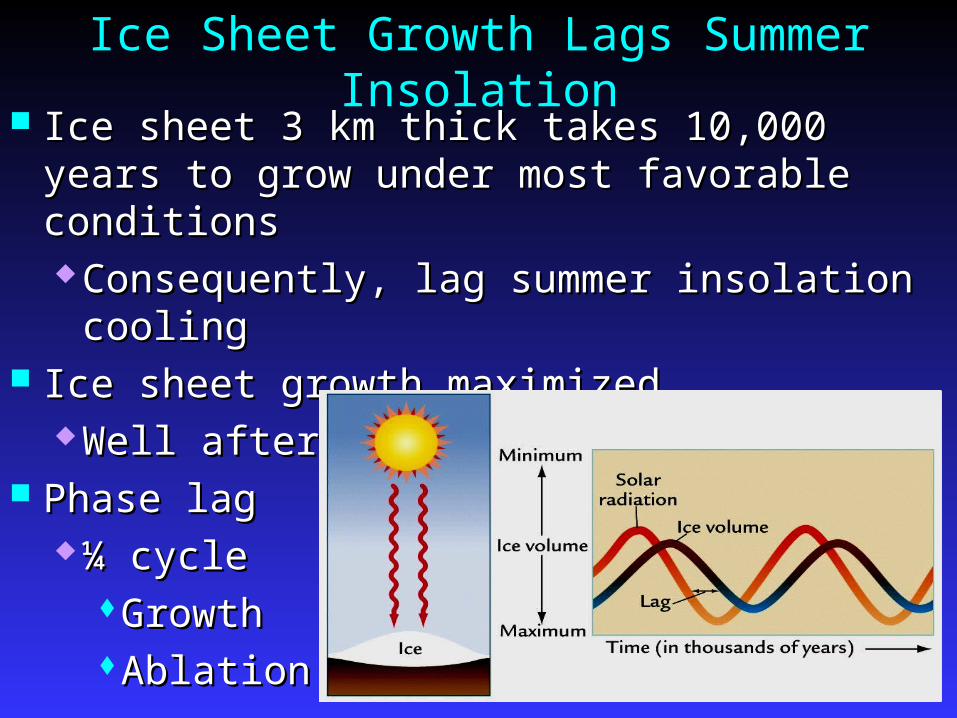
Ice Sheet Growth Lags Summer Insolation
Ice sheet 3 km thick takes 10,000 years Ice sheet 3 km thick takes 10,000 years to grow under most favorable conditionsto grow under most favorable conditions Consequently, lag summer insolation Consequently, lag summer insolation
coolingcooling Ice sheet growth maximizedIce sheet growth maximized
Well after summer insolation minimumWell after summer insolation minimum Phase lagPhase lag
¼ cycle¼ cycleGrowthGrowthAblationAblation
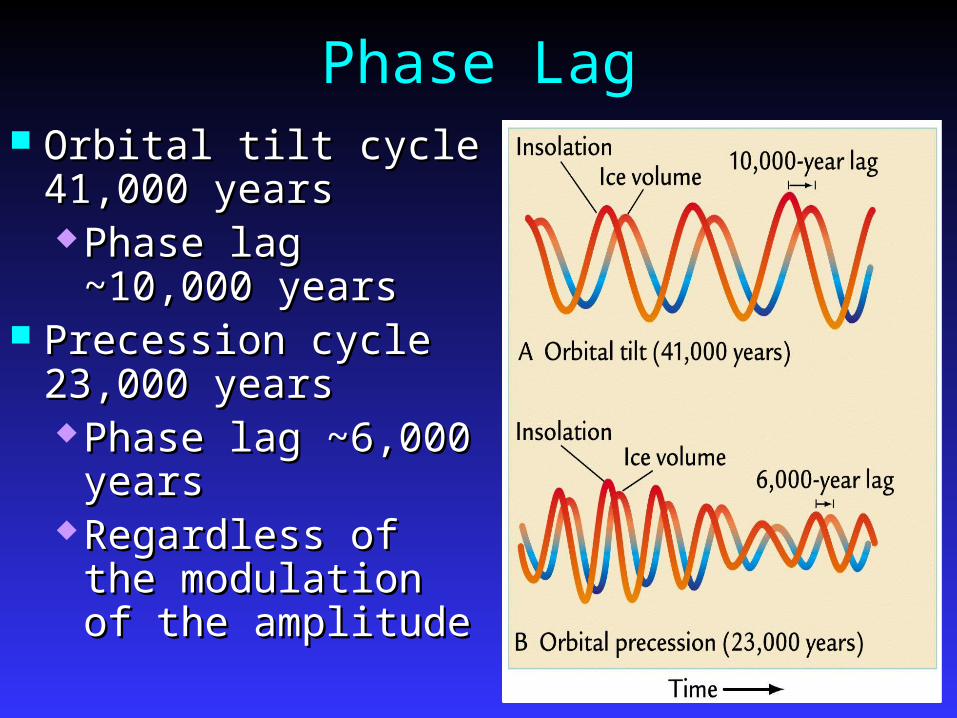
Phase Lag Orbital tilt cycle Orbital tilt cycle
41,000 years41,000 years Phase lag Phase lag
~10,000 years~10,000 years Precession cycle Precession cycle
23,000 years23,000 years Phase lag ~6,000 Phase lag ~6,000
yearsyears Regardless of the Regardless of the
modulation of the modulation of the amplitudeamplitude
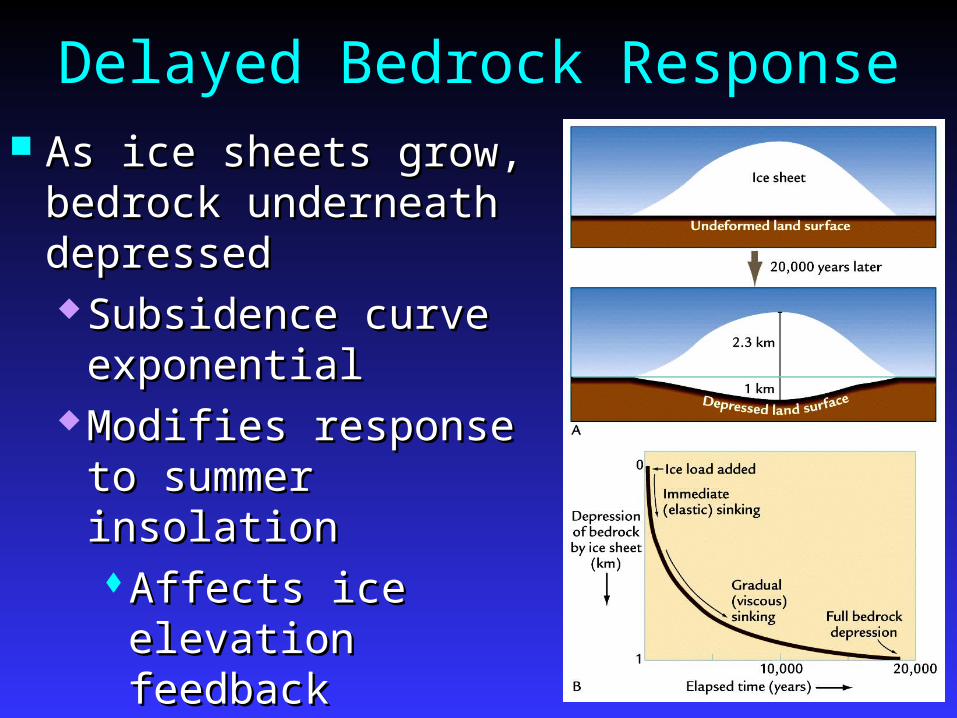
Delayed Bedrock Response As ice sheets grow, As ice sheets grow,
bedrock underneath bedrock underneath depresseddepressed Subsidence curve Subsidence curve
exponentialexponential Modifies response to Modifies response to
summer insolationsummer insolationAffects ice Affects ice elevation feedbackelevation feedback
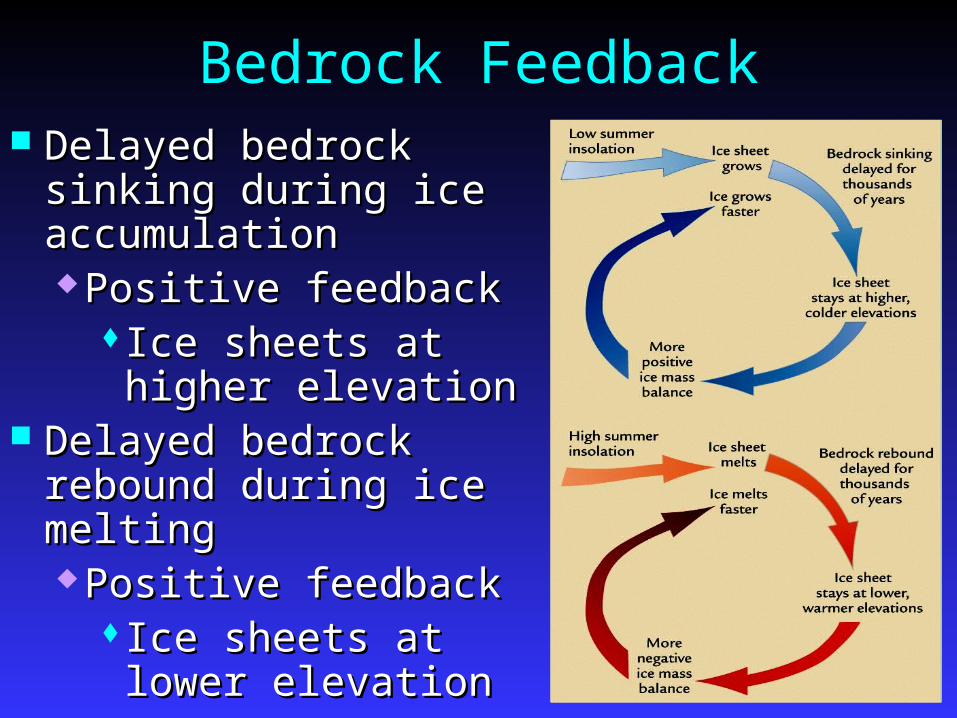
Bedrock Feedback Delayed bedrock Delayed bedrock
sinking during ice sinking during ice accumulationaccumulation Positive feedbackPositive feedback
Ice sheets at Ice sheets at higher elevationhigher elevation
Delayed bedrock Delayed bedrock rebound during ice rebound during ice meltingmelting Positive feedbackPositive feedback
Ice sheets at Ice sheets at lower elevationlower elevation
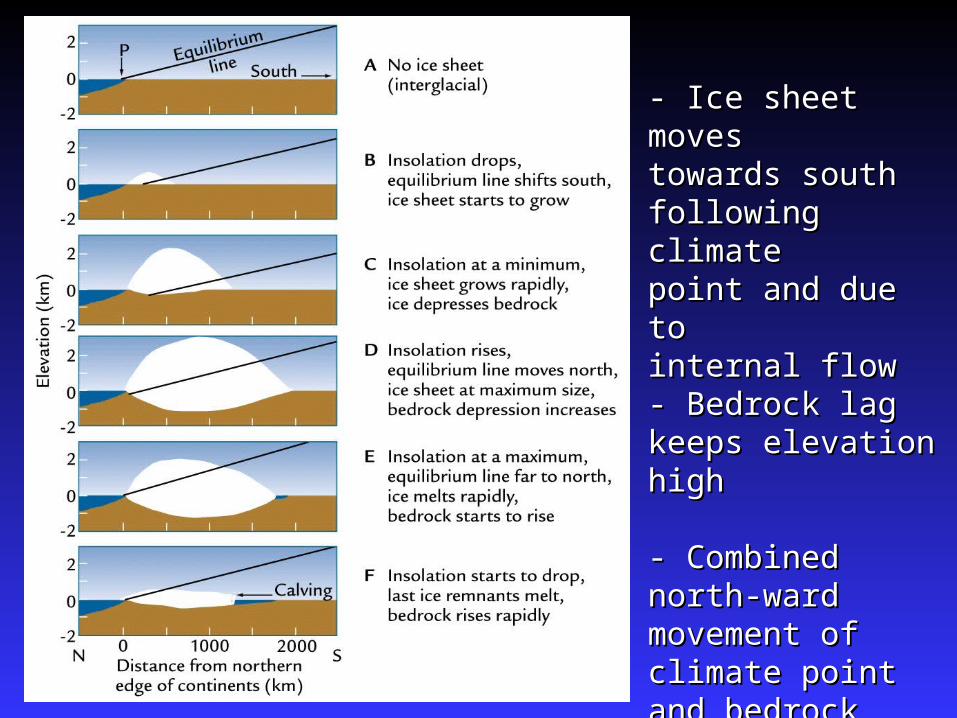
- Ice sheet moves- Ice sheet movestowards southtowards southfollowing climatefollowing climatepoint and due topoint and due tointernal flowinternal flow- Bedrock lag - Bedrock lag keeps elevation keeps elevation highhigh
- Combined north-- Combined north-ward movement ward movement of climate point of climate point and bedrock and bedrock depression depression increases ablation increases ablation mass balance mass balance turns negativeturns negative
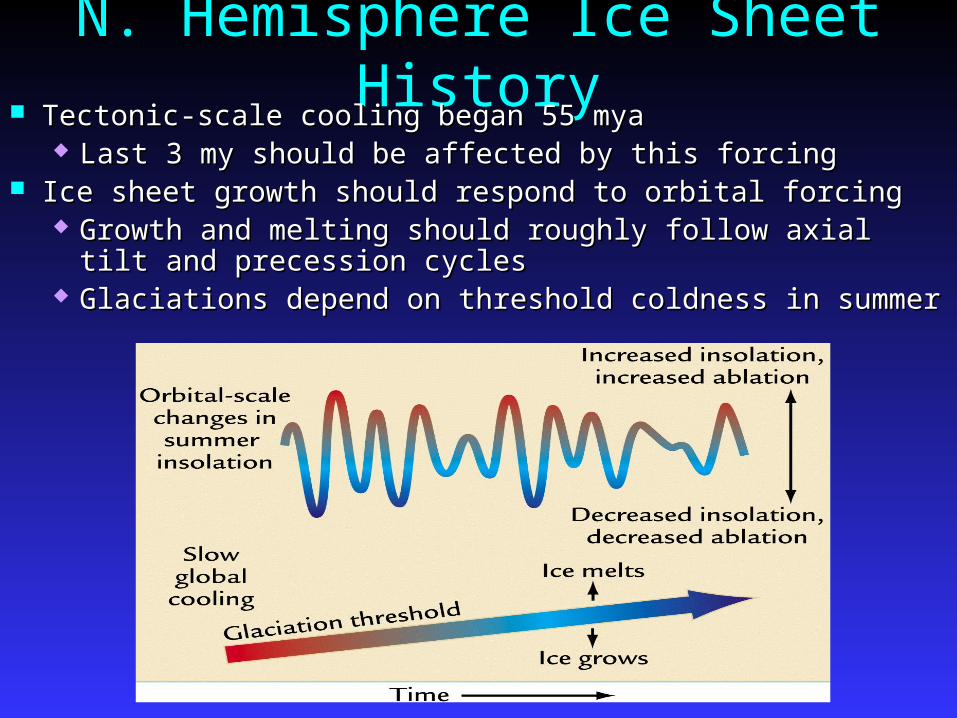
N. Hemisphere Ice Sheet History
Tectonic-scale cooling began 55 myaTectonic-scale cooling began 55 mya Last 3 my should be affected by this forcingLast 3 my should be affected by this forcing
Ice sheet growth should respond to orbital forcingIce sheet growth should respond to orbital forcing Growth and melting should roughly follow axial tilt Growth and melting should roughly follow axial tilt
and precession cyclesand precession cycles Glaciations depend on threshold coldness in summer Glaciations depend on threshold coldness in summer
N. Hemisphere Ice Sheet History
Ice sheet response to external forcing (tectonic Ice sheet response to external forcing (tectonic or orbital)or orbital) Results from interactions betweenResults from interactions between
Slowly changing equilibrium-line thresholdSlowly changing equilibrium-line thresholdRapidly changing curve of summer Rapidly changing curve of summer
insolationinsolation•Insolation values below thresholdInsolation values below threshold
– Ice sheets growIce sheets grow•Insolation values above thresholdInsolation values above threshold
– Ice sheets meltIce sheets meltGrowth and melting lag thousands of years Growth and melting lag thousands of years
behind insolation forcingbehind insolation forcing
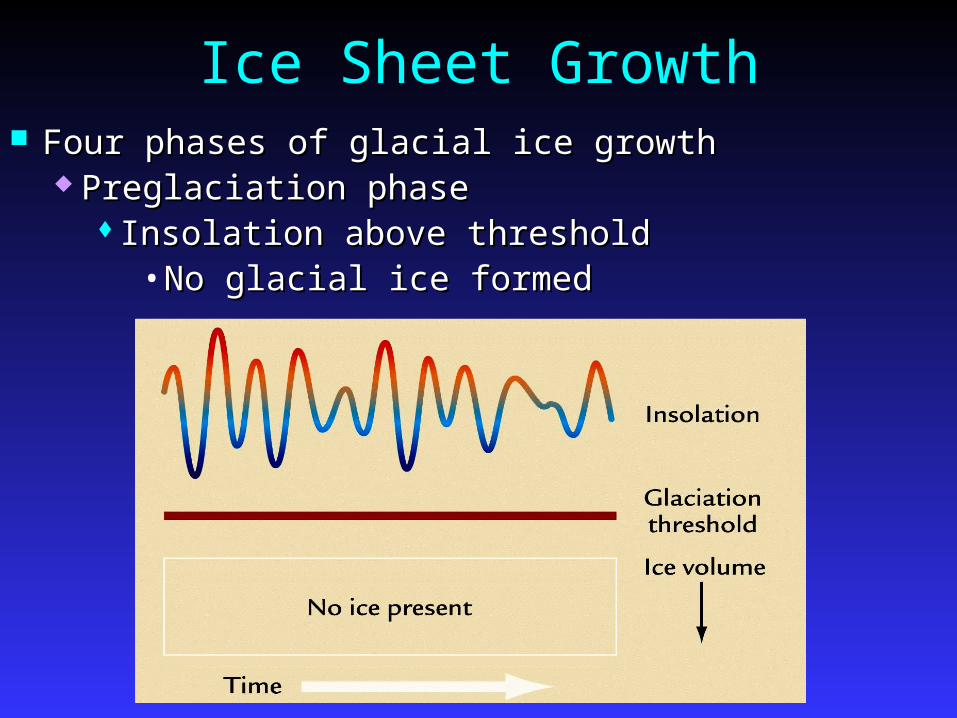
Ice Sheet Growth Four phases of glacial ice growthFour phases of glacial ice growth
Preglaciation phasePreglaciation phase Insolation above thresholdInsolation above threshold
•No glacial ice formedNo glacial ice formed
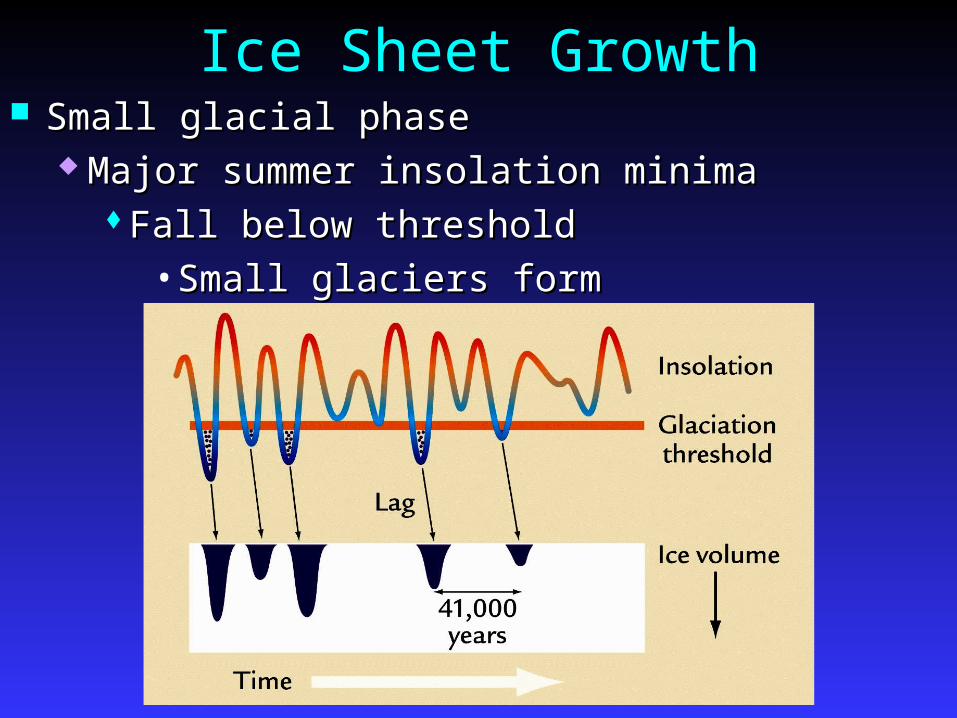
Ice Sheet Growth Small glacial phaseSmall glacial phase
Major summer insolation minima Major summer insolation minima Fall below thresholdFall below threshold
•Small glaciers formSmall glaciers form
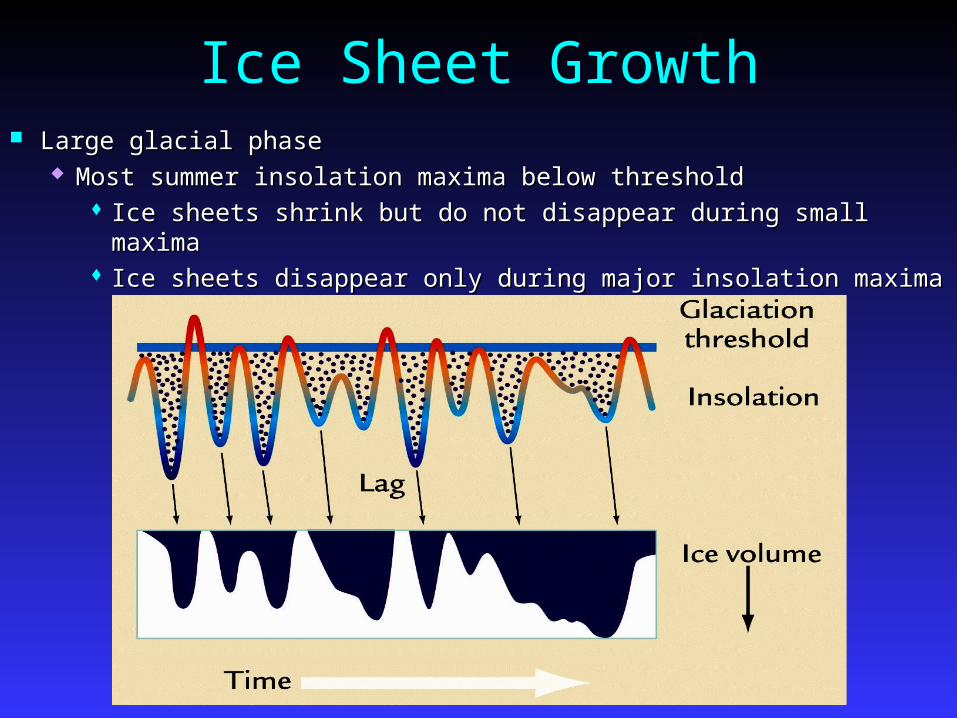
Ice Sheet Growth Large glacial phaseLarge glacial phase
Most summer insolation maxima below thresholdMost summer insolation maxima below threshold Ice sheets shrink but do not disappear during small maximaIce sheets shrink but do not disappear during small maxima Ice sheets disappear only during major insolation maximaIce sheets disappear only during major insolation maxima
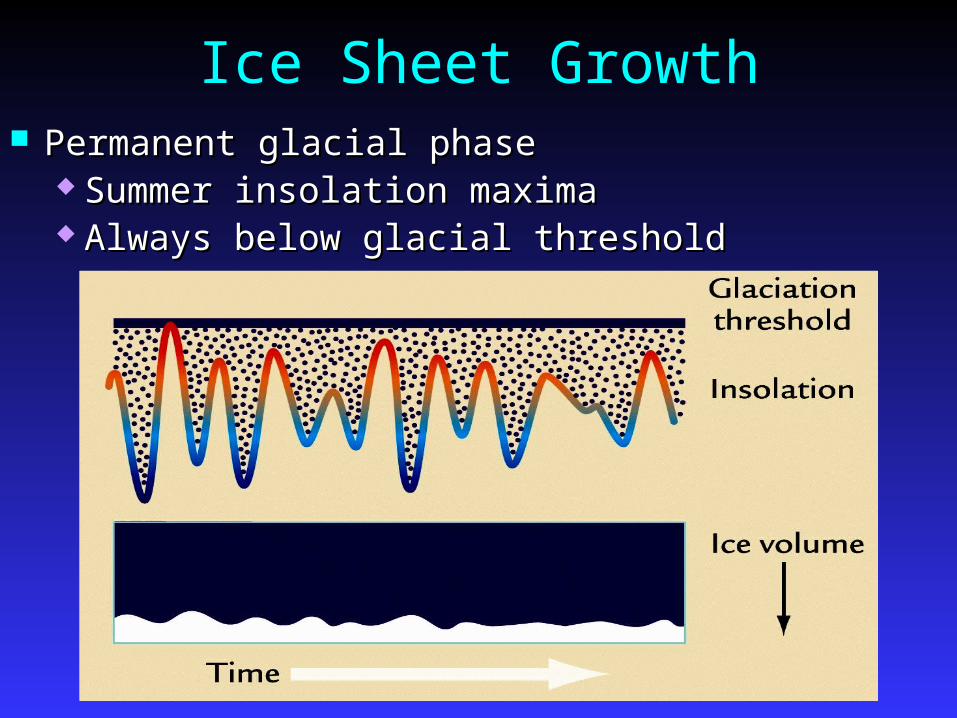
Ice Sheet Growth Permanent glacial phasePermanent glacial phase
Summer insolation maximaSummer insolation maxima Always below glacial thresholdAlways below glacial threshold
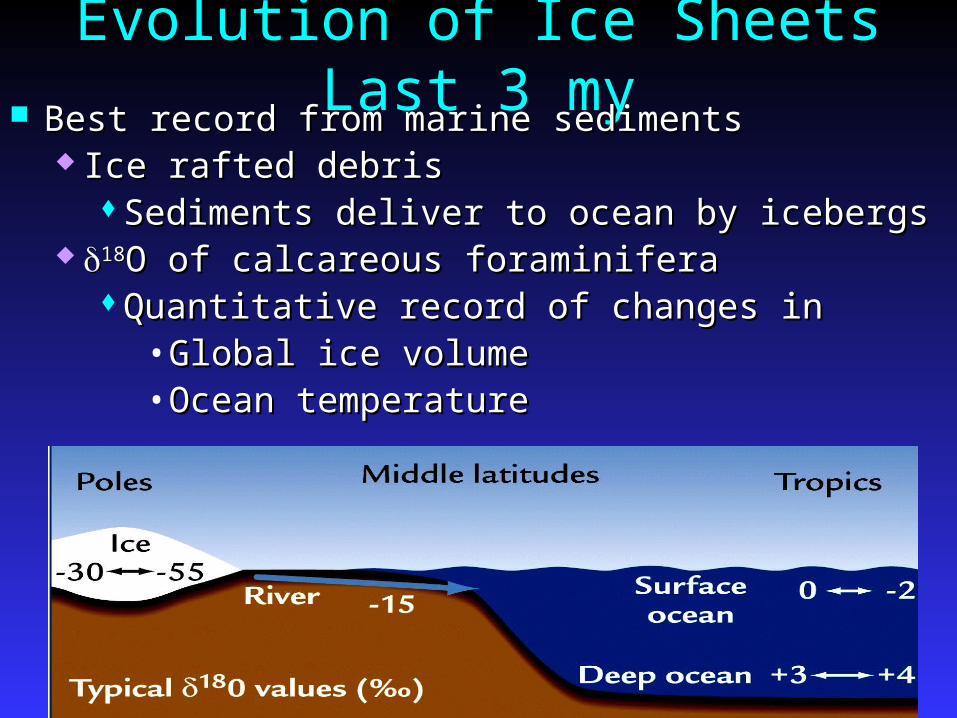
Evolution of Ice Sheets Last 3 my Best record from marine sedimentsBest record from marine sediments
Ice rafted debrisIce rafted debrisSediments deliver to ocean by icebergsSediments deliver to ocean by icebergs
1818O of calcareous foraminiferaO of calcareous foraminiferaQuantitative record of changes inQuantitative record of changes in
•Global ice volumeGlobal ice volume•Ocean temperatureOcean temperature
18O Record from Benthic Foraminifera
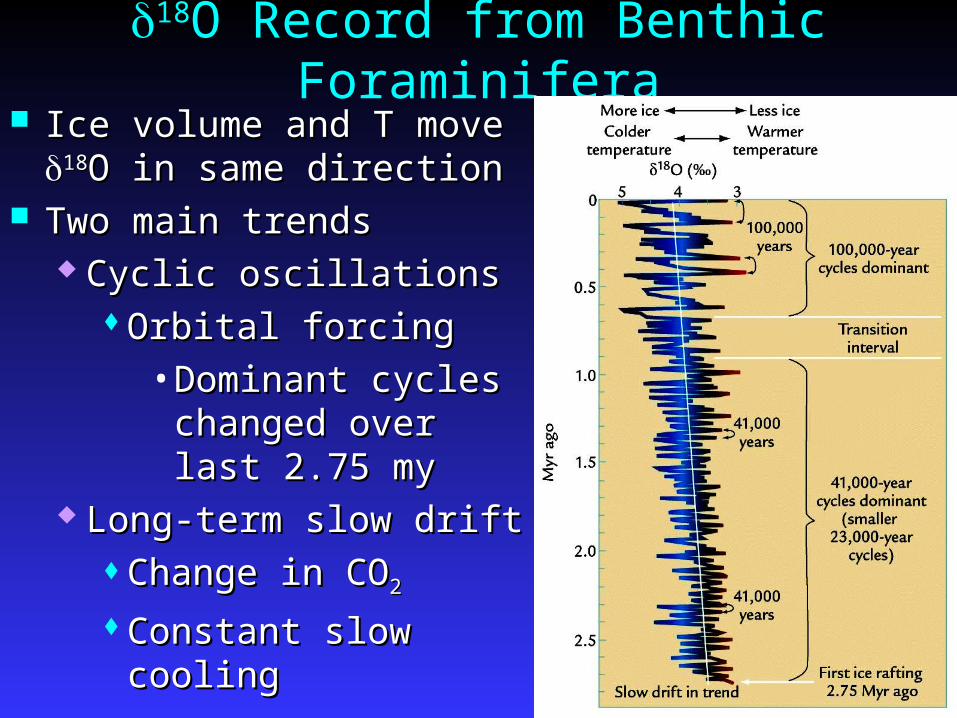
Ice volume and T move Ice volume and T move 1818O in same directionO in same direction
Two main trendsTwo main trends Cyclic oscillationsCyclic oscillations
Orbital forcingOrbital forcing•Dominant cycles Dominant cycles
changed over last changed over last 2.75 my2.75 my
Long-term slow driftLong-term slow driftChange in COChange in CO22
Constant slow Constant slow coolingcooling
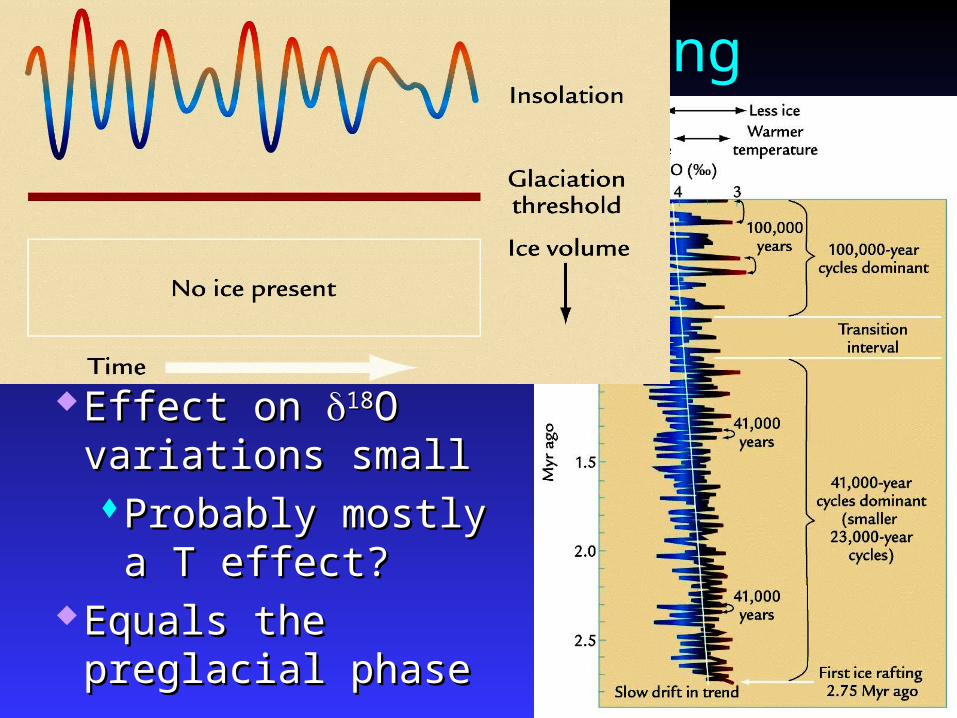
Orbital Forcing Before 2.75 myBefore 2.75 my
No evidence of ice No evidence of ice in N. hemispherein N. hemispherePerhaps COPerhaps CO22 levels too highlevels too high
Effect on Effect on 1818O O variations smallvariations smallProbably mostly a Probably mostly a T effect?T effect?
Equals the Equals the preglacial phasepreglacial phase
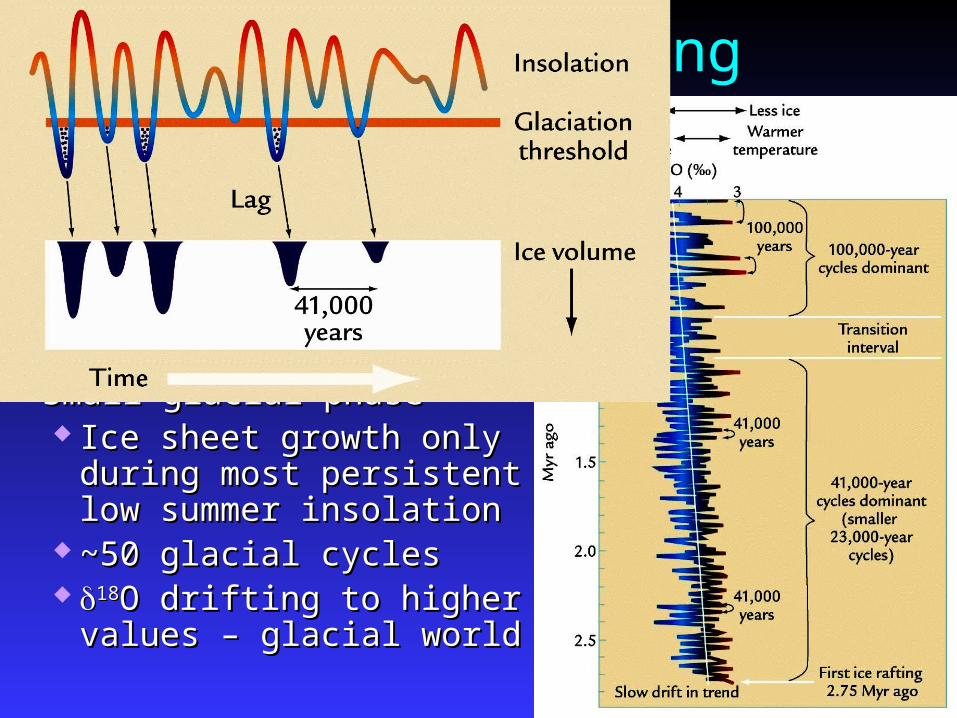
Orbital Forcing 2.75-0.9 my2.75-0.9 my
Ice rafted debris!Ice rafted debris! Variations in Variations in 1818O O
mainly evident in mainly evident in 41,000 year cycle41,000 year cycle Ice sheet growth Ice sheet growth
affects T and affects T and ww
Small glacial phaseSmall glacial phase Ice sheet growth only Ice sheet growth only
during most persistent during most persistent low summer insolationlow summer insolation
~50 glacial cycles~50 glacial cycles 1818O drifting to higher O drifting to higher
values – glacial worldvalues – glacial world
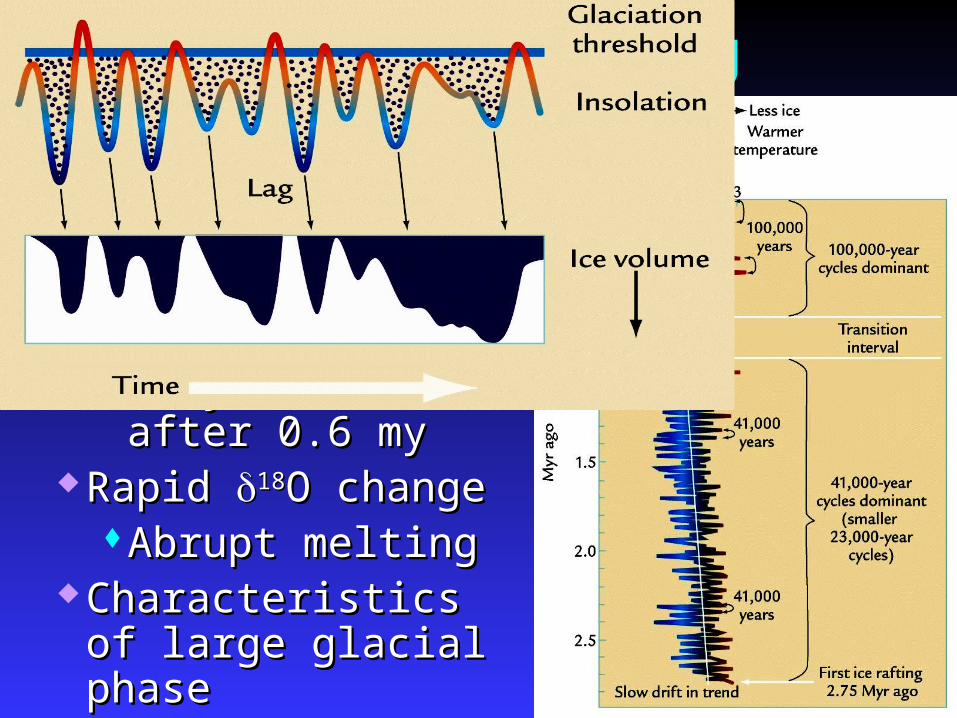
Orbital Forcing After 0.9 myAfter 0.9 my
Maximum Maximum 1818O O values increasevalues increase
100,000 year cycle 100,000 year cycle dominantdominantVery obvious after Very obvious after 0.6 my0.6 my
Rapid Rapid 1818O changeO changeAbrupt meltingAbrupt melting
Characteristics of Characteristics of large glacial phaselarge glacial phase
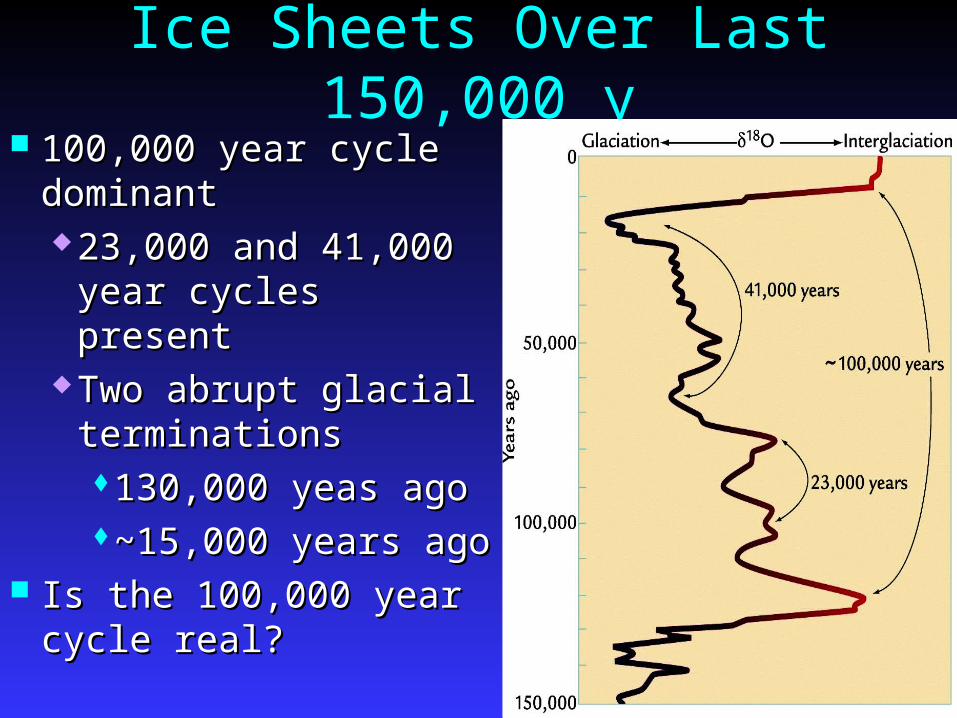
Ice Sheets Over Last 150,000 y 100,000 year cycle 100,000 year cycle
dominantdominant 23,000 and 41,000 23,000 and 41,000
year cycles presentyear cycles present Two abrupt glacial Two abrupt glacial
terminationsterminations130,000 yeas ago130,000 yeas ago~15,000 years ~15,000 years agoago
Is the 100,000 year Is the 100,000 year cycle real?cycle real?
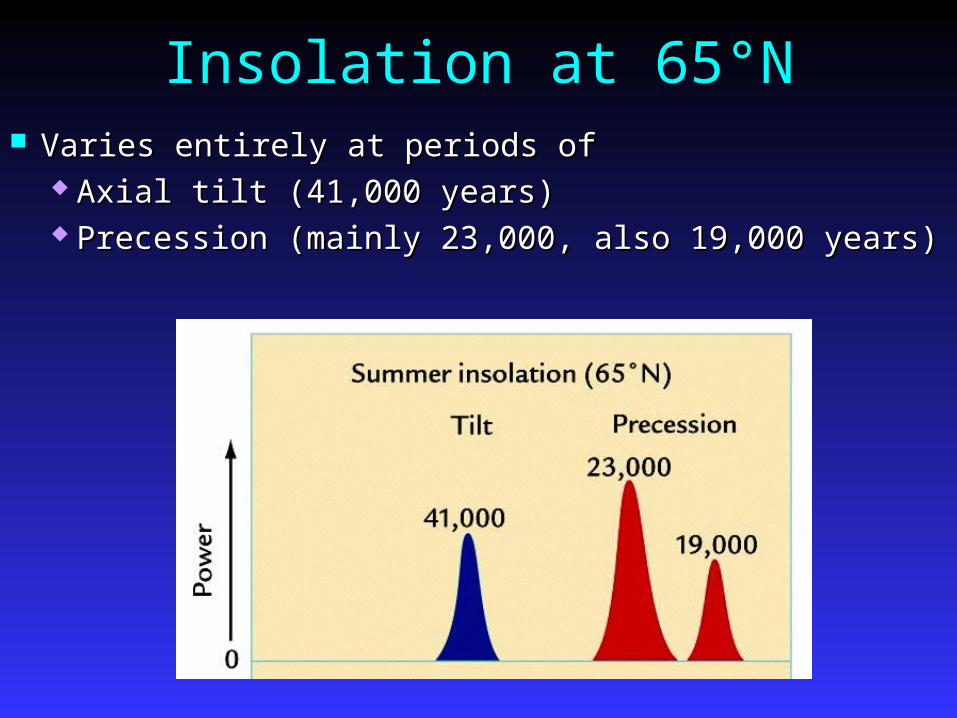
Insolation at 65°N Varies entirely at periods ofVaries entirely at periods of
Axial tilt (41,000 years)Axial tilt (41,000 years) Precession (mainly 23,000, also 19,000 years)Precession (mainly 23,000, also 19,000 years)
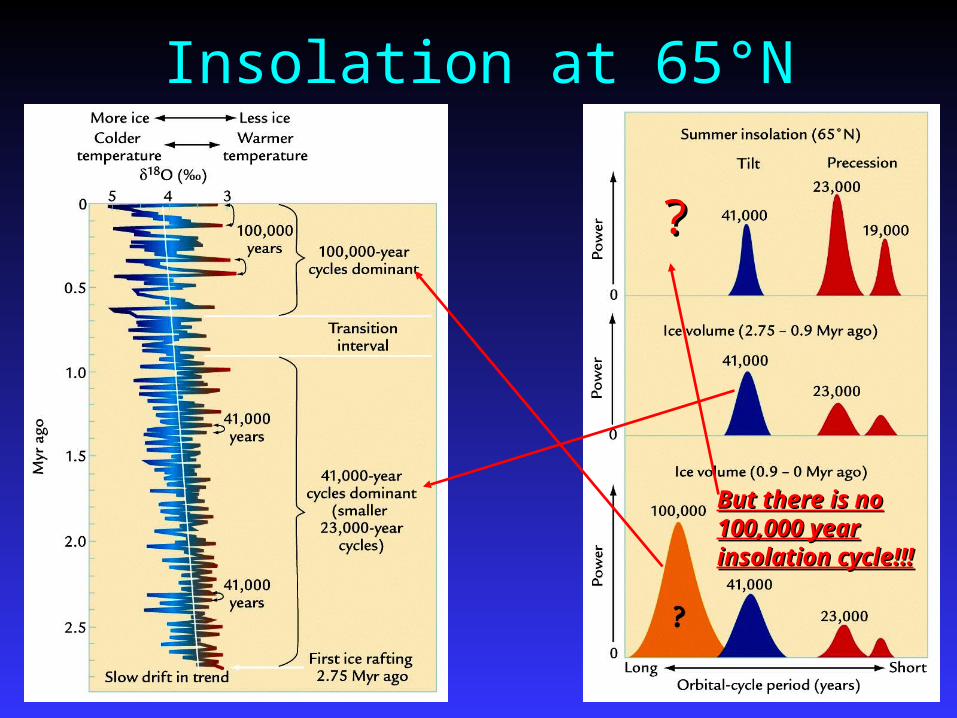
Insolation at 65°N
But there is noBut there is no100,000 year100,000 yearinsolation cycle!!!insolation cycle!!!
??
Confirming Ice Volume Changes
Corals reefs follow sea level and can quantify Corals reefs follow sea level and can quantify change in ice volumechange in ice volume Ideal dipstick for sea levelIdeal dipstick for sea level
Corals grow near sea levelCorals grow near sea levelAncient reefs preserved in geologic recordAncient reefs preserved in geologic recordCan be dated (Can be dated (234234U U 230230Th)Th)
Best sea level records from islands on Best sea level records from islands on tectonically stable platforms (tectonically stable platforms (e.ge.g., Bermuda)., Bermuda)125,000 year old reefs at 6 m above sea 125,000 year old reefs at 6 m above sea
levellevelConfirms shape of Confirms shape of 1818O curve from last O curve from last
150,000 years150,000 years
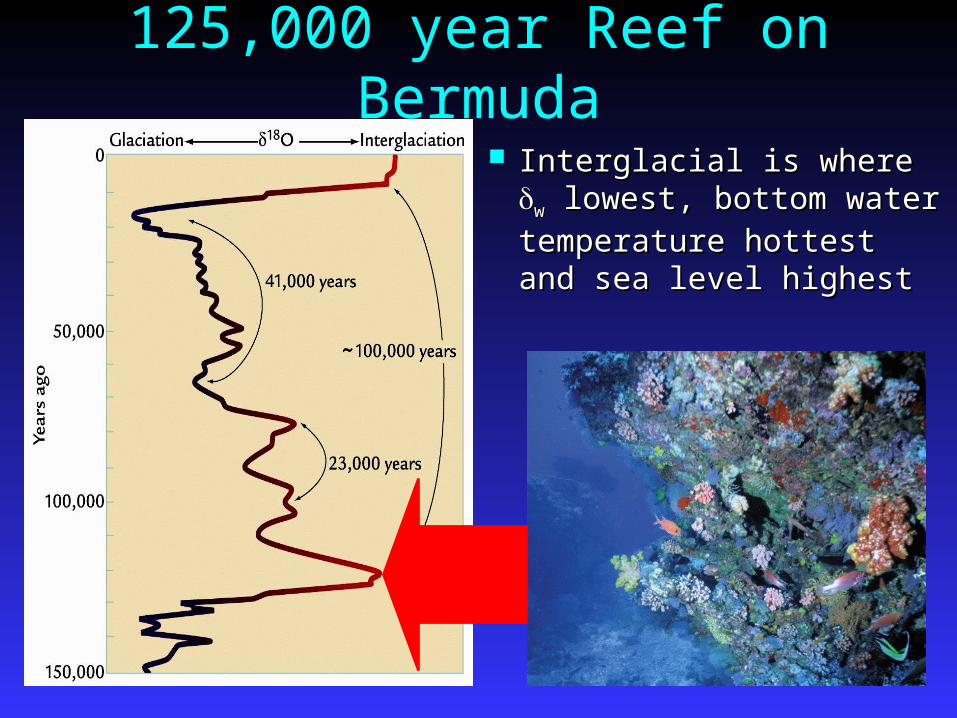
125,000 year Reef on Bermuda
Interglacial is where Interglacial is where ww lowest, bottom water lowest, bottom water temperature hottest temperature hottest and sea level highestand sea level highest
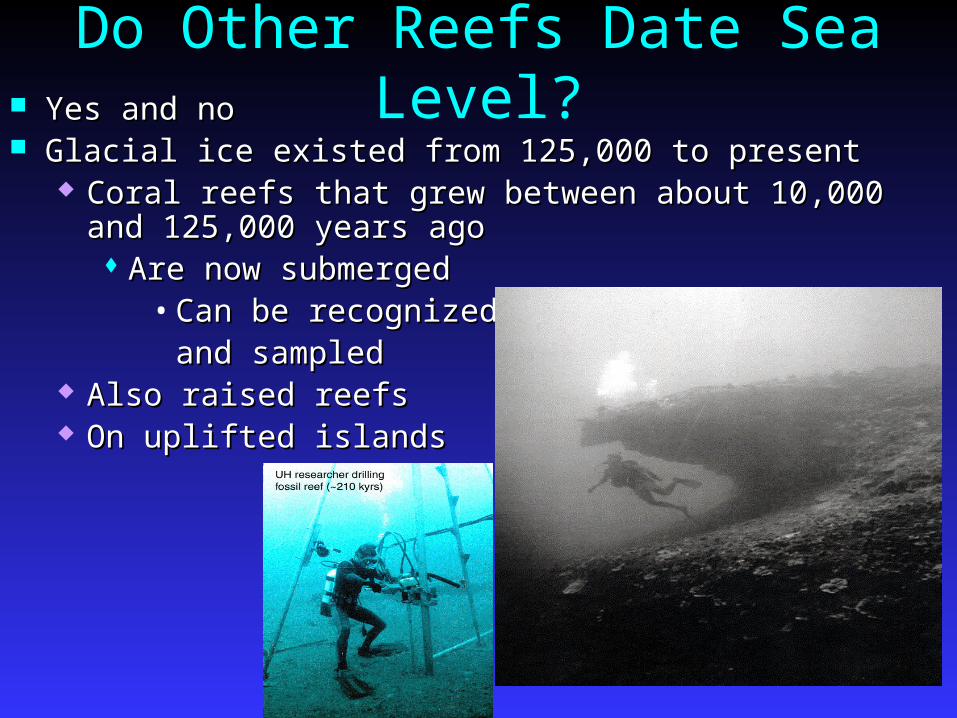
Do Other Reefs Date Sea Level? Yes and noYes and no
Glacial ice existed from 125,000 to presentGlacial ice existed from 125,000 to present Coral reefs that grew between about 10,000 and Coral reefs that grew between about 10,000 and
125,000 years ago125,000 years ago Are now submergedAre now submerged
• Can be recognizedCan be recognizedand sampledand sampled
Also raised reefsAlso raised reefs On uplifted islandsOn uplifted islands
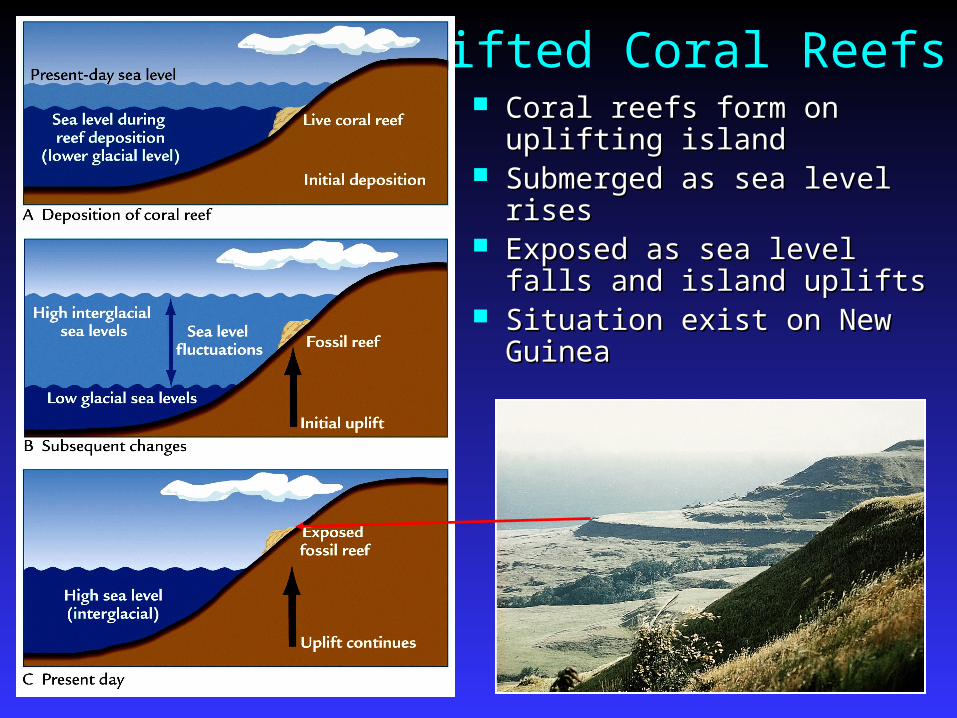
Uplifted Coral Reefs Coral reefs form on Coral reefs form on
uplifting islanduplifting island Submerged as sea level Submerged as sea level
risesrises Exposed as sea level falls Exposed as sea level falls
and island upliftsand island uplifts Situation exist on New Situation exist on New
GuineaGuinea
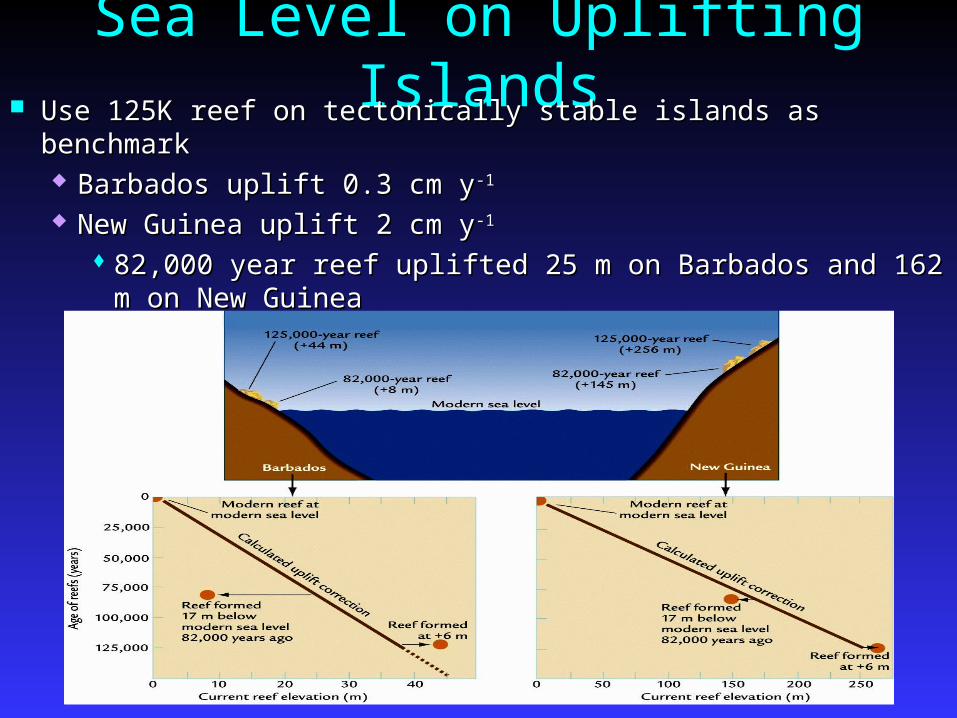
Sea Level on Uplifting Islands Use 125K reef on tectonically stable islands as benchmarkUse 125K reef on tectonically stable islands as benchmark
Barbados uplift 0.3 cm yBarbados uplift 0.3 cm y-1-1
New Guinea uplift 2 cm yNew Guinea uplift 2 cm y-1-1
82,000 year reef uplifted 25 m on Barbados and 162 m 82,000 year reef uplifted 25 m on Barbados and 162 m on New Guinea on New Guinea
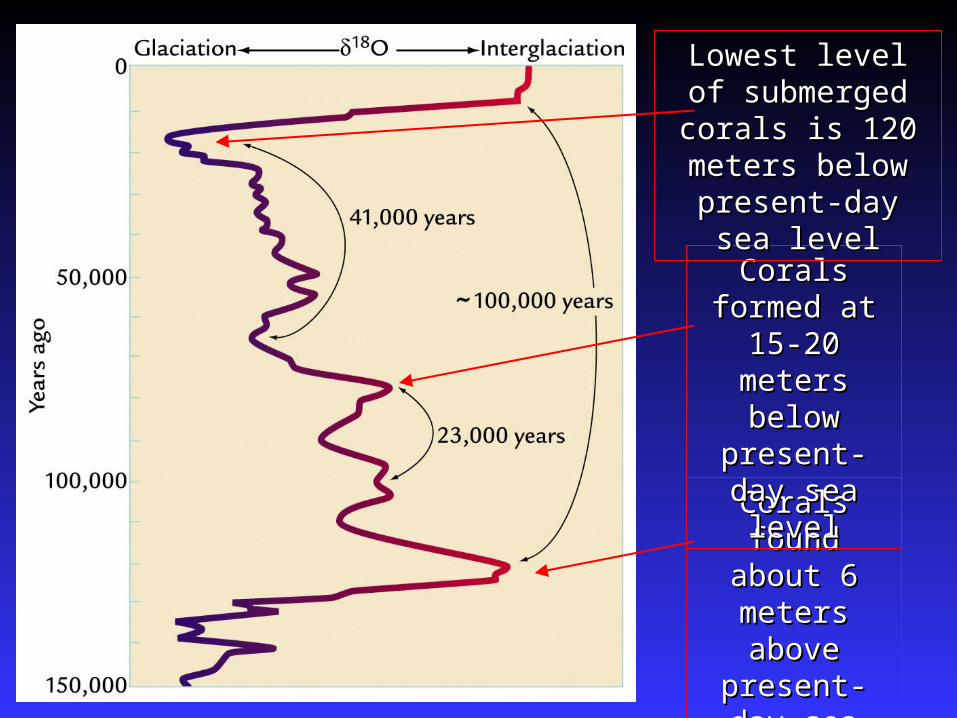
Corals found Corals found about 6 about 6 meters meters above above
present-day present-day sea levelsea level
Corals Corals formed at formed at
15-20 15-20 meters meters below below
present-day present-day sea levelsea level
Lowest level of Lowest level of submerged submerged
corals is 120 corals is 120 meters below meters below
present-day sea present-day sea levellevel
18O records Ice Volume Every 10-m change in sea level produces an Every 10-m change in sea level produces an
~0.1~0.1‰‰ change in change in 1818O of benthic foraminiferO of benthic foraminifer The age of most prominent The age of most prominent 1818O minimaO minima Correspond with ages of most prominent reef Correspond with ages of most prominent reef
recording sea level high standsrecording sea level high standsAbsolute sea levels estimates from reefsAbsolute sea levels estimates from reefs
•Correspond to shifts in Correspond to shifts in 1818OO Reef sea level record agreement with Reef sea level record agreement with
assumption of orbital forcingassumption of orbital forcing125K, 104K and 82K events forced by 125K, 104K and 82K events forced by
precessionprecession
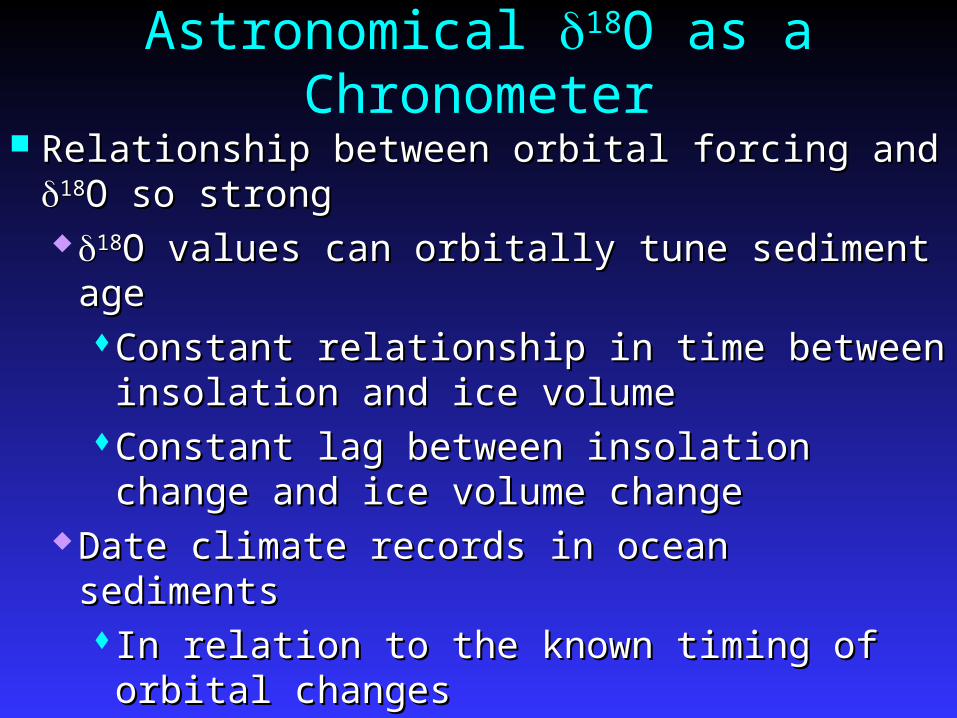
Astronomical 18O as a Chronometer
Relationship between orbital forcing and Relationship between orbital forcing and 1818O so strongO so strong1818O values can orbitally tune sediment O values can orbitally tune sediment
ageageConstant relationship in time between Constant relationship in time between insolation and ice volumeinsolation and ice volume
Constant lag between insolation change Constant lag between insolation change and ice volume changeand ice volume change
Date climate records in ocean sedimentsDate climate records in ocean sedimentsIn relation to the known timing of In relation to the known timing of orbital changesorbital changes
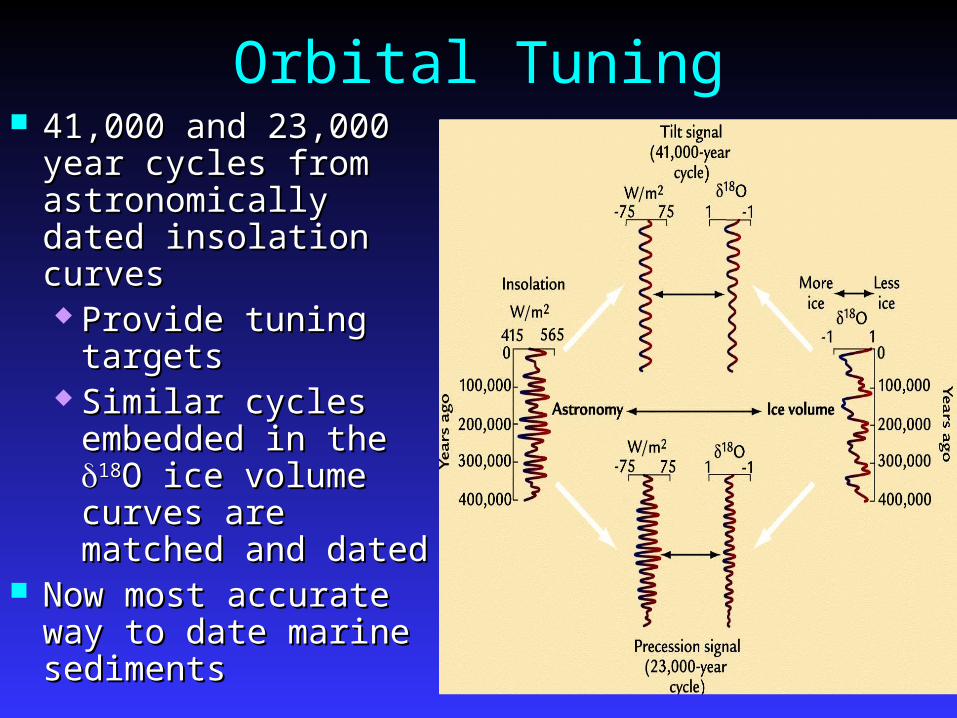
Orbital Tuning 41,000 and 23,000 41,000 and 23,000
year cycles from year cycles from astronomically dated astronomically dated insolation curvesinsolation curves Provide tuning Provide tuning
targetstargets Similar cycles Similar cycles
embedded in the embedded in the 1818O ice volume O ice volume curves are curves are matched and datedmatched and dated
Now most accurate Now most accurate way to date marine way to date marine sedimentssediments