what can we learn from the financial flows of the 2008 ... · what can we learn from the financial...
TRANSCRIPT

What can we Learn from theFinancial Flows of the 2008-2009 Crisis?
Juliane Begenau Saki Bigio Jeremy Majerovitz
HBS UCLA Stanford
Barcelona GSE Summer Forum
June 9, 2015
1 / 77

Introduction
I Financial Crisis ⇒ Crisis in macro theory
I Quick Response ⇒ Army of macro models now
I ...but are shocks and frictions consistent w/ financial flows?
I Here use financial flows to learn about:
1. shocks affecting bank activities2. frictions on banks
2 / 77

Introduction
I Financial Crisis ⇒ Crisis in macro theory
I Quick Response ⇒ Army of macro models now
I ...but are shocks and frictions consistent w/ financial flows?
I Here use financial flows to learn about:
1. shocks affecting bank activities2. frictions on banks
3 / 77

Introduction
I Financial Crisis ⇒ Crisis in macro theory
I Quick Response ⇒ Army of macro models now
I ...but are shocks and frictions consistent w/ financial flows?
I Here use financial flows to learn about:
1. shocks affecting bank activities2. frictions on banks
4 / 77

Frictions in Macro-Finance
I Constraints on external financing
I Market value constraints: banks can divert assetsI Agency conflicts or asymmetric informationI Gertler & Kiyotaki 2010, Jerman & Quadrini 2012, Christiano &
Ikeda 2013, Bigio 2014, Martinez-Miera & Suarez 2014
I Regulatory book value constraintsI Adrian & Shin 2011, Begenau 2015
I Costly asset/balance sheet adjustment
I Fire sales: e.g. Brunnermeier & Sannikov 2014I Debt overhang: e.g. Admati, DeMarzo, Hellwig & Pfleiderer 2014
5 / 77

Frictions in Macro-Finance
I Constraints on external financing
I Market value constraints: banks can divert assetsI Agency conflicts or asymmetric informationI Gertler & Kiyotaki 2010, Jerman & Quadrini 2012, Christiano &
Ikeda 2013, Bigio 2014, Martinez-Miera & Suarez 2014
I Regulatory book value constraintsI Adrian & Shin 2011, Begenau 2015
I Costly asset/balance sheet adjustment
I Fire sales: e.g. Brunnermeier & Sannikov 2014I Debt overhang: e.g. Admati, DeMarzo, Hellwig & Pfleiderer 2014
6 / 77

Frictions in Macro-Finance
I Constraints on external financing
I Market value constraints: banks can divert assetsI Agency conflicts or asymmetric informationI Gertler & Kiyotaki 2010, Jerman & Quadrini 2012, Christiano &
Ikeda 2013, Bigio 2014, Martinez-Miera & Suarez 2014
I Regulatory book value constraintsI Adrian & Shin 2011, Begenau 2015
I Costly asset/balance sheet adjustment
I Fire sales: e.g. Brunnermeier & Sannikov 2014I Debt overhang: e.g. Admati, DeMarzo, Hellwig & Pfleiderer 2014
7 / 77

Frictions in Macro-Finance
I Constraints on external financing
I Market value constraints: banks can divert assetsI Agency conflicts or asymmetric informationI Gertler & Kiyotaki 2010, Jerman & Quadrini 2012, Christiano &
Ikeda 2013, Bigio 2014, Martinez-Miera & Suarez 2014
I Regulatory book value constraintsI Adrian & Shin 2011, Begenau 2015
I Costly asset/balance sheet adjustment
I Fire sales: e.g. Brunnermeier & Sannikov 2014I Debt overhang: e.g. Admati, DeMarzo, Hellwig & Pfleiderer 2014
8 / 77
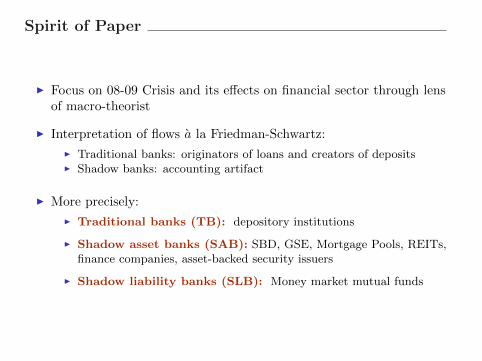
Spirit of Paper
I Focus on 08-09 Crisis and its effects on financial sector through lensof macro-theorist
I Interpretation of flows a la Friedman-Schwartz:
I Traditional banks: originators of loans and creators of depositsI Shadow banks: accounting artifact
I More precisely:
I Traditional banks (TB): depository institutions
I Shadow asset banks (SAB): SBD, GSE, Mortgage Pools, REITs,finance companies, asset-backed security issuers
I Shadow liability banks (SLB): Money market mutual funds
9 / 77

View
I Two key events (shocks):
1. Implosion of shadow banks & absorption by traditional banksI fire-sale shock
2. Equity losses on traditional banksI wealth shock
I Did events impair ability to issue loans and deposits?
I Question fundamental for macro-finance models
10 / 77

Answers depend on
1. Magnitude of shocks:I Magnitude of shadow-bank implosion?
I Magnitude of bank losses?
2. Frictions affecting traditional banking activities:
I Constraints on banks?
I Lessons: How to setup and calibrate models?
11 / 77

This paper
I (Tedious) accounting with theory in mind
I Steps:
1. Quantify flows from shadow to traditional banks (shock 1)2. Quantify traditional bank losses (shock 2)3. Analyze cross-sectional responses (constraints)
12 / 77

Step 1: Aggregate Financial Flows to QuantifyImplosion of Shadow Banks
13 / 77

Traditional Financial System
Reserves
Loans
Deposits
Equity
Bank
Goods
Equity
Borrower
Deposits
Loans
Equity
Saver
14 / 77

Modern Financial System: SB grew to 150% of TB
Reserves
Loans
Deposits
Equity
Bank
Goods
Equity
Borrower
Deposits
Loans
Equity
Saver
CP/Repo
ABS etc
Shadow liability
Shadow assetMMMF
MMMF
CP/RepoABS, MBS and Co
15 / 77
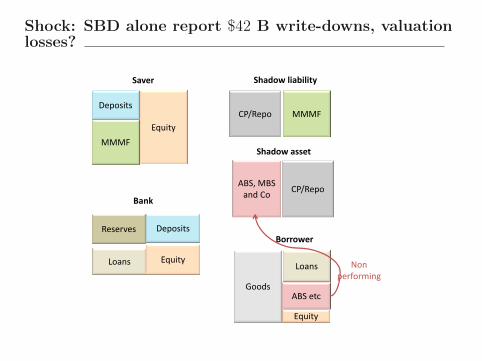
Shock: SBD alone report $42 B write-downs, valuationlosses?
Reserves
Loans
Deposits
Equity
Bank
Goods
Equity
Borrower
Deposits
Loans
Equity
Saver
CP/Repo
ABS etc
Shadow liability
Shadow assetMMMF
MMMF
CP/RepoABS, MBS and Co
Non performing
16 / 77

Unraveling between 2007q3-2009q2
Reserves
Loans
Deposits
Equity
Bank
Goods
Equity
Borrower
Deposits
Loans
Equity
Saver
CP/Repo
ABS etc
Shadow liability
Shadow asset
MMMF
MMMF
CP/RepoABS etc
Run on the REPOCollapse in ABCP
Run on MMMF
ABS etc
Repurchase of MBS by Banks
+Deposits
+Deposits
Shadow Banks: $541 billion net outflow$499 billion increase in traditional banking assets
17 / 77

Accounting Principles
I Where are these numbers coming from?
I Obviously, not-trivial
I Consolidate shadow bank balance sheets...
I Balance sheets shrinking, (by t-accounts) either:I Sales of assets and payout of liabilitiesI Write-down of assets, equity losses
I Assets sold, someone has to buy them...
I Assets lost, someone else has to lose also...
18 / 77
Data
I Most of the time focus on 2007-2011 quarterly
I Flow of Funds
I Bank level data on commercial banks and bank holding companies
I Data on security broker and dealers (FOCUS) filed by SEC
I Annual reports
19 / 77
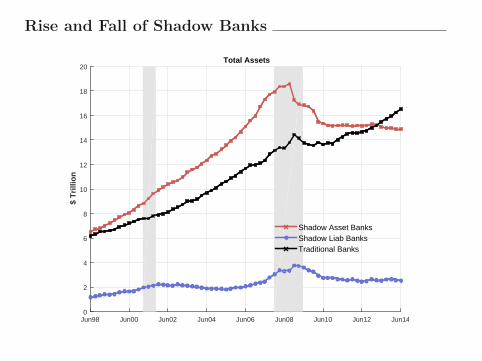
Rise and Fall of Shadow Banks
Jun98 Jun00 Jun02 Jun04 Jun06 Jun08 Jun10 Jun12 Jun14
$ T
rilli
on
0
2
4
6
8
10
12
14
16
18
20 Total Assets
Shadow Asset BanksShadow Liab BanksTraditional Banks
20 / 77

Assets
Total Assets
Mar07 Sep07 Mar08 Sep08 Mar09 Sep09 Mar10 Sep10 Mar11 Sep11
$ T
rilli
on
Ch
ang
e
-1.5
-1
-0.5
0
0.5
1
Shadow Asset BanksShadow Liab BanksTraditional Banks
21 / 77

Asset Flows: Diff 2007 Q3 and 2009 Q2
I SAB: −$879 billion
I SLB: $805 billion / Caveat: mixes prime with gov funds
I TB: $912 billion
I TARP: $426.4 billion of which $157.28 billion at least benefited TB
I What about redefinitions?
I Goldman Sachs and Morgan Stanley now traditional banks
I Holding companies with few deposits
I Broker dealer subsidiaries stay in SBD section of the FoF
I But GS and MS ∆ in SBD assets absorbed within holding company→adjust SAB asset for GS and MS
I Effect of Adjustment: SAB outflow −$1346 billion
I Shadow sector: net outflow of $541 billion
22 / 77

Upper bound of what TB did absorb?
I 2007q3-2009q2
I Adjusting TB inflows by CB in GS or MS holdings
I $912 billion increase in TB assets of which $413 GS and MS
I TB: absorbed at most $499 billion from SB
I What securities needed to be absorbed and from whom?
I SBD, borrowed securities Detail
I GSE & Mortgage-pools, mortgages Detail
I Asset-backed security issuers Detail
23 / 77

SBD Gains and Losses
I Annual reports from large SBD
I Reported writedowns $46.1 Billion
24 / 77

Back of the Envelope
I Shadow banking institution: net outflow of $541 billion
I Write-downs: $46.1B
I TB assets increased by $499B , only $495B could come from theshadow
I Puzzle $-4.1 billion?I ”Natural growth” in TB activity (TBD compute detrended flows)
I Gross ammounts (double counting)?
I Central bank
I Institutional Investors
I Realization of losses
I Book versus market value accounting
25 / 77

Step 2: Traditional Sector Equity Losses
26 / 77

Data
I This section...
I BHC level data from FR Y-9C and CRSP
I Aggregate series corrected by dropping new entrants (e.g. MS, GS,AXP, etc.)
27 / 77

Major Drivers of Losses and Profits
−60
−40
−20
020
40
2000q1 2002q1 2004q1 2006q1 2008q1 2010q1 2012q1 2014q1
Net Income (−) Provision for Loan LossesNet Gains from Securities Trading Revenue
US
D B
illio
n
Major Drivers of Losses and Profits
28 / 77

Trading Revenue Components
−30
−20
−10
010
20
2000q1 2002q1 2004q1 2006q1 2008q1 2010q1 2012q1 2014q1
Trading Revenue Interest Rate ExposuresCredit Exposures
US
D B
illio
n
Total, Interest Rate Exposures, and Credit ExposuresTrading Revenue:
29 / 77

Decomposition of Charge-Offs
010
2030
40
2000q1 2002q1 2004q1 2006q1 2008q1 2010q1 2012q1 2014q1
Other IndividualLoansCandI RELoans
US
D B
illio
n
Net Charge−Offs
30 / 77

Within Real-Estate Charge-Offs
05
1015
20
2000q1 2002q1 2004q1 2006q1 2008q1 2010q1 2012q1 2014q1
Farm+Foreign CommercialResidential Construction
US
D B
illio
n
Real Estate Net Charge−Offs
31 / 77

How did the losses show up in equity?
32 / 77

Book Equity vs. Market Capitalization
400
600
800
1000
1200
1400
US
D B
illio
n
2000q1 2002q1 2004q1 2006q1 2008q1 2010q1 2012q1 2014q1
Equity Equity (Public BHCs)Market Capitalization
Book Equity and Market Capitalization of BHCs
33 / 77

Book vs. Market Equity of Big Four
010
020
030
00
100
200
300
2000q1 2004q1 2008q1 2012q1 2000q1 2004q1 2008q1 2012q1
Bank of America Citigroup
J.P. Morgan Wells Fargo
Equity Market Capitalization
US
D B
illio
n
34 / 77

Facts
I Two Notions...
I Losses Accumulated Over Recession:
1. Book Value Gains of 173 Billion
2. Market Value Losses of 656 Billion
3. Equity Issuances of 147 Billion
I Very little action in books...
35 / 77

Differences in Book and Market?
I From cross-section...more than only price of risk
I Bank incentives to delay acknowledging losses
I Regulation: better capital ratioI Corporate Control: better numbers to shareholders
I + flexibility to delay losses (Laux and Leuz JEP 2010)
36 / 77

Differences in Book and Market?
I From cross-section...more than only price of risk
I Bank incentives to delay acknowledging losses
I Regulation: better capital ratioI Corporate Control: better numbers to shareholders
I + flexibility to delay losses (Laux and Leuz JEP 2010)
37 / 77

Are books missing something?
I Test whether market cap is picking up important information
I log(MarketCap/BookEquity) = α+ βX + ε
I β reflects effect on market cap beyond effect on book equity
I Test regressors that should provide information about bank’s valueI Return on Book EquityI Return on Book Equity One Year LaterI Delinquent Loans to Book EquityI Total Dividends to Book Equity
I Compare results before (2006 Q1) and after crisis (2009 Q1)
38 / 77

Tobin’s Q and RoE (Cross-Sectional)
−3
−2
−1
01
2T
obin
’s Q
(Lo
gged
)
−.1 −.05 0 .05 .1Return on Book Equity (Trimmed)
2006 Q1 Fitted values2009 Q1 Fitted values
Tobin’s Q and Return on Book Equity
39 / 77

Tobin’s Q and RoE Next Year
−3
−2
−1
01
2T
obin
’s Q
(Lo
gged
)
−.1 −.05 0 .05 .1Return on Book Equity Next Year (Trimmed)
2006 Q1 Fitted values2009 Q1 Fitted values
Tobin’s Q and Return on Book Equity Next Year
40 / 77

Tobin’s Q and Delinquency Rates (Cross-Section)
−3
−2
−1
01
2T
obin
’s Q
(Lo
gged
)
0 .2 .4 .6 .8 1Delinquent Loans to Equity (Trimmed)
2006 Q1 Fitted values2009 Q1 Fitted values
Tobin’s Q and Delinquent Loans to Equity
41 / 77

Tobin’s Q and Dividend Rate (Cross-Section)
−3
−2
−1
01
2T
obin
’s Q
(Lo
gged
)
0 .01 .02 .03 .04 .05Total Dividend Rate (Trimmed)
2006 Q1 Fitted values2009 Q1 Fitted values
Tobin’s Q and Total Dividend Rate
42 / 77

Market data seems better
I Market data driven by:
I Profits & Future ProfitsI Loan DelinquencyI Dividends
I Oaxaca Decomposition: 43% to 45% of Drop in Logged Tobin’s Qcan be explained by these four regressors
I Takeaway: info in market cap not in books
43 / 77

Why are book/market values relevant?
I Market Cross-section: tells us who lost wealth
I Book Cross-section: who acknowledged losses
I ...relevant to learn bank constraints
44 / 77
Step 3: Constraints on Bank Activities
45 / 77

Traditional Sector
I ”Fire-Sale Shock” Outflow from shadow banking system totraditional banks: $495B
I ”Wealth Shock” Market value losses of 656 Billion (803 Billion Lostand 147 Billion New Equity)
I Effects on bank activities?
I Answer depends on constraints...(this section)
46 / 77

Illustrate different constraints
I Two period bank optimization model
I Prices and demands exogenous
I Choose flow: equity e, dividend div, riskless assets c, loans l, whetherto acknowledge losses
I Net-worth Nt, deposits Dt, loans Lt, riskless assets Ct
I Constraints:
I Regulatory
I Market value
I Assets: e.g. fire sale
I Liabilities: e.g. debt overhang
47 / 77

Bank Problem
Normalized by stock of loans L0
W(D0, ε0;F0, p, R
L)
= max{div,c,l,e}∈R+
4Q (e) + U (div) + . . .
+βE[max
(0, (1− ε1)
(RLl + 1
)+ C1 −D1
)]subject to
λ (l) l + pC1 −D1 = W1
and
W1 = pe− div −D0
48 / 77

Frictions
I Regulatory constraints (can choose to acknowledge losses)
L1 ≤κ
(1− κ)((C1 −D1) + max {ε0, 0})
I Liability constraints (downward stickiness)
D1 ≥ δD0
I Market-based constraints:
E[V
(NM
1
L1− ε1
)]≥ V
(ξλ (l)
RL
).
I Fire-sale function: λ (l)
I Equity adjustment costs: Q (e)
49 / 77

This Section
I Book-based constraints irrelevant:I Banks can “slow down” accounting
I Sticky assets and liabilities?
I Wealth shocks and “market-based” constraints:I Induce decrease in leverage
I Shocks ⇒ Wealth ⇓, Market-Leverage ⇑
50 / 77

Leverage
510
1520
2530
2000q1 2002q1 2004q1 2006q1 2008q1 2010q1 2012q1 2014q1
Book Leverage Market Leverage
Leverage Ratios
51 / 77

Frictions in Equity Issuance?
I Banks issued lots of equity, but not enough to undo the losses
I Anecdotal: hard to issue enough equity after hit by losses
52 / 77

Equity Issuances (Levels Since 2000 Q1)
050
010
0015
00U
SD
Bill
ion
2000q1 2002q1 2004q1 2006q1 2008q1 2010q1 2012q1 2014q1
Market Capitalization Summed Equity Issuances
Levels of Market Capitalization and Equity Issuances
53 / 77
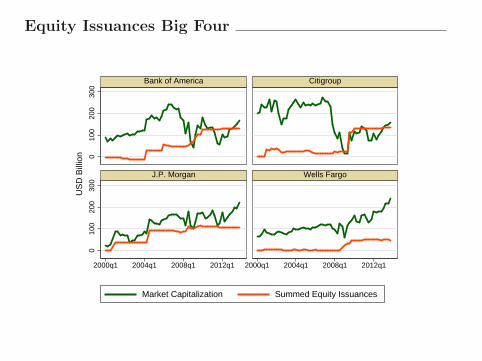
Equity Issuances Big Four
010
020
030
00
100
200
300
2000q1 2004q1 2008q1 2012q1 2000q1 2004q1 2008q1 2012q1
Bank of America Citigroup
J.P. Morgan Wells Fargo
Market Capitalization Summed Equity Issuances
US
D B
illio
n
54 / 77

Irreversibility of Leverage in the Cross-Section
I Can banks de-lever in the cross-section?
I Estimate a dynamic market-equity elasticity of liabilities
I Idea:I Market-equity describes wealthI Poorer, more market-constrained banks should reduce liabilitiesI Did we see this?I Similarly: did we see a reduction in loans, liquid assets such as cash
and liquid liabilities such as repos?
55 / 77

Liabilities vs. Market Capitalization (Log Differences)
−1
01
2Li
abili
ties
(Log
Diff
eren
ces)
−4 −2 0 2Market Capitalization (Log Differences)
2006 Q1 Fitted values2009 Q1 Fitted values
Change in Logs Over Past Three YearsLiabilities and Market Capitalization
56 / 77
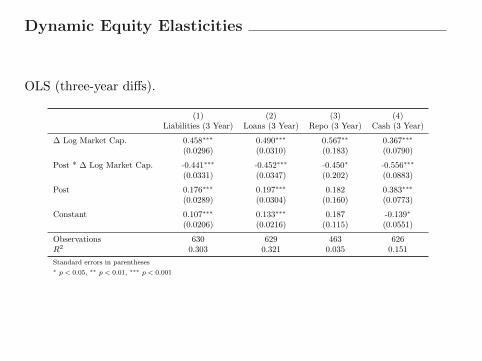
Dynamic Equity Elasticities
OLS (three-year diffs).
(1) (2) (3) (4)Liabilities (3 Year) Loans (3 Year) Repo (3 Year) Cash (3 Year)
∆ Log Market Cap. 0.458∗∗∗ 0.490∗∗∗ 0.567∗∗ 0.367∗∗∗
(0.0296) (0.0310) (0.183) (0.0790)
Post * ∆ Log Market Cap. -0.441∗∗∗ -0.452∗∗∗ -0.450∗ -0.556∗∗∗
(0.0331) (0.0347) (0.202) (0.0883)
Post 0.176∗∗∗ 0.197∗∗∗ 0.182 0.383∗∗∗
(0.0289) (0.0304) (0.160) (0.0773)
Constant 0.107∗∗∗ 0.133∗∗∗ 0.187 -0.139∗
(0.0206) (0.0216) (0.115) (0.0551)
Observations 630 629 463 626R2 0.303 0.321 0.035 0.151
Standard errors in parentheses∗ p < 0.05, ∗∗ p < 0.01, ∗∗∗ p < 0.001
57 / 77

Discussion: illiquid liabilities a constraint?
I Illiquid liabilities: (can’t turn away depositors)
I Some highly liquid (e.g. Repo)
I If illiquid liabilities constraint:I Repo elasticity should be higher than non-Repo during the crisis
I Result: Repo elasticity also zeroI Constrained banks should be picking a corner solution
I But: Most banks have some liquid liabilities during the crisis
58 / 77

Composition of Liabilities
2000 2002 2004 2006 2008 2010 20120
20
40
60
80
100P
erce
ntBHC Liabilities Composition
DepositsFed Funds PurchasedTrading LiabilitiesOther
2000 2002 2004 2006 2008 2010 2012
6
7
8
9
10
Tril
lion
$
Liabilities
59 / 77

Deposits as a Share of Liabilities
01
23
45
Den
sity
0 .2 .4 .6 .8 1Deposits as a Share of Liabilities
2006 Q1 2009 Q1
Deposits as a Share of Liabilities
60 / 77

Deposits / Liabilities (Weighted by Liabilities)
01
23
4D
ensi
ty
0 .2 .4 .6 .8 1Deposits as a Share of Liabilities
2006 Q1 2009 Q1
Deposits as a Share of Liabilities (Weighted by Total Liabilities)
61 / 77

Repo as a Share of Liabilities
05
1015
20D
ensi
ty
0 .05 .1 .15 .2Repo as a Share of Liabilities (Trimmed)
2006 Q1 2009 Q1
Repo as a Share of Liabilities
62 / 77

Repo / Liabilities (Weighted by Liabilities)
02
46
8D
ensi
ty
0 .05 .1 .15 .2Repo as a Share of Liabilities (Trimmed)
2006 Q1 2009 Q1
Repo as a Share of Liabilities (Weighted by Total Liabilities)
63 / 77

Discussion: Sticky Leverage
I Hard to sell assets or unwillingness to sell assets?
I If illiquid assets constraint:I Poorer banks should have:I sold off liquid assets, reduce liquid liabilities
I Data: Dynamic equity elasticity of cashI negative: poorer banks increased reserves
I Caveats:I Bigger losses ⇒ liquidity demand (omitted variable bias)
I Alternative: dynamic debt-overhangI Shareholders: prefer maintain high leverage
64 / 77
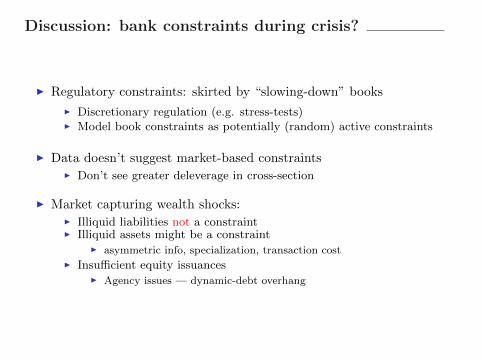
Discussion: bank constraints during crisis?
I Regulatory constraints: skirted by “slowing-down” books
I Discretionary regulation (e.g. stress-tests)I Model book constraints as potentially (random) active constraints
I Data doesn’t suggest market-based constraintsI Don’t see greater deleverage in cross-section
I Market capturing wealth shocks:I Illiquid liabilities not a constraintI Illiquid assets might be a constraint
I asymmetric info, specialization, transaction costI Insufficient equity issuances
I Agency issues — dynamic-debt overhang
65 / 77

Conclusion - Takeaway Insights
I Two numbers: measure size of implosion of shadow-banks and lossesto traditional banks.
I Modeling Constraints:
I Different class of constraints than pop in macro literatureI Wealth shocks: illiquid assets (+deposits) + agency frictions
66 / 77

End
67 / 77

Drivers of Market LossesDep variable: log market cap growth (2006 Q1 to 2009 Q1)Regressors: (2006 Q1).
(1) (2) (3) (4) (5) (6)
MBSMarketCap. 0.261∗∗
(0.0841)
LoansMarketCap. -0.0837∗ 0.158∗
(0.0323) (0.0751)
RELoansMarketCap. -0.137∗∗∗ -0.296∗∗∗
(0.0355) (0.0836)
CDSSoldMarketCap. 0.0196
(0.0856)
CDSNetMarketCap. 2.652
(2.789)
Constant -1.229∗∗∗ -0.740∗∗∗ -0.657∗∗∗ -0.810∗∗∗ -1.082∗∗∗ -1.078∗∗∗
(0.0677) (0.140) (0.120) (0.139) (0.0491) (0.0490)
Observations 306 306 306 306 306 306R2 0.031 0.022 0.047 0.061 0.000 0.003
Standard errors in parentheses∗ p < 0.05, ∗∗ p < 0.01, ∗∗∗ p < 0.001
68 / 77

Security Brokers & Dealers: Total Assets
Jun90 Jun94 Jun98 Jun02 Jun06 Jun10 Jun13
US
$ T
rillio
n
0.5
1
1.5
2
2.5
3
3.5
4
4.5
5 Total Financial Assets
69 / 77

Lion Share: Other Securities
Jun90 Jun94 Jun98 Jun02 Jun06 Jun10 Jun13
US
$ T
rillio
n
0
0.5
1
1.5
2
2.5
3
REPOTotal Government SecuritiesTotal Private SecuritiesOther Securities
70 / 77

Other Securities: Mostly Borrowed Securities
Jun90 Jun94 Jun98 Jun02 Jun06 Jun10 Jun13
US
$ T
rillio
n
0
0.5
1
1.5
Borrow SecuritiesUnidentified Misc
Net of receivables due and payables owed to other SBD, largely cashcollateral associated with securities lending transactions
71 / 77

Security Brokers & Dealers: Liabilities
Jun90 Jun94 Jun98 Jun02 Jun06 Jun10 Jun13
US
$ T
rillio
n
0
0.5
1
1.5
2
2.5
3
3.5
REPOCredit Market InstrumentsOther LiabilitySecurity Credit
back
72 / 77

Asset-backed Security Issuers: Assets
Jun91 Jun94 Jun97 Jun00 Jun03 Jun06 Jun09 Jun12
US
$ T
rillio
n
0
0.5
1
1.5
2
2.5
3
3.5
4
4.5
5 Asset-backed Security Issuers - Assets
Government Sec. MortgagesConsumer CreditSec. Business Loans
73 / 77

Asset-backed Security Issuers: Liabilities
Jun91 Jun94 Jun97 Jun00 Jun03 Jun06 Jun09 Jun12
US
$ T
rillio
n
0
0.5
1
1.5
2
2.5
3
3.5
4
4.5
5 Asset-backed Security Issuers - CP Liabilities
Commercial PaperCorporate Bonds
back
74 / 77

Agency-and GSE-backed mortgage pools: Assets
Jun99 Jun02 Jun05 Jun08 Jun11
US
$ T
rillio
n
0
1
2
3
4
5
6 #Mortgages
Home Multifamily residentialCommercialFarm
75 / 77

Government-Sponsored Enterprises (GSEs): Assets
Jun99 Jun02 Jun05 Jun08 Jun11
US
$ T
rillio
n
0
1
2
3
4
5
6
7 #Mortgages
ShortMortgagesCredit Mkt Instrument other than Mortgages
76 / 77

back
77 / 77