what can history teach us a retrospective examination of ... · consistently forecast future energy...
TRANSCRIPT
LBNL-50498 May 2002
1
Annu. Rev. Energy Environ. 2002. 27:X--Xdoi:<10.1146/annurev.energy.27.122001.083425 >
Copyright © 2002 by Annual Reviews. All rights reservedCRAIG n!GADGIL n!KOOMEY
LONG-TERM ENERGY FORECASTS
<doi>10.1146/annurev.energy.27.122001.083425</doi >
1056-3466/02/1121/XXXX$14.00
WHAT CAN HISTORY TEACH US? A RetrospectiveExamination of Long-Term Energy Forecasts for the United States
Paul P. Craig1, Ashok Gadgil2, and Jonathan G. Koomey3
1Sierra Club Global Warming and Energy Program, 623 Lafayette Street, Martinez,
CA 94553; e-mail: [email protected] Environment Department, Lawrence Berkeley National Laboratory, 1
Cyclotron Road, MS 90-3058, Berkeley, CA 94720;e-mail: [email protected] Use Forecasting Group, Lawrence Berkeley National Laboratory, 1 Cyclotron
Road, MS 90-4000, Berkeley, CA 94720; e-mail: [email protected]
Key Words Global Warming Climate Change Prediction Planning
n!Abstract This paper explores how long-term energy forecasts are created and
why they are useful. It focuses on forecasts of energy use in the United States for theyear 2000 but considers only long-term predictions, i.e., those covering two or more
decades. The motivation is current interest in global warming forecasts, some of whichrun beyond a century. The basic observation is that forecasters in the 1950--1980
period underestimated the importance of unmodeled surprises. A key example is the
failure to foresee the ability of the United States economy to respond to the oilembargos of the 1970s by increasing efficiency. Not only were most forecasts of that
period systematically high, but forecasters systematically underestimateduncertainties. Long-term energy forecasts must make assumptions about both
technologies and social systems. At their most successful, they influence how people
act by showing the consequences of not acting. They are useful when they provideinsights to energy planners, influence the perceptions of the public and the energy

LBNL-50498 May 2002
2
policy community, capture current understanding of underlying physical and
economic principles, or highlight key emerging social or economic trends.
It is true that at best we see dimly into the future, but those who acknowledgetheir duty to posterity will feel impelled to use their foresight upon what facts
and guiding principles we do possess. Though many data are at present wanting
or doubtful, our conclusions may be rendered so far probable as to lead to furtherinquiries… (1:4)
1. INTRODUCTION
This paper explores how long-term energy forecasts are created and why they are useful.
By long-term, we mean forecasts with a time horizon of more than two decades.
Measuring the success of such forecasts is much more difficult than assessing theaccuracy of models of physical systems. Because human beings change, constantly
inventing new technologies and restructuring their social networks, no methodology can
consistently forecast future energy demand with accuracy.A good forecast can illuminate the consequences of action or inaction and thus lead to
changes in behavior. Although these changes may invalidate a specific numericalprediction, they emphasize, rather than detract from, the forecast's importance. One may
judge a forecast successful if it (a) helps energy planners, (b) influences the perceptions
of the public or the energy policy community, (c) captures the current understanding ofunderlying physical and economic principles, or (d) highlights key emerging social or
economic trends.Energy forecasting has been compared to using automobile headlights, which help
drivers avoid obstacles in the road ahead. However, the analogy does not go far enough.
It may be a foggy night. The headlights may fail to illuminate adequately the pathforward, causing one to miss the sign pointing to the crucial exit from the freeway or
notice too late a large rock fallen on the road. Failure to acknowledge imperfections inforecasting can therefore lead to misjudgments.
This paper addresses these issues. We examine the methods available to energy
forecasters. We describe a range of methods, demonstrating their strengths and

LBNL-50498 May 2002
3
weaknesses through historical examples. We consider issues of risk, uncertainty, and
public perception that influence how forecasts are received and present a number ofprescriptions for avoiding the pitfalls and for exploiting the capabilities of the various
modeling techniques. Though centered around energy forecasting, our recommendationsshould apply equally well to any field in which technical and policy concerns interact or
decisions have to be made under conditions of extreme uncertainty.
The paper is organized as follows. In this section we discuss why we forecast. Section2 is a review of the uses of long-range energy forecasts. In Section 3 we summarize
major types of long-range energy forecasts and their respective strengths and weaknesses.Section 4 addresses the issues of risk from decisions based on the uncertain forecasts of
energy demand. Section 5 discusses the technical quality, public attention, and policy
impact of energy forecasts. In Section 6 we present our observations for both theforecasting community and the users of these forecasts. Section 7 summarizes our
conclusions.
1.1. Why Do We Forecast?Forecasts have become an essential tool of modern society. It is hard to imagine a
government action or investment decision not based in some way on a forecast. Forexample, investment decisions in power plants or home insulation are routinely assessed
using economic techniques that require assumptions about future energy prices, which
depend in part on assumptions about future energy demand. New technologies often
come into existence if someone anticipates a market.
Commenting on environmental forecasting, Bella points out that
...changes [in the environment] can be accomplished one at a time as if they wereessentially in isolation from each other. Moreover, only a small part of the
environment and only a few environmental properties must be understood inorder to produce a change. In contrast, to foresee the consequences of change
requires that one examine the combined effect of many changes (2:15)
Global climate change is a particularly salient example of an environmental problem
whose solution requires very long-range forecasting, imperfect though it may be. At its
best forecasting contributes to better social decision-making and minimizes adverse side
effects, both direct and indirect.

LBNL-50498 May 2002
4
1.2. What Makes a Good Forecast?Energy forecasters working in the aftermath of 1970s oil shocks expended enormouseffort in projecting future energy trends. Because 2000 is a round number, it was
routinely used as an end-point. Today we can look back. As Figure 1 shows, the
forecasts summarized in a review by the U.S. Department of Energy (DOE) variedenormously (3). Actual U.S. energy use in 2000, which we have superimposed on the
graph, was at the very lowest end of the forecasts. Energy use turned out to be lower thanwas considered plausible by almost every forecaster. The Lovins scenario, discussed
below (which is not included in the DOE review) is an exception.
Figure 1 Projections of total U.S. primary energy use from the 1970s. The figureis redrawn from a Department of Energy report (3) and simplified from a summaryof dozens of forecasts. Actual use at the end of the century [105 exajoules (4)] isindicated. Forecasters clearly did not anticipate the ability of the economy to limitgrowth of energy use. Note that the figure suppresses the zero baseline. Sources forthe individual curves may be found in Reference 3.
In long-range forecasting "success" is a highly subjective term, and as explained inSection 2, the measure of success hinges on the intended use of the forecast. Long-term
forecasts are primarily useful for the perspectives they give to current users at the timethe forecasts are freshly generated, not to future users.

LBNL-50498 May 2002
5
Perhaps the most interesting reason why a model might fail is that predicting problems
can lead to changes that avoid them. In this sense failure would in fact indicate thesuccess of the model. Much global climate change modeling has the goal of providing
information intended to affect the future. As we discuss below, retrospective interviewsconcluded that some of the forecasts referred to in this article did indeed influence policy
(5).
Long-run forecasting models generally assume that there exist underlying structuralrelationships in the economy that vary in a gradual fashion. The real world, in contrast, is
rife with discontinuities and disruptive events, and the longer the time frame of theforecast, the more likely it is that pivotal events will change the underlying economic and
behavioral relationships that all models attempt to replicate.
Models always have static components, but except for invariant physical laws, there isnothing static in the economy. Energy forecasting necessarily makes assumptions about
human behavior (including social, institutional, and personal) and human innovation.
Institutional behavior evolves, individual behavior changes, and pivotal events occur,affecting outcomes in ways we cannot anticipate. Static models cannot keep pace with the
long-term evolution of the real world, not just because their data and underlyingalgorithms are inevitably flawed, but because the world sometimes changes in
unpredictable and unforeseeable ways. Further, data are always limited and incomplete.
Important characteristics of the energy/economy system may not be measured or aretracked by companies that do not make the data public.
1.3. Long-Range Energy Forecasts Are Not ValidatableHodges & Dewar (6) distinguish between what they call "validatable" and"nonvalidatable" models. In their terminology, validatable models have the potential to
yield predictions of the future in which one can have high confidence. Whereasnonvalidatable models can have many useful features, they are likely to have low
precision and unquantifiable errors.
Situations describable by validatable models are characterized by four properties:1. they must be observable,
2. they must exhibit constancy of structure in time,

LBNL-50498 May 2002
6
3. they must exhibit constancy across variations in conditions not specified in the
model, and
4. they must permit collection of ample and accurate data.
In some instances it is possible to forecast precisely and confidently. Astronomical andsatellite orbital predictions are a clear example. Satellite orbits can be calculated with
enormous precision because orbital mechanics passes these tests. This precision makes
possible technologies such as the satellite-based global positioning system.The fact that a model is validatable does not necessarily mean all properties of the
future outcome can be predicted to any desired accuracy. Both quantum mechanics andchaos theory assess and quantify fundamental limits on prediction.
The situations modeled by long-range energy forecasting tools do not meet criteria 2
and 3 in the list above. Consequently, long-range forecasting models are not validatablein Hodges & Dewar's sense.
2. USES OF LONG-RANGE ENERGY FORECASTS
In spite of being nonvalidatable in the sense of Hodges & Dewar (6), long-rangeforecasting is useful. This section, which combines ideas from Hodges & Dewar (6) and
Greenberger (5), discusses why. We observe that accurately forecasting the future doesnot appear in the discussion.
2.1. Use 1: Bookkeeping DevicesIn this use models are a means to condense masses of data and to provide incentives forimproving data quality. Consider an energy forecasting model that disaggregates energy
use by economic sector, and within each sector by broad end-use category. Using this
model to forecast future energy demand, even by trend projections, may point to a lack ofgood data in some end uses or sectors, thus inducing better data collection. Comparing
energy supply data with energy use data may disclose inconsistencies due to reportingerrors, overlooked categories, losses, etc. For this purpose a model can be considered
useful if it confirms that outputs correctly add up to inputs, or if its use reveals
shortcomings in existing data quality and induces improvements in the quality of datacollected in the future.

LBNL-50498 May 2002
7
Forecasts that disaggregate to high levels of detail are necessarily complex and data
intensive. This type of forecast can only be carried out with large staff and substantialbudgets. Such detailed forecasts may be required for applications focusing on details of
specific sectors (e.g., assessing sectoral carbon dioxide emissions). One should be carefulin using such forecasts, because deeply buried assumptions may drive high-level results
in ways that are not easy to understand.
2.2. Use 2: Aids in Selling Ideas or Achieving Political EndsWithin a month of the first oil embargo, President Nixon (then battling Watergate and
under pressure to respond aggressively to OPEC cutbacks in production) announced
"Project Independence," an energy plan that was claimed would lead to the reduction ofU.S. oil imports to zero by 1980 (7). Figure 2 shows the proposed energy trajectory.1. As
was almost immediately predicted by some energy experts, the goal failed (8). Importswere higher in 1980 than in 1973 (9).
Figure 2 President Nixon's "Project Independence" plan of 1973 to reduce U.S.oil imports to zero by 1980. The plan failed. The quantity plotted is U.S. oil use.The figure has been redrawn and converted to metric units. The original captionread, "Self-sufficiency by 1980 through conservation and expanded production."
1 This graph had little or no analytical basis. It was a sketch to support a policy goal (P.P. Craig, personalcommunication)

LBNL-50498 May 2002
8
A more subtle example is shown in Figure 3. This is from a 1962 report prepared by
the Atomic Energy Commission (10). It was designed to sell nuclear power plants bymaking the argument for sustained growth in electricity demand. The analysis was based
on historic growth rates of total electricity and optimistic projections of the costs ofnuclear power. The citation is a Congressional hearing that includes testimony describing
the kinds of reasoning used. We discuss some of this reasoning below (see Figures 4 and5 and the accompanying discussion). As a result of this optimism, utilities subsidizedearly nuclear plant orders (often with considerable help from the government, such as the
Price Anderson Act limiting liability). Following the Organization of Arab PetroleumExporting Countries (OAPEC) oil embargo of 1973 and the oil shock in 1979, electricity
growth rates dropped to a few percent per year. The cost of nuclear plants did not decline
as predicted, and by the 1980s orders for new plants vanished.
Figure 3 An Atomic Energy Commission forecast from 1962, designed to showdemand for nuclear power plants. The curve of interest here shows electricitydemand. The authors judgmentally assumed a growing nuclear market share.Actual electricity and nuclear electricity in 2000 is indicated (10).
LBNL-50498 May 2002
9
An analysis may be used to provide an appearance of concern and attention for the
benefit of constituents or the general public. It is not uncommon for advocates to citereports selectively or out of context for promotional purposes. Similarly, studies may be
used to provide a cover (“fig leaf”) of technical respectability to a decision actually basedon hidden values or self-interest.
Should a policy decision turn out to be ineffective, a politician may try to avoid
personal criticism by implicating the analyst. Officials routinely take credit for successbut disavow responsibility for failure. A DOE administrator put it this way: “Analysts
must learn there is no fame for them in this business” (5).Studies can be commissioned as a delaying tactic. When all responses look like
political losers, a decision-maker may commission an analysis to gain time and
maneuverability. As additional facts come to light, the problem might resolve itself or acompromise might be arranged.
Government agencies sometimes commission studies to moderate overly ambitious
goals (e.g., as embodied in acts of Congress or presidential proclamations) toward morereasonable expectations.
2.3. Use 3: Training AidsThe applicable measure of success here is the degree to which the forecast can prompt
learning and induce desired changes in behavior. The Limits to Growth model (discussed
below) has been widely used to help students understand the counterintuitive nature ofdynamical systems (11). Simulations and role-playing games have also been used to
teach executives in the utility industry how new markets for SO2 emissions permits or
electric power might behave. Experience with exercising these types of models canimprove intuition for the behavior of complex systems (12--14).
2.4. Use 4: Automatic Management Systems Whose Efficacy Does Not Require theModel to be a True RepresentationHodges & Dewar use the example of the Kalman filter, which can be used to control (for
example) the traffic on freeway on-ramps. These filters can model traffic flow, but onlyin a stochastic representation that does not pretend to be exact and validated, just useful.
Similar filters can also be embedded in management systems controlling power systems
or factory processes. As long as the model cost-effectively controls the process in

LBNL-50498 May 2002
10
question, the issue of whether it is an exact representation of reality is not of concern.
Neural networks fall into this category (15).
2.5. Use 5: Aids in Communication and EducationBy forcing analysts to discuss data and analysis results in a systematic way, forecasting
models can facilitate communication between various stakeholders. The measure ofsuccess for this use is the degree to which the model improves understanding and
communication, both for individuals and between groups with different mindsets andvocabularies.
For example, the population of a developing country at some future time might depend
on childhood survival rates, longevity, female literacy, affluence, income distribution,health care, and nutrition. Modeling these influences could permit better understanding of
interlinkages between them and improve communication between expert groups withdiverse backgrounds. Such a model could inform, for instance, a government's long-term
plans. Another example is the U.S. DOE's Energy Information Administration (EIA)
Annual Energy Outlook forecast (16). This widely used forecast, based on the EIA’slatest analysis of the current data and industry expectations, provides a baseline that
others can and do use for their own explorations of the future.When a problem is being analyzed, word leaks out and leads to suggestions, ideas, and
information from outside parties. This can add to the analysis directly, or stimulate
helpful complementary work by others. A politician facing a thorny problem mightcommission a study to locate knowledgeable people. Thus, studies can identify talent as a
by-product. The National Academy of Sciences CONAES (Committee on Nuclear and
Alternative Energy Systems). study, one of those assessed in the DOE review of forecastsfrom the 1970s (Figure 1) (5), was directly or indirectly responsible for many career
shifts. The American Physical Society "Princeton Study" held during the summer of 1973was explicitly designed with this intent (17). The oil embargos of the 1970s had led many
physicists to think about making career shifts. The study gave them an opportunity to
learn about energy issues, to meet and get to know experts, and to find jobs.
2.6 Use 6: To understand the Bounds or Limits on the Range of Possible OutcomesModels can enhance confidence through limiting or bounding cases. The Princeton Study
referred to in Use 5 includes many examples (17). This study emphasized energy

LBNL-50498 May 2002
11
efficiency, with a focus on physical constraints to energy use. The cornerstone of the
analysis was the concept of fundamental physical limits such as the first and second lawsof thermodynamics. This work showed that great potential existed for improving
efficiency by engineering change. Energy efficiency became a major theme of energypolicy and remains so to this day.
2.7 Use 7: Aids to Thinking and HypothesizingForecasts can help people and institutions think through the consequences of theiractions. Researchers often begin their exercises with baseline or “business-as-usual”
forecasts, which attempt to predict how the world will evolve assuming current trends
continue. Alternative forecasts are then created to assess the potential effects of changesin key factors on the results. For example, an economic forecaster might use such an
analysis to assess the likely effects of a change in property taxes on economic growth in aparticular state.
Computer forecasting is an excellent tool to teach people the dynamics of complex
systems (12, 13). The behavior of these systems is often counterintuitive, so suchforecasting games can help people learn to manage them better. For example, systems
dynamics models (described below) were used in the 1960s to explain why building"premium" housing in urban areas can under some plausible circumstances accelerate,
rather than slow, migration to suburbs (14:5)1.1 Urban renewal generally seeks to make down-town regions more attractive. Undersome circumstances these programs can drive up home prices to the point that they
drive away more people than they attract.
Some forecasts are generated as part of scenario exploration exercises, which can behelpful any time a person or institution faces a critical choice. Oil companies, for
example, are well aware that at some point the transportation sector may have to switchto some other fuel. Even though this switch may be a long time in the future, the prospect
needs to be part of current contingency planning. Considering a wide range of scenarios
can help institutions prepare for the many different ways the future can evolve.Institutions use forecasts to allocate physical and personnel resources. Some businesses
have massive infrastructures with long time constants and find it useful to forecast overdecades. (18)

LBNL-50498 May 2002
12
3. TYPES OF FORECASTS
Forecasters have available to them a considerable tool kit. Armstrong discussed
forecasting techniques in 1978, and two decades later edited the most comprehensivereview of forecasting principles of which we are aware (15, 19). Armstrong's handbook
discusses and assesses many types of forecasting, including some techniques (e.g., neural
nets) not to our knowledge used at all in long-range energy forecasting. The Journal of
Forecasting publishes technical articles on virtually every technique [see also (2, 20,
21)]. The most-used long-term forecasting methodologies fall into six categories: trendprojections, econometric projections, end-use analysis, combined approaches, systems
dynamics, and scenario analysis. Each approach reflects a certain world view, which is
often embodied in hidden assumptions. We describe these approaches and illustrate themwith examples.
Forecasting is impossible in the absence of some sort of (explicit or implicit) view of
how the part of the world of interest works. Even the simplest approaches to forecastingrequire deciding which variables to use. Energy use might be hypothesized to evolve as a
function of time alone. A historical graph, on semi-log paper, of energy consumptionversus time would show that this relation worked remarkably well over considerable
periods. Alternatively, one might hypothesize that energy is linked with economic output.
This approach is illustrated in Figure 4, below.It is important to distinguish between approaches based on what is likely, and those
based on what is possible. The most common approach is to predict what is likely tohappen given continuation of current trends. The second approach is to assess what is
possible, given hypothesized societal choices such as changes in government policy (22).
Trend projection and econometric methods are typically strongest when used in the firstway, whereas end-use, systems dynamics, and scenario analysis are generally most useful
in assessing ranges of policy choices.
3.1. Trend ProjectionsThe simplest assumption is that the future will be a smooth extension of the past. Key
variables are identified and described in terms of time trends or correlation with other

LBNL-50498 May 2002
13
variables. The simplest and oldest trend approach is drawing straight lines on graph
paper. Two-parameter fits can easily be made using linear, log-linear, log-log, or othertransformations.
STRENGTHS AND WEAKNESSES Trend projections rely on empirical correlations. Theapproach can work well in the absence of structural change (i.e., for short-term forecasts).
It is also helpful for business-as-usual forecasts, which generally see the future as a
smooth continuation of historical growth rates. Trend projections often assume(sometimes implicitly) the presence of exponential processes. The “exponential
assumption" is so deeply embedded that economists often use terms like "steady state" or"constant" to refer to fixed rates of change (e.g., fixed GDP growth rates) rather than
fixed levels.
A major weakness in trend-projection approaches is that they discourage searches forunderlying driving forces. Typically these models do not include causality and cannot
identify emerging contradictions, both of which can be critical in understanding how the
future might unfold.
EXAMPLE: DUPREE & WEST For several decades prior to the 1973 OAPEC oil
embargo, U.S. energy use was empirically correlated with GDP (gross domestic product).In such forecasts, energy use was projected to continue increasing in lockstep with GDP.
The embargo led to increased attention to energy efficiency, destroying the historic
correlation. Prior to the 1973 embargo, the last official U.S. government forecast for 2000(23) projected total primary energy use of 201 exajoules (EJ), based on an expected
exponential growth rate of 3.6% per year over the forecast period. This was comparableto growth rates observed in the preceding two decades. Actual primary energy use in
2000 was 103 EJ, so the Dupree & West forecast overestimated by nearly a factor of two.
By 1975, Dupree had modified the forecast to reflect the postembargo realities of higherprices and additional government policies (24), so the new estimate came in at 172 EJ in
2000 (still more than a 65% overestimate).EXAMPLE: STARR Figure 4 shows an example in which energy use was correlated
with GNP (gross national product) (25). The author assumed both that a relation that
worked with high precision for several decades would continue and that GNP growth
LBNL-50498 May 2002
14
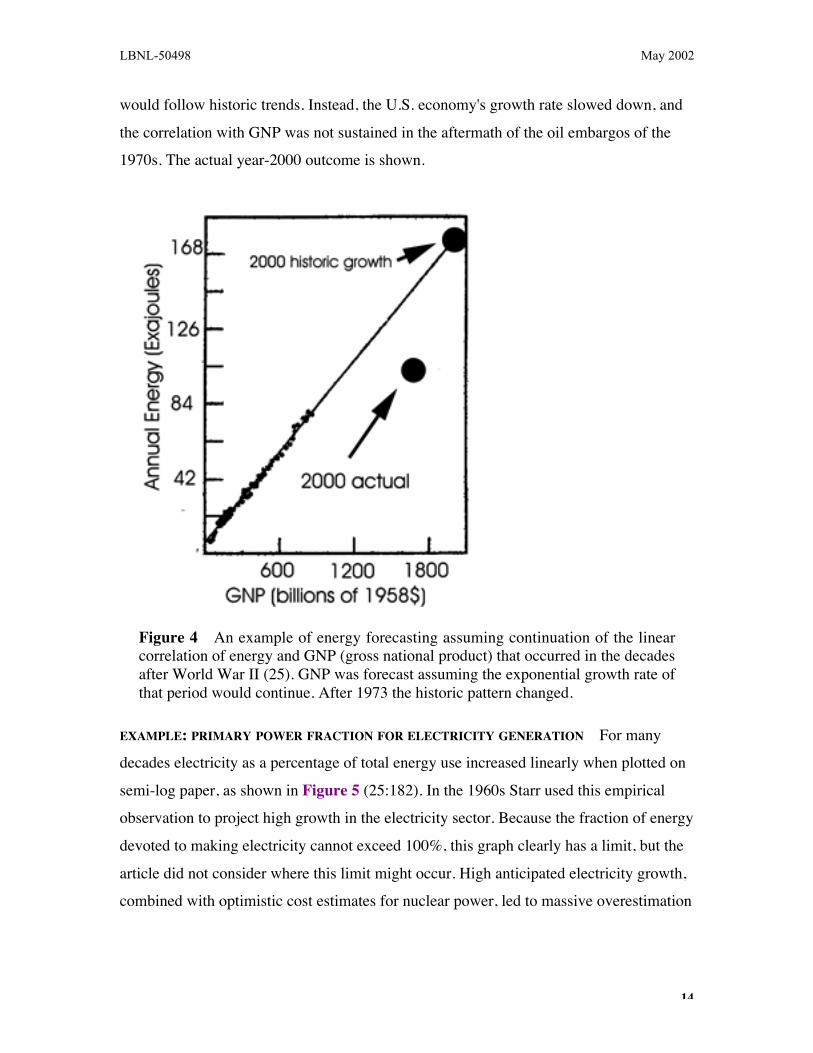
would follow historic trends. Instead, the U.S. economy's growth rate slowed down, and
the correlation with GNP was not sustained in the aftermath of the oil embargos of the1970s. The actual year-2000 outcome is shown.
Figure 4 An example of energy forecasting assuming continuation of the linearcorrelation of energy and GNP (gross national product) that occurred in the decadesafter World War II (25). GNP was forecast assuming the exponential growth rate ofthat period would continue. After 1973 the historic pattern changed.
EXAMPLE: PRIMARY POWER FRACTION FOR ELECTRICITY GENERATION For manydecades electricity as a percentage of total energy use increased linearly when plotted on
semi-log paper, as shown in Figure 5 (25:182). In the 1960s Starr used this empiricalobservation to project high growth in the electricity sector. Because the fraction of energy
devoted to making electricity cannot exceed 100%, this graph clearly has a limit, but the
article did not consider where this limit might occur. High anticipated electricity growth,combined with optimistic cost estimates for nuclear power, led to massive overestimation

LBNL-50498 May 2002
15
of future demand for electric power generation, and especially for nuclear power plants.
Note that the analysis has no economic component whatsoever.
Figure 5 Energy input to electricity as a percentage of total energy (25). Starrassumed that the fraction of primary energy used for electricity generation wouldcontinue at the historic exponential growth rate of 2.6% per year. Whereas thistrend obviously has a limit at 100%, Starr appeared to believe it could continueuntil the end of the twentieth century, when the trend suggested 50%. The actualfraction in 2000, 33%, is indicated.
3.2 Econometric ProjectionsEconometric approaches are a straightforward extension of trend analysis. The approach
is made possible by modern computers. Whereas trend analysis is basically a graphical

LBNL-50498 May 2002
16
technique used with one independent variable, computers make it easy to explore
relations among many hypothesized causal variables. Dependent variables, such asenergy consumed or carbon emissions, may be correlated with independent variables
such as price and income.Econometric analysis relies on regression analysis of historical data and thus assumes
structural rigidity in the economy. Sanstad et al. note that some proponents of this method
have proclaimed the importance of dynamic market forces, whereas their preferredanalytical technique assumes economic rigidity (26).
STRENGTHS AND WEAKNESSES Just as for trend projections, the strength of econometrictechniques is in short-term forecasts, when structural changes and technology adoption
are limited in their effects because of the inherent lags in stock turnover. They become
less useful for longer time frames, because of the greater likelihood that the pastexperience on which the econometric parameters are based will no longer reflect future
conditions.
Despite their complexity, econometric models do not necessarily outperform thesimpler trend-projection approach to regression forecasting. Huss (27) concluded from
his analysis of the accuracy of utility forecasts during 1972--1982 that “in all sectors,econometric techniques fail to outperform trend extrapolation/judgmental techniques.”
Whereas this result may not be general, it points toward one of the key conclusions of
Armstrong (15), that simple models can sometimes yield results as accurate as morecomplicated techniques.
EXAMPLE: THE HUDSON/JORGENSEN PROJECTION In 1979 Hudson and Jorgensenforecast U.S. primary energy use in 2000. We focus on their forecast because of the
authors’ prominence in the energy forecasting community, but we could have picked any
number of other econometric forecasts for this example. Theirs was among the severaldozen studies summarized in the DOE review (3) and shown in Figure 1. Their forecast
assumed crude oil prices of roughly $25/barrel and electricity prices of about 6¢/kWh in2000 dollars. In fact, these were about the average prices for those energy sources in
2000. Although the projected prices were comparable to actual prices, the total
consumption in their forecast was 168 EJ, more than a 60% overestimate.
LBNL-50498 May 2002
17
Sanstad et al. (26) show that 1980 forecasts of this type yield correct year 2000
consumption if one replaces the assumed energy prices with much higher values. That is,agreement can be forced by using energy prices several times higher than those that
actually prevailed in 2000. Sanstad et al. argue that the failure of these models resultsfrom their inability to treat endogenous technological change. Jorgensen has in recent
years been one of the major proponents of incorporating better representations of
technological change in such models (28).
3.3. End-Use AnalysisThe end-use analysis approach disaggregates the energy sector into technologically
distinct subsectors. Total projections are built up from detailed sectoral analyses ofvarious end uses (e.g., lighting, cooling, refrigeration, heating, etc.). This approach begins
by asking, “Who uses how much energy for what purposes?” Thus, it first focuses on theservices that use the energy, then on the technological characteristics of the devices
delivering those energy services (17, 29).
STRENGTHS AND WEAKNESSES Because these models explicitly represent end uses andthe associated technologies, it is relatively easy to incorporate anticipated changes in
technology and policy (e.g., automotive, refrigerator, heating plant, or lighting efficiencystandards). The explicit characterization of equipment ownership in these models also
allows saturation effects to be assessed (e.g., the saturation of residential central air
conditioning will not greatly exceed 100% of the homes in any region; automobilemileage is constrained by the amount of time people are willing to spend traveling, etc.).
Furthermore, because the approach embodies detailed representations of technologies,
end-use analysis can account for physical limits (e.g., Carnot limitations or second-lawefficiency constraints).
A downside of the end-use approach may be tendencies among practitioners towardexcessive technological optimism or pessimism. Optimism places excess emphasis on
new structure-changing technological devices, which may fail technically or in the
marketplace. Conversely, pessimism results from preoccupation with incrementalimprovements to existing technologies, which may lead to overlooking structure-

LBNL-50498 May 2002
18
changing innovations. These approaches often fail to capture the impact of interactions
between price and income within the larger economy.
EXAMPLE: ENGINEERING ECONOMIC APPROACHES During the 1970s scientists
developed detailed engineering-economic analyses of the potential for energy efficiency.The first major technical study was carried out by the American Physical Society (17).
The approach was institutionalized and systematized by analysts at the California Energy
Commission and Lawrence Berkeley Laboratory (29). The general conclusion ofessentially all these “bottom-up” analyses was that energy efficiency was far below levels
that made economic sense from a societal perspective. The 1973 and 1979 oil shocksgave impetus to a focus on efficiency and resulted in major changes in the relationship
between energy use and economic output, changes that remain in place today.
EXAMPLE: MARKET SATURATION LIMITS Compressor-based air conditioning wasintroduced in the Sacramento, CA valley in the 1960s. By the late 1970s, when nearly all
of the households in the Sacramento Valley had air conditioners, an argument based on
saturation suggested that substantial future growth of air conditioner electricity demandin this sector and region was unlikely. This reasoning was a central part of the California
Energy Commission's (correct) conclusion in the 1970s that electricity growth rates werelikely to slow down. In this instance the “limiting case” might have turned out to be
misleading had people decided to cool their homes more than in the past, or to build
larger houses than anticipated in the business-as-usual forecast. In fact, total electricityuse for residential air conditioning did not change much in absolute terms from 1975 to
1999. (30). The results of the technical analysis eventually were embodied in state, andlater federal, law. The result was lowered electricity demand and cancellation of orders
for many anticipated power plants (29).
3.4. Combined ApproachesCombined approaches employ both regression methods, when trends appear to be robust,
and end-use analysis when it appears to provide more insight. This kind of approach is
being used increasingly in both industry and government, and especially by the utilityindustry (27, 31, 32).

LBNL-50498 May 2002
19
STRENGTHS AND WEAKNESSES Combined approaches bring together engineers and
economists, allowing them to draw upon the best analytical tools of each. Typically end-use, engineering-based, approaches are supplemented by parametric models that
characterize economic behavior [such as usage elasticities in the Energy InformationAdministration's National Energy Modeling System (4)].
EXAMPLE: RESOURCES IN AMERICA’S FUTURE The study "Resources in America's
Future," published in 1963 by the then-new Resources for the Future (RFF), was alandmark assessment of the demand and supply of all major U.S. resources from 1960--
2000 (33). The study combined economic and technical analysis. Economic factors weredrawn primarily from U.S. government reports. The authors did a considerable amount of
bottom-up trend analysis, supplemented by their professional judgment. Some
assumptions are grounded in the laws of thermodynamics, but most energy technologiesare so far from fundamental limits that these laws provided minimal constraint. Rather,
technological innovation and human behavior were the dominant factors, and these
factors proved hard to anticipate.The study's lead author, Hans Landsberg, revisited the report two decades later (34).
His perspective was philosophical: "[O]ne is a captive of the time of writing orcalculating, typically without realizing it." In his retrospective review Landsberg
remarked on the consequences of the failure to anticipate the oil embargos of the 1970s
(illustrated in Figure 6). The 1960--1980 period covers the embargo of the 1970s, whichthe 1963 study did not anticipate. Actual energy growth was higher than the RFF forecast
from 1960--1970 and slowed dramatically thereafter. The RFF study showed no such"break-point." It assumed steady growth at a rate that led, fortuitously, to about the right
outcome in 1980. The RFF forecasts become increasingly high in the 1980--2000 period
as actual energy use continued to lag projected use (141 EJ primary energy demand in2000 in the "medium" projection versus 103 EJ actual).

LBNL-50498 May 2002
20
Figure 6 Schematic diagram illustrating how a study done two decades earlier(Resources in America's Future) correctly predicted energy use in 1980, owing tocompensating errors. The forecast energy growth rate was too low in the pre-embargo years, but the oil embargos of the 1970s led to a reduction in actualgrowth rate. The figure is reproduced from Landsberg's article (34).
3.5. Systems Dynamics (Bucket Models)The systems dynamics approach models engineering, social, and economic systems as
combinations of reservoirs (buckets) that can accumulate and discharge quantities ofinterest (such as energy, population, and money). Flow paths, often representing
nonlinear rate processes, link the reservoirs, creating feedback loops that define coupled
sets of first-order nonlinear differential equations (18). The modeling techniqueemphasizes dynamics and identification of key driving variables. Once a model's
structure is fixed, it is exercised by varying parameters and driving forces (13, 14, 35,36).
STRENGTHS AND WEAKNESSES Systems dynamics forces precise specification of
assumptions. It avoids the almost automatic incorporation of exponential growth socharacteristic of the top-down econometric and bottom-up end-use approaches.
Exponential growth, when it occurs, always results from specific positive feedbackmechanisms. Systems dynamics requires the modeler to identify the feedback path in
order to obtain exponential growth (or decay).
LBNL-50498 May 2002
21
Systems dynamics approaches to energy modeling have not been widely used for
policy work, though they have been extensively used in university courses. Typically theapproach has been applied at high levels of aggregation and abstraction. Systems
dynamics modelers in the field of energy have not generally incorporated the wealth ofdetailed engineering, economic, and demographic data sets developed by the other
approaches. Systems dynamics has been extensively used in other areas such as fisheries
depletion and predator-prey relations (14).
EXAMPLE: LIMITS TO GROWTH The Limits to Growth study (11) was initiated in 1968,
and the controversial results, first published in 1972 (a year before the 1973 OAPEC oilembargo), attracted enormous attention from the press and the policy community (37,
38). The report was reissued with commentary about its history on its twentieth
anniversary (39). "Limits to Growth" employed a classic bucket model approach. Itfocused on population increases, resource depletion, and decreasing productivity owing
to environmental pollution.
Criticisms of this model centered on its use of finite reservoirs (buckets) of fossil fuels.Models assuming that resources are finite (i.e., without possibility of substitution or
technological change) inevitably predict trouble as the buckets empty. In the "Limits toGrowth" world technology and policy can only affect the rates at which the buckets
empty. As the models were analyzed it became clear that modification to include
innovation and substitution removed the tendency of the models to predict economic andecological collapse. Cole et al. (38:41) summarized this problem as follows:
One of [the Limits to Growth model’s] main modes of 'collapse' is resourcedepletion [caused by] the assumption of fixed economically-available resources,
and of diminishing returns in resource technology. Neither of these assumptions
is historically valid… That technical change will slow down because of thediminishing opportunities for labor-saving innovations is a highly debatable
assumption.Despite its shortcomings, the "Limits to Growth" study brought systems analysis into
the energy policy arena during the 1970s. The issues raised remain hotly debated to this
day.

LBNL-50498 May 2002
22
The "Limits to Growth" study was by no means the first in which a model was based
on finite resources. In 1865 Jevons wrote a classic study of the energy future of England(1), from which the quote at the beginning of this article is taken. Jevons observed that
because coal was England's major energy resource, and detailed geological research hadcharacterized its size, England had but two choices: to burn the coal quickly and go out in
a blaze of glory or to burn it slowly and eventually become a dying ember. The discovery
of oil, along with other technological developments, falsified Jevons' pessimistic view.Nevertheless, the work is an important precursor to modern systems dynamics techniques
and is considered so important by the economics community that on its centennial it wasreprinted in its entirety.
3.6. Scenario AnalysisThe term "scenario" is taken from a Hollywood approach in which story lines are workedout descriptively and characterized on story boards. It was introduced as a forecasting
tool by Herman Kahn. Scenarios are descriptive conceptions of possible energy futures.
The descriptions can be fleshed out to any degree, including numerical analysis. For anexcellent discussion of the scenario process see Schwartz (40).
STRENGTHS AND WEAKNESSES A scenario approach helps make assumptions explicit.At its best, scenario analysis can stimulate users to consider possibilities they had not
conceived of before. The quality of the scenarios depends critically on the expertise and
wisdom of the scenario-building team. The best scenarios highlight the possibility ofstructural changes.
Scenarios are weak when they assume without careful reflection that the key drivers of
the analysis will continue unchanged indefinitely.
EXAMPLE: THE SHELL "RIVER OF OIL" SCENARIOS During the 1960s a group at the
Royal Dutch Shell Corporation, under the leadership of Pierre Wack, used scenarioanalysis as a vehicle for communication within the organization (41, 42). The driving
metaphor, the "river of oil," portrayed the company as floating down that river (Figure7). Scenarios ranged from optimistic (trouble-free continued expansion of production) topessimistic (political limitation on production, industry restructuring). Optimistic
scenarios were portrayed as smooth spots on the metaphorical river, and pessimistic

LBNL-50498 May 2002
23
scenarios were described as rapids or waterfalls caused by technical constraints,
economic difficulties, or political tensions. The most important prospective tensionidentified in the scenarios was the growing market power of a few oil-producing nations,
especially Saudi Arabia.
Figure 7 The "river of oil" metaphor used by the Royal Dutch Shell Corporationprior to the first oil embargo of 1973 [redrawn from (42)]. The metaphor provedhelpful in preparing the company for the embargo.
The educational process engendered by this exercise made Shell managers sensitive to
possible surprises, and it allowed the company to respond more readily after the 1973OAPEC embargo. The energy scenario analysis approach pioneered at Shell continues to
be used successfully by the Global Business Network. For example, a 1990 GlobalBusiness Network scenario included a pessimistic forecast emphasizing Middle-East
terrorism that seems remarkably prescient today (43).
EXAMPLE: SEVEN TOMORROWS This highly readable set of scenarios was a product ofthe futures group at SRI International (44). Seven futures were described in story form,
and each was fleshed out with numerical estimates for key variables (energy, GNP,population, etc.). The authors were well aware that events they could not plausibly
foresee might upset all their intellectually defensible scenarios. They addressed this
inevitable shortcoming by including an implausible scenario, “apocalyptictransformation, in which a remarkable individual emerged in the American West
preaching a gospel of low impact values. His message resonated, and the structure of the

LBNL-50498 May 2002
24
nation changed.” This type of thinking can broaden views and may help the next
generation of forecasters avoid the kinds of embarrassments exemplified by Figure 1.
EXAMPLE: SOFT ENERGY PATHS Lovins' "soft paths" were designed to argue that a
low-energy future for the United States was feasible (45, 46). The approach posited ascenario based on the concept of unexplored options (the road not taken) and argued that
we would be better off if we would take it. Lovins’ qualitative numerical estimates of
energy use were below those of almost all other forecasts and turned out to have beenremarkably accurate. His goal was to make the case that technical advances would allow
the nation to shift away from historic trends of an ever more fossil- and nuclear-basedenergy supply and toward renewables. His scenario (Figure 8) hits energy use at the end
of the twentieth century almost exactly. However, it shows energy use decreasing,
whereas use in the United States actually increased by 1.7% per year, from 87 EJ in 1990to 103 EJ in 2000. The original figure includes supply mixes, with a focus on renewables.
The year-2000 scenario (and actual) supply mixes were oil/gas 26% (63%), coal 23%
(22%), nuclear 0% (22%), and renewable 26% (7%).
Figure 8 The soft path scenario. Simplified from Lovins (45). Actual energy usein 2000 is shown. This scenario was impressionistic but was driven by a largenumber of engineering and economic calculations about the potential for efficiencyincreases and for renewable supply.
LBNL-50498 May 2002
25
4. RISK AND UNCERTAINTY
The best forecasts change thinking and guide policy or action. Naturally, questions ariseabout the risk of misjudgments and errors arising from forecasts and how to manage these
risks (19, 47). The discipline of understanding, assessing, and managing risk is a broadarena called “risk analysis.” This discipline is relatively young, having been developed
mostly in the past half century. It encompasses the following components:
n probabilistic risk assessment,
n generation of options to reduce risk, and
n evaluation of costs and benefits of risk-reduction strategies.
Classically, probabilistic risk assessment attempts to evaluate risk as the expected
value of an undesirable consequence. This evaluation considers the following sequence ofquestions: (a) What, specifically, can go wrong? (b) How likely is it to go wrong in this
particular way? c) What are the consequences of it going wrong in this way? The “totalrisk” is the product of items (b) and (c) summed over all the possible items in category
(a).
The consequences of a particular failure must be measured in units appropriate to therisk being evaluated. For public health this might be excess annual deaths per million
population, whereas for environmental issues it might be number of species driven toextinction annually. For financial calculations it could be the net present value of loss; for
genetic impacts it could be mutations. The way in which the results are framed is
enormously important. Framing affects the way in which results are perceived and canhave great impact---both positive and negative---on credibility. For example, people tend
to be more risk-averse in situation in which they stand to lose a lot than in a situation in
which they stand to gain a lot (48--51). People tend to be more tolerant of voluntarilychosen risks than of risks forced upon them (52, 53).
Most forecasting exercises do not lend themselves directly to risk analysis. Theconsequences of the forecast (or of any actions based on the forecast), rather than the
forecast itself, are the proper subject of risk and uncertainty analysis. However, placing
uncertainty bounds on long-term energy forecasts is particularly difficult, because themodels are not validatable, as discussed in Section 1.

LBNL-50498 May 2002
26
Most of the time the forecasting team can do no better than to bracket what they think
is likely to take place. Upside and downside risks may differ vastly in cost andconsequence. Small-probability, high-consequence outcomes tend to be viewed by the
public very differently from large-probability, low-consequence outcomes, even thoughthe risk-analysis framework treats the two cases as identical if the cost (probability times
consequence) is identical.
An additional difficulty in assessing the risk associated with policies based onforecasts is that experts usually cannot evaluate the probability that a forecast was based
on a flawed model (i.e., the model completely missed some crucial factor or mechanism).In modeling parlance this is called “model mis-specification” or “conceptual model
misfit.” In addition, the mindset of the modelers can make the team complacent about the
risk of such conceptual misfits in their models.For example, in 2000--2001 California had numerous unanticipated electrical outages.
Much blame was placed on the California Energy Commission (CEC) for failing to
anticipate electricity demand growth. The CEC recently examined the accuracy of theirelectric forecasts dating back to 1988 and found that they generally overestimated peak
load (54). This indicates that the growth in demand was not unanticipated and that theirmodels did not suffer from large conceptual misfits. Moreover, the CEC load forecasts
were generally off by 5% or less (3000 MW or less in absolute terms) from the actual
statewide peak load.The conceptual misfit came into play in the mental models of participants in the
California power market in 2000 and 2001. Virtually no one expected a combination of(a) a dry winter in the North West United States, reducing the hydroelectric power
available for export to California; (b) increases in populations and power consumption in
neighboring states, leaving less power for export to California; (c) many unscheduled andconcurrent shut downs of power plants; (d) California utilities forced to bid on the spot
market for electricity; (e) lack of price signals to electricity consumers, because they
continued to receive power at earlier (low) fixed prices; and (f) potential for market
manipulation by some of the major suppliers owing to loopholes in the deregulation
process and rules. These factors were ignored by market participants before the crisis, butthey proved decisive in driving events during it.

LBNL-50498 May 2002
27
Another type of major risk is that the analysis may be framed from a particular vantage
point, thereby leaving out alternative perceptions. The above discussion, for example,omits all mention of where new power plants might be sited. Proposed sites have often
been in low-income regions, or in regions with minority populations. Proposals that seemobviously unobjectionable to the group making them---often the dominant socio-
economic group---have often come under attack from other groups that consider
themselves disenfranchised. Thus, the apparently technical field of risk assessment canhave significant or even dominant value components. Embedded values can be hidden so
deeply---or so generally accepted among analysts and decision-makers---that even theauthors of the reports are unaware of the values they have included. This is a primary
reason why analysis should be undertaken independently by several groups with different
world views and why users of analysis should cast their nets wide.
5. HOW FORECASTS ARE PERCEIVED: QUALITY, ATTENTION, ANDIMPACT
The technical quality of an analysis does not assure impact. Energy forecasts are carriedout for a variety of reasons. They are commonly released in complex, sometimes sharply
polarized, political environments with contending interests, sometimes with the rulingpolitical mindset already made up. Greenberger et al. reviewed 14 major energy studies
undertaken in 1972--1982 (5). They found 9 to be highly controversial and politicized in
their execution, reception, or use [for study citations see (5)]. The Ford Energy Policyproject, initiated in 1972 and released in 1974, called forth plaudits as well as resentment
and antagonism owing to its conclusions emphasizing the need for energy conservation tobe driven by regulatory measures (55, 56). The Energy Research and Development
Administration (ERDA) was stunned by the criticism of its first report (ERDA-48)
released in 1975, which slighted conservation options and adopted a supply focus.In 1977, the year of the incoming Carter administration, the outgoing ERDA produced
its most comprehensive study, the Market Oriented Program Planning Study.Unexpectedly to the ERDA, this study became the center of a highly publicized conflict
with the new administration over estimates of future gas supply. The classified CIA study
completed in April 1977 on the international energy situation buttressed (fortuitously) the

LBNL-50498 May 2002
28
Carter administration’s energy position so well that most of it was declassified with
alacrity and released to the public with great publicity, developments that stunned theCIA’s own analysts. The released study became controversial and was savagely attacked
for tailoring its conclusions, yet the CIA analysts had no prior idea of the central roletheir report would be selected to play in supporting Carter’s National Energy Plan.
Sometimes the media attention focuses on a misunderstood or dramatic (but possibly
minor) aspect of a study and virtually ignores the more substantial conclusions. Themedia coverage of WAES (Workshop on Alternative Energy Strategies) report in May
1977 emphasized looming shortages without making a distinction between long-termsupply/demand imbalances that could be managed by gradual market adaptation and
short-term overnight shortages that would cause long lines at gas pumps. It was a major
disappointment to WAES members, who regarded their study as “a call for action, not acry of despair.” Another WAES disappointment was the failure of the study to reach the
highest levels of the government. Carter never invoked the WAES study to support his
policies---he invoked the CIA study that had arrived at a more opportune time, one monthearlier. The Ford-MITRE study garnered little media attention, but was highly influential,
as some of the study’s participants assumed important roles in the administration and putinto effect some of the study’s main recommendations.
Technical quality, attention, and impact are subjective evaluations for any energy
study. However, it is possible to gauge a measure of these attributes by conductingsurveys of energy experts to seek their assessments of selected energy forecasts.
Greenberger et al. systematically surveyed close to 200 members of what they call the“energy elite” for their assessment of 14 energy studies from 1972--1980 (5). They used
an “attitude” survey of the experts to divide them according to their allegiance to one of
the two core viewpoints. One group, labeled “traditionalist,” was growth oriented,favored nuclear power, believed in deregulation and the market’s ability to efficiently
allocate resources, and was skeptical about the near-term promise of solar energy. Theother group, labeled “reformist,” had great sensitivity to environmental concerns, favored
vigorous enforcement of environmental protection laws and promotion of a resource-
conserving ethic, and was troubled about the implications of today’s energy decisions for

LBNL-50498 May 2002
29
future generations. This group opposed primary reliance on nuclear power and favored
greater emphasis on renewables such as solar and biomass.Each participant was asked to rate each study from the perspective of analytical
strength, attention (from the media), and impact, assigning letter grades from A (highest)to E (lowest). Grades from within each group were averaged. As one would expect, the
assessments are distinctly different across the two groups. Table 1, reproduced from
Reference 5, summarizes the survey results for 12 energy futures studies.
TABLE 1 Assessment of 12 energy futures studies from the 1970s by two groups ofenergy experts with different viewpoints about renewable and traditional energy systems.
The survey was carried out by Greenburger et al. (5) and is discussed in Appendix A of
their book.
Qualitya Attentiona InfluenceaStudyTrad. Refor. Trad. Refor. Trad. Refor.
Ford Energy Policy Project D A- A B A A-Project Independence Report C E B B C DERDA-48 and ERDA 76-1 D E D C D DMOPPS C D D D E EFord-MITRE Study B B C D A A-Lovins "soft paths" E A- A A A A-WAES Study C B C C C BCIA assessment of int’l energy C B B B B ACONAES B C C C D DStobaugh and Yergin D A A A A ARFF-Mellon Study A B- D D D EFord-RFF Study A A D D D CaParticipants assigned letter grades to each study, from A (highest) to E (lowest).Trad., traditionalist group; Refor., reformist group (see text for details); ERDA, EnergyResearch and Development Administration; MOPPS, Market Oriented Program Planning Study; MITRECorporation; WAES , Workshop on Alternative Energy Strategies ; CONAES, National Academy ofSciences Committee on Nuclear and Alternative Energy Strategies; RFF, Resources for the Future
One major theme that emerges from this study is that the interviewees’ assessmentsdiffered enormously regarding quality and influence, and that there was little correlation
between the two. The survey authors observed that "studies generally regarded high in
quality tend to be non-controversial and integrative in nature. In reflecting ideas alreadyknown and accepted, they are not as likely to attract attention and exert influence (other
LBNL-50498 May 2002
30
things being equal) as studies with striking and fiery conclusions” (5). Another theme is
that the assessment of analytical strength is correlated with the views of the reviewers.The Lovins, Ford Energy Policy Project, and Stobaugh and Yergin studies show the
extremes most clearly. Both found favor with reviewers favoring renewables, whereasanalysts who preferred traditional energy systems such as coal and nuclear power found
them technically flawed.
Views on study quality were influenced by points of view. Greenberg et al. (5:75)found that energy policy analysts and policymakers who favored nuclear power
(traditionalists) disliked both the methodology and the conclusions of the analysts whoargued for the feasibility of demand reduction. Those characterized by Greenberger et al.
as reformists were equally critical of the analysis of the traditionalists.
Little has changed in the intervening quarter century. Precisely the same split overprecisely the same issues is occurring today in the debate over the Bush Administration
energy program.
6. OBSERVATIONS
We summarize here the main lessons gleaned from the above reports, supplemented by
our own experience.
6.1. Document AssumptionsThe importance of clear and complete documentation to successful forecasting and
scenario design cannot be overestimated. Instead of burying analytical assumptions andvalue judgments in “black box” models, as is so often done, it is essential that all
assumptions be recorded in a form that can be evaluated, reproduced, and used by others.
The uncertainties in predicting the future are vast, and making assumptions for the mostuncertain variables is often the best we can do. Unless those assumptions are explicit,
however, others can’t evaluate their reasonableness, and one can’t credibly claim to bedoing anything akin to science. It is for this reason that simpler and more transparent
models are often superior in accuracy and usefulness to large and complex ones, because
the simpler models are more amenable to peer review of underlying data andassumptions.

LBNL-50498 May 2002
31
Documentation and simple explanations lend credibility to any intellectual effort. They
also acknowledge the previous work of others and allow readers to follow thoughtprocesses (they also allow authors to recreate their thinking months after they have
achieved some conceptual breakthrough). Any competent analyst ought to be able torecreate an analysis from the documentation provided, and the original author should be
able to do the same more quickly than others can. Finally, the process of documenting
one's results can help one check those results and ensure accuracy.The importance of transparency of models cannot be overestimated. A model that the
audience can actually grasp is inherently more persuasive than a “black box” that no oneoutside of a small circle of analysts understands. Transparent models for which the input
data and assumptions are also well documented are even more compelling but are, sadly,
all too rare.
6.2. Link the Model Design to the Decision at HandThousands of person-hours are wasted each year because people asking for forecasts have
no clear idea of what decision they are trying to influence or who will make that decision.No forecasting exercise should be undertaken without clearly defining the audience and
the decision they will be called upon to make. What decisions are being considered? Whowill make them, and when? Answering these questions can allow for more effective use
of forecasting resources.
6.3. Beware of Obsession with Technical SophisticationAccurate data compilation and careful scenario creation are more important to achieving
forecasting success than are complex programming or esoteric mathematics. As discussed
above, there is no evidence that more complex models are any more accurate inforecasting the future than are simpler models.
Simple and transparent models, properly used, can be immensely powerful. Analysts atthe International Institute for Applied Systems Analysis (IIASA) found this out to their
chagrin when Will Keepin, a visiting scholar at IIASA, was able to almost exactly
reproduce the results of a multiyear, multimillion dollar study using some of the study'skey input assumptions and a hand calculator (57, 58). Keepin showed that the study's
results followed directly from the input assumptions. He concluded that the study's
projections of future energy supply “are opinion, rather than credible scientific analysis,
LBNL-50498 May 2002
32
and they therefore cannot be relied upon by policy makers seeking a genuine
understanding of the energy choices for tomorrow.”Beware of big complicated models and the results they produce. Generally they
involve so much work to keep them current that not enough time is spent on datacompilation and scenario analysis. Morgan & Henrion, in their book Uncertainty,
devoted an entire chapter to such models and began by summarizing this fundamental
truth:There are some models, especially some science and engineering models, that
are large or complex because they need to be. But many more are large orcomplex because their authors gave too little thought to why and how they were
being built and how they would be used (59:289
Such large models are essential only for the most complex and esoteric analyses, and asimpler model will usually serve as well (and be more understandable to your intended
audience).
Do not be too impressed by a model's complexity. Instead, ask about the data andassumptions used to create scenarios. Focus on the coherence of the scenarios and their
relevance to your decisions, and ignore the marketing doublespeak of those whoseobsession with tools outweighs their concern with useful results.
6.4. Watch Out for Discontinuities and IrreversibilityOne of the biggest unsolved issues in forecasting relates to the treatment ofdiscontinuities. In the analysis of climate change, for example, many climate models
assume linear responses to perturbations in greenhouse gas concentrations.
Unfortunately, there is an unknown nonzero probability that the climate system mayrespond in a discontinuous manner to rapid changes in greenhouse gas concentrations.
For example, there may be thresholds beyond which the climate “snaps” to a newequilibrium level that is far from the current one, which could include substantially
different ocean circulation and temperature patterns (60--62). Such discontinuities are
inherently difficult or impossible to predict, but they remain important to consider,particularly when they might lead to large, irreversible, or catastrophic impacts (63:93,
Ch. 19).
LBNL-50498 May 2002
33
6.5. Do Not Assume Fixed Laws of Human BehaviorA common failing afflicting even sophisticated analysts is that they seek immutable lawsof human behavior, much as the physicist discovers physical laws through experiment.
Such generalizations about human and economic systems often fail because these
systems are adaptable in ways that physical systems are not. Policy choices affect howthe future unfolds, and parameters that embody historical behavior are bound to lead us
astray whenever a forecast relies on those parameters to forecast far into the future (64).Assuming that human behavior is immutable will inevitably lead to errors in forecasting,
no matter which kind of modeling exercise you undertake.
Modelers often create forecasts assuming that key input parameters will be similar totheir historical values, even when exploring futures that are unlike anything that has ever
happened before. This error is particularly egregious for forecasts that look many decadesahead, and can lead to colossal errors.
Most economic forecasting models embody historical experience through relationships
that are derived statistically and then use those relationships to forecast the future. Thesemodels are often used to assess the potential effects of proposed changes in government
policy or business strategy. The fact that these models embody history does not meanthey can give an accurate picture of a world in which the fundamental relationships upon
which they depend are in flux (65).
At a minimum, if the statistically derived relationships embedded in such a model arethe very ones that would be affected by choices or events, then those relationships must
be modified in the analysis. For example, after the OAPEC embargo of 1973 energy
efficiency became important; energy growth and electricity growth rates droppeddramatically. Forecasts that assumed continuance of historic relations between economic
and energy growth were grossly wrong. If society decides that climate change issufficiently threatening that large-scale preventive action is required, such action will
represent a similarly large change in historical patterns.
Many prominent forecasters continue to fall prey to the pitfalls described above. Theworld in which policies and technologies are adopted is one governed by increasing
returns to scale, institutional change, and path dependence (66, 67). Forecasts that do not

LBNL-50498 May 2002
34
account for the dynamic nature of human behavior and technology adoption in
characterizing these effects are bound to miss the mark.
6.6. Use ScenariosIf forecasts are part of your planning process, do not rely on only one. Use a set of
forecasts or scenarios to explore the future (40, 66, 68, 69). Schwartz's examples ofscenario analysis typically have only a small quantitative component, but many other
futurists err by focusing too much on the mechanics of forecasting and quantitativeanalysis (e.g., on particular modeling tools and techniques) and far too little on careful
scenario development. Quantitative analysis can lend coherence and credence to scenario
exercises by elaborating on consequences of future events, but modeling tools shouldsupport that process and not drive it.
In the face of inevitably imperfect forecasts, the most important way to create robustconclusions is to create many well-considered scenarios. No credible analysis should rely
on just one or two forecasts. It is also important to look at projections undertaken by
different groups, using a variety of techniques, and funded by organizations with differentgoals.
Vary key factors, and investigate which of them to ignore and which to dissect further.All forecasts are wrong in some respect, but if the process of designing them teaches you
something about the world and how events may unfold, creating them will have been
worth the effort.
6.7. Use Combined ApproachesIn his analysis of the accuracy of time-series techniques by electric utility load
forecasters, Huss (31) concludes, “combination forecasts seemed to outperform all othertime series techniques tested. These techniques seem to be able to take advantage of the
best characteristics of all techniques which comprise the combination.” Combiningdifferent approaches allows biases in one technique to offset biases in other techniques
(15, 19, 21).
6.8. Expect the Unexpected and Design for UncertaintyNaturally, questions arise about the risks of misjudgments and errors resulting from
forecasts and how to manage these risks (70, 71). One approach is to identify and adopt
LBNL-50498 May 2002
35
strategies that are robust in the face of the inevitably imperfect and uncertain forecasts.
For example, several computer companies have moved to "build-to-order"manufacturing, which allows them to assemble computers as requested by customers.
This strategy reduces dependence on forecasts but introduces other challenges inmanufacturing (which are surmountable using current technology). This same lesson
applies equally well to other such decisions: If the key variables are difficult or
impossible to foresee, then use scenario analysis to evaluate the possible outcomes (47),assess the situation from multiple perspectives (72), analyze the uncertainties using
statistical techniques and formal risk assessment where appropriate, and adopt strategiesthat are less dependent on forecasts. Also consider using concepts like the precautionary
principle (73, 74) as risk minimization tools.
6.9. Communicate EffectivelyForecasts can be technically strong but can fail to influence their target audience because
of poor communication of the results. Conversely, a forecast that is not technically
sophisticated but that is communicated effectively can sometimes be influential in spiteof its inherent weaknesses. A forecast that is successful for one group may be a total
failure for another. The way in which the results are framed can be enormously importantto a study’s credibility and influence (48--51, 75).
In the Greenberger et al. (5) study discussed in Section 5 they note that over time some
studies that were initially highly controversial for both technical and policy reasonsbecame more widely accepted. An example is the Ford Energy Policy Project (55), about
which Greenberger et al. wrote, "Its heresy became the new orthodoxy within four years."
Not surprisingly, these changes did not come about passively. The authors of thesestudies engaged in vigorous and effectively communicated defense of their findings. A
similar observation applies to Lovins' early soft path analysis. Lovins’ prolific,effectively communicated, and highly documented defense of his study is contained in
the proceedings of a U.S. Congressional hearing (which also included attacks on his
views) (76, 77)When creating a forecast leave enough time to craft an effective summary of the
results in a form that your intended audience will find compelling. The time spent willpay off in greater influence in policy debates.

LBNL-50498 May 2002
36
6.10. Be ModestWe need to be humble in the face of our modest abilities to foresee the future (21, 71,78). This caution is especially warranted when assessing effects of technological choices
on the environment, as discussed above, but it applies equally well to most energy
forecasts. Fundamental limitations on our ability to foresee consequences has importantimplications for the ways we use forecasts in our planning.
Reading some old writings is both instructive and humbling. We have already notedJevons' (1) book exploring the prospect of England's running out of coal. In 1893 The
World Columbian Exposition was held to celebrate the technological prowess of the time
(79:226). Great thinkers of the day were asked to prognosticate about the next hundredyears and were consistently off the mark. George Westinghouse, founder of
Westinghouse and inventor of the modern compressed air train brake, wrote that trainswere unlikely ever to go faster than 30 miles per hour. He saw this as no problem,
however, because there was no need to go faster.
A century ago, H.G. Wells (80) departed from his traditional science fiction writingand wrote a book expressing his personal views as to how the world might unfold during
the twentieth century. He thought aircraft might have a marginal role by the end of thetwentieth century, thereby totally overlooking the role they were to play in World War I,
only a dozen years ahead. However, he foresaw with unbelievable prescience the coming
of freeways and the age of the automobile.
7. CONCLUDING REMARKS
The question of how to improve forecasts is more than an academic one. It affects any
number of critical public policy debates that the world must confront in the comingdecades, including climate change, population growth, the AIDS crisis, and the growing
gap between rich and poor.Viewed in terms of forecast accuracy, the forecasts summarized in Figure 1 did not do
well. Might it be possible to do better today? Two decades ago Ascher warned,
[F]orecasting theorists have not confronted the cold fact that there are no decentguidelines for selecting the appropriate forecasting method from among the great
diversity of possibilities. Via hindsight they have demonstrated that particular

LBNL-50498 May 2002
37
approaches would have been appropriate for specific technological patterns, but
this in itself does not establish what sorts of approaches, growth models, orformulae should be applied to current problems… (21:125)
Ascher was optimistic about improvements in short-term forecasting but believedlong-term forecasting techniques were unlikely to become more accurate owing to rapid
and unanticipated changes in society as a whole (21:210--211). The main reason is that
time- and context-invariant statements about the accuracy of different long-runforecasting methods for energy, population, and economic activity will likely fall prey to
the inherent unpredictability of pivotal events such as the 1973 oil shocks. Whereaspeople could predict that something like the oil shock might happen (the Royal Dutch
Shell Corporation did), no one at that time could have anticipated with certainty that it
would happen, or when it would happen. The same holds true for the Great Depression inthe 1930s (81) and the terrorist attacks of September 11, 2001. Such events are beyond
human ability to foresee, but they affect how the future will evolve.
Forecasters tend to be prisoners of their own world view and tend to take too narrow aview of the possibilities for change. Forecasters are human and belong to human
institutions. More often than we would like to believe, forecasts are unduly influenced bythe particular perspective of the sponsoring institution, and perspectives alien to that
organization are downplayed, misrepresented or ignored.
Although forecasters often portray their advice as totally rational, completelyobjective, and value free, every human choice embodies values. One purpose of the
analysis embodied in forecasts is to support public or private choices; in this context itcannot be “clean” or value free. It can, however, illuminate the consequences of choices
so that the people and institutions making them can evaluate the alternative outcomes
based on their own values and judgment. Hidden assumptions and value judgments existin every forecast, but the best forecasters make these explicit, so that users of their work
are fully informed.In significant ways long-term forecasts are getting better. Models that rely principally
on correlations are increasingly being challenged. It is unlikely that models exploring
energy futures with long-run rising energy prices can plausibly be based on elasticitiesderived from experience with short-run falling prices. Engineering analysis is

LBNL-50498 May 2002
38
increasingly being used to assess what is feasible and appears to be cost effective, but at
the same time there is growing realization that the marketplace is sticky, with transactioncosts and institutional resistance often playing dominant roles.
The prospect of global climate change has engendered much new analysis. Manyanalysts from different backgrounds are involved, collectively bringing to bear a broad
set of views. This has led to expanded sets of proposals. The carbon emissions scenarios
developed under the auspices of the Intergovernmental Panel on Climate Change (IPCC)cover a large range (82). To a significant degree they illustrate the extent to which the
world's energy future can be one that humans design. Indeed, the IPCC work suggeststhat the current estimates of uncertainty in human action exceed the uncertainty estimates
in the response of the atmospheric system: Uncertainties in future greenhouse gas
emissions exceed the uncertainties in the amount of global warming per unit greenhousegas emitted. In this instance increased acknowledged uncertainty is an indicator of
improved methodology.
ACKNOWLEDGMENTS
This work was partially supported by the Office of Atmospheric Programs of the U.S.Environmental Protection Agency. Prepared for the U.S. Department of Energy under
Contract No. DE-AC03-76SF00098. Lee Schipper and Rob Socolow gave us much
valuable help, both technical and editorial. We are grateful to David Lorenzetti forextensive editorial assistance, and to Skip Laitner of the U.S. Environmental Protection
Agency for funding this work and contributing significant technical and editorialsuggestions.

LBNL-50498 May 2002
39
LITERATURE CITED
1. Jevons WS. 1865. The Coal Question: An Inquiry Concerning the Progress of the
Nation, and the Probable Exhaustion of our Coal-Mines. (Reprinted 1965). NewYork: Kelley. 467 pp.
2. Bella D. 1979. Technological constraints on technological optimism. Technol.
Forecast. Soc. Change 14:15--263. US Dep. Energy. 1979. Energy Demands 1972 to 2000. Rep. HCP/R4024-01.
Washington, DC: DOE4. Energy Information Admin. 2001. Annual Energy Outlook 2002 with Projections to
2020. http://www.eia.doe.gov/oiaf/aeo/index.html
5. Greenberger M, Brewer GD, Hogan WW, Russell M, 1983. Caught Unawares: The
Energy Decade in Retrospect. Cambridge, MA: Ballinger. 415 pp.
6. Hodges J, Dewar J. 1992. Is It You Or Your Model Talking? A Framework For Model
Validation. Santa Monica, CA: RAND
7. United States Atomic Energy Commission. 1962. Civilian Nuclear Power: A Report to
the President (reprinted in Joint Committee on Atomic Energy 1968)8. Holsendorph E. 1973. Oil independence---it seems unlikely. NY Times Dec. 2, Sec. 2,
pp. 1, 15
9. Energy Inf. Admin.. 2002. Petroleum Imports by Country of Origin, 1960-2000.
www.eia.doe.gov/emeu/aer/txt/tab0504.htm
10. JCAE. 1968. Nuclear Power Economics: 1962-1967. Joint Comm. on AtomicEnergy, 90th Congress, Second Session. Comm. Print, Washington, DC
11. Meadows DH, Meadows DL, Randers J, Behrens WW 1972. The Limits To Growth;
A Report For The Club Of Rome's Project On The Predicament Of Mankind. NewYork: Universe Books. 205 pp.
12. Dörner D. 1996. The Logic of Failure: Recognizing and Avoiding Error in Complex
Situations. Cambridge, MA: Perseus Books. 225 pp.
13. Hannon B, Ruth M. 2000. Dynamic Modeling. New York: Springer-Verlag. 247 pp.
14. Ford A. 1999. Modeling the Environment: An Introduction to System Dynamics
Modeling of Environmental Systems. Washington, DC: Island. 401 pp.

LBNL-50498 May 2002
40
15. Armstrong JS, ed. 2001. Principles of Forecasting: A Handbook for Researchers and
Practitionershttp://. Norwell, MA: Kluwer Academic. 849 pp.16. US Dep. Energy. 2001. Annual Energy Outlook 2002, with Projections to 2020. Rep.
DOE/EIA-0383(2002). Washington, DC: Energy Inf. Admin., U.S. DOE17. Am. Inst. Physics. 1975. Efficient Use Of Energy: A Physics Perspective (Report Of A
Summer Study Held In Princeton, New Jersey, July 1974). AIP Conf. Proc. No. 25, M
Ross, RH Socolow, principal investigators. 237 pp.
18. MIT. 2002. http://sysdyn.mit.edu/road-maps/rm-toc.html
19. Armstrong JS. 1978. Long Range Forecasting: From Crystal Ball to Computer.
Chichester, UK: Wiley-Interscience. 612 pp.
20. Green RD. 1985. Forecasting with Computer Models: Econometric, Population and
Energy Forecasting. New York: Praeger Scientific. 256 pp.
21. Ascher W. 1978. Forecasting: An Appraisal for Policy Makers and Planners.Baltimore, MD: Johns Hopkins Univ. Press. 239 pp.
22. Robinson JB. 1988. Loaded questions: new approaches to utility forecasting. Energy
Policy 16:58--6823. Dupree WG Jr, West JA. 1972. United States Energy Through the Year 2000.
Washington, DC: US Dep. Interior24. Dupree WG Jr, Corsentino JS. 1975. United States Energy Through the Year 2000
(Revised), Washington, DC: US Dep. Interior, Bureau of Mines
25. Starr C. 1979. Energy planning: a nation at risk. In Current Issues in Energy: A
Selection of Papers by Chauncy Starr, pp. 153--90. New York: Pergamon
26. Sanstad AH, Koomey JG, Laitner S. 2002. Back to the Future: A Note on Long-
Range Energy Price and Quantity Projections in Retrospect. Lawrence Berkeley
National Laboratory Report LBNL-48107
27. Huss WR. 1985. Comparative analysis of company forecasts and advanced timeseries techniques using annual electric utility energy sales data. Int. J. Forecast. 1:217--
3928. Jorgenson DW, Goettle RJ, Wilcoxen PJ, Ho MS 2000. The Role of Substitution in
Understanding the Costs of Climate Change Policy, Arlington, VA: Pew Cent. Global
Clim. Change

LBNL-50498 May 2002
41
29. Rosenfeld AH. 1999. The art of energy efficiency: protecting the environment with
better technology. Annu. Rev. Energy Environ. 24:3--8230. Brown RE, Koomey JG. 2002. Electricity use in California: past trends and present
usage patterns. Lawrence Berkeley National Laboratory Report LBNL-47992; .Energy Policy. Forthcoming
31. Huss WR. 1985. What makes a good load forecast? Public Util.
Fortnightly116(11):3--1132. Huss WR. 1985. Can electric utilities improve their forecast accuracy? The historical
perspective. Public Util. Fortnightly:116(13):3--833. Landsberg HH, Fischman LL, Fisher JL. 1963. Resources in America's Future:
Patterns of Requirements and Availabilities 1960-2000. Baltimore: Johns Hopkins
Press for Resources for the Future. 1017 pp.34. Landsberg HH. 1985. Energy in transition: a view from 1960. Energy J. 6:1--18
35. Forester JW. 1969. Urban Dynamics. Cambridge, MA: MIT Press
36. Morecroft JDW, Sterman JD, eds. 1994. Modeling for Learning Organizations.Portland, OR: Productivity
37. McCutcheon R. 1979. Limits of a Modern World: A Study of the Limits to Growth
Debate. Boston: Butterworth
38. Cole HSD, Freeman C, Jahoda M, Pavitt KLR. 1975. Models of Doom: A Critique of
the Limits to Growth. With a Reply by the Authors of The Limits to Growth. NewYork: Universe Books
39. Meadows DH, Meadows DL, Randers J. 1992. Beyond the Limits: Confronting
Global Collapse: Envisioning a Sustainable Future (Sequel to "The Limits to Growth).
Post Mill, VT: Chelsea Green. 300 pp.
40. Schwartz P. 1996. The Art of the Long View: Planning for the Future in an Uncertain
World. New York: Doubleday. 256 pp.
41. Wack P. 1985. The gentle art of reperceiving-scenarios. 1. Uncharted waters ahead.Harv. Bus. Rev. 63:5:73--89
42. Wack P. 1985. The gentle art of reperceiving-scenarios. II. Shooting the rapids. Harv.
Bus. Re63:6:2--14
LBNL-50498 May 2002
42
43. Global Bus. Netw. 1990. On the Plains of Babylon: The 1990 GBN Scenario Book.
Emeryville, CA: GBN44. Hawken P, Ogilvy J, Schwartz P. 1982. Seven Tomorrows: The Potential Crises that
Face Humankind---and the Role of Choice in Determining the Future. New York:Bantam. 235 pp.
45. Lovins A. 1976. The Road Not Taken. Foreign Aff. 55:1:65--96
46. Lovins AB. 1979. Soft Energy Paths: Toward a Durable Peace. New York: HarperColophon. 231 pp.
47. South. Calif. Edison. 1988. Planning for uncertainty: a case study (SouthernCalifornia Edison). Technol. Forecast. Soc. Change 33:119--48
48. Kahneman D, Tversky A, eds. 2000. Choices, Values, and Frames. Cambridge:
Cambridge Univ. Press. 840 pp.49. Tversky A, Kahneman D. 1974. Judgment under uncertainty: heuristics and biases.
Science 185:1124--31
50. Tversky A, Kahneman D, eds. 1982. Judgment under uncertainty: heuristics and
biases. Cambridge: Cambridge Univ. Press. 555 pp.
51. Tversky A, Kahneman D. 1986. Rational choice and the framing of decisions. J. Bus.
59:S251--78
52. Covello VT, Sandman PM, Slovic P. 1988. Risk Communication, Risk Statistics, and
Risk Comparisons: A Manual for Plant Managers. Washington, DC: Chem. Manuf.Assoc. 58 pp.
53. Starr C. 1988. Social benefits versus technological risk. in Science, Technology and
Society: Emerging Relationships, ed. R Chalk, pp. 166--72. Am. Assoc. Advancement
Sci Publication No 88-12, Washington DC, 262 pp..
54. Calif. Energy Commission. 2001. Previous Energy Commission Peak Electricity
Demand Forecasts. Sacramento, CA: Calif. Energy Commission
55. Ford Foundation. 1974. Exploring Energy Choices: A Preliminary Report: Energy
Policy Project. 84 pp.
56. Freeman SD, Baldwin P, Canfield M J, Carhart S, Davidson Jet al. 1974. A Time to
Choose: America's Energy Future. (Final Rep. of the Energy Policy Project of the
Ford Foundation). Cambridge, MA: Ballinger. 511 pp.

LBNL-50498 May 2002
43
57. Keepin B. 1983. A Critical Appraisal of the IIASA Energy Scenarios. Rep. WP-83-
104, Int. Inst. Appl. Syst. Anal.58. Keepin W, Wynne B. 1984. Technical analysis of IIASA energy scenarios. Nature
312:691--9559. Morgan MG, Henrion M. 1992. Uncertainty: A Guide to Dealing with Uncertainty in
Quantitative Risk and Policy Analysis. New York: Cambridge Univ. Press. 332 pp.
60. Broecker WS. 1991. The great ocean conveyor. Oceanography 4:79--8961. Broecker WS. 1997. Thermohaline circulation, the Achilles heel of our climate
system: Will man-made CO2 upset the current balance? Science 278:1592--8862. Taylor K. 1987. Rapid climate change. Am. Sci. 87 No. 4
www.sigmaxi.org/amsci/articles/99articles/taylor.html
63. Intergov. Panel on Clim. Change. 2001. Climate Change 2001---Impacts, Adaptation,
and Vulnerability. Contribution of Working Group II to the Third Assessment Report
to the Intergovernmental Panel on Climate Change. New York: IPCC. Cambridge:
Cambridge Univ. Press. 1032 pp.
64. Koomey J. 2002. From my perspective: Avoiding "the big mistake" in forecastingtechnology adoption. Technol. Forecast. Soc. Change :69 No. 5: 511-8
65. Koomey J. 2001. Turning Numbers into Knowledge: Mastering the Art of Problem
Solving. Oakland, CA: Analytics Press. 221 pp. www.numbersintoknowledge.com
66. Arthur WB. 1990. Positive feedbacks in the economy. Sci. Am. 274:92--98
67. Laitner JAS, DeCanio SJ, Peters I. 2000. Conceptual Frameworks to Reflect
Behavioral and Social Relationships in the Assessment of Climate Mitigation Options.
Presented at IPCC Expert Meeting on "Conceptual Frameworks for MitigationAssessment from the Perspective of Social Science," Karlsruhe, Germany
68. Weingart JM. 1978. The Helios strategy: an heretical view of the potential role of
solar energy in the future of a small planet. Technol. Forecast. Soc. Change 12:373--415
69. Michael DN. 1997. Learning to Plan and Planning to Learn. San Francisco: Jossey-Bass
70. Kammen DM, Hassenzahl DM. 1999. Should We Risk It? Exploring Environmental,
Health, and Technological Problem Solving. Princeton, NJ: Princeton Univ. Press

LBNL-50498 May 2002
44
71. Shlyakhter AI, Kammen DM, Broido CL, et al. 1994. Quantifying the credibility of
energy projections from trends in past data: the US energy sector. Energy Policy
22:119--30
72. Linstone HA. 1999. Decision Making for Technology Executives: Using Multiple
Perspectives to Improve Performance. Boston: Artech House. 315 pp.
73. Appell D. 2001. The new uncertainty principle. Sci. Am. Vol 286 January 18
http://www.sciam.com/article.cfm?articleID=000C3111-2859-1C71-84A9809EC588EF21&catID=2 l74. Foster KR, Vecchia P, Repacholi MH. 2000.
Science and the precautionary principle. Science 288:979--8175. Covello VT, Sandman PM, Slovic P. 1988. Risk Communication, Risk Statistics, and
Risk Comparisons: A Manual for Plant Managers. Washington, DC: Chem. Manuf.
Assoc. 58 pp.76. US Congress. 1976. Alternative long range energy strategies (appendices--1977). In
Joint Hearing Before the Select Committee on Small Business and the Committee on
Interior and Insular Affairs. Washington, DC: US GPO77. US Congress. 1976. Alternative long range energy strategies. In Joint Hearing Before
the Select Committee on Small Business and the Committee on Interior and Insular
Affairs. Washington, DC: US GPO
78. Schnaars S. 1989. Megamistakes: Forecasting and the Myth of Rapid Technological
Change. New York: Free Press. 202 pp.
79. Walter D. 1992. Today Then: America's Best Minds Look 100 Years Into the Future
on the Occasion of the 1893 World's Colombian Expositions. Helena, MT: American
and World Geographic. 226 pp.
80. Wells H. 1902. Anticipations of the Reaction of Mechanical and Scientific Progress
Upon Human Life and Thought. London: Chapman & Hall. 318 pp.
81. Dominguez KM, Fair RC, Shapiro MD. 1988. Forecasting the Depression: Harvardversus Yale. Am. Econ. Rev. 78:595--612
82. Nakicenovic N, Alcamo J, Davis G, de Vries B, Fenham J et al. 2000. IPCC Special
Report on Emissions Scenarios. Cambridge: Cambridge Univ. Press. 599 pp.