what are the facts about mobile advertising mobile ad tech to target did individual level data for...
TRANSCRIPT

What are the Facts about Mobile AdvertisingAnd what Does it mean to a marketer’s business
March 2016
Greg StuartGlobal CEO Mobile Marketing [email protected]
But what do you expect from a channel that has this kind of influence?

Jack Welch Once Said…There are only two sources of competitive advantage:
the ability to learn more about our customers faster than the competition and;
the ability to turn that learning into action faster than the competition.

Which is why we built….
SMoX.me = Smart Mobile Cross Marketing Effectiveness Studies

What Has SMoX Taught Us

SMoX : Industry Consortium Coming together to understand business value of Mobile in advertising Mix
8
5 Brands
4 Co
untri
es
14 5
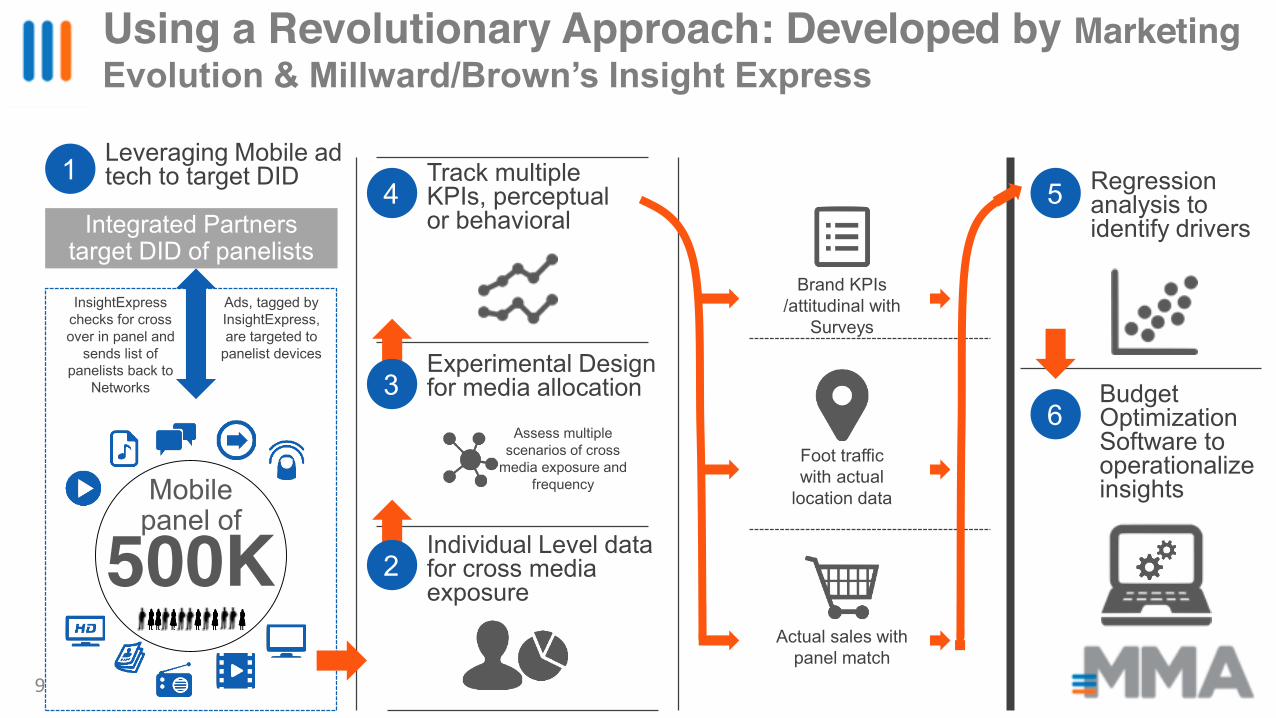
Leveraging Mobile ad tech to target DID
Individual Level data for cross media exposure
Experimental Design for media allocation
Track multiple KPIs, perceptual or behavioral
Regression analysis to identify drivers
Budget Optimization Software to operationalize insights
2
36
Integrated Partners target DID of panelists
500KMobile
panel of
InsightExpress checks for cross over in panel and
sends list of panelists back to
Networks
Ads, tagged by InsightExpress, are targeted to
panelist devices
Assess multiple scenarios of cross
media exposure and frequency
Brand KPIs /attitudinal with
Surveys
Foot trafficwith actual
location data
Actual sales with panel match
Using a Revolutionary Approach: Developed by Marketing Evolution & Millward/Brown’s Insight Express
9
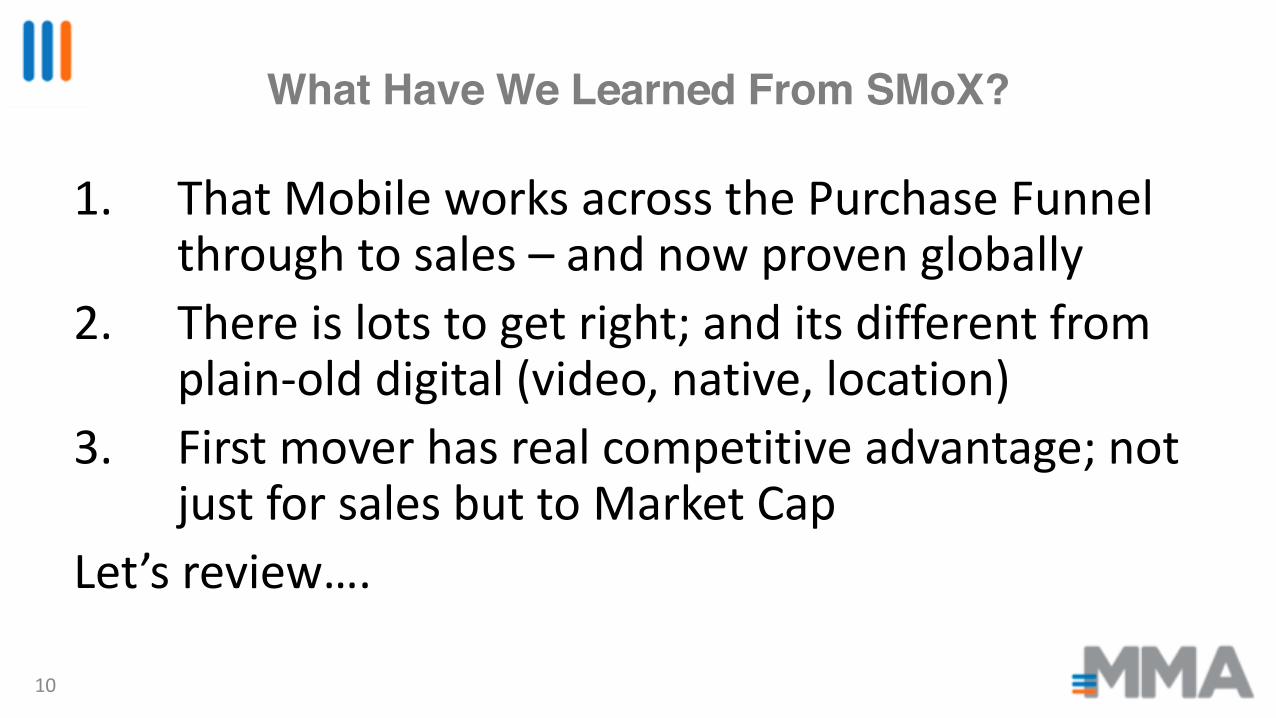
What Have We Learned From SMoX?
1. That Mobile works across the Purchase Funnel
through to sales – and now proven globally
2. There is lots to get right; and its different from
plain-old digital (video, native, location)
3. First mover has real competitive advantage; not
just for sales but to Market Cap
Let’s review….
10

TV
Internet
FSI
Cinema
Social
OOHMobile Display Display,
video,
social
Display,
video, native,
location
Display,
audio, video
social
Display,
video,
social
Display,
video,
social
Display,
video,
social
Display, RM,
Weather
targeting, social,
video
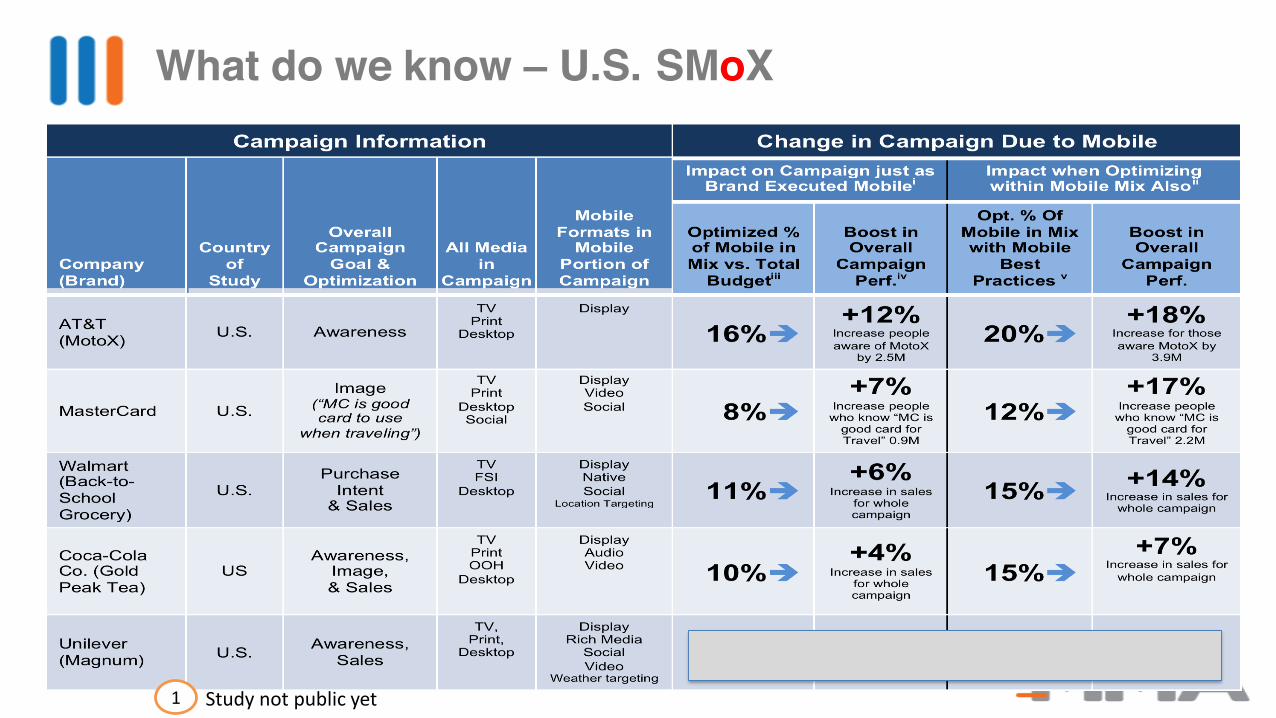
Variety of media in each campaign mix
11
1 11
Study not public yet1
12
What do we know – U.S. SMoX
Study not public yet1

13
What do we know – Coca-Cola Worldwide SMoX
Study not public yet1
1
1

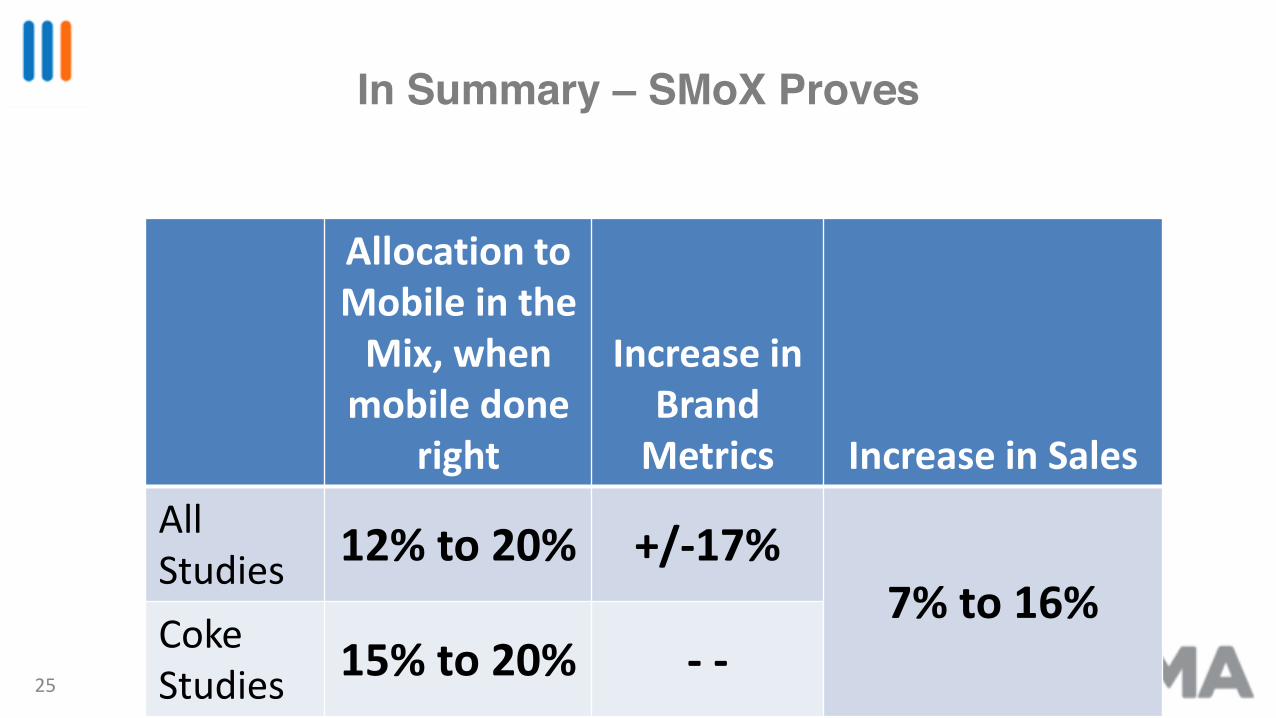
In Summary – SMoX Proves
Allocation to Mobile in the
Mix, when mobile done
right
Increase in Brand
Metrics Increase in SalesAll
Studies12% to 20% +/-17%
7% to 16%Coke
Studies15% to 20% - -
14

1. Optimization of Mobile in the Marketing Mix
– That’s a law of the physics of media
2. Building capabilities within Mobile
– Education, test & learn, access to industry,
Capitalizing on Mobile is a 2-Step Process
15

Using the mobile toolkit to improve results
16
Audio
Video
Display
Rich Media
Native
Coupons
FORMATS CHANNELS TARGETING CREATIVE
Websites
Apps
Push
SMS/MMS
Social
Search
Audience
Context
Day part
Location
Weather
Programmatic
Dynamic
Integrated
Closed loop
to payment
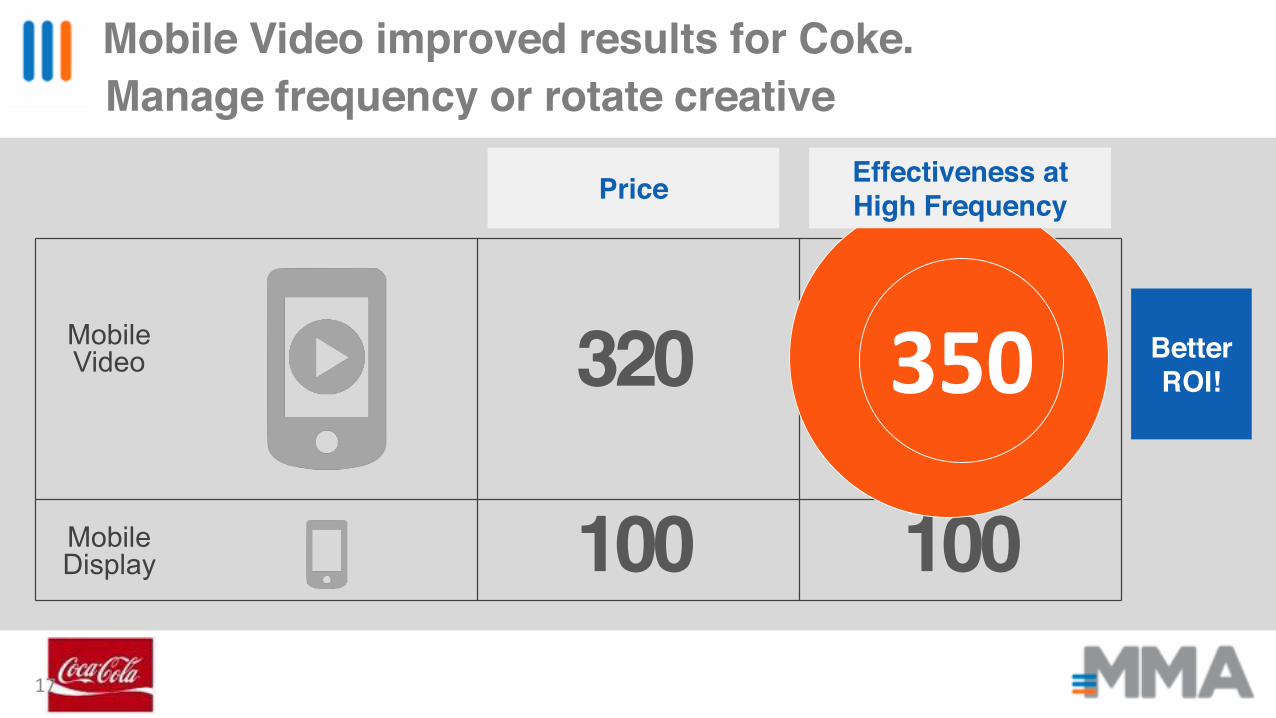
Mobile Video improved results for Coke.
Price
Better ROI!
Effectiveness at low Frequency
Mobile Video
Mobile Display
320
100 100
650
Effectiveness at High Frequency
350
Manage frequency or rotate creative
17

Mobile Video could further improve results for Coca Cola
Price
Better ROI!
Mobile Video
Mobile Display
88
100 100
300
Impact in this case is defined as purchase intent for Gold Peak tea.
Effectiveness
18

0%
2%
4%
6%
8%
10%
12%
Poin
t Inc
reas
e in
Pric
e Pe
rcep
tion
Frequency
Frequency to Lift ResponseMobile Video vs. TV*
Source: Walmart SC Survey; Data Collected from: 8/4-9/28
MOBILE VIDEO
CABLE TV
With the same creative, Mobile Video had more impact than video on other platforms
19
20
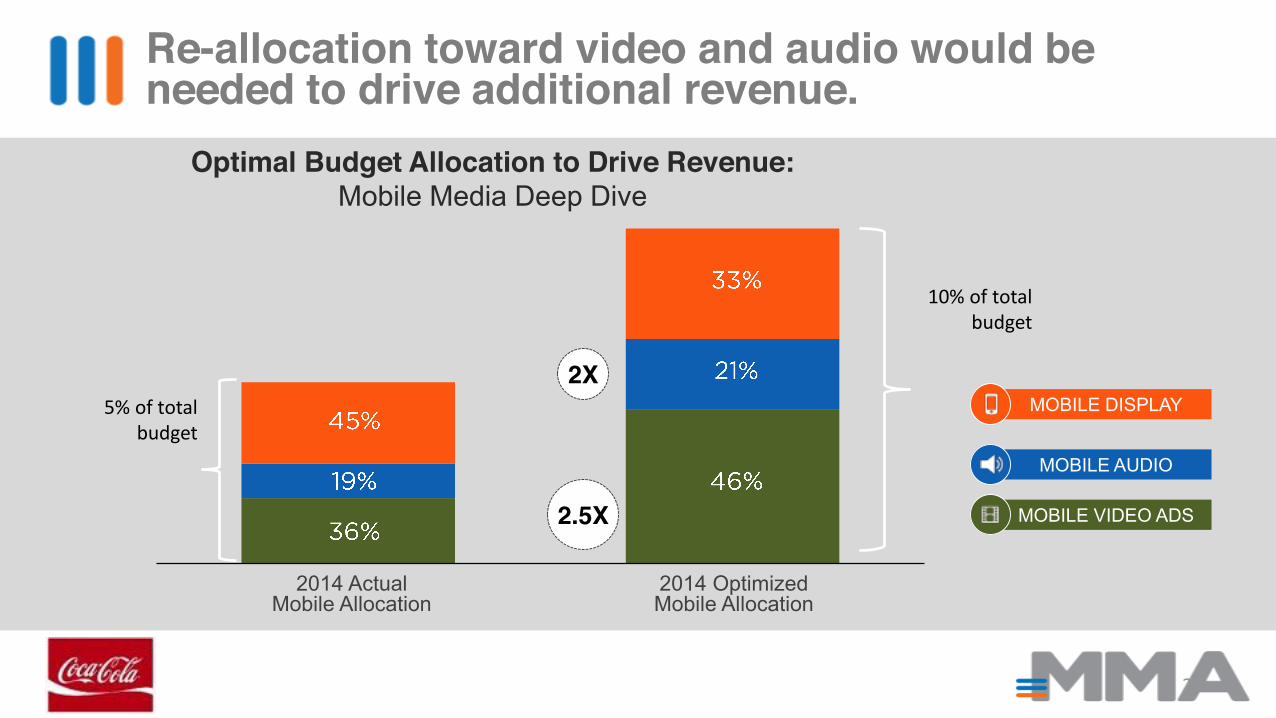
Re-allocation toward video and audio would be needed to drive additional revenue.
MOBILE AUDIO
MOBILE VIDEO ADS
MOBILE DISPLAY
2014 ActualMobile Allocation
2014 Optimized Mobile Allocation
5% of total
budget
10% of total
budget
Optimal Budget Allocation to Drive Revenue:Mobile Media Deep Dive
2X
2.5X

Mobile Native improved results for Walmart.
Price
Better ROI!
Effectiveness at low Frequency
Mobile Native
Mobile Display
500
100 100
1000Effectiveness at High Frequency
300
Manage frequency or rotate creative

% Of
Mobile
allocation
in total
Budget
OTHER MOBILE
NATIVE
MobilePlanned Spend
MobileOptimised Spend
5.9%
1.1%
7.7%
0.0%
1.0%
2.0%
3.0%
4.0%
5.0%
6.0%
7.0%
8.0%
9.0%
10.0%
1.3
7%
9%
Mobile Native’s performance yields it the majority of optimized spend across the mobile formats used.
22

MM = Millions of people converted on Intent to Shop Walmart BTS
7%
9%
Mobile Spend in Back to School Mix
Incremental Impact Due to Mobile Spend
0.9MM
2.5MM
By reallocating within mobile, a 30% increase in Mobile spend results in an 2.8X increase in impact.
23

Optimization focus ROI Upside (based on SMoX)
1.Optimize by Format(display size, audio, video, native, social) 20%-40%
2. Leverage Location targeting(Audience, proximity targeting & role of creative) 20%+
3. Leverage Context targeting(Time of the day, day of the week) 20%+
4. Build on Creative(AB testing, relevance by target group) 40%-60%
Total 100%-160%
ROI Upside (expert opinion)
+ 80%
+120%
+ 60%
+ 200%
+ 460%
But can Mobile be made to work even harder. But what is the opportunity?
3/24/2016 Proprietary & Confidential 24
In Summary – SMoX Proves
Allocation to Mobile in the
Mix, when mobile done
right
Increase in Brand
Metrics Increase in SalesAll
Studies12% to 20% +/-17%
7% to 16%Coke
Studies15% to 20% - -
25

Does this Matter: Market Cap Impact by Marketer for First Mover Advantage
26
Yields a material valuecreation opportunity.
$3.9B
MV / R = 4.2
Market Cap Gain =
4.2 x $922M
And the Company’s currentRevenue and market value . . .
$185.2B Market Cap
2013 Revenue of
$43.9B
2% Share Shift Revenue Gain of
$922M
Using a large Consumer Goodscompany as an example. . .
Cu
rre
nt
Move aggressively, bring mobile spend to about $500M worldwide
Mobile
Allocation
Move revenue across the board by 2%
Re
all
oca
ted
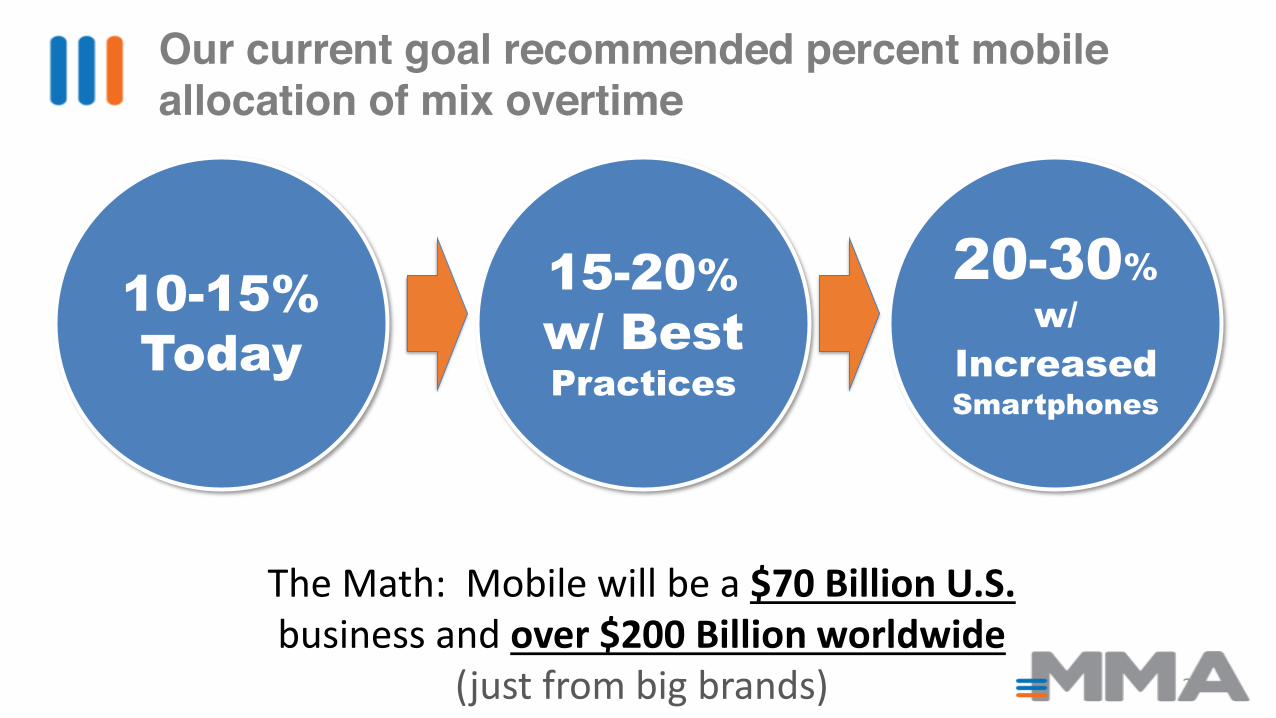
The Math: Mobile will be a $70 Billion U.S.business and over $200 Billion worldwide
(just from big brands)
Our current goal recommended percent mobile allocation of mix overtime
10-15%Today
15-20%w/ Best Practices
20-30%w/
IncreasedSmartphones
27
Opportunity knocks
28

What’s Next: SMoX – Wave II
29
More sectors to assess:1. Insurance 2. Automotive3. QSR4. Alcoholic Beverage5. Consumer Electronics6. Travel7. Fashion8. Anyone with a youth target!9. Maybe multi-cultural too
Video (for example) Insights Desired:
––––––––––
Even given our success with SMoX, there are still more questions
the MMA wants to answer:
Inviting Brands and Sellers to join us in Wave II
30
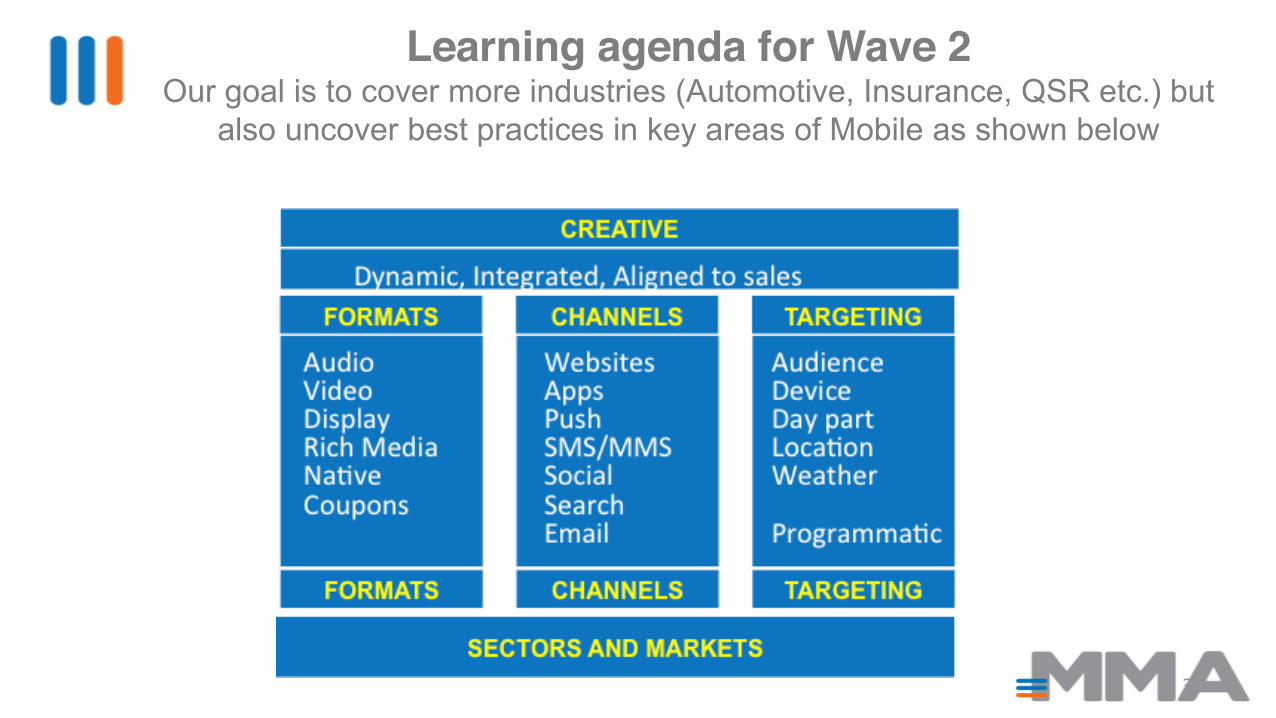
Learning agenda for Wave 2 Our goal is to cover more industries (Automotive, Insurance, QSR etc.) but
also uncover best practices in key areas of Mobile as shown below
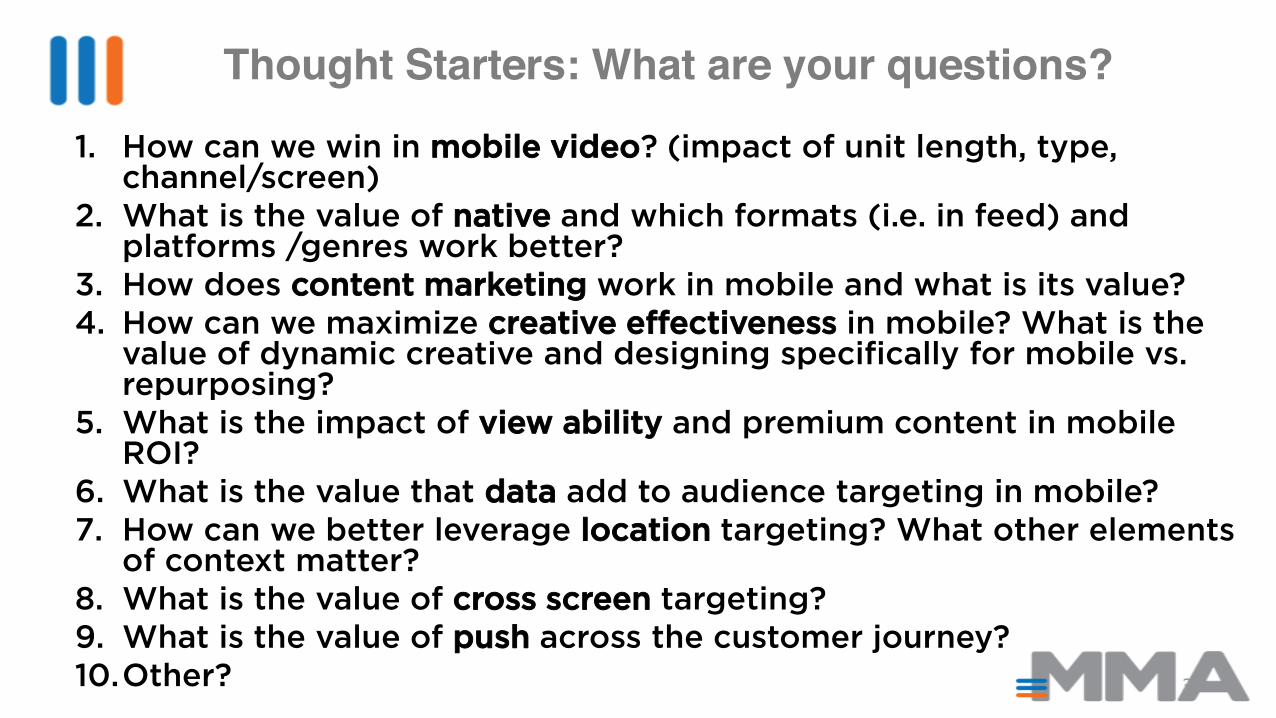
Thought Starters: What are your questions?
31
1. How can we win in mobile video? (impact of unit length, type, channel/screen)
2. What is the value of native and which formats (i.e. in feed) and platforms /genres work better?
3. How does content marketing work in mobile and what is its value?4. How can we maximize creative effectiveness in mobile? What is the
value of dynamic creative and designing specifically for mobile vs. repurposing?
5. What is the impact of view ability and premium content in mobile ROI?
6. What is the value that data add to audience targeting in mobile? 7. How can we better leverage location targeting? What other elements
of context matter?8. What is the value of cross screen targeting?9. What is the value of push across the customer journey?10.Other?
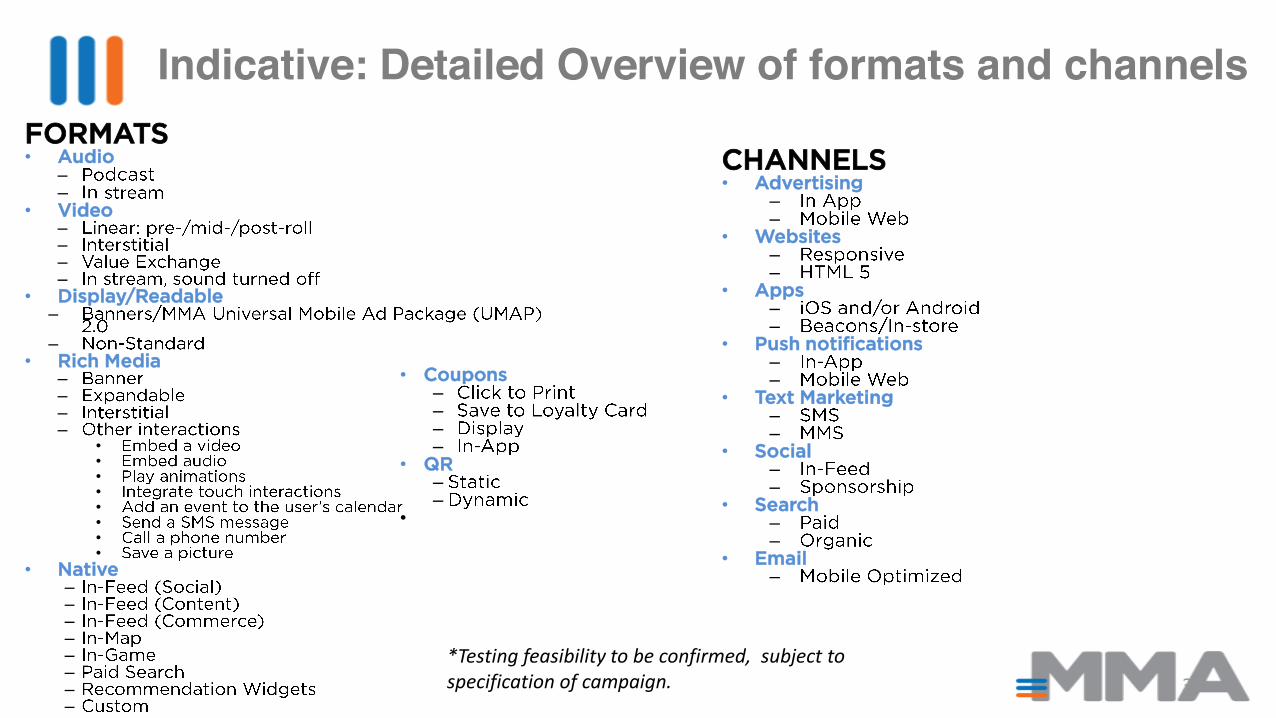
Indicative: Detailed Overview of formats and channels FORMATS• Audio
––
• Video––––
• Display/Readable–
–• Rich Media
––––
••••••••
• Native ––––––––
• Coupons––––
• QR––
•
CHANNELS• Advertising
––
• Websites––
• Apps––
• Push notifications––
• Text Marketing ––
• Social––
• Search––
• Email–
*Testing feasibility to be confirmed, subject to specification of campaign. 32

Thank you to these Innovation Leaders
Supporters Partners
Association of National Advertisers
American Association of Advertising
Agencies
33

34
Thank You!
Seizing the Mobile Opportunity
Mobile Marketing Association
Here to lead the greatest transformation in marketing we’ll see in our generation