what are lightness illusions and why do we see them? and lotto (2007).pdf · citation: corney d,...
TRANSCRIPT

What Are Lightness Illusions and Why Do WeSee Them?David Corney, R. Beau Lotto*
UCL Institute of Ophthalmology, University College London, London, United Kingdom
Lightness illusions are fundamental to human perception, and yet why we see them is still the focus of much research.Here we address the question by modelling not human physiology or perception directly as is typically the case but ournatural visual world and the need for robust behaviour. Artificial neural networks were trained to predict thereflectance of surfaces in a synthetic ecology consisting of 3-D ‘‘dead-leaves’’ scenes under non-uniform illumination.The networks learned to solve this task accurately and robustly given only ambiguous sense data. In addition—and asa direct consequence of their experience—the networks also made systematic ‘‘errors’’ in their behaviourcommensurate with human illusions, which includes brightness contrast and assimilation—although assimilation(specifically White’s illusion) only emerged when the virtual ecology included 3-D, as opposed to 2-D scenes. Subtlevariations in these illusions, also found in human perception, were observed, such as the asymmetry of brightnesscontrast. These data suggest that ‘‘illusions’’ arise in humans because (i) natural stimuli are ambiguous, and (ii) thisambiguity is resolved empirically by encoding the statistical relationship between images and scenes in past visualexperience. Since resolving stimulus ambiguity is a challenge faced by all visual systems, a corollary of these findings isthat human illusions must be experienced by all visual animals regardless of their particular neural machinery. Thedata also provide a more formal definition of illusion: the condition in which the true source of a stimulus differs fromwhat is its most likely (and thus perceived) source. As such, illusions are not fundamentally different from non-illusorypercepts, all being direct manifestations of the statistical relationship between images and scenes.
Citation: Corney D, Lotto RB (2007) What are lightness illusions and why do we see them? PLoS Comput Biol 3(9): e180. doi:10.1371/journal.pcbi.0030180
Introduction
Understanding how we generate accurate perceptions ofsurfaces is often best informed by understanding why wesometimes do not. Thus, illusions of lightness (and colour) areessential tools to vision research. In many natural environ-ments, light levels vary across space and over time. It isimportant to be able to perceive surfaces independently ofthis varying light intensity (and vice versa) in order to forageor predate successfully, for example. (By reflectance, we meanthe proportion of incident light reflected by a surface;lightness is the perceived reflectance of a surface; brightness isthe perceived intensity of light reaching the eye; and luminanceis the actual intensity of the light that reaches the eye withrespect to the sensitivity of the human visual system.)
A number of models of lightness perception have beenproposed, but most of these fail to deal with complex stimulior only demonstrate a narrow range of behaviours. Forinstance, one well-known heuristic model predicts humanlightness perceptions by first subdividing stimuli into multi-ple ‘‘local frameworks’’ based on, for instance, junctionanalysis, and co-planarity as well as other classic gestaltfactors. Then, within each framework, the ratio of a patch’sintensity and the maximum intensity in that patch’s localframework is used to predict the reflectance, combining a‘‘bright is white’’ and a ‘‘large is white’’ area rule [1]. Theserules are well-defined and effective for simple stimuli (e.g.,with two nonzero luminance regions), but the application ofthe rule has not been studied for more complex images [1].Indeed, it is hard to see how such a model could be appliedto even moderately complex stimuli, much less naturalscenes under spatially heterogeneous illumination, withoutextremely complex edge-classification rules that are as yet
undefined. Furthermore, such human-based heuristics pro-vide little insight into the physiological and/or computa-tional principles of vision that are relevant to all visualanimals.More computational approaches, on the other hand, are
less descriptive, more quantitative, and make fewer assump-tions. For example, artificial neural networks (ANNs) havebeen trained to extract scene information, such as objectshape and movement, from simple synthetic images [2,3]; anda statistical approach using Gibbs sampling and Markovrandom fields has been used to separate reflectance andillumination from simple images [4]. Most such models,however, are unable to explain brightness contrast andassimilation (e.g., White’s illusion) simultaneously withoutrecourse to one or more adjustable weighting factors. Oneapproach that can is the Blakeslee and McCourt filter model[5]. By applying a set of filters (specifically, a bank of orienteddifference of Gaussians filters, or ODOG), the modelproduces results that correspond closely to psychophysicalresults on a wide range of illusory stimuli. The same model,however, fails to predict the asymmetry of brightnesscontrast, where darker surrounds cause larger illusions thanequally lighter surrounds, as we discuss later. ‘‘While these
Editor: Karl J. Friston, University College London, United Kingdom
Received May 1, 2007; Accepted July 30, 2007; Published September 28, 2007
Copyright: ! 2007 Corney and Lotto. This is an open-access article distributedunder the terms of the Creative Commons Attribution License, which permitsunrestricted use, distribution, and reproduction in any medium, provided theoriginal author and source are credited.
Abbreviations: ANN, artificial neural network; RMS, root-mean-squared
* To whom correspondence should be addressed. E-mail: [email protected]
PLoS Computational Biology | www.ploscompbiol.org September 2007 | Volume 3 | Issue 9 | e1801790
asymmetries are not captured by the ODOG model as it ispresently implemented, permitting different gain parametersto be applied to the outputs of independent on-channels andoff-channels would constitute a logical first step towardaccommodating these differences’’ [6]. It is also important tostress that the model does not attempt to predict thereflectance of surfaces, only the perceived brightness of astimulus, and therefore is unable to explain lightnessconstancy in more natural scenes under spatially heteroge-neous illumination. Related machine vision work includes theseparation of luminance changes into those caused byshading (including the slant of the surface and direction ofincident light), and those caused by paint on the surface,using filters and a mixture of Gaussians [7]; and a localised‘‘mixture of experts’’ and a set of multiscale filters has beenused to extract the intrinsic components of an image,including ‘‘de-noising’’ it [8]. However, these studies do notattempt to explain the human perception of lightness orillusions. Thus, explanations as to why and how we seelightness illusions remain incomplete.
Here we take a different approach to rationalising humanillusions and, by extension, lightness perception generally.Rather than modelling human perception or known primatephysiology—as is typical of most models—we instead modelthe empirical process by which vision resolves the mostfundamental challenge of visual ecology: the inherentambiguity of visual stimuli. We make no assumptions aboutparticular physiology or cognition, but instead model theprocess of development/learning from stimuli with feedbackfrom the environment. This is analogous to the experientiallearning of any animal whose behaviour is guided visually,and which must learn to resolve perceptual ambiguity inorder to survive.
Results
Fifty ANNs were trained using backpropagation to predictthe reflectance of surfaces in synthetic scenes, an example of
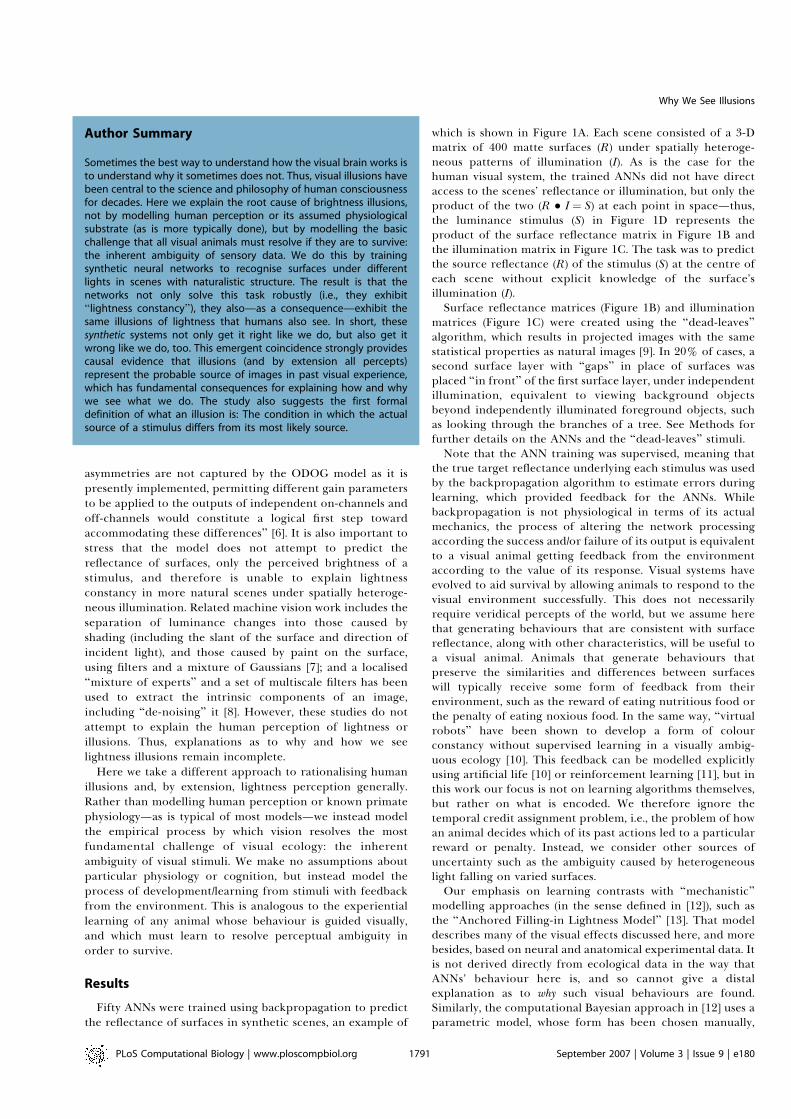
which is shown in Figure 1A. Each scene consisted of a 3-Dmatrix of 400 matte surfaces (R) under spatially heteroge-neous patterns of illumination (I). As is the case for thehuman visual system, the trained ANNs did not have directaccess to the scenes’ reflectance or illumination, but only theproduct of the two (R * I ! S) at each point in space—thus,the luminance stimulus (S) in Figure 1D represents theproduct of the surface reflectance matrix in Figure 1B andthe illumination matrix in Figure 1C. The task was to predictthe source reflectance (R) of the stimulus (S) at the centre ofeach scene without explicit knowledge of the surface’sillumination (I).Surface reflectance matrices (Figure 1B) and illumination
matrices (Figure 1C) were created using the ‘‘dead-leaves’’algorithm, which results in projected images with the samestatistical properties as natural images [9]. In 20% of cases, asecond surface layer with ‘‘gaps’’ in place of surfaces wasplaced ‘‘in front’’ of the first surface layer, under independentillumination, equivalent to viewing background objectsbeyond independently illuminated foreground objects, suchas looking through the branches of a tree. See Methods forfurther details on the ANNs and the ‘‘dead-leaves’’ stimuli.Note that the ANN training was supervised, meaning that
the true target reflectance underlying each stimulus was usedby the backpropagation algorithm to estimate errors duringlearning, which provided feedback for the ANNs. Whilebackpropagation is not physiological in terms of its actualmechanics, the process of altering the network processingaccording the success and/or failure of its output is equivalentto a visual animal getting feedback from the environmentaccording to the value of its response. Visual systems haveevolved to aid survival by allowing animals to respond to thevisual environment successfully. This does not necessarilyrequire veridical percepts of the world, but we assume herethat generating behaviours that are consistent with surfacereflectance, along with other characteristics, will be useful toa visual animal. Animals that generate behaviours thatpreserve the similarities and differences between surfaceswill typically receive some form of feedback from theirenvironment, such as the reward of eating nutritious food orthe penalty of eating noxious food. In the same way, ‘‘virtualrobots’’ have been shown to develop a form of colourconstancy without supervised learning in a visually ambig-uous ecology [10]. This feedback can be modelled explicitlyusing artificial life [10] or reinforcement learning [11], but inthis work our focus is not on learning algorithms themselves,but rather on what is encoded. We therefore ignore thetemporal credit assignment problem, i.e., the problem of howan animal decides which of its past actions led to a particularreward or penalty. Instead, we consider other sources ofuncertainty such as the ambiguity caused by heterogeneouslight falling on varied surfaces.Our emphasis on learning contrasts with ‘‘mechanistic’’
modelling approaches (in the sense defined in [12]), such asthe ‘‘Anchored Filling-in Lightness Model’’ [13]. That modeldescribes many of the visual effects discussed here, and morebesides, based on neural and anatomical experimental data. Itis not derived directly from ecological data in the way thatANNs’ behaviour here is, and so cannot give a distalexplanation as to why such visual behaviours are found.Similarly, the computational Bayesian approach in [12] uses aparametric model, whose form has been chosen manually,
PLoS Computational Biology | www.ploscompbiol.org September 2007 | Volume 3 | Issue 9 | e1801791
Author Summary
Sometimes the best way to understand how the visual brain works isto understand why it sometimes does not. Thus, visual illusions havebeen central to the science and philosophy of human consciousnessfor decades. Here we explain the root cause of brightness illusions,not by modelling human perception or its assumed physiologicalsubstrate (as is more typically done), but by modelling the basicchallenge that all visual animals must resolve if they are to survive:the inherent ambiguity of sensory data. We do this by trainingsynthetic neural networks to recognise surfaces under differentlights in scenes with naturalistic structure. The result is that thenetworks not only solve this task robustly (i.e., they exhibit‘‘lightness constancy’’), they also—as a consequence—exhibit thesame illusions of lightness that humans also see. In short, thesesynthetic systems not only get it right like we do, but also get itwrong like we do, too. This emergent coincidence strongly providescausal evidence that illusions (and by extension all percepts)represent the probable source of images in past visual experience,which has fundamental consequences for explaining how and whywe see what we do. The study also suggests the first formaldefinition of what an illusion is: The condition in which the actualsource of a stimulus differs from its most likely source.
Why We See Illusions

whereas the ANNs used here are a nonparametric model,derived entirely from the data.
Lightness ConstancyAfter training, each ANN was tested with 10,000 novel
images created in the same way as the images in the trainingset, and the ANN’s prediction of the reflectance of each targetpatch was recorded. The average root-mean-squared (RMS)error for predicted reflectance to the novel test set was 0.171(with a standard deviation of 0.0016) and the errorsapproximated a Gaussian distribution (Kolmogorov-Smirnovnormality test; p ’ 0). Thus, trained ANNs—like humans—were able to accurately and robustly predict the reflectance ofthe central surface from uncertain sensory data; i.e., theANNs exhibited ‘‘lightness constancy’’ (see related work ondepth processing [14], the evolution of visually guidedbehaviour in virtual robots [15], and distance perception[16]; and on perceiving colour constancy by estimating theillumination of a scene using higher-order statistics [17]).Robust response accuracy, however, varied according to thenature of the stimulus. When, for instance, the central targetwas viewed against a uniform background with uniformillumination (rather than against a fully articulated sur-round), the RMS error increased significantly to 0.20 (s.d.0.015; t-test: p’ 0, n!50). An equivalent decrease in lightness(and colour) constancy in low variance scenes is also evidentin human perception [18–21]. The study here suggests thatthis is because increasing the number of surfaces in a scene(i.e., ‘‘articulation,’’ which is a subset of the more generalphenomenon of ‘‘cue-combination’’) narrows the distributionof possible sources of a stimulus, which has been suggestedpreviously in human studies but never tested directly [20,21].
Brightness ContrastA basic aspect of human lightness and brightness is that
these phenomena do not always accord with stimulusintensity, which is to say we see illusions. The most basic,well-known, and most thoroughly studied illusion is ‘‘bright-ness contrast,’’ where a central target against a lighterbackground appears darker than the same target viewedagainst a darker background (as will be evident to the readerwhen viewing the two small patches at the middle of the lightand dark surrounds in Figure 2A). To test whether trainedANNs also behave in accordance with this illusion, ANNswere presented with ‘‘hand-made’’ stimuli, in which a targetstimulus of 0.5 was embedded on uniform surrounds thatvaried from 0 to 1. The darkest surrounds lead to an averageoverestimation error of 0.36, whereas the lightest surroundslead to an average underestimation error of 0.17. Thus, trainedANNs did indeed exhibit brightness contrast. What is more,the data show that they also exhibited an asymmetry in therelative effects of the darker versus lighter surrounds, withthe darker surround ‘‘carrying’’ most of the illusion.Remarkably, this latter asymmetry is also evident in humanperception [1,6,22]. The anchoring model [1] explains this interms of a weighted sum of global and local anchoring and‘‘scale normalisation’’ effects; however, while that model fitsthe psychophysical data, it is not predictive as to the strength
Figure 1. Synthetic ‘‘Dead-Leaves’’ Stimuli
(A) ‘‘Dead-leaves’’ example, composed of occluding circular disks withradius r and distribution 1/r3. The intensity of each ‘‘leaf’’ isindependently drawn from a uniform distribution.(B) Reflectance matrix (R), which represents a 20 3 20 subsectionrandomly chosen from the larger ‘‘dead-leaves’’ stimulus. Typically,between 40 and 60 ‘‘leaves’’ were at least partially visible in eachreflectance map.(C) The light falling on a typical surface will come from many sources, sowe model illumination with a more gradual change across space than forreflection (see Methods for details). The example illumination matrix (I)shown here is a 203 20 section chosen from a similar map as R but withlarger disks than with reflection maps, typically containing 10–15 leaves.These were then heavily blurred producing maps of typically 200–400
distinct levels of intensity, but with a high level of spatial correlation.(D) Stimulus intensity matrix (S), which is the pixel-wise product of B andC: S ! I3 R. All the values are in the range 0. . .1.doi:10.1371/journal.pcbi.0030180.g001
PLoS Computational Biology | www.ploscompbiol.org September 2007 | Volume 3 | Issue 9 | e1801792
Why We See Illusions

of the effect, because the weight is never explicitly defined. Aprobabilistic model more similar to the one here alsoexplains the nonlinear relationship between lightness andintensity in terms of possible real-world sources of anambiguous stimulus [22], if the relative contributions ofreflectance and illumination can be estimated. However, thenonlinearity in brightness contrast, which can be inferredfrom this model, is symmetrical, not asymmetrical as it ishere—and in human perception.
Our model suggests a more explicitly data-driven explan-ation. We express the reflectance R and illumination I asfractions of their potential maximum values, so in all cases 0, I , 1 and 0 , R , 1. Because the stimulus intensity S! I *
R, it is similarly bounded between zero and one. Therefore,
the value of S defines the minimum possible illumination andreflectance of a target. As an example of this, suppose that S!0.7 in some particular stimulus; the darkest possible value ofR corresponds to the maximum illumination I! 1, giving R!0.7 as the minimum lightness possible. If the exact illumina-tion is unknown, then the bounds are 0.7 " R " 1 in this case,and conversely, 0.7 " I " 1. In the extreme, if S!1, then R!1and I ! 1 are the only possible sources and the stimulus istotally unambiguous. Conversely, images (or parts of images)with low luminance intensity are more ambiguous—i.e., havea wider range of possible scores for I and R—than high-intensity images. This increased range of possible sources ofdarker images leads to a greater magnitude of perceptualerrors on average, which translates into a larger over-
Figure 2. Brightness Contrast Stimuli
(A) Simultaneous brightness contrast illusion. See text for explanation.(B) Articulated surrounds with mean S! 0.25 and S! 0.75 with same target intensity S ! 0.4. See text for explanation.(C) Concentric rings, both with an average intensity of S ! 0.5 and a target intensity of S ! 0.5.In (A–C), ANNs predict a higher reflectance for the stimulus on the left compared to the stimulus on the right.doi:10.1371/journal.pcbi.0030180.g002
PLoS Computational Biology | www.ploscompbiol.org September 2007 | Volume 3 | Issue 9 | e1801793
Why We See Illusions

estimation of reflectance compared to lighter surrounds onaverage, assuming that negative values are never predicted.We are not claiming that visual systems must explicitlycontain such a model of physics, or that the exact values mustbe known, but only that past experiences of the consequencesof the physics of the environment are encoded in the system,and so behaviour guided by such experiences will lead to theobserved patterns of errors.
Other Lightness IllusionsAn important aspect of brightness contrast in humans is
that the strength of the illusion is as much a function ofstimulus structure as it is of stimulus intensity. For instance,increasing a scene’s articulation (as in Figure 2B) increaseshuman perception of brightness contrast considerably[23,24]. Similarly, when presented with targets on two fullyarticulated surrounds (one light, one dark), the difference inthe predicted reflectance of the identical targets wasincreased (Figure 2B). Also, altering the spatial configurationof a target’s surround, without altering the average lumi-nance, can create the illusion of brightness contrast. Whenthe nets were presented with targets on surrounds ofidentical average intensity, but of differing spatial structure(Figure 2C), they continued to underestimate the target on alocal light surround, and overestimate the target in a local darksurround much like humans, specifically outputting R! 0.32(0.025) and R ! 0.74 (0.011), respectively, for the imagesshown in Figure 2C. The papers summarised in [23] discussvarious aspects of articulation in detail, including the effectof both the number of surfaces in a scene and their structuralorganisation. Similarly here, it is not simply increasing thenumber of surfaces that leads to better constancy (and so tosmaller errors), but the structure of the articulation. Morespecifically, what matters is past experience regarding theprobable source of that articulated information, as has beensuggested previously [23].
The ANNs were next tested on other, more complex butwell-known brightness contrast–like phenomena, specificallythe Vasarely illusion, Mach bands, Chevreul patterns, and theHermann grid. In the Vasarely illusion (Figure 3A), thecorners of each repeated square appear brighter than theirimmediate surround (which results in what looks like a four-edged star), even though the stimulus is uniform at thesejunctions. In Mach bands (Figure 3B), a linear gradientappears to be flanked by a highlight at the lightest end of thegradient and a ‘‘lowlight’’ at the gradient’s minimum. Neitherof these features actually exists in the intensity profile of thestimulus. In Chevreul patterns (Figure 3C), uniform barsappear graded in lightness. And in the Hermann grid (Figure3D), light spots appear at the central junction of the darklines where no light dot actually exists. The 50 trained ANNswere presented with each of these stimuli in turn, none ofwhich were presented during training. Their average re-sponse is shown in the corresponding row of the right columnin Figure 3A–3D. By comparing the stimulus’ intensity profile(red line) with the nets’ response profile (blue line) at eachcorresponding point, it is clear that, as before, the networksexhibit responses that are qualitatively similar to humanperception in each instance. (Whether they are quantitativelysimilar to human perception is not relevant, given theinevitable differences in complexity between natural ecologyand the ‘‘dead-leaves’’ ecology.)
White’s IllusionThe results thus far are consistent with the hypothesis that
human illusions of lightness are caused by nothing more (orless) than image ambiguity and its empirical—and thusstatistical—resolution. The above contrast illusions, however,are also consonant with many other models predicted on, forinstance, the statistics of natural images or assumption aboutlow-level and mid-level processing [1,5,24–25]. Indeed, anymodel that incorporates lateral inhibitory connections, suchas centre/surround receptive fields, will predict most of theabove phenomena (e.g., [5,25]), which is the typical explan-ation in most neuroscience textbooks. Few explanations,however, can simultaneously predict both brightness contrast(including its asymmetry) and brightness assimilation—e.g.,White’s illusion—without recourse to one or more adjustablefree parameters [25]. (Important exceptions include the filtermodel discussed previously [5] and a statistical approachwhich uses a database of natural scenes to estimateprobability distributions over structures in lightness stimuli,including White’s stimulus [26].) What makes these twoillusions difficult to reconcile simultaneously is that theyare diametrically opposed to one another. In brightnesscontrast, the target on a dark surround appears lighter thanthe same target on a light surround (Figure 2A), whereas theopposite is true for assimilation in general and White’sillusion in particular: the target on the overall darker localsurround appears darker (not lighter) than the same target onthe overall lighter local surround (Figure 3E; see [1] for anelegant description of these phenomena and their currentexplanations). White’s stimulus can be interpreted as a seriesof vertical dark and light bars partially obscuring a pair ofmid-grey bars on a monochrome background.Here, the trained ANNs exhibited both brightness contrast
andWhite’s illusion (see right column of Figure 3E). As always,the emergent behaviour of the ANNs can be explained interms of the statistics of their visual experience. Of particularrelevance is their experience with the 3-D layering of thesurfaces in space. A separate group of ANNs was trainedusing scenes composed of surfaces in only one depth plane,consisting of the same ‘‘dead-leaves’’ images described in theMethods section, but without the separate mask layer on anyof the stimuli. Compared to the main group of ANNs, theselost the ‘‘ability’’ to see White’s illusion, but maintained theability to see lightness constancy, brightness contrast, andrelated phenomena (unpublished data). Thus, when pre-sented with surfaces at different depth planes underindependent illumination, the ANNs learned to ignoreinformation arising from surfaces that were not co-planarwith the target; since illumination of each depth-plane isindependent, only co-planar information provides statisticalinformation about the probable source of the target. Thus,changing the ecology (by introducing layers using masks)leads directly to a change in behaviour (the ANNs’ responseto White’s stimulus) showing a causal link between the two.It is important to emphasise, however, that while White’s
illusion only arises when the networks had experience of 3-Dscenes, this is not equivalent to saying that the networks‘‘represented’’ depth in their post-receptor processing. In-deed, it is highly unlikely that the networks encode depthinformation explicitly, or indeed contour junction cues, ashas been posited for human visual processing, since varying
PLoS Computational Biology | www.ploscompbiol.org September 2007 | Volume 3 | Issue 9 | e1801794
Why We See Illusions

PLoS Computational Biology | www.ploscompbiol.org September 2007 | Volume 3 | Issue 9 | e1801795
Why We See Illusions

the spatial frequency of the stimulus or the height of theindividual test patch varies the strength of the illusoryresponse (see Figure 4A and 4B, respectively) without alteringthe stimulus’ junctions. More specifically, decreasing thespatial frequency of the stimulus and/or target heightdecreases the ANNs’ perception of White’s illusion withoutaltering the stimulus’ junctions. Remarkably, these latter twoobservations have also been made of human perception ofWhite’s stimulus [5].
Seeing without ContextNot all human lightness illusions are a consequence of
spatial context, and in these cases we found furthersimilarities between the ANN’s behaviour and human visual
perception. For instance, when viewed in a ‘‘void’’ (i.e., on ablack surround), the relationship between a surface’s stimulusand its (human-) perceived lightness is not linear, but followsthe power law w(S)! kSa, where w(S) is the perceived lightness,S is the physical intensity of the stimulus, k is a scalingconstant, and a is the exponent that describes the shape ofthe relationship to perceived lightness. For humans, the valueof the exponent a typically varies between 0.33 to 0.5 indifferent studies [27]. When the ANNs are presented withuniform images of increasing intensity, the relationshipbetween target intensity and predicted reflectance alsofollows a power law with an exponent (a) that equals0.334—broadly similar to humans.
Figure 4. White’s Stimuli and ANN Responses
(A) Three White’s stimuli of varying spatial frequency and (B) three White’s stimuli with different target patch heights. In all cases, the left-hand targetpatch has the same intensity as the right-hand patch, but generally appears darker to humans. The stimuli seen by the ANNs are 203 20 pixels.(C) Mean ANN responses to White’s stimuli of varying frequencies with varying test patch heights. Each value is the difference in predicted reflectancefor the two test patches. A positive difference means that the test patch on the light bar appears darker than the test patch on the dark bar; a negativedifference means the test patch on the light bar appears lighter than the patch on the dark bar. The former is consistent with White’s illusion, the latterwith brightness contrast. The results show i) that decreasing the frequency of the background stripes (i.e., making them wider) also decreases thestrength of White’s illusion; and also ii) that increasing the height of the test patch decreases the strength of White’s illusion. Both results correspond tohuman psychophysical responses [5].doi:10.1371/journal.pcbi.0030180.g004
Figure 3. Artificial Neural Network Responses to Optical Illusions
(A) Vasarely illusion stimulus on left. Note the illusory regions of lightness along the diagonals formed by the corners of the concentric squares. Blue lineon right indicates the intensity profile at the corresponding points of the blue line on the left. Red line shows the relative reflectance predicted by thenetworks. Units are arbitrary and so are not plotted throughout this figure.(B) Mach band stimulus consisting of a dark bar (left) and a light bar (right) with a linear gradient between. Blue line on right indicates the intensityprofile at the corresponding points of the blue line on the left. Red line shows the relative reflectance predicted by the networks.(C) Chevreul illusion stimulus, with five bars of uniform reflectance. Blue line on right indicates the intensity profile at the corresponding points of theblue line on the left. Red line shows the relative reflectance predicted by the networks.(D) Hermann grid illusion stimulus. Blue line on right indicates the intensity profile at the corresponding points of the blue line on the left. Red lineshows the relative reflectance predicted by the networks.(E) White’s illusion on left. The grey areas indicated have the same physical reflectance, although the left-hand one appears darker than the other. TheANN response on the right corresponds to this human experience, with the first perceived reflectance (1) being darker than the second (2).doi:10.1371/journal.pcbi.0030180.g003
PLoS Computational Biology | www.ploscompbiol.org September 2007 | Volume 3 | Issue 9 | e1801796
Why We See Illusions

Discussion
The ANNs used here are structurally unlike the humanvisual system: they are smaller and less complex; they lackrecurrent connections, spiking, adaptation (after learning iscomplete), and so on; they are nonhierarchical, and so cannotgenerate behaviours according to so-called ‘‘top-down,’’‘‘mid-level,’’ or ‘‘cognitive’’ influences on ‘‘bottom-up’’processing. Indeed, these ANNs lack all the proximalmechanisms that are usually thought to be the immediatecause of human visual illusions. Instead, the output of eachANN is driven solely by the statistics of its training historyinstantiated in the functional architecture of its network.Though sometimes seen as a drawback, this simplicity is takenadvantage of to rationalise human illusions, not by modellingwhat is currently known of human perception and/or primateneurophysiology, but by modelling the inherent ambiguity ofhuman and nonhuman visual ecology that all natural systemsmust solve to survive, and its empirical resolution. Thisextends several recent studies that have found relationshipsbetween the statistics of images of natural scenes and humanperception (e.g., [25–26,28–30]). We can begin to move fromcorrelative to causative explanations.
Perception can be defined as the process of acquiring andorganising information from sensors. The input nodes of theANNs are presented with images in terms of the luminanceintensity across space, from which the ANNs must extractscene information, specifically the reflectance of a targetpatch. This is equivalent to one of the many tasks that thehuman visual system performs. The Oxford English Dictionarydefines an illusion as ‘‘something that deceives or deludes byproducing a false impression.’’ Every instrument has meas-urement errors and the human visual system is no exception.So every percept will have an error associated with it, be itlarge or small. Errors in visual perception are defined as thedifference between what is seen and what the actual physical
quality of the retinal stimulus with which the percept isassociated is [1], irrespective of whether the physical source isever known. Given this definition, a so-called ‘‘illusoryimage,’’ such as the stimuli in Figure 3, is one that inducesperceptions that deviate from the underlying reality of theimage, a view consistent with recent Bayesian frameworks ofconstancy (e.g., [12]). There is, however, no absolute thresholdon these errors that defines a percept as illusory or non-illusory. We must therefore consider the magnitude ofperceptual errors and relate these to the past experiencesof the observer.Returning to the ANNs used earlier, recall that when shown
novel ‘‘dead-leaves’’ images, the RMS error was 0.171.Furthermore, approximately 79% of the predictions werewithin 60.2 of the target, and just 1% of the errors weregreater than 60.5; i.e., most images were interpretedapproximately correctly, but none perfectly. The equivalenterror for simultaneous brightness contrast (Figure 2A), with amid-grey patch on a black background, was 0.36 (s.d. 0.032),an unusually large error. As a specific example, Figure 5shows the range of all possible reflectances of a single targetpatch (x-axis) and their relative probabilities (y-axis), for asingle ‘‘dead-leaves’’ stimulus. The probabilities are derivedfrom the past experiences of a single ANN, and the peak onthe curve corresponds to a reflectance (R) of 0.93. This is bydefinition the ‘‘most likely source’’ of this particular stimulusin the ANN’s past visual experience. If the actual reflectanceof the stimulus under consideration is close to the most likelysource of the stimulus (i.e., a surface with a reflectance closeto 0.93), then the prediction/percept is ‘‘correct’’ and wewould say that lightness constancy holds. One would also saythat the percept is not an illusion. If, on the other hand, theactual reflectance happened not to be near the most likelysource of the stimulus (i.e., more than or less than 0.93), thenwhile the predicted reflectance would have been ‘‘correct’’most of the time, it would be ‘‘wrong’’ in this particular instance,lightness constancy would have failed, and the percept wouldbe called an illusion. What is more, the further into the tail of‘‘unlikeliness’’ the source of the stimulus is, the more‘‘illusory’’ the percept becomes, suggesting that illusions oflightness and lightness constancy exist on a continuum, asopposed to being fundamentally different kinds of phenom-ena.It is therefore misleading to describe any stimulus as being
an illusion in isolation. Instead, one can describe the truesource of a stimulus as being unlikely given the pastexperiences of a particular observer, and therefore likely toinduce an erroneous percept in that observer. Given thesimilarity of the shared experiences of humans, and ourshared genes, it should not be surprising that the patterns oferrors that we make are also shared. The exact distribution oferrors for human or animal perception is hard to quantify,and the factors leading to more or less lightness constancy arelargely unknown [23]. However, it seems clear that mostresponses are approximately correct, at least where it ispossible to measure the true source, although constancy doesfail significantly in some cases. The nearest human psycho-physical study that we are aware of measures colourconstancy for coloured papers under varying illumination[31]. They define a constancy index that ranges from 0 for noconstancy to 1 for perfect constancy, the latter meaning thata surface colour is perceived according to the surface spectral
Figure 5. Conditional Probability Distribution of Reflectance Given PastExperience and a Particular Stimulus as Context
A maximum-likelihood estimation allows the observer to predict thetarget reflectance and will be correct (approximately) most of the time. Ifthe true reflectance actually lies in a low-likelihood tail of thedistribution, then the resulting percept is an illusion.doi:10.1371/journal.pcbi.0030180.g005
PLoS Computational Biology | www.ploscompbiol.org September 2007 | Volume 3 | Issue 9 | e1801797
Why We See Illusions

properties alone (and not illumination, for example). Theymeasure a colour constancy index of around 0.8, although inmany experiments the index was much lower. Constancy canbe seen as the inverse of illusions, if we assume that theconstant response has a small error under a range ofilluminations, and illusions generate large errors. The errorsof the ANNs suggest a similar magnitude of constancy,although direct comparison between such different measuresis never ideal. We know of no such score for lightnessconstancy under typical, natural conditions, but it isreasonable to suppose a broadly similar continuous distribu-tion exists for humans, too.
In conclusion, the emergent similarity between humanperception and the ANNs’ output provides direct support forthe view that illusions are caused by (as opposed to merelycorrelated with) the statistics of past visual experiencetowards surfaces in space under spatially heterogeneousillumination given ambiguous image data. Because stimulusambiguity is an inherent challenge of natural visual ecology,illusions must also be inevitable in nature, suggesting thathuman illusions are common to all visual animals despite vastdifferences in their underlying neural machinery, which hasimportant consequences for thinking about the biologicaland computational principles of vision. Evolving or trainingsynthetic systems in ecologically relevant environmentsprovides an important new strategy for uncovering whatthese principles are that usefully map images to scenesaccording to the statistics of experience. Finally, the studyprovides a clear description of what an illusion is, and why wesee them: an illusion describes the condition in which theactual source of a stimulus differs from the stimulus’ mostlikely source given the observer’s past experience.
Methods
Artificial neural networks. The ANNs used here were standardmultilayer perceptrons trained via backpropagation. We use multi-layer perceptrons because they are known to be universal approx-imators, capable of learning arbitrary mappings from a finite set ofexamples. In preliminary experiments, we achieved similar resultsusing support vector regression methods (unpublished data), andbelieve that any suitable powerful nonlinear multivariate regressiontool would work as well. The behaviour we describe is ultimately dueto the data, not the learning algorithm.
Each ANN had 400 inputs nodes, one for each pixel of the stimuli;four hidden nodes in one layer; and one output node. The trainingwas supervised, so the target reflectance in the training images wasused to estimate errors during the training. The output was thereforethe ANN’s prediction of the reflectance of the central target patch ofthe stimulus presented to it. The inputs consisted solely of thestimulus intensity, and not reflection or illumination explicitly. Allnodes were fully connected to nodes of their adjacent layers; therewere no connections between nodes of the same layer; andconnection weights could be positive or negative. Each ANN wasinitialised with random weights, then trained for 150 iterations with20,000 training images. These parameters were chosen based onpreliminary experiments, and are not critical. Many factors areknown to affect the performance of ANNs, such as the number ofhidden nodes, the learning rate, the number of training iterations(see Figures S1 and S2), the number of training examples, and so on.Furthermore, these factors tend to interact, making any exhaustiveanalysis effectively impossible, and making it difficult to guaranteethat any particular ANN is ‘‘optimal.’’ However, our aim here is notoptimality, but is rather to show that the results described in thepaper are robust, and, to demonstrate this, we now briefly analysesome of these parameter settings.
All nonparametric learning systems, including ANNs trained bybackpropagation, are prone to ‘‘overfitting,’’ when they accuratelymodel the data that they are trained with, but fail to generalise well tonovel data. One conventional solution is to stop training after a fixed
number of iterations, before this problem arises, which is why welimit the training algorithm to 150 iterations (see Figure S1).
To see the effect of varying the number of hidden nodes, wetrained a series of ANNs, each containing between one and 50 nodesin a single hidden layer. The minimum error corresponds to ANNswith four nodes in their hidden layer (see Table S1). However, a seriesof t-tests indicate that the other ANNs achieved performances thatwere not significantly different (p. 0.05 in all cases). Thus, the choicefor the number of nodes is somewhat arbitrary, reinforcing thenotion that it is the statistics of the training set that are critical,rather than the fine details of the learning algorithm.
Next we considered the number of training records used by thebackpropagation algorithm. Again, we trained a series of ANNs withsets of novel ‘‘dead-leaves’’ stimuli. Each ANN had four hidden nodes,but the number of training records varied from 333 to 20,000. Asexpected, being given more training examples allowed the ANNs toachieve a lower test error, because each independent trainingexample provides extra information about the underlying function(see Table S2). Given the trend of decreasing returns, increasing thenumber of records above 20,000 would make only a marginaldifference, with the cost of longer training times.
Each node of an ANN contains an activation (or ‘‘transfer’’)function, which takes the sum of the inputs and transforms it,typically rescaling the value to a fixed range. A typical activationfunction, which we use in the ANNs described in the main paper, isthe log sigmoid function, which produces values in the range [0, 1].The tan sigmoid function, which produces values in the range [#1,$1]and the linear transfer function, which produced unbounded values,were also used in new ANNs for comparison. As the errors in Table S3show, there is no significant difference between log sigmoid and tansigmoid functions, as expected. The pure linear activation function,which gives no bounds on the outputs, leads to significantly worseperformance. Thus the choice of a particular activation function isnot critical, although in the extreme case of a linear function,learning is considerably degraded.
We also tested some of these alternative ANNs with the various‘‘illusion’’ stimuli used elsewhere in the paper. As a simplifiedmeasure of different ANNs responses to the test ‘‘illusory’’ stimuli, wemeasured each ANN’s predicted reflectance for the test patches inthe brightness contrast, Hermann grid, and White’s stimuli (seeFigures 2A, 3D, and 3E, respectively). For each stimulus, we selectedtwo pixels that had identical reflectance values but generate illusoryresponses in humans. For each pair, we calculated the difference inthe ANN’s response, such that a score of zero means that they doNOT perceive any illusion, and a positive score corresponds tohuman perceptions. (This is the same differential measure used inFigure 4C.) The larger the positive score, the stronger the illusion isperceived. Negative scores indicate the ‘‘opposite’’ of humanperception. While there is no direct relationship between themagnitudes and human perception, they do provide an indicationof the strengths of the illusions for the ANNs. The overall effect isthat as training proceeds, the error drops and the strength of theillusions increases (Figure S2). This again shows that the appearanceof illusions is causally related to solving the lightness constancyproblem.
All experiments were carried out on a standard desktop PC usingMatlab 6.5 (Mathworks) and the Matlab Neural Networks toolboxversion 4.
‘‘Dead-leaves’’ images. A number of 2003 200 pixel ‘‘dead-leaves’’images were created following the algorithm presented by Lee et al.[9], which produces images with similar statistics as those that havebeen found in a wide range of natural scenes. The implementation weused was based on Matlab code provided in the Toolbox Signal (2006)by Gabriel Peyre. Each image was composed of a large number ofpartially occluding achromatic disks, which can be thought of as aseries of ‘‘dead leaves’’ falling on top of each other. The leaf radius isdistributed as 1/r3, so these images tend to have a few large ‘‘leaves’’and many smaller ones, much as with natural scenes. For presenta-tions to the ANNs, random 203 20 pixel samples were selected fromthese large images. The minimum-sized disk was fixed at 0.002 for thereflection maps and 0.01 for the illumination maps. The latter wereblurred by filtering with a Gaussian filter of size 83 8 with a width of15. The stimulus matrix presented to the ANNs is defined as S! I * R.Both I and R (and therefore S) are scaled in the range 0. . .1. Where asecond layer was used to create 3-D stimuli (in one-fifth of thetraining set), the same procedure was used to create the surfaces andthe illumination. The layer was then reduced to a series of randomhorizontal and vertical strips covering an average of 10% of theimage opaquely. The remaining 90% was unchanged. The targetcould be in either layer. We have not carried out any human
PLoS Computational Biology | www.ploscompbiol.org September 2007 | Volume 3 | Issue 9 | e1801798
Why We See Illusions

psychophysical experiments testing responses to these stimuli;however, the algorithm is designed to generate images that arestatistically similar to natural scenes, so we assume that humanresponses would be quite consistent with responses to natural scenes.
Preliminary work showed that if the distribution of the reflectanceand illumination maps were very similar, then the ability to resolvelightness constancy in the ANNs was reduced, though not abolished(unpublished data). Presumably, this is because every stimulus was soambiguous that resolution was increasingly difficult. Given thathumans and other animals can solve lightness constancy at least mostof the time, the real visual ecology must provide enough informationto allow the disambiguation to take place. In our simplified model,this is achieved by ensuring that the distributions of R and I aresufficiently different.
These ‘‘dead-leave’’ images, with heterogeneous light and partialmasking, represent a simple model ecology. The size of the distinctsurfaces within each scene follows the same distribution as found innatural scenes. The illumination is assumed to come from multiplesources, consistent with some light being reflected from nearbysurfaces. The reflectance map is therefore approximately piecewiseconstant, while the illumination map only changes smoothly, as in [4]and elsewhere. The addition of a second ‘‘masking’’ layer aims tosimulate effects such as the viewer looking through the branches of atree or through a windowframe. Such a simple model could beextended in many ways to make it more natural and realistic, such asadded colour, transmittance effects, depth, objects of varied shapewith or without attached shadows, sharp shadow edges, and so on.Several of these are the subject of ongoing work, which will allow awider range of visual behaviours to be studied, such as testing themodels’ response to colour illusion stimuli. Similarly, we have chosennot to model the eye explicitly, such as defining cone responsefunctions or light adaptation, instead concentrating on the moregeneric aspects of learning to respond to a visual ecology.
Supporting Information
Figure S1. Overfitting Caused by Training the ANN for Too ManyEpochsThe error on the training set continues to drop as the back-propagation algorithm continues, but the test error on novel ‘‘dead-leaves’’ images starts to rise after around 150–200 epochs. Thisoverfitting is a problem with any nonparametric learning algorithm,such as ANNs, and a typical solution that we adopt is to stop trainingafter a fixed number of iterations (150).Found at doi:10.1371/journal.pcbi.0030180.sg001 (36 KB DOC).
Figure S2. ANNs’ Response to Various Stimuli during TrainingFor each test stimulus, we selected two pixels that had identicalreflectance values but generate illusory responses in humans. For thebrightness contrast and White’s stimuli, we used the pair of test mid-grey patches, and for the Hermann Grid we used an ‘‘intersection’’pixel and an ‘‘edge’’ pixel halfway between two intersections. TheRMS error is the usual test against a novel set of ‘‘dead-leaves’’images. As training continues, the test error drops (left axis) and thestrength of the illusory percepts tends to increase (right axis).Found at doi:10.1371/journal.pcbi.0030180.sg002 (383 KB DOC).
Table S1. The Effect of the Number of Hidden NodesNone of the test errors is significantly worse than the optimum,corresponding to four hidden nodes (two-tailed t-test; p . 0.05 in allcases). In each case, the number of training epochs was adjusted tominimise the test error.Found at doi:10.1371/journal.pcbi.0030180.st001 (31 KB DOC).
Table S2. The Effect of the Number of Training Records on ANNswith Four Hidden NodesProviding more training examples leads to lower test errors, at adecreasing rate.Found at doi:10.1371/journal.pcbi.0030180.st002 (29 KB DOC).
Table S3. Various ANN Activation FunctionsTwo-tailed t-tests show that: log sigmoid is not significantly differentto tan sigmoid (p ! 0.067); log sigmoid is significantly better thanpure linear (p ’ 0); tan sigmoid is significantly better than pure linear(p ’ 0).Found at doi:10.1371/journal.pcbi.0030180.st003 (26 KB DOC).
Acknowledgments
We are grateful to Marcel van Gerven for his participation in theinitial stages of this study, and to Dale Purves and Emma Byrne forreading previous drafts of the manuscript.
Author contributions. RBL conceived and designed the experi-ments. DC performed the experiments. DC and RBL analyzed thedata and wrote the paper.
Funding. Work supported by European Union grant 27731.Competing interests. The authors have declared that no competing
interests exist.
References1. Gilchrist AL, Kossyfidis C, Bonato F, Agostini T, Cataliotti J, et al. (1999) An
anchoring theory of lightness perception. Psych Rev 106: 795–834.2. Kersten D, O’Toole A, Sereno M, Knill D, Anderson JA (1987) Associative
learning of scene parameters from images. Applied Optics 26: 4999–5006.3. Lehky SR, Sejnowski TJ (1988) Network model of shape from shading:
Neural function arises from both receptive and projective fields. Nature333: 452–454.
4. Kersten D (1990) Statistical limits to image understanding. In: Blakemore C,editor. Vision: Coding and efficiency. Cambridge: Cambridge UniversityPress. pp. 32–44.
5. Blakeslee B, McCourt ME (2004) A unified theory of brightness contrast andassimilation incorporating oriented multiscale spatial filtering and contrastnormalization. Vis Res 44: 2483–2503.
6. Blakeslee B, McCourt ME (1999) A multiscale spatial filtering account of theWhite effect, simultaneous brightness contrast and grating induction. VisRes 39: 4361–4377.
7. Bell M, Freeman WT (2001) Learning local evidence for shading andreflectance. Proceedings of the Eighth International Conference onComputer Vision; July 2001; Vancouver, Canada. Volume 1: 670–677.
8. Tappan M, Adelson E, Freeman WT (2006) Estimating intrinsic componentmages using non-linear regression. Proceedings of the IEEE Conference onComputer Vision and Pattern Recognition; 16–26 June 2006; New York,New York, United States. Volume 2: 1992–1999.
9. Lee AB, Mumford D, Huang J (2001) Occlusion models for natural images:A statistical study of a scale-invariant dead leaves model. Int J Comput Vis41: 35–59.
10. Schlessinger E, Bentley PJ, Lotto RB (2005) Evolving visually guided agentsin an ambiguous virtual world. Proceedings of the Genetic and Evolu-tionary Computation Conference; 25–29 June, 2005; Washington, D.C.,United States of America. pp. 115–120.
11. Sutton RS, Barto AG (1998) Reinforcement learning: An introduction.Cambridge (Massachusetts): MIT Press.
12. Brainard DH, Longere P, Delahunt PB, Freeman WT, Kraft JM, et al. (2006)Bayesian model of human color constancy. J Vision 6: 1267–1281.
13. Grossberg S, Hong S (2006) A neural model of surface perception:Lightness, anchoring, and filling-In. Spatial Vision 19: 263–321.
14. Becker S, Hinton GE (1992) Self-organizing neural network that discoverssurfaces in random-dot stereograms. Nature 355: 161–163.
15. Boots B, Nundy S, Purves D (2007) Evolution of visually-guided behaviourin artificial agents. Network: Comput Neural Sys 18: 1–24.
16. Pouget A, Sejnowski TJ (1994) A neural model of the cortical representa-tion of egocentric distance. Cerebral Cortex 4: 314–329.
17. Golz J, MacLeod DIA (2002) Influence of scene statistics on colourconstancy. Nature 415: 637–640.
18. Katz D (1935) The world of colour. London: Kegan Paul.19. Brown RO, MacLeod DIA (1997) Color appearance depends on the
variance of surround colors. Curr Biol 7: 844–849.20. Lotto RB, Purves D (1999) The effects of color on brightness. Nat Neuro 2:
1010–1014.21. Lotto RB, Purves D (2000) An empirical explanation of color contrast. Proc
Natl Acad Sci 97: 12834–12839.22. Nundy S, Purves D (2002) A probabilistic explanation of brightness scaling.
Proc Natl Acad Sci 99: 14482–14487.23. Maloney LT, Schirillo JA (2002) Color constancy, lightness constancy, and
the articulation hypothesis. Perception 31: 135–139.24. Adelson EH (2000) Lightness perception and lightness illusions. In:
Gazzaniga M, editor. The new cognitive neurosciences. 2nd edition.Cambridge (Massachusetts): MIT Press. pp. 339–351.
25. Dakin SC, Bex PJ (2003) Natural image statistics mediate brightness ‘‘fillingin.’’ Proc Roy Soc B 270: 2341–2348.
26. Yang Z, Purves D (2004) The statistical structure of natural light patternsdetermines perceived light intensity. Proc Natl Acad Sci 101: 8745–8750.
27. Stevens SS (1966) Concerning the measurement of brightness. J Opt SocAm A 56: 1135–1136.
PLoS Computational Biology | www.ploscompbiol.org September 2007 | Volume 3 | Issue 9 | e1801799
Why We See Illusions

28. Simoncelli EP, Olshausen BA (2001) Natural image statistics and neuralrepresentation. Annu Rev Neurosci 24: 1193–1216.
29. Long F, Purves D (2003) Natural scene statistics as the universal basis forcolor context effects. Proc Natl Acad Sci 100: 15190–15193.
30. Howe CQ, Purves D (2004) Size contrast and assimilation explained by thestatistics of scene geometry. J Cog Neurosci 16: 90–102.
31. Brainard DH (1998) Color constancy in the nearly natural image. 2.Achromatic loci. J Opt Soc Am A 15: 307–325.
PLoS Computational Biology | www.ploscompbiol.org September 2007 | Volume 3 | Issue 9 | e1801800
Why We See Illusions