whales in fjords - wordpress.com · survey design, preliminary data ... how will unprecedented...
TRANSCRIPT

NGS Research Report Keen W268-13
1
Research Report
Whales in Fjords: The pre-tanker ecology of inland whales, seabirds, & their prey in the
northern Great Bear Fjordland, B.C.
Eric Keen Scripps Institution of Oceanography Grant W268-13

NGS Research Report Keen W268-13
2
Abstract Endangered baleen whales have begun reinvading the temperate fjords of British Columbia's north coast, where they forage intensively and socialize, just as a suite of oil and natural gas tanker routes have been proposed for the area. We must rush to document this unprecedented concentration of inland whales before any impacts from maritime development can take effect. In 2013 I conducted four months of visual, acoustic, and oceanographic surveys within a broad transect of the northern fjords aboard my 12m research cutter. In each circuit we conducted water column sampling (CTD, Secchi, and zooplankton net casts) at 24 stations, between which we conducted four line-transect surveys concurrently: 1) distance sampling for marine mammals and vessels; 2) strip-width sampling for seabirds, jumping salmon and tidal features; 3) dual-frequency echosounder transects to map schools of fish and zooplankton; and 4) passive acoustic monitoring using a towed hydrophone array. When whales were seen, they were approached for detailed behavioral observations, photo-identification, fecal collection, passive acoustics, and echosounder imagery of their surrounding prey field. Special focus was given to fin whales, the newest arrival species to the fjordland and the least studied. My first season of fieldwork has provided a proof of concept for this project, a fine-tuned survey design, preliminary data with which to prepare my analytical approach, and promising media. I can’t wait to get back out there.
All photographs herein are by signed project members of this grant.

NGS Research Report Keen W268-13
3
Background
Endangered baleen whales are now reinvading the temperate fjords of British Columbia's north coast. There, at the interface of the Great Bear Fjordland and the subarctic Pacific, fin and humpback whales have begun to use the protected, productive waterways to forage intensively and socialize. Their return raises questions about the current and past importance of such fjords to species that have historically been considered offshore. As their populations continue to recover from 20th century whaling, how and to what extent will they come to rely on this habitat? Conversely, what is the potential importance of these whales to the ecological function of the north coast? These academic questions have become applied in light of proposed crude oil and natural gas tanker routes through the Great Bear waterways. How will unprecedented vessel noise, ship strikes, and possible spills impact these inland whales, and by extension the place as a whole? Answers here are difficult. As mobile predators whose habitat use depends entirely on transient prey conditions, the response of whales and seabirds to maritime development cannot be assessed by counting the predators alone. The biological oceanography of the place must be monitored on multiple trophic levels. I see my dissertation as an opportunity to study the foraging strategies and ecology of these inland whales while simultaneously collecting baseline data for the impact assessment of escalated resource trafficking in the Great Bear.
Methods Study Area The study area comprises a broad (1,220 km2) inshore-offshore transect of the inland waterways in northern British Columbia, Canada, where the northern Great Bear Fjordland meets Pacific waters within the marine territory of the Gitga'at First Nation (Fig. 1). While the entirety of British Columbia’s 27,000 km coastline is complex, this area comprises one of its few deep-cut fjordlands that open directly to the Pacific. As such, the study area is semi-enclosed by natural boundaries, rendering it an ideal system for focused study. Study Plan We performed repeated circuits of the study area, consisting of systematic water column sampling at a systematic grid of
−129.6 −129.4 −129.2 −129
52.8
5353
.253
.4
Longitude (°)
Latit
ude
(°)
●
●
●
●
●
●
●
●
●
●
●
●
●
●
●
●
●
●
●
●
●
●●
●
●●
●
●
●
●
●
●
●
●
●
●
●
●
● ●
●
●
●
●
●
●
●
●
●
●
●
●
● ●
●
●
●
● ●●
●
●
●
●
●
●●
●●
●
●
●
●
●
●
●
●
●
●
●
●
●
●
●
●
●
●
●●
●
●
●
●
●
●
VerneyMcKayWrightSquallyWhaleEstevanCampaniaCaamano
●
●
TransectStation
0 5 10 km
Fig. 1. Study plan.

NGS Research Report Keen W268-13
4
stations, visual and acoustic transects between those stations, and thorough investigations of all marine mammal sightings (Fig. 2) whenever they occurred. Our goal was to complete four “oceanographic” circuits and four additional “predator-prey” circuits of this area within the summer season. This distribution of effort allows for higher-quality, more intensive circuits at the calculated cost of less repetition. The circuit is partitioned into 9 geographic blocks according to natural patterns in geography, bathymetry, and human use (Fig. 1). “Oceanographic” Circuits: Every time we return to a block, we follow the same exact route through it, stopping at the same points ("stations") to conduct water column sampling (CTD, Secchi cast, and zooplankton tow). Over the course of a circuit, we conduct roughly 351.85 km of transects and sample at 24 oceanographic stations. “Predator-Prey” Circuits: Between oceanographic circuits, repairs permitting, we conduct a relatively quick circuit that consists of visual and acoustic surveys, no oceanographic stations, and more time “with whales”. This study design, when replicated multiple times per season for multiple seasons, will allow me to broadly characterize the geographic and temporal dynamics of the Great Bear’s summer pelagic ecosystem. Several aspects of local oceanography, including water column structure, zooplankton diversity, and the seabird community, remain poorly studied. Moreover, I will be able to offer quantitative answers to questions regarding the relationship between fjordland tetrapods and their prey prior to any impacts imposed by tankers. These questions include:
- Local dynamics: How many baleen whales and seabirds are using this habitat, and how does that use change spatially and behaviorally throughout the summer?
- Threshold foraging: What are the prey conditions (relative density, depth, and patchiness of schools) in which cetaceans and seabirds are foraging, and how do they compare to ambient conditions in the study area?
- Fin whale acoustics: Are fin whales vocalizing in the study area? If so, what behaviors or conditions
are associated with their call rates? This will determine the potential efficacy of passive acoustic monitoring for mitigating ship strikes of this endangered species.
- Baseline for assessment, basis for mitigation: Are oceanographic changes within the study area,
and the response of whales to those changes, predictable enough to inform a policy of adaptive tanker traffic control that minimizes impacts to whales?
The study regime in both circuit types makes for relatively full survey days, but still provides adequate time for thorough “closing” with whales we see along the way. An additional objective in this study was to bear witness to the raw natural history of the area, those interactions and events that one could never design for: competitive or cooperative interactions between predators, the escalation and dissipation of huge, multi-species feeding events, and interactions between local vessels and marine mammals. The 2013 field season verified that this design was at or near the maximum effort that crew and the vessel are able to sustain (Fig. 3). Vessel The SV Bangarang is a Canadian-built 1980 Cooper Seabird 37' (12 m) center-cabin cutter. ). Her 3/4 keel draws 4.0 ft, her displacement is 18,000 lbs, and her cruising speed is 6 knots at 0.68 gal/hr. Her 1980 Perkins 4.108 diesel engine has 45 hp at 2200rpm, and an estimated 3,000 hours as of November 2013. The vessel also features a cockpit fully protected by a new dodger and bimini, as well as a stateroom, kitchen, dinette, salon, and two heads. Bangarang sleeps 3 quite comfortably, 4 comfortably if two are a couple, and 5 if needed. The aft head has a semi-functional shower. Motorsailers are not an uncommon platform in cetology (e.g. Papastavrou et al. 1989, Gordon et al. 1999, Dawson et al. 2008), including fin whales studies (Panigada et al. 2005). They are seaworthy, highly fuel efficient, safe, and silent when conditions allow sailpower.

NGS Research Report Keen W268-13
5
Stations Within each circuit, we conduct casts of CTD, Secchi disk, and our cylindrical-conical plummet zooplankton net (.7m diameter, 2.8 long, 333µ mesh, 250m depth, after Heron 1982 and Keen 2013) at 24 systematically spaced stations. The plankton net is equipped with a calibrated flowmeter in order to determine the actual volume of water sampled during each tow. Its samples are preserved in a buffered 5% formaldehyde-seawater solution. The fixative is stored on-deck above the aft cabin, contained in a “Preservation Station” that is secured to the mainsheet traveler. Fixed samples are stored in 27oz. Whirl-Pak bags, which are ideal for our circumstances because they are shatterproof, economical and space-efficient when not yet used. Transects While underway between stations, we conduct full-effort transects. Designing transect surveys in complex coastal habitats is notoriously difficult (Dawson et al. 2008, Thomas et al. 2007), whether it be for hydroacoustics, distance sampling, or strip-width sampling. Designing to accommodate all three is a special challenge, but our objectives demand it: we want to investigate the predator density found within the prey fields of each study block and test how their overlap differs among blocks and throughout the season. A secondary objective is using these visual surveys to infer local predator population sizes for the study area as a whole. In our study, both stations and transects were positioned with the practicalities of swell, wind patterns, and viable anchorages in mind, but randomly with respect to known cetacean and seabird hotspots. In this way our design can still be used to make inferences about the populations in question (Thomas et al. 2007). 1. Acoustics: Echosounder surveys of prey school distribution While navigating transects, we are recording images of the underwater prey field using a Syqwest Hydrobox dual-beam echosounder. These echograms will provide a map of the ambient (i.e., average) depth, distribution, and patchiness of prey in each block. This can then be compared to echograms recorded while with foraging whales. There is no published evidence that echosounder surveys disturb large whales, but to be overcautious we stop pinging in the presence of orca and whales that do not appear to be foraging. 2. Acoustics: Passive monitoring using a towed hydrophone array An oil-filled hydrophone array was towed 100m behind the vessel during transects, and stored on deck-mounted reel for efficient pay out and retrieval. The array itself consists of 2 HTI-96MIN hydrophones with 10Hz high pass and built-in pre-amps, positioned 3m apart from each other in the array. These hydrophones are powered by the vessel's 12V AGM research battery, which is isolated via switches from engine and house electronics to ensure uncorrupted acoustic signals at low frequencies, where fin whales vocalize. 3. Visual: Distance sampling surveys for whales and vessels We conducted distance sampling according to the methodologies outlined in Buckland et al. (2001 and 2004) and Kinzey et al. (2000). Distances to sightings were estimated using Fujinon FMTRC-SX 7x50 binoculars (after Kinzey and Gerrodette 2001; Lerczak & Hobbs 1998), which display reticles and a compass bearing in the left eyepiece. When whales are within a feasible distance to us, we will break transect and take photographs, behavioral notes, breath intervals, and fecal samples. If the whale is feeding, we will keep the echosounder on long enough to obtain a map of the prey field. We can then compare these "foraged" prey fields to the ambient conditions sampled along transects. The whales are followed from a distance and we observe the same approach protocols as those of North Coast Cetacean Society. We endeavor to disturb the whales as little as possible in our research, and we abandon encounters if we observe adverse reactions to our presence. 4. Visual: Strip-width surveys To count seabirds, jumping salmon, and debris, we search a fixed-width strip of 150m on either side of the vessel. Seabird strip-width methodology is modeled after Tasker et al. (1984), Huff et al. (2006), RIC (1997), Ronconi & Buger (2009) and Ballance (2010), among others. A critical requirement of a strip-width survey is that 100% of events within the strip must be observed and noted; to ensure that all birds within the strip are seen. On the Bangarang, we record every instance of the above targets within 150m of both sides of the vessel (after RIC 1997 and Briggs et al. 1981). In order to know whether or not a bird is within the 150m strip, Bangarang observers use customized handheld range finders (adapted from Heineman 1981) that delineate the strip width from the observer’s point of view. To adequately cover the 300m-wide viewshed, one observer is positioned at the bow of the Bangarang and is responsible for surveying one side of the boat, from 10% beyond

NGS Research Report Keen W268-13
6
dead ahead to 90 degrees abeam. Another observer is placed at midships on the other side of the boat; he and the helmsman are responsible for surveying the other half of the viewshed (Fig. 20).
Fig. 2. All sightings (n=271) of humpback (HW), fin (FW), and killer whales (KW) from summer 2013, color coded by species. and point-sized by group size. Unidentified baleen whales (BW) are also noted.
−129.6 −129.4 −129.2 −129
52.8
5353
.253
.4
Longitude (°)
Latit
ude
(°)
●
●● ●
●
● ●
●
●
●
●●
●●●
●
●●
●
●
●
●
●
●●
●
●
●
●
●
●
●
●
●
●
●
●
● ●
●
●
● ●
●
●●
●
●
●
●
●
●
●
●●●●
●
●●
●
●
●
●
●
●
●
●
●
●
●
●●
●
●●
●
●
●
●●
●
●
●
●
●
●
●
●
●
●
●
●
●
●
●
●
●
●
●
●
●●
●
●
●
●
●
●
●
●●●
●
●
●●●
●
●●●
●●
●
●
●
●
●
●
●
●
●
●
●
●
●●●
●
●
●
●
●
● ●
●
●
●
●
●
●●
●
●
●
●
●
●
●
●
●
●
●
●
●
●
●
●●
●
●
●
●
●
●
●
●
●●
●●
●
●
●
●
●
●
●
●
●
●
●
●●
●
●
●
●
●
●
●
●
●
●
●●
●
●
● ●
●
●
●
●
●
●
●
●
●
●
●●
●
●
●
●
●
●
●
●
●
●
●
●
●
●
●
●
●
●
●
●
●
●
●
●
●
●
●
●
●
●
●
●
●
●
●
●
●
●
●
●
●
●
●
●
●
●
●
0 5 10 km
●
●
●
●
●
12345+
●
●
●
●
HWFWKWBW

NGS Research Report Keen W268-13
7
−129.6−129.4
−129.2−129
52.8 53 53.2 53.4
Longitude (°)
Latitude (°)
● ●
● ●
● ●
●
●●●
●
●●
●●
●●●●
●
●
●●
●
●
●●
●●
●
●
●
●
●
●
●
●
●
●
●
●
●●
●
●●
●
●●
●●● ●
●
● ●
●
●
●●
●●
●
●
●●
●
●
● ●
●
●●
● ● ●●●●
●
●
●
●● ●
● ● ●
●● ● ● ● ● ● ● ●
●●●●●●●●●
●
●
●●●
● ●●
● ●●●●● ●
● ●●
● ● ● ● ● ●● ● ● ● ● ●
● ● ● ● ● ● ● ● ● ● ●● ● ● ●
●●
●●●●
●●●●●
●●●●●●●●●
●●
●●●●●●●●●●●●●
●●●● ● ● ●●
●●●●●●●●●●
●●●●● ●
●●●●
● ● ●
● ●● ●
●●●●
●●●●●●●●
●●●●●●
●●●●●●●
●●●●●●●●●●●●
●●●●●●●●●●● ●●●●●●●●●
●●●●●● ● ● ●
●●●●●● ●●●● ●●●●●●●
●●●●●
●●●●
●
●●●●●
●●●
●●●
●●
●
●●●●●●●
● ●●●
●●
●●●●●
●●●●●●●●
● ●
●●●●
●
●●
●●●
●●●●●●●
●●
●
●
●
●
●●●●
●
●
●
●
● ● ● ● ● ● ● ●
● ● ●● ●
●●
●●● ●
● ● ●●
●● ●●
●● ●
●● ● ●● ●● ● ● ● ● ● ● ● ●● ●
● ●
●●●●●●
● ●●
●●
●● ● ●
● ● ●
●● ●
●
●●●●●●●
●
●●
●● ●●●●●●●
● ●●●
●
●
●●
●
●
●
●
●●
● ●●
●
●
●●
●
●
●●
●
●
●●●
●
●●●
●
●
●
●
●
●
●●
●
●
●
● ●
●●
●●●
● ●
●
●
●
● ●●
●
●
●
●
●●
●●
●
●
●●
●
●●●
●●●
●
●
●●
●
●
●●●●●●
●●
●●
●
●●
●
●
●●●
●
●
●●●●
●●
●●
●
●
●
●
●●●●
●●●●
●●●
●●
● ● ● ● ●
● ●●
●● ●● ●● ● ●●● ● ●● ●●
● ● ● ● ●●
●●● ●●
●● ● ● ●
●
●
● ●
●
●●● ●
●
●
●
●
●
●
●
●●
●
●●●
●
●●
●●
●● ●
● ●
● ●
●
● ●●
●
●●
●
●
●●
●●
●
●
●●
● ●
●
● ●
●●●●●
●● ●
●● ●●● ●● ●● ●
●● ●
● ●
● ● ● ● ● ● ●●●
●
●
● ● ●● ● ● ●
●●● ●
●●●
●
●
● ●
● ● ●● ● ● ● ● ● ● ● ● ● ● ● ● ● ● ●
●●
●●●●
● ●
●
●
●
●
●
●
●
●
●●
●
●
●
●
●
●●
●●
●
●
●●
●
●
●
●
●●
●
●
●
●
● ● ●● ●●●
● ●
●
●
●
●
● ●
● ●
●●
●
●
●●
●
●●
●
●
●
●
●
●
●
●●
● ●● ●
●
●
●●
● ●
● ●
●
●
●
●
● ●
●
●●
●
●●
●
●
●●
●
●●
●
●
●
●
●
●
●
●
●
●
●
●
● ● ● ●●
●
●
●
●
●
●
●
●●
●●
● ● ● ●
●
●
●
●
●
●●
●
●●●●●
●
●
●
●
●
●●
●
●
● ●●
●
●
● ●●
●
●
●
●●
●
● ●●
●
Early Summ
er
05
10 km
●●●●●
Group Size
12345+
−129.6−129.4
−129.2−129
52.8 53 53.2 53.4
Longitude (°)
Latitude (°)
●
●●
●●●
● ●●●
●● ● ● ●
●●
●
●●
●●●
●
●●●●
● ● ●● ●
● ● ● ● ●
●
●●
● ●
● ●
● ●
● ● ●
●
● ●●
●●●●
●●
●●●
● ● ●●●●●
●
●●●
●●
●
●
●
●●
●●
●
●
●
● ●
●●●●
●●●●
●● ●
● ●●
●● ●
●
●
●● ● ● ● ●
●
●
● ● ●● ● ●
●●●
●
●●●
●
●
●
●
●●●
●●
●●
●●● ●
●
●●●
●●●
●●
●
●●
●●
● ●
●
●
● ●
● ● ● ●
●
●
●●
●●
●
●
●
●
●●
●
●●●●●
●●●●●
●●
●
●
●
●
●●●
●
●●
●●●
● ●●
● ● ●
● ●
●
●●●
●●
●●●● ●●
●● ● ●
●
●
●
●●
●
●
● ● ● ● ● ● ● ● ●●
●●
●
● ●● ● ● ● ● ●
● ●
● ●
●
●●
●
● ●● ● ● ● ● ●
●
●
●●●
●●●
●●●●●●
●●●●
●●●
●●●
●●
●●
●
●
●
●
●
●●●●
●
●
●●●
●●
●●
●●●
●●●●●
●●
●
● ●
●
●
●●
●
●
● ●
● ●
●
●●
●
●●
●●
●
● ●
●
●
● ●
●●
●
●●
●
●●
●● ● ●
●
●
●
●
●
● ● ●
●
●
●●●
●
●●●●
●●
●●
●●
●●
● ●
● ●● ● ●
●●
●
●●
● ●
● ● ●● ● ●
● ● ●● ●
●
●●●●●
●●●
●●●
●
●
●
●●●
●
●●
●●
●●●●
●●
●
●●●●●
●●
●●●
●●
●●●●●●
●●●●
●●
●●●●●
●●●
●●
●●●
●●●●●
●●
●●●●●
● ●●●●●●●●●
●●●●●●●●●●●●●●●●●●●●●●●●●●●●●
●●●●●●●●● ●●●●
●●●●●●●●●●● ●
● ●
●●●●
●●●●●●●●●●●●●●
●● ● ●●
●●
● ● ●
●
●●●●●
●
●
●
●
● ● ● ●
●
●
●
●
●●
●
●●
●
●●●
●●●●●●●
●●
●●
●●●●●●
●
●
●
●
●
●
●●
●
●●●●
●●●
●
●●●
●
●
●
●
●
●
●
●
●●
●
●
●
●
● ●
●●●
●
●●●
●
●●
●●●●
●●
●
●●●
●
●
●
●●
●
●
●
●●
●
●
●●
●
●
●
●
●
●
●
●
●
●
● ●
●
●
●
●
●
●
●●
●●
●●
●
●
●
● ●
●
●
●
●
●
●
● ●
●
●●
●
●
●
●
●
●
●
●
●●
●
●
●●●●
● ●
●
●
● ●
●●
●
●●
●
●
●
●
●
●
●
●
● ●
●
●
●
●
●
●●
●
●
●
●
●
●
●
●
●
●
●
●
●
●
●
●
●
●
●
●
●
●
● ●
●
●
● ●
●
●
Late Summ
er
05
10 km
●●●●●
LevelD
ebrisSalm
onSm
all MarM
amSeabirdW
hale
Fig. 3. All sightings of all taxa observed on visual transects and during casual research effort in the early sum
mer (28 June to 28 July)
and late summ
er (12 August to 05 Septem
ber) of 2013. These data overlay the echosounder transects (not pictured).

NGS Research Report Keen W268-13
8
Logistics
Collaborations Fieldwork in the study area is made possible by research agreements made with the Gitga'at First Nation, the North Coast Cetacean Society (NCCS), and the Cetacean Research Program of Canada's Department of Fisheries and Oceans. These and other stewards have been monitoring the whales of the Great Bear for many years, and without their support and good faith I would not have had the chance to contribute my small part to their ongoing work. The hospitality and support of residents in Hartley Bay, the center of the Gitga’at First Nation, enabled us to survive the 2013 field season. Their good nature and patience were constant, and it made all the difference. Hermann Meuter and Janie Wray of NCCS are our primary emergency contacts in the area, as well as our friends and supporters -- as well as the primary inspiration for the inception and realization of this project. The maritime community in the study area, upheld by the Gitga’at, NCCS, DFO, and the NPO Pacific Wild, provided critical friendship whenever it was needed. Permits Marine mammal research was conducted under NCCS’ permit, DFO MML 043. Zooplankton collection was conducted under DFO license XR 65 2013. Crew For most of the season, two other researchers were on board with Eric at any one time; most volunteers worked for tours of 6 weeks. These teammates paid their own way to be on board because Eric couldn’t. Nonetheless, they worked harder than anyone could have hoped for. Their tireless high spirits, patience, friendship, hardiness, work ethic, and sense of adventure made all the difference in the world. Data Entry For efficient and stable data entry, observations are entered into a homemade computer program, Research Underway: Bangarang ("RU Bangarang" or "RUB") on a touchscreen laptop mounted atop the helm stand. All forms of data (data files, photographs, echograms, and hydrophone recordings) are backed up nightly. Subsistence We ordered groceries through NCCS, who has a special relationship with the Overwaitea grocer in Prince Rupert and with the ferry that runs between Hartley Bay and Prince Rupert twice a week. We would typically get a food order every 14 days. Diesel, engine oil, propane (occasionally), water, moorage, and cell phone signal were available to us in Hartley Bay. Emergency Response An EPIRB and SPOT beacon are carried on board. The SPOT beacon was used to transmit our location to family and advisors on a nightly basis. At all times, the Bangarang was within VHF radio contact of the Prince Rupert Coast Guard, as well as the Gitga’at Guardian watchmen and NCCS. We regularly see pleasure craft and sein-fishing boats during transects. Eric and most crew hold wilderness medical certifications at the WMI Wilderness First Responder (WFR) level. Funding & Support This research was funded by the National Geographic Society-Waitt Grant (Grant number W268-13) and the 2013 Mullin Award from the Biological Oceanography curricular group at Scripps Institution of Oceanography (SIO). Material support and equipment loans came from SIO’s Dayton Lab and Pelagic Invertebrate
NGS Research Report Keen W268-13
9
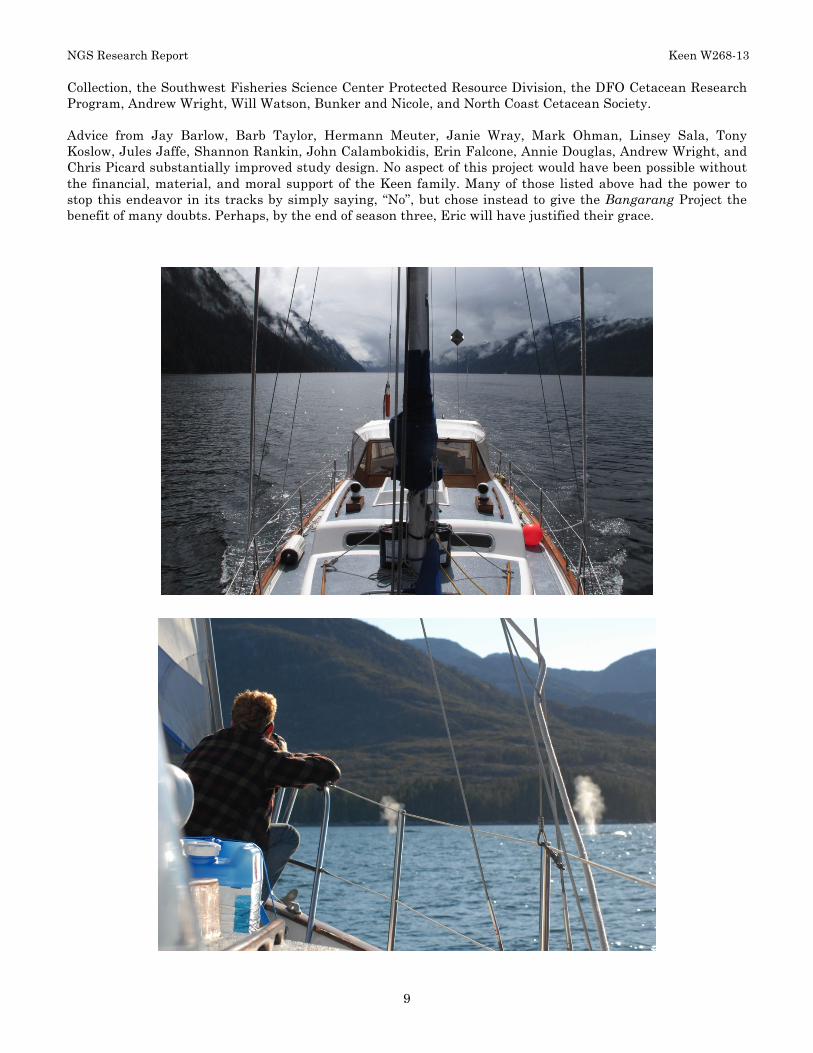
Collection, the Southwest Fisheries Science Center Protected Resource Division, the DFO Cetacean Research Program, Andrew Wright, Will Watson, Bunker and Nicole, and North Coast Cetacean Society. Advice from Jay Barlow, Barb Taylor, Hermann Meuter, Janie Wray, Mark Ohman, Linsey Sala, Tony Koslow, Jules Jaffe, Shannon Rankin, John Calambokidis, Erin Falcone, Annie Douglas, Andrew Wright, and Chris Picard substantially improved study design. No aspect of this project would have been possible without the financial, material, and moral support of the Keen family. Many of those listed above had the power to stop this endeavor in its tracks by simply saying, “No”, but chose instead to give the Bangarang Project the benefit of many doubts. Perhaps, by the end of season three, Eric will have justified their grace.

NGS Research Report Keen W268-13
10
2013 Season Overview
Overall, I consider the season a difficult success. Boat repairs were the primary cause of lost research days. Solving and surviving the problems would have been impossible without the hospitality, patience and support of Whale Point, Hartley Bay, and crew. The time we carved out for field work this season was June 1 to September 30. Of those 122 days, 34 were lost to repairs, 34 were spent in transit to and from the study area, and 9 were claimed by nasty weather. This left us with 45 days of functional research. Many of these functional days took place during the burn-in period at the beginning of the season, in which protocols were still being ironed out. In the end, 19 days were spent performing the full gamit of 3-person transects and station work. Given these pitfalls, our original study objectives had to be adjusted repeatedly. Priorities:
1. Photo-identification of fin and humpback whales. These data were promised to the North Coast Cetacean Society (NCCS), our primary collaborators, as well as John Ford's Cetacean Research Program at DFO and the Gitga’at Guardian Watchmen. Meeting this objective necessitated continual circuits of the study area whenever we were operable, and that’s what our first month consisted primarily of. Meanwhile, we worked on equipment trials, transect design, and protocol refinements for the broader pelagic ecosystem monitoring project – and dealt with frustrating repairs. In turn, this modus operandi acquainted me with the study area, its weather patterns, and its anchorages.
2. Acoustic data, both active and passive, in the presence of fin whales. We were successful in collecting active acoustics data all season-long. Unfortunately, we exprienced hydrophone difficulties that gave us only scant passive recordings. But because the three seasons of acoustic effort will eventually be analyzed cumulatively, any and all acoustic data were valuable.
3. Layout stations and transects, and complete two “oceanographic” circuits. 4. Test various modes of circuit effort intensity. 5. Refine protocols for all aspects of data collection.
After a full oceanographic circuit was finally complete by late July, another month was spent performing photo-ID circuits and dealing with repairs, all the while coping with crew shortages. A third month was spent nearly fully operational but dampened by bad weather, in which a refined oceanographic circuit was conducted. The study plan from this refined circuit will the plan we use in 2014 (Fig. 1). In that third month, a fourth circuit was also fit in, testing the viability of “Predator-Prey” circuits, in which transects but not station work are conducted. All of this contributed to the final study design of the project. We logged 620 engine hours over the course of the season. On days of formal research effort, we averaged 11 engine hours per day. We logged a total of 271 whale sightings. 202 of these were of humpbacks. Only 3 were of killer whales. 43 were of fin whales, and the remaining 22 were of baleen whales that were too distant to confidently identify to species. From photo-identification, we know that we saw 37 individual fin whales in the study area; together with the images from NCCS, the season total was 47 individuals, and many more than that for humpbacks.

NGS Research Report Keen W268-13
11
As stated above, it was a difficult success. I have lists, pages long, of improvements I hope to make to both boat and study design for 2014. But in our first season, many obstacles were successfully overcome, including obtaining the necessary safety for the research; financing, shopping for, purchasing, and retrofitting a suitable vessel; building research agreements with collaborators; enlisting crew; equipping the vessel for research; writing the data entry software; taking the vessel up and down the southern Inside Passage; coping with boat problems; and making the most out of the time we had on the water. We tried to make the most of repair periods, including helping to build a bathroom at Whale Point. As a greenhorn skipper, I was relieved that I never ran aground, dragged anchor, capsized, lost any crew overboard, or had anyone get sea sick. I must repeat, and I could never say it enough, that the undeserved kindness of many folks turned this summer into an extremely positive experience and, quite frankly, a dream come true. I know that the project will remain a constant challenge in one form or another until I am forced to wrap it up, but my heart remains on fire nonetheless. I now turn my attention to funding the 2014 season. A key advantage to small-craft research is its cost-effectiveness. My entire 2013 season cost less than half a day of operations on a Scripps research ship. In addition to improvements in vessel performance and equipment for next season, I hope to cover the airfare costs of crew so that I can attract high-caliber researchers as well as host students from the local Gitga’at village of Hartley Bay. I believe this project has demonstrated potential, both academic and applied, and I’m looking forward to getting back out there.

NGS Research Report Keen W268-13
12
Literature Cited
Ballance, L.T. 2010. Seabird Survey Instruction Manual: Hawaiian Islands Cetacean and Ecosystem Assessment Cruise – HICEAS. NOAA Fisheries Southwest Fisheries Science Center.
Briggs, K.T., and G.L. Hunt, Jr. 1981. Seabirds: details of strip censusing techniques. Pp. 257-276 in Summary Report, 1975-1978: Marine mammal and seabird survey of the Southern California Bight Area. Springfield, Virginia, U.S. Dept. Commerce, Natl. Tech. Info. Serv. Rept. PB 81-248-197.
Buckland, S.T., Anderson, D.R., Burnham, K.P., Laake, J.L., Borchers, D.L. & Thomas, L. 2001. Introduction to Distance Sampling: Estimating Abundance of Biological Populations. Chapman and Hill, New York, USA.
Buckland, S.T., Anderson, D.R., Burnham, K.P., Laake, J.L., Borchers, D.L., & Thomas, L. eds. 2004. Advanced Distance Sampling. Oxford University Press, Oxford, UK.
Dawson, Steve, Paul Wade, Elisabeth Slooten, and Jay Barlow. 2008. Design and field methods for sighting surveys of cetaceans in coastal and riverine habitats. Mammal Review 38(1):19-49.
Gordon, J., S.D. Berrow, and E. Rogan. 1999. Acoustic and visual survey of cetaceans off the Mullet Peninsula, Co Mayo. The Irish Naturalists’ Journal 26:7/8. pp. 251-259.
Heinemann, D. 1981. A range finder for pelagic bird censusing. Journal of Wildlife Management 45(2):489-493.
Heron, A.C. 1982. A vertical free fall plankton net with no mouth obstructions. Limnology and Oceanography 27(3):380-383.
Huff, M.H., Raphael, M.G., Miller, S.L., Nelson, S.K., Baldwin, J., tech. coords. 2006. Northwest Forest Plan—the first 10 years (1994–2003): status and trends of populations and nesting habitat for the marbled murrelet. Gen. Tech. Rep. PNW--GTR--650. Portland, OR: U.S. Department of Agriculture, Forest Service, Pacific Northwest Research Station. 149 p.
Keen, E.M. 2013. A practical designer’s guide to mesozooplankton nets. Scripps Institution of Oceanography, unpublished. Available online: < http://acsweb.ucsd.edu/~ekeen/styled/styled-25/styled-30/index.html >
Kinzey, D. and Gerrodette, T. 2001. Conversion factors for binocular reticles. Mar. Mammal Sci. 17(2):353-61.
Kinzey, Douglas, Paula Olson, and Tim Gerrodette. 2000. Marine mammal data collection procedures on research ship line-transect surveys by the Southwest Fisheries Science Center. National Marine Fisheries Service Southwest Fisheries Science Center. Administrative Report LJ-00-08.
Lerczak, J.A. and Hobbs, R.C. 1998. Calculating sighting distances from angular readings during shipboard, aerial, and shore-based marine mammal surveys. Mar. Mammal Sci. 14(3):590-9. [See Errata. 1998. Mar. Mammal Sci. 14(4):903].
Lerzack, J.A., and R.C. Hobbes. 1998. Calculating sighting distances from angular readings during shipboard, aerial, and shore-based marine mammal surveys. Marine Mammal Science 14(3):590-599.
Panigada, S., G. Pesante, M. Zanardelli, F. Capoulade, A. Gannier, & M.T. Weinrich. 2006. Mediterranean whales at risk from fatal ship strikes. Journal of Cetacean Research & Management 7(2):137.
Papastavrou, V., S.C. Smith, and H. Whitehead. 1989. Diving behavior of the sperm whale, Physeter macrocephalus, off the Galapagos Islands. Canadian Journal of Zoology 67:839-846.
Resources Inventory Committee (RIC). 1997. Inventory methods for seabirds: cormorants, gulls, murres, storm-petrels, ancient murrelet, auklets, puffins, and pigeon guillemot. Standards for Components of British Columbia’s Biodiversity No. 13. Ministry of Environment, Lands and Parks.
Ronconi, Robert A., Alan E. Burger. 2009. Estimating seabird densities from vessel transects: distance sampling and implications for strip transects. Aquatic Biology 4: 297-309.
Tasker, Mark L., Peter Hope Jones, Tim Dixon, and Barry F. Blake. 1984. Counting seabirds at sea from ships: a review of methods employed and a suggestion for a standardized approach. The Auk 101:567-577.
Thomas, Len, Rob Williams, and Doug Sandilands. 2007. Designing line transect surveys for complex survey designs. Journal of Cetacean Research and Management 9(1):1-13.

NGS Research Report Keen W268-13
13