wetland monitoring guidelines - u.s. fish and wildlife … · part l wetland restoration, creation,...
TRANSCRIPT

· /
"'ETLAND l\10NITORING GUIDELINES
Operational Draft
U.S. Fish and Wildlife Service Northeast Region
Ecological Services 300 Westgate Center Drive
Hadley, MA 01035
April 1999
\19
Ii,

Wetland Monitoring Guidelines
Operational Draft
Prepared by:
Ralph W. Tiner
With Cooperation from Regional and Field Office Staff
April 1999
U.S:Fish and Wildlife Service Ecological Services Region 5, Northeast
Hadley, Massachusetts 01035

Table of Contents
IN.TRODUCTION. . . . . . . . . . . . . . . . . . . . . . . . . . . . . . . . . . . . . . . . . . . . . . . . . . . . . . .. 1
Background for Developing Regional Guidance. . . . . . . . . . . . . . . . . . . . . . . . . . . . . . . .. 1 Organization of the Guidelines. . . . . . . . . . . . . . . . . . . . . . . . . . . . . . . . . . . . . . . . . . . . .. 2
PART L WETLAND RESTORATION, CREATION, AND ENHANCEMENT PLANNING . Goal Setting and Project Definition ........................................... 4 Plmming Questions and Standards Development. ............................. , . 5
Key Questions to Consider in Pimming. . . . . . . . . . . . . . . . . . . . . . . . . . . . . . . . .. 5 Developing Performance Standards. . . . . . . . . . . . . . . . .. .................. 7
Vegetation Objectives/Parameters. . . . . . . . . . . . . . . . . . . . . . . . . . . . . . .. 7 Hydrology Objectives/Parameters. . . . . . . . . . . . . . . . . . . . . . . . . . . . . . .. 8 Soil Objectives/Parameters. . . . . . . . . . . . . . . . . . . . . . . . . . . . . . . . . . . .. 9 Wildlife Use Objectives/Parameters. . . . . . . . . . . . . . . . . . . . . . . . . . . . .. 10 flood Storage Objectives/Parameters. . . . . . . . . . . . . . . . . . . . . . . . . . . .. 11 Water Quality Renovation Objectives/Parameters. . . . . . . . . . . . . . . . . .. 11 Shoreline Stabilization Objectives/Parameters. . . . . . . . . . . . . . . . . . . . .. 11
PART II. BASELINE DATA REQUIREMENTS FOR MONITORING .............. 13
Documenting Pre-existing and As-built Conditions. . . . . . . . . . . . . . . . . . . . . . . . . . . . .. 14 Establishing and Monitoring Reference Sites. . . . . . . . . . . . . . . . . . . . . . . . . . . . . . . . . .. 14
PART III. WETLAND MONITORING PROTOCOLS. . . . . . . . . . . . . . . . . . . . . . . . .. 17
Monitoring Techniques and Procedures. . . . . . . . . . . . . . . . . . . . . . . . . . . . . . . . . . . . . .. 18 Hydrology for Nontidal Wetlands. . . . . . . . . . . . . . . . . . . . . . . . . . . . . . . . . . . . .. 19 Hydrology for Tidal Wetlands ..... , . . . . . . . . . . . . . . .. . . .. ............. 21 Hydrophytic Vegetation. . . . . . . . . . . . . . . . . . . . . . . . . . . . . . . . . . . . . . . . . . . .. 25 Accumulation of Organic Matter. . . . . . . . . . . . . . . . . . . . . . . . . . . . . . . . . . . . .. 30 Sediment Accumulation. . . . . . . . . . . . . . . . . . . . . . . . . . . . . . . . . . . . . . . . . . . .. 30 Salinity (for Salt Marsh Restoration). . . . . . . . . . . . . . . . . . . . . . . . . . . . . . . . . .. 31 Soil Analysis (for Created Sites). . . . . . . . . . . . . . . . . . . . . . . . . . . . . . . . . . . . .. 31 Wildlife Use. . . . . . . . . . . . . . . . . . . . . . . . . . . . . . . . . . . . . . . . . . . . . . . . . . . . .. 32 Detem1ining Wetland Extent (for Mitigation Projects) ................... " 33
Additional Considerations for Mitigatjon Projects. . . . . . . . . . . . . . . . . . . . . . . . . . . . .. 33
REFERENCES. . . . . . . . . . . . . . . . . . . . . . . . . . . . . . . . . . . . . . . . . . . . . . . . . . . . . . . . .. 35

APPENDICES
A. Recommended Minimum Wetland Monitoring Guidelines ..................... 37 B. Wetland Monitoring Report Form (Form MI) ............................... 42 C. Hydrology Data Collection Forms (Fonns HI and H247 ....................... 47 D. Year I Vegetation Observation Data Form (Form VI) ......................... 50 E. Species-Area Curve Data Form ........................................... 52 F. Plot Sampling Data Foro1 (Form V2) ........•.............................. 55 G. Point Intercept Sampling Form (Form V3) ....................... . . . . . . .. .. 58 H. Planted or Seeded Site Data Form (Form V4 ................................ 60 L Vegetation Sampling Protocols for Plot Sampling and Point Intercept Sampling .... 63 J. Example of Calculating the Mean Prevalence Index for a Plant Community based on
the Point Intercept Method ................................................ 75
J .

INTRODUCTION
Wetland restoration and creation proj ects are initiated for a variety of purposes mainly as mitigation for losses of regulated wetlands or for proactive reasons to re-establish desired wetland functions. Unfortunately, few projects have been monitored in a way that can help better our understanding of wetland systems and improve the science of restoration and creation. While scientific research of wetland restoration and creation would advance the science, funding is not readily available for long-term studies and not likely in the near future.
~
An alternative to long-term research is monitoring changes in certain paran1eters at restoration and creation sites and comparison with natural wetlands. These investigations should not be overly costly and should provide meaningful information to assess the benefits of these projects and to help guide future improvements in wetland restoration and creation. By recommending monitoring for mitigation projects to be performed by project sponsors and having access to such data and conducting our own small-scale studies of selected Service-initiated projects, we can obtain invaluable data. By evaluating mitigation projects, the information gathered may show that wetland restoration is more successful and beneficial than wetland creation and where neither wetland restoration or creation is a viable solution to mitigating adverse wetland impacts, where this may be true.
Background for Deyeloping Regional Guidance
The FY97 Region 4 and Region 5 workshop (held in Virginia Beach, V A) included a discussion of wetland mitigation and monitoring. Participants identified a universal need for more attention to monitoring wetland restoration and creation projects whether done as mitigation for permitted wetland alterations or as proactive wetland restoration or enhancement projects to benefit wildlife. It was recognized that the level of monitoring should be more stringent in the former cases, since existing wetlands are being destroyed and the restoration/creation project is intended to compensate for these losses.
Following this meeting, it was decided that a set of guidelines for monitoring wetland restoration and creation projects (including enhancement projects) would be useful to provide regional consistency in the Service's response to mitigation and wetland banking initiatives in the regulatory arena as well as in evaluating the success of Service projects. General guidance for determining the success of mosquito control management projects has been developed for Region 5 refuges (Taylor 1998). The New York Field Office requested that the Regional Office (RO) prepare specific guidance that they could use for mitigation and wetland banking projects. Ralph Tiner was assigned the task of preparing a draft set of monitoring guidelines. The first draft was reviewed by the RO staff (Laury Zicari, Robin Heubel, Mike Horton, and Sue Essig) and revisions made. The second draft was reviewed by RO staff and Ecological Services field offices. Among the field office staff providing comments were Laura Mitchell, Cherry Keller, Ed Christoffers, Arnold Balmer, Donald Lima, William Kolodnicki, Richard McCoy, Anne Secord, plus the New Jersey Field Office. Jan Taylor, Refuges Program, also reviewed the draft report. Based on review comments, the operational draft was prepared and is now ready for use
1

and testing by the field. After one year or more of operational use, the guidelines will be reexamined and revised as necessary based on field experiences.
It is hoped that these guidelines will give the Service the foundation to make better recommendations to the Corps re: monitoring requirements for mitigation projects, and to provide the Service with a consistent approach for monitoring a selected set of its own restoration/creation/enhancement projects on an ongoing basis in the future. The lessons learned from monitoring individual projects (e.g., Partners for Fish and Wildlife) can provide valuable data to help improve the design of future wetland restoration and mitigation projects, thereby improving the likelihood for success and increasing the environmental benefits of such projects.
It is important to note that although these monitoring guidelines focus on wetlands, the general approach to monitoring contained herein can be used to design monitoring programs for other habitats, e.g., restored grasslands. Specific requirements for vegetation re-establishment and other vital objectives would have to be developed for such projects.
Organization of the Guidelines
The guidelines are broken dovvn into three general parts: I) wetland restoration, creation, and enhancement planning, 2) baseline data requirements for monitoring, and 3) monitoring protocols. The planning section--Part l--inc1udes goal setting, pertinent planning questions, and examples of possible objectives and parameters to measure project success. This section should aid Service biologists and other readers in understanding why certain parameters should be monitored and help them in evaluating, designing, and reviewing proposed designs for individual projects. Baseline data needed for developing monitoring objectives and for evaluating project success are covered in Part II. Discussions of the actual monitoring standards and guidelines (including how and when to monitor) are presented in Part III. The appendices provide recommended Ininimum wetland monitoring guidelines, a variety of data sheets (for vegetation sampling, hydrology assessment, and general monitoring evaluation), and an overview of vegetation sampling procedures.
z
r
PART I.
WETLAND RESTORATION, CREATION, AND ENHANCEMENT PLANNING

Goal Setting and Project Definition
The primary goal of any restoration, creation, or enhancement project should be either: 1) to establish an area that provides wetland functions--a wetland, or 2) to improve functions for an existing wetland--a rehabilitated wetland or an enhanced wetland. In the first case, a wetland would be created where one does not presently exist. It could be at the site of a former wetland which makes the project a wetland restoration project, or it could be in a place where a wetland never existed ... a wetland creation project. The second goal involves an existing wetland where one or more functions would be improved. If the wetfand is a significantly functionally-impaired or significantly degraded one, improving overall functions by removing or reducing the impact of the disturbance factor (e.g., drainage ditches or minor fill) with the goal ofreturning the functional capacity of the wetland to that of or one much like that of its pre-disturbance condition, the project is a wetland rehabilitation 1 project. If, however, the wetland is not significantly degraded or, if so, the goal of the project is to improve the functions beyond what the type does normally, in other words, changing the type of wetland to maximize a desired function, then the project is considered wetland enhancement.
The difference between ~ehabilitation and enhancement may be subtle or quite apparent. As mentioned above, "rehabilitation" refers to improving the level of performance of a significantly degraded wetland by removing or minimizing the effect of some type of previous significant alteration or disturbance (rehabilitating impaired functions or reducing the extent of degradation). In contrast, "enhancement" is the promoting of one or more \:vetland functions over other functions that a wetland is now performing. It is not to restore a lost or degraded function, but to amplify certain desired functions (e.g., waterfowl habitat or stormwater detention) which typically results in a different wetland type in terms of vegetation and hydrology, for example. Enhancement can be performed to either unaltered or altered wetlands. Oftentimes, wetland enhancement requires in.stalling structures to increase water levels over that which normally occurred at the site. The presence of a dike and water control structure that converts a wet meadow to a marsh or a pond may be an example of enhancement, while the construction of a weir in a ditch or a ditch plug is probably a comparative example of restoration for the wet meadow. The latter action aims to restore the original hydrology by negating the impact of the drainage ditch (the disturbance factor) and restoring previous high water levels upstream, and likely putting the wetland on the trajectory to becoming a forested wetland in the long-run (the type that probably existed at the site before clearing and drainage). In the first scenario, the dike will magnify water levels over those that would normally occur in this type of wetland in this landscape position and thereby increase its capacity to provide one or more functions. While these situations may seem to provide a clear distinction between wetland enhancement and restoration, there are cases where the land's contours (topography) have been severely altered (e.g., major land-leveling involving flattening significant contours) to the point where wetland restoration can only be accomplished tbrough the construction of a dike and water control
lFor discussion purposes in these guidelines, wetland rehabilitation is included in the concept of wetland restoration.

structure. In the Northeast, these situations appear to be quite limited, and are the exception rather than the rule.
In all cases involving existing wetlands, the level of functional impairment or degradation should be evaluated and documented at the outset of project planning. This will require a simple comparison of the impaired or degraded wetland to unaltered wetlands of the same type. It is vital to clearly separate significantly altered wetlands (i.e., where a prior disturbance or alteration has caused significant impairment of one or more of the functions of that wetland type) from altered wetlands with relatively insignificant functional changes. An example of this difference might be a forested wetland with channelized stream running through it versus a forested wetland with a single shallow ditch. The former clearly has a more significant effect, while the latter alteration may have only minor effects. Restoration efforts should ideally be targeting the significantly altered wetlands.
Planning Questions and Standards Development
The goals and objectives of a restoration or creation project may be single- or multi-purpose. If the project is undertaken for mitigation to replace lost wetland functions, the goals/objectives should clearly be multi-purpose, while other projects initiated proactively may be single-purpose, such as to create a wetland for waterfowl use. Often, however, there is more than one project goaL In most projects, the basic goal should be to establish or restore a self-sustaining wetland, whereas some special-purpose projects may have an ongoing operational component, for example, to manage water levels that favor growth of impol1ant forage plants and provide suitable habitat for migrating waterfowL
Without clearly stated objectives, it is virtually impossible to evaluate the success of wetland restoration, creation, or enhancement projects. Ideally, every government-sponsored or governn1ent-required project should have a written plan detailing the specific goals/objectives and a set of measurable parameters to evaluate project success plus a description of original (existing) site conditions. This will help insure project success as well as justify the continued expenditure of public funds for these valuable environmental projects.
Key Questions to Consider in Planning
When planning a wetland restoration, creation, or enhancement project, a considerable amount of up-front thinking must be given to the project. Several questions need to be answered.
The first question is usually:
What type of wetland is desired?
The answer can be driven by the type of wetland to be destroyed by a proposed development project or by the need to restore a certain type tha! has undergone tremendous losses due to human activities or for other reasons (e.g., cost or wetland of interest for proactive projects).
5
I ,

After answering this question, 11 other questions follow:
1. How do existing government wetland regulations apply to the proposed restoration or creation project? (This relates to regulatory requirements for proposed work. Restoring a wetland from an area that is not presently functioning as a wetland--a former wetland--should not usually require a permit, while altering an existing wetland, even though degraded, may require at least some level of regulatory review by Federal, state, and local authorities. Consult these agencies for specifics.)
2. Where are suitable restoration or creation sites located and are they available for use? (This involves locating the available sites most suitable for restoration/creation and securing landowner approval.)
3. Is the intended project a restoration, creation, or enhancement project? (Relates to the reason for initiating the project--mitigation or proactive restoration, creation, or enhancement, and is vital for accomplishment reporting used to help assess how the Nation is faring re: "no-net-loss of wetlands. ")
4. What should the project size be? (This is either dictated by the regulators for mitigation projects and by site conditions for restoration projects, although there are other considerations, e.g., cost for proactive restoration.)
5. If the project is a mitigation project, should the project be located onsite, offsite in the same watershed, or offsite outside the watershed? (This will be answered by the regulatory process.)
6. What hydrologic conditions need to be established? (Depends on the project goals and the type of wetland desired.)
7. What plant communities are desired? (Is planting or seeding required to promote such communities? Check local wetlands for composition of existing wetland plant communities.)
8. How much time should be allowed for wetland vegetation to become established? (This relates to the type of wetland with emergent and scrub-shrub wetlands--probably 3-5 years and forested wetlands and shrub bogs 10-20 years, for example.)
9. What faunal species and kinds of animal use are desired?
10. What is an acceptable risk of structural failure (e.g., dike, weir, ditch plug, or water control device) that would require repair at some frequency (e.g., 5,10,25,50 or 100 years)?
11. What other risk factors exist that may compromise project success? (Consider factors such as invasive plant species, nuisant animals including geese, nutria, and other heavy grazers, erosive potential of site, sea level rise, and adjacent land use).
G

By answering these and other questions, specific project objectives and measurable parameters for establishing project success can be established. Of course, these are questions that should be answered before initiating a particular restoration, creation, or enhancement project as they are vital to proper project design.
Developing Performance Standards
A well-designed restoration, creation, or enhancement project requires developing a specific set of project objectives and measurable parameters forkevaluating project success. Listed below are some examples of objectives and parameters that are easily determined. The objectives and parameters are not listed in any priority order. More complicated analyses such as laboratory soil testing are not recommended as such is beyond the intent of the proposed guidelines, yet may be useful for evaluating the long-term success of mitigation projects regarding organic accumulation .and soil nutrient status in the subject wetland. From these objectives and parameters, specific performance standards can be developed. Projects with multiple objectives ~re preferable to those with a single objective, yet seemingly single-purpose projects (e.g., improve waterfowl habitat) may actually have other objectives (re: desired plant community composition, water depths, seasonal fluctuations of water levels, etc.) which have measurable parameters.
Vegetatioll Objectives/Parameters
.objective: To establish a wetland plant community with more than 50% of the dominant species having an indicator status of OBL and F ACW, with at least one OBL species. Dominant species include dominants from all strata that are present in the particular wetland type (e.g., tree, sapling, shrub, herb, and woody vine) and even mosses where they represent a significant component of the community.
Parameter: Estimate areal coverage of species in a few randomly selected plots or plots along a transect through the center of the subject wetland; can also use other metrics such as stem density/unit area. (See Hydrophytic Vegetation section under Monitoring Techniques and Procedures in Part III for sampling protocoL)
(Caution: This might be a reasonable objective for some of the wetter wetlands, but not for a floodplain forested wetland or other drier-end wetlands lacking OBL species. For marshes, a predominance of OBL species only may be the objective and acceptable species can be specified as necessary. When dealing with drier-end wetlands, however, this is not an appropriate objective, the vegetation objective should be based on either of two requirements: 1) having at least more than 50% of the dominant species represented by species with an indicator status of F AC or wetter, or 2) having a composition of species like that of similar existing wetlands [based on examination oftypicaJ species found in these habitats in the local area]. It is appropriate to list a FACU species as an acceptable species ifit is a typical component of the desired wetland community as in hemlock swamps.)
7
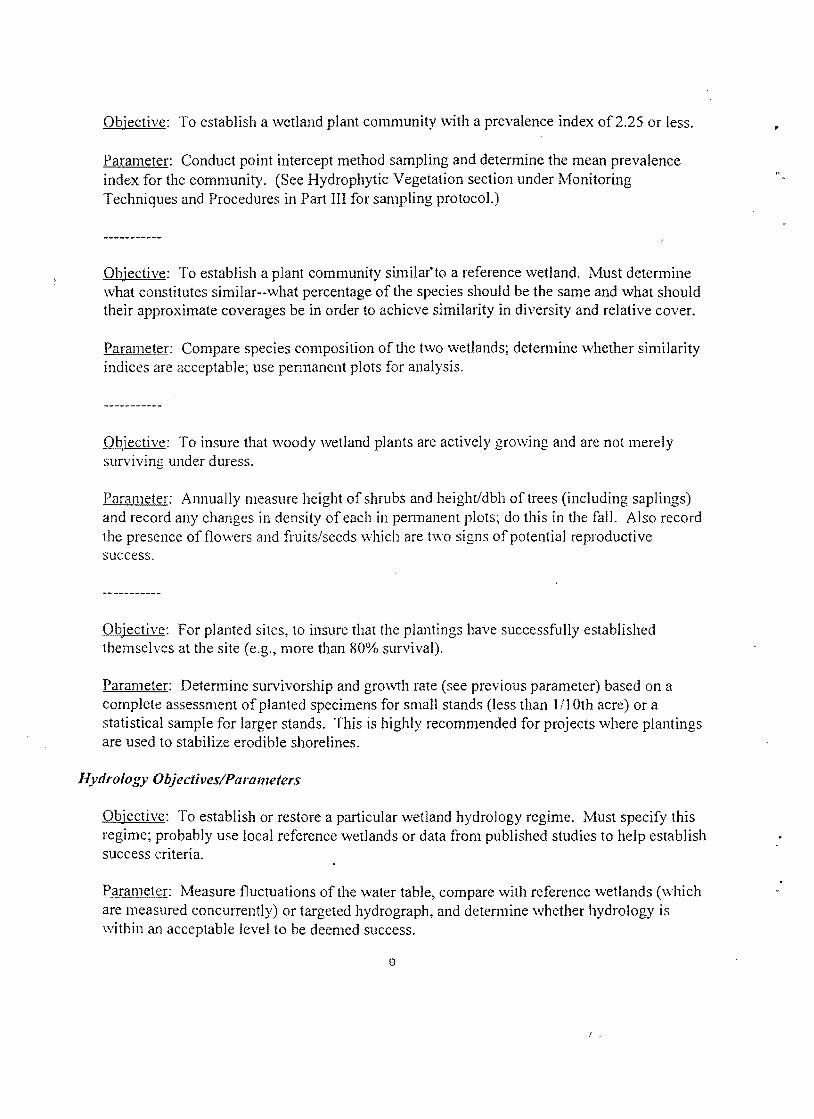
Objective: To establish a wetland plant community with a prevalence index of2.25 or less.
Parameter: Conduct point intercept method sampling and determine the mean prevalence index for the community. (See Hydrophytic Vegetation section under Monitoring Techniques and Procedures in Part III for sampling protocol.)
Objective: To establish a plant community similar'to a reference wetland. Must determine what constitutes similar--what percentage of the species should be the same and what should their approximate coverages be in order to achieve similarity in diversity and relative cover.
Parameter: Compare species composition of the two wetlands; determine whether similarity indices are acceptable; use permanent plots for analysis.
Objective: To insure that woody wetland plants are actively growing and are not merely surviving under duress.
Parameter: Annually measure height of shrubs and heightldbh of trees (including saplings) and record any changes in density of each in permanent plots; do this in the fall. Also record the presence of flowers and fruits/seeds which are two signs of potential reproductive success.
Objective: For planted sites, to insure that the plantings have successfully established themselves at the site (e.g., more than 80% survival).
Parameter: Determine survivorship and grO\vth rate (see previous parameter) based on a complete assessment of planted specimens for small stands (less than 1I10th acre) or a statistical sample for larger stands. This is highly recommended for projects where plantings are used to stabilize erodible shorelines.
Hydrology Objectives/Parameters
Objective: To establish or restore a particular wetland hydrology regime. Must specify this regime; probably use local reference wetlands or data from published studies to help establish success criteria.
Parameter: Measure fluctuations of the water table, compare with reference wetlands (which are measured concurrently) or targeted hydrograph, and determine whether hydrology is within an acceptable level to be deemed success.
8
I .

Objective: To establish a wetland of any kind; determine hydro graph for minimum wetland. (Note: The objective might be modified somewhat to establish a wetland that meets regulatory requirements. This is an example of a poorly stated objectiv.e, as one should always have a good idea of the type of wetland desired in terms of vegetation and hydrology.)
Parameter: Measure hydrology during wettest period of growing season to see if it meets the minimum; in Northeast, weekly measurements should be done from March through May. The observer must note any abnormally wet or dry conditions to insure that the site's hydrology is wet long enough and often enough during years of normal precipitation.
Objective: To establish or restore a wetland that has surface water for a certain period during the growing season or during the waterfowl/shorebird migration season; must specify depth and duration; can use reference wetland in locale for benchmark or criteria from the literature re: bird migration.
Parameter: Measure depth and duration of flooding during the growing season or during bird migration periods.
Objective: To restore tidal flow to a fonner tidal wetland or a tidally restricted wetland; determine the desired hydrograph based on local tidal conditions.
Parameter: Measure hydrology over a 12-hour period during spring tide in the "restored" wetland and the neighboring unaltered existing tidal wetland and compare hydrographs to
. determine similarity; contrast with previous hydrograph of the tidally restricted wetland to verify significant increase in tidal flowage.
Soil Objectives/Parameters
Objective: To have the wetland produce a measurable build-up of organic matter annually; use literature to come up with a reasonable rate (e.g., 1 mmJyr) or compare with local reference wetland.
Parameter: Measure thickness of organic matter at the surface and perhaps do laboratory· analysis of organic matter content ~fthe surface horizon; measurements made in late fall or early spring.
9
t .

Objective: For creation sites, to have the soils develop redoximorphic features (e.g., redox concentrations and redox depletions).
Parameter: Examine soil profile for evidence of gleying and mottling.
Objective: To restore salt marsh salinities to fornier salt marshes (tidally restricted).
Parameter: Determine soil salinity in restored marsh and compare to contiguous seaward salt marsh and to pre-restoration levels.
Objective: To restore original wetland elevations in filled wetland.
Parameter: Determine amount of fill to be removed by locating original wetland soil below fill. After removing fill, measure elevation of restored marsh and compare with adjacent unaltered marsh, if present. Otherwise, examine exposed soil to insure that original profile is mostly intact. Measure any substrate rebound due to fill removal and lessening of compaction due to weight of original fill; consider doing this for projects involving major fill removal from former wetlands with organic soils.
Wildlife Use Objectives/Parameters
Objective: To provide habitat for certain fish and \vildlife (specify species, usc, and season of use).
Parameter: Make visual observations or use other means to assess fish and wildlife use and determine project success. Can compare to reference wetland re: similarity. This can be very time-consuming, but sampling should be limited by species and by activity of interest (e.g., breeding v. migration v. winter use).
Objective: To produce an abundance of aquatic invertebrates for waterfowl and other waterbirds to feed upon.
Parameter: Conduct periodic samP.ling to estimate invertebrate species composition and relative abundance. Can compare to reference wetland or the literature.
10
I',
.'
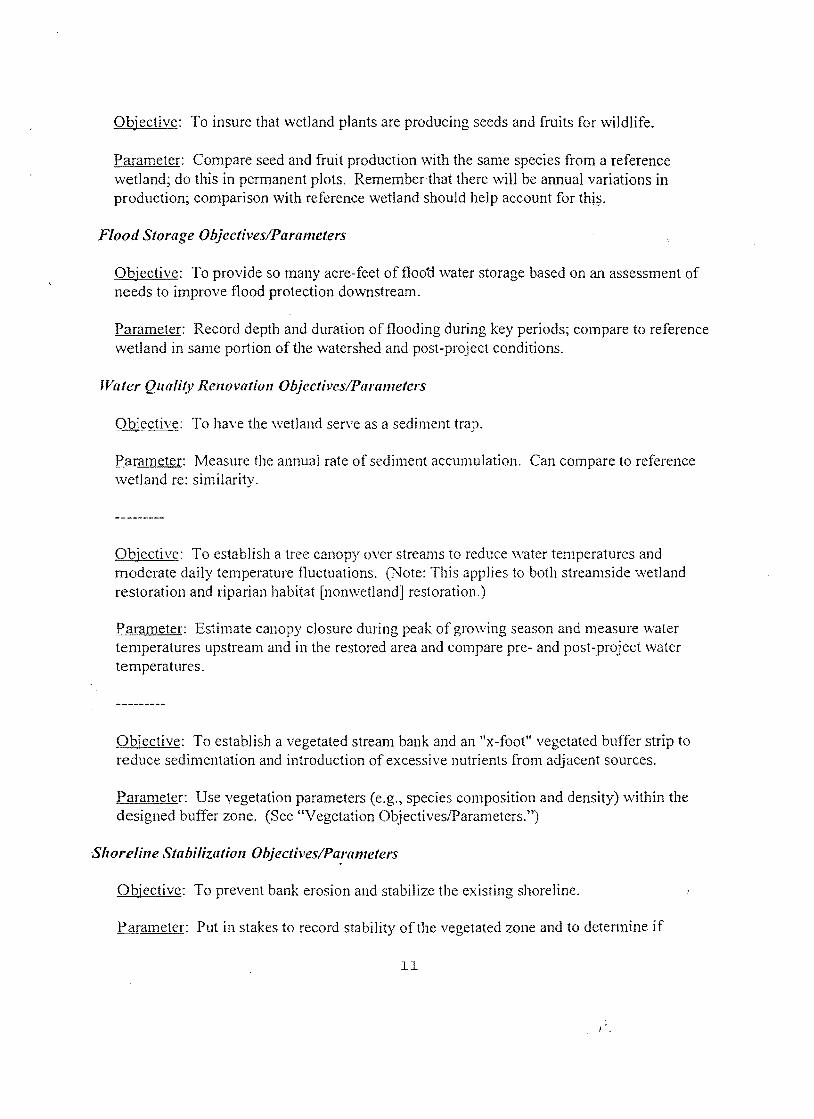
Objective: To insure that wetland plants are producing seeds and fruits for wildlife. . .
Parameter: Compare seed and fruit production with the same species from a reference wetland; do this in permanent plots. Remember that there will be annual variations in production; comparison with reference wetland should help account for thi~,
Flood Storage Objectives/Parameters
Objective: To provide so many acre-feet of flootl water storage based on an assessment of needs to improve flood protection downstream.
Parameter: Record depth and duration of flooding during key periods; compare to reference wetland in same portion of the watershed and post-project conditions.
Water Quality Rellovatioll Objectives/Parameters
Objective: To have the wetland serve as a sediment trap.
Parameter: Measure the annual rate of sediment accumulation. Can compare to reference wetland re: similarity.
Objective: To establish a tree canopy over streams to reduce water temperatures and moderate daily temperature fluctuations. (Note: This applies to both streamside wetland restoration and riparian habitat [nomvetland] restoration.)
Parameter: Estimate canopy closure during peak of growing season and measure \vater temperatures upstream and in the restored area and compare pre- and post-project water temperatures.
Objective: To establish a vegetated stream bank and an "x-foot" vegetated buffer strip to reduce sedimentation and introduction of excessive nutrients from adjacent sources.
Parameter: Use vegetation parameters (e.g., species composition and density) within the designed buffer zone. (See "Vegetation Objectives/Parameters.")
Shoreli11e Stabilization Objectives/Parameters
Objective: To prevent bank erosion and stabilize the existing shoreline.
Parameter: Put in stakes to record stability of the vegetated zone and to determine if
11
I',

vegetation is expanding waterward. Identify any sites of active erosion and bank recession. Also use vegetation objectives and parameters.
In addition to the above objectives and parameters, there are other objectives that focus on not creating environmental problems by the proposed projects. Examples of "shalt not" objectives include:
• not facilitating the spread of undesirable invasive plant species (such as purple loosestrife, common reed, reed canary grass, or, in some instances, cattail) not significantly elevating water temperatures bftrout streams (e.g., through impoundments) not adversely impacting rare, threatened, or endangered plants and animals
• not increasing the flood hazard potential for low-lying development • not jeopardizing existing local water supplies (e.g., through salt-water intrusion)
These, too, should be evaluated to insure that the project is not causing significant adverse consequences to people or other wildlife.
12
! "

PART II.
BASELINE DATA REQUIREMENTS FOR lVIONITORING
l3
, I .

Three types of information may be needed to aid in designing a restoration, creation, or enhancement project and a corresponding monitoring plan: 1) existing conditions (prior to project construction), 2) as-built conditions (after construction), and 3) characteristics and conditions of suitable reference wetlands. Knowing and documenting the pre-existing conditions are the critical first steps in any project. For enhancing or restoring existing wetlands, it is crucial to know the level of impairment or degradation (a "significance" test), so that one can properly design the project and later measure success. As mentioned earlier, this is also needed to determine whether a proposed project is either a true restoration or an enhancement activity. Only projects that attempt to restore pre-disturbance conditions or something similar for significantly altered wetlands are considered restoration projects, whereas projects seeking to change the hydrology to something different from the pre-disturbance water regime are enhancement projects. Other vital data needed prior to monitoring a project are the as-built conditions and perhaps information gained from evaluating wetlands similar to the planned wetland (reference wetland sites).
Documenting Pre-existing and As-built Conditions
It is imp0l1ant to emphasize that a pre-requisite to monitoring is the establishment of baseline conditions in terms of pre-existing conditions (before project construction) and "as-built" conditions (after construction). It is vital to know what the pre-project site conditions were so that gains or improvements can be documented. These conditions should include answers to questions like:
Is the area presently a wetland? If not an existing wetland, is the site a former wetland (potential restoration site) or an upland ( creation site)?
• If a former wetland, what are the soils, current hydrology, and existing vegetation? • If an existing wetland, why does it warrant restoration?
For restoration projects, what was the pre-altered condition that \"li11 be attempted to be restored?
Once the project is constructed, the "as-built conditions" should be recorded. These conditions will provide information on the configuration of the restored or created wetland (e.g., elevations) and other pertinent site conditions (e.g., soil characteristics and the locations of any plantings or specially seeded areas). Projects should have an "as-built" plan showing elevations, plantings, seeded areas, and other factors relevant for monitoring and evaluating project success.
Establishing and Monitoring Reference Sites
Another pre-requisite to monitoring may be the establishment and analysis of reference wetlands. This is particularly important in geographic areas where wetlands have not been well studied and reported in the literature, or for wetland types that are little studied in general. The purpose of reference \\'etJands is to gain a better understanding of the variability among wetlands of a common type in terms of plant composition, hydrology (especially water table fluctuations), and
l4
! .

soil conditions. These wetlands form the basis for designing wetland restoration and creation projects and for establishing measurable and comparable objectives. They permit comparisons between the functions of a restored or created wetland and a naturally functioning one of similar type. Regulatory agencies and agencies/organizations interested in wetland protection should be establishing reference sites on public lands to generate this valuable information, but,in all likelihood, this is not being done in most places. If there is a good foundation of scientific information on plant communities, soil types, and hydroperiods (wetland hydrology dynamics) fora given wetland type, there may seem to be little need for evaluating reference types, to aid in project design, yet this analysis will provide pertinent information on local characteristics and temporal variations. Monitoring of the hydrology of reference wetlands of even well-studied types is useful for evaluating how well a particular wetland restoration or creation project is responding to local conditions and whether the site's hydrology is truly similar to that of local wetlands of the subject type. Consequently, assessment of reference sites is highly recommended.
Basic site analysis should be performed at a number of reference sites for major wetland types likely to be restored or created to gain a better local understanding of the characteristics of these areas. Once established and characterized, reference sites can then be monitored to track the performance of a particular restored or created wetland. There is no magic number to the number of reference sites per local wetland type, but probably two or three nearby reference sites should be sufficient for comparison and to track how well the restored or created wetland is mimicking the hydrology and for eventual comparison of vegetation.
Reference sites should be similar to the targeted type, but do not have to be exactly the same in all respects. It is important to emphasize that reference wetlands are not restricted to "unaltered or pristine natural wetlands," since it is well recognized that many wetlands have some history of human disturbance and that "pristine" wetlands are not necessarily the target condition for restoring an emergent or shrub wetland due to ambient environmental conditions and land uses (e.g., in an area of moderate or poor water quality). Reference wetlands for a given project ideally should be based on the wetland type desired and be in the same landscape position and subjected to the same types of external influences (e.g., water quality and adjacent land use) as the wetland to be restored. Although these types of reference wetlands would probably help establish the best goals and objectives, such wetlands may not exist in the locale. In this case, realistic goals and objectives can be established by considering other wetlands of the desired type in the same physiographic region in a neighboring watershed or by reviewing the wetland literature.
It is also important to recognize that when forested wetland is the targeted type, reference wetlands should change over time as the restored or created wetland changes from an emergent/scrub-shrub wetland to forested wetland. Forested wetlands cannot be created/restored in a short time for several reasons, hen~e the precursor of the forested wetland, such as a wet meadow planted with tree saplings, may be the initial type produced (e.g., reference wetland should be a wet meadow or previously harvested forested wetland in succession) and over time it should evolve into a forested wetland. This process may take 20 years or more for the trees to
l5
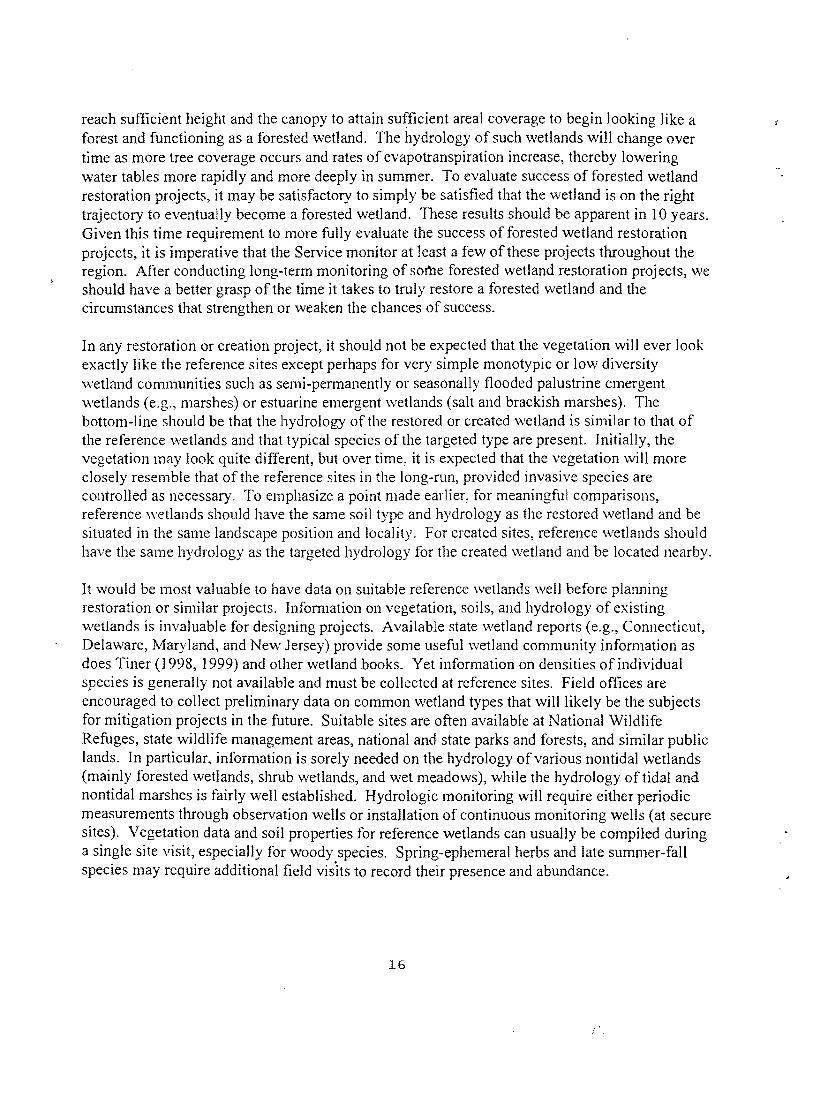
reach sufficient height and the canopy to attain sufficient areal coverage to begin looking like a forest and functioning as a forested wetland. The hydrology of such wetlands will change over time as more tree coverage occurs and rates of evapotranspiration increase, thereby lowering water tables more rapidly and more deeply in summer. To evaluate success of forested wetland restoration projects, it may be satisfactory to simply be satisfied that the wetland is on the right trajectory to eventually become a forested wetland. These results should be apparent in 10 years. Given this time requirement to more fully evaluate the success of forested wetland restoration projects, it is imperative that the Service monitor at least a few of these projects throughout the region. After conducting long-term monitoring of some forested wetland restoration projects, we should have a better grasp of the time it takes to truly restore a forested wetland and the circumstances that strengthen or weaken the chances of success.
In any restoration or creation project, it should not be expected that the vegetation will ever look exactly like the reference sites except perhaps for very simple monotypic or low diversity \\'etIand communities such as semi-permanently or seasonally flooded palustrine emergent wetlands (e.g., marshes) or estuarine emergent wetlands (salt and brackish marshes). The bottom-line should be that the hydrology of the restored or created wetland is similar to that of the reference wetlands and that typical species of the targeted type are present. Initially, the vegetation may look quite different, but over time, it is expected that the vegetation will more closely resemble that of the reference sites in the long-run, provided invasive species are controlled as necessary. To emphasize a point made earlier, for meaningful comparisons, reference wetlands should have the same soil type and hydrology as the restored wetland and be situated in the same landscape position and locality. For created sites, reference wetlands should have the same hydrology as the targeted hydrology for the created wetland and be located nearby.
It would be most valuable to have data on suitable reference wetlands well before plalming restoration or similar projects. Information on vegetation, soils, and hydrology of existing wetlands is invaluable for designing projects. Available state wetland reports (e.g., Connecticut, Delaware, Maryland, and New Jersey) provide some useful wetland community information as does Tiner (1998, 1999) and other wetland books. Yet information on densities of individual species is generally not available and must be collected at reference sites. Field offices are encouraged to collect preliminary data on common wetland types that will likely be the subjects for mitigation projects in the future. Suitable sites are often available at National Wildlife Refuges, state wildlife management areas, national and state parks and forests, and similar public lands. In particular, information is sorely needed on the hydrology of various nontidal wetlands (mainly forested wetlands, shrub wetlands, and wet meadows), while the hydrology oftidal and nontidal marshes is fairly well established. Hydrologic monitoring will require either periodic measurements through observation wells or installation of continuous monitoring wells (at secure sites). Vegetation data and soil properties for reference wetlands can usually be compiled during a single site visit, especially for woody species. Spring-ephemeral herbs and late summer-fall species may require additional field vishs to record their presence and abundance.
16
I ,

PART III.
\VETLAND l\10NITORING PROTOCOLS
l7
I .

Since the primary goal of projects will be to create or restore a certain type of wetland, assessing hydrology, vegetation, and accumulation of organic matter in the soil surface layer should provide adequate metrics for most projects to evaluate whether the project has successfully produced a restored or created vegetated wetland. For all projects, explicit and measurable objectives should be established so that monitoring can be done to determine whether the project has successfully accomplished its stated objectives (see Part I for examples of objectives and parameters). These objectives should include vegetation and hydrologic criteria and will often include other criteria, such as wildlife habitat and wetland size (for mitigation projects) . . The purpose of the following monitoring protocols is to provide recommended procedures for an acceptable minimum amount of monitoring needed to evaluate the success of wetland mitigation, restoration, creation, and enhancement projects from a technical standpoint. Appendix A offers recommended minimum guidelines for monitoring such projects. They are designed for use in all mitigation projects, all proactive projects larger than 5 acres, and a subset of projects 1-5 acres 111 SIze.
Of particular interest may be a requirement to document wildlife use of the site. Unfortunately, this probably has not been done at most mitigation sites, despite the Service's obvious interest and concern over these resources. Remember that these are guidelines for assessing project success and that this does not mean that Service biologists must do this work for mitigation projects, but that they should recommend that such monitoring be performed in order to safeguard fish and wildlife resources. The Service will likely be doing such monitoring for some of its O\>;1n projects and for Natural Resources Damage Assessment restoration projects. A sample monitoring report form is provided in Appendix 8,2.
Monitoring Techniques and Procedures
The following section includes recommended techniques and procedures for examining various properties of both reference wetlands and restored, created, and enhanced wetlands. As mentioned previously, a comparison of the project wetland with natural reference wetlands is desirable. The techniques address the following attributes:
• wetland hydrology (nontidal and tidal wetlands) • hydrophytic vegetation (including the success of plantings and seedings)
2Special Note regarding the minimum guidelines: These minimum guidelines may seem to be more than minimal based on the general lack of adequate monitoring for most projects to date. Yet, if one really wants to document and verify that a project is providing benefits equivalent to natural wetlands, the recommended level of effort is the minimum necessary to do so. In drafting these guidelines, every effort has been made to identify practical, easy-to-observe metrics that relate to important characteristics and functions of wetlands. If during operational use of these guidelines, more efficient and effective metrics are discovered, they will be incorporated in the final guidelines.
18
I ,
.,

• accumulation of organic matter, salinity (for salt marsh restoration), • development of hydric soil properties (for created sites) • wildlife use • wetland extent (for mitigation projects)
The discussion includes sampling methods, frequency of sampling, and other recommendations for monitoring each attribute. Data collection and summary forms are provided in the Appendices (Appendix C through H).
Hydrology for Nontidal \Vctlands
For recording changes in the water table, install a series of groundwater observation wells to a depth of 3 feet or to the confining layer if shallower. Be sure not to puncture the hardpan or other confining layer. An examination of the soil before installing the pipes will reveal any such restrictive layer. The wells are 1 V2-inch PVC pipes with a slotted section glued to the bottom.3
The number of wells will vary due to the size and complexity of the site. Wells should be located in several areas of the \\'etland that correspond \"/ith significantly different elevations including near the wetland-upland boundary. There should also be replicate wells installed at similar elevations. The Regional Office's Regional Wetland Coordinator can offer detailed recommendations for individual projects upon request.
For sites subject to flooding, be sure to put pipes sufficiently above ground so that flood height can be determined. Clearly mark the aboveground pipe with height levels above the ground surface (in inch or cm increments), so that depths can be read from a distance with binoculars when necessary. Also mark the ground surface level of the pipe so you can detect any possible effect of frost heaving and make necessary adjustments in interpreting the results. When not flooded, water table depth can be determined by sticking a wooden stake (or dropping a weighted line) down the tube and measuring the distance from the top of the stake to the water mark and then subtracting for the aboveground height of the well pipe. Record the data on Form HI (Appendix C).
Additional hydrologic observations should be made in soils at the site to record the depth to saturation except when the site is completely inundated or saturated to the surface (for partly flooded sites, exposed areas should still be examined). These observation areas should be far enough from well locations to avoid interference with water table readings in the well pipes (e.g., 20 feet should be sufficient). Dig a hole 2.0 feet deep to detem1ine if there is any saturation within this zone and record the depth of saturation from the soil surface. Examine the surface of the exposed faces of the soil pit and look for evidence of saturation (e.g., weeping ped surfaces) and record the uppermost level of saturation on Form H2 (Appendix C). Backfill the hole after making all the necessary observations.
30ne source for the slotted portion is: Atlantic Screen and Manufacturing, 118 Broadkill Road, Milton, DE 19968; 302-684-3197.
1.9

When making hydrology observations in the spring, it is also worthwhile to record initiation of plant activity for early-blooming species (use Form H2; Appendix C). Look for bud swell, bud break, emergence of herbaceous plants, and flowers. Some typical early-blooming wetland species include pussy willow, alders, skunk cabbage, red maple, silver maple, trout lily, and spring beauty. You should note the return of red-winged blackbirds and other early spring migrants, and other wildlife signs (e.g., salamander and wood frog breeding).
Annual Hydrology Monitoring Schedule. Monitor the hydrology periodically during the expected wet period for all sites, and for the wetter wetlands (e.g., marshes), monitor throughout the growing season. For most of the Northeast, optimal monitoring should commence in October and extend through May (avoiding periods when the soil is frozen for long periods, e.g., January and February in New England, upstate New York, northern New Jersey, and other mountainous areas). Observations of water table depths should be made twice per month from October through February and once a week from March through May (early growing season data will reveal whether site is wet enough to qualify as a wetland) and, if desirable, once a month from June through September. This type of monitoring is especially important for restoration of bottomland hardwood wetlands, seasonally saturated types like flatwoods and certain wet meadows, and temporarily flooded wetlands, where soil saturation or brief flooding occurs from late winter into spring.
More frequent observations just prior to the "growing season" and throughout the early part of the growing season is recommended due to the significance of wetness during this time and its relationship to the plant community. While "growing season" wetness may be a requirement for regulatory determinations, the ecologically significant period is longer. The recommended period covers the time during which plant roots are gwwing and buds begin to swell as well as for early bloomers like skunk cabbage, silver maple, and pussy willow.
If hydrologic sampling has to be limited for budgetary or other reasons, then the minimum sampling for temporarily flooded or seasonally saturated wetlands is biweekly observations from March through May for most of the Northeast. In northern New England and the Adirondacks, minimum biweekly monitoring should be performed from April through June.
For wetter wetlands (e.g., seasonally flooded/saturated wetlands or wetter), bimonthly observations should be made year-round. There is no need for weekly samples since these wetlands should be flooded at least during the early part of the growing season. If a restoration or creation site is not meeting the hydrology requirement, it will be easy to determine. After monitoring bimonthly during the first year (provided it was a normal rainfall year), sampling may be less frequent perhaps just bimonthly during the growing season (e.g., March, May, July, and September). Any significant deviations in water level and table fluctuations should be readily identified when compared with the benchmark data originally collected for the site and/or with previously recorded data (i.e., a hydrograph) from a comparable reference wetland. If a problem is detected, more frequent measurement is recommended to better assess the extent of the problem.
! ,
I'

For all sites, record water table depth, height of inundation, and depth to saturated soils on Forms HI and H2 (Appendix C). On the Coastal Plain (from southern New Jersey south) where soils are essentially never frozen, year-round monitoring may be desired for restoration and creation projects of drier-end wetlands (e.g., temporarily flooded or seasonally saturated types). It should be recognized that some studies have found that winter wetness is a significant factor that positively affects plant productivity as in loblolly pine in Louisiana. So, winter monitoring of hydrology should not be casually dismissed as unimportant, especially in more southerly .. locations. It is noted, however, such monitoring is beyond the minimum needed to determine whether the area is a wetland or not and relates specifically to assessing desired functions.
Duration of Annual Monitoring. Another important question is -- How long should monitoring be performed? The duration of such studies depends on the wetland type and how successful the project is at accomplishing its objectives. Additional monitoring will be required for projects that show signs of failure early in the monitoring. In general, hydrology should be monitored in post-construction years 1 and 2 and if similar to the reference wetland (i.e., no extreme flooding and \vithin 6 inches of the water table of the reference wetland), then again in year 5.
If the hydrology does not seem to be mimicking that of the reference wetland, monitor the groundwater wells more frequently and throughout the year. This may help pinpoint the problem. If the hydrograph is not similar to the reference wetland, determine the likely cause for difference and employ a mid-course correction re: project design (to increase or decrease site wetness) and start monitoring schedule over (i.e., new year I).
For seasonally flooded emergent wetlands (e.g., marshes and wet meadows), if the hydrology of the restored or created wetland successfully mimics that of the reference wetland, hydrology monitoring can be stopped after year 5, unless the site is being used for long-term (continuous) monitoring purposes. Drier-end emergent wetlands, shrub wetlands, and forested wetlands will require longer monitoring, with additional assessment in years 7 and 10, or longer if for longterm monitoring. The rationale for the longer time period is mainly due to the fact that the woody vegetation will take some time to fully establish itself at a given site and that until such time, the full impact of the vegetation (through increased evapotranspiration) on local water tables will not be known.
When monitoring, it is important to know and record the status of precipitation relative to longterm conditions. Such data are usually available at local airports or other weather stations (contact the local U.S. Geological Survey hydrologic office for information). In this way, it will be known whether the observations are made during a wet year or season, a dry year or season, or "normal" conditions.
Hydrology for Tidal \Vctlands
Restoration of tidal wetlands will usually involve plugging ditches to restore pannes (natural depressions in the marsh), or repairing broken culverts, replacing undersized culverts with larger ones, removing tide gates, or replacing them with automated or self-regulating tide gates to allow
21
I',
for a significant increase in tidal water exchange. In some cases, bridge openings will need to be expanded by reducing the amount of causeway approaches and increasing the bridge span to provide for more tidal flowage. Monitoring the hydrology of these types of projects is quite different than that of nontidal wetlands, since the hydrology of tidal wetlands is driven by surface water, namely the tides which are the vital link to site wetness. While one could measure the water tables, more emphasis should be placed on insuring that the project area is sufficiently flooded by spring tides. An existing culvert may be sufficient to pass the daily tides, but may greatly limit the penetration of spring tides which are vital to maintain the salt-fresh water balance upstream and sustaining salt or brackish marsf1 plant communities.
Monitoring the hydrology of restored tidal wetlands will require assessing the tidal exchange during a spring tide. Consult the U.S. Department of Commerce's "Tide Tables" for the upcoming year. Identify the day of the highest predicted spring tides when you can observe virtually the entire period of a rising and falling spring high tide. Ideally, the slack water period should be around 6:00 or 7:00 AM with the tide beginning to rise around 9:00 AM, peaking around noon, and reaching lew tide around 6:00 PM. This is the most convenient time for making observations during working hours. With a hammer or similar device, drive two long wooden stakes with water levels marks in inches into the marsh substrate to a depth of about 1.5 to 2.0 feet. Water level marks, of course, should start at the marsh surface, so depth of flooding can be recorded. Be sure to label the depth intervals (e.g., 6-inch intervals) so that you can read the numbers from the road using binoculars. In terms of the locations of the two stakes, one placed on the seaward side of the former restriction (to record tidal flooding levels in the unrestricted marsh), and the other stake placed upstream in the "restored" marsh (formerly restricted). Ideally the elevations at the stake locations should be recorded by a surveyor; at least relative elevations are needed for comparison.
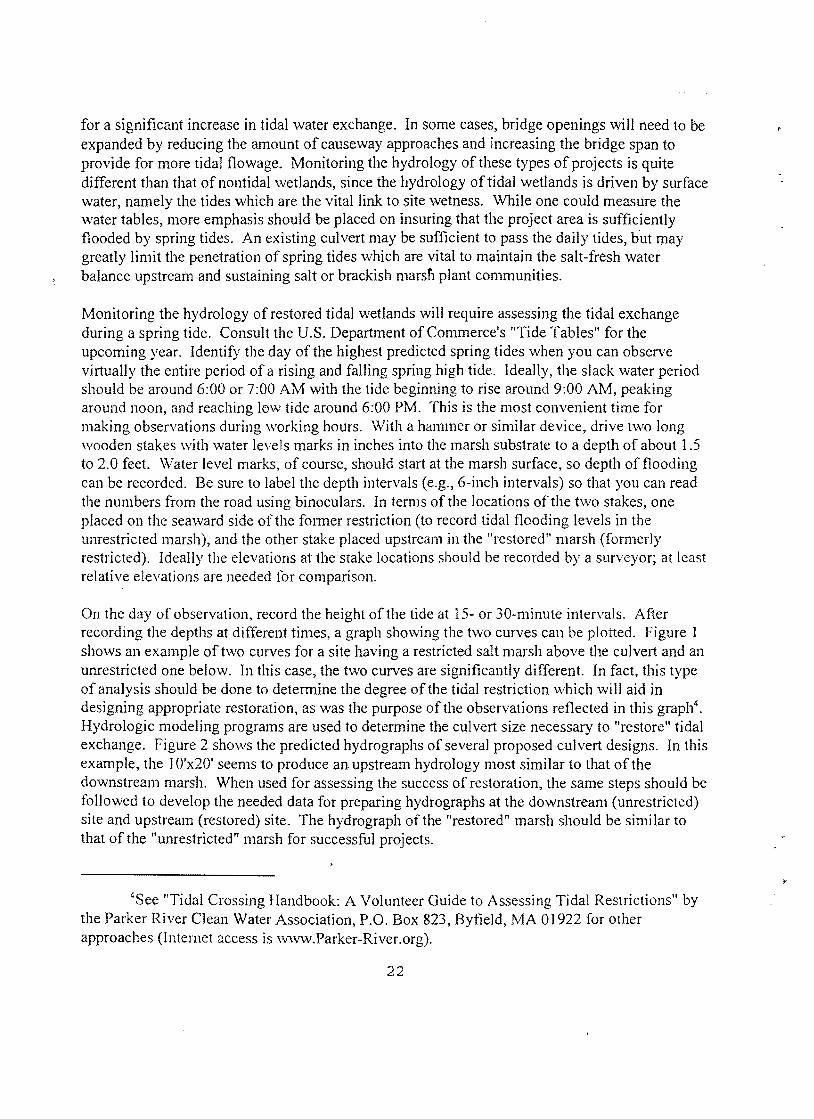
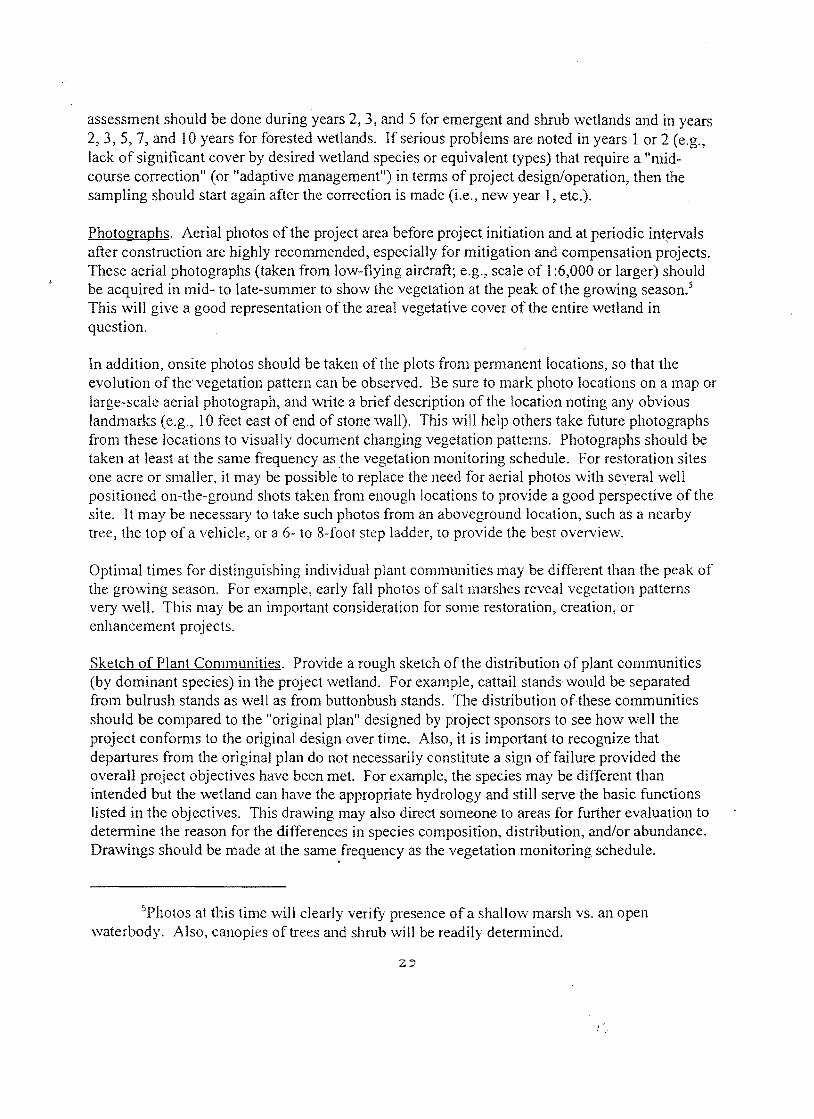
On the day of observation, record the height of the tide at 15- or 30-minute intervals. After recording the depths at different times, a graph showing the two curves can be plotted. Figure 1 shows an example of two curves for a site having a restricted salt marsh above the culvert and an unrestricted one below. In this case, the two curves are significantly different. In fact, this type of analysis should be done to determine the degree of the tidal restriction which will aid in designing appropriate restoration, as was the purpose of the observations reflected in this graph4. Hydrologic modeling programs are used to determine the culvert size necessary to "restore" tidal exchange. Figure 2 shows the predicted hydrographs of several proposed culvert designs. In this example, the 10'x20' seems to produce an upstream hydrology most similar to that of the downstream marsh. When used for assessing the success of restoration, the same steps should be followed to develop the needed data for preparing hydrographs at the downstream (unrestricted) site and upstream (restored) site. The hydrograph of the "restored" marsh should be similar to that of the "unrestricted" marsh for successful projects.
4See "Tidal Crossing Handbook: A Volunteer Guide to Assessing Tidal Restrictions" by the Parker River Clean Water Association, P.O. Box 823, Byfield, MA 01922 for other approaches (Internet access is www.Parker-River.org).
22

I f evaluating the success of flooding of newly established pannes (e.g., created by ditch plugs), photographs taken at high spring tide should show the success of these types of projects. The presence of flooded pools should provide ample evidence of project success.
a > o z
6
6
t;: 4
z o ;::: 0<{
> W ..J W 2 0:: w t-o<{
S
o
-
r i
-_ ..
·2 06:00
"'-A.-J.cI."**
-+++<Q
BRIDGE STREET WETLAND TIDAL READINGS
--~----' -
I i
J i------- ---
~ i
-- --- /'
-~ I
----- I" -- j : ,
.- ~.-- ,
-A-A-A-Al\ j --~-#;-
i.I.-A~ :~ .,. ---_ ..
\ I fr,H.-.lcJ. .... cI.-l.**-J.* ""-.t-.l"" .... .,.,
I \ I
~~ \ --- ._-- '1\ .
10:00 14;00 18:0 TIME. MAY 15,1995
+ DOWNSTREAM OF CULVERT ... UPSTREAM OF CULVERT
Figure 1. Hydrographs of tidal marshes above and below a culvert -- one has unrestricted tidal flow (downstream of culvert) and the other restricted tidal flow (upstream of culvert). The latter hydrograph shows a flattening of the tidal flooding curve with only minimal tidal fluctuation in wate~ levels recorded. (Source: U.S. Army Corps of Engineers 1996)
23
I',

Figure 2. Predicted hydrographs for several alternative culvert designs for the Bridge Street wetland (current hydrographs in Figure 1). The hydrograph for the lO'x20' culvert most closely approximates that ofthe downstream (unrestricted) tidal marsh. (Source: U.S. Army Corps of Engineers 1996).
CULVERT ALTERNA11VES BRIDGE STREET WETLAND
• h20 {vptllurnj
-------+=~~~~..2:,d_~~---+-----+-----_+------1I (; loaOiIJpScItUlTIl
'0 20
TIME. HOURS
24
I'

Hydrophytic Vegetation
Vegetation sampling will involve two basic tasks: 1) making general observations in year 1, and 2) performing detailed assessment in future years.
Year 1 Observations. At the end of the first full growing season, a cursory assessment of the vegetation should be conducted. This will involve making general observations of plant cpver (e.g., detect patches of bare ground), sp~cies composition (i.e., a simple list of dominant and common species with estimated areal coverage), and for planted sites, a general assessment of survival arid plant vigor (complete Form VI in Appendix D). This step will help identify potential problems. Given that the first year of vegetation is often characterized by a transitional community (one in flux), it is probably not worth establishing and evaluating permanent plots at this time, especially for proactive projects.
Detailed Vegetation Sampling. The more comprehensive vegetation analysis will be conducted beginning with the end of the second full growing season. Two types of vegetation sampling will be employed: 1) plot sampling and 2) point intercept sampling. These recommended methods generally follow the methods published in "Federal Manual for Identifying and Delineating Jurisdictional Wetlands" (Federal Interagency Committee for Wetland Delineation 1989; see Appendix I), although there are some additional metrics to evaluate for plant grovvth (e.g., changes in dbh and height of saplings and trees).
Plot Sampling. Establish three or more permanent 30-foot radius circular plots. Mark their center with metal rods and write a narrative statement on their location relative to any visible landmarks (e.g., so many feet northeast of stone wall). If such landmarks do not exist, put other metal rods on the upland and take a compass bearing and measure distance to plot center. This will help locate the plot when vegetation is at maximum height. The number of plots will be based on the size of the wetland and its complexity re: elevational gradients. A global positioning system (GPS) device may be used to record geospatial coordinates for additionallocational reference to individual plots.
For emergent wetlands, use a I-meter square or 3-foot square sampling frame. Divide the 30-foot circular plot into 4 equal-sized quadrants. Randomly toss frame into each quadrant and record each species present and the areal cover of each. Do this for a total of six samples. Build a species-area curve; if the curve is still rising take additional random samples (Figure 3). Six samples, however, should usually be sufficient for 1110st emergent wetlands. Record the species observed and their average % cover on the vegetation sampling data form (see Appendix E for form and graph to plot curve).
25

Figure 3. Example of species-area curve. The number of species increases as more area is sampled until the number of new species decreases. The point of inflection on the curve represents the minimum area (in this example, this point is between quadrats 4 and 5). Always sample slightly more than the minimum area. In this example, 6 or 7 quadrats should be sufficient. (Source: Federal Interagency Committee for Wetland Delineation 1989)
II) <::> ·u 8. t/)
" .8 E :> Z
SPECIES-AREA CURVE 1
20 .. 19
18
17
16
15
14
13
12
11
10
9
8
7 • • • • 6 • • 5 • 4
3 • 2
2 3 4 5 6 7 8 9 10 11 12 13 14 15 16 17
Number of Quadrats 2
t Plot the cumulative number of species against the quadrats (e.g., if quadrat .1 has 3 species and quadrat 112 has any. all, Of none of those species but has 2 new species, then 5 cumulative species should be plotted against quadrat #2). The number of quadrats sufficient to adequately SUlVey the understory will corresdpond to the point on the CUlVe where it first levels off and remains essentially level.
2 Specify Gize of sample quadrat: ___ ..;:;..::.=-.;m-,--z. __ _
26
I'.

For scrub-shrub and forested wetlands, analyze all layers of vegetation within the 3D-foot circular plot. For trees and saplings, count the number of trees and saplings (by species) in the plot, measure dbh of each, compute the basal area, and estimate height of each specimen. For shrubs, count the number of stems by species, estimate areal coverage of each species, and estimate the average height of each species. For woody vines, simply record the number of vine stems present by species. Be sure to take note of any reproductive parts (flowersl fruits/seeds) observed as they are positive signs of plant establishment. Complete the, vegetation sampling data form (Form V2 in Appendix F).
Point Intercept Sampling. Follow procedures in the interagency wetland delineation manual. Basically, the steps involve collecting plant species occurrence data at various points along three randomly selected 200-foot transects. Observations of plant species intercepting a sample point should be recorded on the appropriate data form (Form V3 in Appendix G). Samples (observations) should be taken every 2 feet. Calculate the prevalence index (PI) for each transect and then determine a prevalence index of the plant community (see example in Appendix J). \Vhen the prevalence index for the community is 2.0 or less, the area is well represented by hydrophytes and should be an obvious wetland from a vegetation standpoint. If the PI is between 2.0 and 3.0, the community still has significant wetland species, but it may represent a drier-end wetland or simply a wetland dominated by F ACW and F AC species. The PI of the restored or created wetland should be compared to a reference wetland to determine the similarities and whether the project has successfully accomplished its objectives from a plant community standpoint.
Evaluation of Planting and Seeding Success (for Restored or Created Wetlands). The question to plant or not to plant is a fundamental question for many projects. Planting should be done under the following conditions:
I) the area is likely to be subjected to significant erosion and certain persistent plants are desired to stabilize the soils (note that many soils can be stabilized by seeding and planting is usually not needed),
2) where specific plant species are desired to perform certain functions (e.g., food for wildlife or nutrient uptake) to mitigate for lost wetlands,
3) where there is a potential threat of invasion by exotic or undesirable species and where it is necessary to vegetate the area to help prevent such invasion,
4) where there is no natural seedbank (or imported seedbank) such as for many wetland creation projects, and
5) for many shrub and forested wetland restoration projects initiated to mitigate for destroyed wetlands of these types.
There may be other situations that dictate the need for plantings so the above conditions should
27
I',

not be viewed as exhaustive. Yet many wetland restoration projects can be accomplished without plantings due to the existence of a viable wetland plant seed bank, especially if the area in question is contiguous to an existing wetland or in an area with an abundance of other wetlands that can provide seed sources in addition to the seedbank. As long as the hydric soils remain on the site, there should be an ample supply of viable wetland seeds in storage. If there are questions about viability, one might consider a simple seedbank germination experiment before restoration to ascertain the likely density and diversity of wetland plants held in the seedbank.
Seeding of sites may also be warranted under some cirt:umstances, especially conditions 2, 3, and 4 above. Planting of acorns is a common technique for reestablishing southern bottomland hardwoods forests. It is especially useful for proactive restoration projects. Seeding of exposed banks is important for soil stabilization.
For planted sites, it is important to monitor the survival and growth ofthe plantings each year, since these species represent the desired plants for the restored or created wetland community. For all such sites, a general reconnaissance should be performed to identify areas of the project wetland where specimen plants are dead, dying, or showing signs of stress (no significant grov.1h). These areas may then be studied in more detail to uncover the factors that may be limiting plant growth. These observations probably need only be done once a year, perhaps in mid- to late-summer when comprehensive vegetation analysis is being performed. Lack of wetness in winter may be a factor leading to winter die-offs especially in evergreen species, so early spring observations may also be worthwhile for these situations.
Form V4 (Appendix H) provides some questions to answer in evaluating planted and seeded sites. Survival of plantings is an important observation to record as is the coverage by seedlings. It is also necessary to assess the grov.1h of the plantings and their production of flowers, fruits, and seeds to insure that the plants are actively colonizing the site or, at least, growing vigorously rather than simply surviving. Measuring the annual growth of woody plants (e.g., height and dbh) and estimating the horizontal spread (areal cover) of herbaceous species at the end of the growing season is also recommended. It may be useful to record the number of living and dead woody plants and show the location of the dead specimens on a sketch map if necessary. Do the same for herbaceous plantings, although it may be more appropriate to count living and dead clumps rather than individual specimens.
Vegetation Monitoring Schedule. At the end of the first full growing season, a cursory assessment of the vegetation should be performed at project sites. This involves examining vegetative cover, plant composition, and survival of planted specimens and completing Form VI (Appendix D). There is no need to evaluate permanent plots at this time as it may take some time for the herbaceous vegetation to stabilize.
For restored or created wetlands, vegetation sampling should be done once a year at the peak of the growing season (e.g., mid-July to mid-August for the Northeast). For reference wetlands, vegetation sampling should be done periodically. All sites should be fully evaluated and data tabulated (Forms V2 and V3, plus Form V4 for planted/seeded sites). This vegetation
20
,I "
assessment should be done during years 2, 3, and 5 for emergent and shrub wetlands and in years 2, 3, 5, 7, and 10 years for forested wetlands. If serious problems are noted in years 1 or 2 (e.g., lack of significant cover by desired wetland species or equivalent types) that require a "midcourse correction" (or "adaptive management") in terms of project design/operation, then the sampling should start again after the correction is made (i.e., new year I, etc.).
Photographs. Aerial photos of the project area before project initiation and at periodic intervals after construction are highly recommended, especially for mitigation and compensation projects. These aerial photographs (taken from low-flying air~raft; e.g., scale of I :6,000 or larger) should be acquired in mid- to late-summer to show the vegetation at the peak of the growing season.s
This will give a good representation of the areal vegetative cover of the entire wetland in question.
In addition, onsite photos should be taken of the plots from permanent locations, so that the evolution of the' vegetation pattern can be observed. Be sure to mark photo locations on a map or large-scale aerial photograph, and write a brief description of the location noting any obvious landmarks (e.g., 10 feet east of end of stone wall). This will help others take future photographs from these locations to visually document changing vegetation patterns. Photographs should be taken at least at the same frequency as the vegetation monitoring schedule. For restoration sites one acre or smaller, it may be possible'to replace the need for aerial photos with several well positioned on-the-ground shots taken from enough locations to provide a good perspective of the site. It may be necessary to take such photos from an aboveground location, such as a nearby tree, the top of a vehicle, or a 6- to 8-foot step ladder, to provide the best overview.
Optimal times for distinguishing individual plant communities may be different than the peak of the growing season. For example, early fall photos of salt marshes reveal vegetation patterns very well. This may be an important consideration for some restoration, creation, or enhancement projects.
Sketch of Plant Communities. Provide a rough sketch of the distribution of plant communities (by dominant species) in the project wetland. For example, cattail stands would be separated from bulrush stands as well as from buttonbush stands. The distribution of these communities should be compared to the "original plan" designed by project sponsors to see how well the project conforms to the original design over time. Also, it is important to recognize that departures from the original plan do not necessarily constitute a sign of failure provided the overall project objectives have been met. For example, the species may be different than intended but the wetland can have the appropriate hydrology and still serve the basic functions listed in the objectives. This drawing may also direct someone to areas for further evaluation to determine the reason for the differences in species composition, distribution, and/or abundance. Drawings should be made at the same ,frequency as the vegetation monitoring schedule.
"Photos at this time will clearly verify presence of a shallow marsh vs. an open waterbody, Also, canopies of trees and shrub will be readily determined.
I ..

Accumulation of Organic Matter
For seasonally flooded/saturated, semi-permanently flooded, and permanently flooded wetlands, the amount of organic matter may be worth assessing on an annual basis, since these wetlands tend to accumulate organic matter in one form or another (e.g., as peat or muck or as part of the A-horizon). Although one might infer that organics are building up if a certain hydrology and plant community are observed, it is probably worth separate analysis since it may be done with minimal effort. This type of assessment is probably most needed at created wetlands associated with mitigation projects. •
At the end of the growing season (e.g., October), the upper surface layer can be examined to determine the build-up of organic matter. A simple measurement of the depth of the organic layer (O-horizon) should be sufficient for the wetter wetlands. For drier wetlands (e.g., temporarily flooded or seasonally saturated) where a distinct organic layer is not present, laboratory analysis of the surface mineral layer (A-horizon) will need to be performed. The soils lab at a local university may be able to analyze samples at low cost.6 The % organic matter of restored or created wetlands will be compared with the % of organic matter in reference wetlands. Again, the percentages may not be the same initially, but over time, the percentages from soils at the restored and created wetlands should increase and become closer to that of the reference wetland. The time required for them to intersect is unknown and will require long-term studies.
It may also be possible to track organic accumulation in wetter wetlands like marshes by putting down a layer of colored sand in study plots. A nest of plots could be established and small areas examined within the nest over the course of 5 years or so. Two soil cores could be taken out of each "nest" ammally being sure not to resample in the same location (use a grid system). Samples could be taken in the spring to determine the depth of material above the sand layer. This would present a general picture of whether the marsh is accumulating organic material and when evaluated over time, a sense of the rate of accumulation. This could be compared with similar results from one or more nearby reference wetlands. Such studies should be continued for the duration of the monitoring project and at the same intervals as examining the hydrology and/or vegetation for the specific wetland type.
Sediment Accumulation
Sedimentation rates in the subject wetland may also be determined and compared to one or more reference wetlands. The colored sand or clay approach mentioned under organic matter accumulation may be relevant. Installation of plastic disks secured to the substrate may also be useful. The amount of sediment accumulating above the colored sand/clay layer or plastic disk can be measured periodically. Be sure, to note the locations of these sampling sites as they will
6Ifinterested, the Regional Office could work with the University of Massachusetts to analyze soil collected from across the region to facilitate such analyses .
.:lU

not be easily seen when covered with sediment.
Salinity (for Salt Marsh Restoration)
Besides the typical vegetation and hydrology evaluations, assessment of th<:_ soil chemistry of restored salt marsh may be beneficial especially if there is a question as to whether the restored wetland is receiving too much concentrated freshwater inflow, such as surface water runo(ffrom a storm drain. Salinity measurement should ideally be initiated before project construction as it represents an important consideration in designing the restoration project. Yet, it is still useful to assess post-construction results to see if soil-pore water salinity has increased to that of typical salt marshes. Salinity of water extracted from peat cores can be determined and compared with the soil salinity of neighboring salt marshes that appear healthy. A refractometer can be used to determine the approximate salinity and to detect gross differences that may exist between the wetland in question and the unaffected salt marsh. The problem area of the marsh may also be a point of active groundwater discharge that lowers salinity naturally. If this situation has promoted the establishment of an undesirable plant such as common reed (Phragmites australis), restoration might seek to divert some of this inflow to a marsh ditch or stream (via open marsh water management teclllliques) to reduce freshwater concentration of the marsh substrate. This may produce sufficient salt stress to reduce the vigor and areal cover of common reed to the benefit of more typical halophytic species.
Salinity should be monitored pre- and post-project in the subject wetland and the more seaward reference wetland on several occasions during the year: spring (March-April), summer (JulyAugust), fall (October-November). Measurements should be made at high tide during two tidal cycles for each of these seasons: 1) predicted spring tide and 2) more typical tide. Measurements should be avoided after periods of heavy rainfall as such conditions may interfere with estimate of salt water penetration. These studies should be conducted in years 1,2, and 5 following salt marsh restoration. Salinity measurements should include creek water salinity as well as interstial soil salinity at several locations in the restored and reference wetlands. The locations of sampling sites in the restored wetland should include different elevations as well as some points near the marsh-upland border.
Soil Analysis (for Created Sites)
Created wetlands will require further evaluation of soil characteristics. If soils are imported from a destroyed wetland, we will want to ensure that soils are maintaining hydric conditions. The hydrology measurements and assessment of organic matter accumulation should be sufficient for these sites. Other sites, however, will require a look at the evolution of soil properties, mainly gray mottles and their abundance in the subsoil (below the surface layer or A-horizon).
At three or more locations in the createo wetland, the soils should be described to a depth of 1 foot on an annual basis. These observations are best made during the dry season, so August and September observations are recommended. Soil texture and colors should be described. Also, any evidence of sulfidic odor should be recorded. Record this information on Form M 1 in
3l

Appendix B.
Soil chemistry assessments may also be worthwhile for created sites since such sites were never wetlands and creating anaerobic conditions are vital to the establishment of wetland plants and microbiota and to the performance of many functions, especially nutrient recycling important for water quality renovation. Soil probes and tensiometers can be installed in the created wetland and data can be periodically recorded to insure that prolonged saturation has successfully .created anaerobic soil conditions. This type of analysis would be more likely required for wetland creation projects constructed to mitigate for alteration'of existing wetlands than for proactive· wetland creation since it is quite costly and time-consuming.
Wildlife Use
Assessing wildlife use is especially important for projects seeking to restore, create, or enhance fish and wildlife habitat and should also be equally important for projects attempting to mitigate for destroyed wetland wildlife habitat. Rather than simply assuming that if the plant community and hydrologic conditions are successfully established that the area is a viable wildlife habitat, verification may be required to insure that fish and wildlife are really benefitting from the project. Verification of wildlife use should be a requirement for wetland mitigation projects, especially since it is one of the Service's major concerns about a permitted action. See Service document FWM 221 (published 10/6/95), Part 701 Population Management at Field Stations, Chapter 2, Inventory and Monitoring of Populations, for guidance on conducting faunal surveys on wildlife refuges.
For mitigation projects, various fish and \vildlife habitat restoration and similar projects, the project goals/objectives for fish and wildlife should have specified the target species and the intended usage and, if not, project plaIming needs improvement. Merely making an area wet enough to technically qualify as wetland should not be a valid objective, especially for wetland wildlife habitat restoration projects. Given the Service's expertise and mission, project goals need to be more explicit than this. After all, wildlife have particular habitat requirements which need to be considered and taken care of if the project is to benefit these organisms. For example, a project may require special plantings to promote the growth of more desirable food plants or nesting cover.
To evaluate project success re: fish and wildlife use, documentation of such use will require observations/collections during key periods, such as the breeding season and/or migrat;ion seasons (for migratory species), or perhaps during winter (if such areas are to intended to provide overwintering habitat). Standard fish sampling, small mammal trapping, bird censusing techniques, etc. should be followed. Data collected should include date/time of sampling, methods employed, species recorded, and number of species observed/collected. Sampling should be done at least three different times during a particular season (e.g., winter, spring, summer, and fall) relating to desired wildlife use (e.g., breeding, migration, or overwintering). Observations should be made during the peak of these periods. Data should be compared with qualitative/quantitative measures for evaluating project success. Comparison with data from one
32
I .
or more neighboring reference wetlands is desirable. Be sure that faunal surveys are done during similar periods and times of day to maximize correspondence. Factors that may be adversely affecting wildlife use of the project wetland should also be documented.
The goal of a salt marsh restoration may be to increase production of salt marsh invertebrates and use of the "formerly restricted" tidal creek network by estuarine fish. If so, then these organisms need to be sampled and monitored following standard sampling techniques. Comparisons.can be made with populations in contiguous seaward marshes . . Dctermining Wetland Extent (for Mitigation Projects)
For mitigation projects, the acreage of restored or created wetland is usually an important criterion for evaluating project success. The limits of the new or restored wetland must be established following regulatory procedures for wetland delineation (currently the U.S. Army Corps of Engineers wetland delineation manual with accompanying guidance memoranda; Environmental Laboratory 1987). The determination should include a narrative description of how the wetland boundary was established and, in these cases, it is suggested that hydrologic data be used to help validate the wetland boundary since it should be collected for monitoring purposes. The determination should also provide an estimate of the acreage of the restored or created wetland based on this delineation.
Additional Considerations for Mitigation Projccts
Given that mitigation is required to lessen the environmental consequences of construction projects altering existing wetlands, the monitoring requirements should be more rigorous to insure that the replacement \vetland is providing the desired functions at a satisfactory and specified level of performance. These objectives are established by the regulatory agencies upon advice from other agencies such as the Service, the National Marine Fisheries Service, the Environmental Protection Agency, and state natural resource agencies. Depending on the specific goals and objectives established, a monitoring program must be tailored to evaluate the specific permit c"6nditions. The wetland monitoring guidelines presented herein can help suggest possible goals and objectives, but the details for any required mitigation and monitoring depend upon the final negotiated permit conditions.
It must be emphasized that the monitoring requirements should be as specific as possible. This means specifying the wetland type according to the Service's official wetland classification system (Cowardin et a1. 1979), desired dominant species, landscape position (floodplain, lotic, lentic, and isolated) and landform (Tiner 1997), and wetland size for mitigation and not simply saying the objective is a 10-acre forested wetland. Moreover, it may be more prudent to set the objective as a palustrine emergentlshIl;lb-shrub wetland seasonally flooded on a floodplain with plantings of the following species (x, y, and z) at a certain density (e.g., 20 saplings/acre) than to focus on the desired end result -- a forested wetland. Forested wetlands cannot be recreated in a short time. Rather, the precursor to a forested wetland is the type that can be established and monitored for success in the short-term. Long-term monitoring, however, will be required to
JJ

determine if such efforts are successful in re-establishing forested wetlands.
} "
REFERENCES
Cowardin, L. M., V. Carter, F. C. Golet, and T. LaRoe. 1979. Classification of Wetlands and Deepwater Habitats of the United States. U. S. Fish and Wildlife Service, Washington, DC. FWS/OBS-79/31.
Environmental Laboratory. 1987. Corps of Engineers Wetland Delineation Manual. U.S, Army Engineer Waterways Experiment Station, Vicksburg, MS. Tech. Rept. Y-87-1.
Federal Interagency Committee for Wetland Delineation. 1989. Federal Manual for Identifying and Delineating Jurisdictional Wetlands. U.S. Army Corps of Engineers, U.S. Environmental Protection Agency, U.S Fish and Wildlife Service, and U.S.D.A. Soil Conservation Service, Washington, DC.
Taylor, Janith. 1998. Guidance for Meeting U.S. Fish and Wildlife Service Trust Resource Needs when Conducting Coastal Marsh Management for Mosquito Control on Region 5 National Wildlife Refuges. U.S. Fish and Wildlife Service, Refuges and Wildlife, Region 5, Hadley, MA.
Tiner, R.W. 1997. Keys to Landscape Position and Landform Descriptors for U. S. Wetlands (Operational Draft). U. S. Fish and Wildlife Service, Region Ecological Services, Hadley, MA.
Tiner, R.W. 1998. In Search of Swampland: A \\'etland Sourcebook and Field Guide. Rutgers University Press, New Brunswick, NJ.
Tiner, R. W. 1999. Wetland Indicators: A Guide to Wetland Identification, Delineation, Classification, and Mapping. Lewis Publishers, Inc., Boca Raton, FL.
U.S. Army Corps of Engineers. 1996. Cape Cod Wetlands Investigations. Section 22 Planning Assistance to States, Massachusetts, in cooperation with Coastal America, Massachusetts Wetlands Restoration & Banking Program, and Massachusetts Highways Department. New England Division, Waltham, MA.
! .

APPENDICES
36
I .

Appendix A. Recommended Minimum Wetland Monitoring Guidelines.
37
Recommended Minimum "'etIand Monitoring Guidelines for Restoration, Creation, or Enhancement Projects
These guidelines are suggested for all sites larger than 5 acres and for a subset (e.g., 25%) of sites 1-5 acres plus all mitigation sites (regardless of size). The recommended observations and measurements will be made by Service personnel (their volunteers or contractors) for Service projects or by consulting biologists or regulatory personnel for mitigation projects. It is not intended by these guidelines to require Service personnel to do all tasks for all projects, yet the Service should include in its permit review comment's a statement recommending that permittees be required to do appropriate monitoring of mitigation projects to insure that the interests of fish and wildlife resources are reasonably accommodated by such projects.
Documentation of monitoring results should be summarized on Form M 1. Completion of other forms are used to rec,ord specific observations, measurements, and calculations.
Note: Years designated in the guidelines refer to years after the first complete grOlving season, for example, Year 1 is the end of the first full growing season.
Reference \Vetlands Identification/Analysis
Identify 2 to 3 reference wetlands suitable for comparison \'lith the subject wetland. At a minimum, these wetlands should have the following characteristics in order to be comparable to the restored or created wetland:
1) be the same wetland type (including potential vegetation, soil [for restoration sites], and hydrology),
2) have the same landform (e.g., basin, flat, floodplain, or slope),
3) be in the same landscape position (along a lake, river/stream, or estuary, or isolated), and
4) be located in the same watershed or an adjoining watershed of similar terrain and soils.
Every effort should be made to collect vegetation and soils data and begin monitoring the hydrology prior to initiating wetland restoration, creation, or enhancement, as this information will aid in project design.
Vegetation
For all sites:
1. Cursory survey of vegetation (complete Form V I); if plantings are used incl ude an assessment of their survival (do likewise for seeded sites; Form V4) -- Year 1 (end of first growing season).
I .
2. Analysis of permanent plots (30'-radius circular plots) -- Years 2,3, and 5 for all wetlands plus Years 7 and 10 for forested wetlands and broad-leaved evergreen scrub-shrub wetlands (shrub bogs). Sampling should be done from mid-July to mid-August. Tabulate data on Forms V2 and V3, plus Fom1 V4 for planted or seeded sites. Then complete vegetation analysis for Form Ml.
i 3. Take photographs of site during vegetation evaluations from mid- to late-summer -- eud of project construction and Years I, 2, 3, and 5 for all wetlands plus Years 7 and 10 for forested wetlands and bogs. Aerial photos should be taken for~larger projects, if possible. Multiple sites can be photographed during a single mid-summer flight.
4. Prepare a sketch of plant communities in the project wetland -- Years 2, 3, and 5 for all wetlands plus Years 7 and 10 for forested wetlands and shrub bogs.
5. Look for and record the appearance of undesirable species (especially common reed and purple loosestrife) -- Years 1,2,3, and 5 for all wetlands. Record findings on Form MI. Be sure to eradicate or attempt to control these species as early as possible.
For planted or seeded sites:
Annually inspect specimens to insure survival and grO\vth -- Years 1,2,3, and 5. Complete Form V4 and record data on Form MI.
Soil
For all sites:
Examine area to insure that soils are stabilized and not eroding. Do this annually until soils are stabilized. If significant erosion is detected, plantings should be made to stabilize soil or other suitable actions taken to eliminate this condition (e.g., installation ofbiomats). Complete soil analysis section on Form MI.
If a seasonally flooded/saturated or wetter wetland is the target type:
Measure the buildup of organic matter--during the spring following Years 1, 2, 3, and 5 for all wetlands plus Years 7 and 10 for forested wetlands and shrub bogs. Record findings on Form Ml. .
Hydrology
For Mitigation Projects:
Record surface water depths and groundwater levels at both reference wetlands and project wetland on a bimonthly basis from October to February, weekly from March to May, and
39
I',

monthly from June through September -- Years 1,2, 3, and 5 for all wetlands (except semipermanentl y flooded types) and also in Years 7 and 10 for forested wetlands and shrub bogs. For semipermanently flooded wetlands, monthly monitoring should be sufficient at the frequency listed above. The number of wells will be determined by site size and complexity, but should be sufficient to track water table fluctuations in center of wetland, along the wetland edge, and in between (at least 6 wells per site). Tabulate data on Forms HI and H2. Record annual findings on Form Ml. (Note: If mid-course correction is necessary, start monitoring schedule over from date that the additional work is completed.)
For Proactive Restoration Projects:
1. For marsh restoration projects, record surface water depths and groundwater levels for restored wetlands at four times: March, May, July, and September (use Forms HI and H2). This should be done in Years 1,2, and 5, unless problems are encountered which would dictate additional monitoring in the intervening years.
2. For other projects, the minimum sampling is every two weeks from March through May for most of the Northeast. In northern New England and the Adirondacks, minimum biweekly monitoring should be performed from April into June. This should be done in Years 1,2, and 5, unless problems are encountered which would dictate additional monitoring in the intervening years.
For all sites:
Submit annual findings along with vegetation analysis results by completing the hydrology analysis section on Form Ml -- Years 1,2, and 5.
Salinity
For salt marsh restoration projects only:
Measure tidal creek and interstitial soil salinity at project site and reference wetland at high tide during three seasons: spring, summer, and fall. Such measurements should be made at high tide during both a spring tide and a normal tide. Salinity measurements should be done in Years 1, 2, ' and 5.
Wildlife
For both mitigation and proactive wetland restoration projects, identify wildlife use as a specified objective and develop standards for e".aluating species composition, population size, and use.
Make observations during optimum times for evaluating wildlife use, such as bird breeding surveys, herptile counts (in vernal pools during breeding), migratory bird use in spring and fall, overwintering bird habitat, winter deer yards, spring invertebrate counts, and estuarine fish use
40
I',

(high tide) -- Years I, 2, and 5 for all wetlands, plus Years 7 and 10 for forested wetlands, shrub wetlands, .and drier-end wetlands.
41
I .

Appendix B. Annual Monitoring Report Form (Form MI) .
•
42
I ' ,
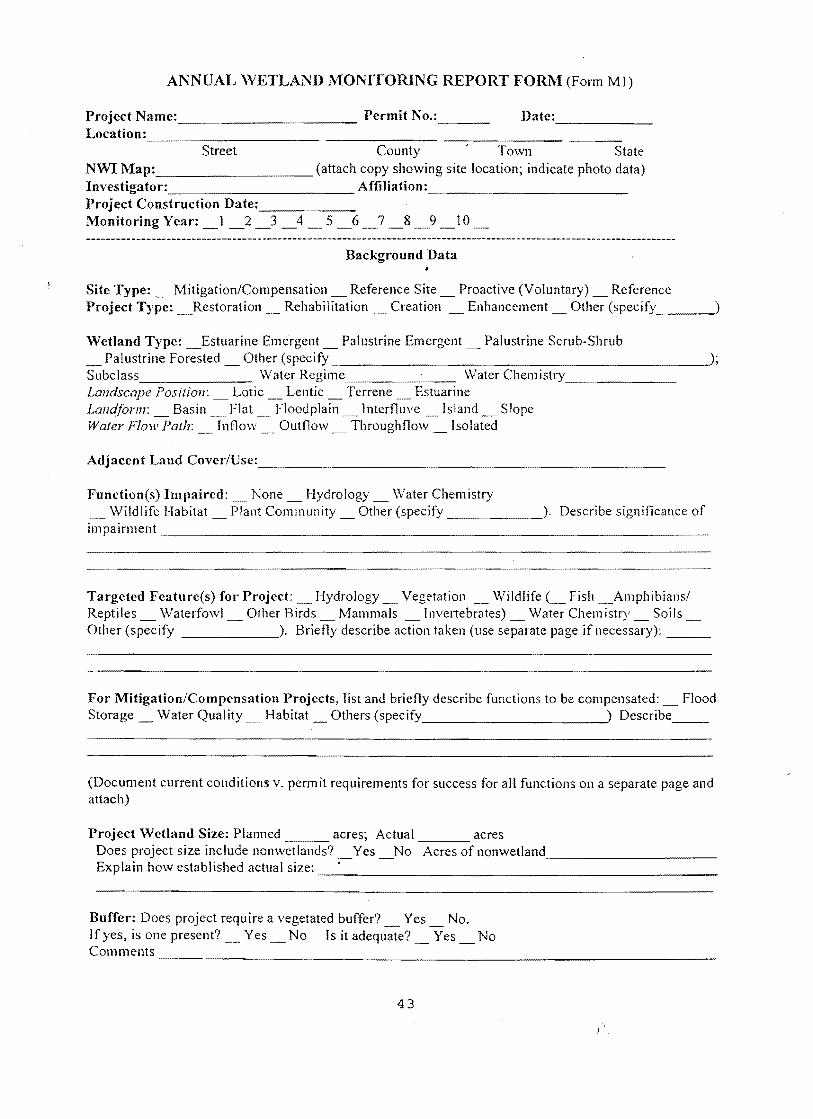
ANNUAL \VETLAND MONITORING REPORT FORM (Form Ml)
Project Name: ___________ Permit No.: __ _ Date: --------Location: ------------
Street County Town State NWI Map: _______________ (attach copy showing site location; indicate photo data) Investigator: Affiliation: ____________ _ Project Construction Date: _____ _ Monitoring Year: _1 4 5 6 8 10
Background Data
Site Type: Mitigation/Compensation _ Reference Site Proactive (Voluntary) Reference Project Type: _Restoration Rehabilitation Creation _ Enhancement __ Other (specify )
Wetland Type: _Estuarine Emergent _ Palustrine Emergent _ Palustrine Scrub-Shrub Palustrine Forested Other (specify ________________________ -'
Subclass Water Water Chem Landscape Position: _ Lotic _ Lentic __ Terrene Estuarine Landform: _ Basin __ Flat _ Floodplain _ Interfluve Island Slope Waler Flow Path: Inflow Outflow _ Throughflow __ Isolated
Adjacent Land Cover/Use: _______________________________ _
Function(s) Impaired: None Hydrology Water Chemistry _ Wildlife Habitat _ Plant Community _ Other (specify _______ / Describe significance of impairment ________________________________________ _
Targeted Feature(s) fOl' Project: Hydrology Vegetation Wildlife L Fish _Amphibians/ Reptiles __ Waterfowl_ Other Birds Mammals Invertebrates) Water Chemistry _ Soils Other (specify Briefly describe action taken (use separate page if necessary): __ _
For Mitigation/Compensation Projects, list and briefly describe functions to be compensated: Flood Storage __ Water Quality _ Habitat _ Others (specify ) Describe __
(Document current conditions v. permit requirements for sllccess for all functions on a separate page and attach)
Project \Vetland Size: Planned acres; Actual acres Does project size include nonwetlands? _Yes _No Acres ofnonwetland ____________ _ Explain how established actual size: ------------------------------
Buffer: Does project require a vegetated buffer? __ Yes _ No. If yes, is one present? Yes No Is it adequate? __ Yes _No Comments ---------------------------------------------------------------------
43
I'.

Monitoring Results
Vegetation Analysis
1. On a separate sheet, prepare a species list for the site and designate relative abundance of each as follows: very abundant (::::75% cover), abundant (40-74% cover), common (20-39% cover), less common (10-19% cover), occasional (2-9% cover), and scarce «2% cover).
2. Type of vegetation analysis: Plot __ Point Intercept __ Other (specify: __________ --'
3. No. of plots: __ No. of transects: __ No. of sample points/transects: __ _
4. A. For plot analysis, indicate dominant species/stratum (as appropriate) for the plant community: Herbs _______________________________ _ Shrubs _______________________________ _ Saplings ________________________________ _ Trees ___________________________________ _
Woody Vines ________________________________ _ (attach data sheets for each plot)
B. For point intercept, indicate mean prevalence index (MP) for the community and record species with high frequencies of occurrence: MPl; species w/high frequencies: ______ _
(attach data sheets for each transect and calculations)
5. Are any undesirable plant species present? Yes No If yes, indicate species: Purple Loosestrife __ Common Reed Reed Canary Grass Others
Indicate plans to control them: ______________________________ _
6. Estimated percent of bare ground at project site:
7. Attach photos of vegetation at project site from permanent photo stations sufficient to show overall plant cover; indicate location of photo locations on copy of the project map (attach).
8. If a planted or seeded site, complete Form V4 and attach.
9. Other vegetation observations (flowering/fruiting success, plant vigor, herbivory problems, etc.):
10. Note any changes in adjacent land use:-______________________ _
1 J. Summarize any changes in vegetation from last report on a separate sheet and include a sketch of plant communities as they currently exist.
44
I ,

Soils Analysis
I. Are soils stabilized at project site? __ Yes ~ No If not, what measures are needed to correct the probJem? ____________________________________________________________________ _
When will such measures be employed? ________________________________________ _
2. For projects that involve restoration or creation of seasonally flooded and \vetter wetlands, is there a noticeable accumulation of organic matter on the surface? Yes No Don't know. If yes, indicate amount of buildup since last assessment: _mm Ifno, what might be done to improve the situation? _____________________________ _
3. For created sites, indicate soil texture, matrix c010r, and mottling (% mottles and color) for the A-horizon and B-110rizon (subsoil); also indicate thickness of the former. --A-horizon:
----------------------~---~-~-------~-----------------------
B-horizon: ---------------------------------------------------------------------
4. For created sites, is the soil developing hydric soil properties? __ Yes __ No __ Can't determine. If yes, indicate at what depth and type of properties: ________________________________________ _
5. Sulfidic materials present? __ Yes __ No If yes, indicate depth: __
Hydrology Analysis
I. What type of monitoring has been done this year? _______________________________ _
(attach data sheets -- Forms H] and H2)
2. Has the hydrology of the project site attained the target hydrology (i.e., mimicking that of the reference wetland or the typical hydrology for wetland type)? __ Yes No
Briefly explain and attach hydrographs for comparison:
3. Is there need to make adjustments to project to insure proper hydrology? Yes No
Explain: ______ -------------------------------------------------------------
45

Water Chemistry Analysis (for salt marsh restorations)
1. What is the soil-water salinity in the project wetland v. the seaward marsh? ___ parts/thousand v. ppt for reference
2. Has the project successfully attained its salinity objective? Yes No Ifno, discuss hov'; situation canbel1nl~rA\1P~. ________________________________________________________________ __
Wildlife Analysis
I. Type of habitat targeted: Fish spawning __ Fish nur",ery Fish general __ Amphibian breeding __ Amphibian general Reptile general_ Bird breeding Bird overwintering __ Bird general __ Mammal breeding Mammal overwintering _ Mammal general __ Invertebrate general
2. List target species for each of the above and indicate project wetland use in parentheses:
Invertebrates ------------------------Fish -----------------------------------------------------------------Amphibians ____ _ Repti les ________________________________________________________ __ Waterfmvl -------------------------------------------------------------
Other Birds _________________________________________________ _
Mammals -----------------------------------------------------------
3. Record aninlal observations and their lise of project
4. Is project wetland meeting wildlife objectives? Yes No.
Overall Assessment
1. Is project successful so far? Yes No. Explain: ____________________________ __
2. Is there a need for any mid-course correction? Yes No Explain __________________ __
46

Appendix C. Hydrology Data Collection Forms (Forms H I and H2).
47
,'.
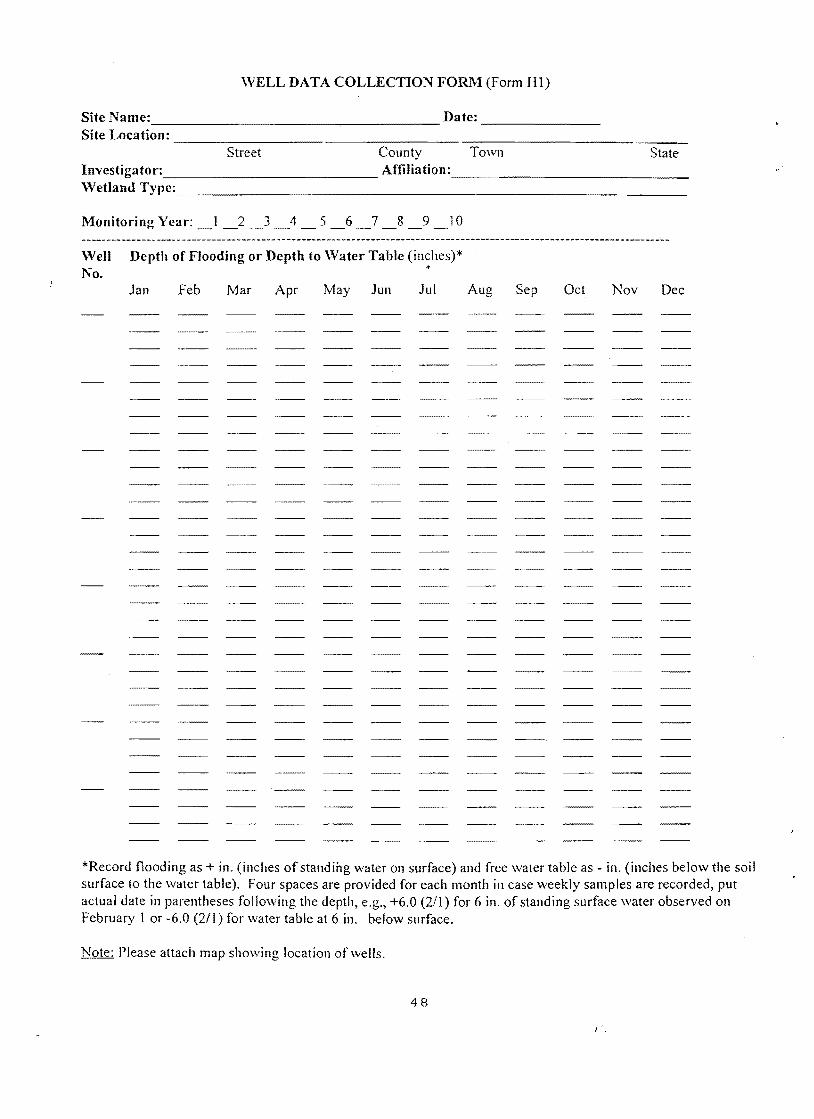
WELL DATA COLLECTION FORM (Form HI)
Site . _____________ -----Date: _______ _ Site Location: --------------
Street County Town State Investigator: ______________ Affiliation: ____________ ~--Wetland
Monitoring Yea.-: 2 4 5 7 8 ]0
-------~----------------------------------------------------------~------------------------------------------------~--Well No.
Depth of Flooding or Depth to Water Table (inches)* .. Jan Feb Mar Apr May Jun Jul Aug Sep Oct Nov Dec
*Record flooding as + in. (inches of standing water on surface) and free water table as - in. (inches below the soil surface to the water table). Four spaces are provided for each month in case weekly samples are recorded, put actual date in parentheses following the depth, e.g., +6.0 (2/1) for 6 in. of standing surface water observed on February I or -6.0 (2/1) for water table at 6 in. below surface.
Note: Please attach map showing location of wells.
48
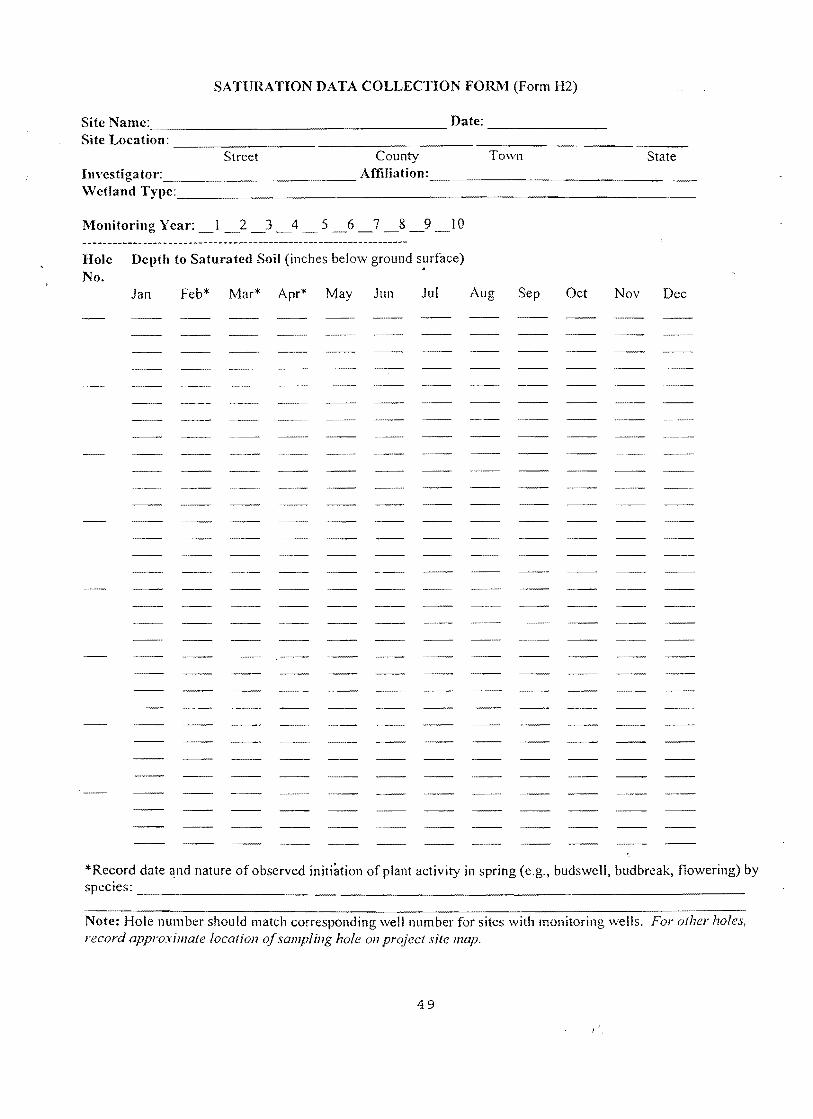
SATURATION DATA COLLECTION FORM (Form H2)
Site Date: Site Location:
Street County Town State Investigator: Affiliation: Wetland
Monitoring Year: 2 3 4 5 6 7 8 9 0 -- -- -- -- - --
Hole Depth to Saturated Soil (inches below ground s~rface) No.
Jan Feb* Mar* Apr* May Jun Jul Aug Sep Oct Nov Dec
*Record date ~nd nature of observed initiation of plant activity in spring (e.g., budswell, budbreak, flowering) by species: _______________________________________________________________________ __
Note: Hole number shou Id match corresponding well number for sites with monitoring wells. For other record approximate location of sampling hole 011 project site map.
49

Appendix D. Year I Vegetation Observation Data Form (Form VI).
50

YEAR 1 VEGETATION OBSERVATION DATA FORM (Form VI)
Site Date: -------------------------------------- ----------------Site Location: --------------------
Street County Town Investigator: ________________________ Affiliation: ___________________ _
Vegetation Observations*
,1. What is the. percent cover of vegetation to bare ground and open water at the site? __ % Vegetated % Bare Ground Water
2. List all species observed in project wetland and indicate common species (with.2: 20% areal cover):
3. How many different plant communities are present? Briefly describe each.
4. Was project wetland seeded or planted?_ Yes No If yes, complete Form V4 and attach.
5. Additional comments --------------------------------------------------------
*Note: Be sure to auach photographs of sites/1owing vegetation patterns.
I ..

Appendix E. Species-Area Curve Data Forms. (Source: "Federal Manual for Identifying and Delineating Jurisdictional Wetlands," Federal Interagency Committee for Wetland Delineation 1989)
52

DATA FORM COMPREHENSIVE ONSfTE DETERMINATION METHOD
QUADRAT SAMPLING PROCEDURE 1
(Herbs and Bryophyles)
Field Investigator(s): Date: --~------ProjecVSite: __ .. _ .. ___ ... __ .. ___ .~. _____ State:---- County: ApplicanVOwner: ____ . Transect # __ Plot # __ Vegetation Unit #/Name: Note: If a more detailed site description is necessary. use the back of data form or a field notebook. --------- ---------
Species
1. 2. 3. 4. 5. 6. 7. 8. 9.
10. 11. 12. 13. 14. 15. 16.
Indicator Status
. Quadrat Percent Areal Cover
Q1 Q2 Q3 Q4 Q5 Q6 Q7 Q8 X
Total Cover 2 Dominance Threshold Number Equals 50% x Total Cover_2
Total of Averages (X's) 3
Dominance Threshold Number Equals 50% x Total of Averages (X's) __
Ranlf
1 This data form can be used for both the Plant Community Transect Sampling Approach and the Fixed Interval Transect Sampling Approach.
2 These entries are only applicable to the Fixed Interval Transect Sampling Approach which uses only one quadrat per sampling point along a transect. -
3 These entries are only appliCable to the Plant Community Transect Sampling Approach which uses multiple quadrats per sampling point along a transect. .
4 To determine the dominants. first rank the species by their cover (or mean cover). Then cumulatively sum the cover (mean cover) of the ranked species until 50% of the total for all species cover (mean cover) is immediately exceeded. All species contributing to that cumulative total (the dominance threshold number) plus additional species having 20% of the total cover (mean cover) value should be considered dominants and marked with an asterisk.
53
I ' .

tf) (!)
'0 8..
(J)
'0 '-
~ E :::>
Z
SPECIES-AREA CURVE 1
20
19
18
17
16
15
14
13
12
11
10
9
8
7
6
5
4
3
2
1 2 3 4 5 6 7 8 9 10 11 12 13 14 15 16 17
Number of Quadrats 2
1 Plot the cumulative number of species against the quadrats (e.g .• if quadrat #1 has 3 species and quadrat #2 has any. all. or none of those species but has 2 new species. then 5 cumulative species should be plotted against quadrat #2). The number of quadrats sufficient to adequately survey the understory will corresdpond to the point on the curve where it first levels off and remains essentially level.
2 Specify size of sample quadrat:
S4
I',

Appendix F. Plot Sampling Data Form (Form V2).
I'.

PLOT SAI\:1PLING DATA FORM (Form V2)
Site Date: ----------------------------- ~---------------Site Location: --------------
Street County Town State Investi!!ator: Affiliation:
= -------------------------- ---------------------
4 5 6 9 10
----------------------------~-------------------------------------------~-------~-----------------------------------------------
Plot Sampling Results
Herbs
List all herbs and their mean % areal cover ------------------------------------------
(attach species-area curve data forms)
List dominant herbs
Shrubs
List all shrubs, their % cover, number of stems, and average height
List dominant shrubs --------------------------------------------------
Saplings
Record all individual saplings, their dbh, and height ________________________________ _
Record total basal area and number of stems for saplings by species ___________________ _
List dom inant sapl ings ___________________________________________ _
56
J ' ,

Trees
Record all individual trees, their dbh, and height ____________________ _
Record total basal area and number of stems, and average height for trees by species
List dom inant trees _______________________________ _
\Voody Vines
List all woody vines and their number per plot _____________________ _
List dominant woody vines _____________________________ _
Other Observations
Plants with flowers or fruits ------------------------------
Plants showing signs of stress (explain) ________________________ _
Additional comments (e.g., problems with grazing/browsing or surprising responses)
57

Appendix G. Point Intercept Sampling Form (Form V3).
58
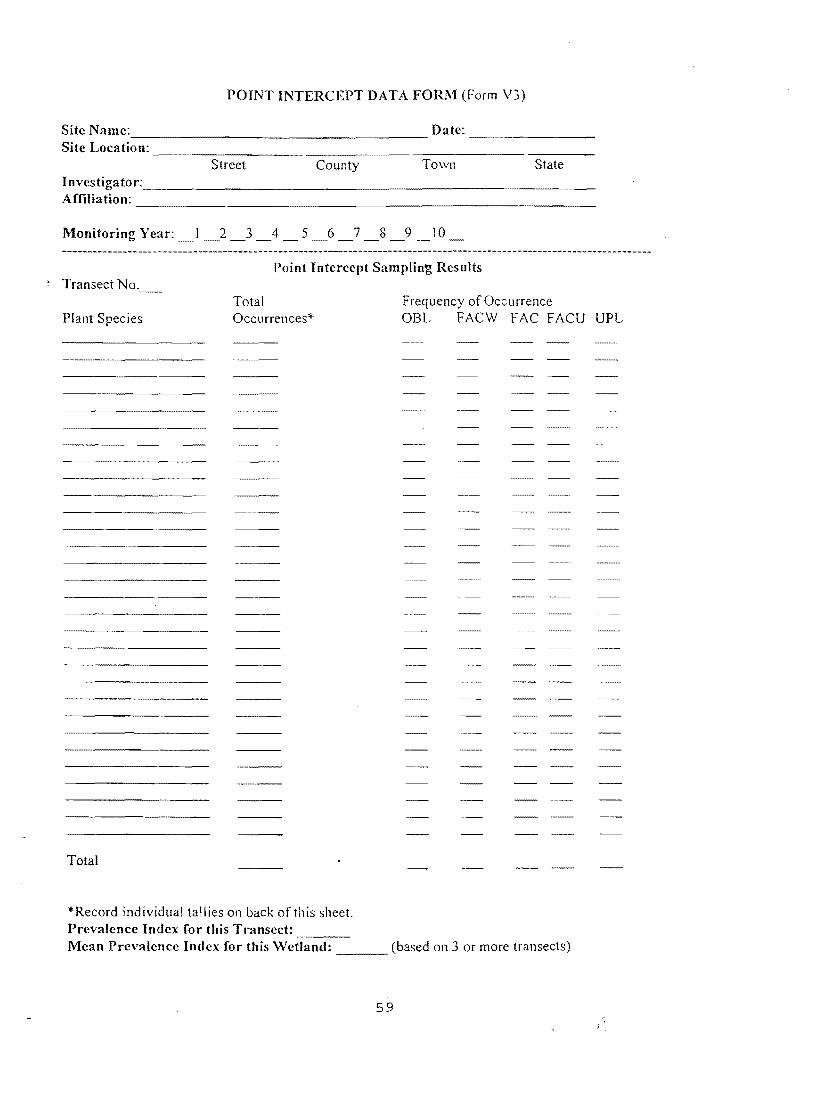
POINT INTERCEPT DATA FORM (Form V3)
Site Name: _____________________ Date:
Site Location: ---------------Street County Tawil State
Affiliation: ---------------------------------------------Monitoring Year: 3 4 5 6 8 9 10
Point Intercept Sampling Results > Transect
Plant Species
Total
Total Occurrences*
*Record individual tallies on back of this sheet. Prevalence Index for this Tl-ansect: ---
Frequency of Occurrence OBL F ACW F AC F ACU UPL
Mean Prevalence Index for this Wetland: (based on 3 or more transects) ----
59

Appendix H. Planted or Seeded Site Data Form (Form V4).
GO
I .

PLANTED OR SEEDED SITE DATA FORM (Form V4)
Site __________________ Date: _______ _ Site Location: -----------
Street County Town State Investigator: ____________________________ _ Affiliation: ____________________________ _
Monitoring Year: 2 5 8 9 o
Observations
1. What type of site is this? _ Planted _ Seeded (Note: Ifwoody plants are seeded, their growth should be measured as if they were planted.)
2. List species that were planted and/or seeded ____________________ _
3. For seeding projects, is seeding successful? Yes No. Briefly explain
4. What is the percent cover of each seeded species? (List species and % cover) ________ _
5. For planted sites, what is the estimated survival of each species? (List species and % survival)
6. Is there any evidence of reproductive success (e.g., flowers or fruits present)? Yes No. If yes, identify species and observed features. ------------------------
Gl

7. Is there any evidence of growth in woody plants (e.g., changes in dbh and height from last observation*)? Yes No. If yes, explain. _____________________ _
*This information is derived from plot sampling results.
8. List species present that were not seeded or planted and estimate their percent cover. ____ _
9. Is project successful to date? _ Yes _ No (Compare with last report). Briefly explain. ____ _
10. If the project is not successful, what mid-course correction is needed to achieve success?
62
I',

Appendix I. Vegetation Sampling Protocols for Plot Sampling and Point Intercept Sampling. All steps of methods are presented for convenience, but focus should be on the steps for vegetation sampling and calculating dominants or prevalence index. (Note: Plot sampling is called "Quadrat Sampling Procedure" in this manuaL) (Source: "Federal Manual for Identifying and Delineating Jurisdictional Wetlands," Federal Interagency Committee for Wetland Delineation 1989)
Ed
I' ..

Quadrat Sampling Procedure
4.18. Prior to implementing this determination procedure. read the sections of this manual that discuss disturbed area and problem area wetland determination procedures (pp. 50-59); this information is often relevant to project areas requiring a comprehensive determination.
. .Step 1. Locate the limits of the project area In the field. Previously, the project boundary should have been determined on aerial photos or maps. Now appropriate ground reference points need to be located to ensure that sampling wUl be conducted in the proper area. Proceed to Step 2.
Step 2. Stratify (he project area inco differellt pIa!!! cOllllllunity types. Delineate the locations of these types on aerial photos or base m::lps and label c::Ich community with an appropriate name. (CAUTION: In highly variable terrain, such as ridge and swale complexes. be sure to srratify properly to ensure best reSUlts.) In evaluating the subject area, were any significantly disrurbed areas observed? If YES, identify their limits for they should be evaluated separately for wetland determination purposes (usually after evaluating undisturbed areas). Refer to the section on disturbed areas (p: 50) to evaluate the altere'd characteristic(s) (i.e., vegetation, soils, and/or hydrology); then return to this method to continue evaluating the characteristics not altered. Keep in mind that if at any time during this determination, it is found that one or more or these three characteristics have been significantly altered, the disturbed areas wetland determination procedures should be followed. If the area is nOt significantly disturbed, proceed to Step 3.
Step 3. Establish a baseline/or loearing sampling transects. Select as a baseline one project boundary or a conspicuous feature, such as a road, in the project area. The baseline ideally should be more or less parallel to the major watercourse through the area, if present, or perpendicular to the hydrologic gradient (see Figure 5). Determine the approximate baseline length and record its origin, length, and compass heading in a field notebook. When a limited number of transects are planned, a baseline may not be necessary provided there are sufficient fixed points (e.g., buildings, walls, and fences) to serve as starting points for the transects. Proceed to Step 4.
Step 4. Determine the required number and position of transects. The number of transects necessary to adequately characterize the site will vary due to the area's size and complexity of habitats. In general, it is best to divide the baseline into a number of equal segments and randomly select a point within each segment to begin a transect (see Figure 5).
Use the following as a guide to determine the appropriate number of baseline segments:
64

Baseline Number Baseline Length of Segment
(It) Segments (It)
<1.000 3 18 - 333 ~ 1.000 - 5.000 5 200 - 1.000 !5.000 - 10,000 7 700 -1.400
>10.000· variable 2.000
[f the~baseline exceeds five miles, baseline seglents should be 0.5 mile in length.
BASEllNE SEGMENT ~
I,
TRANSECT STARTING POINT
I B
I I 1 I
TRANSECT ---.....1 C 1
D
STREAM
'" BASELINE STARTING POINT
FIgure 5. General orientation of baseline and transacts in a hypothetical project area. The letters "A·, -B", ·C", and -0" represent different plant communities. Transect positions were determined using a random numbers table.
Use a random numbers table or a calculator with a random numbers generation feature to detennine the position of a transect starting point within each baseline segment. For example, when the baseline is 4,000 feet, the number of baseline segments will be five. and each baseline segment length will be 800 feet (4.000/5). Locate the first transect within the first 800 feet of the baseline. If the random numbers table yields 264 as the distance from the baseline starting point. measure 264 feet from the baseline starting point and establish the starting point of the first transect. If the second random number selected is 530, the startine point of the
65
second transect will be located at a distance of 1,330 feet (800 + 530) from the baseline staning point. Record the location of each transect in a field notebook. When a fixed point such as a stone wall is used as a starting point, be sure to record its position also. Make sure that each plant community type is included in at least one transect; if not, modify the sampling design accordingly. When the starting points for all required transects have been located, go to the beginning of the first transect and proceed to 'Step 5.
Step 5. Identify sample plots along the transect. Along each transect, sample plots may be established in two ways: (1) within each plant community encountered (the plant community transect sampling approach); or (2) at fixed intervals ([he fixed interval transect sampling approach); these plots will be used to assess vegetation, soils, and hydrology.
When employing the plan[ community transect sampling approach, two techniques for identifying sample plots may be followed: (l) walk the entire length of the transect. taking note of the number, type, and location of plant communities present (flag the locations, if necessary) and on the way back to the baseline, record the length of the transect, identify sample plots and perform sampling; or (2) identify plant communities as the transect is walked, sample the plot at that time ("sample as you go"), and record the length of the transect.
When conducting the fixed interval transect sampling approach, establish sample plots along each transect using the following as a guide:
Transect Length (feet)
d,ooo 1,000 - <10,000
:2'.10.000
Number of
Sample Plots
<10 10
>10
Interval Between
the Center of Sample Plots (feet)
100 100 -1,000 (based on length of transect)
1.000
The first sample plot should be established at a distance of 50 feet from the baseline. When obvious non wetlands occupy a long segment of the transect
I ,

from the baseline, begin the first plot in the nonwetland at approximately 300 feet from the point \,,fhere the non wetland begins to intergrade into a potential wetland community type. Keep in mind that additional plots will be required to determine the wetland-nonwetland boundary between fixed points. In large areas having a mosaic of plant communities, one transect may contain several wetland boundaries.
If obstacles such as a body of water or impenetrable thicket prevent access through the length of the :rarlsect, access from the opposite side of the proJect area may be necessary to complete the transect; take appropriate compass reading and location data. At each sample plot (i.e., plant community or fixed interval area), proceed to Step 6.
Step 6. Determine whether normal environmental conditions are presefll. Determine whether normal environmental conditions are present by considering the following:
1) Is the area presently lacking hydrophytic vegetation or hydrologic indicators due to annual, seasonal or long-term fluctuations in precipitation, surface water, or ground-water levels?
. 2) Are hydrophytic vegetation indicators lacking due to seasonal fluctuations in temperature (e.g., seasonality of plant growth)?
If the answer to either of these questions is YES or uncertain, proceed to the section on problem area wetland detenninations (p. 55). If the answer to both questions is NO, normal conditions are ass~med to be present Proceed to Step 7 when followmg the plant community transect approach. If following the fixed interval approach, go to the appropriate IIxed point along the transect and proceed to Step 8.
Step 7. Locate a sample plot in the plant community type encountered. Choose a representative location along the transect in this plant community. Select an area that is no closer than 50 feet from the baseline or from any perceptible change in the plant community type. Mark the center of the sample plot on the base map or photo and flag the point in the field. Additional sample plots should be established within the plant community at 300-foot intervals along the transect or sooner if a different plant community is encountered. (Nole: In large-sized plant communities, a sampling interval
larger than 300 feet may be appropriate, btl! try to use 300-fool intervals first.) Proceed to Step 8.
Step 8. Layout the boundary of the sample plol. A circular sample plot with a 30-foot radius should be established. (Note The size and shape of the plot may be changed to match local conditions.) At the flagged center of the plot. use a compass to divide the circular plot into four equal sampling units at 90°, 180°,270°, and 360°. Mark the outer points of the plot with flagging. Proceed to Step 9. .
Step 9. Characterize the vegetation and determine dominant species within the sample plot. Sample the vegetation in each layer or stratum (i.e., tree, sapling, shrub, herb, woody vine, and bryophyte) within the plot using the following procedures for each vegetative stratum and enter data on appropriate data sheet (see Appendix B for examples of data sheet):
1) Herb stran.cm
66
A) Sample this stratum using corresponding approach:
(1) Plant community transect sampling approach:
(a) Select one of the following designs:
(i) Eight (8) - 8" x 20" sample quadrats (two for each sampling unit within the circular plot); or
(ii) Four (4) - 20" x 20" sample quadrats (one for each sample unit within the plot); or
(iii) Four (4) - 40" x 40" sample quadrats (one for each sample unit).
(Note: Alternate shapes of sample quadrats are acceptable provided they are similar in area to those listed above.)
(b) Randomly toss the quadrat frame into the understory of the appropriate sample unit of the plot.
(c) Record percent areal cover of each plant species.
I ,

, .
(d) Repeal (b) and (c) as requir~d by the sampling scheme.
(e) Construct a species area curve (see example. Appendix C) for the plot to determine whether the number of quadrats sampled sufficiently represent the vegetation in the slTatum; the number of samples necessary corresponds to the point at which the curve levels off horizontally; if necessary, sample additional quadrats within the plot until the curve levels off. ,
(f) For each plant species sampled. determine the average percent areal cover by summing the percent areal cover for all sample quadrats within the plot and dividing by the total number of quadrats (see example. Appendix C). Proceed to substep B below.
(2) Fixed interval sampling approach:
(a) Place one (1) 40" x 40" sample quadrat centered on the transect point.
(b) Determine percent areal coverage for each species. Proceed to su bstep B below.
B) Rank plant species by their average percent a.:eal cover, beginning with the most abundant speCies.
C) Sum the percent cover (fixed interval sampling approach) or average percent cover (plant community transect sampling approach).
D) Determine the dominance threshold numberthe number at which 50 percent of the total dominance measure (i.e., total cover) for the stratum is represented by one or more plant species when ranked in descending order of abundance (Le., from most to least abundant).
E) Sum .th~ cov~r values for the ranked plant specIes begmmng WIth the most abundant until the dominance threshold number is immediately exceeded; these species contributing to surpassing the threshold number are considered dominants, plus any additional species representing 20 percent or more of the total cover of the stratum; denote dominant species with an asterisk on the appropriate data form.
F) Designate the indicator status of each dominant.
2) Bryophyte strQCwn (mosses. horned liver.vorts. and true liverworts): Bryophytes may be sampled as a separate stratum in certaih wetlands, such as shrub bogs, moss-lichen wetlands,' and the wetter wooded swamps, where they are abundant and represent an important component of the plant community. If treated as a separate stratum, follow the same prQcedures as listed for herb SlTatum. In many wetlands, however, bryophytes are not abundant and should be included as part of the herb SlTatum.
3) Shrub stratum (woody plants usually between 3 and 20 feet tall, including multi-stemmed, bushy shrubs and smalllTees below 20 feet):
A) Determine the percent areal cover of shrub species within the entire plot by walking through the plot, listing all shrub species and estimating the percent areal cover of each species.
B) Indicate the appropriate cover class (T and 1 through 7) and its corresponding midpoints (shown in parentheses) for each species: T = <1 % cover (None); 1 = 1-5% (3.0); 2 = 6-15% (10.5); 3 = 16-25% (20.5); 4 = 26-50% (38.0); 5 = 51-75% (63.0); 6 = 76-95% (85.5); 7 = 96-100% (98.0).
67
C) Rank shrub species according to their midpoints, from highest to lowest midpoint;
D) Sum the midpoint values of ~ll shrub species.
E) Determine the dominance threshold number -the number at which 50 percent of the total dominance measure (i.e .• cover class midpoints) for the' stratum is represented by one or more plant species when ranked in descending order of abundance (Le., from most to least abundant).
F) Sum the midpoint values for the ranked shrub species, beginning with the most abundant, until the dominance threshold number is immediately exceeded; these species are considered dominants, plus any additional species representing 20 percent or more of the total midpqint values of the stratum; identify dominant species (e.g., with an asterisk) on the appropriate data form.

G) Designate the indicator status of each dominant.
4) Sapling stratum (young Or small trees greater than or equal to 20 feet tall and with a diameter at breast height less than 5 inches): Follow the same procedures as listed for the shrub stratum or the tree stratum (i.e., plot sampling technique), whichever is preferred.
5) Woody vine stratum (climbing or twining woody plants): Follow the same procedures as listed for the shrub stratum.
6) Tree stratum (woody plants greater than or equal to 20 feet tall and with a diameter at breast height equal to or greater than 5 inches). Two alternative approaches are offered for characterizing the tree stratum:
A) Plot sampling technique
This technique involves establishing a sample unit within the 30-foot radius sample plot and determining the basal area of the trees by individual and by species. Basal area for individual trees can be measured directly by using a basal area tape or indirectly by measuring diameter at breast height (dbh) with a diameter tape and converting diameter to basal area using the formula A = n;d2/4 (where A
= basal area, 1t = 3.1416, and d = dbh). This technique may be preferred to the plotless technique if only one person is periorming a comprehensive determination.
The plot teChnique involves the following steps:
(1) Locate and mark,if necessary, a sample unit (plot) with a radius of 30 feet, or change the shap"e of the plot to match topography. (Note: A larger sampling unit may be required when trees are large and widely spaced.)
(2) Identify each tree, within the plot, measure its basal area (using a basal area tape) or measure its dbh (using a diameter tape) and compute its basal area, then record data on the data form.
(3) Calculate the total basal area for each tree species by summing the basal area values of all individual trees of each species.
(4) Rank species according to their total basal area, in descending order from largest basal area to lowest
(5) Calculate the total basal area value of all trees in the plot by summing the total basal area for all species.
(6) Determine the dominant trees species; dominant species are those species (when ranked in descending order and cumulatively totaled) that immediately exceed 50 percent of the total basal area value for the plot, plus any additional species comprising 20 percent or more of the total basal area of the plot; record the dominant species on the appropriate data form.
(7) Designate the indicator status of each dominant (i.e., OBL, FACW, FAC, FACU, or UPL).
B) Plotless Sampling Technique
This technique involves determining basal area by using a basal area factor (BAF) prism (e.g., BAF 10 for the East) or an angle gauge to identify individual trees to measure diameter at breast height (dbh) or basal area. This approach is plotless in that trees within and beyond the 30-foot radius plot are recorded depending on their dbh and distance from the sampling point.
(1) Standing near the center of the 30-foot radius plot, hold the prism or angle gauge directly over the center·of the plot at a constant distance from the eye and record all trees by species that are "sighted in," while rotating 3600 in one direction. (Note: Trees with multiple trunks below 4.5 feet should be counted as two or more trees if all trunks are "sighted in." If trunks split above 4.5 feet, count as one tree if "sighted in." Sighting level should approximate 4.5 feet above the ground. With borderline trees, every other tree of a given species should be tallied.)
(2) Measure the dbh of all "sighted in" trees. (Note: This should be done as trees are sighted.)
(3) Compute basal area for each tree. (Note: When dbh was measured, apply the formula A =
1td2/4, where A = basal area, rr = 3.1416, and d = dbh. To expedite this calculation, use a hand calculator into which the following conversion factor is
68
I .
(

;tored - 0.005454 for diameter data in inches or 178535 in feel. Basal area in square feet of an lndividual tree can be obtained by squaring the tree :1iameter and multiplying by the stored conversion factor.)
(4) Sum the basal areas for individual trees by species, then rank tree species by their total basal area values.
, (5) Determine the dominance threshold number by summing the basal areas of all tree species (total basal area for the "plot") and multiplying by 50 percent .
(6) Sum the basal area values for the ranked tree species, beginning with the largest value, until the dominance threshold number is immediately exceeded; all species contributing to surpassing the threshold number are considered dominants, plus any species representing 20 percent or more of the total basal area for the "plot." (Note: If it is felt that a representative sample of the trees has not been obtained from one tally, additional tallies can be obtained by moving perpendicular from the center of the plot to another area.) Denote dominant species with an asterisk on the appropriate data form.
(7) Designate the indicator status of each dominant (i.e., OBL, FACW, FAC, FACU, or UPL).
After determining the dominants for each stratum, proceed to Step 10.
soils) in the sample plot. Examine the soil charactcristics and compare if possible to soil descriptions in the soil survcy report. If soil colors match those described for hydric soil in the report, then record data and proceed to Step 12. If not, then check for hydric soil indicators below the A-horizon (surface layer) and within 18 inches for organic soils and poorly drained and very poorly drained mineral soils with low permeability rates «6.0 inches! hour), within 12 inches for coarse-textured poorly drained and very poorly drained mineral soils with high permeability rates Q,6.0 inches/hour) and within 6 inches for somewhat poorly drained soils. (Note: If the A-horizon extends below the designated depth, look immediately below the A-horizon for signs of hydric soil.) If hydric soil indicators are present (see pp. 13-15), list indicators present on data form and proceed to Step 12. If the soil has been plowed or otherwise altered, which may have eliminated these indicators, proceed to the section on disturbed areas (p. 50). If field indicators are not present, but available information verifies that the hydric soil criterion is met, then the soil is hydric.
Complete the soils section on an appropriate data sheet. (CAUTION: Become familiar with problematic hydric soils that do not possess good hydric field indicators, such as red parent material soils, some sandy soils, and some floodplain soils, so that these hydric soils are not misidentified as nonhydric soils; see the section on problem area wetlands, p. 55.)
.: .. ::'::::7:::,,-=.:::~' Step 12. Determine whether the.wetland Step 10. Determinewhether the hydrophyti;~~~~_Jzydrology criterion is met. Examine the sample
vegetation criterion is met. When more than 50 per- plot for indicators of wetland hydrology (see pp. cent of the dominant species in the sample plot 17-19) and review available recorded hydrologic have an indicator status of OBL, FACW, and/or information. If one or more indicators of wetland FAC; hydrophytic vegetation is present. Complete hydrology are materially present in the plot, then the vegetation section of the summary data sheet. If the wetland hydrology criterion is met. Available the veg~tation fails ~o be dominated by thesr-' es hydrologic data may also verify this criterion. of spe~:tes. the plot IS usually not a wetl__ Record observations on the appropriate data form ever, It may constitute hydrophytic~v~'- and proceed to Step 13. If no such indicators or under cert.ain cu:cumstances (see the probL vidence exist, then wetland hydrology does not 'Yet1~nd discusslOn, p. 55). If hydrophytic,_v . cur at the plot; complete the hydrology section on 110n IS present, proceed to Step 11. the data sheet
Step 11. Determine whether criterion is met. Locate the sample plot soil survey map, if possible, and map unit delineation for the plot. Using er, probe, or spade, make a soil hole inches deep (2 3 feet to best chnrilC ..
u-=-=~.vu;;u13_Make the wetland determination/or Examine the data forms for the
meets the hydrophytic vegetawetland hydrology criteria, it
Complete the summary data Step 1-1 when continuing to !;~TTI_
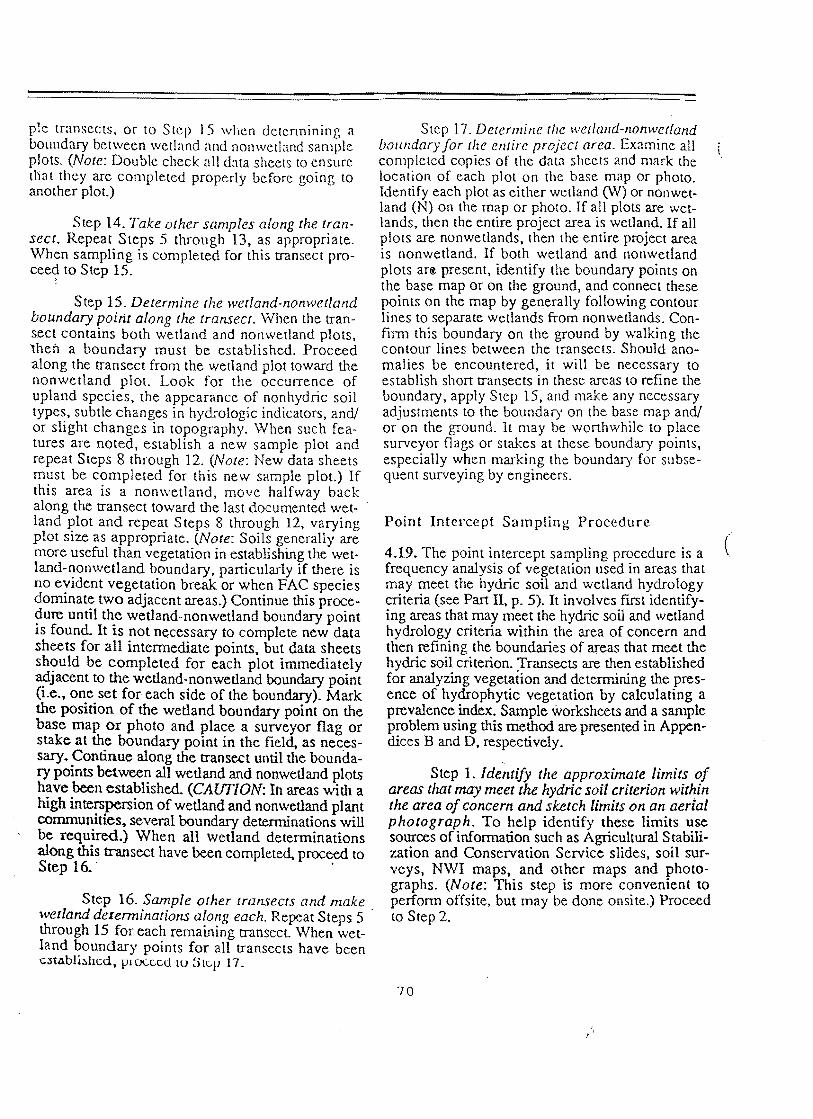
p1c transects, or to Slep 15 when dctcrmining a boundary bctween wctland and nonwctland sample plots. (Note: Double check all data sheets to ensurc tliat they are completed properly before going to another plot.)
Step 14. Take other samples along the transect. Repeat Steps 5 through 13, as appropriate. When sampling is completed for this transect procee~ to Step 15.
Step 15. Determine the wetland-non wetland boundary point along the transect. When the trans.ect contains both wetland and non wetland plots, then a boundary must be established. Proceed along the transect from the wetland plot toward the nonwclland plot. Look for the occurrence of upland species, the appearance of non hydric soil types, subtle changes in hydrologic indicators, and! or slight changes in topography. When such features are noted, establish a new sample plot and repeat Steps 8 through 12. (Note: New data sheets must be completed for this new sample plot.) If this area is a non wetland, move halfway back along the transect toward the last documented wet- . land plot and repeat Steps 8 through 12, varying plot size as appropriate. (Note: Soils generally are more useful than vegetation in establishing the wetland-nonwetland boundary, particularly if there is no evident vegetation break or when FAC species dominate two adjacent areas.) Continue this procedure until the wetland-non wetland boundary point is found. It is not necessary to complete new data sheets for all intennediate points, but data sheets sh~)Uld be completed for each plot immediately adjacent to the wetland-nonwetland boundary point (Le .• one set for· each side of the boundary). Mark the position of the wetland boundary point on the base map or photo and place a surveyor flag or stake at the boundary point in the field, as necessary. Continue along the transect until the boundary points between all wetland and nonwetland plots have been established.. (CAUTION: In areas with a high interspersion of wetland and nonwetland plant communities. several boundary detenninations will be required.) When all wetland determinations .along this transect have been completed, proceed. to Srepl& .
Step 16. Sample other transects and make wetland derenninations along each. Repeat Steps 5 through 15 for each remaining transeCL When wetland boundary points for all transects have been estAblished, proceed tu Step 17.
Step 17. Determine (he wetlalld-llonwetland bOllndary for the entire projecl area. Examine all completed copies of the data sheets and mark the location of each plot on the base map or photo. Identify each plot as either wetland C'N) or nonwetland (N) on the map or photo. If all plots are wetlands, then the entire project area is wetland. If all plots are nonwetlands, then the entire project area is nonwetland. If both wetland and non wetland plots an~ present, identify the boundary points on the base map or on the ground, and connect these points on the map by generally following contour lines to separate wetlands from non wetlands. Confirm this boundary on the ground by walking the contour lines between the transects. Should anomalies be encountered, it will be necessary to establish short transects in these areas to refine the boundary, apply Step 15, and make any necessary adjustments to the boundary on the base map and! or on the ground. It may be worthwhile to place surveyor flags or stakes at these boundary points, especially when marking the boundary for subsequent surveying by engineers.
Point Intercept Sampling Procedure
4.19. The point intercept sampling procedure is a frequency analysis of vegetation used in areas that may meet the hydric soil and wetland hydrology criteria (see Part II, p. 5). It involves first identifying areas that may meet the hydric soil and wetland hydrology criteria within the area of concern and then refining the boundaries of areas that meet the hydric soil criterion. ),ransects are then established for analyzing vegetation and determining the presence of hydrophytic vegetation by calculating a prevalence index. Sample worksheets and a sample problem using this method are presented in Appendices B andD, respectively.
,
Step 1. Identify the approximate limits of areas that may meet the hydric soil criterion within the area of concern and sketch limits on an aerial photograph. To help identify these limits use sources ofinforrnation such as Agricultural Stabilization and Conservation Service slides, soil surveys, NWI maps, and other maps and photographs. (Note: This step is more convenient to perform offsite, but may be done onsite.) Proceed to Step 2.
70
(

Step 2. Scan [he areas that may meer {he hydric soil crirerioll and determine if disturbed cot!dirions exist. Are any significantly disturbed areas present? If YES. identify their limits for they should be evaluated separately for wetland detemlination purposes (usually after evaluating undisturbed areas). Refer to the section on disturbed areas (p. 50). if necessary. to evaluate the altered characteristic(s) (vegetation, soils. or hydrology), th~n return to this method and continue evaluating characteristics not altered. (Note: Prior experience with disturbed sites may allow one to easily evaluate an altered characteristic, such as when vegetation is not present in a farmed wetland due to cultivation.) Keep in mind that if at any time during this determination one or more of these three characteristics is found to have been significantly altered, the disturbed area wetland determination procedures should be followed. If the area is not significantly disturbed. proceed to Step 3.
Step 3. Scan the areas that may meer the hydric soil criterion and determine if obviolls signs of wetland hydrology are present. The wetland hydrology criterion is met for any area or portion thereof where, it is obvious or known that the area is frequently inundated or saturated to the surface during the growing season. If the above condition exists, the hydric soil criterion is met for the subject area and the area is considered wetland. If necessary. confirm the presence of hydric soil by examining the soil for appropriate field indicators. (Note: Hydrophytic vegetation is assumed to be present under these conditions, i.e .• undrained hydric soil, so vegetation" does not need to be examined. Moreover, hydrophytic vegetation should be obvious in these situations.) Areas lacking obvious indicators of wetland hydrology must be further examined, so proceed to Step 4.
Step 4. Refine the boundary of areas that meet the hydric soil criterion. Verify the presence of h.¥dric soil within the appropriate map units by dIggmg a number of holes at least 18 inches deep along the boundary (interface) between hydric soil units and non hydric soil units. Compare soil samples with descriptions in the soil survey report to see if they are properly mapped, and rook for hydric soil characteristics or indicators. In this way, the boundary of areas meeting the hydric soil criterion is further refined by field observations. In map units where only part of the unit is hydric (e.g., complexes, associations. and inclusions),
locate hydric soil areas on the ground by considering landscape position and evaluating soil characteristics for hydric soil properties (indicators). (Note: Some hydric soils. especially organic soils. have not been given a series name and are referred to by common names, such as peat. muck, swamp, marsh, wet alluvial land, tidal marsh, sulfaquents, and sulfihemists. These areas are also considered hydric soil map units. Certain hydric soils are mapped with nonhydric soils as an association or complex, while other hydric soils occur as inclusions in nonhydric soil map units. Only the hydric soil portion of these map units should be evaluated for hydrophytic vegetation.) In areas where hydric soils are not easily located by landscape position and soil characteristics (morphology), a qualified soil scientist should be consulted. (CAUTION: Become familiar with problematic hydric soils that do not possess good hydric field indicators, such as red parent material soils. some sandy soils, and some floodplain"s soils, so that these hydric soils are not misidentified as nonhydric soils. see section on problem area wetlands, p. 55.) (Note: If the project area does not have a soil map, hydric soil areas must be determined in the field to use the point intercept sampling method. Consider landscape position, such as depressions, drainageways, floodplains and seepage slopes, and look for field indicators of hydric soil, then delineate the hydric soil areas accordingly. If the boundary of the hydric soil area cannot be readily delineated, one should use the quadrat sampling procedure on p. 40.)
After establishing the boundary of the area in question, proceed to Step 5.
Step 5. Determine whether normal environmental conditions are present. Determine whether normal environmental conditions are present by considering the following:
1) Is the area presently lacking hydrophytic vegetation or hydrologic indicators due to annual, seasonal, or long-term fluctuations in precipitation, swface water, or ground water levels?
2} Are hydrophytic vegetation indicators la<;king due to seasonal fluctuations in temperature (e.g., seasonality of plant growth)?
If the answer to either of these questions is YES or uncertain, proceed to the section on problem area wetland determinations (p. 55). If the answer to
71
I',

both questions is NO, normal conditions are assumed to be present. Proceed to Step 6.
Step 6. Determine random starting points and random directions for three 200joot line transects in each area that meets or may meet the hydric soil criterion. (Note: More than three transects may be required depending on the standard error obtained for the three transects.) There are many ways to determine random starting points and random~transect direction. The following procedures are suggested:
1) Starting point - Superimpose a grid over an aerial photo or map of the study area. Assign numbers (1, 2, 3 ... N) to each vertical and horizontal line on the grid. Starting points for a transect are selected by using a table for generating random numbers or other suitable method. The first selected digit represents a line on the horizontal axis; the second, the vertical axis. The intersection of the two lines establishes a starting point.
2) Transect direction At a'starting point, spin a pencil or similar pointed object in the air and let it fall to the ground. The direction that the pencil is pointing indicates the direction of the transect. Proceed to Step 7.
Step 7. Layout the transect in the established direction. If the transect crosses the hydric soil boundary (into the nonhydric soil area), bend the line back into the hydric soil area by randomly selecting a new direction for the transect following the procedure suggested above. Mark the approximate location of the transect on a base map or aerial photo. Proceed to Step 8.
Step 8. Record plant data (e.g., species name, indicator group, and number of occurrences) at interval points along the transect. At the starting point and at each point on 2-foot intervals along the transect. record all plants that would intersect an ima!pn~ verticalline extending through the point. If thIS line has no plants intersecting it (either above or below the sample poinO, record nothing.
Identify each plant observed to species (or mher taxonomic. category if species cannot be identified), enter speCIes name on the Prevalence Lndex Worksheet. and record all occurrences of each species ~lo.ng ~he transect. For each species listed, identify Its mdicator group from the appropriate regional list of plant species that occur in wetlands (i.e., OBL.
FACW, FAC. FACU. and UPL; see Pe 15.). Plant ' species not recorded on the lists are assumed to be ( upland species. If no regional indicator status and only one national indicator status is assigned, apply the national indicator status to the species. If no regional indiCator status is assigned and more than one national indicator status is assigned, do not use the species to calculate a prevalence index. If the plant species is on the list and no regional or nation-al indicator status is assigned, do not use the species to ca!culate the prevalence index. For a transect to be valid for a prevalence calculation, at least 80 percent of the occurrences must be plants that have been identified and placed in an indicator group. Get help in plant identification if necessary. (Note: Unidentified plants or plants without indicator status are recorded but are not used to calculate the
. prevalence index.) Proceed to Step 9.
Step 9. Calculate the total frequency of occurrencesfor each species (or other taxonomic category),for each indicator group o/plants. andfor all plant species observed, and enter on the Prevalence Index Worksheet. The frequency of occurrences of a plant species equals the number of times it occurs at the sampling points along the transect. Proceed to Step 10. (
Step 10. Calculate the prevalence index for the transect using the following fonnula:
Fo + 2Ffw + 3Ff + 4Ffu + 5Fu
PIi = Fo + Ffw + Ff + Ffu + Fu
where
PIj = Prevalence Index for transect i; Fo = Frequency of occurrence of obligate wetland
species; Ffw = Frequency of occurrence of facultative
wetland species; Ff = Frequency of occurrence of facultative
species; Ffu = Frequency of occurrence of facultative
upland species; Fu = Frequency of occurrence of upland species.
After calculating and recording the prevalence index for this transect, proceed to Step 11.
72
! .

Step 11. Repeat Steps 5 through 10 for two otlter transects. After completing the three transects, proceed to Step 12.
Step 12. Calculate a mean prevalence index/or the three transects. To be considered wetland, a hydric soil area usually must have a mean prevalence index (PIM) of less than 3.0. A minimum of three transects are required in each delineated area of hydric soil, but enough transects are required so that the standard error for PIM does not exceed 0.20 percent.
Compute the mean prevalence index for the three transects by using the following fonnula:
where
PIM = mean prevalence index for transects; PIT = sum of prevalence index values for all
transects; N = total number of transects.
After computing the mean prevalence index for the three transects, proceed to Step 13.
Step 13. Calculate the standard deviation (s)for the prevalence index using the following fonnula:
s= N-l
(Note: See fonnulas in Steps 8 and 10 for symbol definitions.)
. After perfonning this calculation, proceed to Step 14.
Step 14. Calculate the standard error (s.f) of the mean prevalence index using the following fonnula:
s SX=
N
where
s = standard deviation for the Prevalence Index N = total number of transects
(Note: The sx cannot exceed 0.20. If sx exceeds 0.20, one or more additional transects are required. . Repeat Steps 6 through 14, as necessary, for each additional transect.) When sx for all transects does not e,\ceed 0.20, proceed to Step 15.
Step 15. Record final mean prevalence index value for each hydric soil map unit and make a wetland determination. All areas having a mean prevalence index of less than 3.0 meet the hydrophytic vegetation criterion (see p. 5). One should also look for evidence or field indicators of wetland hydrology, especially if there is some question as to whether the wetland hydrology criterion is met. If such evidence or indicators are present or the area's hydrology has not been disturbed, then the area is considered a wetland. If the area has been hydrologically disturbed, one must determine whether the area is effectively drained before making a wetland detenninatio~ (see di~turbed ar:ea di~- . cussion, p. 50). If the area IS effectIvely dramed, It is considered nonwetland; if it is not, the wetland hydrology criterion is met and the area is considered a wetland.
73
Areas where the prevalence index value is greater than or equal to 3.0 (especially greater than 3.5) are usually not wetlands, but can, on occasion, be wetlands. These exceptions are disturbed or problem area wetlands (see discussion on pp. 5(}'59) and further evaluation of wetland hydrology must be undertaken. When the prevalence index falls between 3.0 and 3.5 (inclusive) in the absence of significant hydrologic modification, the area is presumed to meet the wetland hydrology criterion and is, therefore, wetland; the plant community is considered hydrophytic vegetation since the plants are growing in an undrained hydric soil. If the prevalence index of the plant community is greater than 3.5, stronger evidence of wetland hydrology is required to make a wetland detennination. Walk through the area of concern and look for field indicators of wetland hydrology. If field observations, aerial photographs or other reliable sources provide direct evidence of inundation or soil saturation within 6, 12, or 18 inches depending on soil penneability and drain.age class for o~e w~e~ or more during the growmg season, or If oXldlZed
I .

channels (rhizospheres) are present around living roolS and rhizomes of any plants, or if waterstained leaves caused by inundation are presem, then these areas are considered to meet the wetland hydrology criteria and are wetlands. If direct evidence or these field indicators are nO( present, then one must use best professional judgement to make the wetland determination. In doing so, one should review the problem area wetland discussion (p. 55), consider other hydrologic indicators that may be present (see pp. 17-19), and perhaps even consult with a wetland expert to assist in the determination.
74
I',

Appendix J. Example of Calculating the Mean Prevalence Index for a Plant Community based on the Point Intercept Method. (Source: Federal Interagency Committee for Wetland Delineation 1989)
75
, ' .
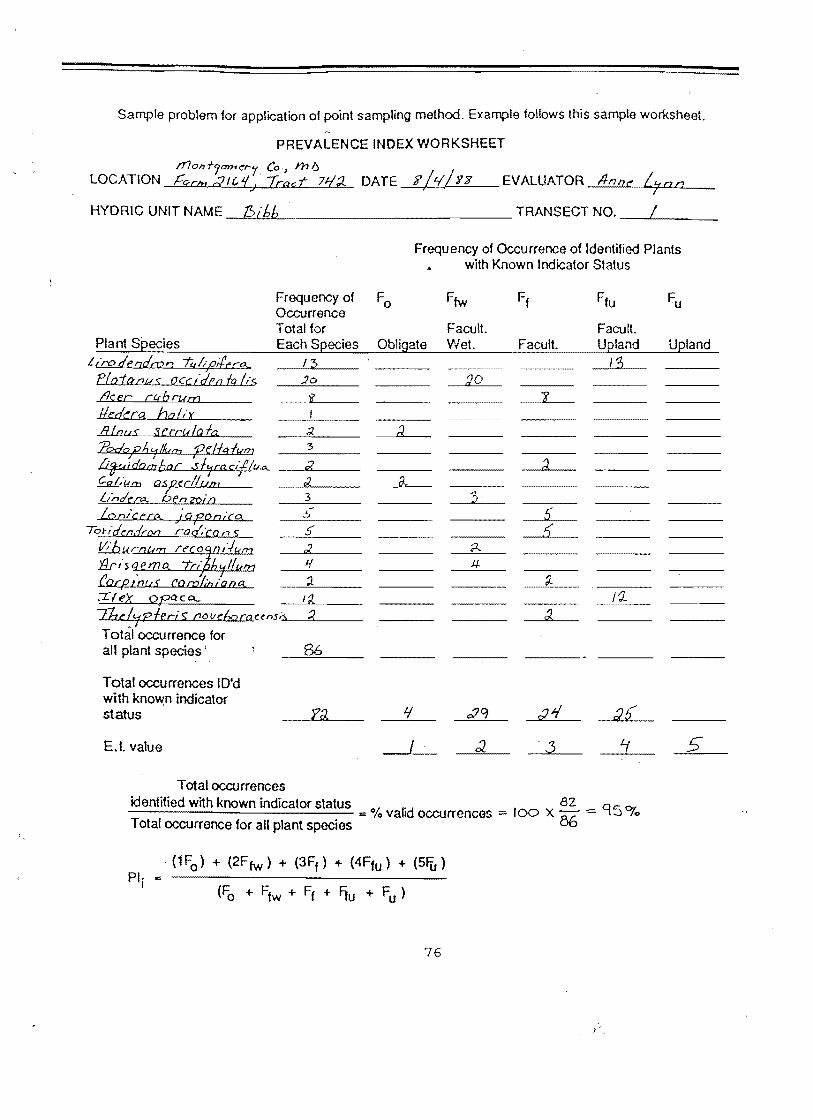
Sample problem for application of point sampling method. Example follows this sample worksheet
PREVALENCE INDEX WORKSHEET
r11onft;aYMc-t-'1 CO'I !'h6 / LOCATION ~q-C!n c21('l/. Tract 71/2. DATE ? /'1 yy
J ' EV ALUA TOR I+n Or:: iT a a
HYDRIC UNIT NAME --,=w~ _____________ TRANSECT NO. _--L-I __ _
Frequency of Occurrence of Identified Plants with Known Indicator Status
Plant Species L/roderza'mn 7q/i/:J;/ero....
PfotC;(?U( occ,-JP; {q u·s deer c4brum lIedcca. hoUr IUouf Scrrw/afa
Lonicere.. iOPonico. To{-,'dmdroa ;'od;'co/7 $"
~~,~~~~mQ c~~2Z;'£:: Cacpwl/£ caca'liaiaaa..
Frequency of Fa Occurrence Total for Each Species Obligate
:Ife'X opc!co... 12-7hdypleci'S (lov,bocaanSi..l..:> _2"'--__ Total occurrence for all plant species'
Total occurrences IO'd with knov.:n indicator status
E.I. value
Total occurrences
fil
Facult. Wet.
'dO
Facult. Facult. Upland
identified with known indicator status. .82 n 50,-----------:...-..;....;.. :::: % valid occurrences"" /00 x - ="\ -/0
Total occurrence for all plant species 56
, (1Fo> + (2Ffw) + (3Ff ) + (4Ffu) + (SFu) PI· ..
I
76
Upland

COMPUTATIONS
1. Computation of prevalence index (PI) for transect #1:
PI· •
(1 FO) + (2F fw ) + (3Ff ) + (4Ffu) + (SFu )
(Fo + Ffw + Ff + Flu + F u )
(1x4) + (2x29) + (3x24) + (4x2S) 234 =
4 + 29 + 24 + 25 82
where:
PI i Prevalence index for transect i
= 2.85
F 0 Frequence of occurrence of obligate wetland species
F fw Frequency of occurrence of facultative wetland species
F f Frequency of occurrence of facultative species
Ffu Frequency of occurrence of facultative upland species
F u = Frequency of occurrence of upla!)d species
2. Computation of mean prevalence inqex (PIM) for three transects:
where:
PIM ::: Mean prevalence index for transects PIT ::: Sum of prevalence index values for all transects
N = Total number of transects
For example: PI for Transect 1 = 2.85 PI for Transect 2 = 3.16 PI for Transect 3 = 2.93
2.85 + 3.16 + 2.93
3 8.94
3 = 2.98
77
' ..

j
I f
3. Computation of standard deviation (s) for prevalence index (PI):
(P1 1 - PIM)2 + (P12 - PIM)2 + (P13 - PIM)2 s ::
N -1
For example:
Transect PI· .:....:.L PIM (Plj PIM) (Pl j - PIM?
1 2.85 2.98 -0.13 0.0169
2 3.16 2.98 0.18 0.0324
3 2.93 2.98 -0.05 0.0025 0.0518
If! ~ "" )0.0259 s = 0.161 3-1
4. Computation of standard error (sx) of the prevalence index:
:: 0.161
~ 0.161
0.093 sx s
1.73
Since 0.093 does not exceed 0.20. no additional transects are n.eeded.
5. Record mean prevalence index value.
PIM = 2.98
Since 2.98 is less than 3.0. the area has 'hydrophytic vegetation. If the wetland hydrology criterion is met, then the area is a wetland.
70
I ' ,