westpac 2008 pillar 3 report · controlling and managing risk ... minimum liquid asset holdings ......
TRANSCRIPT

Westpac 2008 Pillar 3 Report Incorporating the requirements of Australian Prudential Standard 330
1
CONTENTS APS 330 Prudential Disclosure Sep 2008
1. INTRODUCTION ....................................................................................................................................................... 2
2. RISK APPETITE AND RISK TYPES...................................................................................................................... 3
3. CONTROLLING AND MANAGING RISK........................................................................................................... 4
4. GROUP STRUCTURE AND CAPITAL OVERVIEW......................................................................................... 6 Table 1 Scope of application..............................................................................................................................6 Table 2 Capital structure ...................................................................................................................................8 Table 3 Capital adequacy ................................................................................................................................10
5. CREDIT RISK ............................................................................................................................................................12 Table 4 Credit risk - general disclosures ..........................................................................................................12 Table 5 Credit risk – disclosures for portfolios subject to the standardised approach and
supervisory risk weights in the IRB approaches ....................................................................................26 Table 6 Credit risk – disclosures for portfolios subject to IRB approaches .........................................................28 Table 7 Credit risk mitigation disclosures ........................................................................................................37 Table 8 General disclosure for exposures related to counterparty credit risk.....................................................40
6. SECURITISATION ...................................................................................................................................................42 Table 9 Securitisation disclosures....................................................................................................................42
7. MARKET RISK ..........................................................................................................................................................52 Table 10 Market risk – disclosure for ADI’s using the standardised approach......................................................52 Table 11 Market risk – disclosure for ADI’s using the internal models approach for trading
portfolios ...........................................................................................................................................52
8. OPERATIONAL RISK .............................................................................................................................................56 Table 12 Operational risk ..................................................................................................................................56
9. EQUITIES....................................................................................................................................................................58 Table 13 Equities – disclosures for banking book positions ................................................................................58
10. INTEREST RATE RISK IN THE BANKING BOOK ........................................................................................60 Table 14 Interest rate in the banking book ........................................................................................................60
11. LIQUIDITY RISK ......................................................................................................................................................63 Minimum liquid asset holdings.............................................................................................................................63
APPENDIX 1 – Group entities ......................................................................................................................................65
APPENDIX 2 – Capital structure.................................................................................................................................68
GLOSSARY ............................................................................................................................................................................72
Disclosure regarding forward-looking statements.........................................................................................76
In this report, references to ‘Westpac,’ ‘Group’, ‘we,’ ‘us’ and ‘our’ and its subsidiaries mean Westpac Banking Corporation ABN 33 007 457 141 and its subsidiaries unless they clearly mean just Westpac Banking Corporation.

2
40
1. INTRODUCTION APS 330 Prudential Disclosure Sep 2008
1. INTRODUCTION Westpac has been accredited by the Australian Prudential Regulation Authority (APRA) and Reserve Bank of New Zealand (RBNZ) to apply the most advanced models permitted by the new global capital adequacy regime, commonly known as Basel II, to the measurement of its regulatory capital requirements. Westpac uses the Advanced Internal Ratings Based approach (Advanced IRB) for credit risk and the Advanced Measurement Approach (AMA) for operational risk.
In accordance with the Australian Prudential Standard 330 (APS 330), financial institutions that have received this accreditation, such as Westpac, are required to disclose prudential information about their risk management practices on a semi-annual basis. A subset of this information must be disclosed quarterly.
This report is Westpac’s first disclosure under these public disclosure requirements and presents a more granular view of Westpac’s risk management than has previously been available.
The Structure of Westpac’s APS 330 report as at 30 September 2008 The next ten chapters of this report describe the Group’s risk management practices and display the prudential assessment of the Group’s risk exposures. The tables in each chapter retain the numbering used in APS 330 in order to facilitate comparisons between different bank’s disclosures.
Specifically:
• Chapter 2 defines the risks that Westpac manages; • Chapter 3 outlines the responsibilities of the Board of Directors of Westpac and executive risk
management committees; • Chapter 4 explains the regulatory definition of the Level 2 Westpac Group to which all disclosure in
subsequent chapters relates. The chapter includes a description of Westpac’s capital management strategy and presents the capital adequacy ratios for the Westpac Group and Westpac New Zealand Limited. Chapter 4 includes APS 330 tables 1 to 3;
• Chapter 5 describes Westpac’s approach to managing credit risk and tabulates Westpac’s credit risk exposures. Chapter 5 includes APS 330 tables 4 to 8;
• Chapter 6 describes how Westpac participates in the securitisation market and includes APS 330 table 9; • Chapter 7 describes Westpac’s approach to market risk management and includes APS 330 tables 10
and 11; • Chapter 8 describes Westpac’s operational risk management framework and describes the structure of
the Group’s operational risk capital model. The chapter includes APS 330 table 12; • Chapter 9 describes the equity positions held in the Level 2 group1 The chapter includes APS 330 table
13; • Chapter 10 describes Westpac’s approach to managing the structural interest rate risk incurred in its
banking book. The Group’s accreditation to use internal models to estimate the regulatory capital required to be held against this risk took effect on 1 July 2008. The chapter includes APS 330 table 14; and
• Chapter 11 describes Westpac’s approach to managing liquidity risk.
1 Westpac also takes equity risk in its Wealth Management subsidiaries. These subsidiaries are outside the scope of the Level 2 Westpac Group and the risk is therefore not described in this report.

3
2. RISK APPETITE AND RISK TYPES APS 330 Prudential Disclosure Sep 2008
2. RISK APPETITE AND RISK TYPES Westpac’s vision is to be the leading financial services company in Australia and New Zealand. Effective risk management is key to achieving this goal. Protecting Westpac from unacceptable loss, or other damage, and meeting compliance obligations, are all critical elements of effective risk management.
Westpac’s appetite for risk is influenced by a range of factors, including whether a risk is considered consistent with its strategy (core risk) and whether an appropriate return can be achieved from taking that risk. Westpac has a lower appetite for risks that are not part of its core strategy. Westpac seeks to achieve an appropriate return on risk and prices its products accordingly.
Westpac’s risk appetite is set by the Board. The risk appetite cannot be defined by a single figure. It has many dimensions and is an amalgam of top–down requirements (including Westpac’s preferred debt rating and regulatory requirements) and bottom–up aggregates (such as risk concentrations and limits). Westpac uses a capital model as the basis of risk measurement, calibrated to its target debt rating.
Westpac distinguishes between different types of risk, and takes an integrated approach toward managing them. These risks are:
Key risks • Credit risk – the risk of financial loss where a customer or counterparty fails to meet their financial obligations
• Market risk – the risk to earnings from changes in market factors, such as foreign exchange rates, interest rates, commodity prices and equity prices. This includes interest rate risk in the banking book – the risk to interest income from a mismatch between the duration of assets and liabilities that arises in the normal course of business activities
• Operational risk – the risk that arises from inadequate or failed internal processes, people and systems or from external events. This includes compliance risk - the risk of legal or regulatory sanction, financial or reputation loss arising from our failure to apply the regulatory standards expected of us as a financial services group
• Liquidity risk – the risk of not meeting our payment obligations, which could arise as a result of mismatched cash flows generated by our business
Other risks • Equity risk – the potential for financial loss arising from movements in the value of our direct and indirect equity investments
• Insurance risk – the risk of not being able to meet insurance claims (related to insurance subsidiaries)
• Model risk – the risk of financial, reputation or operational losses arising because of a model
• Reputation risk – the risk to earnings or capital arising from negative public opinion resulting from the loss of reputation or public trust and standing. This risk encompasses social, ethical and environmental risks arising out of areas such as people management, climate change governance, and supply chain management
• Business risk – the risk associated with the vulnerability of a line of business to changes in the business environment
• Contagion risk – the risk that problems arising in other Westpac Group members compromise the financial and operational position of the authorised deposit-taking institutions in the Westpac Group.

4
3. CONTROLLING AND MANAGING RISK APS 330 Prudential Disclosure Sep 2008
3. CONTROLLING AND MANAGING RISK Westpac approaches risk management by identifying, assessing and managing the risks that affect its business in accordance with a set of core risk management values.
Risk management roles and responsibilities The Board is responsible for reviewing and approving our overall risk management strategy, including determining our appetite for risk. The Board has delegated the responsibility for setting risk appetite, approving frameworks, policies and processes for managing risk, and accepting risks beyond management’s approval discretion to the Risk Management Committee.
Westpac’s risk management governance structure is set out in the table below:
Board
Reviews and approves our overall risk management strategy, including our appetite for risk
Board risk management committee
The Board has delegated responsibility to the Board Risk Management Committee to set risk appetite, approve frameworks, policies and processes for managing risk, and accept risks beyond the approval discretion provided to management.
In addition, the Board Risk Management Committee:
• monitors the risk profile, performance, capital levels, exposures against limits and management and control of our risks;
• monitors changes anticipated in the economic and business environment and other factors relevant to our risk profile;
• oversees the development and ongoing review of appropriate policies that support our frameworks for managing risk; and
• reviews significant issues that may be raised by internal audit as well as the length of time and action taken to resolve such issues.
Board committees with a risk focus
Board Audit Committee
Oversees the integrity of financial statements and financial reporting systems
Board Sustainability Committee
Oversees environmental, social, governance and ethical performance and issues
5
3. CONTROLLING AND MANAGING RISK APS 330 Prudential Disclosure Sep 2008
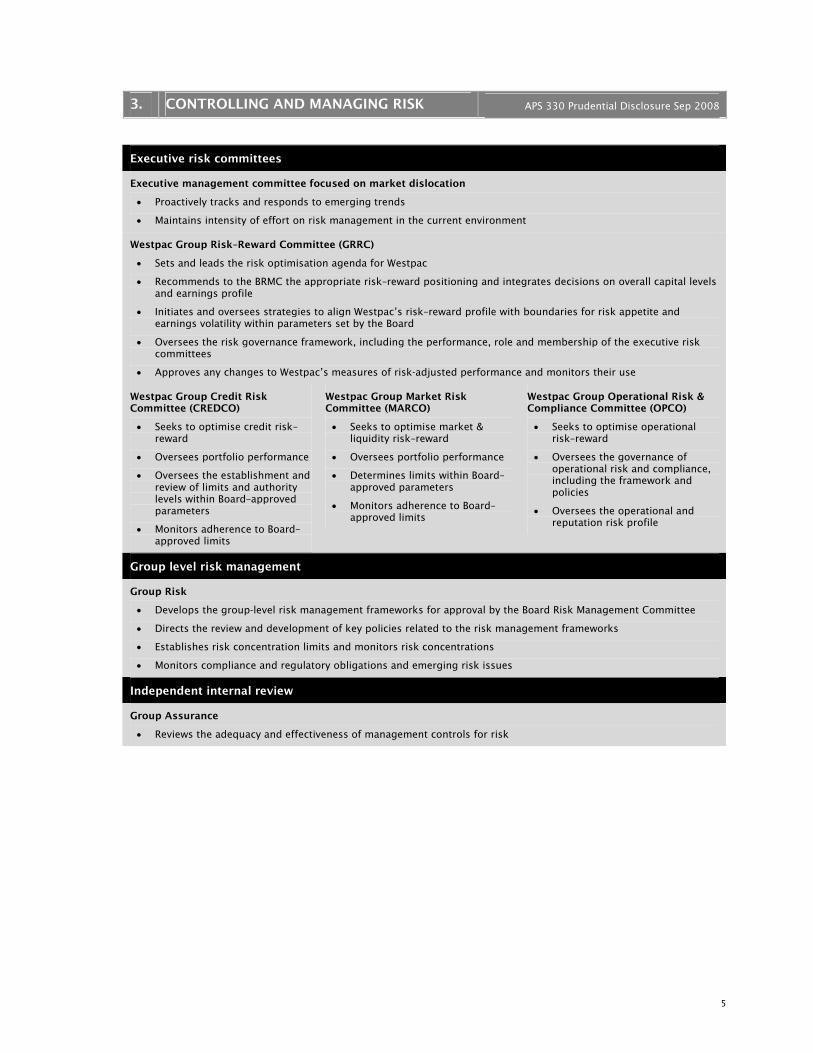
Executive risk committees
Executive management committee focused on market dislocation
• Proactively tracks and responds to emerging trends
• Maintains intensity of effort on risk management in the current environment
Westpac Group Risk–Reward Committee (GRRC)
• Sets and leads the risk optimisation agenda for Westpac
• Recommends to the BRMC the appropriate risk–reward positioning and integrates decisions on overall capital levels and earnings profile
• Initiates and oversees strategies to align Westpac’s risk–reward profile with boundaries for risk appetite and earnings volatility within parameters set by the Board
• Oversees the risk governance framework, including the performance, role and membership of the executive risk committees
• Approves any changes to Westpac’s measures of risk-adjusted performance and monitors their use
Westpac Group Credit Risk Committee (CREDCO)
• Seeks to optimise credit risk–reward
• Oversees portfolio performance
• Oversees the establishment and review of limits and authority levels within Board–approved parameters
• Monitors adherence to Board–approved limits
Westpac Group Market Risk Committee (MARCO)
• Seeks to optimise market & liquidity risk–reward
• Oversees portfolio performance
• Determines limits within Board–approved parameters
• Monitors adherence to Board–approved limits
Westpac Group Operational Risk & Compliance Committee (OPCO)
• Seeks to optimise operational risk–reward
• Oversees the governance of operational risk and compliance, including the framework and policies
• Oversees the operational and reputation risk profile
Group level risk management
Group Risk
• Develops the group-level risk management frameworks for approval by the Board Risk Management Committee
• Directs the review and development of key policies related to the risk management frameworks
• Establishes risk concentration limits and monitors risk concentrations
• Monitors compliance and regulatory obligations and emerging risk issues
Independent internal review
Group Assurance
• Reviews the adequacy and effectiveness of management controls for risk
6
BTFG and subsidiaries
Level 2
Westpac New Zealand and Pacific Banks
Westpac ELE
Australia & Offshore Branches
Level 1
Level 3
4. GROUP STRUCTURE AND CAPITAL OVERVIEW APS 330 Prudential Disclosure Sep 2008
4. GROUP STRUCTURE AND CAPITAL OVERVIEW
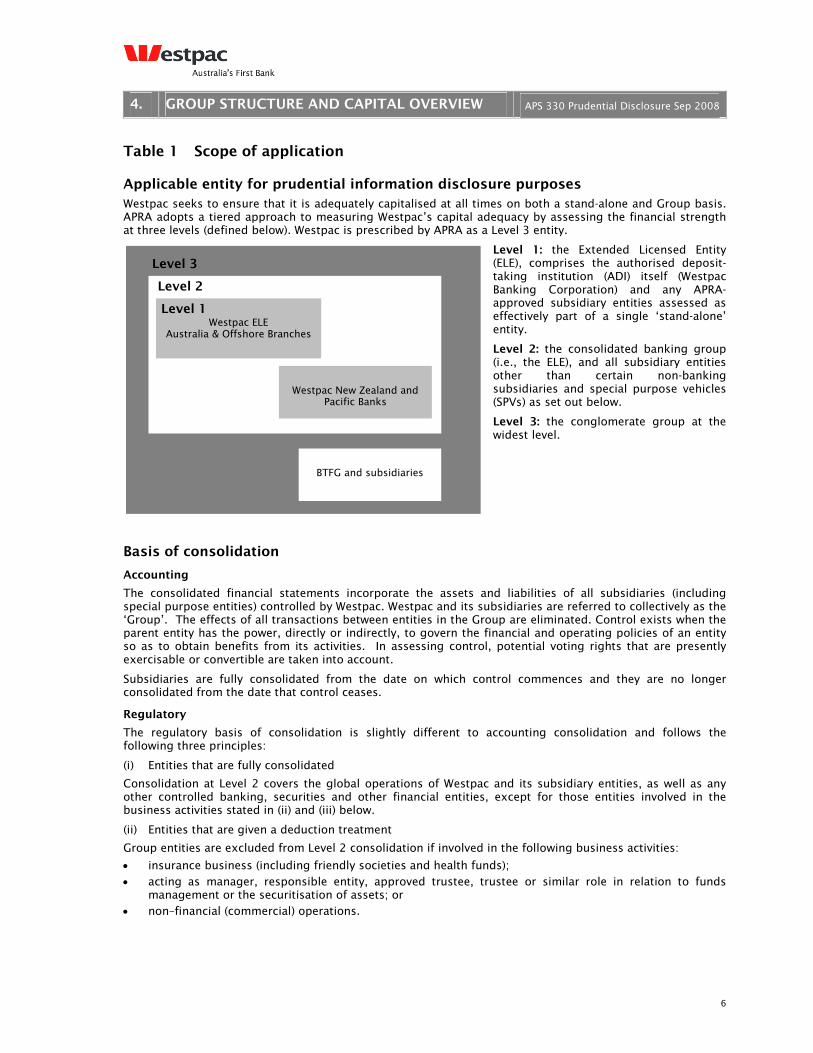
Table 1 Scope of application Applicable entity for prudential information disclosure purposes Westpac seeks to ensure that it is adequately capitalised at all times on both a stand-alone and Group basis. APRA adopts a tiered approach to measuring Westpac’s capital adequacy by assessing the financial strength at three levels (defined below). Westpac is prescribed by APRA as a Level 3 entity.
Level 1: the Extended Licensed Entity (ELE), comprises the authorised deposit-taking institution (ADI) itself (Westpac Banking Corporation) and any APRA-approved subsidiary entities assessed as effectively part of a single ‘stand-alone’ entity.
Level 2: the consolidated banking group (i.e., the ELE), and all subsidiary entities other than certain non-banking subsidiaries and special purpose vehicles (SPVs) as set out below.
Level 3: the conglomerate group at the widest level.
Basis of consolidation
Accounting
The consolidated financial statements incorporate the assets and liabilities of all subsidiaries (including special purpose entities) controlled by Westpac. Westpac and its subsidiaries are referred to collectively as the ‘Group’. The effects of all transactions between entities in the Group are eliminated. Control exists when the parent entity has the power, directly or indirectly, to govern the financial and operating policies of an entity so as to obtain benefits from its activities. In assessing control, potential voting rights that are presently exercisable or convertible are taken into account.
Subsidiaries are fully consolidated from the date on which control commences and they are no longer consolidated from the date that control ceases.
Regulatory
The regulatory basis of consolidation is slightly different to accounting consolidation and follows the following three principles:
(i) Entities that are fully consolidated
Consolidation at Level 2 covers the global operations of Westpac and its subsidiary entities, as well as any other controlled banking, securities and other financial entities, except for those entities involved in the business activities stated in (ii) and (iii) below.
(ii) Entities that are given a deduction treatment
Group entities are excluded from Level 2 consolidation if involved in the following business activities:
• insurance business (including friendly societies and health funds); • acting as manager, responsible entity, approved trustee, trustee or similar role in relation to funds
management or the securitisation of assets; or • non–financial (commercial) operations.

7
4. GROUP STRUCTURE AND CAPITAL OVERVIEW APS 330 Prudential Disclosure Sep 2008
(iii) Entities that are neither consolidated nor deducted
For regulatory reporting purposes all assets, liabilities, revenues and expenses of special purpose vehicles (SPV) to which assets have been transferred in accordance with the APS 120 clean sale requirements must be excluded from Westpac’s regulatory reported amounts, regardless of whether the SPV or its assets are consolidated for accounting purposes.
See Appendix 1 for a listing of relevant Group entities and their respective classifications for accounting and regulatory consolidation purposes.
Disclosures in this report apply to the Level 2 entity, referred to as the Westpac consolidated banking group.
Restrictions, or other major impediments, on transfer of funds or regulatory capital within the group
External restrictions
Minimum capital (‘thin capitalisation’) rules
Tax legislation in most jurisdictions in which the Group operates (including Australia, New Zealand and the United Kingdom) prescribes minimum levels of capital that must be retained in that jurisdiction. Capital for these purposes includes both contributed capital and non–distributed retained earnings. If the minimum capital is not retained in the jurisdiction, a portion of the interest costs incurred in the jurisdiction will not be tax deductible. Westpac seeks to maintain sufficient capital/retained earnings so as not to breach these rules.
Tax costs associated with repatriation
Repatriation of retained earnings (and capital) may result in tax being payable in either the jurisdiction from which the repatriation occurs or Australia on receipt of the relevant amounts. This cost would reduce the amount actually repatriated.
Westpac’s disclosure of the amount of tax that would be associated with repatriation can be seen in Note 15 of the 2008 Financial Statements.
Intra–group exposure limits
Exposures to related entities are managed within the prudential limits prescribed by APRA in its Australian Prudential Standard APS 222.
Internal restrictions
Intra–group exposures
Westpac has an internal limit structure and approval process governing the extent of credit exposures to related entities. This structure and approval process, combined with APRA’s prudential limits, is designed to minimise the potential for unacceptable contagion risk.
Capital deficiencies
The aggregate amount of capital deficiencies in all subsidiaries not included in the consolidation is nil.
Treatment of interests in insurance entities
The aggregate amount of Westpac’s total interests in insurance entities, which are risk-weighted rather than deducted from capital, is nil.
8
4. GROUP STRUCTURE AND CAPITAL OVERVIEW APS 330 Prudential Disclosure Sep 2008
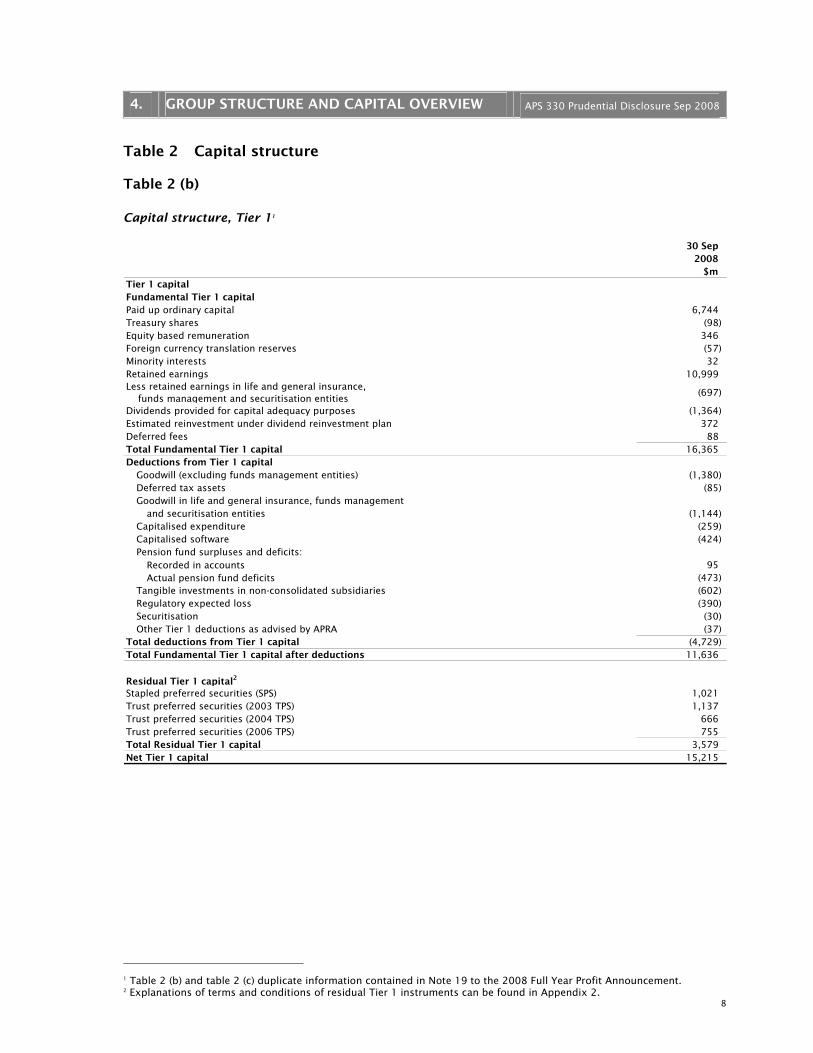
Table 2 Capital structure Table 2 (b)
Capital structure, Tier 11
30 Sep 2008
$m Tier 1 capitalFundamental Tier 1 capitalPaid up ordinary capital 6,744 Treasury shares (98) Equity based remuneration 346 Foreign currency translation reserves (57) Minority interests 32 Retained earnings 10,999 Less retained earnings in life and general insurance, funds management and securitisation entities
(697)
Dividends provided for capital adequacy purposes (1,364) Estimated reinvestment under dividend reinvestment plan 372 Deferred fees 88 Total Fundamental Tier 1 capital 16,365 Deductions from Tier 1 capital
Goodwill (excluding funds management entities) (1,380) Deferred tax assets (85) Goodwill in life and general insurance, funds management
and securitisation entities (1,144) Capitalised expenditure (259) Capitalised software (424) Pension fund surpluses and deficits:
Recorded in accounts 95 Actual pension fund deficits (473)
Tangible investments in non-consolidated subsidiaries (602) Regulatory expected loss (390) Securitisation (30) Other Tier 1 deductions as advised by APRA (37)
Total deductions from Tier 1 capital (4,729) Total Fundamental Tier 1 capital after deductions 11,636
Residual Tier 1 capital2
Stapled preferred securities (SPS) 1,021 Trust preferred securities (2003 TPS) 1,137 Trust preferred securities (2004 TPS) 666 Trust preferred securities (2006 TPS) 755 Total Residual Tier 1 capital 3,579 Net Tier 1 capital 15,215
2
1 Table 2 (b) and table 2 (c) duplicate information contained in Note 19 to the 2008 Full Year Profit Announcement. 2 Explanations of terms and conditions of residual Tier 1 instruments can be found in Appendix 2.
9
4. GROUP STRUCTURE AND CAPITAL OVERVIEW APS 330 Prudential Disclosure Sep 2008
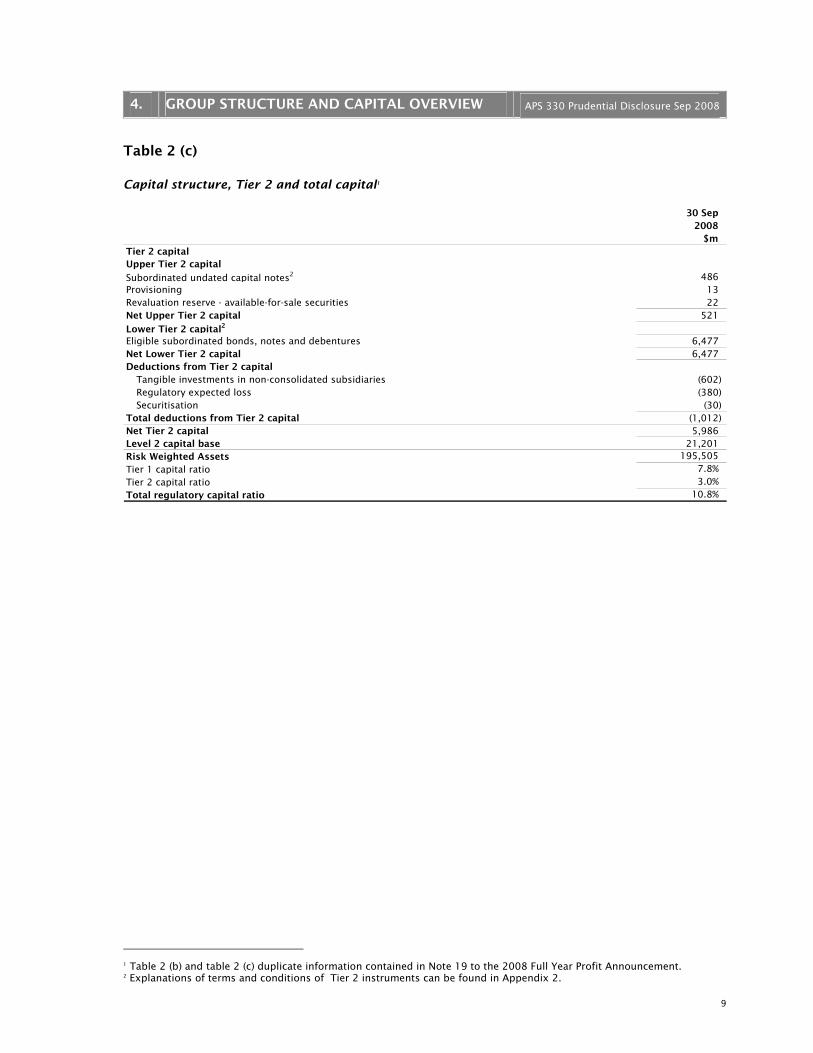
Table 2 (c)
Capital structure, Tier 2 and total capital1
30 Sep 2008
$m Tier 2 capitalUpper Tier 2 capital
Subordinated undated capital notes2 486 Provisioning 13 Revaluation reserve - available-for-sale securities 22 Net Upper Tier 2 capital 521 Lower Tier 2 capital2
Eligible subordinated bonds, notes and debentures 6,477 Net Lower Tier 2 capital 6,477 Deductions from Tier 2 capital
Tangible investments in non-consolidated subsidiaries (602) Regulatory expected loss (380) Securitisation (30)
Total deductions from Tier 2 capital (1,012) Net Tier 2 capital 5,986 Level 2 capital base 21,201 Risk Weighted Assets 195,505 Tier 1 capital ratio 7.8% Tier 2 capital ratio 3.0% Total regulatory capital ratio 10.8%
2
1 Table 2 (b) and table 2 (c) duplicate information contained in Note 19 to the 2008 Full Year Profit Announcement. 2 Explanations of terms and conditions of Tier 2 instruments can be found in Appendix 2.
10
4. GROUP STRUCTURE AND CAPITAL OVERVIEW APS 330 Prudential Disclosure Sep 2008
Table 3 Capital adequacy
Westpac’s approach to assessing capital adequacy
Capital management strategy seeks to balance the fact that capital is an expensive form of funding with the need to be adequately capitalised as an authorised deposit-taking institution. In Westpac, balancing efficiency, flexibility and adequacy is recognised in the consideration of the adequacy of capital and the development of capital management plans.
Westpac details these considerations through an Internal Capital Adequacy Assessment Process (ICAAP). The key features of the ICAAP include:
• Westpac aims to remain capitalised to a level above regulatory and economic minimums; • utilisation of a three year planning horizon for business and capital management plans; • an economic capital measurement framework, in addition to regulatory driven estimates of risk and
capital requirements, that is calibrated to Westpac’s AA debt rating; • a challenge process to the capital measures, coverage and requirements. Westpac challenges its capital
measures using stress and scenario testing that considers the possibility of not achieving planned outcomes, severe but plausible scenarios (i.e. unexpected outcomes), and the impact of concentrations; and
• the development of capital plans and a capital management strategy, which includes levels of capital buffers, contingent plans, the availability of capital deployed and the various forms of capital instruments.
11
4. GROUP STRUCTURE AND CAPITAL OVERVIEW APS 330 Prudential Disclosure Sep 2008
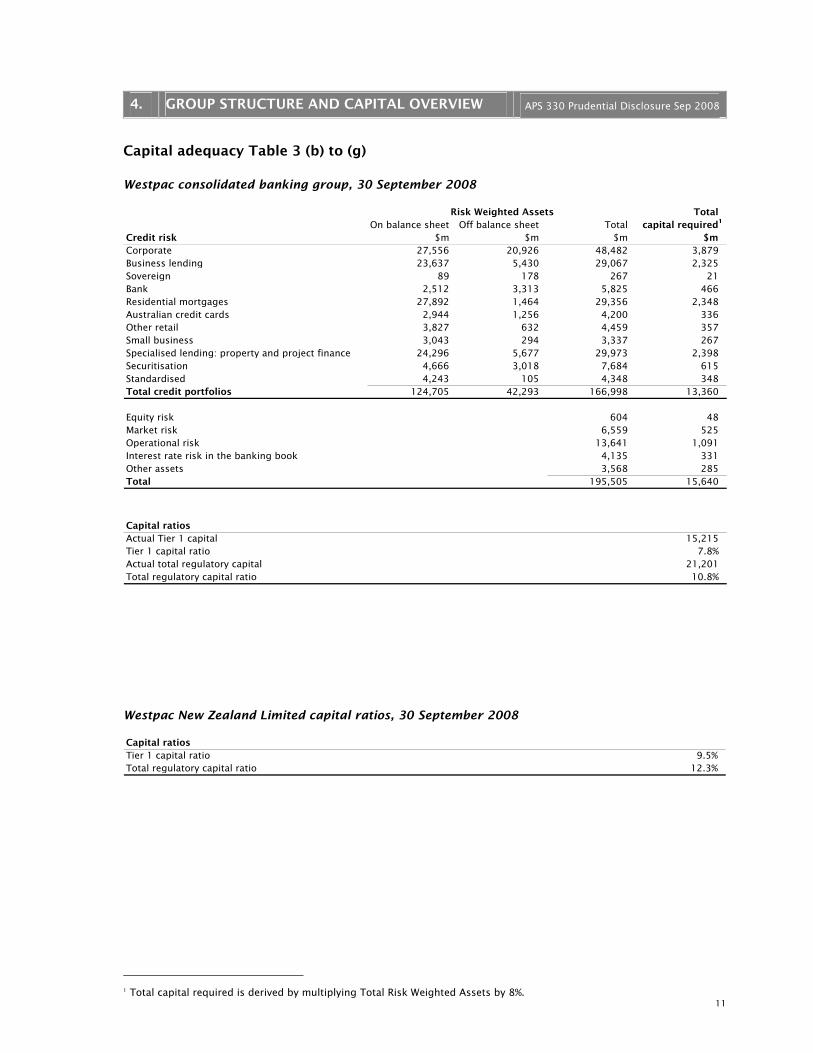
Capital adequacy Table 3 (b) to (g)
Westpac consolidated banking group, 30 September 2008
Total On balance sheet Off balance sheet Total capital required
Credit risk $m $m $m $m Corporate 27,556 20,926 48,482 3,879 Business lending 23,637 5,430 29,067 2,325 Sovereign 89 178 267 21 Bank 2,512 3,313 5,825 466 Residential mortgages 27,892 1,464 29,356 2,348 Australian credit cards 2,944 1,256 4,200 336 Other retail 3,827 632 4,459 357 Small business 3,043 294 3,337 267 Specialised lending: property and project finance 24,296 5,677 29,973 2,398 Securitisation 4,666 3,018 7,684 615 Standardised 4,243 105 4,348 348 Total credit portfolios 124,705 42,293 166,998 13,360
Equity risk 604 48 Market risk 6,559 525 Operational risk 13,641 1,091 Interest rate risk in the banking book 4,135 331 Other assets 3,568 285 Total 195,505 15,640
Capital ratiosActual Tier 1 capital 15,215 Tier 1 capital ratio 7.8% Actual total regulatory capital 21,201 Total regulatory capital ratio 10.8%
Risk Weighted Assets1
1
90
Westpac New Zealand Limited capital ratios, 30 September 2008
Capital ratiosTier 1 capital ratio 9.5% Total regulatory capital ratio 12.3%
1 Total capital required is derived by multiplying Total Risk Weighted Assets by 8%.
12
5. CREDIT RISK APS 330 Prudential Disclosure Sep 2008
5. CREDIT RISK Credit risk is the potential for financial loss where a customer or counterparty fails to meet their financial obligations.
Table 4 Credit risk - general disclosures Approach Westpac maintains an extensive set of methodologies, policies, processes, and controls to support the assessment and approval of customer (and counterparty) credit risk, incorporating the assignment of risk grades, the quantification of loss estimates in the event of default, and the segmentation of credit exposures.
Westpac adopts two approaches to managing credit risk depending upon the nature of the customer and product:
Transaction–managed approach – For larger customers, Westpac evaluates credit requests by undertaking detailed individual customer and transaction risk analysis (the ‘transaction–managed’ approach). Such customers are assigned a customer risk grade (CRG) based on Westpac’s estimate of their probability of default (PD). Each facility is assigned a loss given default (LGD). The Westpac risk rating system has 20 risk grades for non–defaulted customers and 10 risk grades for defaulted customers. Non–defaulted CRGs down to the level of normally acceptable risk (i.e. D grade – see table below) are mapped to Moody’s and Standard & Poor’s (S&P) external senior ranking unsecured ratings. This mapping is reviewed annually and allows Westpac to integrate the rating agencies’ default history, along with our own internal historical data, to calculate PDs. The final assignment of CRGs and LGDs is approved by independent credit officers with appropriate authority. Divisional operational units, operating independently of the areas originating and approving the credit risk proposals, are responsible for ensuring accurate and timely recording of all credit risk approvals and changes to customer and facility data.
Program–managed approach – High–volume (retail) customer credit portfolios with homogenous credit risk characteristics are managed on a statistical basis according to predetermined objective criteria (the ‘program-managed’ approach). Program-managed exposure to a consumer customer may exceed $1 million. No program-managed exposure to a business customer exceeds $1 million. Quantitative scorecards are used to assign application and behavioural scores to enable risk–based decision making within these portfolios. The scorecard outcomes and decisions are regularly monitored and validated against subsequent customer performance and recalibrated or rebuilt when required. For capital estimation and other purposes, risk-based customer segments are created based upon expected PD; LGDs are then assigned for each segment based on a combination of historic experience and management judgement.
The retail portfolio is divided into over 50 segments. Each segment is assigned a quantified measure of its PD and LGD.
For both approaches, the assignment of CRGs, PDs and LGDs is reviewed at least annually.
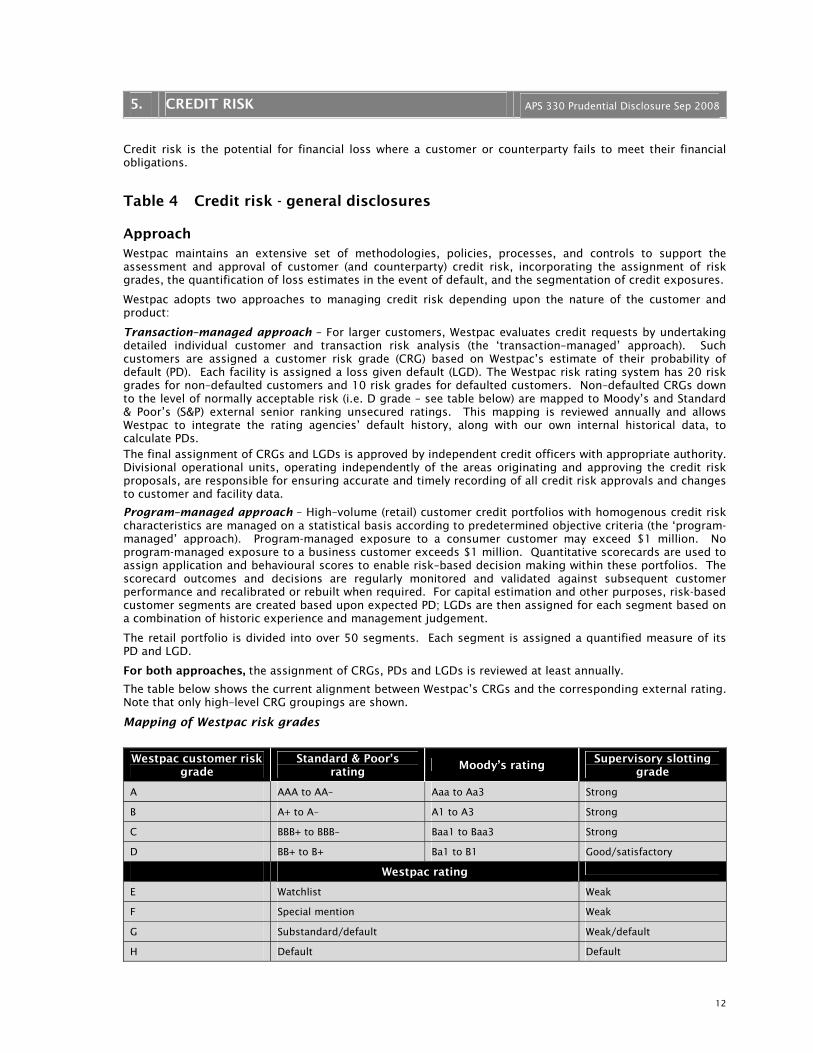
The table below shows the current alignment between Westpac’s CRGs and the corresponding external rating. Note that only high–level CRG groupings are shown.
Mapping of Westpac risk grades
Westpac customer risk grade
Standard & Poor’s rating
Moody’s rating Supervisory slotting
grade
A AAA to AA– Aaa to Aa3 Strong
B A+ to A– A1 to A3 Strong
C BBB+ to BBB– Baa1 to Baa3 Strong
D BB+ to B+ Ba1 to B1 Good/satisfactory
Westpac rating
E Watchlist Weak
F Special mention Weak
G Substandard/default Weak/default
H Default Default
13
5. CREDIT RISK APS 330 Prudential Disclosure Sep 2008
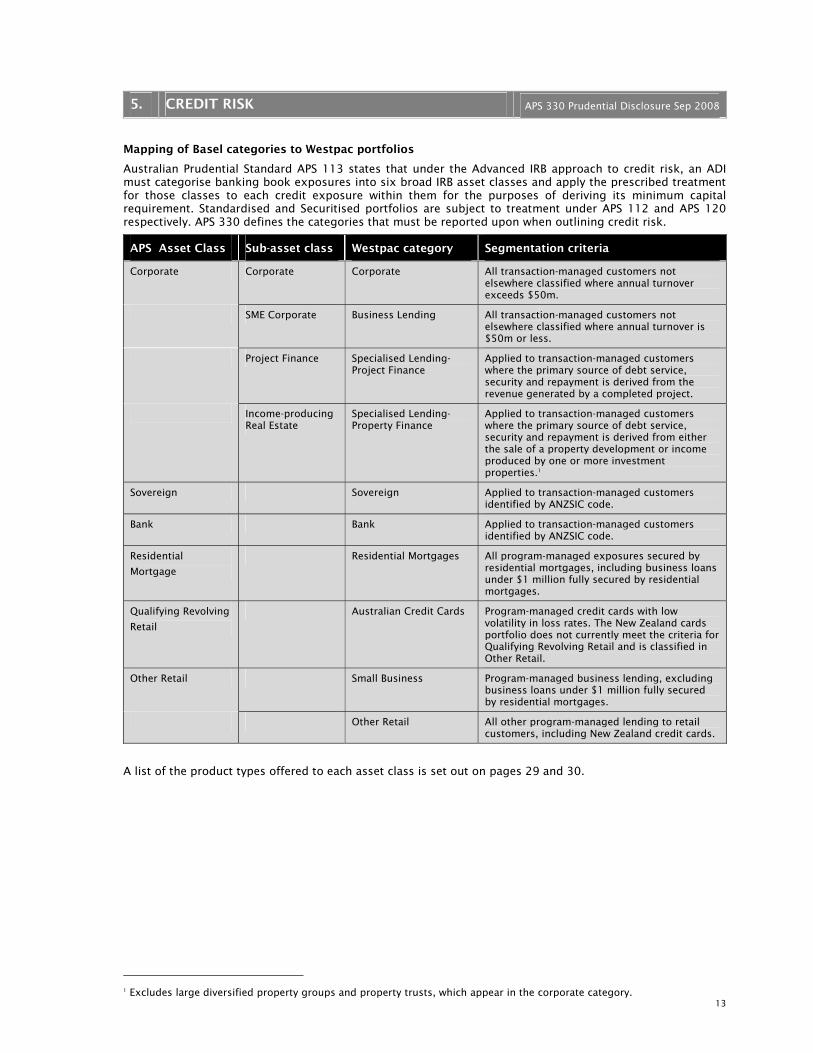
Mapping of Basel categories to Westpac portfolios
Australian Prudential Standard APS 113 states that under the Advanced IRB approach to credit risk, an ADI must categorise banking book exposures into six broad IRB asset classes and apply the prescribed treatment for those classes to each credit exposure within them for the purposes of deriving its minimum capital requirement. Standardised and Securitised portfolios are subject to treatment under APS 112 and APS 120 respectively. APS 330 defines the categories that must be reported upon when outlining credit risk.
APS Asset Class Sub-asset class Westpac category Segmentation criteria
Corporate Corporate Corporate All transaction-managed customers not elsewhere classified where annual turnover exceeds $50m.
SME Corporate Business Lending All transaction-managed customers not elsewhere classified where annual turnover is $50m or less.
Project Finance Specialised Lending-Project Finance
Applied to transaction-managed customers where the primary source of debt service, security and repayment is derived from the revenue generated by a completed project.
Income-producing Real Estate
Specialised Lending- Property Finance
Applied to transaction-managed customers where the primary source of debt service, security and repayment is derived from either the sale of a property development or income produced by one or more investment properties.1
Sovereign Sovereign Applied to transaction-managed customers identified by ANZSIC code.
Bank Bank Applied to transaction-managed customers identified by ANZSIC code.
Residential
Mortgage
Residential Mortgages All program-managed exposures secured by residential mortgages, including business loans under $1 million fully secured by residential mortgages.
Qualifying Revolving
Retail
Australian Credit Cards Program-managed credit cards with low volatility in loss rates. The New Zealand cards portfolio does not currently meet the criteria for Qualifying Revolving Retail and is classified in Other Retail.
Other Retail Small Business Program-managed business lending, excluding business loans under $1 million fully secured by residential mortgages.
Other Retail All other program-managed lending to retail customers, including New Zealand credit cards.
A list of the product types offered to each asset class is set out on pages 29 and 30. 1
1 Excludes large diversified property groups and property trusts, which appear in the corporate category.
14
5. CREDIT RISK APS 330 Prudential Disclosure Sep 2008
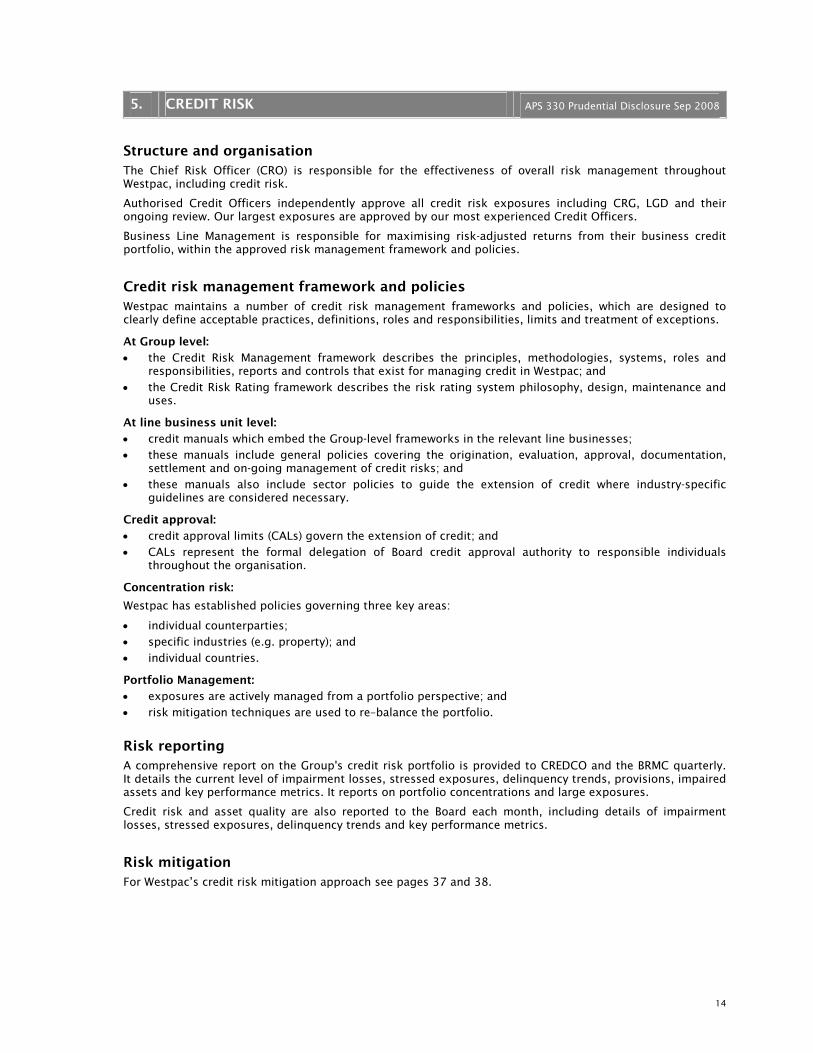
Structure and organisation The Chief Risk Officer (CRO) is responsible for the effectiveness of overall risk management throughout Westpac, including credit risk.
Authorised Credit Officers independently approve all credit risk exposures including CRG, LGD and their ongoing review. Our largest exposures are approved by our most experienced Credit Officers.
Business Line Management is responsible for maximising risk-adjusted returns from their business credit portfolio, within the approved risk management framework and policies.
Credit risk management framework and policies Westpac maintains a number of credit risk management frameworks and policies, which are designed to clearly define acceptable practices, definitions, roles and responsibilities, limits and treatment of exceptions.
At Group level:
• the Credit Risk Management framework describes the principles, methodologies, systems, roles and responsibilities, reports and controls that exist for managing credit in Westpac; and
• the Credit Risk Rating framework describes the risk rating system philosophy, design, maintenance and uses.
At line business unit level:
• credit manuals which embed the Group-level frameworks in the relevant line businesses; • these manuals include general policies covering the origination, evaluation, approval, documentation,
settlement and on-going management of credit risks; and • these manuals also include sector policies to guide the extension of credit where industry-specific
guidelines are considered necessary.
Credit approval:
• credit approval limits (CALs) govern the extension of credit; and • CALs represent the formal delegation of Board credit approval authority to responsible individuals
throughout the organisation.
Concentration risk:
Westpac has established policies governing three key areas:
• individual counterparties; • specific industries (e.g. property); and • individual countries.
Portfolio Management:
• exposures are actively managed from a portfolio perspective; and • risk mitigation techniques are used to re–balance the portfolio.
Risk reporting A comprehensive report on the Group's credit risk portfolio is provided to CREDCO and the BRMC quarterly. It details the current level of impairment losses, stressed exposures, delinquency trends, provisions, impaired assets and key performance metrics. It reports on portfolio concentrations and large exposures.
Credit risk and asset quality are also reported to the Board each month, including details of impairment losses, stressed exposures, delinquency trends and key performance metrics.
Risk mitigation For Westpac’s credit risk mitigation approach see pages 37 and 38.

15
5. CREDIT RISK APS 330 Prudential Disclosure Sep 2008
Approaches followed for creation of individually assessed and collectively assessed provisions Provisions for loan impairment losses represent management’s best estimate of the losses incurred in the loan portfolios as at the balance date. There are two components of Westpac’s loan impairment provisions; individually assessed provisions and collectively assessed provisions.
In determining individually assessed provisions, all relevant considerations that have a bearing on the expected future cash flows are taken into account, for example:
• the business prospects of the customer; • the realisable value of collateral; • Westpac’s position relative to other claimants; • the reliability of customer information; and • the likely cost and duration of the work–out process.
These judgements and estimates can change with time as new information becomes available or as work–out strategies evolve, resulting in revisions to the impairment provision as individual decisions are made.
Collectively assessed provisions are established on a portfolio basis taking into account:
• the level of arrears; • collateral; • past loss experience; and • expected defaults based on portfolio trends. The most significant factors in establishing these provisions are estimated loss rates and the related emergence period. The future credit quality of these portfolios is subject to uncertainties that could cause actual credit losses to differ from reported loan impairment provisions. These uncertainties include: • the economic environment, notably interest rates and unemployment levels; • payment behaviour; and • bankruptcy rates.
Exposures that are subject to standardised approach and advanced IRB approach Assets subject to the standardised approach are Westpac’s Pacific Banking exposures, Asian retail exposures in accordance with APRA’s current requirements, and Westpac’s margin lending portfolio. All other exposures are subject to the advanced IRB approach.
There are currently no plans to move the Pacific Banking and Asian retail exposures to the IRB approach.
Key Definitions
Credit Risk
Credit Risk is the risk of financial loss that results from customers or counterparties failing to meet their financial obligations including obligations that exist via direct loans, contingent liabilities and financial markets activities.
Default
A customer default is considered to have occurred when Westpac considers that either or both of the following events have taken place:
• the customer is unlikely to pay its credit obligations to its financiers in full, without recourse by any of them to actions such as realising security (where held); and
• the customer is past due 90 or more calendar days on any material credit obligation to its financiers. Overdrafts will be considered past due once the customer has breached an advised limit, or been advised of a limit smaller than the current outstandings.
Probability of default (PD)
The PD is a through the cycle assessment of the likelihood of a customer defaulting on its financial obligations within one year.
16
5. CREDIT RISK APS 330 Prudential Disclosure Sep 2008
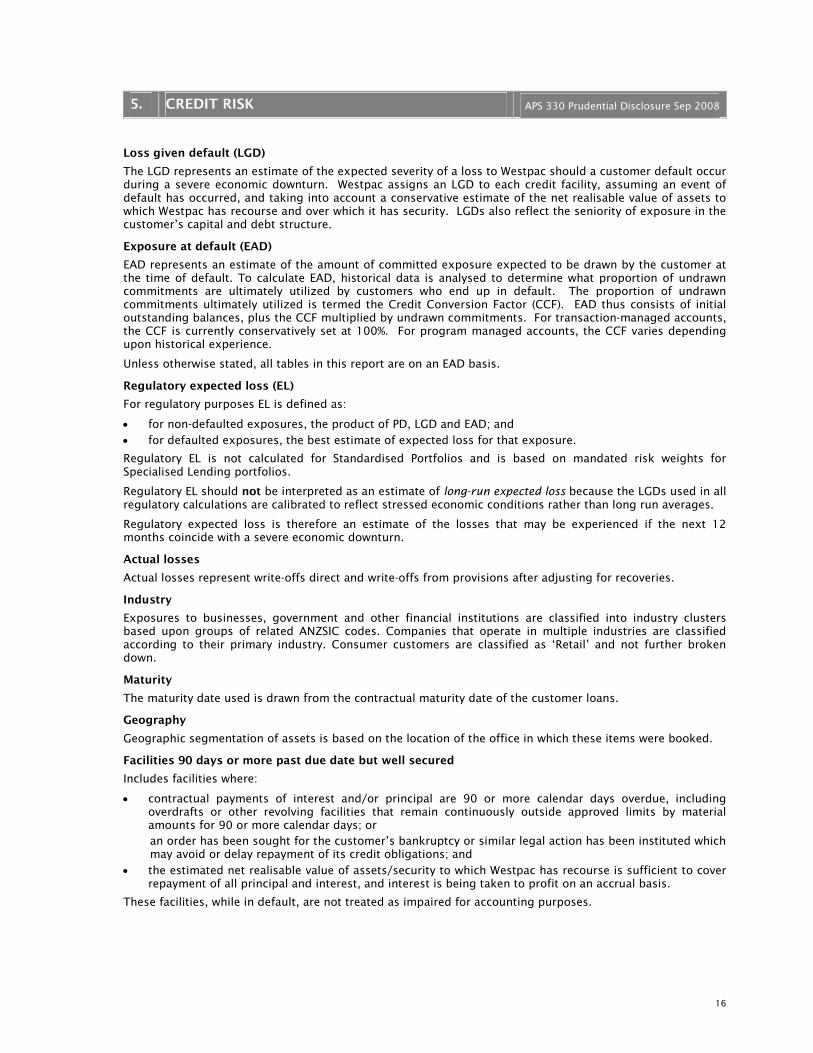
Loss given default (LGD)
The LGD represents an estimate of the expected severity of a loss to Westpac should a customer default occur during a severe economic downturn. Westpac assigns an LGD to each credit facility, assuming an event of default has occurred, and taking into account a conservative estimate of the net realisable value of assets to which Westpac has recourse and over which it has security. LGDs also reflect the seniority of exposure in the customer’s capital and debt structure.
Exposure at default (EAD)
EAD represents an estimate of the amount of committed exposure expected to be drawn by the customer at the time of default. To calculate EAD, historical data is analysed to determine what proportion of undrawn commitments are ultimately utilized by customers who end up in default. The proportion of undrawn commitments ultimately utilized is termed the Credit Conversion Factor (CCF). EAD thus consists of initial outstanding balances, plus the CCF multiplied by undrawn commitments. For transaction-managed accounts, the CCF is currently conservatively set at 100%. For program managed accounts, the CCF varies depending upon historical experience.
Unless otherwise stated, all tables in this report are on an EAD basis.
Regulatory expected loss (EL)
For regulatory purposes EL is defined as:
• for non-defaulted exposures, the product of PD, LGD and EAD; and • for defaulted exposures, the best estimate of expected loss for that exposure.
Regulatory EL is not calculated for Standardised Portfolios and is based on mandated risk weights for Specialised Lending portfolios.
Regulatory EL should not be interpreted as an estimate of long-run expected loss because the LGDs used in all regulatory calculations are calibrated to reflect stressed economic conditions rather than long run averages.
Regulatory expected loss is therefore an estimate of the losses that may be experienced if the next 12 months coincide with a severe economic downturn.
Actual losses
Actual losses represent write-offs direct and write-offs from provisions after adjusting for recoveries.
Industry
Exposures to businesses, government and other financial institutions are classified into industry clusters based upon groups of related ANZSIC codes. Companies that operate in multiple industries are classified according to their primary industry. Consumer customers are classified as ‘Retail’ and not further broken down.
Maturity
The maturity date used is drawn from the contractual maturity date of the customer loans.
Geography
Geographic segmentation of assets is based on the location of the office in which these items were booked.
Facilities 90 days or more past due date but well secured
Includes facilities where:
• contractual payments of interest and/or principal are 90 or more calendar days overdue, including overdrafts or other revolving facilities that remain continuously outside approved limits by material amounts for 90 or more calendar days; or
an order has been sought for the customer’s bankruptcy or similar legal action has been instituted which may avoid or delay repayment of its credit obligations; and
• the estimated net realisable value of assets/security to which Westpac has recourse is sufficient to cover repayment of all principal and interest, and interest is being taken to profit on an accrual basis.
These facilities, while in default, are not treated as impaired for accounting purposes.

17
5. CREDIT RISK APS 330 Prudential Disclosure Sep 2008
Impaired assets
Includes exposures that have deteriorated to the point where full collection of interest and principal is in doubt, based on a conservative assessment of the customer’s outlook, cashflow, and the net realisation of value of assets to which recourse is held:
• facilities 90 days or more past due, and not well secured – exposures where contractual payments are 90 or more days in arrears and the net realisable value of assets to which recourse is held may not be sufficient to allow full collection of interest and principal, including overdrafts or other revolving facilities that remain continuously outside approved limits by material amounts for 90 or more calendar days;
• non-accrual assets – exposures with individually assessed impairment provisions held against them, excluding restructured loans;
• restructured assets – exposures where the original contractual terms have been formally modified to provide for concessions of interest or principal for reasons related to the financial difficulties of the customer;
• other assets acquired through security enforcement (includes other real estate owned) – includes the value of any other assets acquired as full or partial settlement of outstanding obligations through the enforcement of security arrangements; and
• any other assets where the full collection of interest and principal is in doubt

18
5. CREDIT RISK APS 330 Prudential Disclosure Sep 2008
Credit Risk General Disclosures
The following tables segment the portfolio by characteristics that provide an insight into the assessment of credit risk concentration.
All exposures described in table 4 reflect the Westpac consolidated banking group with all foreign currency exposures converted into Australian dollars.
Summary credit risk disclosures
Actual Losses Risk Regulatory for the 12
Exposure Weighted expected month period Impaired Specific at default Assets loss ending loans Provisions
30 Sep 30 Sep 30 Sep 30 Sep 30 Sep 30 Sep 2008 2008 2008 2008 2008 2008
$m $m $m $m $m $m Corporate 95,313 48,482 467 17 332 175 Business lending 45,243 29,067 368 52 181 70 Sovereign 11,963 267 - - - - Bank 38,194 5,825 10 - 6 5 Residential mortgages 183,376 29,356 354 21 193 49 Australian credit cards 15,353 4,200 228 185 60 65 Other retail 4,823 4,459 161 117 50 31 Small business 8,270 3,337 110 39 35 16 Specialised lending: property and project finance 30,798 29,973 555 7 148 37 Securitisation 22,591 7,684 - - 56 12 Standardised portfolios 7,044 4,348 - 1 116 75
Collective provisions for non - impaired assets 1,639 General reserve for credit losses adjustment 14 Total 462,968 166,998 2,253 439 1,177 2,188
1
1
Table 4 (b)
Total regulatory credit exposures by major type (EAD)
Average Exposure at default 6 months ended
30 Sep 2008 30 Sep 2008 $m % $m
Corporate 95,313 20.6% 93,948 Business lending 45,243 9.8% 45,184 Sovereign 11,963 2.6% 12,686 Bank 38,194 8.2% 42,688 Residential mortgages 183,376 39.6% 178,431 Australian credit cards 15,353 3.3% 15,175 Other retail 4,823 1.0% 4,867 Small business 8,270 1.8% 8,186 Specialised lending: property and project finance 30,798 6.7% 29,268 Securitisation 22,591 4.9% 19,981 Standardised portfolios 7,044 1.5% 7,004 Total 462,968 100.0% 457,418
1 Specific Provisions are defined as the sum of Individually Assessed Provisions and Collectively Assessed Provisions for impaired assets.
19
5. CREDIT RISK APS 330 Prudential Disclosure Sep 2008
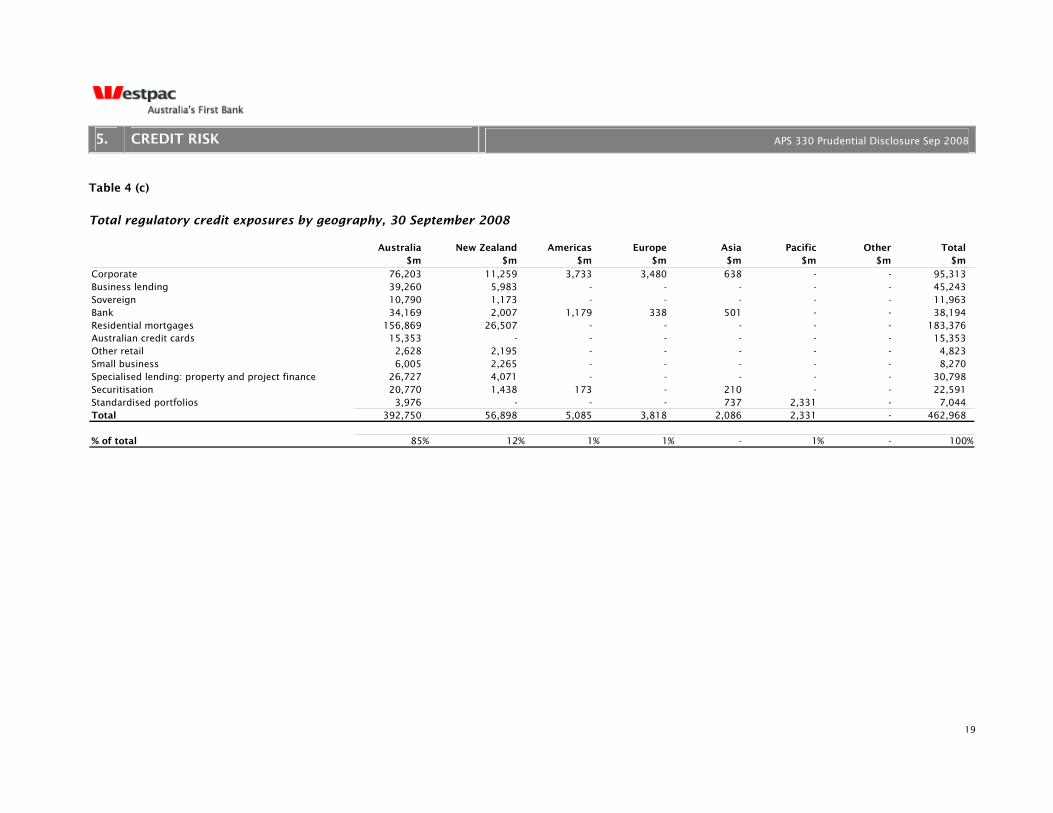
Table 4 (c)
Total regulatory credit exposures by geography, 30 September 2008
Australia New Zealand Americas Europe Asia Pacific Other Total $m $m $m $m $m $m $m $m
Corporate 76,203 11,259 3,733 3,480 638 - - 95,313 Business lending 39,260 5,983 - - - - - 45,243 Sovereign 10,790 1,173 - - - - - 11,963 Bank 34,169 2,007 1,179 338 501 - - 38,194 Residential mortgages 156,869 26,507 - - - - - 183,376 Australian credit cards 15,353 - - - - - - 15,353 Other retail 2,628 2,195 - - - - - 4,823 Small business 6,005 2,265 - - - - - 8,270 Specialised lending: property and project finance 26,727 4,071 - - - - - 30,798 Securitisation 20,770 1,438 173 - 210 - - 22,591 Standardised portfolios 3,976 - - - 737 2,331 - 7,044 Total 392,750 56,898 5,085 3,818 2,086 2,331 - 462,968
% of total 85% 12% 1% 1% - 1% - 100%
20
5. CREDIT RISK APS 330 Prudential Disclosure Sep 2008
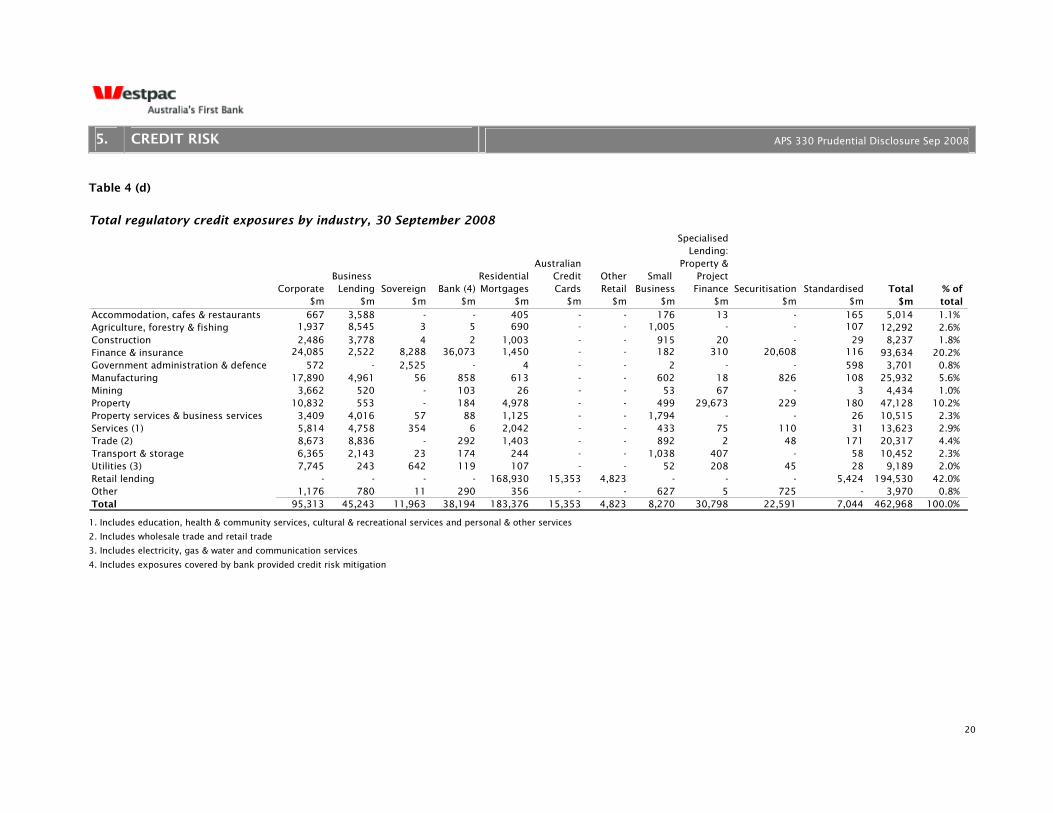
Table 4 (d)
Total regulatory credit exposures by industry, 30 September 2008
SpecialisedLending:
Australian Property &Business Residential Credit Other Small Project
Corporate Lending Sovereign Bank (4) Mortgages Cards Retail Business Finance Securitisation Standardised Total % of$m $m $m $m $m $m $m $m $m $m $m $m total
Accommodation, cafes & restaurants 667 3,588 - - 405 - - 176 13 - 165 5,014 1.1% Agriculture, forestry & fishing 1,937 8,545 3 5 690 - - 1,005 - - 107 12,292 2.6% Construction 2,486 3,778 4 2 1,003 - - 915 20 - 29 8,237 1.8% Finance & insurance 24,085 2,522 8,288 36,073 1,450 - - 182 310 20,608 116 93,634 20.2% Government administration & defence 572 - 2,525 - 4 - - 2 - - 598 3,701 0.8% Manufacturing 17,890 4,961 56 858 613 - - 602 18 826 108 25,932 5.6% Mining 3,662 520 - 103 26 - - 53 67 - 3 4,434 1.0% Property 10,832 553 - 184 4,978 - - 499 29,673 229 180 47,128 10.2% Property services & business services 3,409 4,016 57 88 1,125 - - 1,794 - - 26 10,515 2.3% Services (1) 5,814 4,758 354 6 2,042 - - 433 75 110 31 13,623 2.9% Trade (2) 8,673 8,836 - 292 1,403 - - 892 2 48 171 20,317 4.4% Transport & storage 6,365 2,143 23 174 244 - - 1,038 407 - 58 10,452 2.3% Utilities (3) 7,745 243 642 119 107 - - 52 208 45 28 9,189 2.0% Retail lending - - - - 168,930 15,353 4,823 - - - 5,424 194,530 42.0% Other 1,176 780 11 290 356 - - 627 5 725 - 3,970 0.8% Total 95,313 45,243 11,963 38,194 183,376 15,353 4,823 8,270 30,798 22,591 7,044 462,968 100.0%
1. Includes education, health & community services, cultural & recreational services and personal & other services
2. Includes wholesale trade and retail trade
3. Includes electricity, gas & water and communication services
4. Includes exposures covered by bank provided credit risk mitigation

21
5. CREDIT RISK APS 330 Prudential Disclosure Sep 2008
Table 4 (e)
Total regulatory credit exposures by contractual residual maturity
On demand <12 Months 1 to <3yrs 3 to <5yrs >=5 yrs Total 30 Sep 30 Sep 30 Sep 30 Sep 30 Sep 30 Sep
2008 2008 2008 2008 2008 2008 $m $m $m $m $m $m
Corporate 6,586 26,889 42,104 15,877 3,857 95,313 Business lending 4,125 5,909 13,479 6,854 14,876 45,243 Sovereign 489 677 10,223 228 346 11,963 Bank 3,382 5,605 26,218 2,839 150 38,194 Residential mortgages 7,843 3,875 13,777 14,103 143,778 183,376 Australian credit cards 15,353 - - - - 15,353 Other retail 2,116 51 579 688 1,389 4,823 Small business 791 676 2,366 2,866 1,571 8,270 Specialised: property and project finance 472 11,349 11,013 3,995 3,969 30,798 Securitisation 438 15,863 3,451 530 2,309 22,591 Standarised portfolios 4,245 59 1,805 121 814 7,044 Total 45,840 70,953 125,015 48,101 173,059 462,968
22
5. CREDIT RISK APS 330 Prudential Disclosure Sep 2008
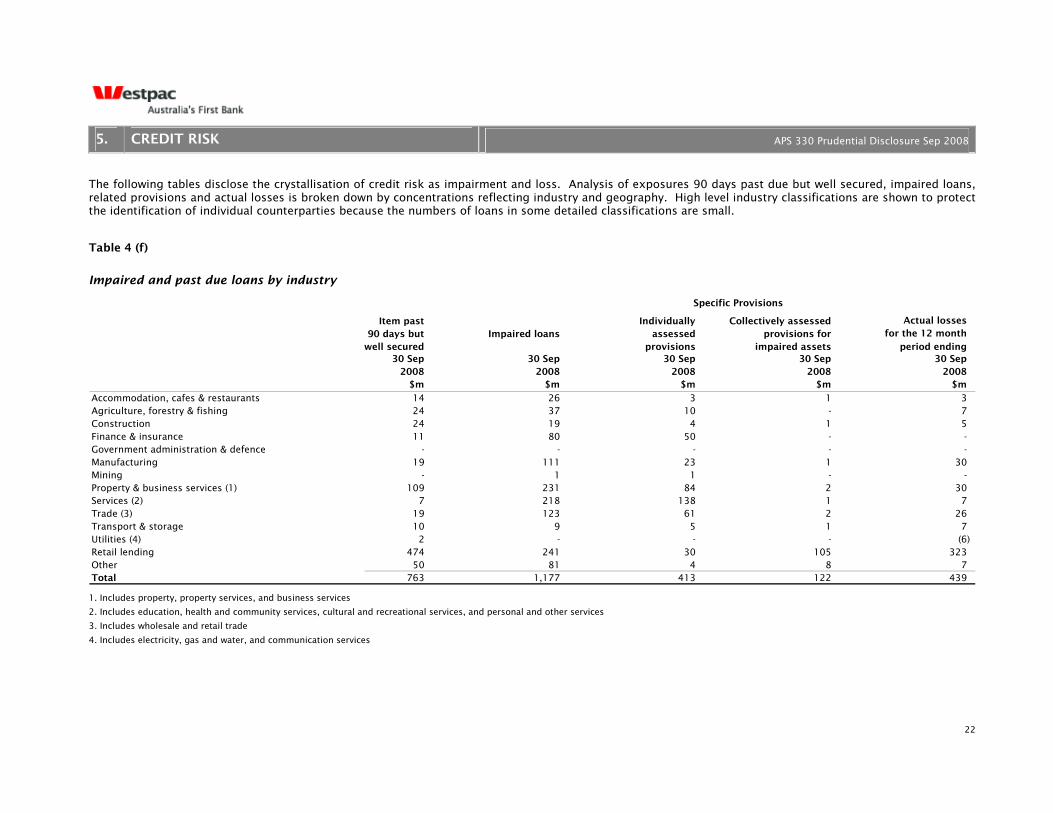
The following tables disclose the crystallisation of credit risk as impairment and loss. Analysis of exposures 90 days past due but well secured, impaired loans, related provisions and actual losses is broken down by concentrations reflecting industry and geography. High level industry classifications are shown to protect the identification of individual counterparties because the numbers of loans in some detailed classifications are small.
Table 4 (f)
Impaired and past due loans by industry
Item past Individually Collectively assessed 90 days but Impaired loans assessed provisions for
well secured provisions impaired assets period ending 30 Sep 30 Sep 30 Sep 30 Sep 30 Sep
2008 2008 2008 2008 2008 $m $m $m $m $m
Accommodation, cafes & restaurants 14 26 3 1 3 Agriculture, forestry & fishing 24 37 10 - 7 Construction 24 19 4 1 5 Finance & insurance 11 80 50 - - Government administration & defence - - - - - Manufacturing 19 111 23 1 30 Mining - 1 1 - - Property & business services (1) 109 231 84 2 30 Services (2) 7 218 138 1 7 Trade (3) 19 123 61 2 26 Transport & storage 10 9 5 1 7 Utilities (4) 2 - - - (6) Retail lending 474 241 30 105 323 Other 50 81 4 8 7 Total 763 1,177 413 122 439
for the 12 month Actual losses
Specific Provisions
1. Includes property, property services, and business services
2. Includes education, health and community services, cultural and recreational services, and personal and other services
3. Includes wholesale and retail trade
4. Includes electricity, gas and water, and communication services
23
5. CREDIT RISK APS 330 Prudential Disclosure Sep 2008
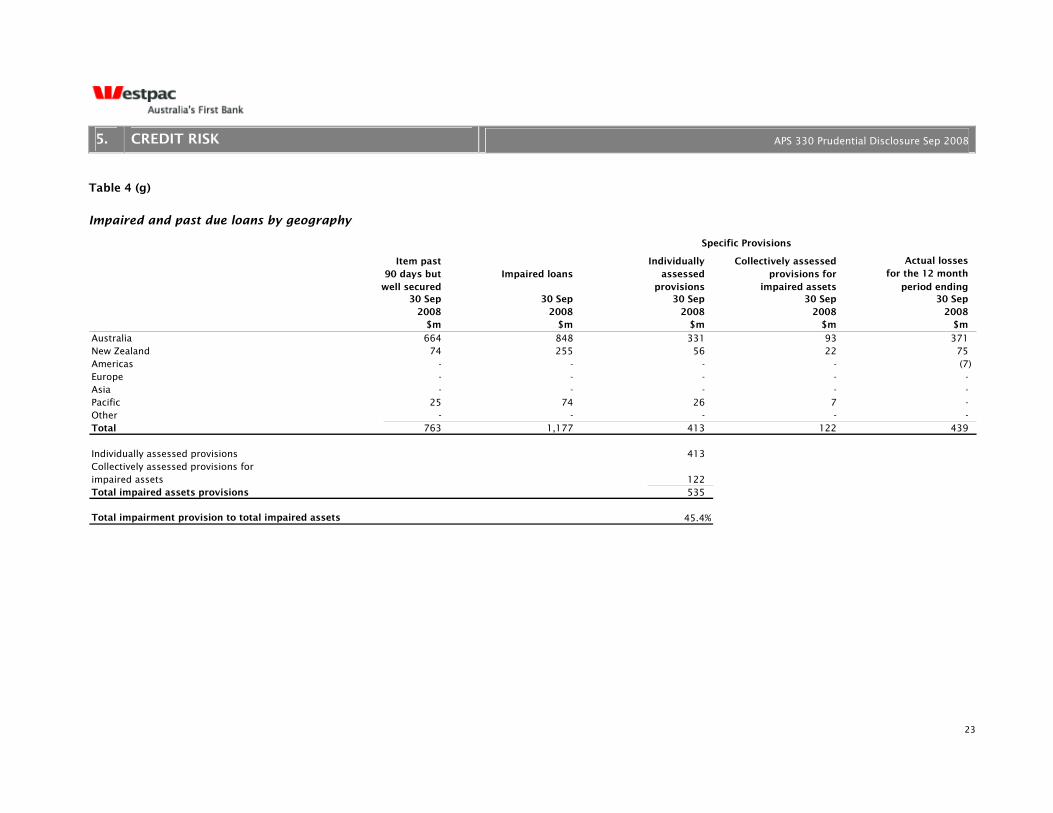
Table 4 (g)
Impaired and past due loans by geography
Item past Individually Collectively assessed 90 days but Impaired loans assessed provisions for
well secured provisions impaired assets period ending 30 Sep 30 Sep 30 Sep 30 Sep 30 Sep
2008 2008 2008 2008 2008 $m $m $m $m $m
Australia 664 848 331 93 371 New Zealand 74 255 56 22 75 Americas - - - - (7) Europe - - - - - Asia - - - - - Pacific 25 74 26 7 - Other - - - - - Total 763 1,177 413 122 439
Individually assessed provisions 413 Collectively assessed provisions forimpaired assets 122 Total impaired assets provisions 535
45.4%
Specific Provisions
Total impairment provision to total impaired assets
Actual losses for the 12 month

24
5. CREDIT RISK APS 330 Prudential Disclosure Sep 2008
Impaired assets and past due loans by portfolio
Item past Individually Collectively assessed 90 days but Impaired loans assessed provisions for
well secured provisions impaired assets period ending 30 Sep 30 Sep 30 Sep 30 Sep 30 Sep
2008 2008 2008 2008 2008 $m $m $m $m $m
Corporate - 332 175 - 17 Business lending 110 181 68 2 52 Sovereign - - - - - Bank - 6 5 - - Residential mortgages 528 193 40 9 21 Australian credit cards - 60 - 65 185 Other retail - 50 - 31 117 Small business 47 35 8 8 39 Specialised lending: property and project finance 53 148 37 - 7 Securitisation - 56 12 - - Total 738 1,061 345 115 438
Standardised portfolios 25 116 68 7 1
Total 763 1,177 413 122 439
Actual losses for the 12 month
Specific Provisions

25
5. CREDIT RISK APS 330 Prudential Disclosure Sep 2008
Table 4 (h)
Reconciliation of changes in the provisions
period ending 30 Sep
2008 $m
Balance at beginning of the period 1,410 New provisions raised 606 Utilised - Write-offs (378) Discount unwind 130 Exchange rate adjustments (7)
Closing balance 1,761
Balance at beginning of period 148 447
Write-backs (90) Write-offs (93) Discount unwind (6) Exchange rate adjustments 7
Closing balance 413 2,174
General reserve for credit losses adjustment 14 2,188
New individually assessed provisions
Total provisions for impairment losses on loans and credit commitments
Total provision plus general reserve for credit losses
Collectively assessed provisions
Individually assessed provisions
For the 12 month
This table duplicates information found in Note 12 to the 2008 Full Year Profit Announcement.
Table 4 (i)
Exposures subject to standardised and advanced IRB approaches
This is the only table in which Standardised exposures are split by regulatory portfolios. In all other tables they are grouped under the Standardised heading, while portfolio totals refer to Advanced IRB exposures only.
Standardised Advanced IRB Total
30 Sep 30 Sep 30 Sep
2008 2008 2008
$m $m $m
Corporate - 95,313 95,313 Business lending 679 45,243 45,922 Sovereign 605 11,963 12,568 Bank 74 38,194 38,268 Residential mortgages 986 183,376 184,362 Australian credit cards - 15,353 15,353 Other retail 4,482 4,823 9,305 Small business - 8,270 8,270 Specialised lending: property and project finance 218 30,798 31,016 Securitisation - 22,591 22,591 Total 7,044 455,924 462,968
% of total 2% 98% 100%
26
5. CREDIT RISK APS 330 Prudential Disclosure Sep 2008
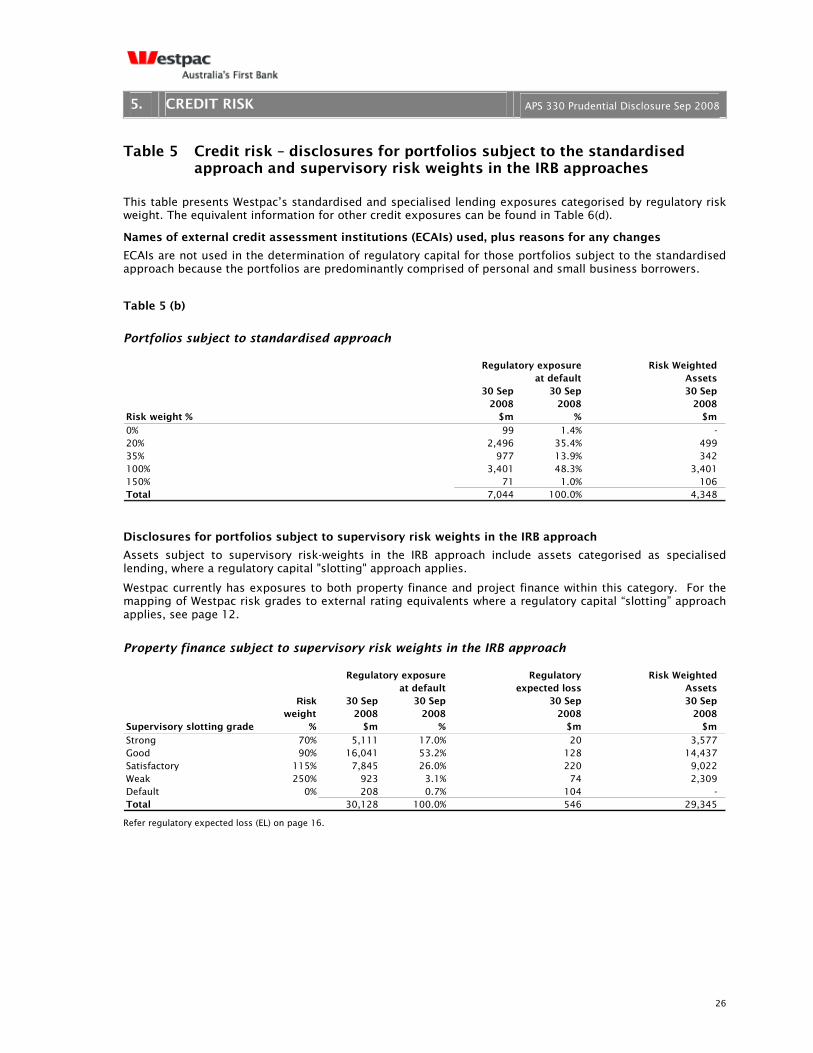
Table 5 Credit risk – disclosures for portfolios subject to the standardised approach and supervisory risk weights in the IRB approaches
This table presents Westpac’s standardised and specialised lending exposures categorised by regulatory risk weight. The equivalent information for other credit exposures can be found in Table 6(d).
Names of external credit assessment institutions (ECAIs) used, plus reasons for any changes
ECAIs are not used in the determination of regulatory capital for those portfolios subject to the standardised approach because the portfolios are predominantly comprised of personal and small business borrowers.
Table 5 (b)
Portfolios subject to standardised approach
Regulatory exposure Risk Weighted at default Assets
30 Sep 30 Sep 30 Sep 2008 2008 2008
Risk weight % $m % $m
0% 99 1.4% - 20% 2,496 35.4% 499 35% 977 13.9% 342 100% 3,401 48.3% 3,401 150% 71 1.0% 106 Total 7,044 100.0% 4,348
Disclosures for portfolios subject to supervisory risk weights in the IRB approach
Assets subject to supervisory risk-weights in the IRB approach include assets categorised as specialised lending, where a regulatory capital "slotting" approach applies.
Westpac currently has exposures to both property finance and project finance within this category. For the mapping of Westpac risk grades to external rating equivalents where a regulatory capital “slotting” approach applies, see page 12.
Property finance subject to supervisory risk weights in the IRB approach
Regulatory exposure Regulatory Risk Weighted at default expected loss Assets
Risk 30 Sep 30 Sep 30 Sep 30 Sep weight 2008 2008 2008 2008
Supervisory slotting grade % $m % $m $m
Strong 70% 5,111 17.0% 20 3,577 Good 90% 16,041 53.2% 128 14,437 Satisfactory 115% 7,845 26.0% 220 9,022 Weak 250% 923 3.1% 74 2,309 Default 0% 208 0.7% 104 - Total 30,128 100.0% 546 29,345
Refer regulatory expected loss (EL) on page 16.

27
5. CREDIT RISK APS 330 Prudential Disclosure Sep 2008
Project finance subject to supervisory risk weights in the IRB approach
Regulatory exposure Regulatory Risk Weighted at default expected loss Assets
Risk 30 Sep 30 Sep 30 Sep 30 Sep weight 2008 2008 2008 2008
Supervisory slotting grade % $m % $m $m
Strong 70% 445 66.4% 2 312 Good 90% 141 21.1% 1 127 Satisfactory 115% 15 2.2% - 17 Weak 250% 69 10.3% 6 172 Default 0% - 0.0% - - Total 670 100.0% 9 628
28
5. CREDIT RISK APS 330 Prudential Disclosure Sep 2008
Table 6 Credit risk – disclosures for portfolios subject to IRB approaches Supervisory acceptance APRA has approved Westpac for the advanced IRB approach for credit risk.
Explanation and review
Internal credit risk ratings system
In addition to using the credit risk estimates as the basis for regulatory capital purposes, they are also used in the following processes:
Economic Capital
Westpac allocates economic capital to all exposures. Economic capital includes both credit and non-credit components. Economic credit capital is allocated using a framework that considers estimates of PD, LGD, EAD, total committed exposure and loan tenor, as well as measures of portfolio composition not reflected in regulatory capital formulae.1
Provisioning
Impairment provisions are reserves held by Westpac to cover credit losses that are incurred in the loan portfolio. Individual provisions are calculated on impaired loans taking into account management’s best estimate of the present value of future cash flows. Collective provisions are established on a portfolio basis taking into account the level of arrears, collateral, past loss experience and emergence periods. Transaction-managed portfolio provisions use the risk grading framework and suitable PD, LGD and EADs assigned to each customer/facility as the basis for the calculation. Program-managed portfolios use estimated loss rates based on recent past experience as the primary basis of the calculation.
Risk adjusted performance measurement
Business performance is measured using economic profit which incorporates charges for economic credit capital as well as capital for other risk types.
Pricing
Westpac prices loans so as to produce an acceptable return on the economic capital allocated to the loan. Returns include interest income and fees after expected credit losses and other costs.
Credit approval
For transaction-managed facilities the approval authorities are allocated based on the CRG with lower limits applicable for customers with a higher probability of default.
Program-managed facilities are approved on the basis of application scorecard outcomes and product based approval authorities.
Credit risk mitigation
See pages 37 and 38.
Control mechanisms for the credit risk rating system include:
• Westpac’s credit risk rating system is reviewed annually to ensure the rating criteria and procedures are applicable to the current portfolio and external conditions;
• the BRMC monitors the risk profile, performance and management of Westpac’s credit portfolio and development and review of key credit risk policies;
• all models materially impacting the risk rating process are reviewed annually in accordance with Westpac’s model risk policy;
• Portfolio Risk Review undertake an annual end-to-end technical and operational review of the overall process; and
• specific credit risk estimates (including PD, LGD and EAD levels) are overseen, reviewed annually and approved by the Credit Risk Estimates Committee (a sub committee of CREDCO).
1 Westpac uses economic capital as the basis for risk-adjusted decision making across the Group. Westpac allows differences between economic and regulatory capital where such differences drive better medium term to long term business decisions.
29
5. CREDIT RISK APS 330 Prudential Disclosure Sep 2008
Description of internal ratings process, by portfolio Table 6 (c)
Transaction-managed portfolio
Process for assignment and approval of individual customer PDs and facility LGDs
Line business unit representatives recommend the CRG and facility LGDs under the guidance of criteria set out in established credit policies. Each CRG is associated with an estimated probability of default (PD).
Credit officers independently evaluate the recommendations, and approve the final customer risk grade and facility LGDs. Credit officers may override line business unit recommendations.
An expert judgement decisioning process is employed to evaluate CRG, and the outputs of various risk grading models are used as one of several inputs into that process. For property lending, the risk grade decision is primarily model driven, and credit officer approved overrides of the model recommendations are rare.
For on-going exposures to transaction-managed customers, risk grades and facility LGDs are required to be reviewed at least annually, but also whenever material changes occur.
Description of permitted material deviations from the reference definition of default and segments affected
No material deviation from the reference definition of default is permitted.
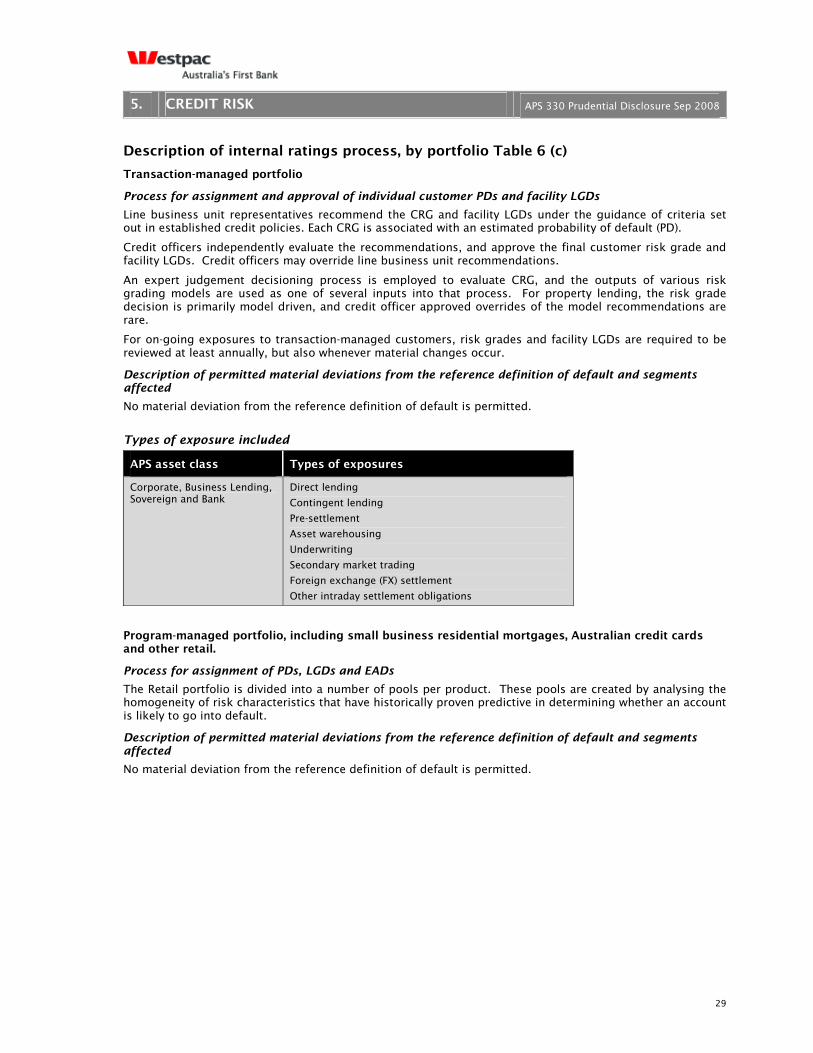
Types of exposure included
APS asset class Types of exposures
Corporate, Business Lending, Sovereign and Bank
Direct lending
Contingent lending
Pre-settlement
Asset warehousing
Underwriting
Secondary market trading
Foreign exchange (FX) settlement
Other intraday settlement obligations
Program-managed portfolio, including small business residential mortgages, Australian credit cards and other retail.
Process for assignment of PDs, LGDs and EADs
The Retail portfolio is divided into a number of pools per product. These pools are created by analysing the homogeneity of risk characteristics that have historically proven predictive in determining whether an account is likely to go into default.
Description of permitted material deviations from the reference definition of default and segments affected
No material deviation from the reference definition of default is permitted.
30
5. CREDIT RISK APS 330 Prudential Disclosure Sep 2008
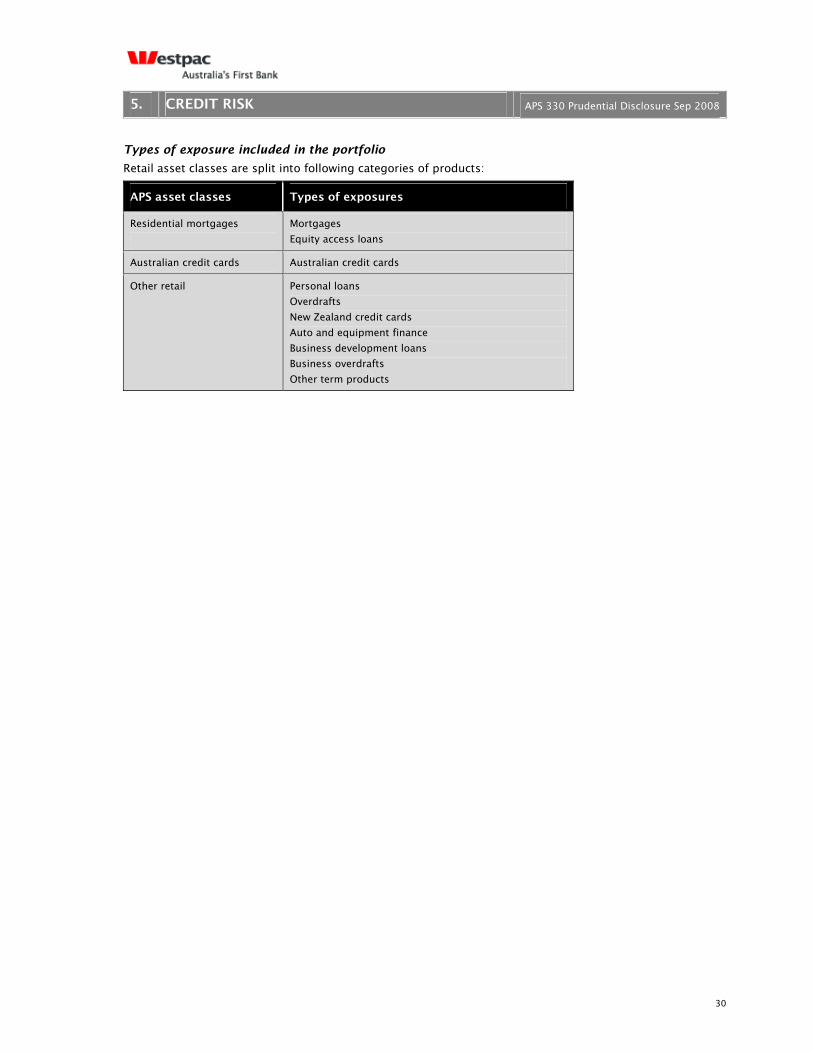
Types of exposure included in the portfolio
Retail asset classes are split into following categories of products:
APS asset classes Types of exposures
Residential mortgages
Mortgages
Equity access loans
Australian credit cards Australian credit cards
Other retail Personal loans
Overdrafts
New Zealand credit cards
Auto and equipment finance
Business development loans
Business overdrafts
Other term products

31
5. CREDIT RISK APS 330 Prudential Disclosure Sep 2008
Table 6 (d) Disclosures for portfolios subject to IRB approaches
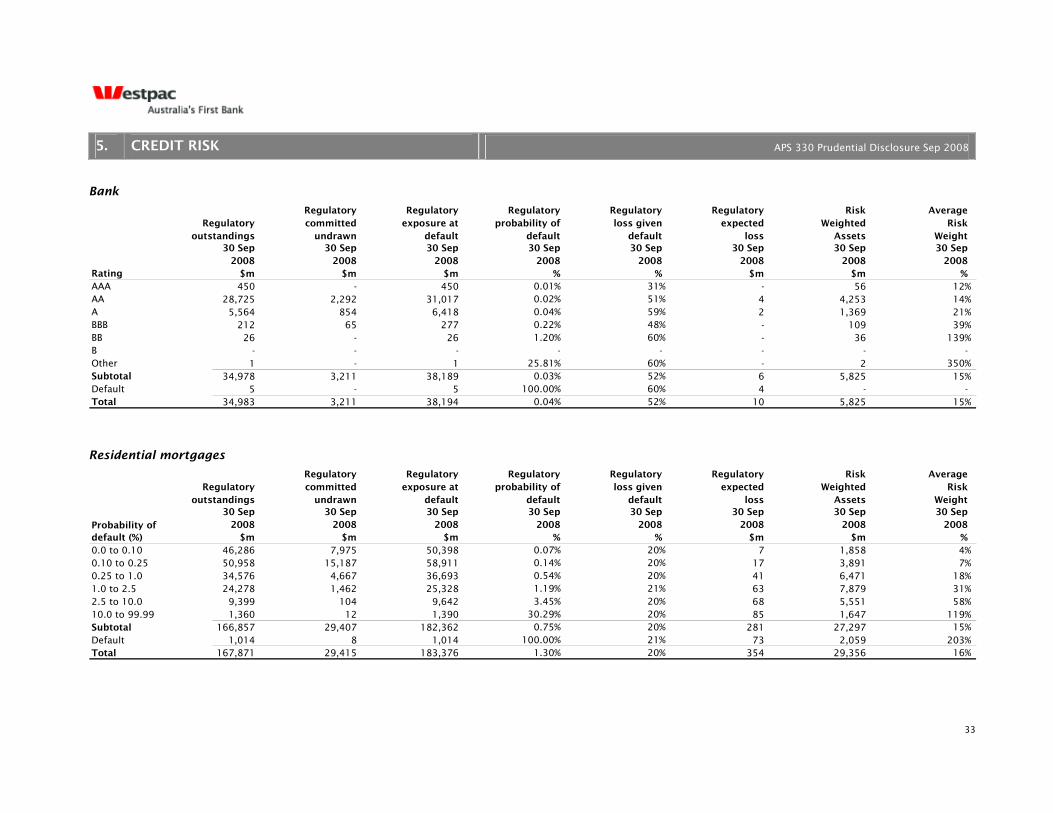
Westpac has classified its transaction-managed exposures by the external credit rating to which the internally assigned credit risk grade aligns. Because there is a many-to-one relationship between internal ratings and external grades, probability of default will vary from portfolio to portfolio for the same rating. Westpac’s program-managed exposures are classified by PD band. The average PD within a band likewise varies from portfolio to portfolio.
For non-defaulted exposures, Regulatory expected loss is defined as the product of EAD, PD and LGD. For defaulted exposures, Regulatory expected loss is based upon best estimates of loss. Expected loss is calculated at the facility level and then aggregated. However, multiplying the aggregates of the EAD, PD and LGD, as reported in the tables below (e.g. 22,487 x 0.05% x 46%), does not equal the aggregate Regulatory expected loss (6) because the product of two averages does not equal the average of a product.
All exposures described in table 6 reflect the Westpac consolidated banking group with all foreign currency exposures converted into Australian dollars.
Corporate
Regulatory Regulatory Regulatory Regulatory Regulatory Risk Average Regulatory committed exposure at probability of loss given expected Weighted Risk
outstandings undrawn default default default loss Assets Weight 30 Sep 30 Sep 30 Sep 30 Sep 30 Sep 30 Sep 30 Sep 30 Sep
2008 2008 2008 2008 2008 2008 2008 2008 Rating $m $m $m % % $m $m % AAA 830 565 1,395 0.01% 36% - 176 13% AA 4,540 2,203 6,743 0.02% 33% 1 570 8% A 14,678 7,809 22,487 0.05% 46% 6 4,224 19% BBB 31,139 15,462 46,601 0.26% 47% 56 22,442 48% BB 11,731 4,058 15,789 1.25% 42% 83 15,151 96% B 169 98 267 3.27% 42% 4 343 129% Other 1,379 342 1,721 17.31% 52% 168 4,731 275% Subtotal 64,466 30,537 95,003 0.67% 45% 318 47,637 50% Default 305 5 310 100.00% 56% 149 845 272% Total 64,771 30,542 95,313 0.99% 45% 467 48,482 51%
32
5. CREDIT RISK APS 330 Prudential Disclosure Sep 2008
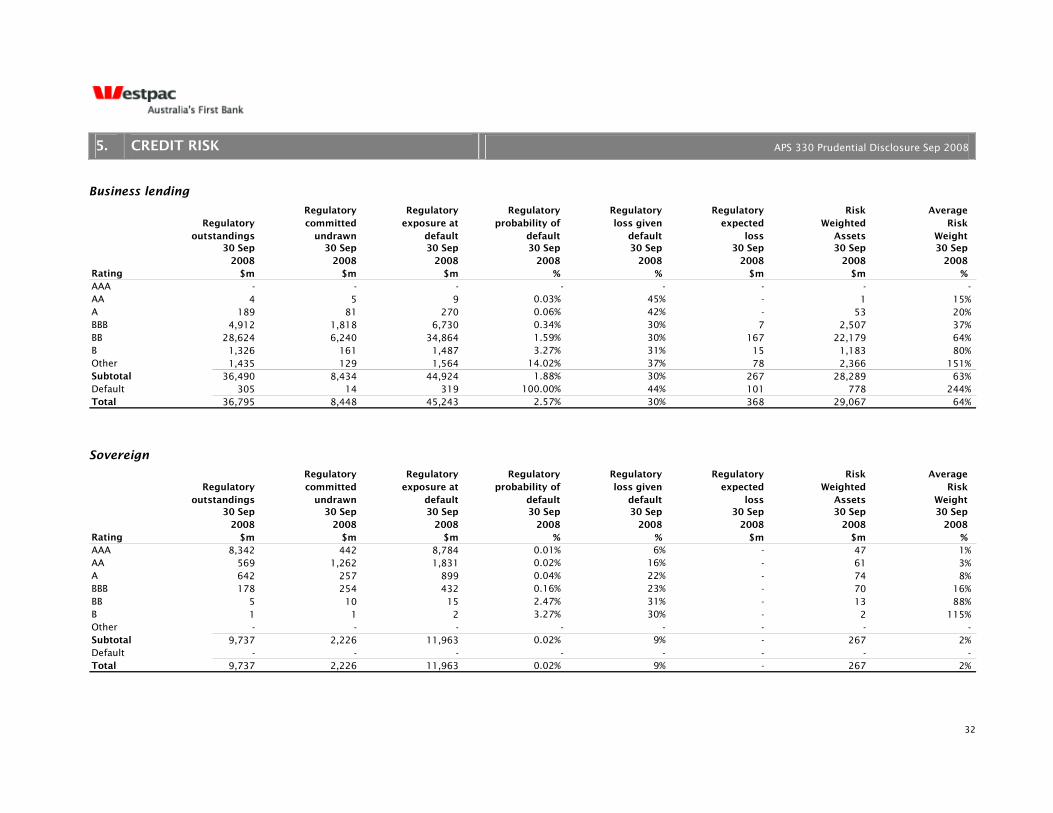
Business lending
Regulatory Regulatory Regulatory Regulatory Regulatory Risk Average Regulatory committed exposure at probability of loss given expected Weighted Risk
outstandings undrawn default default default loss Assets Weight 30 Sep 30 Sep 30 Sep 30 Sep 30 Sep 30 Sep 30 Sep 30 Sep
2008 2008 2008 2008 2008 2008 2008 2008 Rating $m $m $m % % $m $m % AAA - - - - - - - -AA 4 5 9 0.03% 45% - 1 15% A 189 81 270 0.06% 42% - 53 20% BBB 4,912 1,818 6,730 0.34% 30% 7 2,507 37% BB 28,624 6,240 34,864 1.59% 30% 167 22,179 64% B 1,326 161 1,487 3.27% 31% 15 1,183 80% Other 1,435 129 1,564 14.02% 37% 78 2,366 151% Subtotal 36,490 8,434 44,924 1.88% 30% 267 28,289 63% Default 305 14 319 100.00% 44% 101 778 244% Total 36,795 8,448 45,243 2.57% 30% 368 29,067 64%
Sovereign
Regulatory Regulatory Regulatory Regulatory Regulatory Risk Average Regulatory committed exposure at probability of loss given expected Weighted Risk
outstandings undrawn default default default loss Assets Weight 30 Sep 30 Sep 30 Sep 30 Sep 30 Sep 30 Sep 30 Sep 30 Sep
2008 2008 2008 2008 2008 2008 2008 2008 Rating $m $m $m % % $m $m % AAA 8,342 442 8,784 0.01% 6% - 47 1% AA 569 1,262 1,831 0.02% 16% - 61 3% A 642 257 899 0.04% 22% - 74 8% BBB 178 254 432 0.16% 23% - 70 16% BB 5 10 15 2.47% 31% - 13 88% B 1 1 2 3.27% 30% - 2 115% Other - - - - - - - -Subtotal 9,737 2,226 11,963 0.02% 9% - 267 2% Default - - - - - - - -Total 9,737 2,226 11,963 0.02% 9% - 267 2%
33
5. CREDIT RISK APS 330 Prudential Disclosure Sep 2008
Bank
Regulatory Regulatory Regulatory Regulatory Regulatory Risk Average Regulatory committed exposure at probability of loss given expected Weighted Risk
outstandings undrawn default default default loss Assets Weight 30 Sep 30 Sep 30 Sep 30 Sep 30 Sep 30 Sep 30 Sep 30 Sep
2008 2008 2008 2008 2008 2008 2008 2008 Rating $m $m $m % % $m $m % AAA 450 - 450 0.01% 31% - 56 12% AA 28,725 2,292 31,017 0.02% 51% 4 4,253 14% A 5,564 854 6,418 0.04% 59% 2 1,369 21% BBB 212 65 277 0.22% 48% - 109 39% BB 26 - 26 1.20% 60% - 36 139% B - - - - - - - - Other 1 - 1 25.81% 60% - 2 350% Subtotal 34,978 3,211 38,189 0.03% 52% 6 5,825 15% Default 5 - 5 100.00% 60% 4 - - Total 34,983 3,211 38,194 0.04% 52% 10 5,825 15%
Residential mortgages
Regulatory Regulatory Regulatory Regulatory Regulatory Risk Average Regulatory committed exposure at probability of loss given expected Weighted Risk
outstandings undrawn default default default loss Assets Weight 30 Sep 30 Sep 30 Sep 30 Sep 30 Sep 30 Sep 30 Sep 30 Sep
2008 2008 2008 2008 2008 2008 2008 2008 $m $m $m % % $m $m %
0.0 to 0.10 46,286 7,975 50,398 0.07% 20% 7 1,858 4% 0.10 to 0.25 50,958 15,187 58,911 0.14% 20% 17 3,891 7% 0.25 to 1.0 34,576 4,667 36,693 0.54% 20% 41 6,471 18% 1.0 to 2.5 24,278 1,462 25,328 1.19% 21% 63 7,879 31% 2.5 to 10.0 9,399 104 9,642 3.45% 20% 68 5,551 58% 10.0 to 99.99 1,360 12 1,390 30.29% 20% 85 1,647 119% Subtotal 166,857 29,407 182,362 0.75% 20% 281 27,297 15% Default 1,014 8 1,014 100.00% 21% 73 2,059 203% Total 167,871 29,415 183,376 1.30% 20% 354 29,356 16%
Probability of default (%)

34
5. CREDIT RISK APS 330 Prudential Disclosure Sep 2008
Australian credit cards
Regulatory Regulatory Regulatory Regulatory Regulatory Risk Average Regulatory committed exposure at probability of loss given expected Weighted Risk
outstandings undrawn default default default loss Assets Weight 30 Sep 30 Sep 30 Sep 30 Sep 30 Sep 30 Sep 30 Sep 30 Sep
2008 2008 2008 2008 2008 2008 2008 2008 $m $m $m % % $m $m %
0.0 to 0.10 - - - - - - - -0.10 to 0.25 1,312 9,198 5,662 0.21% 66% 8 437 8% 0.25 to 1.0 1,189 3,841 3,382 0.44% 66% 10 481 14% 1.0 to 2.5 3,377 742 4,232 1.16% 66% 32 1,276 30% 2.5 to 10.0 1,229 756 1,626 4.58% 68% 51 1,317 81% 10.0 to 99.99 351 109 383 23.55% 69% 63 689 180% Subtotal 7,458 14,646 15,285 1.57% 66% 164 4,200 27% Default 68 8 68 100.00% 70% 64 - - Total 7,526 14,654 15,353 2.01% 66% 228 4,200 27%
Probability of default (%)
Other retail
Regulatory Regulatory Regulatory Regulatory Regulatory Risk Average Regulatory committed exposure at probability of loss given expected Weighted Risk
outstandings undrawn default default default loss Assets Weight 30 Sep 30 Sep 30 Sep 30 Sep 30 Sep 30 Sep 30 Sep 30 Sep
2008 2008 2008 2008 2008 2008 2008 2008 $m $m $m % % $m $m %
0.0 to 0.10 - - - - - - - -0.10 to 0.25 19 202 143 0.14% 86% - 41 29% 0.25 to 1.0 807 1,739 1,324 0.48% 66% 4 645 49% 1.0 to 2.5 1,158 354 1,348 1.51% 71% 15 1,188 88% 2.5 to 10.0 1,416 229 1,557 4.28% 71% 48 1,698 109% 10.0 to 99.99 327 23 376 22.61% 71% 61 618 164% Subtotal 3,727 2,547 4,748 3.76% 70% 128 4,190 88% Default 75 10 75 100.00% 71% 33 269 361% Total 3,802 2,557 4,823 5.25% 70% 161 4,459 92%
Probability of default (%)
35
5. CREDIT RISK APS 330 Prudential Disclosure Sep 2008
Small business
Regulatory Regulatory Regulatory Regulatory Regulatory Risk Average Regulatory committed exposure at probability of loss given expected Weighted Risk
outstandings undrawn default default default loss Assets Weight 30 Sep 30 Sep 30 Sep 30 Sep 30 Sep 30 Sep 30 Sep 30 Sep
2008 2008 2008 2008 2008 2008 2008 2008 $m $m $m % % $m $m %
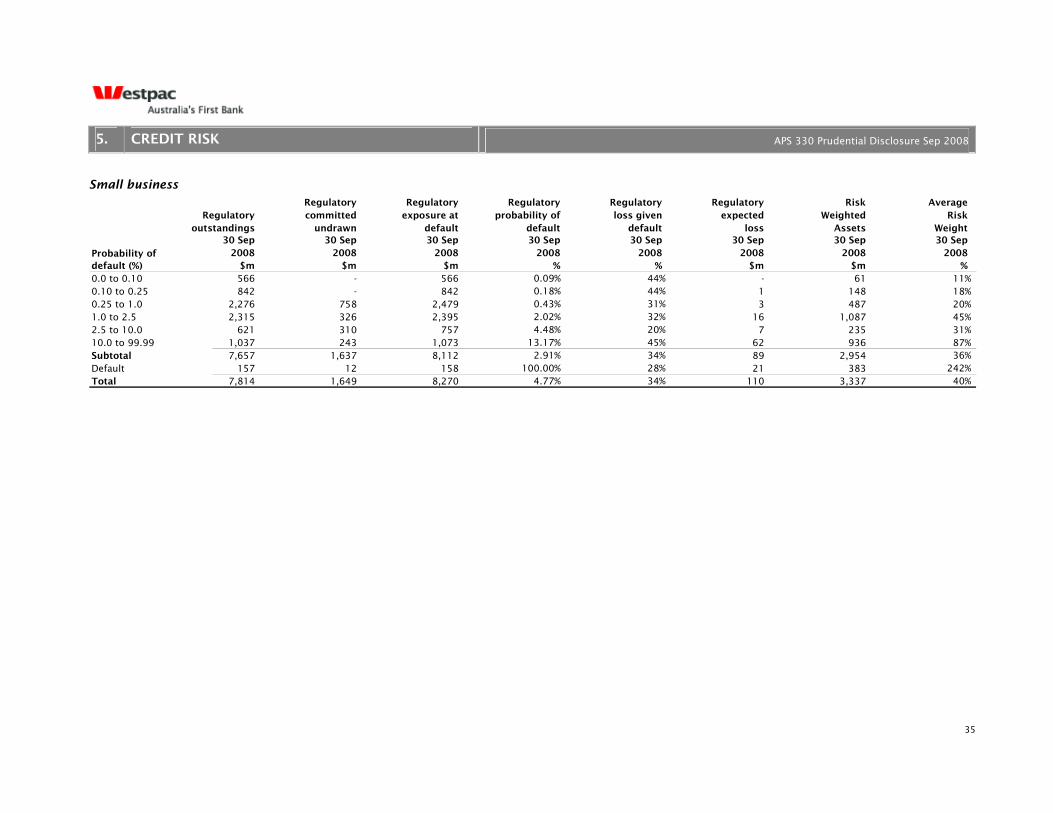
0.0 to 0.10 566 - 566 0.09% 44% - 61 11% 0.10 to 0.25 842 - 842 0.18% 44% 1 148 18% 0.25 to 1.0 2,276 758 2,479 0.43% 31% 3 487 20% 1.0 to 2.5 2,315 326 2,395 2.02% 32% 16 1,087 45% 2.5 to 10.0 621 310 757 4.48% 20% 7 235 31% 10.0 to 99.99 1,037 243 1,073 13.17% 45% 62 936 87% Subtotal 7,657 1,637 8,112 2.91% 34% 89 2,954 36% Default 157 12 158 100.00% 28% 21 383 242% Total 7,814 1,649 8,270 4.77% 34% 110 3,337 40%
Probability of default (%)
36
5. CREDIT RISK APS 330 Prudential Disclosure Sep 2008
Table 6 (e)
Actual Losses
Legal and Write-offs Write-offs recovery from Recoveries
direct costs provisions period ending 30 Sep 30 Sep 30 Sep 30 Sep 30 Sep
2008 2008 2008 2008 2008 $m $m $m $m $m
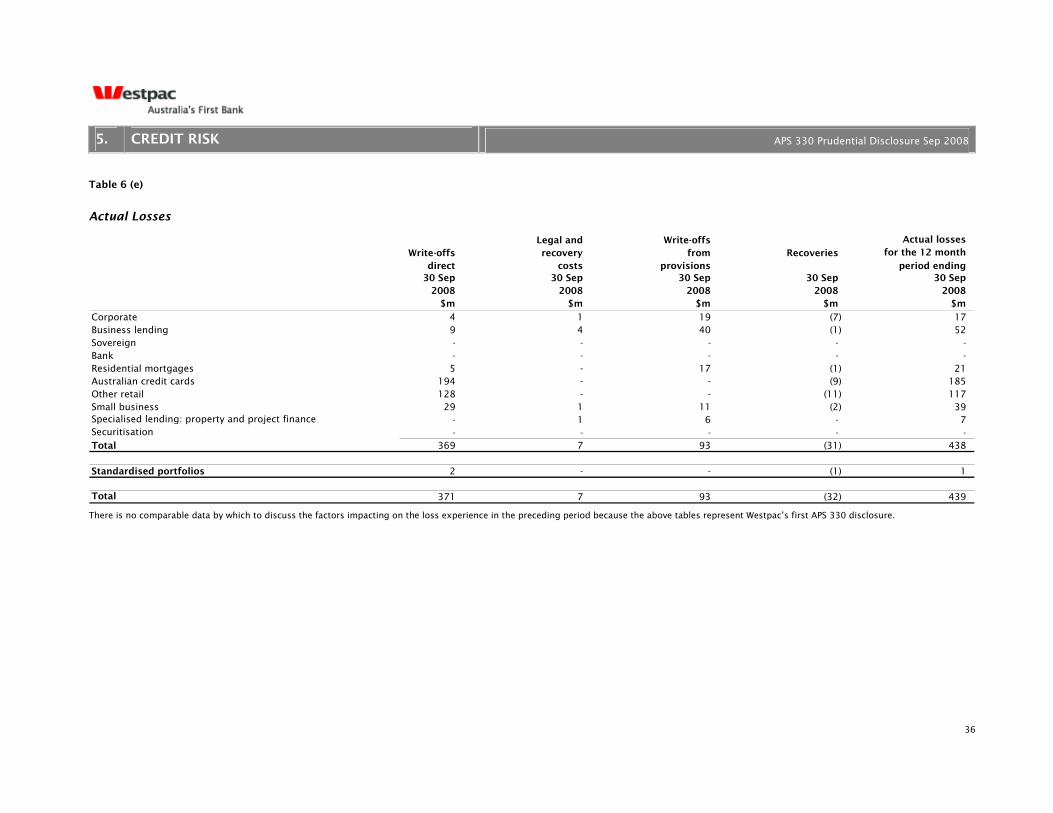
Corporate 4 1 19 (7) 17 Business lending 9 4 40 (1) 52 Sovereign - - - - - Bank - - - - - Residential mortgages 5 - 17 (1) 21 Australian credit cards 194 - - (9) 185 Other retail 128 - - (11) 117 Small business 29 1 11 (2) 39 Specialised lending: property and project finance - 1 6 - 7 Securitisation - - - - - Total 369 7 93 (31) 438
Standardised portfolios 2 - - (1) 1
Total 371 7 93 (32) 439
Actual losses for the 12 month
There is no comparable data by which to discuss the factors impacting on the loss experience in the preceding period because the above tables represent Westpac’s first APS 330 disclosure.
37
5. CREDIT RISK APS 330 Prudential Disclosure Sep 2008
Table 7 Credit risk mitigation disclosures
This table describes the way in which Westpac reduces its credit risk by using collateral, guarantees or credit derivatives.
Approach Westpac recognises credit risk mitigation only when formal legal documentation is held which establishes Westpac’s direct, irrevocable and unconditional recourse to the collateral or to an unrelated mitigation provider. The minimum standards to be met so that credit risk mitigation can be recognised are embodied in Westpac's credit rules and policies. All proposals for risk mitigation require a formal submission confirming compliance with these standards, for approval by an independent credit officer. Independent credit officer approval is also required for existing mitigation to be discontinued or withdrawn.
The amount of credit risk mitigation recognised is the face value of the mitigation instrument which is adjusted by the application of discounts for any maturity and/or currency mismatch with the underlying obligation, so that a discounted amount is recognised when calculating the residual exposure after mitigation.
For regulatory capital purposes Westpac addresses credit risk mitigation as follows:
• exposures secured by cash, eligible financial collateral or where protection is bought via credit linked notes, provided the proceeds are invested in either cash or eligible financial collateral are included at the gross value, with risk weighted assets for the portion thus secured calculated by applying a 5% LGD;
• exposures that are mitigated by way of eligible guarantees, standby letters of credit or similar instruments where Westpac has direct recourse to a third party on default or non–payment by the customer, or credit protection bought via credit default swaps where Westpac is entitled to recover either full principal or credit losses on occurrence of defined credit events, are treated under the double default rules (see Glossary) where the protection provider is a financial firm rated A or better;
• exposure mitigated by way of guarantee, letter of credit, credit default swap or similar instruments where the criteria in the preceding point are not met are treated under the substitution approach.
Structure and organisation The business unit responsible for managing the overall risk in Westpac’s corporate, sovereign and bank credit portfolios, Westpac Institutional Bank, uses a variety of instruments, including securitisation and single name credit default swaps to manage loan and counterparty risk. Westpac Institutional Bank includes a dedicated portfolio trading desk with the specific mandate of actively monitoring the underlying exposure and the offsetting hedge book.
Risk reporting Monthly reports are issued which detail risk mitigated facilities where the mitigation instruments mature within 30 – 90 days. An independent operational unit supervises this process to ensure that the relevant business and credit risk management units' decisions are taken and actions implemented in a timely fashion.
Specific reporting is maintained and monitored on the matching of hedges with underlying facilities, with any adjustments to hedges (e.g. unwinds or extensions) managed dynamically.
Balance sheet netting Risk reduction by way of current account set–offs is recognised for exposures to creditworthy customers domiciled in Australia and New Zealand only. Customers are required to enter into formal agreements giving Westpac the unfettered right to set–off gross credit and debit balances in their nominated accounts to determine Westpac’s net exposure within each of these two jurisdictions. Cross–border set–offs are not permitted.
Close–out netting is undertaken for off–balance sheet financial market transactions with counterparties with whom Westpac has entered into master dealing agreements which allow such netting in specified jurisdictions. Close-out netting effectively aggregates pre-settlement risk exposure at time of default, thus reducing overall exposure.

38
5. CREDIT RISK APS 330 Prudential Disclosure Sep 2008
Collateral valuation and management Westpac revalues all financial markets and associated collateral positions on a daily basis to monitor the net risk position, and has formal processes in place to ensure calls for collateral top–up or exposure reduction are made promptly. An independent operational unit has responsibility for monitoring these positions. The collaterisation arrangements are documented via the Support Annex of the International Swaps and Derivatives Association (ISDA) dealing agreement.
Types of collateral taken Westpac recognises the following as eligible collateral for credit risk mitigation by way of risk reduction:
• cash (Australian dollars (AUD), New Zealand dollars (NZD), United States dollars (USD), British pounds (GBP), or Euro (EUR) only);
• bonds issued by Australian Commonwealth, State and Territory government or their Public Sector Enterprises, provided these attract a zero risk weighting under APS 112;
• securities issued by other specified AAA-rated sovereign governments; and • credit–linked notes, provided the proceeds are invested in cash or other eligible collateral described
above.
Guarantor/credit derivative counterparties For mitigation by risk transfer, Westpac only recognises unconditional irrevocable guarantees or standby letters of credit issued by, or eligible credit derivative protection bought from, the following entities provided they are not related to the underlying obligor:
• sovereign entities; • public sector entities; • banks or securities firms; and • other entities with a minimum risk grade equivalent of A–.
Market and/or credit risk concentrations When Westpac uses credit risk mitigation techniques to reduce counterparty exposure, limits are applied to both gross (i.e. pre mitigation) and net exposure.
Furthermore, exposure is recorded against the provider of any credit risk mitigation and a limit framework prevents excessive concentration to such counterparties.
All exposures to risk transfer counterparties are separately approved under Westpac's usual credit approval process with the amount and tenor of mitigation recorded against the counterparty in Westpac's exposure management systems. The credit quality of mitigation providers is reviewed regularly in accordance with Westpac's usual periodic review processes.
Market risks arising from credit risk mitigation activities are managed similarly to market risks arising from any other trading activities.
These risks are managed under either the market risk banking book or trading book frameworks as appropriate.

39
5. CREDIT RISK APS 330 Prudential Disclosure Sep 2008
Credit risk mitigation disclosures
Table 7 (b) & (c)
Total exposure covered by collateral, credit derivatives and guarantees
Total exposure
Total to customers Eligible Exposures Exposures
exposure for which some financial covered by covered
credit risk is collateral guarantees by credit
mitigated derivatives
30 Sep 30 Sep 30 Sep 30 Sep 30 Sep 2008 2008 2008 2008 2008
Portfolio $m $m $m $m $m
Corporate 95,313 8,195 2,562 131 2,247 Sovereign 11,963 151 - 151 - Bank 38,194 12,721 4,908 357 564 Total 145,470 21,067 7,470 639 2,811

40
5. CREDIT RISK APS 330 Prudential Disclosure Sep 2008
Table 8 General disclosure for exposures related to counterparty credit risk
This table describes Westpac’s exposure to credit risk arising from its financial markets business.
Approach Westpac’s process for managing derivatives and counterparty credit risk is based on the assessment of the potential future credit risk Westpac is exposed to when dealing in financial markets (FM) products. Westpac simulates future market rates by imposing shocks on correlation and volatility factors and assessing the effect these shocks have on the mark to market value of Westpac’s positions. These simulated exposure numbers are then checked against pre–settlement risk limits which are set at the counterparty level.
Structure and organisation The Financial Markets and Treasury Credit management team is charged with managing the counterparty credit exposure arising from derivatives and treasury products.
Risk reporting Westpac actively reassesses and manages the counterparty credit exposure sourced from the derivatives business via an end of day Monte Carlo simulation of the derivatives portfolio that updates forecasts of potential future credit exposure via movements in market rates. This information is then loaded against the FM credit limit management system. Limit violations or excesses are segregated in a report which is actioned under strict timeframes by credit managers.
Risk mitigation Mitigation is achieved in a number of ways:
• the limit system monitors for breaches of the pre–determined limits with any violations being immediately highlighted to credit staff;
• Westpac has collateral agreements with its largest counterparties. The market value of the counterparty’s portfolio is used to recalculate the credit position at each end of day, with collateral being called for when certain pre–set limits are met;
• credit derivatives are used to mitigate credit exposure against certain counterparties; • incorporating right–to–breaks in Westpac’s contracts, effectively reducing the tenor of the risk; • signing ISDA netting agreements, thus allowing the exposure across a portfolio of trades to be netted; • regular marking to market and settling of the FX components of FX reset contracts; and • downgrade triggers in documentation that, if breached, require the counterparty to provide collateral.
Credit limits The risk management methodology for counterparty derivatives exposures is similar to the credit methodology for transactions-managed loans. The main difference is in the estimation of the EAD for derivative exposures.
EAD for derivative exposures is based on expected future exposure (EFE). EFE is calculated as the average of all positive to market values. EFE calculation takes into account eligible netting agreements. All EFE exposures are scaled up in order to capture the dependency between market values of transactions across counterparties, and the correlation between market and credit risks.
Counterparty credit limits are approved on an uncommitted and unadvised basis by independent credit officers. This follows an evaluation of each counterparty’s credit worthiness and establishing an agreed credit risk appetite for the nature and extent of prospective business.

41
5. CREDIT RISK APS 330 Prudential Disclosure Sep 2008
Securing collateral and establishing credit reserves Most collateral agreements negotiated by Westpac require daily reassessment of exposure positions in order to determine whether additional collateral must be called for. Under this process, the market value of the customer's portfolio is assessed daily with demands being sent out by the collateral team on the following day. The collateral received is subject to haircuts depending on type and maturity. In line with the requirements of AASB 139, counterparty credit risk takes into account the adjusted fair value of the derivative instrument involved.
Wrong–way risk exposures Wrong-way risk exposures using credit derivatives are controlled by only buying protection from highly rated counterparties. Wrong-way risk exposures refers to derivative transactions for which there is significant positive dependency between counterparty's default and the mark-to-market value of the transaction. There should be no obvious correlation between the protection seller and the customer (e.g. bought protection covering a government risk should not be bought from a bank or entity controlled or owned by that government). All transactions, including credit derivatives, are assessed by an independent credit officer who has the right to decline any transaction where they feel there is an unacceptably high correlation between ability to perform under the trade and the performance of the underlying counterparty.
Consequences of a downgrade in Westpac’s credit rating Where an outright threshold and minimum transfer amount are agreed, there will not be any impact on the amount of collateral posted by Westpac given a credit rating downgrade. Where the threshold and minimum transfer amount are tiered according to credit rating, the impact of Westpac being downgraded below AA would be; for a one notch downgrade, additional postings of USD 190m required; while for a two notch downgrade, additional postings would be approximately USD 950m.

42
6. SECURITISATION APS 330 Prudential Disclosure Sep 2008
6. SECURITISATION A securitisation is a financial structure where the cash flow from a pool of assets is used to service obligations to at least two different tranches or classes of creditors (typically holders of debt securities), with each class or tranche reflecting a different degree of credit risk (i.e. one class of creditors is entitled to receive payments from the pool before another class of creditors).
Securitisation transactions are generally grouped into two broad categories:
• traditional or true sale securitisations, which involve the legal transfer of ownership of the underlying asset pool to a third party; and
• synthetic transactions, where the ownership of the pool remains with the originator and only the credit risk of the pool is transferred to a third party, using credit derivatives or guarantees.
Table 9 Securitisation disclosures Approach Westpac’s involvement in securitisation activities ranges from a seller of own assets to an investor in third-party transactions and includes the provision of securitisation services and funding for clients wishing to access capital markets.
Securitisation of Westpac originated assets
Securitisation is a tool of funding, liquidity and capital management. Securitisation gives Westpac the ability to liquefy a pool of assets. Securitisation increases Westpac's wholesale funding capacity. In some cases securitised assets are removed from Westpac's calculation of Risk Weighted Assets.
Westpac may provide at arms length facilities to a securitisation trust. The facilities typically entered into include the provision of liquidity, funding, underwriting and derivative contracts. Westpac has also securitised assets for contingent liquidity purposes but in this case the exposures are treated as if they had not been securitised.
Securitisation in the management of Westpac’s credit portfolio
Westpac uses securitisation, including portfolio credit default swaps, to manage its corporate and institutional loan and counterparty credit risk portfolios. Single name credit default swaps are not treated as securitisations but as credit risk mitigation facilities as noted on page 37. Transactions are entered into to manage counterparty credit risk or concentration risks.
Provision of securitisation services, including funding and management of conduit vehicles
Westpac provides an array of services to clients wishing to access asset backed financing through securitisation. Those services include access to the Asset Backed Commercial Paper Market through Waratah, the Westpac sponsored securitisation conduit, the provision of warehouse and term funding of securitised assets; and arranging Asset Backed Bond issues. Westpac provides facilities to Waratah including liquidity, funding, underwriting, credit enhancement and derivative contracts.
Key Objectives
Securitisation of Westpac originated assets
The securitisation of Westpac's own assets achieves funding, liquidity and capital management objectives.
Securitisation in the management of Westpac’s credit portfolio
Westpac acts as principal in transactions and will buy and sell protection in order to meet its portfolio management objectives. Westpac also purchases securitisation exposure in order to earn income. All securitisation activity must follow Westpac’s credit approval processes.
Provision of securitisation services including funding and management of conduit vehicles
Westpac receives market-based fees in return for its services as trust manager, servicer, swap counterparty and facility provider and programme fees, interest margins and Bond distribution fees on warehouse and term funding facilities.
43
6. SECURITISATION APS 330 Prudential Disclosure Sep 2008
Westpac’s role in the securitisation process
Securitisation activity Role played by Westpac
Securitisation of Westpac originated assets
Asset originator
Swap provider
Servicer
Trust manager
Facility provider
Securitisation in the management of Westpac’s credit portfolio
Hedger – protection purchaser
Investor – protection seller
Provision of securitisation services including funding and management of conduit vehicles
Servicer
Swap counterparty
Funder
Liquidity facility provider
Structure and organisation
Securitisation of Westpac originated assets
Westpac’s Treasury operation is responsible for funding, liquidity and capital management.
Securitisation in the management of Westpac’s credit portfolio
Debt Markets is a business in Westpac. Westpac’s exposure arising from securitisation, including portfolio hedging, is managed by Debt Markets and integrated within Westpac’s normal risk reporting and management systems.
Provision of securitisation services including funding and management of conduit vehicles
These services are provided by the Debt Markets team. Exposure to client securitisations arises in the role of provider of liquidity, funding and derivative facilities.
Risk reporting
Credit exposure
Funding, liquidity and redraw facilities, swap arrangements and counterparty exposures are captured and monitored in key source systems along with other facilities/derivatives entered into by Westpac.
Operational risk exposure
The quarterly operational risk review process for Westpac includes the identification of risks, controls and key performance indicators in relation to all securitisation activity and services provided by Westpac or any of its subsidiaries.
Market risk exposure
Exposures arising from transactions with securitisation conduits and other counterparties are captured as part of Westpac’s traded and non-traded market risk reporting and limit management framework.
Liquidity risk exposure
Exposure to and the impact of securitisation transactions are managed under the Market and Liquidity Risk Management framework and are integrated into routine reporting for capital and liquidity positions, net interest margin analysis, balance sheet forecasting and funding scenario testing. The annual funding plan incorporates consideration of overall liquidity risk limits and the level of securitisation of Westpac originated assets.
44
6. SECURITISATION APS 330 Prudential Disclosure Sep 2008
Risk mitigation
Securitisation of Westpac originated assets
The interest rate and basis risks generated by Westpac’s provision of hedge arrangements to a Westpac Securitisation Trust are captured and managed in Westpac’s Asset and Liability Management framework. The liquidity risk generated by Westpac’s provision of liquidity and redraw facilities to Westpac Securitisation Trusts is captured and managed in accordance with Treasury's liquidity management policies along with all other contingent liquidity facilities.
Securitisation in the management of Westpac’s corporate and institutional credit portfolio
Transactions are approved in accordance with Westpac’s credit risk mitigation policy (see pages 37 and 38).
Provision of securitisation services including funding and management of conduit vehicles
All securitisation transactions are approved within the context of a dedicated securitisation credit policy that sets detailed transaction specific guidelines that regulate servicer counterparty risk appetite, transaction tenor, asset class, third party credit support and portfolio quality. This policy is applied in conjunction with other credit and market risk policies that govern the provision of derivative and other services that support securitisation transactions.
In particular, credit hedging transactions are subject to policy (see pages 37 and 38). Any interest rate or currency hedging is subject to counterparty credit risk management (see pages 40 and 41) and market risk management (see pages 52 and 53) policies and processes.
Regulatory capital approaches The regulatory capital treatment of all securitisation exposures is undertaken in accordance with Australian Prudential Standard APS 120 Securitisation. The approaches employed include the Ratings Based Approach (RBA), where the regulator provides risk weights that are matched to external credit ratings, and the Internal Assessment Approach (IAA), which largely mirrors the ratings based approach. The Supervisory Formula (SF) which determines a capital charge based on the attributes of the securitisation structure through an industry standard formula with pre-determined parameters, is used where the Ratings Based and Internal Assessment approaches are deemed inappropriate.
Securitisation of Westpac originated assets
The assets sold to a Westpac Securitisation Trust are excluded from Westpac’s calculation of risk-adjusted assets if the provisions of APS 120 are satisfied. For capital adequacy purposes the interest rate and basis swaps; currency swaps; servicing functions; and liquidity and redraw facilities all satisfy the relevant provisions of APS 120.
Westpac applies the RBA and the SF when determining regulatory capital treatments for securitisation exposures.
Securitisation in the management of Westpac’s credit portfolio
Unless Westpac makes an election under APS 120, the underlying assets subject to synthetic securitisation are excluded from Westpac’s calculation of risk adjusted assets. They are replaced with the risk weight of the applicable securitisation instrument, usually a credit default swap or underlying cash collateral. Westpac applies the RBA and the SF when determining regulatory capital treatments for securitisation exposures arising from the management of its credit portfolio.
Provision of securitisation services including funding and management of conduit services
Westpac applies the RBA and the IAA when determining regulatory capital requirements for the facilities associated with the provision of securitisation services to conduit vehicles.

45
6. SECURITISATION APS 330 Prudential Disclosure Sep 2008
Westpac’s accounting policies for securitisation activities
Securitisation of Westpac originated assets
The assets sold by Westpac to a Westpac Securitisation Trust remain on Westpac's balance sheet for accounting purposes.
Securitisation in the management of Westpac’s credit portfolio
For risk mitigation using synthetic securitisation, the underlying assets remain on Westpac's balance sheet for accounting purposes. The accounting treatment of the assets will depend on their nature. They could include loans and receivables, available for sale securities or derivatives. The most common form of synthetic securitisation is via a credit default swap, which is treated as a derivative and recognised in the profit and loss statement at fair value.
For investment in securitisation exposures, if the instrument includes a credit default swap, the exposure will be fair valued through the profit and loss statement. Other securitisation exposures will be fair valued through the balance sheet unless Westpac makes an election to the time of purchase to fair value through the profit and loss statement.
Provision of securitisation services including funding and management of conduit vehicles
Fee income from these services is recognised on an accrual basis. Liquidity and funding facilities are treated as commitments to provide finance, with fee and margin income recognised on an accrual basis. Warehouse and term funding facilities are treated as loans.
External credit assessment institutions (ECAIs) used for securitisations The ECAIs that can be used by Westpac are Fitch, Moody’s and Standard & Poor’s.

46
6. SECURITISATION APS 330 Prudential Disclosure Sep 2008
Table 9 (d) & (e)
Total assets securitised and the amount of impaired/past due assets and losses
These tables describe the assets Westpac has securitised.
Securitisation of Westpac originated assets
Impaired assets Total past due assets ADI recognised losses relating to exposures from exposures from exposures
Traditional Synthetic securitised securitised securitised 30 Sep 30 Sep 30 Sep 30 Sep 30 Sep
2008 2008 2008 2008 2008 Underlying asset $m $m $m $m $m Residential mortgages 14,168 - 1 34 - Credit cards - - - - - Auto and equipment finance - - - - - Business lending - - - - - Other - - - - - Total 14,168 - 1 34 -
Total outstanding exposures securitised
Securitisation in the management of Westpac’s credit portfolio
Impaired assets Total past due assets ADI recognised losses relating to exposures from exposures from exposures
Traditional Synthetic securitised securitised securitised 30 Sep 30 Sep 30 Sep 30 Sep 30 Sep
2008 2008 2008 2008 2008 Underlying asset $m $m $m $m $m Residential mortgages - - - - - Credit cards - - - - - Auto and equipment finance - - - - - Business lending - - - - - Other - - - - - Total - - - - -
Total outstanding exposures securitised
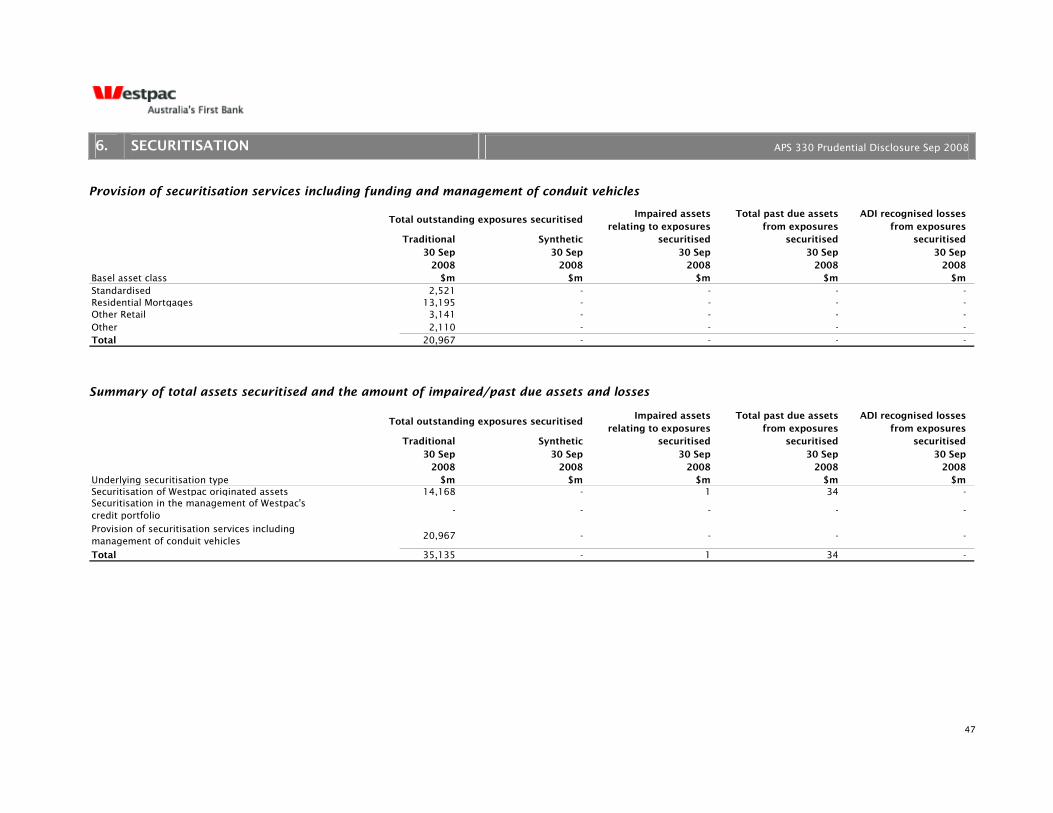
47
6. SECURITISATION APS 330 Prudential Disclosure Sep 2008
Provision of securitisation services including funding and management of conduit vehicles
Impaired assets Total past due assets ADI recognised losses relating to exposures from exposures from exposures
Traditional Synthetic securitised securitised securitised 30 Sep 30 Sep 30 Sep 30 Sep 30 Sep
2008 2008 2008 2008 2008 Basel asset class $m $m $m $m $m Standardised 2,521 - - - - Residential Mortgages 13,195 - - - - Other Retail 3,141 - - - - Other 2,110 - - - - Total 20,967 - - - -
Total outstanding exposures securitised
Summary of total assets securitised and the amount of impaired/past due assets and losses
Impaired assets Total past due assets ADI recognised losses relating to exposures from exposures from exposures
Traditional Synthetic securitised securitised securitised 30 Sep 30 Sep 30 Sep 30 Sep 30 Sep
2008 2008 2008 2008 2008 Underlying securitisation type $m $m $m $m $m Securitisation of Westpac originated assets 14,168 - 1 34 - Securitisation in the management of Westpac's credit portfolio - - - - -
Provision of securitisation services including management of conduit vehicles 20,967 - - - -
Total 35,135 - 1 34 -
Total outstanding exposures securitised

48
6. SECURITISATION APS 330 Prudential Disclosure Sep 2008
Table 9 (f)
This table describes Westpac’s credit risk exposure arising from its participation in the securitisation business.
Aggregate amount of securitisation exposures, broken down by exposure type
Securitisation of Securitisation in the Provision of securitisation Total by Westpac originated management of Westpac's services including funding securitisation
assets credit porfolio and management of type conduit vehicles
30 Sep 30 Sep 30 Sep 30 Sep 2008 2008 2008 2008
Securitisation exposure type $m $m $m $m
Liquidity facilities 91 - 6,397 6,488 Funding facilities 170 - 13,951 14,121 Underwriting facilities - - - - Credit enhancements - - 413 413 Derivative transactions 10 - - 10 Other - 1,353 206 1,559 Total 271 1,353 20,967 22,591

49
6. SECURITISATION APS 330 Prudential Disclosure Sep 2008
Table 9 (g)
Aggregate amount of securitisation exposures and the associated regulatory capital charges.
Securitisation of Westpac originated assets
Regulatory exposure Risk Weighted Total capital at default Assets required
30 Sep 30 Sep 30 Sep 2008 2008 2008
Risk weight band $m $m $m
Less than or equal to 10% 271 22 2 Greater than 10 - 20% - - - Greater than 20 - 30% - - - Greater than 30 - 50% - - - Greater than 50 - 75% - - - Greater than 75 - 100% - - - Greater than 100 - 250% - - - Greater than 250 - 425% - - - Greater than 425 - 650% - - - Greater than 650 - 1250% - - - Greater than or equal to 1250% - - - Total 271 22 2
Total capital required is derived by multiplying Risk Weighted Assets by 8%.
Securitisation in the management of Westpac's credit portfolio
Regulatory exposure Risk Weighted Total capital at default Assets required
30 Sep 30 Sep 30 Sep 2008 2008 2008
Risk weight band $m $m $m
Less than or equal to 10% 1,106 77 6 Greater than 10 - 20% 31 4 - Greater than 20 - 30% - - - Greater than 30 - 50% - - - Greater than 50 - 75% - - - Greater than 75 - 100% 66 51 4 Greater than 100 - 250% - - - Greater than 250 - 425% 150 542 44 Greater than 425 - 650% - - - Greater than 650 - 1250% - - - Greater than or equal to 1250% - - - Total 1,353 674 54
Total capital required is derived by multiplying Risk Weighted Assets by 8%.
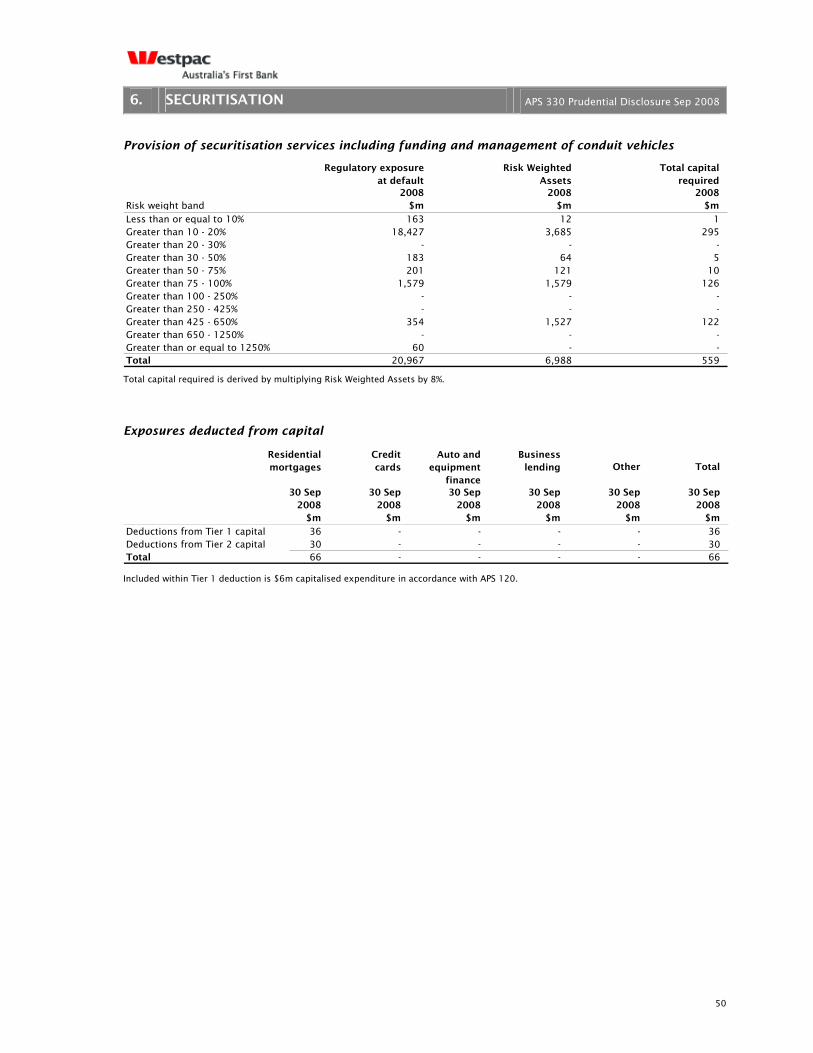
50
6. SECURITISATION APS 330 Prudential Disclosure Sep 2008
Provision of securitisation services including funding and management of conduit vehicles
Regulatory exposure Risk Weighted Total capital at default Assets required
2008 2008 2008 Risk weight band $m $m $m
Less than or equal to 10% 163 12 1 Greater than 10 - 20% 18,427 3,685 295 Greater than 20 - 30% - - - Greater than 30 - 50% 183 64 5 Greater than 50 - 75% 201 121 10 Greater than 75 - 100% 1,579 1,579 126 Greater than 100 - 250% - - - Greater than 250 - 425% - - - Greater than 425 - 650% 354 1,527 122 Greater than 650 - 1250% - - - Greater than or equal to 1250% 60 - - Total 20,967 6,988 559
Total capital required is derived by multiplying Risk Weighted Assets by 8%.
Exposures deducted from capital
Residential Credit Auto and Business mortgages cards equipment lending
finance 30 Sep 30 Sep 30 Sep 30 Sep 30 Sep 30 Sep
2008 2008 2008 2008 2008 2008 $m $m $m $m $m $m
Deductions from Tier 1 capital 36 - - - - 36 Deductions from Tier 2 capital 30 - - - - 30 Total 66 - - - - 66
Total Other
Included within Tier 1 deduction is $6m capitalised expenditure in accordance with APS 120.

51
6. SECURITISATION APS 330 Prudential Disclosure Sep 2008
Table 9 (h)
Securitisations subject to early amortisation treatment
There are no securitisations subject to early amortisation treatment.
Table 9 (j)
Underlying exposures originated into a securitisation and the recognised gain or loss
Amount securitised Recognised gain during period or loss on sale
30 Sep 30 Sep 2008 2008
Recent securitisation activity $m $m
Residential mortgages 1,427 - Credit cards - - Auto and equipment finance - - Business lending - - Other - - Total 1,427 -
New facilities provided to securitisation schemes
Notional amount of new facilities provided
12 months to 30 Sep
2008 New facilities provided $m
Liquidity facilities 8 Funding facilities 4,756 Underwriting facilities - Credit enhancements - Derivative transactions - Other - Total 4,764

52
7. MARKET RISK APS 330 Prudential Disclosure Sep 2008
7. MARKET RISK Westpac’s exposure to market risk arises out of its Financial Markets and Group Treasury trading activities. This is quantified for regulatory capital purposes using both the standardised and the internal models approach, details of which are provided below. Westpac’s exposure to Interest Rate Risk in the Banking Book is described in Chapter 10.
Table 10 Market risk – disclosure for ADI’s using the standardised approach
Table 11 Market risk – disclosure for ADI’s using the internal models approach for trading portfolios
Approach Trading activities are controlled by a Board–approved market risk framework that incorporates Board–approved Value at Risk (VaR) limits. VaR is the primary mechanism for measuring and controlling market risk. Market risk is managed using VaR and structural risk limits (including volume limits and basis point value limits) in conjunction with scenario analysis and stress testing. Market risk limits are allocated to business management based upon business strategies and experience, in addition to market liquidity and concentration risks. All trades are marked to market daily, using independently sourced or reviewed rates. Rates that have limited independent sources are reviewed at least on a monthly basis.
Financial Markets’ trading activity represents dealings that encompass book running and distribution activity. The types of market risk arising from trading activity include interest rate, foreign exchange, commodity, equity price, credit spread and volatility risk.
Group Treasury’s trading activity represents dealings that include the management of interest rate, foreign exchange and credit spread risks associated with the wholesale funding task, liquid asset portfolios and FX repatriations.
VaR limits
Market risks arising from trading activities are primarily measured using an historical simulation based VaR methodology. VaR is the potential loss in earnings from adverse market movements and is calculated over a 1-day time horizon at a 99% confidence level using a minimum of 1 year of historical rate data. VaR takes account of all material market variables that may cause a change in the value of the trading portfolio, including interest rates, foreign exchange rates, price changes, volatility, and the correlation among these variables.
The BRMC has approved separate market risk VaR limits for the trading activities of Financial Markets and Group Treasury.
Backtesting
Daily backtesting of VaR results is performed to ensure that model integrity is maintained. A review of both the potential profit and loss outcomes is also undertaken to monitor any skew created by the historical data.
Stress testing
Daily stress testing against pre–determined scenarios is carried out to analyse potential losses beyond the 99% confidence level. An escalation framework around selective stress tests is approved by the Group Market Risk Committee (MARCO).
Profit and loss notification framework
The BRMC has approved a profit and loss notification framework. Included in this framework are levels of escalation in accordance with the size of the profit or loss. Triggers are applied to both a 1–day and a rolling 20–day cumulative total.
Structure and organisation
A separate independent Market Risk Management unit is responsible for the daily measurement and monitoring of market risk exposures. This unit performs daily stress and scenario tests on the trading portfolios to quantify the impact of extreme or unexpected movements in market factors. Stress and scenario tests include historical market movements, tests defined by one of the market risk committees or management and independent scenarios developed by Westpac’s economics department.

53
7. MARKET RISK APS 330 Prudential Disclosure Sep 2008
Risk reporting
Daily monitoring of current exposure and limit utilisation is conducted independently by the Market Risk Management unit, which monitors market risk exposures against VaR and structural limits. Daily VaR position reports are produced by risk type, by product lines and by geographic region. These are supplemented by structural risk reporting, advice of profit and loss trigger levels and stress test escalation trigger points. Model accreditation has been granted by APRA for the use of the internal model for the determination of regulatory capital for the key classes of interest rate (general market), foreign exchange, commodity and equity (including specific risk) risks. Specific risk refers to the variations in individual security prices that cannot be explained by general market movements and event and default risk. Interest rate specific risk (specific issuer risk) is calculated using the standardised approach and is disclosed in Table 10 (b).
Risk mitigation
Market risk positions are managed by the trading desks consistent with delegated trading and product authorities. Risks are consolidated into portfolios based on product and risk type. Risk management is carried out by suitably qualified personnel with varying levels of seniority commensurate with the nature and scale of market risks under management.
The following controls allow monitoring by management:
• trading authorities and responsibilities are clearly delineated at all levels to ensure accountability; • a structured system of limits and reporting of exposures; • all new products and significant product variations undergo a rigorous approval process to ensure
business risks have been identified prior to launch; • models that are used to determine risk or profit and loss for Westpac’s accounts are independently
reviewed; • duties are segregated to ensure that employees involved in the origination, processing and valuation of
transactions operate under separate reporting lines, minimising the opportunity for collusion; and • legal counsel approves documentation to ensure it complies with relevant laws and regulations.
In addition, internal audit independently review compliance with policies, procedures and limits.
Segregation of duties is a significant feature of Westpac's internal controls. Separation of persons executing transactions from those responsible for processing contracts, confirming transactions, settling transactions, approving the accounting methodology or entries and performing revaluations minimises opportunities for fraud.
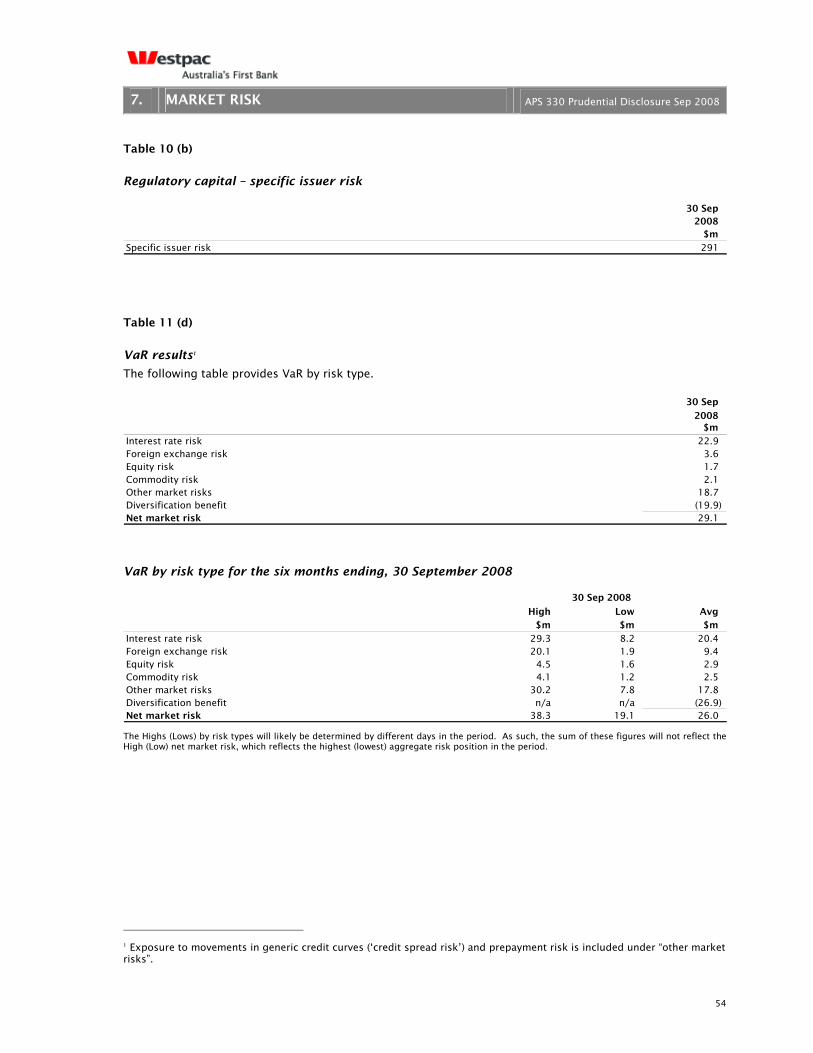
54
7. MARKET RISK APS 330 Prudential Disclosure Sep 2008
Table 10 (b)
Regulatory capital – specific issuer risk
30 Sep 2008
$m
Specific issuer risk 291
Table 11 (d)
VaR results1
The following table provides VaR by risk type.
30 Sep
2008 $m
Interest rate risk 22.9 Foreign exchange risk 3.6 Equity risk 1.7 Commodity risk 2.1 Other market risks 18.7 Diversification benefit (19.9) Net market risk 29.1
VaR by risk type for the six months ending, 30 September 2008
High Low Avg
$m $m $m
Interest rate risk 29.3 8.2 20.4 Foreign exchange risk 20.1 1.9 9.4 Equity risk 4.5 1.6 2.9 Commodity risk 4.1 1.2 2.5 Other market risks 30.2 7.8 17.8 Diversification benefit n/a n/a (26.9) Net market risk 38.3 19.1 26.0
30 Sep 2008
The Highs (Lows) by risk types will likely be determined by different days in the period. As such, the sum of these figures will not reflect the High (Low) net market risk, which reflects the highest (lowest) aggregate risk position in the period.
1 Exposure to movements in generic credit curves (‘credit spread risk’) and prepayment risk is included under “other market risks”.
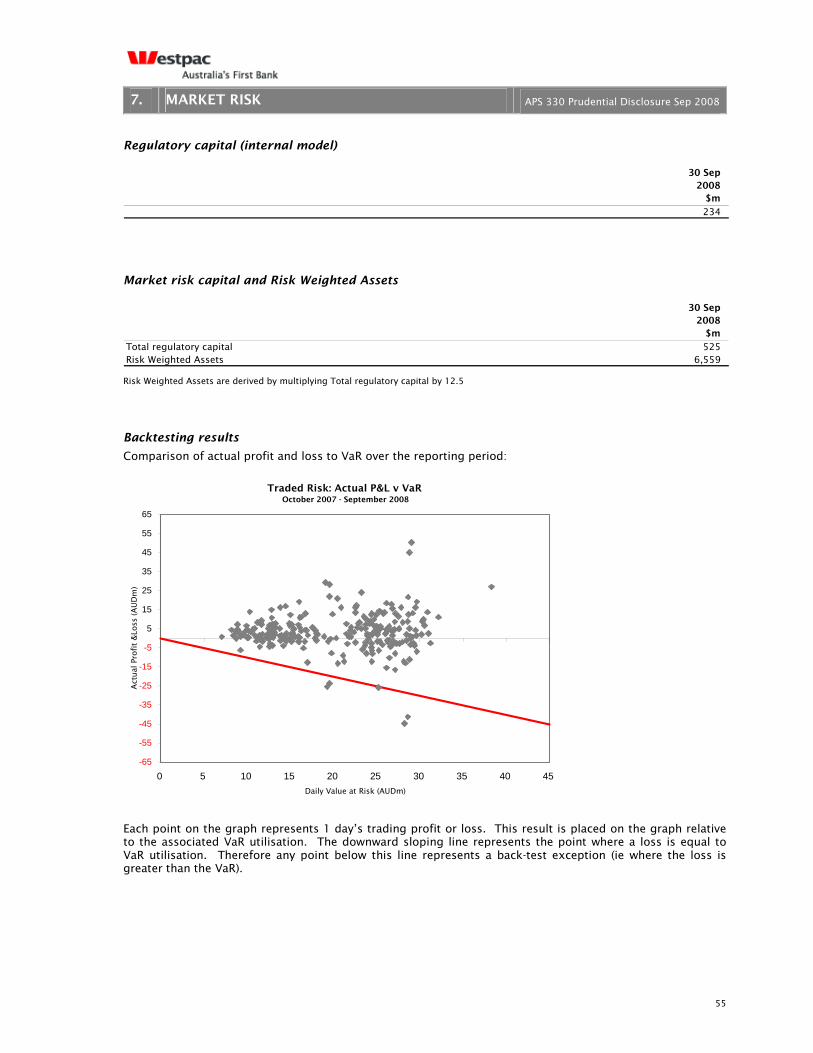
55
7. MARKET RISK APS 330 Prudential Disclosure Sep 2008
Regulatory capital (internal model)
30 Sep 2008
$m
234
Market risk capital and Risk Weighted Assets
30 Sep 2008
$m
Total regulatory capital 525 Risk Weighted Assets 6,559
Risk Weighted Assets are derived by multiplying Total regulatory capital by 12.5
Backtesting results
Comparison of actual profit and loss to VaR over the reporting period:
Traded Risk: Actual P&L v VaR October 2007 - September 2008
-65
-55
-45
-35
-25
-15
-5
5
15
25
35
45
55
65
0 5 10 15 20 25 30 35 40 45Daily Value at Risk (AUDm)
Act
ual
Pro
fit
&Lo
ss (
AU
Dm
)
Each point on the graph represents 1 day’s trading profit or loss. This result is placed on the graph relative to the associated VaR utilisation. The downward sloping line represents the point where a loss is equal to VaR utilisation. Therefore any point below this line represents a back-test exception (ie where the loss is greater than the VaR).

56
8. OPERATIONAL RISK APS 330 Prudential Disclosure Sep 2008
8. OPERATIONAL RISK The Westpac operational risk definition is aligned to the Basel II definition. Operational risk is the risk of loss resulting from inadequate or failed internal processes, people and systems or from external events. It includes legal and regulatory risk but excludes strategic and reputation risk.
Table 12 Operational risk Approach Operational risk is inherent in every aspect of doing business and includes people risks, technology risks, supplier risks, business disruption risks and fraud risks.
The key components of Westpac's operational risk management framework are:
• Governance: The governance framework includes Board and Senior Management oversight, risk reporting, escalation and independence of the Operational Risk and Compliance function. Westpac’s formalised operational risk governance framework is part of its broader risk governance framework.
• Risk and Control Assessment (RCA): RCA is a forward-looking process for developing Westpac’s operational risk profile. The profile is developed by Senior Management with operational risk advisors. RCA involves identifying and assessing the level of operational risk and the adequacy of controls. Senior Management identifies and implements action plans to effectively manage the risks. The completeness and accuracy of the RCA is supported by historical incident data (internal and external), internal audit issues and key risk indicators. An independent review and challenge process also assists with completeness, accuracy and consistency across Westpac.
• Scenario Analysis: Extreme Event Scenario Analysis (EES) assesses the impact of rare yet plausible extreme internal operational risk events. Quantitative Scenario Analysis (QSA) assesses the impact of rare yet plausible extreme external events across all risk classes.
• Key Risk Indicators (KRIs): KRIs are quantitative indicators that allow management to monitor the operational risk profile. KRIs assist the business to proactively understand their current operational risk exposure.
• Incident management: Involves identifying operational risk incidents, escalating them to appropriate levels of management, minimising any immediate impacts of the incidents and addressing the root causes. Controls are in place over the incident data to ensure that the data is recorded completely and accurately.
Structure and organisation
Westpac has an independent Group Operational Risk and Compliance function that manages and monitors the operational risk framework and provides advice. Monitoring includes an independent challenge of the operational risks by business identified and their assessment. Westpac also has independent Operational Risk and Compliance functions in each business which guide the consistent embedding of the framework and provide advice on the management of operational risks.
Risk reporting
The operational risk profile and exposure are reported to Senior Management and the Board. Reporting includes a description of the operational risk profile, key indicators, major incidents, the strategy to manage the risk, operational risk capital movements and emerging external or internal issues.
Operational risk capital model overview
The operational risk capital model has been developed to provide reliable, reasonable and conservative estimates of the capital required to cover operational risks. It includes capital for both expected and unexpected losses arising from operational risk events.
Westpac adopts a hybrid approach that involves combining historical loss data (internal and external) with forward looking Risk and Control Assessment and Scenario Analysis data to derive a capital estimate. Capital is estimated by simulating distributions of operational risk losses for each data source. The final capital estimate is a weighted average of the capital calculated for each data source. The diagram below provides an overview of the process for calculating capital.
The operational risk capital model does not currently make any adjustment or deduction for risks that may be mitigated by insurance. It also does not deduct any expected losses that are the subject of financial provisions.
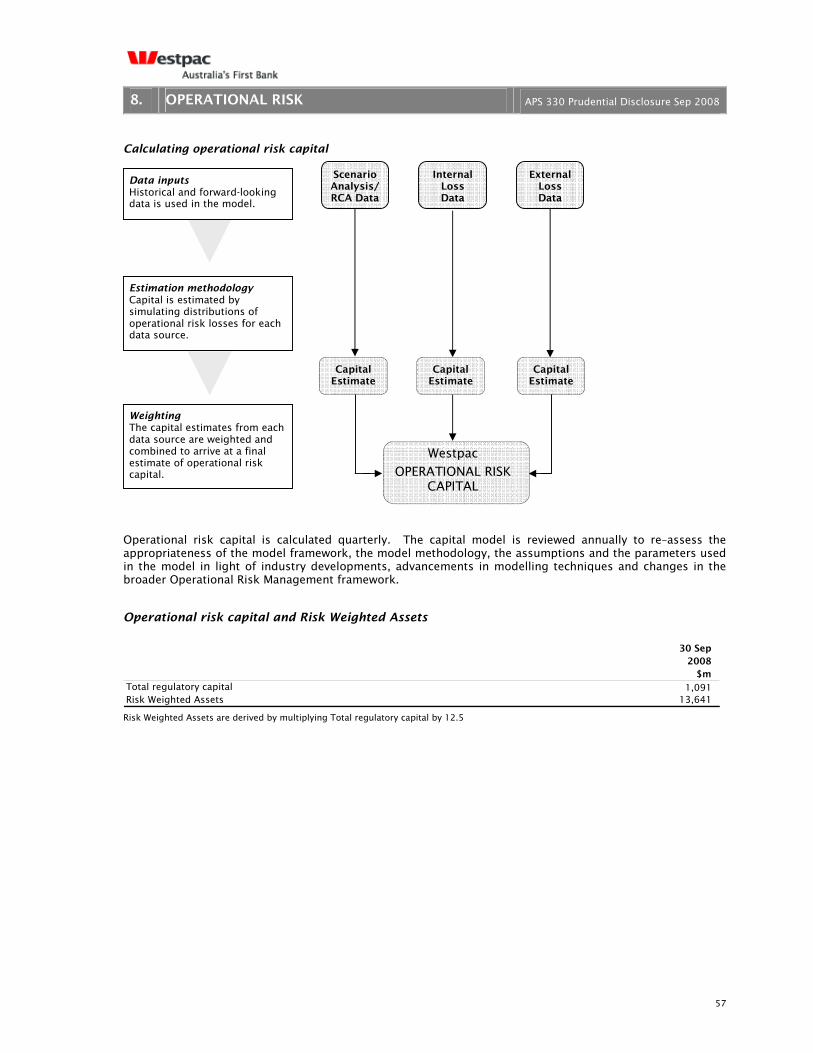
57
8. OPERATIONAL RISK APS 330 Prudential Disclosure Sep 2008
Calculating operational risk capital
Operational risk capital is calculated quarterly. The capital model is reviewed annually to re–assess the appropriateness of the model framework, the model methodology, the assumptions and the parameters used in the model in light of industry developments, advancements in modelling techniques and changes in the broader Operational Risk Management framework.
Operational risk capital and Risk Weighted Assets
30 Sep 2008
$m Total regulatory capital 1,091 Risk Weighted Assets 13,641
Risk Weighted Assets are derived by multiplying Total regulatory capital by 12.5
Westpac OPERATIONAL RISK
CAPITAL
Internal Loss Data
External Loss Data
Data inputs Historical and forward-looking data is used in the model.
Weighting The capital estimates from each data source are weighted and combined to arrive at a final estimate of operational risk capital.
Estimation methodology Capital is estimated by simulating distributions of operational risk losses for each data source.
Capital Estimate
Capital Estimate
Capital Estimate
Scenario Analysis/ RCA Data

58
9. EQUITIES APS 330 Prudential Disclosure Sep 2008
9. EQUITIES Equity risk is defined as the potential for financial loss arising from movements in equity values. The disclosures in this section refer to exposures to equities in Westpac's consolidated banking group. Exposure to equity risk in wealth management subsidiaries is outside the scope of this report.
Table 13 Equities – disclosures for banking book positions Approach Westpac has established a comprehensive set of policies defining the appropriate management of equity risk. These policies are reviewed and approved annually.
Structure and organisation
The BRMC approves any changes to the portfolio and transactional limits for Westpac’s direct equity investments. The BRMC also approves the Equity Risk Management framework.
Risk reporting
Westpac manages equity risk in two ways, Value at Risk (VaR) limits and Investment limits.
A VaR limit (in conjunction with structural limits) is used to manage equity risk in the equity trading business in Financial Markets. This limit is a sub-limit of the BRMC approved VaR limit for Financial Markets trading activities.
Investment exposures are risk graded and captured within Westpac Credit Systems.
Risk mitigation
Westpac does not use formal financial instruments to mitigate our exposure to equities in the banking book.
Banking book positions
Equity underwriting and warehousing risk
As a financial intermediary Westpac underwrites listed and unlisted equities. Equity warehousing activities require the acquisition of assets in anticipation of refinancing through a combination of senior, mezzanine and capital market debt and listed, unlisted and privately placed equity.
Investment securities
Westpac undertakes, as part of the ordinary course of business, certain investments in strategic equity holdings and over time the nature of underlying investments will vary.
Measurement of equity securities
Equity securities that have a quoted market price are carried at their fair value. Fair value is determined based upon current bid prices. If a market for a financial asset is not active, fair value is determined based upon a valuation technique. This includes the use of recent arms length transactions, discounted cash flow analysis, option pricing models and other valuation techniques commonly used by market participants to price similar instruments. Where fair value is not determined based upon an actively traded market price, judgement is required to take into consideration the impact of liquidity, concentration, uncertainty of market factors, pricing assumptions and other risks affecting the specific instrument. In the event that the fair value of an unlisted security cannot be measured reliably, these investments are measured at cost.
Where the investment is held for long term strategic purposes, these investments are accounted for either as available for sale, with changes in fair value being recognised in equity, or at fair value through profit and loss.
Other related matters
• Book value will differ to fair value when instruments are equity accounted (currently none) and carried at cost.
• Fair value should not differ to the listed stock price. Should a listed stock price not be available, it is estimated.
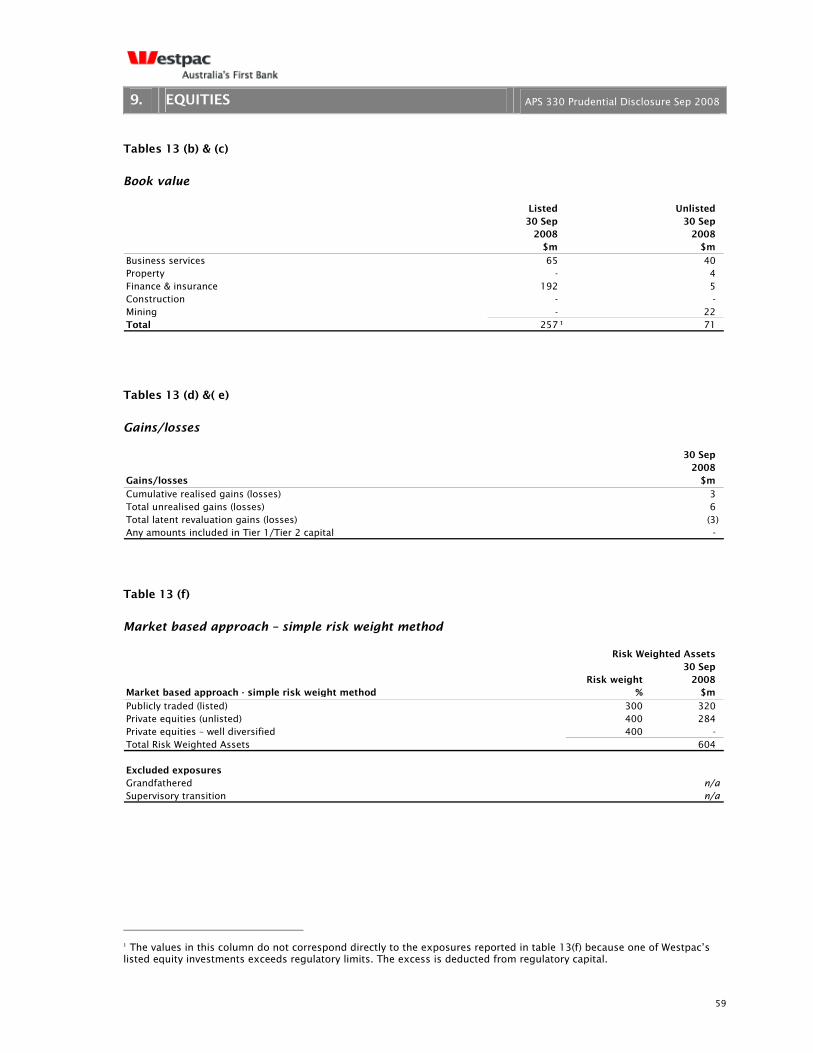
59
9. EQUITIES APS 330 Prudential Disclosure Sep 2008
Tables 13 (b) & (c)
Book value
Listed Unlisted 30 Sep 30 Sep
2008 2008 $m $m
Business services 65 40 Property - 4 Finance & insurance 192 5 Construction - - Mining - 22 Total 257 71 1
1
90
Tables 13 (d) &( e)
Gains/losses
30 Sep 2008
Gains/losses $m
Cumulative realised gains (losses) 3 Total unrealised gains (losses) 6 Total latent revaluation gains (losses) (3) Any amounts included in Tier 1/Tier 2 capital -
Table 13 (f)
Market based approach – simple risk weight method
Risk Weighted Assets 30 Sep
Risk weight 2008 Market based approach - simple risk weight method % $m
Publicly traded (listed) 300 320 Private equities (unlisted) 400 284 Private equities – well diversified 400 - Total Risk Weighted Assets 604
Excluded exposuresGrandfathered n/aSupervisory transition n/a
1 The values in this column do not correspond directly to the exposures reported in table 13(f) because one of Westpac’s listed equity investments exceeds regulatory limits. The excess is deducted from regulatory capital.
60
10. INTEREST RATE RISK IN THE BANKING BOOK APS 330 Prudential Disclosure Sep 2008
10. INTEREST RATE RISK IN THE BANKING BOOK Interest Rate Risk in the Banking Book is the risk to interest income arising from a mismatch between the duration of assets and liabilities that arises in the normal course of business activities.
Table 14 Interest rate in the banking book Approach The banking book activities that give rise to market risk include lending activities, balance sheet funding and capital management. Interest rate risk, currency risk and funding and liquidity risk are inherent in these activities. Group Treasury’s Asset & Liability Management (ALM) unit is responsible for managing market risk arising from Westpac’s banking book activity.
All material regions, business lines and legal entities are included Westpac’s Interest Rate Risk in the Banking Book (IRRBB) framework.
Asset and liability management
ALM manages the structural interest rate mismatch associated with the transfer priced balance sheet, including the investment of Westpac’s capital to its agreed benchmark duration. A key risk management objective is to help ensure the reasonable stability of Net Interest Income (NII) over time. These activities are performed under the direction of MARCO with oversight by the independent Market Risk Management unit.
Net Interest Income sensitivity
NII sensitivity is managed in terms of the net interest income–at–risk (NaR) modelled over a three year time horizon using a 99% confidence interval for movements in wholesale market interest rates. A simulation model is used to calculate Westpac’s potential NaR. The NII simulation framework combines the underlying statement of financial position data with assumptions about runoff and new business, expected repricing behaviour and changes in wholesale market interest rates. Simulations using a range of interest rate scenarios are used to provide a series of potential future NII outcomes. The interest rate scenarios modelled include those projected using historical market interest rate volatility as well as 100 and 200 basis point shifts up and down from current market yield curves. Additional stressed interest rate scenarios are also considered and modelled.
A comparison between the NII outcomes from these modelled scenarios indicates the sensitivity to interest rate changes. Both on and off–balance sheet instruments are then used to manage the interest rate risk.
NaR limit
The BRMC has approved a NaR limit. This limit is managed by the Group Treasurer and is expressed as a deviation from benchmark hedge levels over a one-year rolling time frame, at a 99% level of confidence. This limit is monitored by Market Risk Management.
VaR limit
The BRMC has also approved an overall VaR limit for ALM. This limit is managed by the Group Treasurer and monitored by Market Risk Management.
Structural foreign exchange rate risk
Structural foreign exchange rate risk results from the generation of foreign currency denominated earnings and from Westpac's capital deployed in offshore branches and subsidiaries, where it is denominated in currencies other than Australian dollars. As exchange rates fluctuate the Australian dollar equivalent of offshore earnings and capital is subject to change, which could introduce significant variability to Westpac's reported financial results. MARCO determines the appropriateness of FX earnings volatility, associated limits and the derivatives used to hedge the variability. The identification and management of structural foreign exchange risk is reported to MARCO monthly.

61
10. INTEREST RATE RISK IN THE BANKING BOOK APS 330 Prudential Disclosure Sep 2008
Risk reporting
Interest rate risk in the banking book risk measurement systems and personnel are centralised in Sydney. These include front office product systems, which capture all treasury funding and derivative transactions; the transfer pricing system, which captures all retail and other business transactions; non–traded VaR systems which calculate Group Treasury VaR; and the NII system, which calculates NaR.
Daily monitoring of current exposure and limit utilisation is conducted independently by Market Risk Management, which monitors market risk exposures against VaR and NaR limits. Management reports detailing structural positions and VaR are produced and distributed daily for use by dealers and management across all stakeholder groups. Monthly and quarterly reports are produced for the senior management market risk forums of MARCO and BRMC respectively to ensure transparency of material market risks and issues.
Risk mitigation
Market risk arising in the banking book stems from the ordinary course of banking activities, including structural interest rate risk (the mismatch between the duration of assets and liabilities) and capital management. Hedging Westpac’s exposure to interest rate risk is undertaken using derivatives. The hedge accounting strategy adopted utilises a combination of the cash flow, fair value and net investment hedge approaches. Some derivatives held for economic hedging purposes do not meet the criteria for hedge accounting as defined under AASB 139, Financial Instruments: Recognition and Measurement, and therefore are accounted for in the same way as derivatives held for trading.
The same controls as used to monitor traded market risk allow for continuous monitoring by management.
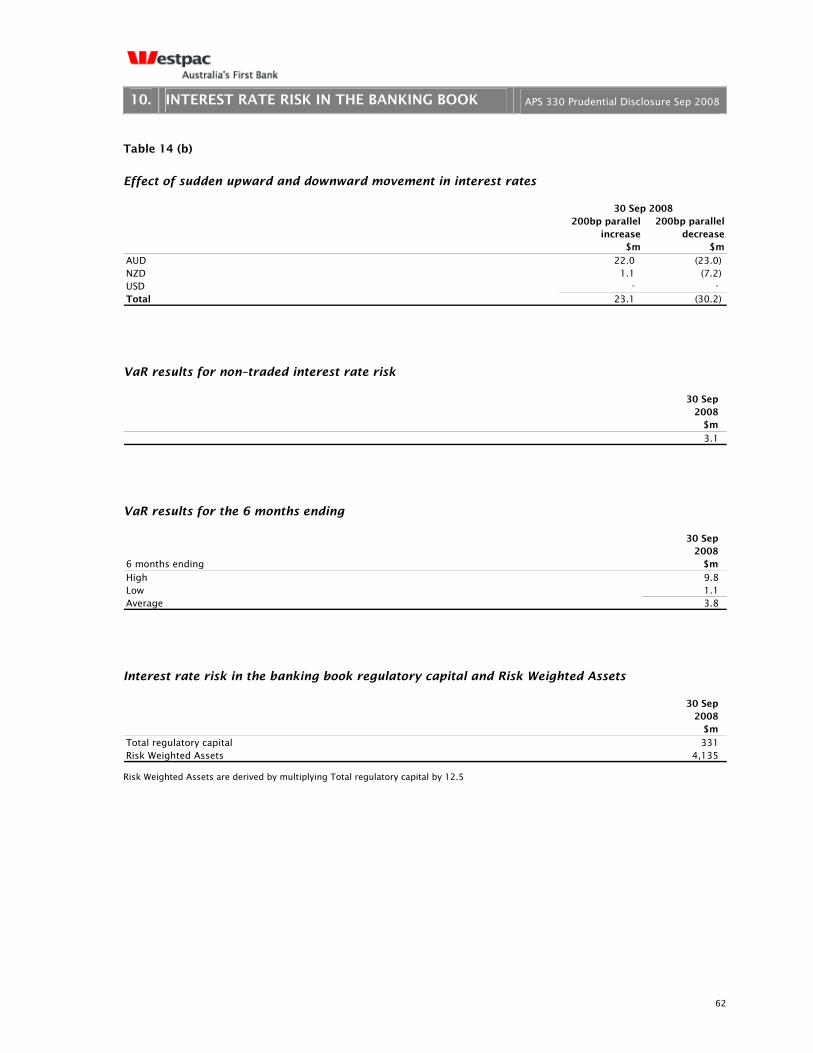
62
10. INTEREST RATE RISK IN THE BANKING BOOK APS 330 Prudential Disclosure Sep 2008
Table 14 (b)
Effect of sudden upward and downward movement in interest rates
200bp parallel 200bp parallelincrease decrease
$m $m
AUD 22.0 (23.0) NZD 1.1 (7.2) USD - - Total 23.1 (30.2)
30 Sep 2008
VaR results for non–traded interest rate risk
30 Sep 2008
$m
3.1
VaR results for the 6 months ending
30 Sep 2008
6 months ending $m
High 9.8 Low 1.1 Average 3.8
Interest rate risk in the banking book regulatory capital and Risk Weighted Assets
30 Sep 2008
$m
Total regulatory capital 331 Risk Weighted Assets 4,135
Risk Weighted Assets are derived by multiplying Total regulatory capital by 12.5
63
11. LIQUIDITY RISK APS 330 Prudential Disclosure Sep 2008
11. LIQUIDITY RISK Liquidity risk is the risk of not meeting our payment obligations, which could arise as a result of mismatched cash flows generated by our business.
Approach Group Treasury manages the funding of Westpac with oversight by MARCO and the BRMC, which set and monitors policies relating to liquidity and liability generation.
Key aspects of the liquidity management strategy are as follows:
Liquidity risk framework
The BRMC approves Westpac’s policies relating to liquidity risk management annually, including:
• modelling approach; • scenarios covered; • limit determination; and • levels of liquid asset holdings.
Funding plan
Group Treasury undertakes a review annually that is approved by the BRMC. It outlines the funding strategy for the coming year, which includes:
• trends in global debt markets; • peer analysis; • wholesale funding capacity (reviewed every 6 months by Group Treasury, and signed off by Market Risk
Management); • estimation of wholesale funding task; • estimated market capacity; and • funding risk analysis.
Contingency planning
Group Treasury maintains a Crisis Management Action Plan that details the broad actions that should be taken by Westpac in the event of a ‘funding crisis’. The report is reviewed and approved by MARCO and is aligned with the Group’s broader situation management procedures.
Minimum liquid asset holdings The BRMC annually approves minimum holdings of liquid assets in Australia and New Zealand.
Westpac complies with local regulatory requirements in Westpac’s offshore operations. Liquidity requirements exist in USA, Hong Kong, Singapore, Japan, Fiji, Vanuatu and the Solomon Islands. A global concession has been granted by the United Kingdom regulatory body (the Financial Services Authority), which effectively sees Westpac’s United Kingdom operations under APRA supervision.

64
11. LIQUIDITY RISK APS 330 Prudential Disclosure Sep 2008
Liquidity reporting
Frequency Liquidity report
Produced by Middle Office
Reviewed by Market Risk Management
Daily
Monitored within Group Treasury
Submitted to MARCO Monthly
Submitted to APRA
Quarterly Submitted to the BRMC

65
APPENDIX 1 – Group entities APS 330 Prudential Disclosure Sep 2008
APPENDIX 1 – Group entities The following table is a listing of relevant Group entities and their respective classifications for accounting and regulatory consolidation purposes.
Group Entities as at 30 September 2008 Consolidated for regulatory requirements
Name
Consolidated for accounting requirements Fully
consolidated Treated as a deduction
Neither consolidated nor deducted
BT Funds Management Limited Yes Yes
BT Finance & Investment Pty Limited Yes Yes
Oniston Pty Limited Yes Yes
BT Life Limited Yes Yes
BT Portfolio Services Limited Yes Yes
Magnitude Group Pty Limited Yes Yes
BT Funds Management No.2 Limited Yes Yes
BT Investment Management No.2 Limited Yes Yes
BT Funds Management (NZ) Limited Yes Yes
BT Investment Management No.3 Pty Limited Yes Yes
Hargrave Investments Pty Limited Yes Yes
Voyager Funds Management Pty Limited Yes Yes
Westpac Custodian Nominees Limited Yes Yes
Westpac Life–NZ–Limited Yes Yes
Westpac Nominees–NZ–Limited Yes Yes
Westpac Funds Management Limited Yes Yes
Westpac Superannuation Nominees–NZ–Limited Yes Yes
Westpac Airport Link Pty Limited Yes Yes
Westpac Airport Link Trust Yes Yes
Westpac Life Insurance Services Limited Yes Yes
Westpac General Insurance Services Limited Yes Yes
Westpac Securities Administration Limited Yes Yes
Westpac Equity Pty Limited Yes Yes
A.F.G. Insurances Limited Yes Yes
Westpac General Insurance Limited Yes Yes
Westpac Private Equity Pty Limited Yes Yes
Westpac Residential Property Trust Yes Yes
First Residential Property Trust Yes Yes
Novacare Health Solutions No. 1 Pty Limited Yes Yes
Novacare Health Pty Limited Yes Yes
Novacare Health Solutions Pty Limited Yes Yes
Novacare Services Pty Limited Yes Yes
Novacare Health Solutions No.1 Trust Yes Yes
Novacare Health Solutions Trust Yes Yes
Novacare Solutions Partnership Yes Yes
Novacare Solutions No.1 Pty Limited Yes Yes
Novacare Solutions Pty Limited Yes Yes

66
APPENDIX 1 – Group entities APS 330 Prudential Disclosure Sep 2008
Group Entities as at 30 September 2008 Consolidated for regulatory requirements
Name
Consolidated for accounting requirements
Fully consolidated
Treated as a deduction
Neither consolidated nor deducted
Novacare Solutions No.1 Trust Yes Yes
Novacare Solutions Trust Yes Yes
Hastings Forests Australia Pty Limited Yes Yes
Hastings Funds Management (UK) Limited Yes Yes
Hastings Funds Management (US) Inc. Yes Yes
Hastings Private Equity Fund IIA Pty Limited Yes Yes
Hastings Private Equity Fund IIB Pty Limited Yes Yes
Utilities of Australia International Pty Limited Yes Yes
TIF International 1 Pty Limited Yes Yes
Westpac Lenders Mortgage Insurance Limited Yes Yes
Westpac Securitisation Management Pty Limited Yes Yes
Hastings Funds Management Limited Yes Yes
Australian Infrastructure Fund International 1 Pty Limited Yes Yes
Hastings Forestry Investments Limited Yes Yes
Beech Trust Yes Yes
CMBS – Warehouse Trust Yes Yes
FAI No. 2 Trust Yes Yes
Gemini Trust Yes Yes
Jacaranda Trust Yes Yes
Jarrah Trust Yes Yes
Orion Trust Yes Yes
Phoenix Trust Yes Yes
Series 1997–4E WST Trust Yes Yes
Series 1999–1G WST Trust Yes Yes
Series 2002–1G WST Trust Yes Yes
The Series WST 2006–1D WST Trust Yes Yes
Series 2007–IG WST Trust Yes Yes
Acacia Securities Limited Yes Yes
Sydney Capital Corp Inc Yes Yes
The Series WST 2005–1G WST Trust Yes Yes
Waratah Receivables (NZ) Consolidated Yes Yes
Waratah Receivables (AUS) Consolidated Yes Yes
Waratah Securities Australia Limited Yes Yes
Wollemi Trust Yes Yes
Wollemi Trust 2005–1 Yes Yes
WST Funding Trust Yes Yes
WST Warehouse Trust #1 Yes Yes
WST–NZ Series WLIS #6 Trust Yes Yes

67
APPENDIX 1 – Group entities APS 330 Prudential Disclosure Sep 2008
Group Entities as at 30 September 2008 Consolidated for regulatory requirements
Name
Consolidated for accounting requirements
Fully consolidated
Treated as a deduction
Neither consolidated nor deducted
WST–NZ Warehouse Trust #1 Yes Yes
BT Investment Management Limited Yes Yes
BT Investment Management (RE) Limited Yes Yes
Series 2007–IM WST Trust Yes Yes
Real Estate Investment Trust A Yes Yes
Westpac Real Estate Investment Trust I Yes Yes
Westpac Real Estate Investment Trust II Yes Yes
WEST BP Trust Yes Yes
WEST BP Holdco Pty Limited Yes Yes
WEST BP Pty Limited Yes Yes
Westpac Essential Services Trust I Yes Yes
Westpac Essential Services Trust II Yes Yes
Westpac Essential Services Pty Limited Yes Yes
Real Estate Investment Trust B Yes Yes
Boyd Cook Cove Finance Corporation Pty Limited Yes
Yes
Westpac Cook Cove Trust I Yes Yes
Westpac Cook Cove Trust II Yes Yes
Boyd Cook Cove Unit Trust Yes Yes
Cook Cove Pty Limited Yes Yes
Cook Cove Investment Pty Limited Yes Yes
Cook Cove Investment Trust Yes Yes
Athena Finance Pty Limited Yes Yes
Westpac Financial Services Limited Yes Yes
Hastings Advisers LLC Yes Yes
Hastings Development Fund Ltd Yes Yes
Westpac Asset Services Pty Ltd Yes Yes
Westpac Diversified Property Fund Yes Yes
North Ryde Office Trust Yes Yes
Uni No. 1 Office Trust Yes Yes
WOT Loan Note Pty Limited Yes Yes
Westpac Office Trust Yes Yes
WOT Holding Trust Yes Yes
WOW Office Trust Yes Yes
Castlereagh Trust Yes Yes
Hickory Trust Yes Yes
Series 2008 – 2M WST Trust Yes Yes

68
APPENDIX 2 – Capital structure APS 330 Prudential Disclosure Sep 2008
APPENDIX 2 – Capital structure
Table 2 (a) – Main features of all capital instruments
Residual Tier 1 Capital
Instrument Issue date Terms and conditions and main features Innovative
Stapled Preferred Securities (SPS)
30 July 2008 Westpac issued 10,362,670 Westpac SPS at face value of $100 each on 30 July 2008. Westpac SPS are stapled securities, each consisting of a perpetual, unsecured, non-cumulative subordinated note issued by Westpac’s New York branch stapled to a preference share issued by Westpac. Westpac SPS qualify as non-innovative residual tier one capital of Westpac.
Westpac SPS are expected to pay non-cumulative, floating rate quarterly distributions (30 September, 31 December, 31 March and 30 June) which are expected to be fully franked. The distribution rate on Westpac SPS is calculated as the Australian bank bill rate plus the margin of 2.40% per annum multiplied by one minus the Australian corporate tax rate (30% at the time of issue). Westpac SPS distributions are subject to a distribution payment test and distributions will not be paid if the Westpac directors determine not to pay a distribution, the distribution payment exceeds the distributable profits of Westpac, or APRA objects to the payment of the distribution.
Westpac SPS distributions will consist of interest payment on the notes while the notes remain stapled to the preference shares. Following an assignment event, the notes will unstaple from the preference shares and holders will only hold preference shares. Dividends will then become payable on the preference shares if the preference shares have not been converted or redeemed.
An assignment event includes among others, a date selected by Westpac at its absolute discretion, the date preference shares are converted or redeemed, or where interest on the notes has not been paid in full.
On 26 September 2013, the initial mandatory conversion date, it is expected that the Westpac SPS will be either converted into a variable number of Westpac ordinary shares (subject to a conversion discount) provided certain conversion conditions are satisfied, or transferred to a nominated party at the election of Westpac for cash equal to their face value. If the conversion conditions are not satisfied, Westpac SPS may in certain circumstances be redeemed for their face value subject to APRA approval.
If Westpac SPS are not converted, transferred or redeemed on 26 September 2013, they will remain on issue and may either be converted, transferred or redeemed at the next possible conversion date, subject to satisfaction of the conversion conditions. In certain other limited circumstances Westpac SPS may be converted, transferred or redeemed, prior to 26 September 2013.
Westpac SPS rank for payment in a winding up of Westpac ahead of ordinary shares and equally with equal ranking capital securities but are subordinated to claims of Westpac deposit holders and other senior creditors. Holders of Westpac SPS are entitled to vote at a general meeting of Westpac in limited circumstances only.
No
Trust Preferred Securities (2003 TPS)
13 August 2003
A wholly owned entity, Westpac Capital Trust III (Capital Trust III), issued 750,000 2003 TPS in the USA at US$1,000 each on 13 August 2003, with non–cumulative semi–annual distributions (31 March and 30 September) in arrears at the annual rate of 5.819% up to but excluding 30 September 2013. From, and including, 30 September 2013 the 2003 TPS will pay non–cumulative quarterly distributions (31 December, 31 March, 30 June and 30 September) in arrears at a floating rate of LIBOR plus 2.05% per year. Capital Trust III has also issued common securities with a total price of US$1,000 to Westpac Capital Holdings Inc.
The proceeds from the issue of 2003 TPS were ultimately invested in convertible debentures issued by Westpac NZ Branch. The distributions on the 2003 TPS are ultimately sourced from interest paid by Westpac NZ Branch on the convertible debentures. Distributions are subject to Westpac having sufficient distributable profits or in certain circumstances, subject to APRA approval.
The convertible debentures are unsecured, junior subordinated obligations of Westpac and will rank subordinate and junior in right of payment of principal and distributions to Westpac’s obligations to its depositors and creditors.
Yes
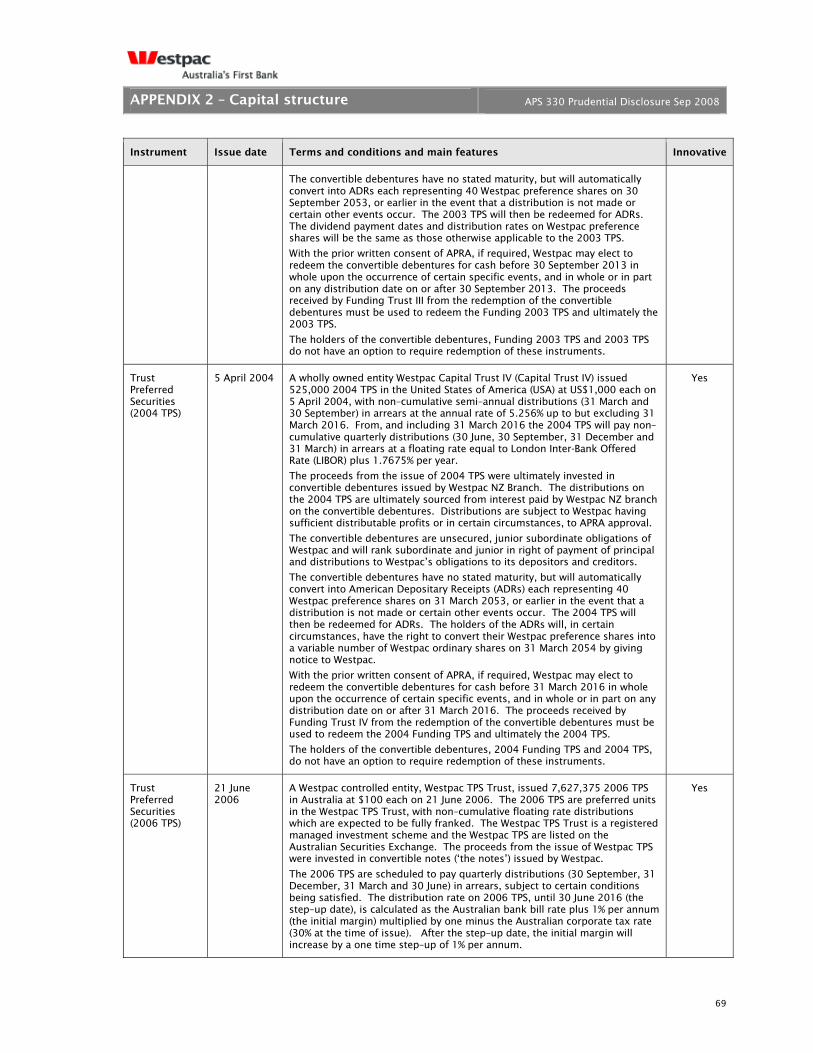
69
APPENDIX 2 – Capital structure APS 330 Prudential Disclosure Sep 2008
Instrument Issue date Terms and conditions and main features Innovative
The convertible debentures have no stated maturity, but will automatically convert into ADRs each representing 40 Westpac preference shares on 30 September 2053, or earlier in the event that a distribution is not made or certain other events occur. The 2003 TPS will then be redeemed for ADRs. The dividend payment dates and distribution rates on Westpac preference shares will be the same as those otherwise applicable to the 2003 TPS.
With the prior written consent of APRA, if required, Westpac may elect to redeem the convertible debentures for cash before 30 September 2013 in whole upon the occurrence of certain specific events, and in whole or in part on any distribution date on or after 30 September 2013. The proceeds received by Funding Trust III from the redemption of the convertible debentures must be used to redeem the Funding 2003 TPS and ultimately the 2003 TPS.
The holders of the convertible debentures, Funding 2003 TPS and 2003 TPS do not have an option to require redemption of these instruments.
Trust Preferred Securities (2004 TPS)
5 April 2004 A wholly owned entity Westpac Capital Trust IV (Capital Trust IV) issued 525,000 2004 TPS in the United States of America (USA) at US$1,000 each on 5 April 2004, with non–cumulative semi–annual distributions (31 March and 30 September) in arrears at the annual rate of 5.256% up to but excluding 31 March 2016. From, and including 31 March 2016 the 2004 TPS will pay non–cumulative quarterly distributions (30 June, 30 September, 31 December and 31 March) in arrears at a floating rate equal to London Inter-Bank Offered Rate (LIBOR) plus 1.7675% per year.
The proceeds from the issue of 2004 TPS were ultimately invested in convertible debentures issued by Westpac NZ Branch. The distributions on the 2004 TPS are ultimately sourced from interest paid by Westpac NZ branch on the convertible debentures. Distributions are subject to Westpac having sufficient distributable profits or in certain circumstances, to APRA approval.
The convertible debentures are unsecured, junior subordinate obligations of Westpac and will rank subordinate and junior in right of payment of principal and distributions to Westpac’s obligations to its depositors and creditors.
The convertible debentures have no stated maturity, but will automatically convert into American Depositary Receipts (ADRs) each representing 40 Westpac preference shares on 31 March 2053, or earlier in the event that a distribution is not made or certain other events occur. The 2004 TPS will then be redeemed for ADRs. The holders of the ADRs will, in certain circumstances, have the right to convert their Westpac preference shares into a variable number of Westpac ordinary shares on 31 March 2054 by giving notice to Westpac.
With the prior written consent of APRA, if required, Westpac may elect to redeem the convertible debentures for cash before 31 March 2016 in whole upon the occurrence of certain specific events, and in whole or in part on any distribution date on or after 31 March 2016. The proceeds received by Funding Trust IV from the redemption of the convertible debentures must be used to redeem the 2004 Funding TPS and ultimately the 2004 TPS.
The holders of the convertible debentures, 2004 Funding TPS and 2004 TPS, do not have an option to require redemption of these instruments.
Yes
Trust Preferred Securities (2006 TPS)
21 June 2006
A Westpac controlled entity, Westpac TPS Trust, issued 7,627,375 2006 TPS in Australia at $100 each on 21 June 2006. The 2006 TPS are preferred units in the Westpac TPS Trust, with non–cumulative floating rate distributions which are expected to be fully franked. The Westpac TPS Trust is a registered managed investment scheme and the Westpac TPS are listed on the Australian Securities Exchange. The proceeds from the issue of Westpac TPS were invested in convertible notes (‘the notes’) issued by Westpac.
The 2006 TPS are scheduled to pay quarterly distributions (30 September, 31 December, 31 March and 30 June) in arrears, subject to certain conditions being satisfied. The distribution rate on 2006 TPS, until 30 June 2016 (the step–up date), is calculated as the Australian bank bill rate plus 1% per annum (the initial margin) multiplied by one minus the Australian corporate tax rate (30% at the time of issue). After the step–up date, the initial margin will increase by a one time step–up of 1% per annum.
Yes
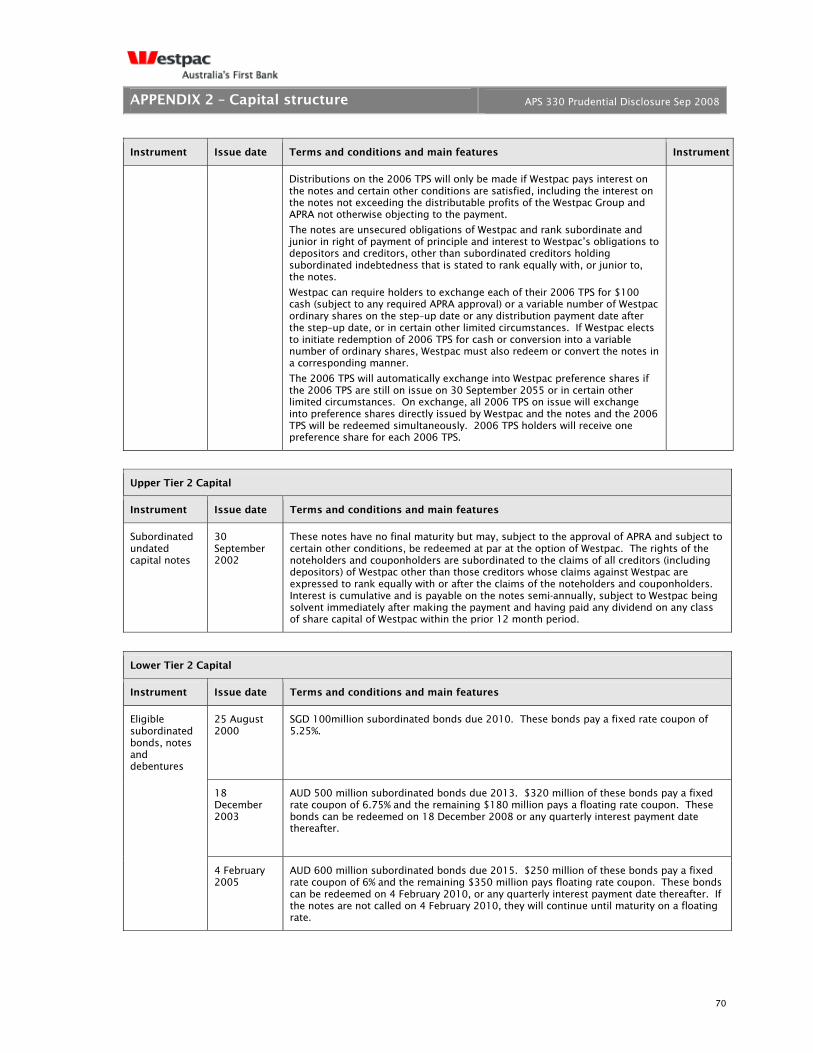
70
APPENDIX 2 – Capital structure APS 330 Prudential Disclosure Sep 2008
Instrument Issue date Terms and conditions and main features Instrument
Distributions on the 2006 TPS will only be made if Westpac pays interest on the notes and certain other conditions are satisfied, including the interest on the notes not exceeding the distributable profits of the Westpac Group and APRA not otherwise objecting to the payment.
The notes are unsecured obligations of Westpac and rank subordinate and junior in right of payment of principle and interest to Westpac’s obligations to depositors and creditors, other than subordinated creditors holding subordinated indebtedness that is stated to rank equally with, or junior to, the notes.
Westpac can require holders to exchange each of their 2006 TPS for $100 cash (subject to any required APRA approval) or a variable number of Westpac ordinary shares on the step–up date or any distribution payment date after the step–up date, or in certain other limited circumstances. If Westpac elects to initiate redemption of 2006 TPS for cash or conversion into a variable number of ordinary shares, Westpac must also redeem or convert the notes in a corresponding manner.
The 2006 TPS will automatically exchange into Westpac preference shares if the 2006 TPS are still on issue on 30 September 2055 or in certain other limited circumstances. On exchange, all 2006 TPS on issue will exchange into preference shares directly issued by Westpac and the notes and the 2006 TPS will be redeemed simultaneously. 2006 TPS holders will receive one preference share for each 2006 TPS.
Upper Tier 2 Capital
Instrument Issue date Terms and conditions and main features
Subordinated undated capital notes
30 September 2002
These notes have no final maturity but may, subject to the approval of APRA and subject to certain other conditions, be redeemed at par at the option of Westpac. The rights of the noteholders and couponholders are subordinated to the claims of all creditors (including depositors) of Westpac other than those creditors whose claims against Westpac are expressed to rank equally with or after the claims of the noteholders and couponholders. Interest is cumulative and is payable on the notes semi-annually, subject to Westpac being solvent immediately after making the payment and having paid any dividend on any class of share capital of Westpac within the prior 12 month period.
Lower Tier 2 Capital
Instrument Issue date Terms and conditions and main features
Eligible subordinated bonds, notes and debentures
25 August 2000
SGD 100million subordinated bonds due 2010. These bonds pay a fixed rate coupon of 5.25%.
18 December 2003
AUD 500 million subordinated bonds due 2013. $320 million of these bonds pay a fixed rate coupon of 6.75% and the remaining $180 million pays a floating rate coupon. These bonds can be redeemed on 18 December 2008 or any quarterly interest payment date thereafter.
4 February 2005
AUD 600 million subordinated bonds due 2015. $250 million of these bonds pay a fixed rate coupon of 6% and the remaining $350 million pays floating rate coupon. These bonds can be redeemed on 4 February 2010, or any quarterly interest payment date thereafter. If the notes are not called on 4 February 2010, they will continue until maturity on a floating rate.
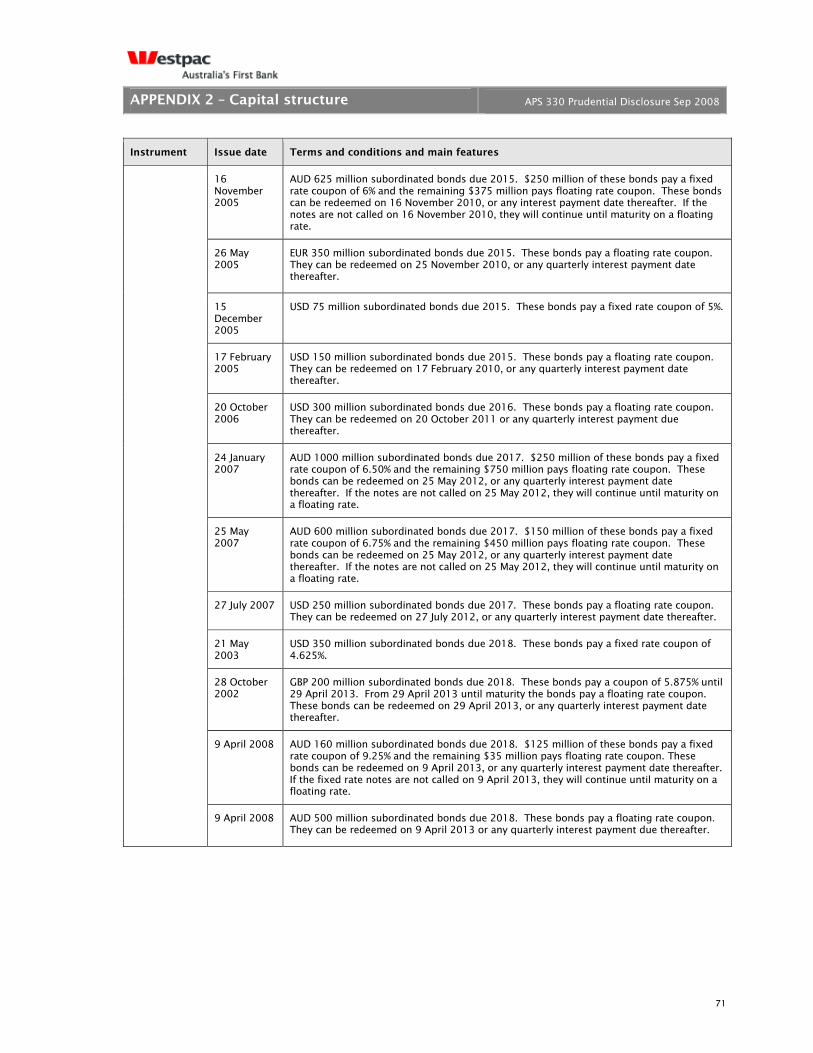
71
APPENDIX 2 – Capital structure APS 330 Prudential Disclosure Sep 2008
Instrument Issue date Terms and conditions and main features
16 November 2005
AUD 625 million subordinated bonds due 2015. $250 million of these bonds pay a fixed rate coupon of 6% and the remaining $375 million pays floating rate coupon. These bonds can be redeemed on 16 November 2010, or any interest payment date thereafter. If the notes are not called on 16 November 2010, they will continue until maturity on a floating rate.
26 May 2005
EUR 350 million subordinated bonds due 2015. These bonds pay a floating rate coupon. They can be redeemed on 25 November 2010, or any quarterly interest payment date thereafter.
15 December 2005
USD 75 million subordinated bonds due 2015. These bonds pay a fixed rate coupon of 5%.
17 February 2005
USD 150 million subordinated bonds due 2015. These bonds pay a floating rate coupon. They can be redeemed on 17 February 2010, or any quarterly interest payment date thereafter.
20 October 2006
USD 300 million subordinated bonds due 2016. These bonds pay a floating rate coupon. They can be redeemed on 20 October 2011 or any quarterly interest payment due thereafter.
24 January 2007
AUD 1000 million subordinated bonds due 2017. $250 million of these bonds pay a fixed rate coupon of 6.50% and the remaining $750 million pays floating rate coupon. These bonds can be redeemed on 25 May 2012, or any quarterly interest payment date thereafter. If the notes are not called on 25 May 2012, they will continue until maturity on a floating rate.
25 May 2007
AUD 600 million subordinated bonds due 2017. $150 million of these bonds pay a fixed rate coupon of 6.75% and the remaining $450 million pays floating rate coupon. These bonds can be redeemed on 25 May 2012, or any quarterly interest payment date thereafter. If the notes are not called on 25 May 2012, they will continue until maturity on a floating rate.
27 July 2007 USD 250 million subordinated bonds due 2017. These bonds pay a floating rate coupon. They can be redeemed on 27 July 2012, or any quarterly interest payment date thereafter.
21 May 2003
USD 350 million subordinated bonds due 2018. These bonds pay a fixed rate coupon of 4.625%.
28 October 2002
GBP 200 million subordinated bonds due 2018. These bonds pay a coupon of 5.875% until 29 April 2013. From 29 April 2013 until maturity the bonds pay a floating rate coupon. These bonds can be redeemed on 29 April 2013, or any quarterly interest payment date thereafter.
9 April 2008
AUD 160 million subordinated bonds due 2018. $125 million of these bonds pay a fixed rate coupon of 9.25% and the remaining $35 million pays floating rate coupon. These bonds can be redeemed on 9 April 2013, or any quarterly interest payment date thereafter. If the fixed rate notes are not called on 9 April 2013, they will continue until maturity on a floating rate.
9 April 2008
AUD 500 million subordinated bonds due 2018. These bonds pay a floating rate coupon. They can be redeemed on 9 April 2013 or any quarterly interest payment due thereafter.

72
GLOSSARY APS 330 Prudential Disclosure Sep 2008
GLOSSARY
Glossary of definitions and abbreviations
Abbreviation Term Explanation
AASB 112 Australian Accounting Standards AASB Income Taxes
AASB 139 Australian Accounting Standards AASB Financial Instruments: Recognition and Measurement
ACE Adjusted common equity ACE is equal to shareholders’ equity less hybrid equity; intangible assets; investments in insurance, funds management and securitisation entities; and other deductions.
ADI Authorised deposit taking institution
Authorised deposit taking institutions (ADIs) are corporations which are authorised under the Banking Act 1959 to carry on banking business in Australia.
ADR American depositary receipts
A-IFRS Australian equivalents to International Financial Reporting Standards
ALM Asset and liability management
AMA Advanced measurement approach
The capital requirement using the AMA is based on the bank’s internal operational risk systems, which must both measure and manage operational risk.
ANZSIC Australian and New Zealand Standard Industry Classification
A code used by the Australian Bureau of Statistics and Statistics New Zealand for classifying businesses.
APRA Australian Prudential Regulation Authority
APS Australian prudential standard
APS 111 APS 111 Capital Adequacy: Measurement of Capital
APS 112 APS 112 Capital Adequacy: Standardised Approach to Credit Risk
APS 113 APS 113 Capital Adequacy: Internal Ratings-based Approach to Credit Risk
APS 120 APS 120 Securitisation
APS 222 APS 222 Associations with Related Entities
APS 330 APS 330 Capital Adequacy: Public Disclosure of Prudential Information
ASX Australian Securities Exchange
BRMC Board Risk Management Committee
The Risk Management Committee oversees the risk profile and approves risk management framework within the context of the Risk Reward Strategy determined by the Board.
BTFG BT Financial Group
CEO Chief Executive Officer
CRG Customer risk grade
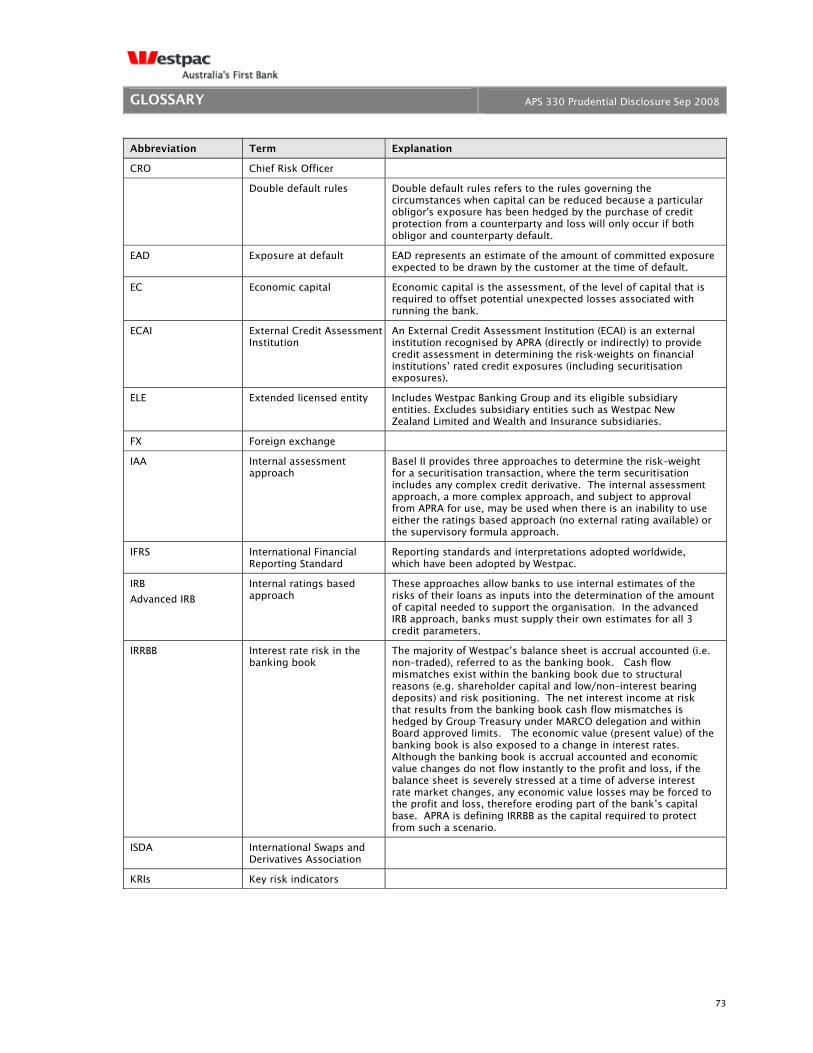
73
GLOSSARY APS 330 Prudential Disclosure Sep 2008
Abbreviation Term Explanation
CRO Chief Risk Officer
Double default rules Double default rules refers to the rules governing the circumstances when capital can be reduced because a particular obligor's exposure has been hedged by the purchase of credit protection from a counterparty and loss will only occur if both obligor and counterparty default.
EAD Exposure at default EAD represents an estimate of the amount of committed exposure expected to be drawn by the customer at the time of default.
EC Economic capital Economic capital is the assessment, of the level of capital that is required to offset potential unexpected losses associated with running the bank.
ECAI External Credit Assessment Institution
An External Credit Assessment Institution (ECAI) is an external institution recognised by APRA (directly or indirectly) to provide credit assessment in determining the risk-weights on financial institutions’ rated credit exposures (including securitisation exposures).
ELE Extended licensed entity Includes Westpac Banking Group and its eligible subsidiary entities. Excludes subsidiary entities such as Westpac New Zealand Limited and Wealth and Insurance subsidiaries.
FX Foreign exchange
IAA Internal assessment approach
Basel II provides three approaches to determine the risk–weight for a securitisation transaction, where the term securitisation includes any complex credit derivative. The internal assessment approach, a more complex approach, and subject to approval from APRA for use, may be used when there is an inability to use either the ratings based approach (no external rating available) or the supervisory formula approach.
IFRS International Financial Reporting Standard
Reporting standards and interpretations adopted worldwide, which have been adopted by Westpac.
IRB
Advanced IRB
Internal ratings based approach
These approaches allow banks to use internal estimates of the risks of their loans as inputs into the determination of the amount of capital needed to support the organisation. In the advanced IRB approach, banks must supply their own estimates for all 3 credit parameters.
IRRBB Interest rate risk in the banking book
The majority of Westpac’s balance sheet is accrual accounted (i.e. non–traded), referred to as the banking book. Cash flow mismatches exist within the banking book due to structural reasons (e.g. shareholder capital and low/non–interest bearing deposits) and risk positioning. The net interest income at risk that results from the banking book cash flow mismatches is hedged by Group Treasury under MARCO delegation and within Board approved limits. The economic value (present value) of the banking book is also exposed to a change in interest rates. Although the banking book is accrual accounted and economic value changes do not flow instantly to the profit and loss, if the balance sheet is severely stressed at a time of adverse interest rate market changes, any economic value losses may be forced to the profit and loss, therefore eroding part of the bank’s capital base. APRA is defining IRRBB as the capital required to protect from such a scenario.
ISDA International Swaps and Derivatives Association
KRIs Key risk indicators
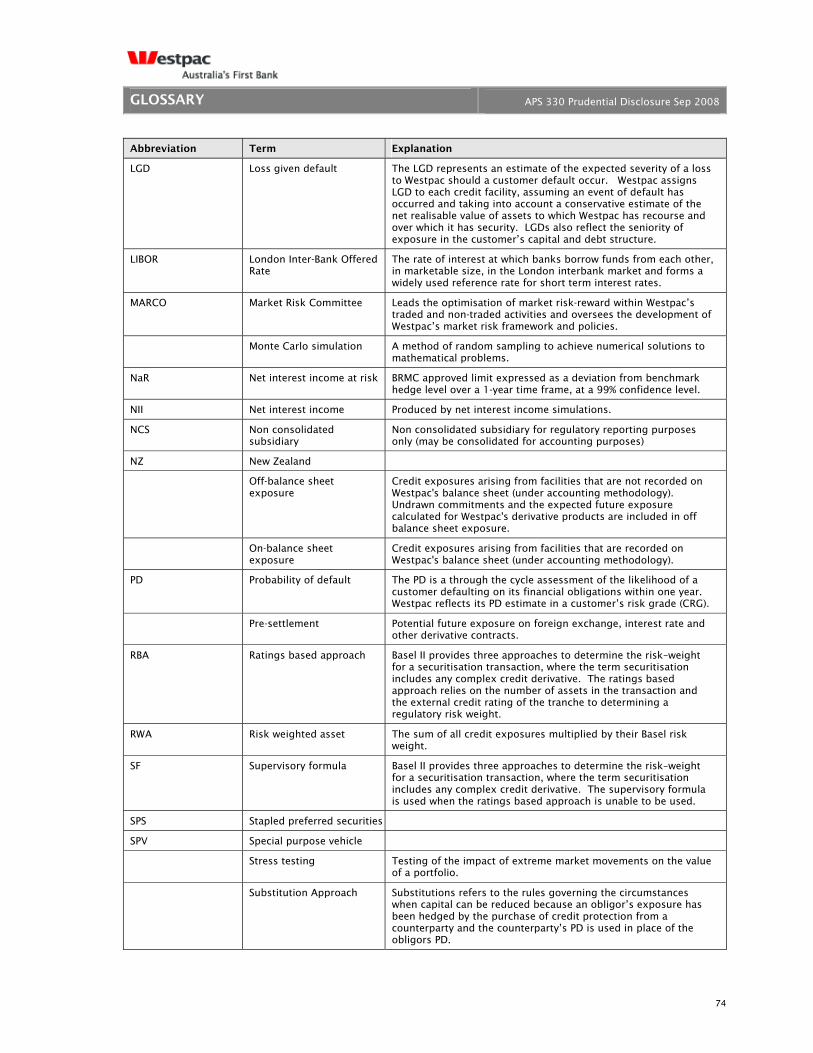
74
GLOSSARY APS 330 Prudential Disclosure Sep 2008
Abbreviation Term Explanation
LGD Loss given default The LGD represents an estimate of the expected severity of a loss to Westpac should a customer default occur. Westpac assigns LGD to each credit facility, assuming an event of default has occurred and taking into account a conservative estimate of the net realisable value of assets to which Westpac has recourse and over which it has security. LGDs also reflect the seniority of exposure in the customer’s capital and debt structure.
LIBOR London Inter-Bank Offered Rate
The rate of interest at which banks borrow funds from each other, in marketable size, in the London interbank market and forms a widely used reference rate for short term interest rates.
MARCO Market Risk Committee Leads the optimisation of market risk-reward within Westpac’s traded and non-traded activities and oversees the development of Westpac’s market risk framework and policies.
Monte Carlo simulation A method of random sampling to achieve numerical solutions to mathematical problems.
NaR Net interest income at risk BRMC approved limit expressed as a deviation from benchmark hedge level over a 1-year time frame, at a 99% confidence level.
NII Net interest income Produced by net interest income simulations.
NCS Non consolidated subsidiary
Non consolidated subsidiary for regulatory reporting purposes only (may be consolidated for accounting purposes)
NZ New Zealand
Off-balance sheet exposure
Credit exposures arising from facilities that are not recorded on Westpac's balance sheet (under accounting methodology). Undrawn commitments and the expected future exposure calculated for Westpac's derivative products are included in off balance sheet exposure.
On-balance sheet exposure
Credit exposures arising from facilities that are recorded on Westpac's balance sheet (under accounting methodology).
PD Probability of default The PD is a through the cycle assessment of the likelihood of a customer defaulting on its financial obligations within one year. Westpac reflects its PD estimate in a customer’s risk grade (CRG).
Pre-settlement Potential future exposure on foreign exchange, interest rate and other derivative contracts.
RBA Ratings based approach Basel II provides three approaches to determine the risk–weight for a securitisation transaction, where the term securitisation includes any complex credit derivative. The ratings based approach relies on the number of assets in the transaction and the external credit rating of the tranche to determining a regulatory risk weight.
RWA Risk weighted asset The sum of all credit exposures multiplied by their Basel risk weight.
SF Supervisory formula Basel II provides three approaches to determine the risk–weight for a securitisation transaction, where the term securitisation includes any complex credit derivative. The supervisory formula is used when the ratings based approach is unable to be used.
SPS Stapled preferred securities
SPV Special purpose vehicle
Stress testing Testing of the impact of extreme market movements on the value of a portfolio.
Substitution Approach Substitutions refers to the rules governing the circumstances when capital can be reduced because an obligor’s exposure has been hedged by the purchase of credit protection from a counterparty and the counterparty’s PD is used in place of the obligors PD.

75
GLOSSARY APS 330 Prudential Disclosure Sep 2008
Abbreviation Term Explanation
Supervisory slots
Banks that do not meet the requirements for the estimation of PD for their property and project finance assets are required to map their internal risk grades to five supervisory categories, each of which is associated with a specific risk weight. These categories are also referred to as 'supervisory slots' or 'the slotting approach'.
TCE Total committed exposure TCE represents the sum of the committed portion of direct lending (including deposits placed), contingent and pre-settlement risk plus the committed portion of secondary market trading and underwriting risk (Trading and Underwriting Committed Exposure).
The Group Westpac Banking Corporation and its subsidiaries
Tier 1 capital
Comprises the capital elements which fully satisfy all of APRA’s essential criteria. The key components of the gross Tier 1 capital are shareholders funds and hybrid equity.
Tier 2 capital
Includes other elements, which to varying degrees, fall short of the quality of Tier 1 capital but still contribute to the overall strength of an entity as a going concern.
TPS Trust preferred securities
Trading book Trading book activity represents dealings that encompass book running and distribution activity. The types of market risk arising from trading activity include interest rate risk, foreign exchange risk, commodity risk, equity price risk, credit spread risk and volatility risk. Financial Markets and Group Treasury are responsible for managing market risk arising from Westpac’s trading activity.
TRC Total regulatory capital
UK United Kingdom
VaR Value at risk VaR is the potential loss in earnings from adverse market movements and is calculated over a one-day time horizon at a 99% confidence level using a minimum of one year of historical rate data. VaR takes account of all material market variables that may cause a change in the value of the trading portfolio, including interest rates, foreign exchange rates, price changes, volatility, and the correlation among these variables.
WNZL Westpac New Zealand Limited
WST Westpac Securitisation Trust program

76
Disclosure regarding forward-looking statements APS 330 Prudential Disclosure Sep 2008
Disclosure regarding forward-looking statements This report contains statements that constitute "forward-looking statements" or statements about "future matters" within the meaning of section 728(2) of the Corporations Act 2001 and/or "forward-looking statements" within the meaning of section 21E of the U.S. Securities Exchange Act of 1934. The US Private Securities Litigation Reform Act of 1995 provides a ‘safe harbour’ for forward-looking information to encourage companies to provide prospective information about themselves without fear of litigation so long as the information is identified as forward-looking and is accompanied by meaningful cautionary statements identifying important factors that could cause actual results to differ materially from those projected in the information.
Forward-looking statements appear in a number of places in this report and include statements regarding our intent, belief or current expectations with respect to Westpac's business and operations, market conditions, capital adequacy and risk management practices. We use words such as ‘may,’ ‘expect,’ ‘intend,’ ‘plan,’ ‘estimate,’ ‘anticipate,’ ‘believe,’ ‘probability,’ ‘risk’ or other similar words to identify forward-looking statements. These statements reflect our current views with respect to future events and are subject to certain risks, uncertainties and assumptions. Should one or more of the risks or uncertainties materialise, or should underlying assumptions prove incorrect, actual results may vary materially from the plans, objectives, expectations, estimates and intentions described in this report as anticipated, believed, estimated, expected or intended.
Factors that may impact on the forward-looking statements made include those described in the sections entitled "Risk factors", "Competition" and "Risk management" in Westpac's 2008 Annual Report available at www.westpac.com.au. When relying on forward-looking statements to make decisions with respect to Westpac, investors and others should carefully consider risk factors and other uncertainties and events. Westpac is under no obligation, and does not intend, to update any forward-looking statements contained in this report, whether as a result of new information, future events or otherwise, after the date of this report.
Currency of presentation and certain definitions
In this report, unless otherwise stated or the context otherwise requires, references to 'dollar amounts', '$', 'AUD' or 'A$' are to Australian dollars.
Westpac's financial year ends on 30 September. As used throughout this report, the financial year ended 30 September 2008 is referred to as 2008 and other financial years are referred to in a corresponding manner.
Any discrepancies between totals and sums of components in tables contained in this report are due to rounding.