westjet first quarter report · westjet first quarter 2019│ 3 financial and operational...
TRANSCRIPT

2019 First Quarter Report

Management’s Discussion and Analysis of Financial Condition and Operating Results For the three months ended March 31, 2019 and 2018
WestJet Airlines Ltd. First Quarter 2019 MD&A May 6, 2019

WestJet First Quarter 2019│ 1
Contents
About WestJet ............................................................. 2
Financial and Operational Highlights .............................. 3
Overview ..................................................................... 4
Outlook ....................................................................... 5
Discussion of Operations............................................... 6
Summary of Quarterly Results ..................................... 12
Guest Experience ....................................................... 13
Liquidity and Capital Resources ................................... 13
Fleet ......................................................................... 17
Off-Balance sheet arrangements and related-party transactions ............................................................... 18
Share Capital ............................................................. 19
Accounting ................................................................ 19
Controls and Procedures ............................................. 21
Forward-Looking Information ...................................... 22
Definition of Key Operating Indicators .......................... 23
Non-GAAP and Additional GAAP Measures .................... 23
Advisories
The following Management’s Discussion and Analysis of Financial Condition and Operating Results (MD&A), dated May 6, 2019, should be read in conjunction with the cautionary statement regarding forward-looking information below, as well as WestJet’s unaudited condensed consolidated interim financial statements and notes thereto for the three months ended March 31, 2019 and 2018, and our audited consolidated financial statements and notes thereto for the years ended December 31, 2018 and 2017. The consolidated financial statements have been prepared in accordance with International Financial Reporting Standards (IFRS). All amounts in the following MD&A are in Canadian dollars unless otherwise stated. References to “WestJet,” “the Corporation,” “the Company,” “we,” “us” or “our” mean WestJet Airlines Ltd. and its consolidated subsidiaries and structured entities, unless the context otherwise requires. Additional information relating to WestJet, including periodic quarterly and annual reports and Annual Information Forms, filed with Canadian securities regulatory authorities,
is available on SEDAR at sedar.com and our website at westjet.com.
Cautionary statement regarding forward-looking information
This MD&A contains “forward-looking information” as defined under applicable Canadian securities legislation. This forward-looking information typically contains the words “anticipate,” “believe,” “estimate,” “intend,” “expect,” “forecast,” “may,” “will,” “should,” “potential,” “plan,” “project” or other similar terms. Our actual results, performance or achievements could differ materially from those expressed in, or implied by, this forward-looking information. We can give no assurance that any of the events anticipated will transpire or occur or, if any of them do, what benefits or costs we will derive from them. By its nature, forward-looking information is subject to numerous risks and uncertainties including, but not limited to, the impact of general economic conditions, changing domestic and international airline industry conditions, volatility of fuel prices, terrorism, pandemics, currency fluctuations, interest rates, competition from other airline industry participants (including new entrants, capacity fluctuations and changes to the pricing environment), labour matters, government regulations, stock market volatility, the ability to access sufficient capital from internal and external sources, the decisions of Transport Canada, the Federal Aviation Administration and/or The Boeing Company (Boeing) and additional risk factors discussed in other documents we file from time to time with securities regulatory authorities, which are available on SEDAR at sedar.com or, upon request, without charge from us.
The forward-looking information, including any financial outlook, contained in this MD&A, is provided to assist investors in understanding our assessment of WestJet’s future plans, operations and expected results. The forward-looking information, including without limitation, the disclosure found in the Outlook section in this MD&A may not be appropriate for other purposes and is expressly qualified by this cautionary statement. Please refer to page 22 of this MD&A for further information on our forward-looking information including assumptions and estimates used in its development. Our assumptions and estimates relating to the forward-looking information referred to above are updated in conjunction with filing our quarterly and annual MD&A and, except as required by law, we do not undertake to update any other forward-looking information.
Non-GAAP and additional GAAP measures
Certain measures in this MD&A do not have any standardized meaning as prescribed by Generally Accepted Accounting Principles (GAAP) and, therefore, are considered non-GAAP measures. These measures are provided to enhance the reader’s overall understanding of our financial performance or current financial condition. These measures also provide investors and management with an alternative method for assessing our operating results in a manner that is focused on the performance of our ongoing operations and provide a more consistent basis for comparison between periods. These measures are not in accordance with, or an alternative to, GAAP and do not have standardized meanings.
Therefore, they may not be comparable to similar measures presented by other entities.
Please refer to page 24 of this MD&A for a reconciliation of non-GAAP measures, including cost per available seat mile (CASM), excluding fuel and employee profit share; return on invested capital (ROIC); free cash flow; diluted free cash flow per share; and diluted operating cash flow per share, and for a reconciliation of additional GAAP measures, including adjusted debt-to-equity; net debt to earnings before interest, taxes,
depreciation and other items (EBITDA); and the cash to trailing 12 months (TTM) revenue ratio.
Definitions
Various terms used throughout this MD&A are defined at page 23 under the title Definition of key operating indicators.

WestJet First Quarter 2019│ 2
About WestJet
WestJet is a Canadian airline, based in Calgary, Alberta, with expanding global operations. Through scheduled flights across a
growing network, WestJet also operates WestJet Vacations, which provides air, hotel, car and excursion packages, WestJet
Encore, a regional airline which operates a fleet of turboprop aircraft in a network of destinations in Canada and the United
States, and Swoop, an ultra-low-cost carrier (ULCC), launched to provide affordable air transportation to the most price-
sensitive travellers.
As of March 31, 2019, our airline offered scheduled service to over 100 destinations in North America, Central America, the
Caribbean and Europe with our fleet of narrow-body and wide-body Boeing aircraft, Bombardier Q400 (Q400) aircraft and
Saab 340B aircraft, operated under our capacity purchase agreement (CPA) with Pacific Coastal Airlines. When including
connectivity provided through our airline partners, including our expanded codeshare agreements, we serve over 240
destinations. We will continue to build diversity and frequency in our network through portfolio management of our fleet.
WestJet’s mission is to enrich the lives of everyone in WestJet’s world. We believe that focusing on metrics such as safety, on-
time performance, profitability, guest satisfaction and employee engagement will lead us to this goal.
Our 2022 vision for all WestJet employees focuses on three bold claims:
• We are team WestJet. WestJet is people powered.
• We are caring at our core. Air travel is better with WestJet.
• We are a global airline. Authentically Canadian. Uniquely WestJet.
This vision was co-created with WestJetters across the country and reflects our shared beliefs and values across the
organization. Guiding us every day toward accomplishing our mission and vision are our core values of acting like an owner,
caring from the heart, rising to the challenge and working together as one team.
Our focus on our people has always been fundamental to the success of our Company. In an industry that has become largely
commoditized, we recognize that WestJetters are an essential part of our business and that their commitment to caring for
our guests supports our profitable results. We remain committed to our goal to attract, train, motivate, develop and retain the
right people.
WestJet First Quarter 2019│ 3
Financial and operational highlights
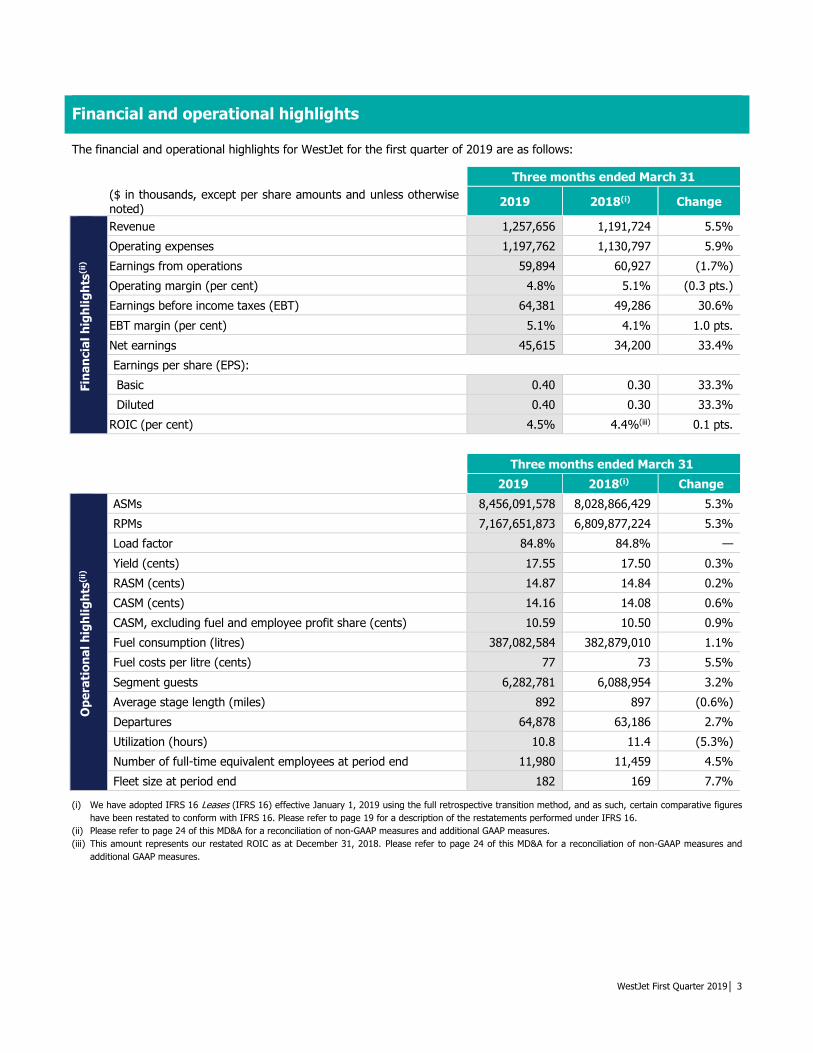
The financial and operational highlights for WestJet for the first quarter of 2019 are as follows:
Three months ended March 31
($ in thousands, except per share amounts and unless otherwise noted)
2019 2018(i) Change
Fin
an
cia
l h
igh
lig
hts
(ii)
Revenue 1,257,656 1,191,724 5.5%
Operating expenses 1,197,762 1,130,797 5.9%
Earnings from operations 59,894 60,927 (1.7%)
Operating margin (per cent) 4.8% 5.1% (0.3 pts.)
Earnings before income taxes (EBT) 64,381 49,286 30.6%
EBT margin (per cent) 5.1% 4.1% 1.0 pts.
Net earnings 45,615 34,200 33.4%
Earnings per share (EPS):
Basic 0.40 0.30 33.3%
Diluted 0.40 0.30 33.3%
ROIC (per cent) 4.5% 4.4%(iii) 0.1 pts.
Three months ended March 31
2019 2018(i) Change
Op
era
tio
na
l h
igh
lig
hts
(ii)
ASMs 8,456,091,578 8,028,866,429 5.3%
RPMs 7,167,651,873 6,809,877,224 5.3%
Load factor 84.8% 84.8% —
Yield (cents) 17.55 17.50 0.3%
RASM (cents) 14.87 14.84 0.2%
CASM (cents) 14.16 14.08 0.6%
CASM, excluding fuel and employee profit share (cents) 10.59 10.50 0.9%
Fuel consumption (litres) 387,082,584 382,879,010 1.1%
Fuel costs per litre (cents) 77 73 5.5%
Segment guests 6,282,781 6,088,954 3.2%
Average stage length (miles) 892 897 (0.6%)
Departures 64,878 63,186 2.7%
Utilization (hours) 10.8 11.4 (5.3%)
Number of full-time equivalent employees at period end 11,980 11,459 4.5%
Fleet size at period end 182 169 7.7%
(i) We have adopted IFRS 16 Leases (IFRS 16) effective January 1, 2019 using the full retrospective transition method, and as such, certain comparative figures
have been restated to conform with IFRS 16. Please refer to page 19 for a description of the restatements performed under IFRS 16.
(ii) Please refer to page 24 of this MD&A for a reconciliation of non-GAAP measures and additional GAAP measures.
(iii) This amount represents our restated ROIC as at December 31, 2018. Please refer to page 24 of this MD&A for a reconciliation of non-GAAP measures and
additional GAAP measures.

WestJet First Quarter 2019│ 4
Overview
Our 2019 first quarter financial results reported profitability with net earnings of $45.6 million and quarterly diluted earnings
per share of $0.40. Total revenue increased by 5.5 per cent year over year primarily driven by increases in guest revenue due
to year-over-year capacity and ancillary revenue increases. Our operating margin was 4.8 per cent, down 0.3 percentage
points when compared to the first quarter of 2018, as a result of the continuing increase in aircraft fuel costs, salaries and
benefits expense and other operating expenses.
We returned approximately $16.0 million to our shareholders through our dividend program in the first quarter of 2019. Since
our dividend and share buy-back programs began in 2010, we have returned approximately $1.2 billion to our shareholders.
Our 12-month ROIC of 4.5 per cent at March 31, 2019 represents a decrease of 0.1 percentage points compared to our
restated December 31, 2018 ROIC of 4.4 per cent.
We have adopted IFRS 16 Leases (IFRS 16) effective January 1, 2019 using the full retrospective transition method, and as
such, certain comparative figures have been restated to conform with IFRS 16.
WestJetters
We were pleased to announce on April 2, 2019, the ratification of a five-year compensation agreement with our WestJet and
WestJet Encore aircraft maintenance engineers which is effective from May 1, 2019. Further to this announcement, on May 2,
2019, a five-year agreement was ratified with the Air Line Pilots Association (ALPA) representing our WestJet Encore pilots.
The agreement was approved with 92 per cent of WestJet Encore pilots voting in favour of the five-year agreement, which is
effective from January 1, 2019 to December 31, 2023. Additionally, we are working to finalize the implementation of the
collective agreement, reached through binding arbitration, with respect to our WestJet and Swoop pilot groups.
During the quarter, the bargaining unit representing our WestJet cabin crew members was updated to include onboard
operations team members and cabin crew managers. Negotiations with the Canadian Union of Public Employees (CUPE) on
behalf of our WestJet cabin crew members commenced on March 25, 2019 and remains ongoing, as do negotiations with the
Canadian Airline Dispatchers Association representing our WestJet and WestJet Encore flight dispatchers. CUPE was certified
by the Canada Industrial Relations Board to represent cabin crew members at WestJet Encore following their application on
April 11, 2019.
As disclosed in our Management Information Circular, dated March 20, 2019, Messrs. Hugh Bolton and Jacques Ménard will
not be standing for re-election as members of our Board of Directors at our May 7, 2019 annual and special meeting.
Additionally, effective January 2, 2019, Mr. Arved Von Zur Muehlen was appointed Executive Vice-President and Chief
Commercial Officer and effective March 31, 2019, Ms. Barbara Munroe retired as Executive Vice-President, Corporate Services
and General Counsel and Corporate Secretary.
Guest experience and service enhancements
As part of our overall strategy, we are committed to exploring and implementing initiatives that will improve both our onboard
guest experience and the ease with which our guests do business with us. As a result of our ongoing efforts and the
dedication of our over 14,000 WestJetters to creating an exceptional guest experience, we were again recognized as the Best
Airline in Canada, for the third consecutive year, as well as a winner among Mid-Size Airlines in North America in the 2019
TripAdvisor Travellers’ Choice awards for Airlines. Additionally, the WestJet RBC® World Elite MasterCard± was again named
the top airline credit card, for the second consecutive year, by Rewards Canada in their 11th annual Canada’s Top Travel
Rewards Credit Cards feature, reflecting the preferred benefits offered by our card, including the annual companion flight,
complimentary first checked bag and expanding reciprocal frequent flyer benefits.
Effective in January 2019, we expanded the lounge benefits available under our WestJet Rewards program, providing guest
vouchers for WestJet Rewards members within all three of our premium tiers, Platinum, Gold and Silver, as well as unlimited
access for Gold and Platinum members, including their immediate family members. Guests seated in our Business cabin,
available on our Boeing 787-9 Dreamliner (Boeing 787) aircraft, also enjoy complimentary lounge access.
In February 2019, we launched our first revenue flights on our Boeing 787 aircraft with service between Calgary and Toronto,
and have carried over 66 thousand guests through the end of April 2019. Our initial fleet of Boeing 787 aircraft is based in
Calgary out of our new wide-body hangar, the construction of which was completed in April 2019. Onboard our Boeing 787
WestJet First Quarter 2019│ 5
aircraft, we offer our distinctly Canadian and uniquely WestJet service, including our restaurant-style menu served on dining
ware inspired by Canadian landscapes, as well as an exclusive amenity case which includes nourishing skin care products from
top Canadian brands. Additionally, guests onboard our Boeing 787 aircraft will experience our new bilingual animated safety
video which plays on the seatback screens in each cabin of the aircraft and replaces our live safety demonstration performed
prior to flight departure.
Network expansion and fleet
In the first quarter of 2019, our overall fleet count increased by five aircraft with the delivery of our first three Boeing 787
aircraft, financed through sale and leaseback arrangements, and two Boeing MAX aircraft, one of which is leased.
We announced our summer schedule in January 2019, adding flights to and from key business and leisure destinations, new
destinations including Portland, Oregon and Austin, Texas, as well as new domestic routes between Edmonton and St. John’s
and London (Ontario) and Montreal. The schedule also includes previously announced service to Atlanta, Georgia and
Barcelona, Spain, along with non-stop service to London (Gatwick), Paris and Dublin from Calgary on our Boeing 787 aircraft.
Additionally, Swoop’s summer schedule reflects the addition of six new markets, including service to two new domestic
destinations: Kelowna and London (Ontario).
On March 13, 2019, Transport Canada issued a safety notice closing Canadian airspace to Boeing MAX aircraft until further
notice. The Federal Aviation Administration also issued a temporary grounding order for such aircraft and Boeing has
suspended all Boeing MAX deliveries to airline customers. WestJet has 13 Boeing MAX aircraft within our fleet, representing
less than 10 per cent of our total fleet. In response to these actions, WestJet has grounded our Boeing MAX fleet and enacted
our contingency plan to minimize guest disruption and any financial impact, including adjustments to our lease return dates
and our flight schedule to move guests to other aircraft across our fleet, including our new Boeing 787 aircraft. Additionally,
while the Boeing MAX fleet is unavailable for commercial flights, these aircraft are being reconfigured with our new 2x2 seat
configuration in the Premium cabin ahead of their originally scheduled configuration dates. Our flight schedules reflect the
removal of our Boeing MAX aircraft through the end of July, and we continue to monitor the situation. The timing for the
resumption of our Boeing MAX flights is not known at this time.
Subsequent to the quarter, we announced our expanded codeshare with Air France, allowing WestJet guests travelling to Paris
to connect on codeshare flights operated by Air France to Brest, Biarritz and Montpellier, France along with Italian destinations
of Venice, Milan and Rome and Athens, Greece. Direct flights between Calgary and Paris’ Charles de Gaulle airport, operated
on our new Boeing 787 aircraft, begin May 17, 2019.
Business development
We are on track to reach our 2019 target of margin expansion of $120 million in 2019 as we continue to progress towards our
target of annualized savings of $200 million by the end of 2020. During the quarter, we partnered with a third-party
consultant to analyze five key business areas, assisting us in maximizing efficiencies and creating sustainable operating
processes during our transformation to a modern and innovative global network carrier.
Outlook
All 2019 financial guidance provided in our MD&A for the year ended December 31, 2018, as well as at our Investor Day in
December 2018, was suspended following Transport Canada’s safety notice closing Canadian airspace to Boeing MAX aircraft
until further notice, the Federal Aviation Administration’s temporary grounding order and Boeing’s decision to suspend all
Boeing MAX aircraft deliveries to customers. The financial guidance provided with respect to EPS, ROIC and cumulative free-
cash flow from 2020 to 2022 remains in place until further information is known.

WestJet First Quarter 2019│ 6
Discussion of operations
Capacity
For the three months ended March 31, 2019, our system capacity increased by 5.3 per cent over the same period in 2018
due to deliveries of nine Boeing MAX aircraft and two Q400s during the last 12 months, as well as our Boeing 787
deliveries during the first quarter of 2019 (please refer to the Fleet section in this MD&A on page 17), the launch of Swoop
in June of 2018, as well as our new regional service, WestJet Link, operated under our CPA with Pacific Coastal Airlines.
The following table depicts our capacity allocation between our domestic and transborder and international markets for the
three months ended March 31, 2019 and 2018:
Three months ended March 31
2019 2018 Change
ASMs % of total ASMs % of total ASMs
Domestic 3,251,498,347 38.5% 3,342,043,881 41.6% (2.7%)
Transborder and international 5,204,593,231 61.5% 4,686,822,548 58.4% 11.0%
Total 8,456,091,578 100.0% 8,028,866,429 100.0% 5.3%
The year-over-year decrease in domestic capacity reflects our targeted capacity reductions in certain under -performing
markets, allowing for the redeployment of aircraft to more profitable routes, as well as the impact of timing of spring
holiday travel which occurred in the second quarter of 2019, compared to the first quarter of the prior year. As well, the
grounding of our Boeing MAX fleet from March 13, 2019 onward and lower than expected flight completion in February ,
due to poor weather conditions in Eastern Canada, further contributed to the domestic capacity reduction in the first
quarter of 2019.
The majority of our transborder and international capacity growth was due to the addition of new routes as well as
increased frequency on routes between our Canadian hubs and international sun destinations.
Traffic
The following table depicts our traffic allocation between our domestic and transborder and international markets for the
three months ended March 31, 2019 and 2018:
Three months ended March 31
2019 2018 Change
RPMs % of total RPMs % of total RPMs
Domestic 2,586,424,712 36.1% 2,568,332,291 37.7% 0.7%
Transborder and international 4,581,227,161 63.9% 4,241,544,933 62.3% 8.0%
Total 7,167,651,873 100.0% 6,809,877,224 100.0% 5.3%
During the three months ended March 31, 2019, our increase in system traffic, measured in RPMs, was consistent with the
increase in capacity at 5.3 per cent year over year. Domestic traffic growth of 0.7 per cent reflects our targeted capacity
reductions in markets with weaker demand combined with our increased domestic flying on routes operated by Swoop and
WestJet Link, resulting in a slight increase in domestic load factor.
Transborder and international capacity growth for the first quarter of 2019 outpaced traffic growth for the region in light of
industry-wide increases in capacity. Additionally, peak travel related to the spring holiday was shifted from within the first
quarter in 2018, to the second quarter of 2019, impacting the comparability of the two periods.

WestJet First Quarter 2019│ 7
Revenue
Three months ended March 31
($ in thousands, unless otherwise noted) 2019 2018 Change
Guest revenue 1,178,296 1,109,307 6.2%
Other revenue 79,360 82,417 (3.7%)
Total revenue 1,257,656 1,191,724 5.5%
RASM (cents) 14.87 14.84 0.2%
Load factor 84.8% 84.8% —
Yield (cents) 17.55 17.50 0.3%
During the first quarter of 2019, total revenue increased by 5.5 per cent to $1,257.7 million, compared to $1,191.7 million in
the first quarter of 2018, due to increases in capacity and ancillary revenues, partially offset by a decrease in other revenue.
On an ASM basis, revenue increased by 0.2 per cent to 14.87 cents, from 14.84 cents in the same quarter of 2018 due to the
slight improvement in flight yield.
Guest revenue
Guest revenue is comprised of ticket sales for scheduled domestic and transborder and international flights, the air component
of vacation packages, as well as ancillary revenues such as fees associated with guest itinerary changes or cancellations,
Premium and Business cabin upgrades, baggage fees, buy-on-board sales, pre-reserved seating fees and certain revenues
related to our co-branded credit card program.
Three months ended March 31
($ in thousands) 2019 2018 Change
Guest revenue – domestic 465,214 452,192 2.9%
Guest revenue – transborder and international 586,962 547,653 7.2%
Ancillary revenue 126,120 109,462 15.2%
Total guest revenue 1,178,296 1,109,307 6.2%
For the three months ended March 31, 2019, guest revenue increased to $1,178.3 million, from $1,109.3 million in the first
quarter of 2018, due to our stable load factor of 84.8 per cent on a capacity increase of 5.3 per cent, combined with a slight
improvement in flight yield and increased ancillary revenues.
Ancillary revenue provides an opportunity to sell higher-margin goods and services while enhancing our overall guest
experience by providing guests with additional products and services to meet their needs. The following table presents
ancillary revenue and ancillary revenue on a per guest basis for the three months ended March 31, 2019 and 2018:
Three months ended March 31
2019 2018 Change
Ancillary revenue ($ in thousands) 126,120 109,462 15.2%
Ancillary revenue per guest 20.47 18.58 10.2%
For the three months ended March 31, 2019, ancillary revenue was $126.1 million, an increase of 15.2 per cent from $109.5
million in the first quarter of 2018. This increase is due to the increased baggage fees implemented in the fourth quarter of
2018, recognition of ancillary revenue generated through Swoop’s sale of unbundled fares, as well as increased frequency of
pre-reserved seat purchases during the period as compared to the prior year.
On a per guest basis, ancillary fees for the quarter increased by 10.2 per cent to $20.47 per guest, from $18.58 per guest in
the first quarter of 2018, largely due to increased per guest spend on baggage fees.
Other revenue
Included in other revenue are amounts related to WestJet Vacations’ non-air revenue, cargo revenue, our charter operations
and the brand value licensing component of our co-branded credit card program. For the three months ended March 31, 2019,
other revenue decreased by 3.7 per cent to $79.4 million from $82.4 million in the same period of 2018, primarily due to the

WestJet First Quarter 2019│ 8
decrease in revenue from our charter operations which was partially offset by increased revenue generated by our WestJet
Vacations packages and our co-branded credit card program.
Expenses
Expense ($ in thousands) CASM (cents)
Three months ended March 31 Three months ended March 31
2019 2018(i) Change 2019 2018(i) Change
Aircraft fuel 296,922 281,151 5.6% 3.51 3.50 0.3%
Salaries and benefits 269,576 255,125 5.7% 3.19 3.18 0.3%
Rates and fees 175,203 168,930 3.7% 2.07 2.10 (1.4%)
Depreciation and amortization 157,806 146,499 7.7% 1.87 1.82 2.7%
Sales and marketing 126,096 119,579 5.4% 1.49 1.49 —
Maintenance 51,563 49,995 3.1% 0.61 0.62 (1.6%)
Other 115,347 103,134 11.8% 1.36 1.29 5.4%
Employee profit share 5,249 6,384 (17.8%) 0.06 0.08 (25.0%)
Total operating expenses 1,197,762 1,130,797 5.9% 14.16 14.08 0.6%
Total, excluding fuel and employee profit share
895,591 843,262 6.2% 10.59 10.50 0.9%
(i) We have adopted IFRS 16 effective January 1, 2019 using the full retrospective transition method, and as such, certain comparative figures have been
restated to conform with IFRS 16. Please refer to page 19 for a description of the restatements performed under IFRS 16.
During the three months ended March 31, 2019, operating expenses totaled $1,197.8 million or 14.16 cents per ASM, an
increase of 5.9 per cent and 0.6 per cent, respectively, from $1,130.8 million and 14.08 cents per ASM for the same period in
2018. These increases reflect the year-over-year ASM growth of 5.3 per cent, as well as per ASM increases in other operating
expenses.
Aircraft fuel
Three months ended March 31
2019 2018 Change
Aircraft fuel expense ($ in thousands) 296,922 281,151 5.6%
Aircraft fuel expense as a percent of operating expenses 24.8% 24.9% (0.1 pts.)
Fuel consumption (litres) 387,082,584 382,879,010 1.1%
Fuel cost per litre (cents) 77 73 5.5%
Fuel remains a significant cost representing 24.8 per cent of total operating expenses for the three months ended March 31,
2019 (March 31, 2018 – 24.9 per cent). Aircraft fuel expense for the three months ended March 31, 2019 increased by 5.6 per
cent to $296.9 million, from $281.2 million in the same period in 2018. Our fuel costs per litre for the three months ended
March 31, 2019 increased by 5.5 per cent, to 77 cents per litre from 73 cents per litre in the prior year, primarily due to the
year-over-year increase in the average market price for jet fuel in Canadian dollars, combined with a slight increase in fuel
consumption in the first quarter of 2019. Fuel consumption for the three months ended March 31, 2019 increased by 1.1 per
cent year over year on a capacity increase of 5.3 per cent due to the growth of increasingly fuel-efficient aircraft within our
fleet combined with the implementation of numerous fuel-saving initiatives identified through our cost-saving program which
was launched in the second quarter of 2018.
For 2019, we estimate our sensitivity of fuel costs to changes in crude oil to be approximately US $9.6 million annually for
every one US dollar change per barrel of West Texas Intermediate crude oil. Additionally, we estimate our sensitivity of fuel
costs to changes in fuel pricing for 2019 to be approximately $15.3 million for every one-cent change per litre of fuel. Fuel
prices continue to be volatile due to global economic and geopolitical factors, which are outside of our control and which make
accurate predictions difficult. We estimate that every one-cent change in the value of the Canadian dollar versus the US dollar
will have an approximate impact of $8.1 million on fuel costs for 2019.
As at March 31, 2019, we have no fuel derivative contracts outstanding. We will continue to monitor and adjust to movements
in fuel prices and may re-visit our hedging strategy as changing markets and competitive conditions warrant.

WestJet First Quarter 2019│ 9
Salaries and benefits
Our compensation philosophy is designed to align corporate and personal success. We have created a compensation program
whereby a portion of our compensation expenses are variable and are tied to our financial results. Our compensation strategy
encourages employees to become owners in WestJet, which creates a personal vested interest in our financial results and
operational accomplishments.
Three months ended March 31
($ in thousands, except FTE data) 2019 2018 Change
Salaries and benefits plans 240,748 226,215 6.4%
Employee stock purchase plan 25,358 25,032 1.3%
Share-based payment plans 3,470 3,878 (10.5%)
Total salaries and benefits 269,576 255,125 5.7%
Full-time equivalent employees (FTE) 11,980 11,459 4.5%
Salaries and benefits expense for the three months ended March 31, 2019 was $269.6 million, a $14.5 million or 5.7 per cent
increase from $255.1 million in 2018.
Salaries and benefits plans
Compensation, including salary levels and participation in benefits plans are determined via a framework of job levels based
on internal experience and external market data. During the first quarter of 2019, salaries and benefits plans expense
increased by 6.4 per cent to $240.7 million, from $226.2 million in the same period of 2018. This increase was primarily due to
an increase in our total number of full-time equivalent employees to 11,980 at March 31, 2019 (March 31, 2018 – 11,459)
resulting primarily from hiring at Swoop, which commenced operations in the second quarter of 2018. Additionally, the salaries
and benefits plans expense in the first quarter of 2019 also includes costs related to the collective agreement governing the
employment terms and conditions of WestJet mainline and Swoop pilots.
Employee stock purchase plan (ESPP)
The ESPP encourages employees to become owners of WestJet and provides employees with the opportunity to significantly
enhance their earnings. Under the terms of the ESPP, employees may, dependent on their employment agreement, contribute
a percentage of their gross salary to acquire voting shares of WestJet at the current fair market value. The contributions are
matched by WestJet and are required to be held within the ESPP for a period of one year. At March 31, 2019, 78.5 per cent
(March 31, 2018 – 81.3 per cent) of our eligible active employees participated in the ESPP, contributing an average of 12.2
per cent (March 31, 2018 – 13.5 per cent) of their gross salaries. Under the terms of the ESPP, we acquire voting shares on
behalf of employees through open market purchases. For the three months ended March 31, 2019, our matching expense was
$25.4 million, a 1.3 per cent increase from $25.0 million in the same period in 2018, driven by the increased number of
participating employees compared to the prior year, driven by the year-over-year growth in headcount.
Share-based payment plans
We have three equity-settled share-based payment plans whereby either stock options, restricted share units (RSUs) or
performance share units (PSUs) may be awarded to pilots, senior executives and certain non-executive employees. Our
equity-settled share-based payments are measured at the fair value of the instrument granted and recognized as
compensation expense with a corresponding increase in equity reserves on a straight-line basis over the related service period
based on the number of awards expected to vest. For the three months ended March 31, 2019, share-based payment expense
totaled $3.5 million, representing a decrease of 10.5 per cent from the $3.9 million recognized in the same period in the prior
year. This decrease relates primarily to the downward revision in the estimated number of PSUs expected to vest within the
next two years.

WestJet First Quarter 2019│ 10
Other operating expenses
The following table provides a breakdown of the more significant items included in other operating expenses:
Expense ($ in thousands) CASM (cents)
Three months ended March 31
2019 2018(i) Change 2019 2018(i) Change
General and administrative 34,710 25,335 37.0% 0.41 0.32 28.1%
Travel and training 33,069 30,016 10.2% 0.39 0.37 5.4%
Technical support 19,244 17,936 7.3% 0.23 0.22 4.5%
Remaining other operating expenses 28,324 29,847 (5.1%) 0.33 0.38 (13.2%)
Total other operating expenses 115,347 103,134 11.8% 1.36 1.29 5.4%
(i) We have adopted IFRS 16 effective January 1, 2019 using the full retrospective transition method, and as such, certain comparative figures have been
restated to conform with IFRS 16. Please refer to page 19 for a description of the restatements performed under IFRS 16.
During the three months ended March 31, 2019, our other operating expense was $115.3 million, a $12.2 million or 11.8 per
cent increase from $103.1 million for the same period in 2018. Other operating expense per ASM was 1.36 cents for the three
months ended March 31, 2019, an increase of 5.4 per cent from 1.29 cents in the same period of 2018. These increases were
driven primarily by increased general and administrative and travel and training costs.
General and administrative expenses for the three months ended March 31, 2019 increased 37.0 per cent to $34.7 million,
from $25.3 million in the same period of 2018, due to increased consulting and legal fees related to ongoing projects and
charges incurred related to the service component of our CPA agreement with Pacific Coastal Airlines which commenced in the
second quarter of 2018.
Travel and training expenses for the three months ended March 31, 2019 increased 10.2 per cent to $33.1 million, from $30.0
million in the same period of 2018, due to increased accommodation costs associated with our expanded transborder and
international network as well as additional training costs on our year-over-year growth in headcount.
Employee profit share
All employees are eligible to participate in the employee profit sharing plan. As the profit share system is a variable cost plan,
employees receive larger awards when we are more profitable. Conversely, the amount distributed to employees is reduced
and adjusted in less profitable periods. Our profit share expense for the three months ended March 31, 2019, was $5.2
million, a 17.8 per cent decrease from $6.4 million in the same period of the prior year. The year-over-year decrease was
directly attributable to lower earnings eligible for profit share compared to the prior year.
Foreign exchange
The gain or loss on foreign exchange included in our condensed consolidated statement of earnings is mainly attributable to
the effect of the changes in the value of our US-dollar-denominated net monetary assets and liabilities. Monetary assets
consist mainly of US dollar cash, cash equivalents and marketable securities, accounts receivable, security deposits on various
leased aircraft, and maintenance reserves paid to lessors, offset by monetary liabilities of US dollar accounts payable and
accrued liabilities, lease obligations recognized under IFRS 16 and maintenance provisions on leased aircraft. As part of our
Foreign Currency Risk Management Policy we hold US-dollar-denominated cash and short-term investments and enter into US
dollar foreign exchange forward contracts to mitigate a portion of the foreign currency exposure risk we experience on our
balance sheet, operating margins and cash flows.
At March 31, 2019, US-dollar-denominated net monetary liabilities totaled approximately US $624.8 million compared to
restated net monetary liabilities of US $385.9 million at December 31, 2018. The increase in US-dollar-denominated net
monetary liabilities from December 2018 is largely due to an increase in US-dollar-denominated lease obligations for leases
executed during the first quarter of 2019. During the three months ended March 31, 2019, our foreign exchange gain was
$6.8 million compared to a restated foreign exchange loss of $7.1 million in the same period of 2018. The gain on foreign
exchange in the first quarter of 2019 was predominantly driven by an unrealized foreign exchange gain related to the
revaluation of net-monetary liability balances at a lower period end US dollar foreign exchange rate compared to the rate in
effect on December 31, 2018. For the first quarter of 2018, the revaluation of our restated net monetary liability balances
resulted in an unrealized loss on foreign exchange of approximately $8.2 million, reflecting the increase in the US dollar

WestJet First Quarter 2019│ 11
exchange rate during the first quarter of 2018. The unrealized gain on foreign exchange for the first quarter of 2019 was
partially reduced by a realized loss on foreign exchange related to the settlement of US dollar payables at a higher average
exchange rate compared to those settled in the first quarter of 2018.
We periodically use financial derivatives to manage our exposure to foreign exchange risk. At March 31, 2019, to fix the
exchange rate on a portion of our US-dollar-denominated hotel costs and aircraft lease payments, we have foreign exchange
forward contracts for an average of US $14.3 million per month for the period of April 2019 to March 2020, for a total of US
$171.8 million, at a weighted average contract price of 1.3155 Canadian dollars to one US dollar.
We have designated certain contracts under our foreign exchange hedging program for cash flow hedge accounting, while
other contracts do not qualify for hedge accounting or have not been designated as a hedging instrument. Under cash flow
hedge accounting, the effective portion of the change in the fair value of the hedging instrument is recognized in hedge
reserves, while any ineffective portion is recorded directly to net earnings as a non-operating gain or loss. Upon maturity of
the derivative instrument, the effective gains and losses previously recognized in hedge reserves are recorded in net earnings
as a component of the expenditure to which they relate. Those contracts not designated under cash flow hedge accounting
have the change in fair value recorded directly in net earnings as a non-operating gain or loss. The fair value of the foreign
exchange forward contracts presented on the condensed consolidated statement of financial position is measured based on
the difference between the contracted rate and the current forward price obtained from the counterparty, which can be
observed and corroborated in the marketplace.
The following table presents the financial impact and statement presentation of our foreign exchange derivatives related to
our US-dollar-denominated hotel costs and aircraft lease payments on the condensed consolidated statement of financial
position at March 31, 2019 and December 31, 2018 and on the condensed consolidated statement of earnings for the three
months ended March 31, 2019 and 2018:
March 31 December 31
($ in thousands) Statement presentation 2019 2018
Statement of Financial Position:
Fair value Prepaid expenses, deposits and other 3,391 13,113
Fair value Accounts payable and accrued liabilities (507) (30)
Unrealized gain/(loss) Hedge reserves (before tax) 2,400 11,888
Three months ended March 31
($ in thousands) Statement presentation 2019 2018
Statement of Earnings:
Realized gain/(loss) Gain (loss) on foreign exchange(i) 1,590 (1,448)
Realized gain Other revenue 1,398 860
Realized loss Gain (loss) on derivatives (256) (59)
Unrealized gain/(loss) Gain (loss) on derivatives (449) 124
(ii) We have adopted IFRS 16 effective January 1, 2019 using the full retrospective transition method, and as such, certain comparative figures have been
restated to conform with IFRS 16. Settlement of cash flow hedges of aircraft leasing payments, accounted for using hedge accounting, were previously
captured within Aircraft leasing line item of the statement of earnings. Please refer to page 19 for a description of the restatements performed under IFRS 16.
Additionally, we entered into fixed US dollar to fixed Canadian dollar uncollateralized cross-currency interest rate swap
agreements (the cross-currency swaps) to mitigate our exposure to fluctuations in the Canadian to US dollar exchange rate on
interest payments on the US-dollar-denominated notes (US Dollar Notes). The cross-currency swap terms are from June 16,
2016 to June 16, 2021, which matches the five-year maturity of the US Dollar Notes. We designated the cross-currency swap
contracts as effective cash flow hedges for accounting purposes. The fair value of the cross-currency swap contracts was
determined by discounting future cash flows over the remaining term of the swaps at market rates of interest and quoted
foreign exchange rates.

WestJet First Quarter 2019│ 12
The following table presents the financial impact and statement presentation of the cross-currency swaps on the condensed
consolidated statement of financial position at March 31, 2019 and December 31, 2018:
March 31 December 31
($ in thousands) Statement presentation 2019 2018
Statement of Financial Position:
Fair value Prepaid expenses, deposits and other 469 845
Fair value Other assets 17,426 28,963
Unrealized gain Hedge reserves (before tax) 17,895 29,808
At March 31, 2019, we estimate that every one-cent change in the value of the Canadian dollar versus the US dollar will have
an approximate impact of $11.9 million on our annual unhedged operating costs (approximately $8.1 million for fuel and $3.8
million related to other US-dollar-denominated operating expenses).
We also have a significant amount of our future purchase obligations, including certain aircraft, exposed to foreign exchange
risk. At March 31, 2019, we estimate every one-cent change in the value of the Canadian dollar versus the US dollar would
have an approximate impact of $30.5 million on our future US-dollar-denominated purchase obligations.
Gain on disposal of property and equipment
During the three months ended March 31, 2019, we recognized a gain on disposal of property and equipment of $14.9 million
on total proceeds from disposition of $578.2 million, primarily due to the sale and leaseback of our three Boeing 787 aircraft
delivered during the first quarter of 2019. No such gain was recognized in the same period of the prior year. These aircraft
have been recognized as right-of-use assets and lease obligations in the statement of financial position in accordance with
IFRS 16, with lease terms of 12 years each.
Income taxes
Our effective consolidated income tax rate for three months ended March 31, 2019 was 29.1 per cent, as compared to 30.6
per cent for the same period in 2018. The year-over-year decrease in our effective tax rate is primarily due to higher
comparative earnings. As earnings increase, the impact of relatively fixed permanent differences on the overall effective tax
rate is less pronounced, resulting in a corresponding decrease in the rate.
Summary of quarterly results
Three months ended
($ in thousands, except per share data) Mar. 31
2019 Dec. 31
2018 Sep. 30
2018 Jun. 30 2018
Total revenue 1,257,656 1,193,263 1,260,902 1,087,573
Net earnings 45,615 5,551 70,059 (15,826)
Basic earnings per share 0.40 0.05 0.61 (0.14)
Diluted earnings per share 0.40 0.05 0.61 (0.14)
Three months ended
($ in thousands, except per share data)
Mar. 31
2018
Dec. 31
2017(i)
Sep. 30
2017(i)
Jun. 30
2017(i)
Total revenue 1,191,724 1,119,079 1,214,624 1,058,282
Net earnings 34,200 47,806 135,937 48,611
Basic earnings per share 0.30 0.42 1.17 0.42
Diluted earnings per share 0.30 0.41 1.15 0.41
(i) The quarterly results for 2017 comparative periods have not been restated under IFRS 16 and are presented in accordance with previous IFRS standards.
Our business is seasonal in nature with varying levels of activity throughout the year. We experience increased domestic travel
in the summer months (second and third quarters) and more demand for transborder and international sun destinations over
the winter period (first and fourth quarters). With our transborder and international destinations, we have been able to

WestJet First Quarter 2019│ 13
partially alleviate the effects of seasonality on our net earnings. Our operating results could also vary from this trend due to
changes in general economic conditions and consumer behaviour, among other things.
Our results for the year ended December 31, 2018 reflect revenue and net earnings fluctuations consistent with historical
trends, with the first and third quarters of the year representing our most profitable periods. However, despite growing
revenue, we faced downward pressure on net earnings throughout the year as a result of increased costs incurred in the first
quarter related to weather delays and cancellations, threatened industrial action in the second quarter which impacted
revenue and expenses into the third quarter due to reduced bookings, fare reductions to stimulate demand due to increased
competition within domestic markets and significant increases in aircraft fuel prices.
We continue to focus on positioning our airline for successful expansion of our widebody service, with deliveries of our first
three Boeing 787 aircraft during the first quarter of 2019 for service to a growing number of global destinations, enhancing
our product and service offerings, including our WestJet Rewards program, to appeal to premium travellers across our
network, and continued focus on enhancing our network through increased frequencies at our primarily domestic hub airports.
Guest experience
At WestJet, we are focused on meeting the needs of our guests while maintaining the highest safety standards. We are
committed to delivering a positive guest experience at every stage of our service, from the time the flight is booked to its
completion. Key performance indicators
On-time performance, indicating the percentage of flights that arrive within 15 minutes of their scheduled time, is a key factor
in measuring the quality of our guest experience. The completion rate indicator represents the percentage of flights completed
of the flights originally scheduled. Our mishandled bag ratio represents the number of delayed, lost, damaged or pilfered
baggage claims made per 1,000 guests.
Three months ended March 31
2019 2018 Change
On-time performance 72.5% 68.9% 3.6 pts.
Completion rate 96.6% 96.4% 0.2 pts.
Mishandled bag ratio 5.15 6.03 (14.6%)
The first quarter of 2019 delivered year-over-year performance improvements in all three key performance indicators. Our on-
time performance metric increased 3.6 percentage points primarily due to milder weather throughout January and March,
leading to a reduced number of days we operated under conditions of irregular operations as compared to the first quarter of
2018. As a result of our ongoing efforts to identify and implement improvements to our flight operations, we were recognized
in Cirium’s 2018 Performance Awards in On-Time Excellence as a top 10 North American Major Airline for the sixth consecutive
year.
Our completion rate and mishandled bag ratio for the three months ended March 31, 2019 both improved year-over-year,
largely due to the milder weather throughout much of the period compared to the first quarter of 2018. Additionally, when
adjusted to exclude the impact of flight cancellations related to the unplanned grounding of our Boeing MAX fleet in March
2019, the completion rate improves slightly to 96.7 per cent. We continue to implement and execute our contingency plans to
minimize guest disruption, including replacing flights intended to operate using our Boeing MAX aircraft with other aircraft.
Liquidity and Capital Resources
Liquidity The airline industry is highly sensitive to unpredictable circumstances and, as such, maintaining a strong financial position is
imperative to an airline’s success. We completed the first quarter of 2019 with a cash, cash equivalent and marketable
securities balance of $1,614.8 million, compared to $1,279.6 million at December 31, 2018. Through our revenue generating
and cost saving initiatives, supplemented by available borrowings under our existing or new financing sources, including our

WestJet First Quarter 2019│ 14
$400 million undrawn revolving credit facility, we expect to be able to generate sufficient cash in both the short and long-term
to maintain our current capacity and fund our future planned growth.
We use our working capital to settle our operating expenses, the current portion of long-term debt and lease obligations,
payments of dividends and interest. In addition to our restricted cash requirements, detailed below, our contractual
obligations and commitments (please refer to Contractual obligations and commitments section in this MD&A on page 17)
summarizes certain of our liquidity and working capital requirements as at March 31, 2019.
Our current ratio, defined as current assets over current liabilities, has remained relatively stable at 0.74 at March 31, 2019 as
compared to our restated current ratio of 0.75 at December 31, 2018. As at March 31, 2019, both our $400 million Canadian
dollar senior unsecured notes and our $255.0 million unsecured term loan are classified as current due to their current
maturity of July 2019 and January 2020, respectively. During the first quarter of 2019, we finalized the sale and leaseback of
our first three Boeing 787 deliveries, the proceeds from which will help fund our capital commitment requirements for 2019. A
gain of $13.8 million on the sale and leaseback transactions was recorded on the condensed consolidated statement of
earnings for the aircraft, in accordance with IFRS 16.
In addition to our cash, cash equivalents and marketable securities balance of $1,614.8 million at March 31, 2019, we have
available our undrawn revolving credit facility of $400.0 million, totaling $2,014.8 million in unrestricted liquidity (please refer
to the section Capital Resources on page 16 of this MD&A). In the near term, we continue to evaluate the optimum balance
and sources of financing available to us based on internal requirements and our preparations for upcoming maturities of
existing debt, as well as the external environment for aircraft financing.
The following table lists our restricted cash balances as at March 31, 2019 and December 31, 2018.
March 31
2019 December 31
2018 Change
Cash held in trust for WestJet Vacations Inc. 67,750 79,403 (11,653)
Security on facilities for letters of guarantee 34,514 34,684 (170)
Passenger facility charges 1,147 1,528 (381)
Total restricted cash 103,411 115,615 (12,204)
Restricted cash related to WestJet Vacations relates to vacation package sales to guests in Ontario, where regulations require
us to hold the cost of the vacation package in trust until the guest departs. Due to the seasonality in our vacation package
sales, this balance generally decreases over the Canadian summer months and increases later in the year when demand for
travel to sun destinations increases. Additionally, for certain foreign jurisdictions, we are required to hold letters of guarantee
for certain guest ticket taxes. The letters of guarantee were issued under our revolving letter of credit facility by assigning
restricted cash.
Our cash, cash equivalents and marketable securities balance includes cash collected with respect to advance ticket sales. At
March 31, 2019, we had cash on hand of 2.08 (December 31, 2018 – 1.84) times our advance ticket sales balance. We have
cash, cash equivalents and marketable securities on hand to have sufficient liquidity to meet our liabilities, when due, under
both normal and stressed conditions.
We monitor capital on a number of measures, including the following ratios:
March 31
2019 December 31
2018 Change
Cash to TTM revenue(i)(ii) 33.6% 27.0% 6.6 pts.
Adjusted debt-to-equity ratio(i) 1.28 1.13 13.3%
Net debt to EBITDA(i) 1.62 1.59 1.9%
(i) We have adopted IFRS 16 effective January 1, 2019 using the full retrospective transition method, and as such, certain comparative figures have been restated to conform with IFRS 16. Please refer to page 19 of this MD&A for a description of the restatements performed under IFRS 16 and page 24 for a reconciliation of non-GAAP and additional GAAP measures.
(ii) In addition to our cash and cash equivalents, as of March 31, 2019, we have available our entire $400.0 million revolving credit facility that expires in June 2022 (please refer to the section Capital Resources found on page 16 of this MD&A).
As of March 31, 2019, our cash to TTM revenue ratio increased by 6.6 percentage points to 33.6 per cent, from 27.0 per cent
at December 31, 2018, which is temporarily above our internal target of approximately 30 per cent due to the receipt of
proceeds from the sale and leaseback transactions with respect to the delivery of our first three Boeing 787 aircraft in the

WestJet First Quarter 2019│ 15
quarter. In addition to our cash, cash equivalents and marketable securities, as of March 31, 2019 we have available $400.0
million as the undrawn portion of our revolving credit facility (please refer to the section Capital Resources found on page 16
of this MD&A).
Our March 31, 2019 adjusted debt-to-equity ratio of 1.28 and our net debt to EBITDA ratio of 1.62 both increased from the
restated measures of 1.13 and 1.59, respectively, at December 31, 2018 due to the additional lease obligations recognized
during the first quarter of 2019 related to the three Boeing 787 deliveries, financed through sale and leaseback transactions,
as well as the delivery of a leased Boeing MAX aircraft. Both ratios continue to meet our internal threshold of not more than
2.5.
Select cash flow information Three months ended March 31
($ in thousands) 2019 2018(i) Change
Cash provided by operating activities 413,105 273,190 139,915
Less:
Cash provided (used) by investing activities 36,086 (154,001) 190,087
Cash used by financing activities (107,356) (86,039) (21,317)
Cash flow from operating, investing and financing activities 341,835 33,150 308,685
Effect of foreign exchange on cash and cash equivalents (5,856) 7,231 (13,087)
Net change in cash and cash equivalents 335,979 40,381 295,598
Cash and cash equivalents, beginning of period 1,185,806 1,147,076 38,730
Cash and cash equivalents, end of period 1,521,785 1,187,457 334,328 (i) We have adopted IFRS 16 Leases (IFRS 16) effective January 1, 2019 using the full retrospective transition method, and as such, certain comparative figures
have been restated to conform with IFRS 16.
Operating cash flows
For the quarter ended March 31, 2019, our cash provided by operating activities increased 51.2 per cent to $413.1 million
compared to $273.2 million in the same quarter of the prior year, primarily due to contributions from working capital.
Similarly, for the quarter ended March 31, 2019, our diluted operating cash flow per share increased 52.3 per cent to $3.61
per diluted share, compared to $2.37 per diluted share in the same period of the prior year, due to the increase in cash
provided by operations.
Investing cash flows
For the quarter ended March 31, 2019, cash inflow from investing activities totaled $36.1 million as compared to cash outflow
of $154.0 million in the same period of the prior year. The majority of our investing activities during the first quarter of 2019
related to the net proceeds received from the sale and leaseback of the three Boeing 787 aircraft delivered in the quarter,
partially offset by the delivery of one purchased Boeing MAX aircraft, and payment of additional deposits for future Boeing
MAXs and Boeing 787 aircraft and overhauls of owned engines.
Financing cash flows
For the quarter ended March 31, 2019, our cash used by financing activities totaled $107.4 million as compared to $86.0
million in the same period of the prior year. Our financing activities in the first quarter of 2019 consisted mainly of cash
outflows related to repayments of long-term debt and lease obligations of $70.0 million, cash interest paid of $20.0 million
and dividends paid of $16.0 million. Cash from financing activities in the first quarter of 2018 also included $20.6 million in
proceeds from the financing of a Q400 aircraft delivery.
On transition to IFRS 16, the repayment of lease obligations was reclassified from cash provided by operating activities to
financing activities.
Free cash flow
Free cash flow is a non-GAAP measure that represents the cash that a company is able to generate after meeting its
requirements to maintain or expand its asset base. It is a calculation of operating cash flow, less the amount of cash used in
investing activities related to property and equipment. Our free cash flow for the three months ended March 31, 2019, was
$452.6 million or $3.96 per diluted share, as compared to a $120.4 million or $1.04 per diluted share in the same period of
WestJet First Quarter 2019│ 16
the prior year. This year-over-year increase was due to the cash inflow for aircraft additions net of disposals due to the sale
and leaseback of our first three Boeing 787 aircraft.
Please refer to page 24 of this MD&A for a reconciliation of non-GAAP and additional GAAP measures.
Capital Resources
During the first quarter of 2019, our owned Boeing MAX aircraft delivery was funded with cash. At March 31, 2019, we have
secured loans financing 14 Boeing 737 NG aircraft and 45 Q400 aircraft with a remaining debt balance of $755.7 million, net
of transaction costs. This debt is financed in Canadian dollars and has no financial covenants associated with it. At the date of
this MD&A, we have a total of 78 unencumbered aircraft, representing over 40 per cent of our total fleet. This provides us
with additional liquidity to manage our capital resource requirements through varying arrangements such as direct sales,
leaseback agreements and the issuance of secured debt.
At March 31, 2019, we have not drawn on our revolving credit facility and therefore the undisbursed portion of the credit
facility was $400.0 million on which we pay a standby fee. Additionally, $255.0 million of our four-year term credit facility,
drawn using Canadian dollar bankers’ acceptances, remained outstanding as at March 31, 2019. Interest is calculated by
reference to the applicable base rate plus an applicable pricing margin based on our corporate debt credit ratings. Both our
revolving and non-revolving credit facilities contain two financial covenants: (i) minimum pooled asset coverage ratio of 1.5 to
1, and (ii) minimum fixed charge coverage ratio of 1.25 to 1. At March 31, 2019, WestJet was in compliance with both ratios.
Additionally, at March 31, 2019, the present value of future lease payments associated with our aircraft, real estate and
equipment lease contracts, was $962.1 million. Our total outstanding long-term debt and lease obligations balance at March
31, 2019 is $2,904.1 million, net of transaction costs (December 31, 2018 - $2,526.0 million).
Finance cost
During the three months ended March 31, 2019, we incurred $22.6 million in finance cost (March 31, 2018 - $21.1 million) on
our long-term debt and lease obligations. During the quarter, $3.0 million of interest was capitalized (March 31, 2018 - $4.9
million) as it related to deposits paid for Boeing aircraft.
We mitigate the earnings impact of changing interest rates on our variable rate loans through our interest rate swap
agreements to fix the interest rates over the term of the loans. At March 31, 2018, the interest rate swap contracts continue
to meet the criteria for designation as effective cash flow hedges for accounting purposes. The following table presents the
financial impact and statement presentation of the interest rate swap agreements on the condensed consolidated statement of
financial position at March 31, 2019 and December 31, 2018 and on the condensed consolidated statement of earnings for the
three months ended March 31, 2019 and 2018:
March 31 December 31
($ in thousands) Statement presentation 2019 2018
Statement of Financial Position:
Fair value Prepaid expenses, deposits and other 1,771 2,743
Fair value Accounts payable and accrued liabilities (745) (504)
Fair value Other assets — 40
Fair value Other liabilities (2,128) (1,150)
Unrealized gain/(loss) Hedge reserves (before tax) (164) 2,067
Three months ended March 31
($ in thousands) Statement presentation 2019 2018
Statement of Earnings:
Realized gain/(loss) Finance costs 568 (143)
The fair value of the interest rate swap agreements is measured based on the difference between the fixed swap rate and the
forward curve for the applicable floating interest rates obtained from the counterparty, which can be observed and
corroborated in the marketplace. In addition to the interest rate swap agreements, in June 2016, we also entered into a cross
currency interest rate swap to fix the cash flow exposure to fluctuations in the foreign exchange rate on the notional and
interest portions of the US-Dollar Notes (please refer to the section Foreign exchange on page 10 of this MD&A).

WestJet First Quarter 2019│ 17
Credit Ratings
On April 4, 2019, Moody’s Investors Service downgraded our senior unsecured ratings to Ba2, from Baa3, withdrew our Baa3
issuer rating and changed our ratings outlook to stable, from negative. As at March 31, 2019, our ‘BBB-’ long-term corporate
credit rating and negative outlook from Standard & Poor’s Rating Services remained unchanged from December 31, 2018.
Credit ratings are intended to provide investors with an external measure of our overall creditworthiness. Credit ratings are
not recommendations to buy, sell or hold our securities and do not address the market price or suitability of a specific security
for a particular investor. There is no assurance that our ratings will remain in effect for any given period of time or that our
ratings will not be revised or withdrawn entirely by the credit rating agencies in the future if, in their judgment, circumstances
so warrant.
Contractual obligations and commitments
At March 31, 2019, our contractual obligations and commitments are indicated in the following table. All US dollar amounts
have been converted at the period-end foreign exchange rate in effect at March 31, 2019 and presented in Canadian dollars.
($ in thousands) Total < 1 year 2 - 3 years 4 - 5 years Over 5 years
Long-term debt and lease repayments(i) 3,240,445 1,008,408 1,077,906 415,822 738,309
Contractual commitments(ii) 191,696 68,747 100,862 17,161 4,926
Purchase obligations(iii) 4,070,413 668,432 1,497,343 870,142 1,034,496
Total contractual obligations(iv) 7,502,554 1,745,587 2,676,111 1,303,125 1,777,731
(i) Includes contractual principal and interest payments on long-term debt and lease obligations.
(ii) Relates to commitments for computer hardware, software licenses and inflight entertainment.
(iii) Relates to obligations for our confirmed purchased aircraft deliveries for Boeing MAXs, Boeing 787s and spare engines.
(iv) Total contractual obligations exclude long-term liabilities, other than long-term debt and lease repayments, due to reasons of uncertainty of timing and
amount of cash flows.
Our future US-dollar-denominated purchase commitments, including certain aircraft, are exposed to foreign exchange risk
(please refer to the section Foreign exchange on page 10 of this MD&A). We plan to meet our contractual obligations and
commitments through our current cash, cash equivalents and marketable securities balance which include the proceeds from
the sale and leaseback of our first three Boeing 787 aircraft combined with cash flows from operations and future sources of
financing. We continuously monitor the capital markets and assess financing alternatives available to us for our future aircraft
deliveries. At this time, we are not aware of, nor do we reasonably expect, adverse changes to our future ability to access
similar or other generally available sources of liquidity.
Contingencies
We are party to legal proceedings and claims that arise during the ordinary course of business. It is the opinion of
management that the ultimate outcome of these and any outstanding matters will not have a material effect upon our
financial position, results of operations or cash flows.
Fleet
During the three months ended March 31, 2019, we took delivery of our first three Boeing 787 aircraft, financed through sale
and leaseback arrangements, as well two additional Boeing MAX aircraft. We ended the quarter with a registered fleet of 182
aircraft with an average age of 8.1 years.
The combination of our firm commitments and our lease renewal options help us to optimize the size and age of our fleet.
This provides us with the flexibility within our firm commitments to end 2027 with a fleet size between 193 and 233 aircraft,
depending on future decisions to exercise options to purchase and to renew leases.

WestJet First Quarter 2019│ 18
The following table illustrates our Boeing narrow-body, Boeing wide-body and Bombardier Q400 fleet as at March 31, 2019
and December 31, 2018 as well as our firm commitments through to 2027.
Total Future Deliveries Total
Dec. 31,
2018
Mar. 31,
2019
Q2-Q4 2019
2020 2021 2022 2023-
24 2025-
27 Total 2027
Boeing narrow-body aircraft
737-600 NG 13 13 ― ― ― ― ― ― ― 13
737-700 NG(i) 54 54 ― ― ― ― ― ― ― 54
737-800 NG(ii) 48 48 ― ― ― ― ― ― ― 48
737 MAX 7(iii)(iv) ― ― ― ― 1 1 6 14 22 22
737 MAX 8(iii)(iv) 11 13 2 2 4 2 ― ― 10 23
737 MAX 10(iii)(iv) ― ― ― ― ― 6 5 1 12 12
Boeing wide-body aircraft
767-300 ERW 4 4 ― ― ― ― ― ― ― 4
787-9 Dreamliner(iii)(v) ― 3 ― 3 4 ― ― ― 7 10
Total Boeing aircraft 130 135 2 5 9 9 11 15 51 186
Lease expiries ― ― (2) (5) (11) (4) (13) (3) (38) (38)
Boeing aircraft after lease expiries
130 135 ― ― (2) 5 (2) 12 13 148
Bombardier aircraft
Q400 NextGen(vi) 47 47 ― ― ― ― ― ― ― 47
Lease expiries ― ― ― ― ― ― ― (2) (2) (2)
Bombardier aircraft after lease expiries
47 47 ― ― ― ― ― (2) (2) 45
Fleet before lease expiries
177 182 2 5 9 9 11 15 51 233
Fleet after lease expiries
177 182 ― ― (2) 5 (2) 10 11 193
(i) At March 31, 2019, of the 54 Boeing 737-700NG series aircraft in our fleet, 25 are leased (Dec. 31, 2018 – 25) and 29 are owned (Dec. 31, 2018 – 29).
(ii) At March 31, 2019, of the 48 Boeing 737-800NG series aircraft in our fleet, 14 are leased (Dec. 31, 2018 – 14) and 34 are owned (Dec. 31, 2018 – 34). (iii) We have options to purchase an additional 17 Boeing 737 MAX aircraft and an additional 10 Boeing 787 aircraft between the years 2021 and 2026.
(iv) WestJet’s Boeing 737 MAX 7 and MAX 8 aircraft orders can each be substituted for the other model of aircraft, or, beginning in 2022, for Boeing 737 MAX 10 aircraft.
(v) At March 31, 2019, all three of our Boeing 787 Dreamliner aircraft are leased.
(vi) At December 31, 2019, of the 47 Bombardier Q400 aircraft in our fleet, two are leased (Dec. 31, 2018 – 2) and 45 are owned (Dec. 31, 2018 – 45).
A total of three Saab 340B aircraft are also operated by Pacific Coastal Airlines, on behalf of WestJet, under a capacity
purchase agreement.
Off balance sheet arrangements and related-party transactions
Fuel and de-icing facility corporations
We are a contracted party to 20 fuel facility arrangements and three de-icing facility arrangements whereby we participate
under contract in Fuel Facility Corporations (FFCs) and De-icing Facility Corporations (DFCs), along with other airlines, to
obtain fuel services and de-icing services at major Canadian and US airports. The FFCs and DFCs operate on a cost-recovery
basis. The purpose of these corporations is to own and finance the systems that distribute fuel and de-icing fluid, to the
contracting airlines, including the leasing of land rights, while providing the contracting airlines with preferential service and
pricing over non-participating entities. The operating costs, including the debt service requirements, of the FFCs and DFCs are
shared pro rata among the contracting airlines. These FFCs and DFCs are not consolidated within our accounts. In the remote
event that all other contracting airlines withdraw from the arrangements and we remained as sole member, we would be
responsible for the costs of the FFCs and DFCs, including debt service requirements. As at the date of this MD&A, these
corporations have combined total assets of approximately $1,045.8 million and liabilities of approximately $1,064.3 million,
based on the FFCs and DFCs’ most recently completed financial reports.

WestJet First Quarter 2019│ 19
Related-party transactions
At March 31, 2019, we had no transactions with related parties as defined in International Accounting Standard (IAS) 24 –
Related Party Disclosures, except those pertaining to transactions with key management personnel in the ordinary course of
their employment or directorship agreements.
Share capital
Outstanding share data
Our issued and outstanding voting shares, along with voting shares potentially issuable, are as follows:
April 30, 2019 March 31, 2019
Total voting shares issued and outstanding(i) 113,952,590 113,952,015
Stock options 11,138,413 11,148,274
RSUs – Key employee and pilot plan 481,156 484,373
RSUs – Executive share unit plan 217,172 217,172
PSUs – Executive share unit plan 413,362 413,362
Total voting shares potentially issuable 12,250,103 12,263,181
Total outstanding and potentially issuable voting shares 126,202,693 126,215,196
(i) At March 31, 2019, 79,124,188 common voting shares were outstanding and 34,827,827 variable voting shares were outstanding.
Quarterly dividend policy
Our dividend is reviewed on a quarterly basis in light of our financial position, financing policies, cash flow requirements and
other factors deemed relevant. On May 6, 2019, the Board of Directors declared our 2019 second quarter dividend of $0.14
per common voting share and variable voting share payable on June 28, 2019 to shareholders of record on June 12, 2019.
This remains consistent with the $0.14 per share declared and paid during our first quarter of 2019. We believe this
demonstrates our confidence in delivering continued profitable results and is consistent with our objective of creating and
returning value to our shareholders.
Accounting
Critical accounting judgments and estimates
Critical accounting judgments and estimates used in preparing our unaudited condensed consolidated interim financial
statements are described in WestJet’s 2018 annual MD&A and annual consolidated financial statements for the year ended
December 31, 2018. The preparation of consolidated financial statements in conformity with GAAP requires management to
make both judgments and estimates that could materially affect the amounts recognized in the financial statements. By their
nature, judgments and estimates may change in light of new facts and circumstances in the internal and external
environment.
Other than judgments and estimates relating to the adoption of IFRS 16 during the period, described in Note 1 of the
condensed consolidated interim financial statements, there have been no material changes to our critical accounting estimates
and judgments during the three months ended March 31, 2019.
IFRS adopted in the period
In January 2016, the IASB issued IFRS 16, effective for annual and interim reporting periods beginning on or after January 1,
2019. This standard eliminates the classification of leases as either operating leases or finance leases for a lessee, and
instead, all leases are capitalized by recognizing the present value of lease payments and presenting them as either leased
assets or together with property and equipment. The service component of a lease agreement must be separated from the
value of the asset and thus not reported on the statement of financial position; however, there is a practical expedient to
combine lease and non-lease components. Purchase, renewal and termination options which are reasonably certain of being
exercised are also included in the measurement of the lease obligation. Lease obligations do not include variable lease
payments other than those that depend on an index or rate. Entities have the option of using the full retrospective approach
or a modified retrospective approach on transition to IFRS 16.

WestJet First Quarter 2019│ 20
We have adopted IFRS 16 at the required effective date of January 1, 2019, using the full retrospective transition method, and
have restated 2018 comparative periods presented from that which was previously reported. The changes to our accounting
policies and reconciliation of the adjustments to our condensed consolidated statement of financial position and condensed
consolidated statement of earnings as a result of the application of IFRS 16, from those previously presented under prior IFRS
standards, can be found in notes 1 and 2 of the unaudited condensed consolidated interim financial statements for the three
months ended March 31, 2019.
We have elected to apply the recognition exemptions for all asset categories to short-term leases and leases for which the
underlying asset is of low value. In addition, we have elected not to separate non-lease components from lease components
for real estate leases. Instead, we have accounted for each lease component and any associated non-lease components as a
single lease component. For all leases that have not been covered by these recognition exemptions described above, WestJet
has recognized right-of-use assets and lease obligations measured under IFRS 16.
As at January 1, 2018, WestJet had 41 leased aircraft classified as operating leases as well as leased aircraft operated under
our capacity purchase agreement with Pacific Coastal Airlines. Additionally, we have real estate contracts for leased office
space at airports, land leases, storage space, hangar storage space, parking space and leased space for corporate head
offices. Many of the real estate contracts have early termination and extension options that we have considered in assessing
each respective lease term. Effective January 1, 2018, the present value of the future operating lease payments for aircraft,
real estate and other qualifying operating lease arrangements were recognized as right-of-use assets and lease obligations in
the statement of financial position. Additionally, certain qualifying mid-life maintenance events performed on leased aircraft
that were previously provided for and recognized as maintenance expense have been capitalized as leasehold improvements
under IFRS 16. Other assets and liabilities were adjusted on transition to remove the accounting impact of deferred rent and
other lease incentives accounted for under previous IFRS guidance to reflect the right-of-use asset and lease obligation
measurement requirements of IFRS 16.
As at January 1, 2018, the adoption of IFRS 16 resulted in a decrease in retained earnings of $55.9 million due to the
cumulative impact of unrealized losses on foreign exchange on the revaluation of US-dollar-denominated lease obligations.
Additionally, as certain components of right-of-use assets relating to aircraft leases are depreciated over the shorter of the
lease term and useful life, the value of these right-of-use assets at the date of adoption was lower than the present value of
remaining lease payments.
Upon adoption of IFRS 16, qualifying operating leases are no longer expensed as aircraft leasing expense or other operating
expenses. These lease contracts are now being recognized as right-of-use assets which are depreciated and a lease obligation
liability which now includes a portion of the lease payments being recognized as finance costs. Certain lease contracts that are
short-term or are comprised of variable lease payments and do not meet the criteria for recognition as a lease in the
statement of financial position continue to be expensed on a straight-line basis over the lease term and presented in other
operating expenses.
The lease obligations recognized under IFRS 16 are monetary liabilities of which the majority are denominated in US dollars,
which differs from our Canadian dollar reporting currency. This results in increased volatility in the measurement of the lease
obligations on the statement of financial position, as well as the gain (loss) on foreign exchange line item in the statement of
earnings due to the remeasurement of these liabilities at the foreign exchange rate in effect at the end of each reporting
period.
In the statement of cash flows, repayments of lease obligations have been reclassified from operating cash flow to financing
cash flow in accordance with IFRS 16.
The condensed consolidated interim financial statements for the three months ended March 31, 2019 include the additional
disclosures required under IFRS 16 as they relate to our portfolio of leases as well as the revision to Note 15 Commitments in
such financial statements to exclude future lease payments related to leased aircraft, real estate contracts and leased
equipment as these payments have been recognized as lease obligations in the statement of financial position on adoption of
IFRS 16.

WestJet First Quarter 2019│ 21
The following table summarizes the impact of IFRS 16 on certain key financial ratios and operational performance metrics:
Three months ended March 31, 2018
($ in thousands, except ratio and per share amounts) Previously reported
Restated IFRS 16 Change
Financial ratios and operational performance metrics
CASM (cents) 14.15 14.08 (0.5%)
CASM, excluding fuel and employee profit share (cents) 10.57 10.50 (0.7%)
Free cash flow 83,705 120,358 36,653
Diluted free cash flow per share 0.73 1.04 42.5%
Current ratio 1.05 0.99 (5.7%)
Twelve months ended December 31, 2018
($ in thousands, except ratio and per share amounts) Previously reported
Restated IFRS 16 Change
Financial ratios and operational performance metrics
CASM (cents) 13.90 13.76 (1.0%)
CASM, excluding fuel and employee profit share (cents) 10.11 9.98 (1.3%)
Adjusted debt 3,026,730 2,525,960 (500,770)
Adjusted equity 2,295,711 2,242,291 (53,420)
Adjusted debt-to-equity 1.32 1.13 (14.4%)
Adjusted net debt 1,747,153 1,246,383 (500,770)
EBITDA 728,885 784,172 55,287
Adjusted net debt-to-EBITDA 2.40 1.59 (33.8%)
Free cash flow 128,675 275,983 147,308
Diluted free cash flow per share 1.12 2.41 115.2%
Current ratio 0.78 0.75 (3.8%)
ROIC 5.0% 4.4% (0.6 pts.)
Please refer to page 24 of this MD&A for a reconciliation of the non-GAAP measures and additional GAAP measures.
The financial ratios in the tables above have been restated to reflect the application of IFRS 16 on a full retrospective method
of adoption. The previous reported measures, such as adjusted debt, adjusted net debt, and ROIC, included adjustments to
the related financial statement line items to reflect the estimated impact of off-balance sheet lease contracts. On application of
IFRS 16, the actual impact of accounting for these contracts as lease obligations on the statement of position was determined
to be lower than the estimated impact, resulting in a decrease to the adjusted debt measure after restatement.
Future accounting pronouncements
As at the date of this MD&A, there have been no accounting pronouncements issued by the IASB or International Financial
Reporting Interpretations Committee (IFRIC) that are applicable to WestJet and have effective dates beginning subsequent to
the current reporting period.
Controls and procedures
Disclosure controls and procedures (DC&P)
DC&P are designed to provide reasonable assurance that all relevant information is gathered and reported to management,
including the chief executive officer (CEO) and the chief financial officer (CFO), on a timely basis so that appropriate decisions
can be made regarding public disclosure.
Internal control over financial reporting (ICFR)
ICFR is designed to provide reasonable assurance regarding the reliability of financial reporting and the preparation of
financial statements in accordance with GAAP. Management is responsible for establishing and maintaining adequate ICFR.

WestJet First Quarter 2019│ 22
Our ICFR includes policies and procedures that pertain to the maintenance of records that provide reasonable assurance that
transactions are recorded as necessary to permit preparation of the financial statements in accordance with GAAP, and that
receipts and expenditures are being made only in accordance with authorizations of management and directors; pertain to the
maintenance of records that in reasonable detail accurately and fairly reflect our transactions and dispositions of our assets;
and are designed to provide reasonable assurance regarding prevention or timely detection of unauthorized acquisition, use or
disposition of our assets that could have a material effect on our consolidated annual financial statements.
Because of its inherent limitations, ICFR can provide only reasonable assurance and may not prevent or detect misstatements.
Furthermore, projections of an evaluation of effectiveness to future periods are subject to the risk that controls may become
inadequate because of changes in conditions, or that the degree of compliance with the policies and procedures may
deteriorate.
The CEO and the CFO have concluded that there were no changes in our ICFR during the interim period ended March 31,
2019 that have materially affected, or are reasonably likely to materially affect, our ICFR.
Forward-looking information
This MD&A offers our assessment of WestJet’s future plans, operations and outlook and contains “forward-looking
information” as defined under applicable Canadian securities legislation, including without limitation:
Forward looking statement Key assumptions Heading Page
We will continue to build diversity and frequency
in our network through portfolio management of
our fleet.
Based on our strategic plans and
network planning as well as aircraft
delivery schedules.
About WestJet 2
Our expectation that our ROIC will return to
double digits by 2020 and reach 13.0 per cent in
2022.
Based on our current business strategy
and forecasted performance.
Overview 4
Our estimate of our sensitivity of fuel costs to
changes in crude oil and jet fuel and sensitivity to
fuel costs to the change in the value of the
Canadian dollar versus of the US dollar.
Forecasted jet fuel prices of US $84 per
barrel for the second quarter of 2019.
Average foreign exchange rate of
approximately 1.34 Canadian dollars to
one US dollar.
Aircraft fuel 8
We will continue to monitor and adjust to
movements in fuel prices and may re-visit our
hedging strategy as changing markets and
competitive conditions warrant.
Based on our current risk management
policies.
Aircraft fuel 8
Our estimate of our sensitivity in our annual
unhedged operating costs and our future US-
denominated purchase obligations to the change
in the value of the Canadian dollar versus the US
dollar.
Average foreign exchange rate of approximately 1.34 Canadian dollars to one US dollar.
Foreign exchange 10
Our expectation that we will generate sufficient
cash in both the short and long-term to maintain
our currently capacity and fund our future planned
growth, as well as generate positive free cash
flow.
Based on our current business strategy
and forecasted performance.
Liquidity 13
Our plan to meet contractual obligations and
commitments through our current cash and cash
equivalents balance combined with future cash
flows from operations sources of aircraft financing
and our expectation that there will not be adverse
changes to our future ability to access liquidity.
We will have sufficient cash on hand
and/or will continue to be able to
obtain future financing as
circumstances require.
Contractual obligations and commitments
Off balance sheet
arrangements
17
18

WestJet First Quarter 2019│ 23
We expect that the future outcome of our current
legal proceedings and claims will not have a
material effect upon our financial position, results
of operations or cash flows.
Based on our current legal counsel
assessment.
Contingencies 17
Our confidence in our ability to deliver continued
profitable results.
That our fuel price, exchange rate and
tax rate forecasts are accurate. That
we will maintain our current aircraft
delivery and network planning
schedules.
Quarterly dividend
policy
19
Definition of key operating indicators
Our key operating indicators are airline industry metrics, which are useful in assessing the operating performance of an airline.
Available seat miles (ASM): A measure of total guest capacity, calculated by multiplying the number of seats available for
guest use in an aircraft by stage length.
Average stage length: The average distance of a non-stop flight leg between take-off and landing as defined by
International Air Transport Association (IATA) guidelines.
Cost per available seat mile (CASM): Operating expenses divided by available seat miles.
Departures: One flight, counted by the aircraft leaving the ground and landing.
Load factor: A measure of total capacity utilization, calculated by dividing revenue passenger miles by total available seat
miles.
Revenue passenger miles (RPM): A measure of guest traffic, calculated by multiplying the number of segment guests by
stage length.
Revenue per available seat mile (RASM): Total revenue divided by available seat miles.
Segment guest: Any person who has been booked to occupy a seat on a flight leg and is not a member of the crew
assigned to the flight.
Utilization: Operating hours per day per operating aircraft.
Yield (revenue per revenue passenger mile): A measure of unit revenue, calculated as the gross revenue generated per
revenue passenger mile.
Non-GAAP and additional GAAP measures
The following non-GAAP and additional GAAP measures are used to monitor our financial performance:
Adjusted equity: The sum of share capital, equity reserves and retained earnings, excluding hedge reserves. This measure
is used in the calculation of adjusted debt-to-equity.
Net debt: Long-term debt less cash, cash equivalents and marketable securities. This measure is used in the calculation of
net debt to EBITDA, as defined below.
EBITDA: Earnings before net finance costs, taxes, depreciation and amortization and other items, such as asset impairments,
gains and losses on derivatives and foreign exchange gains or losses. TTM EBITDA is a measure commonly used in the airline
industry to evaluate results by excluding differences in the method by which an airline finances its aircraft. The impact of
gains and losses on derivatives and foreign exchange gains and losses have also been adjusted in our calculation of this
measure, as these impacts are not able to be controlled by management nor are reflective of our core operating performance.
Cash to TTM of revenue: Cash as a percentage of the TTM of revenue is a measure commonly used in the airline industry
to compare liquidity positions, adjusting for seasonality that may occur within a financial year.

WestJet First Quarter 2019│ 24
CASM, excluding fuel and employee profit share: CASM is a common measure used in the airline industry to measure an
airline’s cost structure and efficiency. We exclude the effects of aircraft fuel expense and employee profit share expense to
assess the operating performance of our business. Fuel expense is excluded from our operating results because fuel prices are
affected by a host of factors outside our control. Additionally, employee profit share expense is excluded as it varies based on
the outcome of our net earnings. Excluding these expenses allows us to analyze our relative operating results to those of
other airlines.
Return on invested capital: ROIC is a measure commonly used in the airline industry to assess the efficiency with which a
company allocates its capital to generate returns. Return is calculated based on our earnings before tax, excluding special
items and finance costs. Invested capital includes average long-term debt, average lease obligations and average
shareholders’ equity.
Free cash flow: Operating cash flow less capital expenditures. This measure is used to calculate the amount of cash
available that can be used to pursue other opportunities after maintaining and expanding the asset base.
Diluted free cash flow per share: Free cash flow divided by the diluted weighted average number of shares outstanding.
This metric measures our ability to generate operating cash flows after capital expenditures on a per share basis. This metric
can be used as a proxy for earnings per share and reflects our company’s solvency and ability to repay debt, pay dividends
and buy back stock.
Diluted operating cash flow per share: Cash flow from operations divided by diluted weighted average shares
outstanding. Measures our financial strength and our ability to generate cash from our operations on a per share basis.
Reconciliation of non-GAAP and additional GAAP measures
The following provides a reconciliation of non-GAAP and additional GAAP measures to the nearest measure under GAAP for items presented throughout this MD&A.
CASM, excluding fuel and employee profit share
Three months ended March 31
($ in thousands) 2019 2018(i) Change
Operating expenses 1,197,762 1,130,797 66,965
Aircraft fuel expense (296,922) (281,151) (15,771)
Employee profit share expense (5,249) (6,384) 1,135
Operating expenses, adjusted 895,591 843,262 52,329
ASMs 8,456,091,578 8,028,866,429 5.3%
CASM, excluding above items (cents) 10.59 10.50 0.9%
(i) This measure has been restated from that which was previously disclosed under prior IFRS guidance as a result of the application of IFRS 16.
CASM, excluding fuel and employee profit share
The table below presents our restated CASM, excluding fuel and employee profit share measure for the twelve months ended December 31, 2018, as a result of the application of IFRS 16, as well as the measure which was previously presented in our 2018 annual MD&A.
Twelve months ended December 31
($ in thousands) 2018(i) 2018 Change
Operating expenses 4,533,970 4,578,235 (44,265)
Aircraft fuel expense (1,231,632) (1,231,632) —
Employee profit share expense (15,937) (15,937) —
Operating expenses, adjusted 3,286,401 3,330,666 (44,265)
ASMs 32,939,257,510 32,939,257,510 —
CASM, excluding above items (cents) 9.98 10.11 (1.3%)
(i) This measure has been restated from that which was previously disclosed under prior IFRS guidance as a result of the application of IFRS 16.

WestJet First Quarter 2019│ 25
Adjusted debt-to-equity
($ in thousands) March 31
2019 December 31
2018(i) Change
Long-term debt and lease obligations(ii) 2,904,058 2,525,960 378,098
Total shareholders’ equity 2,273,243 2,249,147 24,096
Add (deduct): Hedge reserves 2,046 (6,856) 8,902
Adjusted equity 2,275,289 2,242,291 32,998
Adjusted debt-to-equity 1.28 1.13 13.3%
(i) This measure has been restated from that which was previously disclosed under prior IFRS guidance as a result of the application of IFRS 16.
(ii) At March 31, 2019, long-term debt includes the current portion of long-term debt and lease obligations of $949,266 (December 31, 2018 – $689,135) and long-term debt of $1,954,792 (December 31, 2018 – $1,836,825).
Net debt to EBITDA(i)
($ in thousands) March 31
2019 December 31
2018(ii) Change
Long-term debt and lease obligations 2,904,058 2,525,960 378,098
Less: Cash, cash equivalents and marketable securities (1,614,790) (1,279,577) (335,213)
Net debt 1,289,268 1,246,383 42,885
Net earnings 105,397 93,984 11,413
Add:
Net finance costs(iii) 36,591 38,090 (1,499)
Taxes 49,020 45,341 3,679
Depreciation and amortization 591,938 580,630 11,308
Other(iv) 13,007 26,126 (13,119)
EBITDA 795,953 784,171 11,782
Net debt to EBITDA(v) 1.62 1.59 1.9%
(i) All net earnings adjustments included in the metric above reflect the earnings impact for the trailing 12-month period.
(ii) This measure has been restated from that which was previously disclosed under prior IFRS guidance as a result of the application of IFRS 16.
(iii) At March 31, 2019, net finance costs include the trailing 12 months of finance income of $32,094 (December 31, 2018 – $29,421) and the trailing 12 months
of finance cost of $68,685 (December 31, 2018 – $67,511).
(iv) At March 31, 2019, other includes the trailing 12 months foreign exchange loss of $13,509 (December 31, 2018 – loss of $27,373) and trailing 12 months gain on derivatives of $502 (December 31, 2018 – gain of $1,247).
(v) At March 31, 2019 and December 31, 2018, the Corporation met its internal guideline of an adjusted net debt to EBITDA and an adjusted net debt to adjusted EBITDA measure of less than 2.50.
Free cash flow
Three months ended March 31
($ in thousands, except per share data) 2019 2018(i) Change
Cash flow from operating activities 413,105 273,190 139,915
Adjusted for:
Aircraft additions(ii) 66,502 (130,316) 196,818
Other property and equipment and intangible additions(ii) (26,965) (22,516) (4,449)
Free cash flow 452,642 120,358 332,284
Weighted average number of shares outstanding - diluted 114,386,217 115,267,978 (881,761)
Diluted free cash flow per share 3.96 1.04 280.8%
(i) This measure has been restated from that which was previously disclosed under prior IFRS guidance as a result of the application of IFRS 16.
(ii) Aircraft additions and other property and equipment and intangible additions above are net of proceeds from disposals and exclude non-cash amounts included in the consolidated statement of cash flows.

WestJet First Quarter 2019│ 26
Free cash flow
The table below presents our restated free cash flow measure for the twelve months ended December 31, 2018, as a result of the application of IFRS 16, as well as the measure which was previously presented in our 2018 annual MD&A.
Twelve months ended December 31
($ in thousands, except per share data) 2018(i) 2018 Change
Cash flow from operating activities 940,766 758,580 182,186
Adjusted for:
Aircraft additions(ii) (495,235) (495,235) —
Other property and equipment and intangible additions(ii) (169,548) (134,670) (34,878)
Free cash flow 275,983 128,675 147,308
Weighted average number of shares outstanding - diluted 114,553,266 114,553,266 —
Diluted free cash flow per share 2.41 1.12 115.2%
(i) This measure has been restated from that which was previously disclosed under prior IFRS guidance as a result of the application of IFRS 16.
(ii) Aircraft additions and other property and equipment and intangible additions above are net of proceeds from disposals and exclude non-cash amounts
included in the consolidated statement of cash flows.
Operating cash flow per share
Three months ended March 31
($ in thousands, except per share data) 2019 2018(i) Change
Cash flow from operating activities 413,105 273,190 139,915
Weighted average number of shares outstanding - diluted 114,386,217 115,267,978 (881,761)
Diluted operating cash flow per share 3.61 2.37 52.3%
(i) This measure has been restated from that which was previously disclosed under prior IFRS guidance as a result of the application of IFRS 16.
Cash to trailing 12 months revenue
($ in thousands) March 31
2019 December 31
2018 Change
Cash, cash equivalents and marketable securities 1,614,790 1,279,577 335,213
TTM revenue 4,799,394 4,733,462 65,932
Cash to TTM revenue(i) 33.6% 27.0% 6.6 pts.
(i) At March 31, 2019 and December 31, 2018, the Corporation was within its internal guideline of cash to TTM revenue of approximately 30 per cent.
Return on invested capital
($ in thousands) March 31
2019 December 31
2018(i) Change
Earnings before income taxes (TTM) 154,417 139,325 15,092
Add:
Finance costs 68,685 67,511 1,174
Return 223,102 206,836 16,266
Invested capital:
Average long-term debt and lease obligations(ii) 2,717,034 2,526,573 190,461
Average shareholders' equity 2,249,698 2,226,033 23,665
Invested capital 4,966,732 4,752,606 214,126
Return on invested capital 4.5% 4.4% 0.1 pts.
(i) This measure has been restated from that which was previously disclosed under prior IFRS guidance as a result of the application of IFRS 16.
(ii) Average long-term debt is comprised of the current portion and long-term portion of long-term debt and lease obligations.

WestJet First Quarter 2019│ 27
Return on invested capital
The table below presents our restated return on invested capital measure for the twelve months ended December 31, 2018, as a result of the application of IFRS 16, as well as the measure which was previously presented in our 2018 annual MD&A.
($ in thousands) December 31
2018(i) December 31
2018 Change
Earnings before income taxes (TTM) 139,325 135,882 3,443
Add:
Finance costs 67,511 57,027 10,484
Implicit interest in operating leases(ii) — 73,344 (73,344)
Return 206,836 266,253 (59,417)
Invested capital:
Average long-term debt and lease obligations(iii) 2,526,573 2,014,002 512,571
Average shareholders' equity 2,226,033 2,280,711 (54,678)
Off-balance sheet aircraft leases(iv) — 1,047,773 (1,047,773)
Invested capital 4,752,606 5,342,486 (589,880)
Return on invested capital 4.4% 5.0% (0.6 pts.)
(i) This measure has been restated from that which was previously disclosed under prior IFRS guidance as a result of the application of IFRS 16.
(ii) Interest implicit in operating leases is equal to 7.0 per cent of 7.5 times the trailing 12 months of aircraft lease expense. 7.0 per cent is a proxy and does not necessarily represent actual for any given period.
(iii) Average long-term debt is comprised of the current portion and long-term portion of long-term debt and lease obligations.
(iv) Off-balance-sheet aircraft operating leases are calculated by multiplying the trailing 12 months of aircraft leasing expense by 7.5. At December 31, 2018, the trailing 12 months of aircraft leasing expenses totalled $139,703.

Condensed Consolidated Interim Financial Statements and Notes
For the three months ended March 31, 2019 and 2018
WestJet Airlines Ltd. First Quarter 2019 Financial Statements and Notes May 6, 2019

WestJet First Quarter 2019 │ 29
Condensed Consolidated Statements of Earnings For the three months ended March 31 (Stated in thousands of Canadian dollars, except per share amounts) (Unaudited)
Note
2019
2018(i)
Revenue:
Guest 3 1,178,296 1,109,307
Other 79,360 82,417
1,257,656 1,191,724
Operating expenses:
Aircraft fuel 296,922 281,151
Salaries and benefits 269,576 255,125
Rates and fees 175,203 168,930
Depreciation and amortization 157,806 146,499
Sales and marketing 126,096 119,579
Maintenance 51,563 49,995
Other 115,347 103,134
Employee profit share 5,249 6,384
1,197,762 1,130,797
Earnings from operations 59,894 60,927
Non-operating income (expense):
Finance income 9,384 6,710
Finance cost 13 (25,858) (13,532)
Gain (loss) on foreign exchange 6,764 (7,101)
Gain on disposal of property and equipment 7 14,876 2,217
Gain (loss) on derivatives (679) 65
4,487 (11,641)
Earnings before income tax 64,381 49,286
Income tax expense:
Current 4,761 7,824
Deferred 14,005 7,262
18,766 15,086
Net earnings 45,615 34,200
Earnings per share:
Basic 12 0.40 0.30
Diluted 12 0.40 0.30
The accompanying notes are an integral part of the condensed consolidated interim financial statements.
(i) Certain 2018 numbers have been restated for the adoption of IFRS 16. See Note 2 for further discussion.
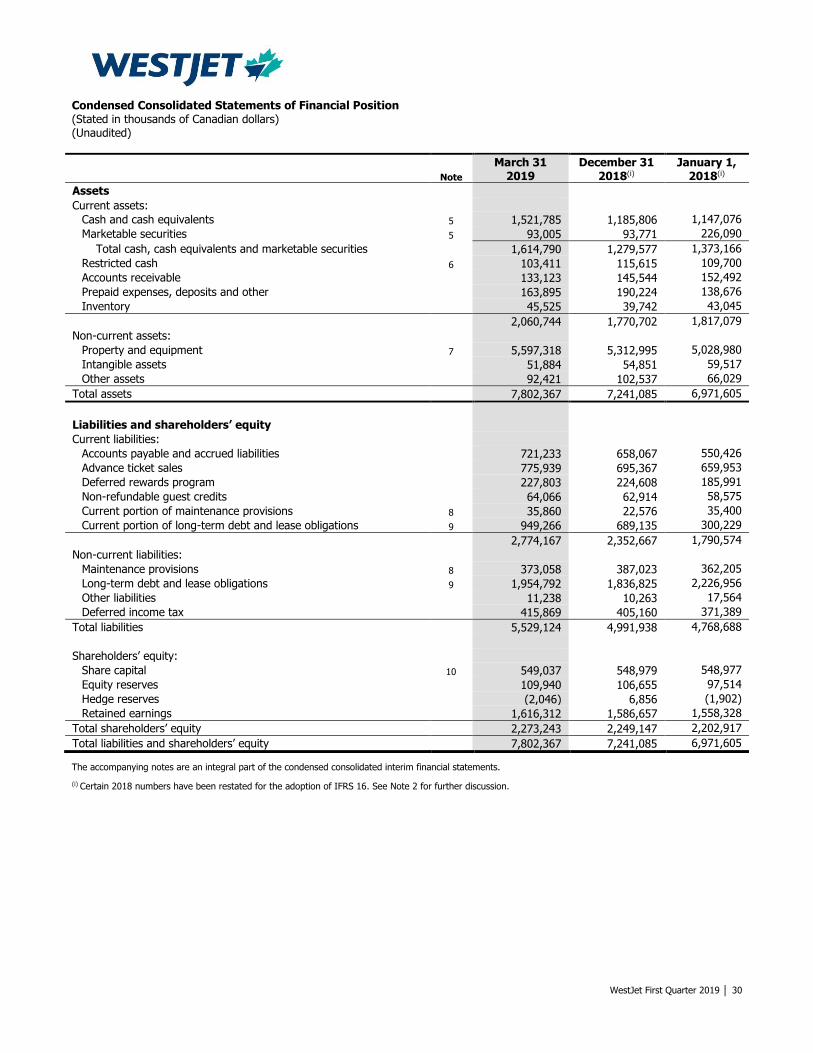
WestJet First Quarter 2019 │ 30
Condensed Consolidated Statements of Financial Position (Stated in thousands of Canadian dollars) (Unaudited)
Note
March 31 2019
December 31 2018(i)
January 1, 2018(i)
Assets
Current assets:
Cash and cash equivalents 5 1,521,785 1,185,806 1,147,076
Marketable securities 5 93,005 93,771 226,090
Total cash, cash equivalents and marketable securities 1,614,790 1,279,577 1,373,166
Restricted cash 6 103,411 115,615 109,700
Accounts receivable 133,123 145,544 152,492
Prepaid expenses, deposits and other 163,895 190,224 138,676
Inventory 45,525 39,742 43,045
2,060,744 1,770,702 1,817,079
Non-current assets:
Property and equipment 7 5,597,318 5,312,995 5,028,980
Intangible assets 51,884 54,851 59,517
Other assets 92,421 102,537 66,029
Total assets 7,802,367 7,241,085 6,971,605
Liabilities and shareholders’ equity
Current liabilities:
Accounts payable and accrued liabilities 721,233 658,067 550,426
Advance ticket sales 775,939 695,367 659,953
Deferred rewards program 227,803 224,608 185,991
Non-refundable guest credits 64,066 62,914 58,575
Current portion of maintenance provisions 8 35,860 22,576 35,400
Current portion of long-term debt and lease obligations 9 949,266 689,135 300,229
2,774,167 2,352,667 1,790,574
Non-current liabilities:
Maintenance provisions 8 373,058 387,023 362,205
Long-term debt and lease obligations 9 1,954,792 1,836,825 2,226,956
Other liabilities 11,238 10,263 17,564
Deferred income tax 415,869 405,160 371,389
Total liabilities 5,529,124 4,991,938 4,768,688
Shareholders’ equity:
Share capital 10 549,037 548,979 548,977
Equity reserves 109,940 106,655 97,514
Hedge reserves (2,046) 6,856 (1,902)
Retained earnings 1,616,312 1,586,657 1,558,328
Total shareholders’ equity 2,273,243 2,249,147 2,202,917
Total liabilities and shareholders’ equity 7,802,367 7,241,085 6,971,605
The accompanying notes are an integral part of the condensed consolidated interim financial statements.
(i) Certain 2018 numbers have been restated for the adoption of IFRS 16. See Note 2 for further discussion.
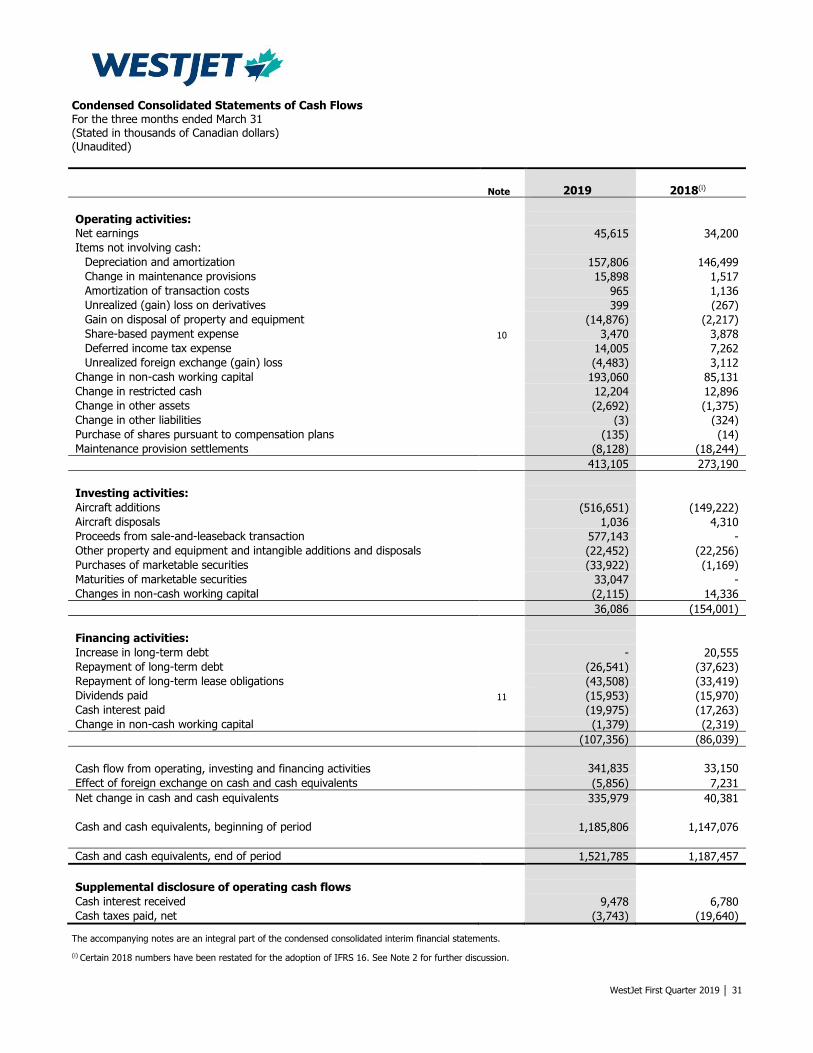
WestJet First Quarter 2019 │ 31
Condensed Consolidated Statements of Cash Flows
For the three months ended March 31 (Stated in thousands of Canadian dollars) (Unaudited)
Note
2019 2018(i)
Operating activities:
Net earnings 45,615 34,200
Items not involving cash:
Depreciation and amortization 157,806 146,499
Change in maintenance provisions 15,898 1,517
Amortization of transaction costs 965 1,136
Unrealized (gain) loss on derivatives 399 (267)
Gain on disposal of property and equipment (14,876) (2,217)
Share-based payment expense 10 3,470 3,878
Deferred income tax expense 14,005 7,262
Unrealized foreign exchange (gain) loss (4,483) 3,112
Change in non-cash working capital 193,060 85,131
Change in restricted cash 12,204 12,896
Change in other assets (2,692) (1,375)
Change in other liabilities (3) (324)
Purchase of shares pursuant to compensation plans (135) (14)
Maintenance provision settlements (8,128) (18,244)
413,105 273,190
Investing activities:
Aircraft additions (516,651) (149,222)
Aircraft disposals 1,036 4,310
Proceeds from sale-and-leaseback transaction 577,143 -
Other property and equipment and intangible additions and disposals (22,452) (22,256)
Purchases of marketable securities (33,922) (1,169)
Maturities of marketable securities 33,047 -
Changes in non-cash working capital (2,115) 14,336
36,086 (154,001)
Financing activities:
Increase in long-term debt - 20,555
Repayment of long-term debt (26,541) (37,623)
Repayment of long-term lease obligations (43,508) (33,419)
Dividends paid 11 (15,953) (15,970)
Cash interest paid (19,975) (17,263)
Change in non-cash working capital (1,379) (2,319)
(107,356) (86,039)
Cash flow from operating, investing and financing activities 341,835 33,150
Effect of foreign exchange on cash and cash equivalents (5,856) 7,231
Net change in cash and cash equivalents 335,979 40,381
Cash and cash equivalents, beginning of period 1,185,806 1,147,076
Cash and cash equivalents, end of period 1,521,785 1,187,457
Supplemental disclosure of operating cash flows
Cash interest received 9,478 6,780
Cash taxes paid, net (3,743) (19,640)
The accompanying notes are an integral part of the condensed consolidated interim financial statements.
(i) Certain 2018 numbers have been restated for the adoption of IFRS 16. See Note 2 for further discussion.

WestJet First Quarter 2019 │ 32
Condensed Consolidated Statements of Changes in Equity For the three months ended March 31 (Stated in thousands of Canadian dollars) (Unaudited)
Note
2019 2018(i)
Share capital:
Balance, beginning of period 10 548,979 548,977
Issuance of shares pursuant to compensation plans 10 58 509
549,037 549,486
Equity reserves:
Balance, beginning of period 106,655 97,514
Share-based payment expense 10 3,470 3,878
Issuance of shares pursuant to compensation plans (185) (520)
109,940 100,872
Hedge reserves:
Balance, beginning of period 6,856 (1,902)
Other comprehensive income (8,902) 1,139
(2,046) (763)
Retained earnings:
Balance, beginning of period 1,586,657 1,558,328
Dividends declared 11 (15,953) (15,970)
Purchase of shares pursuant to compensation plans (7) (4)
Net earnings 45,615 34,200
1,616,312 1,576,554
Total shareholders’ equity 2,273,243 2,226,149
The accompanying notes are an integral part of the condensed consolidated interim financial statements.
(i) Certain 2018 numbers have been restated for the adoption of IFRS 16. See Note 2 for further discussion.

WestJet First Quarter 2019 │ 33
Condensed Consolidated Statements of Comprehensive Income For the three months ended March 31 (Stated in thousands of Canadian dollars) (Unaudited)
2019 2018(i)
Net earnings 45,615 34,200 Items that are or may be reclassified to net earnings: Other comprehensive income, net of tax: Net unrealized gain (loss) on foreign exchange derivatives(ii) (4,743) 4,094 Reclassification of net realized (gain) loss on foreign exchange derivatives(iii) (2,181) 429 Net unrealized gain (loss) on interest rate derivatives(iv) (1,214) 355 Reclassification of net realized (gain) loss on interest rate derivatives(v) (414) 105 Net unrealized loss on cross-currency swap derivatives(vi) (350) (3,844)
(8,902) 1,139
Total comprehensive income 36,713 35,339
The accompanying notes are an integral part of the condensed consolidated interim financial statements.
(i) Certain 2018 numbers have been restated for the adoption of IFRS 16. See Note 2 for further discussion.
(ii) Net of income taxes of $1,755 (2018 – $(1,516)).
(iii) Net of income taxes of $807 (2018 – $(159)).
(iv) Net of income taxes of $450 (2018 – $(131)).
(v) Net of income taxes of $153 (2018 – $(39)).
(vi) Net of income taxes of $130 (2018 – $1,424).

Notes to the Condensed Consolidated Interim Financial Statements For the three months ended March 31, 2019 and 2018 (Stated in thousands of Canadian dollars, except percentage, ratio, share and per share amounts) (Unaudited)
WestJet First Quarter 2019 │ 34
1. Statement of significant accounting policies
The condensed consolidated interim financial statements of WestJet Airlines Ltd. (the Corporation) for the three months ended March 31, 2019 and 2018, were authorized for issue by the Board of Directors on May 6, 2019. The Corporation is a public company incorporated and domiciled in Canada. The Corporation provides airline services and travel packages. The Corporation’s shares are publicly traded on the Toronto Stock Exchange (TSX) under the symbol WJA. The principal business address is 22 Aerial Place N.E., Calgary, Alberta, T2E 3J1 and the registered office is Suite 2400, 525 - 8 Avenue S.W., Calgary, Alberta, T2P 1G1.
(a) Basis of presentation
These condensed consolidated interim financial statements and the notes thereto have been prepared in accordance with IAS 34 – Interim Financial Reporting. They do not include all of the information required for full annual financial statements and should be read in conjunction with the 2018 consolidated annual financial statements. The Corporation has retrospectively adopted IFRS 16 Leases (IFRS 16) with an initial application date of January 1, 2019. In addition, and as a result of the adoption of IFRS 16, accounting of maintenance on leased aircraft has also changed. Refer to note 2 of these condensed consolidated interim financial statements for the impacts of the changes. There have been no other changes to the Corporation’s significant accounting policies from those disclosed in the 2018 consolidated annual financial statements other than those noted below.
(b) Seasonality
The airline industry is sensitive to general economic conditions and the seasonal nature of air travel. The Corporation experiences increased domestic travel in the summer months and more demand for transborder and international travel over the winter months, thus partially reducing the effects of seasonality on net earnings.
(c) Leases
At inception of a contract, the Corporation assesses whether a contract is, or contains a lease. A contract is, or contains, a lease if the contract conveys the right to control the use of an identified asset for a period of time in exchange for consideration. In order to perform this assessment, the Corporation determines whether:
(i) The Corporation has the right to obtain substantially all of the economic benefits from use of the asset throughout the period of use; and
(ii) The Corporation has the right to direct the use of the identified asset.
At inception or on reassessment of a contract that contains a lease component, the Corporation allocates consideration in the contract to each lease component on the basis of their respective stand-alone prices. The Corporation has elected not to separate non-lease components from lease components for its real estate leases. The Corporation will account for each lease component and any associated non-lease components as a single lease component.
Accounting for Lessee arrangements
The Corporation recognizes a right-of-use asset and a lease obligation at the lease commencement date.
Most of the Corporation’s aircraft leases contain extension options exercisable by the Corporation.
Many of the real estate contracts have early termination and extension options. Some leased space agreements contain extension options exercisable by the Corporation.
The Corporation assesses at lease commencement whether it is reasonably certain to exercise the extension options. It reassesses whether it is reasonably certain to exercise the options if there is a significant event or significant change in circumstances within its control.
Right-of use assets are initially measured at cost, which comprises the initial amount of the lease obligation adjusted for any lease payments made at or before the commencement date, plus any initial direct costs incurred, plus an estimate of costs to dismantle and remove the underlying asset or to restore the underlying asset or the site on which it is located, less any lease incentives received.
Right-of-use assets are componentized in the same manner as owned assets and depreciated using the straight-line method from the commencement date to the earlier of the end the useful life or the end of the lease term. The estimated useful lives of right-of-use assets are determined on the same basis as those of Property and equipment. In addition, right-of-use assets are periodically reduced by impairment losses, if any, and adjusted for certain remeasurements on the related lease obligation.

Notes to the Condensed Consolidated Interim Financial Statements For the three months ended March 31, 2019 and 2018 (Stated in thousands of Canadian dollars, except percentage, ratio, share and per share amounts) (Unaudited)
WestJet First Quarter 2019 │ 35
1. Statement of significant accounting policies (continued)
(c) Leases (continued)
Accounting for Lessee arrangements (continued)
Lease obligations are initially measured at the present value of future lease payments at the commencement date, discounted using the interest rate implicit in the lease or, if not readily determinable, the Corporation’s incremental borrowing rate.
Lease payments included in the measurement of the lease obligation are comprised of fixed payments, including in-substance fixed payments, and variable lease payments that depend on an index or rate; initially measured using the index or rate at the commencement date.
Lease obligations are subsequently measured at amortized cost using the effective interest method. Lease obligations are remeasured when there is a lease modification, and a corresponding adjustment is made to the carrying amount of the right-of-use asset, or is recorded in profit or loss if the carrying amount of the right-of-use asset has been reduced to zero.
The Corporation presents right-of-use assets in Property and equipment and lease obligations in Long-term debt and lease obligations in the Consolidated Statement of Financial Position. The current portion of lease obligations are presented as Current portion of long-term debt and lease obligations.
Short-term leases and leases of low-value assets
The Corporation has elected not to recognize right-of-use assets and lease obligations for short-term leases that have a lease term of 12 months or less and leases of low-value assets. The Corporation recognizes the lease payments associated with these leases as an expense on a straight-line basis over the lease term in other operating expenses. The amount recognized in other operating expenses was not significant.
Sale-and-leaseback
At times, the Corporation enters into sale-and-leaseback transactions of aircraft to help fund capital commitment requirements. When control is transferred to the lessor, the Corporation first applies the requirements of IFRS 15 to qualify the sale of the aircraft. The Corporation then recognizes a right-of-use asset and a lease obligation in accordance with IFRS 16 for the lease in the same way as for other right-of-use assets and lease obligations. Gains or losses on the sale are recognized in the condensed consolidated interim statement of earnings for only the amount that relates to the portion of rights transferred to the lessor. Gains or losses relating to the right-of-use retained by the lessee are recognized as part of the right-of-use asset.
(d) Maintenance
Provisions
Provisions are made when it is probable that an outflow of economic benefits will be required to settle a present legal or constructive obligation in respect of a past event and where the amount of the obligation can be reliably estimated.
The Corporation’s aircraft lease agreements require leased aircraft to be returned to the lessor in a specified operating condition, in the form of end of lease usage payments or a completion of an overhaul prior to return. This obligation requires the Corporation to record a maintenance provision liability for certain end of lease return conditions specified in the agreements. Certain obligations are based on aircraft usage and the passage of time, while others are fixed amounts. Expected future costs are estimated based on contractual commitments and company-specific history. Each period, the Corporation recognizes additional maintenance expense based on increased aircraft usage, the passage of time and any changes to judgments or estimates, including discount rates and expected timing and cost of maintenance activities. The unwinding of the discounted present value is recorded as a finance cost on the consolidated statement of earnings. The discount rate used by the Corporation is the current pre-tax risk-free rate approximated by the corresponding term of a US or Canadian government bond to the remaining term until cash outflow.
Any amendments or extensions to lease agreements may impact the expected future cost and the expected timing of the future outflows and will be recognized in the statement of earnings at the time of the change.

Notes to the Condensed Consolidated Interim Financial Statements For the three months ended March 31, 2019 and 2018 (Stated in thousands of Canadian dollars, except percentage, ratio, share and per share amounts) (Unaudited)
WestJet First Quarter 2019 │ 36
1. Statement of significant accounting policies (continued)
(e) Property and equipment
Property and equipment includes any major overhaul expenditures that occur mid-lease on the leased aircraft and will be capitalized as a leasehold improvement and depreciated over the shorter of the expected life of the overhaul or the remaining lease term. Leased aircraft are also componentized upon lease inception in a similar manner as owned aircraft, resulting in an embedded overhaul component. The expected useful lives and depreciation methods for the right-of-use assets and the leasehold improvements are as follows:
Asset class Basis Rate
Right-of-use asset - aircraft Straight-line 15 to 25 years/Term of lease
Right-of-use asset - engine, airframe and landing gear overhaul Straight-line 3 to 13 years/Term of lease
Right-of-use asset - real estate Straight-line Term of lease
Leasehold improvements Straight-line 5 to 12 years/Term of lease
(f) Critical accounting judgments and estimates
Estimates
(i) Discount rate on lease obligations
The Corporation applies the incremental borrowing rate to calculate the lease obligation upon execution of a lease agreement, when the implicit rate of the lease is not readily determinable. The Corporation estimates the incremental borrowing rate at the time an agreement is signed evaluating several factors such as risk-free rate at inception of lease, the Corporation’s credit strength, currency of the lease, term of the lease, and the security of the underlying asset. (ii) Maintenance provisions
The Corporation has a legal obligation to adhere to certain maintenance conditions set out in its aircraft lease agreements relating to the condition of the aircraft at lease return. To fulfill these obligations, a provision is made during the lease term. Estimates related to the maintenance provision include the likely utilization of the aircraft, the expected future cost of the maintenance or usage payment, the point in time at which maintenance is expected to occur, the discount rate used to present value the future cash flows, and the lifespan of life-limited parts. These estimates are based on data and information obtained from various sources including the lessor, current maintenance schedules and fleet plans, contracted costs with maintenance service providers, other vendors and company-specific history.
2. New accounting standards and interpretations
Adoption of New Accounting Standars
The Corporation has adopted IFRS 16 Leases (IFRS 16) with an initial application date of January 1, 2019. The Corporation has implemented the standard using the full retrospective method, which requires restatement of the prior year financial statements and disclosures. Impacts prior to January 1, 2018 are reflected as an adjustment to opening 2018 retained earnings.
(a) Definition of a lease
Under IFRS 16, the Corporation assesses whether a contract is or contains a lease based on the definition of a lease as explained in Note 1.
On transition to IFRS 16, the Corporation applied the definition of a lease to all contracts in place at December 31, 2017.
(b) Accounting policy change for lessee arrangements
As a lessee, the Corporation previously classified leases as operating or finance leases based on its assessment of whether the lease transferred significantly all of the risks and rewards incidental to ownership of the underlying asset to the Corporation. Under IFRS 16, the Corporation recognizes right-of-use assets and lease obligations for all contracts that are or contain a lease based on the revised definition described in note 1(c).
The Corporation elected to apply the recognition exemptions for all asset categories to short-term leases and leases for which the underlying asset is of low value. In addition, the Corporation has elected not to separate non-lease components from lease components for real estate leases. Instead, the Corporation will account for each lease component and any associated non-lease components as a single lease component.

Notes to the Condensed Consolidated Interim Financial Statements For the three months ended March 31, 2019 and 2018 (Stated in thousands of Canadian dollars, except percentage, ratio, share and per share amounts) (Unaudited)
WestJet First Quarter 2019 │ 37
2. New accounting standards and interpretations (continued)
Adoption of New Accounting Standards (continued)
(b) Accounting policy change for lessee arrangements (continued)
For all leases that have not been covered by the recognition exemptions elected by the Corporation and described above, the Corporation recognized right-of-use assets and lease obligations measured under IFRS 16. Additionally, as a result of IFRS 16, certain qualifying mid-life maintenance events performed on leased aircraft that were previously provided for and recognized as maintenance expense have been capitalized as leasehold improvements. The maintenance provision now only provides for certain end of lease return conditions, which could be in the form of an end of lease usage payment or completion of an overhaul prior to return.
(c) Leases identified under IFRS 16
(i) Leased aircraft
As of January 1, 2018, the Corporation had 41 leased aircraft classified as operating leases and two leased aircraft under the capacity purchase agreement. Effective January 1, 2018, the Corporation has recorded such aircraft as right-of-use assets and lease obligations in accordance with the requirements of IFRS 16.
(ii) Real estate leases
The Corporation has real estate contracts for leased office space at airports, land leases, storage space, hangar storage space, parking space and leased space for corporate head offices.
(d) Impacts on financial statements
Upon adoption of IFRS 16, qualifying operating leases are no longer expensed as aircraft leasing expense or other operating expenses. These lease contracts are now being recognized as right-of-use assets which are depreciated and a lease obligation liability which now includes a portion of the lease payments being recognized as finance costs. Certain lease contracts that are short-term or are comprised of variable lease payments and do not meet the criteria for recognition as a lease in the statement of financial position continue to be expensed on a straight-line basis over the lease term and presented in other operating expenses.
In the statement of cash flows, repayments of lease obligations have been reclassified from operating cash flow to financing cash flow in accordance with IFRS 16.
The cumulative effect of the impacts of adopting IFRS 16, including the impact of the change in accounting policy for the maintenance provision, are presented in the tables below:
Consolidated Statement of Financial Position At January 1, 2018
As previously reported
IFRS 16 adjustments
As restated
Property and equipment 4,567,504 461,476 5,028,980
Other assets 78,584 (12,555) 66,029
Total assets 6,522,684 448,921 6,971,605
Accounts payable and accrued liabilities 546,505 3,921 550,426
Current portion of maintenance provision 82,129 (46,729) 35,400
Current portion of long-term debt and lease obligations 153,149 147,080 300,229
Total current liabilities 1,686,302 104,272 1,790,574
Maintenance provision 270,347 91,858 362,205
Long-term debt and lease obligations 1,895,898 331,058 2,226,956
Other liabilities 19,171 (1,607) 17,564
Deferred income tax 392,111 (20,722) 371,389
Total liabilities 4,263,829 504,859 4,768,688
Retained earnings 1,614,266 (55,938) 1,558,328
Total shareholders’ equity 2,258,855 (55,938) 2,202,917
Total liabilities and shareholders’ equity 6,522,684 448,921 6,971,605

Notes to the Condensed Consolidated Interim Financial Statements For the three months ended March 31, 2019 and 2018 (Stated in thousands of Canadian dollars, except percentage, ratio, share and per share amounts) (Unaudited)
WestJet First Quarter 2019 │ 38
2. New accounting standards and interpretations (continued)
Adoption of New Accounting Standards (continued)
(d) Impacts on financial statements (continued)
Consolidated Statement of Financial Position At December 31, 2018
As previously reported
IFRS 16 adjustments
As restated
Prepaid expenses, deposits and other 190,242 (18) 190,224
Property and equipment 4,814,200 498,795 5,312,995
Other assets 118,284 (15,747) 102,537
Total assets 6,758,055 483,030 7,241,085
Accounts payable and accrued liabilities 654,422 3,645 658,067
Current portion of maintenance provision 101,852 (79,276) 22,576
Current portion of long-term debt and lease obligations 536,044 153,091 689,135
Total current liabilities 2,275,207 77,460 2,352,667
Maintenance provision 278,898 108,125 387,023
Long-term debt and lease obligations 1,442,913 393,912 1,836,825
Other liabilities 33,512 (23,249) 10,263
Deferred income tax 424,958 (19,798) 405,160
Total liabilities 4,455,488 536,450 4,991,938
Retained earnings 1,640,077 (53,420) 1,586,657
Total shareholders’ equity 2,302,567 (53,420) 2,249,147
Total liabilities and shareholders’ equity 6,758,055 483,030 7,241,085
Consolidated Statement of Earnings For the three months ended March 31, 2018
As previously reported
IFRS 16 adjustments
As restated
Depreciation and amortization 107,897 38,602 146,499
Aircraft leasing 37,484 (37,484) -
Maintenance 54,921 (4,926) 49,995
Other 104,686 (1,552) 103,134
Total operating expenses 1,136,157 (5,360) 1,130,797
Earnings from operations 55,567 5,360 60,927
Finance cost (11,110) (2,422) (13,532)
Loss on foreign exchange (55) (7,046) (7,101)
Earnings before income tax 53,394 (4,108) 49,286
Income tax expense – Deferred 8,372 (1,110) 7,262
Net earnings 37,198 (2,998) 34,200
Earnings per share – Basic 0.33 (0.03) 0.30
Earnings per share – Diluted 0.32 (0.02) 0.30
Consolidated Statement of Cash Flows Position At March 31, 2018
As previously reported
IFRS 16 adjustments
As restated
Earnings for the period 37,198 (2,998) 34,200
Adjustments for:
Depreciation and amortization 107,897 38,602 146,499
Impairment of right-of-use assets - - -
Net cash from operating activities 244,940 28,250 273,190
Repayment of long-term lease obligations - (33,419) (33,419)
Cash interest paid (14,027) (3,236) (17,263)
Net cash from financing activities (49,384) (36,655) (86,039)

Notes to the Condensed Consolidated Interim Financial Statements For the three months ended March 31, 2019 and 2018 (Stated in thousands of Canadian dollars, except percentage, ratio, share and per share amounts) (Unaudited)
WestJet First Quarter 2019 │ 39
3. Revenue
The Corporation has disaggregated revenue transactions into categories that reflects the similar nature, amounts, timing, and uncertainty of revenue and cash flows that are affected by similar economic factors. Domestic guest revenue and transborder and international guest revenue represent flight tickets which are purchased in advance of the travel date and flown, however these geographies are impacted by different seasonal, economic and competitive factors. Ancillary goods and services are typically purchased on or near the date of the flight and provide an opportunity to enhance the overall experience for less price sensitive guests through the sale of higher margin goods and services.
Three months ended March 31
2019 2018
Guest revenue:
Domestic guest ticket 465,214 452,192
Transborder and international guest ticket 586,962 547,653
Ancillary 126,120 109,462
1,178,296 1,109,307
4. Capital management
The Corporation’s policy is to maintain a strong capital base in order to maintain investor, creditor and market confidence and to sustain the future development of the airline. The Corporation manages its capital structure and makes adjustments in light of changes in economic conditions and the risk characteristics of the underlying assets. In order to manage the capital structure, the Corporation may, from time to time, purchase shares for cancellation pursuant to normal course issuer bids, issue new shares, pay dividends and adjust current and projected debt levels.
In the management of capital, the Corporation includes shareholders’ equity (excluding hedge reserves), long-term debt and lease obligations and cash, cash equivalents and marketable securities, all of which are presented in detail in the following table.
The Corporation monitors its capital structure on a number of bases, including cash to trailing 12 months revenue, adjusted debt-to-equity and net debt to earnings before net finance cost, taxes, and depreciation and amortization (EBITDA). EBITDA is a non-GAAP financial measure commonly used in the airline industry to evaluate results by excluding differences in tax jurisdictions. In addition, the Corporation will adjust EBITDA for non-operating gains and losses on derivatives, foreign exchange and impairment losses. The calculation of EBITDA is a measure that does not have a standardized meaning prescribed under IFRS and therefore may not be comparable to similar measures presented by other issuers. The Corporation defines net debt as debt less cash, cash equivalents and marketable securities. The Corporation defines equity as total shareholders’ equity, excluding hedge reserves.

Notes to the Condensed Consolidated Interim Financial Statements For the three months ended March 31, 2019 and 2018 (Stated in thousands of Canadian dollars, except percentage, ratio, share and per share amounts) (Unaudited)
WestJet First Quarter 2019 │ 40
4. Capital management (continued)
March 31
2019 December 31
2018(v) Change
Cash to trailing 12 months revenue Cash, cash equivalents and marketable securities 1,614,790 1,279,577 335,213 Trailing 12 months revenue 4,799,394 4,733,462 65,932
Cash to trailing 12 months revenue(iv) 33.6% 27.0% 6.6 pts
Adjusted debt-to-equity Long-term debt and lease obligations(i) 2,904,058 2,525,960 378,098
Total shareholders’ equity 2,273,243 2,249,147 24,096 Add (deduct): Hedge reserves 2,046 (6,856) 8,902
Adjusted equity 2,275,289 2,242,291 32,998
Adjusted debt-to-equity(iv) 1.28 1.13 13.3%
Net debt to EBITDA Debt (as above) 2,904,058 2,525,960 378,098 Less: Cash, cash equivalents and marketable securities (1,614,790) (1,279,577) (335,213)
Net debt 1,289,268 1,246,383 42,885
Trailing 12 months net earnings 105,397 93,984 11,413 Add:
Net finance cost(ii) 36,591 38,090 (1,499) Taxes 49,020 45,341 3,679 Depreciation and amortization 591,938 580,630 11,308 Other(iii) 13,007 26,126 (13,119)
EBITDA 795,953 784,171 11,782
Net debt to EBITDA(iv) 1.62 1.59 1.9%
(i) At March 31, 2019, long-term debt and lease obligations includes the current portion of long-term debt and lease obligations of $949,266 (December 31, 2018 – $689,135) and long-term debt and lease obligations of $1,954,792 (December 31, 2018 – $1,836,825).
(ii) At March 31, 2019, net finance cost includes the trailing 12 months of finance income of $32,094 (December 31, 2018 – $29,421) and the trailing 12 months of finance cost of $68,685 (December 31, 2018 – $67,511).
(iii) At March 31, 2019, other includes the trailing 12 months foreign exchange loss of $13,509 (December 31, 2018 – loss of $27,373) and trailing 12 months non-operating gain on derivatives of $502 (December 31, 2018 – gain of $1,247).
(iv) The Corporation has internal guidelines for cash to trailing 12 months revenue of approximately 30%, an adjusted debt-to-equity measure of no more than 2.5 and a net debt to EBITDA measure of no more than 2.5. The Corporation’s internal guidelines are not related to any covenants.
(v) Certain 2018 numbers have been restated for the adoption of IFRS 16. See Note 2 for further discussion

Notes to the Condensed Consolidated Interim Financial Statements For the three months ended March 31, 2019 and 2018 (Stated in thousands of Canadian dollars, except percentage, ratio, share and per share amounts) (Unaudited)
WestJet First Quarter 2019 │ 41
5. Cash, cash equivalents and marketable securities
March 31
2019 December 31
2018
Bank balances(i) 402,800 224,699
Short-term investments(ii) 1,118,985 961,107
Total cash and cash equivalents 1,521,785 1,185,806
Marketable securities(iii) 93,005 93,771
1,614,790 1,279,577
(i) Included in these balances, at March 31, 2019, the Corporation has US-dollar cash and cash equivalents totaling US $31,959 (December 31, 2018 – US $11,709).
(ii) Included in these balances, at March 31, 2019, the Corporation has US-dollar short-term investments totaling US $233,495 (December 31, 2018 – US $207,562).
(iii) Included in these balances, at March 31, 2019, the Corporation has US-dollar marketable securities totaling US $50,936 (December 31, 2018 – US $50,430).
6. Restricted cash
March 31
2019 December 31
2018
Cash held in trust for WestJet Vacations Inc. 67,750 79,403 Security on facilities for letters of guarantee 34,514 34,684 Passenger facility charges 1,147 1,528
103,411 115,615
7. Property and equipment
January 1
2019(iv)
Net Additions Depreciation Transfers
March 31 2019
Aircraft(i) 3,696,825 (172,961)(v) (95,756) 252,777 3,680,885
Ground property and equipment 72,319 3,877 (4,942) 1,013 72,267
Spare engines and rotables 254,608 6,853 (7,150) 2,289 256,600
Deposits on aircraft 538,249 96,866 - (231,770) 403,345
Buildings 95,788 - (834) - 94,954
Leasehold improvements(ii) 83,933 810 (8,841) 211 76,113
Assets under development 113,301 71,480 - (24,520) 160,261
Right-of-use assets – aircraft(iii) 404,251 431,211 (34,116) - 801,346
Right-of-use assets – real estate 53,721 781 (2,955) - 51,547
5,312,995 438,917 (154,594) - 5,597,318
January 1
2018(iv)
Net Additions(iv) Depreciation(iv) Transfers(iv)
December 31 2018(iv)
Aircraft(i) 3,479,739 44,608 (360,646) 533,124 3,696,825
Ground property and equipment 72,946 19,651 (20,278) - 72,319
Spare engines and rotables 195,929 31,307 (24,677) 52,049 254,608
Deposits on aircraft 650,487 380,098 - (492,336) 538,249
Buildings 99,309 - (3,521) - 95,788
Leasehold improvements(ii) 76,192 36,368 (31,190) 2,563 83,933
Assets under development 51,524 157,177 - (95,400) 113,301
Right-of-use assets – aircraft(iii) 352,296 167,464 (115,509) - 404,251
Right-of-use assets – real estate 50,558 13,860 (10,697) - 53,721
5,028,980 850,533 (566,518) - 5,312,995 (i) Aircraft includes (a) aircraft (b) engine, airframe and landing gear core and overhaul components, and (c) inflight entertainment systems. For the three
months ended March 31, 2019, total aircraft depreciation expense for overhaul components was $37,986 (March 31, 2018 – $42,268).
(ii) Leasehold improvements includes engine, airframe and landing gear overhaul components. For the three months ended March 31, 2019, total leasehold improvements depreciation expense for overhaul components was $7,714 (March 31, 2018 – $6,025)
(iii) Right-of-use assets – aircraft includes (a) aircraft (b) engine, airframe and landing gear core and overhaul components. For the three months ended March 31, 2019, total right-of-use assets – aircraft depreciation expense for overhaul components was $6,086 (March 31, 2018 – $7,934).
(iv) Certain numbers have been restated for the adoption of IFRS 16. See Note 2 for further discussion.
(v) Included in this amount are disposals of $179,585 related to the sale-and-leaseback transaction.

Notes to the Condensed Consolidated Interim Financial Statements For the three months ended March 31, 2019 and 2018 (Stated in thousands of Canadian dollars, except percentage, ratio, share and per share amounts) (Unaudited)
WestJet First Quarter 2019 │ 42
7. Property and equipment (continued)
March 31, 2019 Cost Accumulated depreciation Net book value(i)
Aircraft 5,705,561 (2,024,676) 3,680,885
Ground property and equipment 192,892 (120,625) 72,267
Spare engines and rotables 395,582 (138,982) 256,600
Deposits on aircraft 403,345 - 403,345
Buildings 136,781 (41,827) 94,954
Leasehold improvements 103,625 (27,512) 76,113
Assets under development 160,261 - 160,261
Right-of-use assets – aircraft 950,971 (149,625) 801,346
Right-of-use assets – real estate 65,199 (13,652) 51,547
8,114,217 (2,516,899) 5,597,318
December 31, 2018 Cost(ii)
Accumulated depreciation(ii)
Net book value(i)(ii)
Aircraft 5,606,097 (1,909,272) 3,696,825
Ground property and equipment 188,003 (115,684) 72,319
Spare engines and rotables 389,504 (134,896) 254,608
Deposits on aircraft 538,249 - 538,249
Buildings 136,780 (40,992) 95,788
Leasehold improvements 94,324 (10,391) 83,933
Assets under development 113,301 - 113,301
Right-of-use assets – aircraft 519,760 (115,509) 404,251
Right-of-use assets – real estate 64,418 (10,697) 53,721
7,650,436 (2,337,441) 5,312,995
(i) The net book value of the property and equipment pledged as collateral for the Corporation’s long-term debt was $1,120,632 at March 31, 2019 (December 31, 2018 – $1,158,566).
(ii) Certain 2018 numbers have been restated for the adoption of IFRS 16. See Note 2 for further discussion.
During the quarter, the Corporation took delivery of three Boeing 787-9 aircraft that were financed under sale-and-leaseback transactions with proceeds of $577,143. The sales were at fair value, of which a portion of the gain on sale was recognized in non-operating income of $13,840. The leases are accounted for in accordance with IFRS 16 with 12 year terms, paid monthly.
8. Maintenance provisions and reserves
March 31
2019 December 31
2018(iii)
Opening balance 409,599 397,606
Additions 11,802 42,434
Change in estimate(i) 1,558 (36,757)
Foreign exchange (8,483) 29,297
Accretion(ii) 2,570 10,827
Settled (8,128) (33,808)
Ending balance 408,918 409,599
Current portion (35,860) (22,576)
Long-term portion 373,058 387,023
(i) Reflects changes to the timing and scope of maintenance activities and the discount rate used to present value the liability.
(ii) At March 31, 2019, the Corporation’s aircraft lease maintenance provisions are discounted using a weighted average risk-free rate of approximately 2.07% (December 31, 2018 – 1.89%) to reflect the weighted average remaining term of approximately 43 months (December 31, 2018 – 36 months) until cash outflow.
(iii) Certain 2018 numbers have been restated for the adoption of IFRS 16. See Note 2 for further discussion

Notes to the Condensed Consolidated Interim Financial Statements For the three months ended March 31, 2019 and 2018 (Stated in thousands of Canadian dollars, except percentage, ratio, share and per share amounts) (Unaudited)
WestJet First Quarter 2019 │ 43
9. Long-term debt and lease obligations
March 31
2019 December 31
2018(viii)
Term loans – purchased aircraft(i) 14,977 20,007
Term loans – purchased aircraft(ii) 130,739 136,010
Term loans – purchased aircraft(iii) 609,937 625,657
Senior unsecured notes(iv) 399,823 399,685
Non-revolving facility(v) 254,809 254,765
USD senior unsecured notes(vi) 531,661 542,833
Lease obligations(vii) 962,112 547,003
Ending balance 2,904,058 2,525,960
Current portion of long-term debt and lease obligations (949,266) (689,135)
Long-term portion 1,954,792 1,836,825
(i) Seven individual term loans, amortized over a 12-year term, repayable in quarterly principal instalments totaling $5,062, at an effective weighted average fixed rate of 6.03%, maturing between 9201 and 2020. These facilities are guaranteed by the Export-Import Bank of the United States (Ex-Im Bank) and secured by seven Boeing 737 Next Generation aircraft. There are no financial covenants related to these term loans.
(ii) Seven individual term loans, amortized over a 12-year term, repayable in quarterly principal instalments totaling $5,576, in addition to a floating rate of interest at the three month Canadian Dealer Offered Rate plus a basis point spread, with an effective weighted average floating interest rate of 3.71% at March 31, 2019, maturing between 2024 and 2025. The Corporation has fixed the rate of interest on these seven term loans, at a weighted average rate of 3.20%, using interest rate swaps. These facilities are guaranteed by Ex-Im Bank and secured by seven Boeing 737 Next Generation aircraft. There are no financial covenants related to these term loans.
(iii) 45 individual term loans, amortized over a 12-year term, repayable in quarterly principal instalments totaling $15,881, at an effective weighted average fixed rate of 3.24%, maturing between 2025 and 2030. Each term loan is secured by one Q400 aircraft. There are no financial covenants related to these term loans.
(iv) 3.287% Senior Unsecured Notes with semi-annual interest payments and an effective interest rate of 3.43% at March 31, 2019, with principal due upon maturity in July 2019. The notes rank equally in right of payment with all other existing and future unsubordinated debt of the Corporation, but are effectively subordinate to all of the Corporation’s existing and future secured debt to the extent of the value of the assets securing such debt. There are no financial covenants related to these senior unsecured notes.
(v) Non-revolving, unsecured term loan repayable in quarterly principal instalments of $11,250 with an effective weighted average floating interest rate of 3.95% at March 31, 2019, maturing in January 2020. The Corporation has fixed the rate of interest on the term loan, at a weighted average rate of 2.76%, using interest rate swaps. The credit facility contains two financial covenants: (i) minimum pooled asset coverage ratio of 1.5 to 1, and (ii) minimum fixed charge coverage ratio of 1.25 to 1 measurable on a quarterly basis. At March 31, 2019 the Corporation has met both covenants.
(vi) Senior unsecured notes denominated in US Dollars with semi-annual interest payments and a fixed effective rate of 3.78% at March 31, 2019, with principal due upon maturity in June 2021. The notes rank equally in right of payment with all other existing and future unsubordinated debt of the Corporation, but are effectively subordinate to all of the Corporation’s existing and future secured debt to the extent of the value of the assets securing such debt. There are no financial covenants related to these senior unsecured notes.
(vii) Consists of (i) 45 US-dollar aircraft leases, payable monthly at an effective weighted average interest rate of 3.60%, maturing between 2019 and 2031, three aircraft leases under capacity purchase agreement, payable monthly at an effective average interest rate of 3.14%, maturing in 2023 and (iii) 50 real estate and other leases, payable monthly at an effective weighted average interest rate of 4.29%, maturing between 2019 and 2052.
(viii) Certain 2018 numbers have been restated for the adoption of IFRS 16. See Note 2 for further discussion
Future scheduled principal and interest repayments of long-term debt and lease obligations at March 31, 2019 are as follows:
Long-term
debt Lease
obligations Total
Within 1 year 812,812 195,596 1,008,408
1 – <3 years 770,053 307,853 1,077,906
3 – <5 years 213,445 202,377 415,822
Over 5 years 308,658 429,651 738,309
2,104,968 1,135,477 3,240,445
The Corporation has an unsecured, revolving syndicated credit facility of $400,000 available for general corporate purposes, including the funding of future aircraft acquisitions, maturing in June 2022. Funds from the revolving credit facility can be drawn through various debt instruments and interest is calculated by reference to the applicable base rate plus an applicable pricing margin based on the Corporation’s debt rating. The Corporation also pays a standby fee for the undisbursed portion of the revolving credit facility. At March 31, 2019, the Corporation has $nil (December 31, 2018 – $nil) drawn on the facility. The credit facility contains two financial covenants: (i) minimum pooled asset coverage ratio of 1.5 to 1, and (ii) minimum fixed charge coverage ratio of 1.25 to 1. At March 31, 2019 the Corporation has met both covenants.

Notes to the Condensed Consolidated Interim Financial Statements For the three months ended March 31, 2019 and 2018 (Stated in thousands of Canadian dollars, except percentage, ratio, share and per share amounts) (Unaudited)
WestJet First Quarter 2019 │ 44
10. Share capital
(a) Issued and outstanding
March 31 2019
December 31 2018
Number Amount Number Amount
Common and variable voting shares: Balance, beginning of period 113,948,623 548,979 114,052,889 548,977 Issuance of shares pursuant to compensation plans 3,392 58 20,288 602 Shares repurchased - - (124,554) (600)
Balance, end of period 113,952,015 549,037 113,948,623 548,979
At March 31, 2019, the number of common voting shares outstanding was 79,124,188 (December 31, 2018 – 82,069,418) and the number of variable voting shares was 34,827,827 (December 31, 2018 – 31,879,205).
(b) Stock option plan
The fair value of options granted and the assumptions used in their determination are as follows:
Three months ended March 31
2019 2018
Weighted average fair value per option 4.08 4.60 Expected life of options (years) 4.2 4.2 Weighted average risk-free interest rate 1.8% 2.1% Weighted average expected volatility 27.6% 25.9% Weighted average dividend yield 2.5% 2.2%
Changes in the number of options, with their weighted average exercise prices, are summarized below:
Three months ended March 31 2019 2018
Number of options
Weighted exercise price
Number of options
Weighted exercise price
Stock options outstanding, beginning of period 11,193,031 22.11 9,429,826 22.95 Granted 11,591 21.19 18,172 24.30 Exercised (13,066) 15.46 (124,803) 22.35 Forfeited (12,777) 20.50 (20,450) 21.95 Expired (30,505) 22.85 (6,438) 25.28
Stock options outstanding, end of period 11,148,274 22.12 9,296,307 22.96
Exercisable, end of period 7,546,723 23.02 5,069,199 23.70
Under the terms of the Corporation's stock option plan, with the approval of the Corporation, option holders can either (i) e lect to receive shares by delivering cash to the Corporation in the amount of the exercise price of the options, or (ii) choose a cashless settlement alternative, whereby they can elect to receive a number of shares equivalent to the market value of the options over the exercise price. For the three months ended March 31, 2019, option holders exercised 13,066 options (three months ended March 31, 2018 – 124,803 options) on a cashless basis and received 3,392 shares (three months ended March 31, 2018 – 16,261 shares).

Notes to the Condensed Consolidated Interim Financial Statements For the three months ended March 31, 2019 and 2018 (Stated in thousands of Canadian dollars, except percentage, ratio, share and per share amounts) (Unaudited)
WestJet First Quarter 2019 │ 45
10. Share capital (continued)
(c) Key employee plan
Changes in the number of units, with their weighted average fair value, are summarized below:
Three months ended March 31
2019 2018
Number of units
Weighted fair value
Number of units
Weighted fair value
Units outstanding, beginning of period 488,957 20.06 231,640 22.04 Granted 464 21.19 7,972 24.30 Units, in lieu of dividends 3,556 19.00 1,435 23.33 Settled (6,488) 20.59 (541) 21.47 Forfeited (2,116) 20.97 (506) 21.04
Units outstanding, end of period 484,373 20.04 240,000 22.13
(d) Executive share unit plan
Changes in the number of units, with their weighted average fair value, are summarized below:
Three months ended March 31
2019 2018
RSUs PSUs RSUs PSUs
Number of units
Weighted fair value
Number of units
Weighted fair value
Number of units
Weighted fair value
Number of units
Weighted fair value
Units outstanding, beginning of period 208,362 20.43 403,417 20.59 259,672 22.46 488,452 22.42
Granted 7,222 21.19 6,922 21.19 - - - - Units granted in lieu of dividends 1,588 19.00 3,023 19.00 1,537 23.33 2,882 23.33 Forfeited - - - - (3,494) 21.46 (8,179) 22.28
Units outstanding, end of period 217,172 20.44 413,362 20.59 257,715 22.48 483,155 22.43
(e) Share-based payment expense
The following table summarizes share-based payment expense for the Corporation’s equity-based plans:
Three months ended March 31
2019 2018
Stock option plan 2,871 2,863 Key employee plan 625 335 Executive share unit plan (26) 680
Total share-based payment expense 3,470 3,878
11. Dividends
On February 4, 2019 the Board of Directors declared the Corporation’s 2019 first quarter dividend of $0.14 per common and variable voting share. For the three months ended March 31, 2019, the Corporation paid dividends totaling $15,953 (three months ended March 31, 2018 – $15,970).

Notes to the Condensed Consolidated Interim Financial Statements For the three months ended March 31, 2019 and 2018 (Stated in thousands of Canadian dollars, except percentage, ratio, share and per share amounts) (Unaudited)
WestJet First Quarter 2019 │ 46
12. Earnings per share
The following reflects the share data used in the computation of basic and diluted earnings per share:
Three months ended March 31 2019 2018
Weighted average number of shares outstanding – basic 113,950,502 114,061,568
Effect of dilution 435,715 1,206,410
Weighted average number of shares outstanding – diluted 114,386,217 115,267,978
For the three months ended March 31, 2019, 9,919,316 employee stock options (three months ended March 31, 2018 – 2,339,655) and 5,364 restricted share units (three months ended March 31, 2018 – nil) were not included in the calculation of dilutive potential shares as the result would have been anti-dilutive.
13. Finance cost
Three months ended March 31 2019 2018(ii)
Interest on long-term debt 17,006 17,807 Capitalized interest(i) (3,016) (4,936) Interest on lease obligations 5,620 3,332 Accretion on maintenance provisions 6,248 (2,671)
25,858 13,532
(i) Relates to interest capitalized on deposits paid for Boeing and Bombardier aircraft yet to be delivered using a weighted average interest rate of 3.27%. (ii) Certain 2018 numbers have been restated for the adoption of IFRS 16. See Note 2 for further discussion

Notes to the Condensed Consolidated Interim Financial Statements For the three months ended March 31, 2019 and 2018 (Stated in thousands of Canadian dollars, except percentage, ratio, share and per share amounts) (Unaudited)
WestJet First Quarter 2019 │ 47
14. Financial instruments and risk management
Fair value of financial assets and financial liabilities
The Corporation’s financial assets and liabilities consist primarily of cash and cash equivalents, marketable securities, restricted cash, accounts receivable, derivatives, other deposits that will be settled in cash, accounts payable and accrued liabilities and long-term debt and lease obligations. The following tables set out the Corporation’s classification and carrying amount, together with the fair value, for each type of financial asset and financial liability at March 31, 2018 and December 31, 2018:
Fair value Amortized cost Total
March 31, 2019 Through profit
or loss Financial assets
Financial liabilities
Carrying amount
Fair value
Asset (liability):
Cash and marketable securities (i) – 1,718,201 – 1,718,201 1,718,201 Accounts receivable – 133,123 – 133,123 133,123
Foreign exchange derivatives(ii) 2,884 – – 2,884 2,884
Interest rate derivatives(iii) (1,102) – – (1,102) (1,102)
Cross-currency interest rate swap derivatives(iv) 17,895 – – 17,895 17,895
Other deposits(v) – 92,439 – 92,439 89,966
Accounts payable and accrued liabilities(vi) – – (719,981) (719,981) (719,981)
Long-term debt(vii) – – (1,941,946) (1,941,946) (1,878,547)
Lease obligations(viii) – – (962,112) (962,112) N/A
19,677 1,943,763 (3,624,039) (1,660,599) (637,561)
Fair value Amortized cost Total
December 31, 2018 Through profit
or loss Financial assets
Financial liabilities
Carrying amount
Fair value
Asset (liability):
Cash and marketable securities(i) – 1,395,192 – 1,395,192 1,395,192 Accounts receivable – 145,544 – 145,544 145,544
Foreign exchange derivatives(ii) 13,083 – – 13,083 13,083
Interest rate derivatives(iii) 1,129 – – 1,129 1,129 Cross-currency interest rate swap
derivatives(iv) 29,808 – – 29,808 29,808
Other deposits(v) – 97,752 – 97,752 95,112
Accounts payable and accrued liabilities(vi) – – (657,533) (657,533) (657,533)
Long-term debt(vii) – – (1,978,957) (1,978,957) (1,858,404)
Lease obligations(viii) – – (547,003) (547,003) N/A
44,020 1,638,488 (3,183,493) (1,500,985) (836,069)
(i) Includes restricted cash of $103,411 (December 31, 2018 – $115,615) and marketable securities of $93,005 (December 31, 2018 – $93,771).
(ii) Includes $3,391 (December 31, 2018 – $13,113) classified in prepaid expenses, deposits and other, and $507 (December 31, 2018 – $30) classified in accounts payable and accrued liabilities.
(iii) Includes $1,771 (December 31, 2018 – $2,743) classified in prepaid expenses, deposits and other, $745 (December 31, 2018 – $504) classified in accounts payable and accrued liabilities, $nil (December 31, 2018 - $40) classified in other long-term assets, and $2,128 classified in other long-term liabilities (December 31, 2018 – $1,150).
(iv) Includes $469 (December 31, 2018 - $845) classified in prepaid expenses, deposits and other, $17,426 (December 31, 2018 - $28,963) classified in other long-term assets.
(v) Includes $33,259 (December 31, 2018 – $38,535) classified in prepaid expenses, deposits and other, and $59,180 (December 31, 2018 – $59,217) classified in other long-term assets. The fair value of the long-term aircraft deposits is determined by discounting the future contractual cash flows using an average rate of 1.48% (December 31, 2018 – 1.90%) for an average term of 4.2 years (December 31, 2018 – 4.0 years).
(vi) Excludes foreign exchange derivative liabilities of $507 (December 31, 2018 – $30), interest rate derivative liabilities of $745 (December 31, 2018 – $504).
(vii) Includes current portion of long-term debt of $753,670 (December 31, 2018 – $536,044) and long-term debt of $1,188,276 (December 31, 2018 – $1,442,913). The fair value of the long-term debt is determined by discounting the future contractual cash flows of principal and interest under the current financing arrangements using the Corporation’s March 31, 2019 implied Corporate BBB- rate of 4.30% (December 31, 2018 – 5.37%) for a 3.88 year term (December 31, 2018 – 4.15 year term), equal to the weighted average remaining term of the Corporation’s long term debt at March 31, 2019.
(viii) Includes current portion of lease obligations of $195,596 (December 31, 2018 – $153,091) and long-term lease obligations of $766,516 (December 31, 2018 – $393,912). The fair value of the lease obligations is not required.

Notes to the Condensed Consolidated Interim Financial Statements For the three months ended March 31, 2019 and 2018 (Stated in thousands of Canadian dollars, except percentage, ratio, share and per share amounts) (Unaudited)
WestJet First Quarter 2019 │ 48
14. Financial instruments and risk management (continued)
Fair value of financial assets and financial liabilities (continued)
The following items shown in the condensed consolidated statement of financial position at March 31, 2019 and December 31, 2018, are measured at fair value on a recurring basis using level 2 inputs. Level 1 inputs are defined as quoted prices in active markets while level 2 is defined as significant other observable inputs. There are no financial assets or liabilities classified as level 1 or level 3 (significant unobservable inputs) in the fair value hierarchy.
March 31, 2019 December 31, 2018
Asset (liability):
Foreign exchange derivatives 2,884 13,083
Interest rate derivatives (1,102) 1,129
Cross-currency interest rate swap derivatives 17,895 29,808
19,677 44,020
During the quarter ended March 31, 2019 and the year ended December 31, 2018, there were no transfers between level 1, level 2 and level 3 financial assets and liabilities measured at fair value.
Foreign exchange derivatives: Classified as level 2, these consist of foreign exchange forward contracts where the fair value of the forward contracts is measured based on the difference between the contracted rate and the current forward price. At March 31, 2019, to fix the exchange rate on a portion of the Corporation’s US dollar aircraft lease payments and hotel costs for the next twelve months, the Corporation has entered into foreign exchange contracts with an average monthly notional of US $14,317 (December 31, 2018 – US $20,084) for a total of US $171,806 (2018 – US $241,005) at a weighted average contracted rate on the forward contracts of 1.3155 (December 31, 2018 – 1.3070) Canadian dollars to one US dollar, and the weighted average forward rate used in determining the fair value was 1.3323 (December 31, 2018 – 1.3613) Canadian dollars to one US dollar. At March 31, 2019, a portion of the change in the fair value of foreign exchange derivatives amounting to $26 (December 31, 2018 – $nil) was recognized within gain (loss) on derivatives in the consolidated statement of earnings as hedge ineffectiveness.
Interest rate derivatives: Classified as level 2, these consist of interest rate swap contracts that exchange a floating rate of interest with a fixed rate of interest. The fair value of the interest rate swaps is determined by measuring the difference between the fixed contracted rate and the forward curve for the applicable floating interest rates. At March 31, 2019, the Corporation’s swap contracts have an outstanding notional value of $372,701 with a weighted average fixed interest rate of 1.59% (December 31, 2018 – 1.59%). The March 31, 2019, weighted average floating forward interest rate was 2.21% (December 31, 2018 – 2.23%).
Cross-currency interest rate swap derivatives: Classified as level 2, these consist of fixed US dollar to fixed Canadian dollar uncollateralized cross-currency interest rate swap agreements to mitigate exposure to fluctuations in future cash flows that are attributable to foreign currency risk resulting from the issuance of US denominated long-term debt. The US $400,000 notional at 3.50% interest per annum was exchanged for $511,110 at a 3.56% weighted average interest per annum through the terms of the swaps, which match the maturity of the US-dollar senior unsecured notes. The fair value of the cross-currency interest rate swap contracts were determined by discounting the difference between the contracted prices and market based yield curves.

Notes to the Condensed Consolidated Interim Financial Statements For the three months ended March 31, 2019 and 2018 (Stated in thousands of Canadian dollars, except percentage, ratio, share and per share amounts) (Unaudited)
WestJet First Quarter 2019 │ 49
14. Financial instruments and risk management (continued)
Fair value of financial assets and financial liabilities (continued)
The following table represents the maturity of derivative financial instruments by risk category:
Currency Total > 1 year 1 – 5 years Over 5 years
Foreign currency risk:
Foreign exchange derivatives USD 171,806 171,806 – – Cross-currency interest rate swap derivatives USD 400,000 – 400,000 –
571,806 171,806 400,000 –
Interest rate risk:
Interest rate derivatives CAD 372,701 266,055 88,429 18,217
15. Commitments
(a) Purchased aircraft and spare engines
At March 31, 2019, the Corporation is committed to purchase seven 787-9 Dreamliner aircraft for delivery between 2020 and 2021 and 43 737 MAX aircraft for delivery between 2019 and 2027. The Corporation is also committed to purchase a total of six Boeing spare engines for delivery between 2019 and 2026.
The remaining estimated deposits and delivery payments for the 50 aircraft and six spare engines are presented in the table below. Where applicable, US dollar commitments are translated at the period end foreign exchange rate.
Within 1 year 668,432
1 – <3 years 1,497,343
3 – <5 years 870,142
Over 5 years 1,034,496
4,070,413
(b) Contractual commitments
The Corporation has entered into contractual commitments for computer hardware, software licenses and inflight entertainment. At March 31, 2019, the future payments under these commitments are presented in the table below. Where applicable, US dollar commitments are translated at the period end foreign exchange rate.
Within 1 year 68,747 1 – <3 years 100,862 3 – <5 years 17,161 Over 5 years 4,926
191,696
(c) Letters of guarantee
At March 31, 2019, the Corporation has a revolving letter of credit facility totaling $50,000 (December 31, 2018 – $50,000). The facility requires funds to be assigned and held in cash security for the full value of letters of guarantee issued by the Corporation. At March 31, 2019, $34,514 (December 31, 2018 – $34,684) letters of guarantee were issued under the facility by assigning restricted cash.