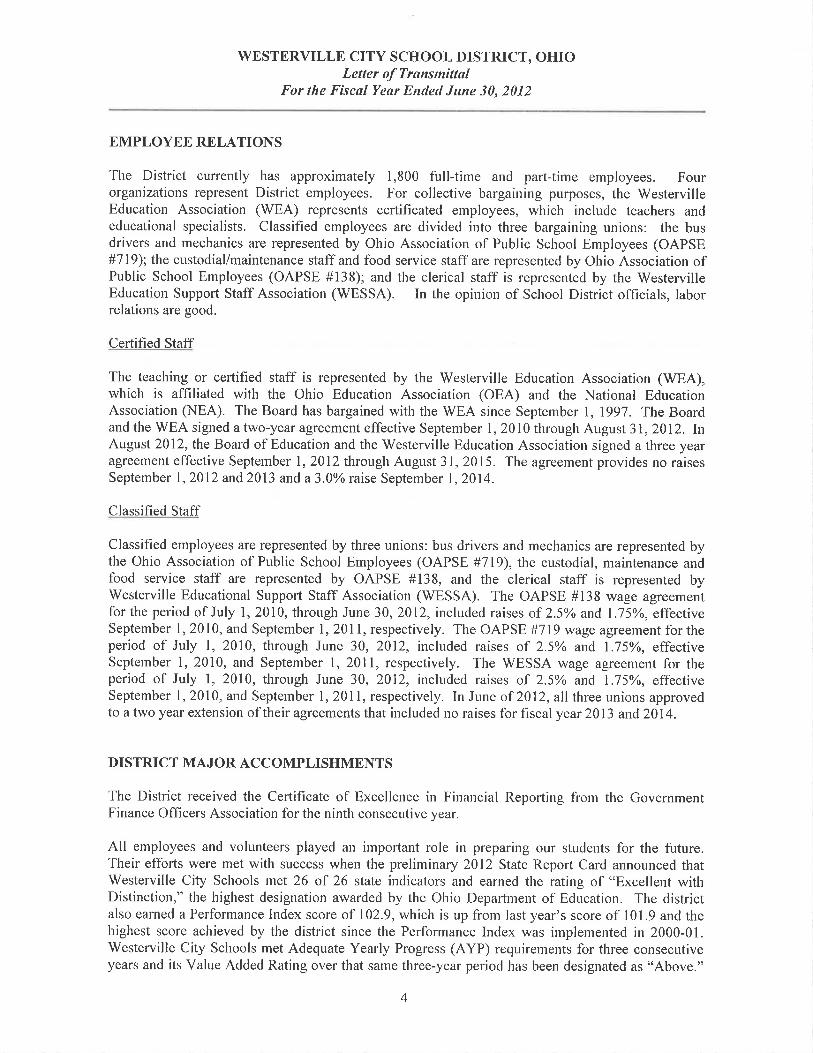
westerville city school district westerville, ohio
TRANSCRIPT

Westerville City School District
Westerville, Ohio
Comprehensive Annual Financial Report
For Fiscal Year Ended June 30, 2012
Issued By: Office of the Treasurer
Prepared By: Bart Griffith Treasurer/CFO Laura A. Hendricks Assistant Treasurer

Westerville City School District
Westerville, Ohio
(This page left intentionally blank)
WESTERVILLE CITY SCHOOL DISTRICT, OHIO Comprehensive Annual Financial Report
Table of Contents For the Fiscal Year Ended June 30, 2012
i
Page
I. INTRODUCTORY SECTION
Letter of Transmittal 1 Elected Officials and Administrative Staff 7 Table of Organization for Administrators 8 Certificate of Achievement, Government Finance Officers Association 9
II. FINANCIAL SECTION
Independent Accountants’ Report 11 Management’s Discussion and Analysis 13 Basic Financial Statements:
Government-wide Financial Statements
Statement of Net Assets 23 Statement of Activities 24
Fund Financial Statements
Balance Sheet – Governmental Funds 25 Reconciliation of Total Governmental Fund Balances to Net Assets of Governmental Activities 26 Statement of Revenues, Expenditures, and Changes in
Fund Balances – Governmental Funds 27
Reconciliation of the Statement of Revenues, Expenditures and Changes in Fund Balances of Governmental Funds to the Statement of Activities 28
Statement of Revenues, Expenditures and Changes in Fund Balance – Budget and Actual (Non-GAAP Budgetary Basis) – General Fund 29
Combined Statement of Net Assets – Proprietary Funds 30 Combined Statement of Revenues, Expenses, and Changes in
Fund Net Assets – Proprietary Funds 31
Combined Statement of Cash Flows – Proprietary Funds 32 Combined Statement of Net Assets – Fiduciary Funds 33 Statement of Changes in Net Assets – Fiduciary Funds 34
WESTERVILLE CITY SCHOOL DISTRICT, OHIO Comprehensive Annual Financial Report
Table of Contents, Continued For the Fiscal Year Ended June 30, 2012
ii
Notes to Basic Financial Statements 35
Supplementary Information
Combining Statements and Individual Fund Schedules
Description of Funds – Debt Service and Permanent Improvement 69
Schedule of Revenues, Expenditures and Changes in Fund Balance – Budget and Actual (Non-GAAP Budgetary Basis) –Debt Service Fund 70
Schedule of Revenues, Expenditures and Changes in Fund
Balance – Budget and Actual (Non-GAAP Budgetary Basis) –Permanent Improvement Fund 70
Description of Funds – Other Governmental Funds 71
Combining Balance Sheet – Other Governmental Funds 74
Combining Statement of Revenues, Expenditures and
Changes in Fund Balances – Other Governmental Funds 78 Schedule of Revenues, Expenditures and Changes in Fund
Balance – Budget and Actual (Non-GAAP Budgetary Basis) – Other Governmental Funds 82
Description of Funds – Internal Service Funds 89
Combining Statement of Net Assets – Internal Service Funds 90
Combining Statement of Revenues, Expenses and
Changes in Fund Net Assets – Internal Service Funds 91
Combining Statement of Cash Flows – Internal Service Funds 92 Description of Funds – Agency Funds 93
Combining Statement of Changes in Assets & Liabilities –
Agency Funds 94
III. STATISTICAL SECTION
Table 95 Net Assets by Component – Last Ten Fiscal Years 96
Change in Net Assets – Last Ten Fiscal Years 97
Fund Balances, Governmental Funds – Last Ten Fiscal Years 100
WESTERVILLE CITY SCHOOL DISTRICT, OHIO Comprehensive Annual Financial Report
Table of Contents, Continued For the Fiscal Year Ended June 30, 2012
iii
Changes in Fund Balances, Governmental Funds – Last Ten Fiscal Years 102
Assessed Valuation and Estimated Actual Value of Taxable Property – Last Ten Collection Years 104 Property Tax Rates Direct and Overlapping Governments – Last Ten Collection Years 105 Principal Taxpayers – Current Year and Nine Years Ago 106 Property Tax Levies and Collections – Real, Public Utility Tax And Tangible Personal Property – Last Ten Calendar Years 107 Ratios of General Bonded Debt Outstanding – Last Ten Years 108 Computation of Direct and Overlapping General Obligation Bonded Debt as of June 30, 2012 109 Legal Debt Margin Information as of June 30, 2012 110
Demographic and Economic Statistics – Last Ten Years 111
Principal Employers – Current Year and Nine Years Ago 112
Staffing Statistics – Full Time Equivalents (FTE) by Type and Function – Last Nine Years 113
Operating Indicators by Function – Last Eight Years 114
Capital Assets by Function/Program – Last Nine Fiscal Years 115 School Building Information– Last Ten Years 116 Educational and Operating Statistics– Last Ten Years 118

Westerville City School District
Westerville, Ohio
(This page left intentionally blank)


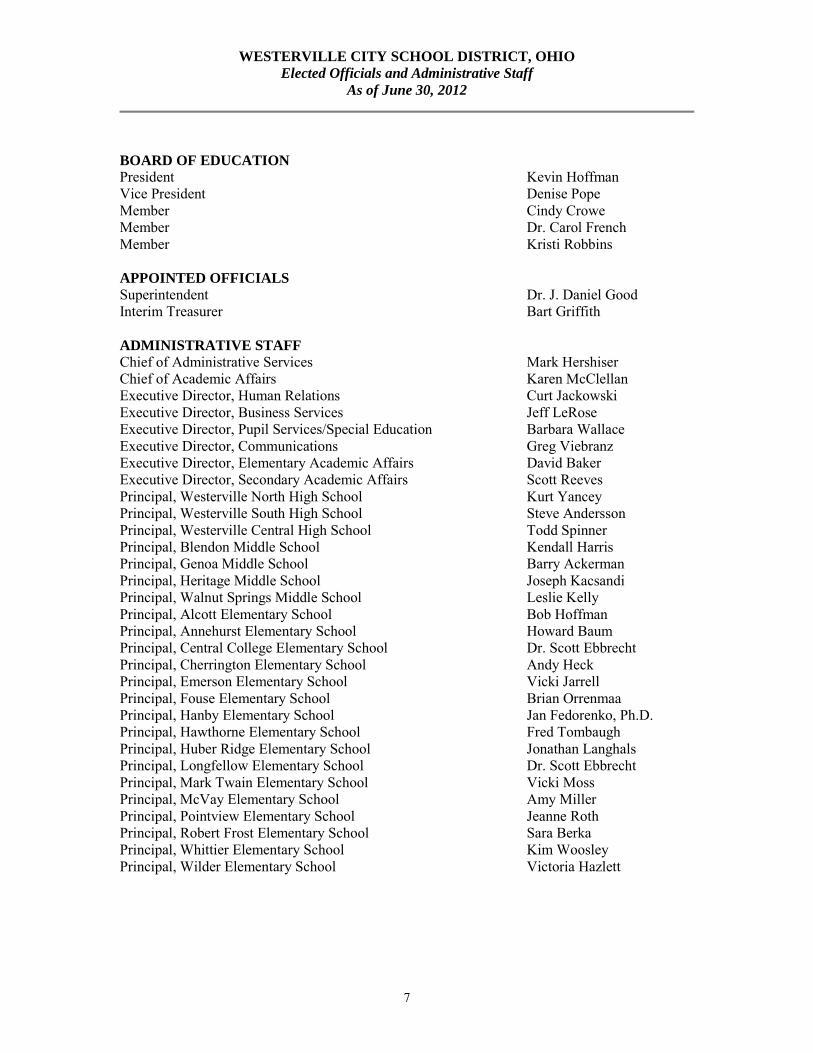
WESTERVILLE CITY SCHOOL DISTRICT, OHIO Elected Officials and Administrative Staff
As of June 30, 2012
7
BOARD OF EDUCATION President Kevin Hoffman Vice President Denise Pope Member Cindy Crowe Member Dr. Carol French Member Kristi Robbins APPOINTED OFFICIALS Superintendent Dr. J. Daniel Good Interim Treasurer Bart Griffith ADMINISTRATIVE STAFF Chief of Administrative Services Mark Hershiser Chief of Academic Affairs Karen McClellan Executive Director, Human Relations Curt Jackowski Executive Director, Business Services Jeff LeRose Executive Director, Pupil Services/Special Education Barbara Wallace Executive Director, Communications Greg Viebranz Executive Director, Elementary Academic Affairs David Baker Executive Director, Secondary Academic Affairs Scott Reeves Principal, Westerville North High School Kurt Yancey Principal, Westerville South High School Steve Andersson Principal, Westerville Central High School Todd Spinner Principal, Blendon Middle School Kendall Harris Principal, Genoa Middle School Barry Ackerman Principal, Heritage Middle School Joseph Kacsandi Principal, Walnut Springs Middle School Leslie Kelly Principal, Alcott Elementary School Bob Hoffman Principal, Annehurst Elementary School Howard Baum Principal, Central College Elementary School Dr. Scott Ebbrecht Principal, Cherrington Elementary School Andy Heck Principal, Emerson Elementary School Vicki Jarrell Principal, Fouse Elementary School Brian Orrenmaa Principal, Hanby Elementary School Jan Fedorenko, Ph.D. Principal, Hawthorne Elementary School Fred Tombaugh Principal, Huber Ridge Elementary School Jonathan Langhals Principal, Longfellow Elementary School Dr. Scott Ebbrecht Principal, Mark Twain Elementary School Vicki Moss Principal, McVay Elementary School Amy Miller Principal, Pointview Elementary School Jeanne Roth Principal, Robert Frost Elementary School Sara Berka Principal, Whittier Elementary School Kim Woosley Principal, Wilder Elementary School Victoria Hazlett

Westerville City School District, OhioTable of Organization for Administrators
For Fiscal Year ended June 30, 2012
Board of Education
Superintendent/CEO Treasurer/CFO
Academic AffairsAdministrative Services
Secondary Academic Affairs
Business Operations
Pupil Services / Special Education
Elementary Academic AffairsCommunications
Human Resources / Employee Relations
Curriculum & Instruction Services
Assessment & Alternative Education
Technology Services
Health & Safety Alternative Education
ServicesServices
8
9

10
Westerville City School District
Westerville, Ohio
(This page left intentionally blank)

11
88 East Broad Street, Tenth Floor, Columbus, Ohio 43215‐3506 Phone: 614‐466‐3402 or 800‐443‐9275 Fax: 614‐728‐7199
www.auditor.state.oh.us
INDEPENDENT ACCOUNTANTS’ REPORT Westerville City School District Franklin County 936 Eastwind Drive Westerville, Ohio 43081 To the Board of Education: We have audited the accompanying financial statements of the governmental activities, each major fund, and the aggregate remaining fund information of Westerville City School District, Franklin County, Ohio (the District), as of and for the year ended June 30, 2012, which collectively comprise the District’s basic financial statements as listed in the table of contents. These financial statements are the responsibility of the District’s management. Our responsibility is to express opinions on these financial statements based on our audit. We conducted our audit in accordance with auditing standards generally accepted in the United States of America and the stan dards applicable to financi al audits contained in th e Comptroller General of the United States’ Government Auditing Standards. Those standards require that we plan and perform the audit to reasonably assure whether the financial statements are free of mate rial misstatement. An audit includes examining, on a test basi s, evidence sup porting the am ounts and disclosures in the finan cial statements. An audit also includes assessing the accounting principles used and significant estimates made by management, as well as evaluating the overall financial statement presentation. We believe our audit provides a reasonable basis for our opinions. In our opini on, the financi al statements referred to above pre sent fairly, in all material resp ects, the respective financial position of the governmental activities, each major fund, and the aggregate remaining fund information of Westerville City School District, Franklin County, Ohio, as of June 30, 2012, and the respective changes in fina ncial position and wh ere applicable, cash flows, thereof and the budgetary comparison for the General Fund for the yea r then ended in conformity with accounting principles generally accepted in the United States of America. In accordance with Government Auditing Standards, we have also issued our report dated November 16, 2012, on our consideration of the District’s internal control over financial reporting and our tests of its compliance with certain provisions of laws, re gulations, contracts a nd grant agreements and other matters. While we did not opine on the internal control over financial reporting or on compliance, that report describes the scope of our testing of internal control over financial reporting and compliance and the results o f that testing. T hat report is an integral part of an audit perfo rmed in acco rdance with Government Auditing Standards. You should read it in conjun ction with thi s report in a ssessing the results of our audit.
Westerville City School District Franklin County Independent Accountants’ Report Page 2
12
Accounting principles generally accepted in the Un ited States of America require this presentation to include Management’s discussion and analysis, as listed in the table of contents, to supplement the basic financial statements. Although this information is not part of the ba sic financial statements, the Governmental Accounting Standards Board considers it essential for pla cing the basic financial statements in an appropriate operational, economic, or historical context. We have applied certain limited procedures to the requi red supplementary information in accord ance with au diting standards generally accepted in the United States of America, which consisted of inquiries of management about the methods of preparing the information and comparing the information for consistency with management’s responses to our inquiries, the basic financial statements, and other knowledge we obtained during our audit of the basic financial statements. We do not express an opinion or provide any assurance on the information because the limited procedures do not provide us with suffici ent evidence to express an opinion or provide any other assurance. We conducted our audit to opine on the financial statements that collectively comprise the District’s basic financial statements taken as a whole. The introductory section, the fina ncial section’s combining statements, individual fund statements and schedules, and the statistical section information provide additional analysis and are not a re quired part of the basic financial statements. The finan cial section’s combining statements, individual fund statements and schedules are management’s responsibility, and were derived from and relates directly to the underlying accounting and other records used to prepare the basic financial statements. These statements and schedules were subject to the auditing procedures we applied to the basi c financial statements. We also applied certain additional procedures, including comparing and reconciling this information directly to the underlying accounting and other records used to prepare the basic financial statements or to the basic financial statements themselves, in accordance with auditing standards generally accepted in the United States of America. In our opinion, this information is fairly stated in all material respects in relation to the basic financial statements taken as a whole. We did not subject the introductory section and statistical section information to the au diting procedures applied in the audit of the ba sic financial statements and, accordingly, we exp ress no opini on or any oth er assurance on them. Dave Yost Auditor of State November 16, 2012

WESTERVILLE CITY SCHOOL DISTRICT, OHIO Management’s Discussion & Analysis, Continued
For the Fiscal Year Ended June 30, 2012 Unaudited
13
The management of the Westerville City School District offers the readers of the District’s Comprehensive Annual Financial Report this narrative overview and analysis of the financial activities for the year ended June 30, 2012. The District encourages readers to consider the information presented here in conjunction with additional information that has been furnished in the letter of transmittal, notes to the basic financial statements and the financial statements to enhance their understanding of the District’s financial performance. FINANCIAL HIGHLIGHTS The District’s net assets increased by $1.4 million or 1.6%. Program revenues accounted for $19.9 million or 11.2% of total revenues, and general revenues accounted for $158.3 million or 88.8%. The general fund reported a positive fund balance of $20.1 million. USING THIS COMPREHENSIVE ANNUAL FINANCIAL REPORT This comprehensive annual financial report consists of a series of financial statements and notes to those statements. The statements are organized so the reader can understand the Westerville City School District as a financial whole, an entire operating entity. The statements then proceed to provide an increasingly detailed look at specific financial activities. The Statement of Net Assets and Statement of Activities provide information about the activities of the whole School District, presenting both an aggregate view of the District’s finances and a longer-term view of those finances. Fund financial statements provide the next level of detail. For governmental funds, these statements tell how services were financed in the short-term as well as what remains for future spending. The fund financial statements also look at the District’s major funds with all other non-major funds presented in total in one column. The major funds for the Westerville City School District are the general fund, and the debt service fund. The District has also selected to present the permanent improvement fund as a major fund. REPORTING THE DISTRICT AS A WHOLE Statement of Net Assets and Statement of Activities While this document contains a large number of funds utilized by the School District to provide programs and activities, the view of the District as a whole looks at all financial transactions and asks the questions, “How did the District perform financially in 2012?” The Statement of Net Assets and the Statement of Activities help to answer this question. These statements include all assets and liabilities using the accrual basis of accounting, which is similar to the accounting used by private sector corporations. This basis of accounting takes into account all of the current year’s revenues and expenses regardless of when cash is received or paid. These two statements report the District’s net assets and changes in those assets. This change in net assets is important because it tells the reader that, for the District as a whole, the financial position of the District has improved or diminished. The reader must also consider other non-financial factors such as the District’s property tax base, current property tax laws, student enrollment growth, facility conditions and other factors in arriving at their conclusion regarding the overall health of the District.
WESTERVILLE CITY SCHOOL DISTRICT, OHIO Management’s Discussion & Analysis, Continued
For the Fiscal Year Ended June 30, 2012 Unaudited
14
In the Statement of Net Assets and the Statement of Activities, all of the District’s activities are reported as governmental including instruction, support services, operation and maintenance of plant, student transportation and extracurricular activities. REPORTING THE DISTRICT’S MOST SIGNIFICANT FUNDS Fund Financial Statements Our analysis of the District’s major funds begins on page 19. The fund financial statements begin on page 25 and provide detailed information about the most significant funds – not the District as a whole. Some funds are required to be established by State statute, while many other funds are established by the District to help manage money for particular purposes and compliance with various grant provisions. The District’s three types of funds, governmental, proprietary and fiduciary use different accounting approaches as further described in the notes to the financial statements. Governmental Funds Most of the District’s activities are reported in governmental funds, which focus on how money flows into and out of those funds and the balances remaining at year-end available for spending in future periods. These funds are reported utilizing an accounting method called modified accrual accounting, which measures cash and other financial assets that can readily be converted to cash. The governmental fund statements provide a detailed short-term view of the District’s general government operations and the basic services it provides. Governmental fund information helps you determine whether there are more or fewer financial resources available to spend in the near future to finance the District’s programs. The relationship (or differences) between governmental activities (reported in the Statement of Net Assets and the Statement of Activities) and governmental funds is reconciled in the financial statements. Proprietary Funds Proprietary funds use the same basis of accrual basis of accounting, the same as on the entity-wide statements. The District uses an internal service fund to account for the Intra-District Services Fund which provides copy and print services to other funds, as well as an internal service fund to account for a self-insurance program and one for workers compensation insurance. The assets, liabilities, and net assets of the internal service funds have been included within the governmental activities. Fiduciary Funds The District is the trustee, or fiduciary for various student managed activity programs, various scholarship programs and other items listed as agency and private purpose. All of the District’s fiduciary activities are reported in separate Statements of Fiduciary Net Assets and Changes in Fiduciary Net Assets on page 33-34. We exclude these activities from the District’s other financial statements because the assets cannot be utilized by the District to finance its operations. FINANCIAL ANALYSIS OF THE SCHOOL DISTRICT AS A WHOLE Net assets may serve over time as a useful indicator of a government’s financial position. In the case of the District, assets exceeded liabilities by $85 million at the close of the most recent fiscal year.
WESTERVILLE CITY SCHOOL DISTRICT, OHIO Management’s Discussion & Analysis, Continued
For the Fiscal Year Ended June 30, 2012 Unaudited
15
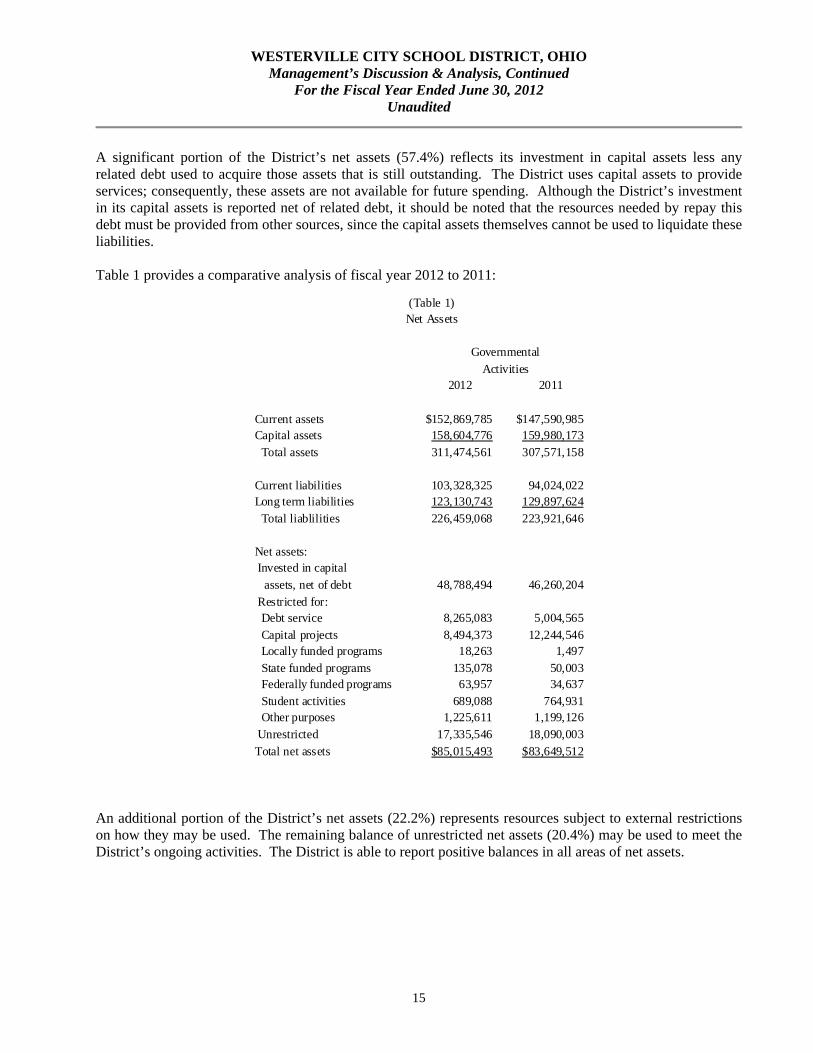
A significant portion of the District’s net assets (57.4%) reflects its investment in capital assets less any related debt used to acquire those assets that is still outstanding. The District uses capital assets to provide services; consequently, these assets are not available for future spending. Although the District’s investment in its capital assets is reported net of related debt, it should be noted that the resources needed by repay this debt must be provided from other sources, since the capital assets themselves cannot be used to liquidate these liabilities. Table 1 provides a comparative analysis of fiscal year 2012 to 2011:
An additional portion of the District’s net assets (22.2%) represents resources subject to external restrictions on how they may be used. The remaining balance of unrestricted net assets (20.4%) may be used to meet the District’s ongoing activities. The District is able to report positive balances in all areas of net assets.
2012 2011
Current assets $152,869,785 $147,590,985Capital assets 158,604,776 159,980,173 Total assets 311,474,561 307,571,158
Current liabilities 103,328,325 94,024,022Long term liabilities 123,130,743 129,897,624 Total liablilities 226,459,068 223,921,646
Net assets: Invested in capital
assets, net of debt 48,788,494 46,260,204 Restricted for: Debt service 8,265,083 5,004,565 Capital projects 8,494,373 12,244,546 Locally funded programs 18,263 1,497 State funded programs 135,078 50,003 Federally funded programs 63,957 34,637 Student activities 689,088 764,931 Other purposes 1,225,611 1,199,126 Unrestricted 17,335,546 18,090,003
Total net assets $85,015,493 $83,649,512
Net Assets(Table 1)
Activities
Governmental
WESTERVILLE CITY SCHOOL DISTRICT, OHIO Management’s Discussion & Analysis, Continued
For the Fiscal Year Ended June 30, 2012 Unaudited
16
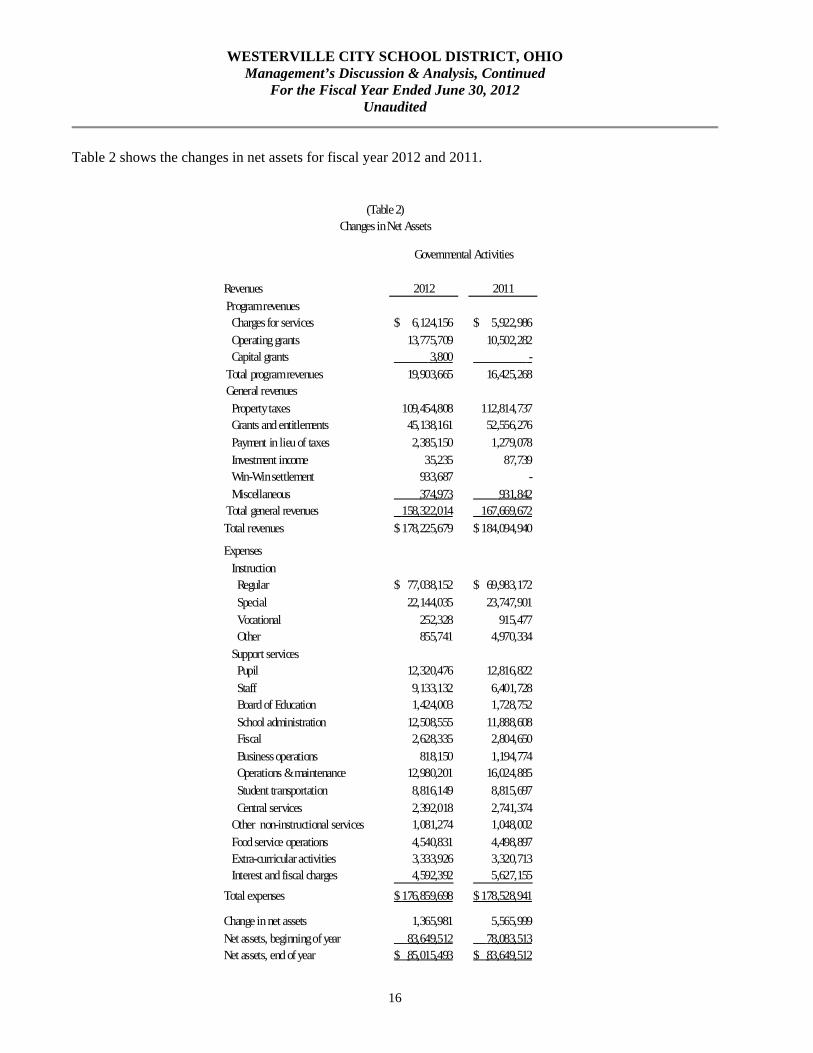
Table 2 shows the changes in net assets for fiscal year 2012 and 2011.
Revenues 2012 2011
Program revenues Charges for services 6,124,156$ 5,922,986$
Operating grants 13,775,709 10,502,282 Capital grants 3,800 -
Total program revenues 19,903,665 16,425,268 General revenues
Property taxes 109,454,808 112,814,737 Grants and entitlements 45,138,161 52,556,276
Payment in lieu of taxes 2,385,150 1,279,078 Investment income 35,235 87,739 Win-Win settlement 933,687 -
Miscellaneous 374,973 931,842 Total general revenues 158,322,014 167,669,672
Total revenues 178,225,679$ 184,094,940$
Expenses
Instruction Regular 77,038,152$ 69,983,172$
Special 22,144,035 23,747,901 Vocational 252,328 915,477 Other 855,741 4,970,334
Support services Pupil 12,320,476 12,816,822
Staff 9,133,132 6,401,728 Board of Education 1,424,003 1,728,752
School administration 12,508,555 11,888,608 Fiscal 2,628,335 2,804,650
Business operations 818,150 1,194,774 Operations & maintenance 12,980,201 16,024,885
Student transportation 8,816,149 8,815,697 Central services 2,392,018 2,741,374 Other non-instructional services 1,081,274 1,048,002
Food service operations 4,540,831 4,498,897 Extra-curricular activities 3,333,926 3,320,713 Interest and fiscal charges 4,592,392 5,627,155
Total expenses 176,859,698$ 178,528,941$
Change in net assets 1,365,981 5,565,999
Net assets, beginning of year 83,649,512 78,083,513 Net assets, end of year 85,015,493$ 83,649,512$
(Table 2)Changes in Net Assets
Governmental Activities

WESTERVILLE CITY SCHOOL DISTRICT, OHIO Management’s Discussion & Analysis, Continued
For the Fiscal Year Ended June 30, 2012 Unaudited
17
Governmental Activities Net assets of the District’s governmental activities increased by $1.4 million, and unrestricted net assets reflect a balance of $17.3 million. In fiscal year 2012 the District faced decreasing tax revenues as re result of the poor housing market and a shrinking tax base. Also, the District was unsuccessful with a levy request on the November 2011 ballot. Grant revenue declined as the federal ARRA programs ended in June 2011. The District was able to offset these losses by significant reductions in staff and programs. The Statement of Activities shows the cost of program services and the charges for services and grants offsetting those services. The table below reflects the cost of program services and the net cost of those services after taking into account the program revenues for the governmental activities. The net cost of program services must be supported by general revenues including tax revenue, investment earnings and unrestricted State entitlements.
2012 2011 2012 2011 Program expenses Instruction Regular 77,038,152$ 69,983,172$ 74,632,908$ 68,194,464$ Special 22,144,035 23,747,901 15,654,570 19,454,463 Vocational 252,328 915,477 78,155 696,130 Other 855,741 4,970,334 567,485 4,582,490 Support services Pupil 12,320,476 12,816,822 11,766,940 12,218,599 Staff 9,133,132 6,401,728 7,478,713 4,706,444 General administration 1,424,003 1,728,752 1,424,003 1,728,752 School administration 12,508,555 11,888,608 12,263,573 11,637,388 Fiscal 2,628,335 2,804,650 2,605,278 2,784,298 Business operations 818,150 1,194,774 818,150 1,194,774 Operations & maintenance 12,980,201 16,024,885 12,355,653 16,024,885 Student transportation 8,816,149 8,815,697 8,340,727 8,808,466 Central services 2,392,018 2,741,374 2,350,618 2,680,630 Other non-instructional services 1,081,274 1,048,002 139,699 202,417 Food service operations 4,540,831 4,498,897 (154,074) (270,140) Extra-curricular activities 3,333,926 3,320,713 2,041,243 1,832,458 Interest and fiscal charges 4,592,392 5,627,155 4,592,392 5,627,155
Total expenses 176,859,698$ 178,528,941$ 156,956,033$ 162,103,673$
(Table 3)
Total Cost of Services Net Cost of Services
WESTERVILLE CITY SCHOOL DISTRICT, OHIO Management’s Discussion & Analysis, Continued
For the Fiscal Year Ended June 30, 2012 Unaudited
18
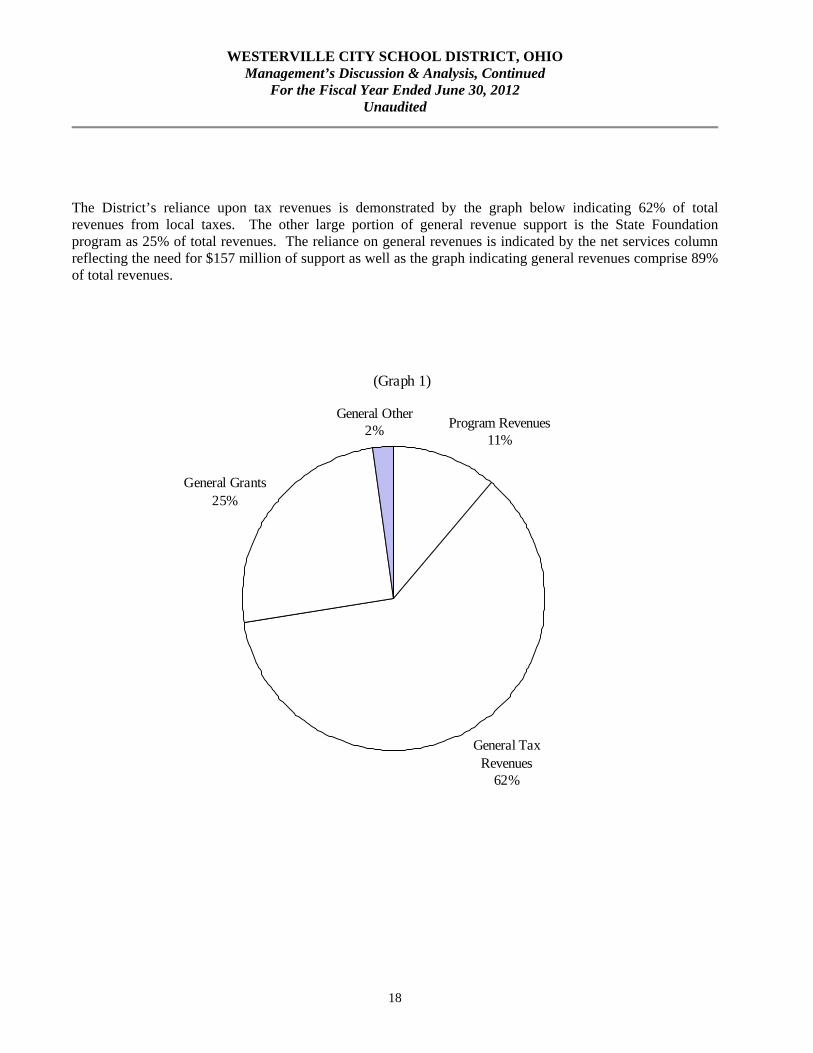
The District’s reliance upon tax revenues is demonstrated by the graph below indicating 62% of total revenues from local taxes. The other large portion of general revenue support is the State Foundation program as 25% of total revenues. The reliance on general revenues is indicated by the net services column reflecting the need for $157 million of support as well as the graph indicating general revenues comprise 89% of total revenues.
(Graph 1)
Program Revenues11%
General Tax Revenues
62%
General Grants25%
General Other2%

WESTERVILLE CITY SCHOOL DISTRICT, OHIO Management’s Discussion & Analysis, Continued
For the Fiscal Year Ended June 30, 2012 Unaudited
19
The District’s Funds The District’s governmental funds (as presented on the balance sheet on page 25) reported a combined fund balance of $38.5 million, which represents a decrease of $7.95 million. The schedule below indicates the fund balance and the total change in fund balance as of June 30, 2012 and 2011.
General Fund The District’s general fund balance decrease is due to expenditures exceeding revenues. Property tax revenue decreased $3.9 million due a shrinking tax base and an unsuccessful levy attempt in November 2011. Intergovernmental – State revenue decreased as a result of the continued phase out of the tangible personal property tax and the electric deregulation replacement funds. The tables and graphs that follow assist in illustrating the financial activities and balance of the general fund.
Fund Balance Fund Balance IncreaseJune 30, 2012 June 30, 2011 (Decrease)
(as restated)
General 20,148,122$ 24,713,940$ (4,565,818)$ Debt Service 8,447,429 7,964,302 483,127 Permanent Improvement 7,818,103 11,866,584 (4,048,481) Other Governemental 2,130,878 1,950,036 180,842
Total 38,544,532$ 46,494,862$ (7,950,330)$
Revenues by Source 2012 2011 % ChangeRevenues Taxes 92,827,847$ 96,767,909$ -4.07% Payment in lieu of taxes 2,385,150 1,279,078 86.47% Intergovernmental - State 45,377,104 48,519,306 -6.48% Other Revenue 3,409,653 2,451,749 39.07%Total 143,999,754$ 149,018,042$ -3.37%

WESTERVILLE CITY SCHOOL DISTRICT, OHIO Management’s Discussion & Analysis, Continued
For the Fiscal Year Ended June 30, 2012 Unaudited
20
As the graph below illustrates, the largest portions of general fund expenditures is for salaries and fringe benefits. The District is a service entity and as such is labor intensive.
Salaries & Wages61%
Fringe Benefits22%
Purchased Services11%
Supplies2%
Miscellaneous4%
Expenditures by Object 2012 2011 % Change
Salaries and Wages 90,625,000$ 89,714,756$ 1.01% Fringe Benefits 32,684,426 29,815,509 9.62% Purchased Services 16,342,213 17,321,215 -5.65% Supplies 2,971,311 2,895,449 2.62% Miscellaneous 5,942,623 6,713,219 -11.48%
Total 148,565,572$ 146,460,148$ 1.44%
(Table 6)
(Graph 2)
WESTERVILLE CITY SCHOOL DISTRICT, OHIO Management’s Discussion & Analysis, Continued
For the Fiscal Year Ended June 30, 2012 Unaudited
21
Expenditures have increased $2.1 million over the prior year. Salaries and wages and fringe benefits have increased $3.8 million due to increases in base salaries and steps and the continued rising costs of insurance despite staff reductions in January 2012. Purchased services decreased $1 million due to the District purchasing some special education programs through the Educational Service Center in fiscal year 2011, but providing the services with District staff in fiscal year 2012. Other Funds The District’s debt service fund balance increased by $483 thousand. The revenues of the fund are property taxes, calculated by the county auditor, and state homestead and rollback money computed as a percentage of the tax due to the fund. The expenses of the fund include debt principal and interest payments as well as county auditor and treasurer fees. The permanent improvement fund had a decrease in fund balance of $4 million due to the completion of spending of the $25 million of Tax Anticipation Notes issued in March 2010. Other governmental funds consist of special revenue funds. The decrease in fund balance of $80 thousand is primarily due to timing of expenditures in the State and Federal grants. General Fund Budget Information The District’s budget is prepared in accordance with Ohio law and is based on the cash basis of accounting, utilizing cash receipts, disbursements and encumbrances. The most significant budgeted fund is the General Fund. The District utilizes the five-year forecast as the original document from which to form the operating budget. After updating of the forecast for changes in revenue and expenditure assumptions the operating budget begins at the school level. Each school in the district receives a per pupil allocation augmented with resources for special education students in the specific buildings. The departments then receive the remainder of funds to bring the budget into balance with the five-year forecast. The site and department budgets are reviewed periodically to ensure management becomes aware of any significant variations during the year. Capital Assets The District has $158.6 million invested in capital assets net of depreciation. Acquisitions totaled $5.3 million and depreciation was $6.5 million. The acquisitions were for various land and building improvements, equipment and buses. For more detailed information regarding the District’s capital assets, refer to Note 8 in the notes to the basic financial statements. Debt At June 30, 2012, the District had $110.7 million in outstanding bonds. The District paid $6.5 million in principal on bonds outstanding and $4.9 million in interest during the fiscal year. Under current state statutes, the District’s general obligation bonded debt issues are subject to a legal limitation based on 9% of the total assessed value of real and personal property. At June 30, 2012, the District’s general obligation debt was below the legal limit. For more detailed information regarding the District’s debt, refer to Note 9 in the notes to the basic financial statements.

WESTERVILLE CITY SCHOOL DISTRICT, OHIO Management’s Discussion & Analysis, Continued
For the Fiscal Year Ended June 30, 2012 Unaudited
22
Restrictions and Other Limitations The District was unsuccessful on November 8, 2011 with a levy request of .5% earned income tax and 4.06 mill property tax. Both of these were for general operating expenses. The District made a number of reductions to staff and programs beginning January 1, 2012. Plans were also developed for eliminating staffing and programs for school year 2012-2013. The District passed a five year, 6.71 mill emergency levy request on March 6, 2012. However, the future financial stability of the District is not without challenges. The first challenge is for management to ensure resources can be preserved as long as possible. The five-year forecast of the general fund and the five-year capital plans are utilized by management as a tool to manage resources effectively. The second challenge facing the District is based on the economy. The District had experienced growth in property valuation for many years, but this year’s decrease of 6.79% is the second year of decrease in a row. The growth patterns in student population have slowed down. Also, the economic slowdown has resulted in revenue forecasts having to be revised downward. These scenarios have caused the District to make accommodations for program offerings within existing dollars. Requests for Information This financial report is designed to provide a general overview of the Westerville City School District’s finances for all those with an interest in the government’s finances. Questions concerning any of the information provided in this report or requests for additional financial information should be addressed to Westerville City Schools, Office of the Treasurer, 936 Eastwind Drive, Westerville, Ohio, 43081.
GovernmentalActivities
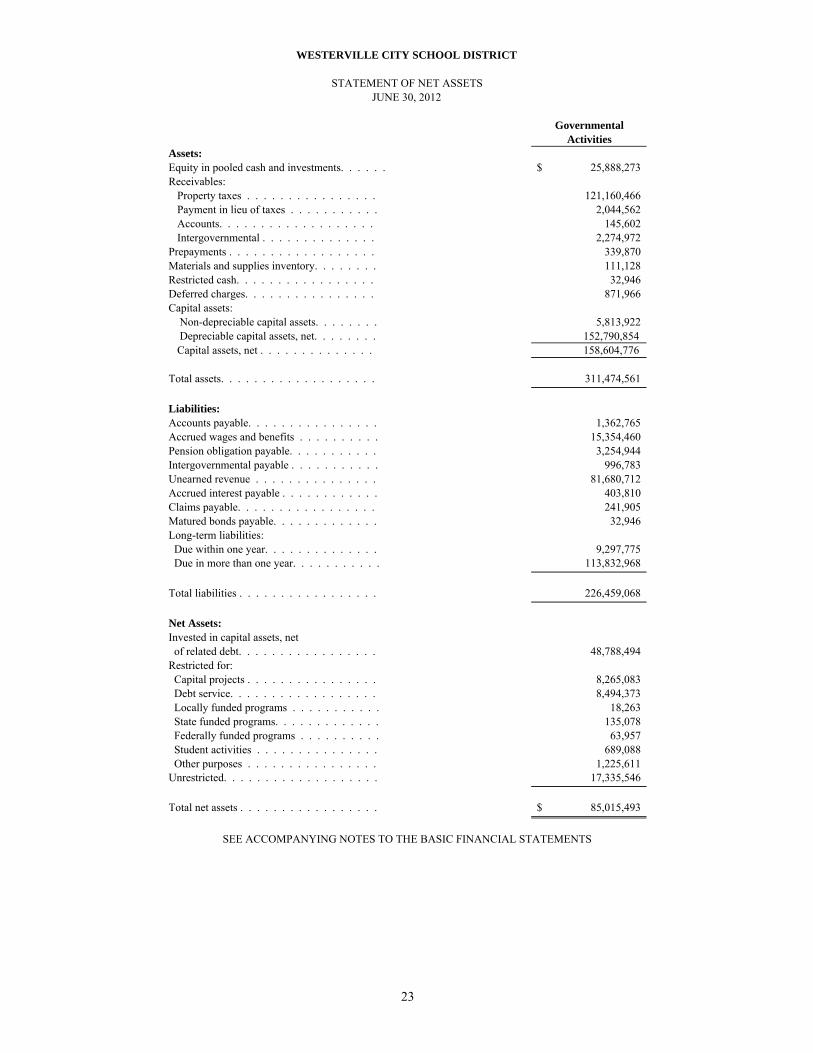
Assets:Equity in pooled cash and investments. . . . . . 25,888,273$ Receivables:
Property taxes . . . . . . . . . . . . . . . . 121,160,466 Payment in lieu of taxes . . . . . . . . . . . 2,044,562 Accounts. . . . . . . . . . . . . . . . . . . 145,602 Intergovernmental . . . . . . . . . . . . . . 2,274,972
Prepayments . . . . . . . . . . . . . . . . . . 339,870 Materials and supplies inventory. . . . . . . . 111,128 Restricted cash. . . . . . . . . . . . . . . . . 32,946 Deferred charges. . . . . . . . . . . . . . . . 871,966 Capital assets: Non-depreciable capital assets. . . . . . . . 5,813,922 Depreciable capital assets, net. . . . . . . . 152,790,854
Capital assets, net . . . . . . . . . . . . . . 158,604,776
Total assets. . . . . . . . . . . . . . . . . . . 311,474,561
Liabilities:Accounts payable. . . . . . . . . . . . . . . . 1,362,765 Accrued wages and benefits . . . . . . . . . . 15,354,460 Pension obligation payable. . . . . . . . . . . 3,254,944 Intergovernmental payable . . . . . . . . . . . 996,783 Unearned revenue . . . . . . . . . . . . . . . 81,680,712 Accrued interest payable . . . . . . . . . . . . 403,810 Claims payable. . . . . . . . . . . . . . . . . 241,905 Matured bonds payable. . . . . . . . . . . . . 32,946 Long-term liabilities: Due within one year. . . . . . . . . . . . . . 9,297,775 Due in more than one year. . . . . . . . . . . 113,832,968
Total liabilities . . . . . . . . . . . . . . . . . 226,459,068
Net Assets:Invested in capital assets, net of related debt. . . . . . . . . . . . . . . . . 48,788,494 Restricted for: Capital projects . . . . . . . . . . . . . . . . 8,265,083 Debt service. . . . . . . . . . . . . . . . . . 8,494,373 Locally funded programs . . . . . . . . . . . 18,263 State funded programs. . . . . . . . . . . . . 135,078 Federally funded programs . . . . . . . . . . 63,957 Student activities . . . . . . . . . . . . . . . 689,088 Other purposes . . . . . . . . . . . . . . . . 1,225,611 Unrestricted. . . . . . . . . . . . . . . . . . . 17,335,546
Total net assets . . . . . . . . . . . . . . . . . 85,015,493$
SEE ACCOMPANYING NOTES TO THE BASIC FINANCIAL STATEMENTS
WESTERVILLE CITY SCHOOL DISTRICT
STATEMENT OF NET ASSETSJUNE 30, 2012
23
Net (Expense)Revenue and
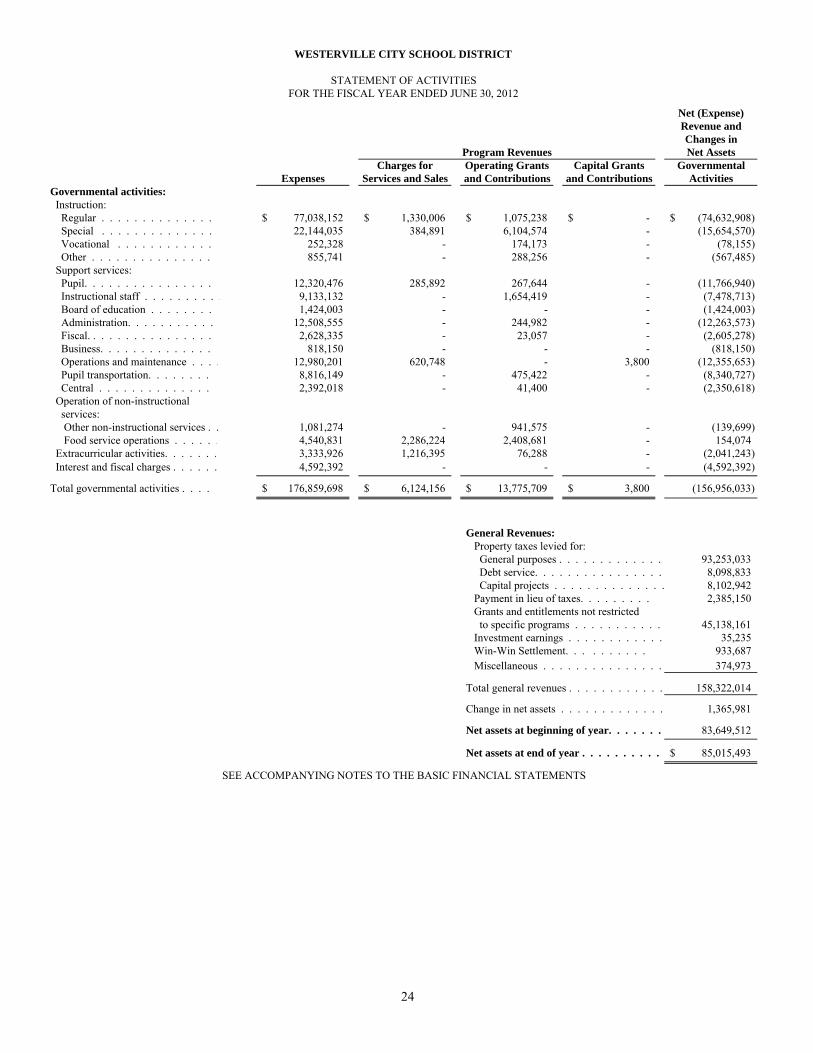
Charges for Operating Grants Capital Grants GovernmentalExpenses Services and Sales and Contributions and Contributions Activities
Governmental activities: Instruction: Regular . . . . . . . . . . . . . . 77,038,152$ 1,330,006$ 1,075,238$ -$ (74,632,908)$ Special . . . . . . . . . . . . . . 22,144,035 384,891 6,104,574 - (15,654,570) Vocational . . . . . . . . . . . . 252,328 - 174,173 - (78,155) Other . . . . . . . . . . . . . . . 855,741 - 288,256 - (567,485) Support services: Pupil. . . . . . . . . . . . . . . . 12,320,476 285,892 267,644 - (11,766,940) Instructional staff . . . . . . . . . . 9,133,132 - 1,654,419 - (7,478,713) Board of education . . . . . . . . . 1,424,003 - - - (1,424,003) Administration. . . . . . . . . . . . 12,508,555 - 244,982 - (12,263,573) Fiscal. . . . . . . . . . . . . . . . 2,628,335 - 23,057 - (2,605,278) Business. . . . . . . . . . . . . . 818,150 - - - (818,150) Operations and maintenance . . . . 12,980,201 620,748 - 3,800 (12,355,653) Pupil transportation. . . . . . . . . 8,816,149 - 475,422 - (8,340,727) Central . . . . . . . . . . . . . . 2,392,018 - 41,400 - (2,350,618) Operation of non-instructional services: Other non-instructional services . . 1,081,274 - 941,575 - (139,699) Food service operations . . . . . . 4,540,831 2,286,224 2,408,681 - 154,074 Extracurricular activities. . . . . . . 3,333,926 1,216,395 76,288 - (2,041,243) Interest and fiscal charges . . . . . . 4,592,392 - - - (4,592,392)
Total governmental activities . . . . 176,859,698$ 6,124,156$ 13,775,709$ 3,800$ (156,956,033)
General purposes . . . . . . . . . . . . . 93,253,033 Debt service. . . . . . . . . . . . . . . . 8,098,833 Capital projects . . . . . . . . . . . . . . 8,102,942
2,385,150 Grants and entitlements not restricted to specific programs . . . . . . . . . . . 45,138,161
Investment earnings . . . . . . . . . . . . 35,235 Win-Win Settlement. . . . . . . . . . 933,687 Miscellaneous . . . . . . . . . . . . . . . 374,973
Total general revenues . . . . . . . . . . . . 158,322,014
Change in net assets . . . . . . . . . . . . . 1,365,981
Net assets at beginning of year. . . . . . . 83,649,512
Net assets at end of year . . . . . . . . . . 85,015,493$
WESTERVILLE CITY SCHOOL DISTRICT
STATEMENT OF ACTIVITIESFOR THE FISCAL YEAR ENDED JUNE 30, 2012
General Revenues:Property taxes levied for:
SEE ACCOMPANYING NOTES TO THE BASIC FINANCIAL STATEMENTS
Program Revenues
Payment in lieu of taxes. . . . . . . . .
Changes inNet Assets
24

Other TotalDebt Permanent Governmental Governmental
General Service Improvement Funds FundsAssets:Equity in pooled cash and investments. . . . . . . . . . . . . . . . 10,350,157$ 5,882,146$ 6,094,396$ 2,511,103$ 24,837,802$ Receivables:
Property taxes. . . . . . . . . . . . . . . . . 103,712,981 8,754,957 8,692,528 - 121,160,466 Payment in lieu of taxes . . . . . . . . . . . 2,044,562 - - - 2,044,562 Accounts . . . . . . . . . . . . . . . . . . . 116,370 - - 23,837 140,207 Interfund loans . . . . . . . . . . . . . . . . 5,859 - - - 5,859 Intergovernmental. . . . . . . . . . . . . . . 1,529,307 - - 745,665 2,274,972
Prepayments. . . . . . . . . . . . . . . . . . . 339,870 - - - 339,870 Materials and supplies inventory. . . . . . . . . 82,317 - - 28,811 111,128 Restricted cash. . . . . . . . . . . . . . . . . - 32,946 - - 32,946 Total assets . . . . . . . . . . . . . . . . . . . 118,181,423$ 14,670,049$ 14,786,924$ 3,309,416$ 150,947,812$
Liabilities: Accounts payable . . . . . . . . . . . . . . . . 364,116$ -$ 817,907$ 179,669$ 1,361,692$ Accrued wages and benefits. . . . . . . . . . . 14,587,233 - - 752,589 15,339,822 Compensated absences payable . . . . . . . . . 2,148,646 - - - 2,148,646 Interfund loans payable. . . . . . . . . . . . . - - - 5,859 5,859 Intergovernmental payable . . . . . . . . . . . 852,215 - - 9,279 861,494 Unearned revenue. . . . . . . . . . . . . . . . 70,237,858 5,738,920 5,703,934 - 81,680,712 Deferred revenue . . . . . . . . . . . . . . . . 6,822,800 450,754 446,980 - 7,720,534 Pension obligation payable . . . . . . . . . . . 3,020,433 - - 231,142 3,251,575 Matured bonds payable. . . . . . . . . . . . . - 32,946 - - 32,946 Total liabilities. . . . . . . . . . . . . . . . . . 98,033,301 6,222,620 6,968,821 1,178,538 112,403,280
Fund Balances: Nonspendable: Materials and supplies inventory. . . . . . . 82,317 - - 28,811 111,128 Prepaids. . . . . . . . . . . . . . . . . . . 339,870 - - - 339,870 Restricted: Debt service . . . . . . . . . . . . . . . . . - 8,447,429 - - 8,447,429 Capital improvements . . . . . . . . . . . . - - 7,818,103 - 7,818,103 Food service operations . . . . . . . . . . . - - - 1,196,800 1,196,800 Non-public schools . . . . . . . . . . . . . - - - 133,714 133,714 Special education . . . . . . . . . . . . . . - - - 10,739 10,739 Targeted academic assistance . . . . . . . . - - - 21,435 21,435 Vocational education. . . . . . . . . . . . . - - - 19,893 19,893 Extracurricular. . . . . . . . . . . . . . . - - - 689,088 689,088 Other purposes. . . . . . . . . . . . . . . . - - - 31,517 31,517 Assigned: Student instruction . . . . . . . . . . . . . . 103,054 - - - 103,054 Student and staff support. . . . . . . . . . . 820,340 - - - 820,340 Subsequent year appropriations. . . . . . . . 1,420,662 - - - 1,420,662 Unassigned (deficit) . . . . . . . . . . . . . 17,381,879 - - (1,119) 17,380,760
Total fund balances . . . . . . . . . . . . . . . 20,148,122 8,447,429 7,818,103 2,130,878 38,544,532
Total liabilities and fund balances . . . . . . . . 118,181,423$ 14,670,049$ 14,786,924$ 3,309,416$ 150,947,812$
SEE ACCOMPANYING NOTES TO THE BASIC FINANCIAL STATEMENTS
WESTERVILLE CITY SCHOOL DISTRICT
BALANCE SHEETGOVERNMENTAL FUNDS
JUNE 30, 2012
25
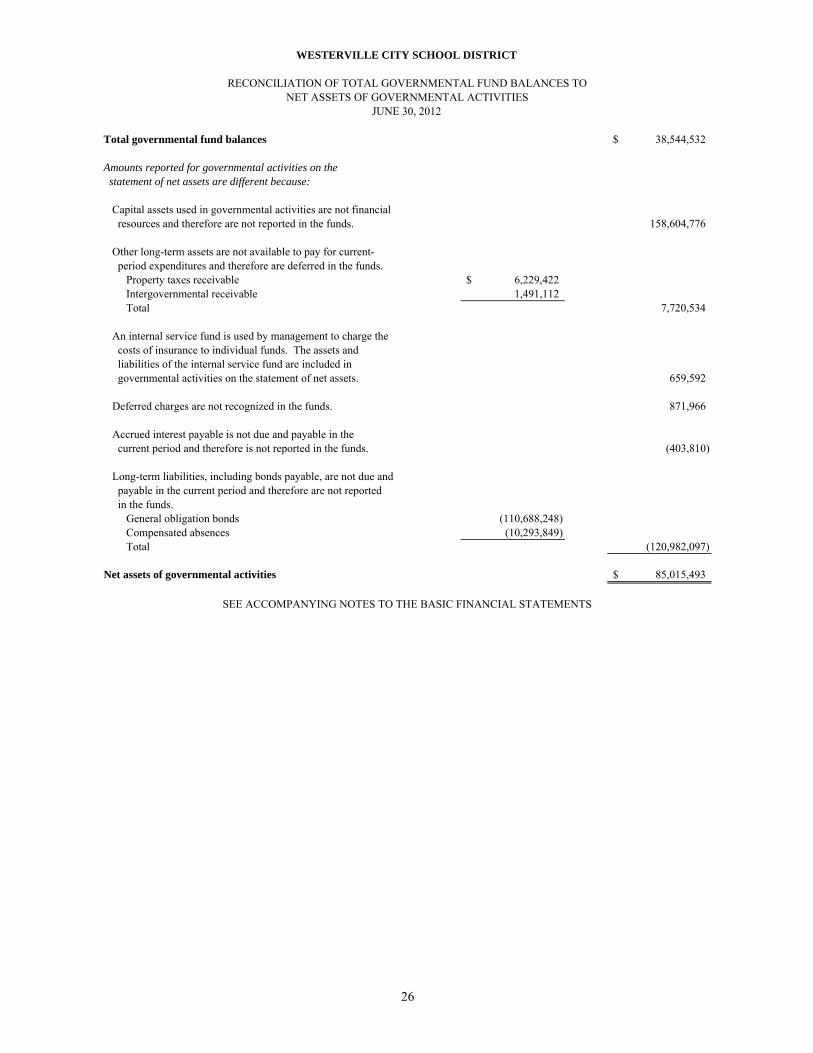
Total governmental fund balances 38,544,532$
Amounts reported for governmental activities on the statement of net assets are different because:
Capital assets used in governmental activities are not financial resources and therefore are not reported in the funds. 158,604,776
Other long-term assets are not available to pay for current- period expenditures and therefore are deferred in the funds. Property taxes receivable 6,229,422$ Intergovernmental receivable 1,491,112 Total 7,720,534
An internal service fund is used by management to charge the costs of insurance to individual funds. The assets and liabilities of the internal service fund are included in governmental activities on the statement of net assets. 659,592
Deferred charges are not recognized in the funds. 871,966
Accrued interest payable is not due and payable in the current period and therefore is not reported in the funds. (403,810)
Long-term liabilities, including bonds payable, are not due and payable in the current period and therefore are not reported in the funds. General obligation bonds (110,688,248) Compensated absences (10,293,849) Total (120,982,097)
Net assets of governmental activities 85,015,493$
SEE ACCOMPANYING NOTES TO THE BASIC FINANCIAL STATEMENTS
JUNE 30, 2012
WESTERVILLE CITY SCHOOL DISTRICT
RECONCILIATION OF TOTAL GOVERNMENTAL FUND BALANCES TONET ASSETS OF GOVERNMENTAL ACTIVITIES
26

Other TotalDebt Permanent Governmental Governmental
General Service Improvement Funds FundsRevenues:From local sources: Property taxes . . . . . . . . . . . . . . . . 92,827,847$ 8,018,642$ 8,033,924$ -$ 108,880,413$ Payment in lieu of taxes . . . . . . . . . . . 2,385,150 - - - 2,385,150 Tuition. . . . . . . . . . . . . . . . . . . . 1,145,130 - - - 1,145,130 Earnings on investments . . . . . . . . . . . 34,940 - - 717 35,657 Charges for services . . . . . . . . . . . . . - - - 2,283,149 2,283,149 Extracurricular. . . . . . . . . . . . . . . . 590,962 - - 889,119 1,480,081 Classroom materials and fees . . . . . . . . 569,767 - - - 569,767 Rental income . . . . . . . . . . . . . . . . 605,189 - 15,559 - 620,748 Contributions and donations . . . . . . . . . 100,712 - 3,800 142,212 246,724 Other local revenues . . . . . . . . . . . . . 362,953 - - 14,721 377,674 Intergovernmental - state . . . . . . . . . . . 45,377,104 1,010,022 1,195,309 948,696 48,531,131 Intergovernmental - federal . . . . . . . . . . - - - 9,819,993 9,819,993 Total revenues . . . . . . . . . . . . . . . . . 143,999,754 9,028,664 9,248,592 14,098,607 176,375,617
Expenditures: Current: Instruction: Regular. . . . . . . . . . . . . . . . . . . 70,113,609 - - 1,087,818 71,201,427 Special . . . . . . . . . . . . . . . . . . . 16,872,003 - - 3,912,928 20,784,931 Vocational . . . . . . . . . . . . . . . . . 157,997 - - 54,197 212,194 Other . . . . . . . . . . . . . . . . . . . . 552,380 - - 288,256 840,636 Support services: Pupil . . . . . . . . . . . . . . . . . . . . 12,109,540 - - 189,511 12,299,051 Instructional staff . . . . . . . . . . . . . . 7,430,607 - - 1,654,512 9,085,119 Board of education . . . . . . . . . . . . . 1,424,110 - - - 1,424,110 Administration . . . . . . . . . . . . . . . 11,054,502 - - 244,982 11,299,484 Fiscal . . . . . . . . . . . . . . . . . . . . 2,392,547 103,306 104,067 20,660 2,620,580 Business. . . . . . . . . . . . . . . . . . . 860,314 - - - 860,314 Operations and maintenance . . . . . . . . 12,927,669 - - - 12,927,669 Pupil transportation . . . . . . . . . . . . . 8,174,272 - - 9,519 8,183,791 Central . . . . . . . . . . . . . . . . . . . 2,281,001 - - 41,651 2,322,652 Operation of non-instructional services:
Operation of non-instructional . . . . . . . 115,503 - - 862,607 978,110 Food service operations. . . . . . . . . . . - - - 4,498,250 4,498,250
Extracurricular activities . . . . . . . . . . . 2,099,518 - - 1,052,874 3,152,392 Facilities acquisition, construction and maintenance - - 10,212,668 - 10,212,668 Debt service: Principal retirement. . . . . . . . . . . . . . - 6,535,000 - - 6,535,000 Interest and fiscal charges . . . . . . . . . . - 4,887,569 - - 4,887,569 Total expenditures . . . . . . . . . . . . . . 148,565,572 11,525,875 10,316,735 13,917,765 184,325,947
(Deficiency) of revenues (under)expenditures. . . . . . . . . . . . . . . . . (4,565,818) (2,497,211) (1,068,143) 180,842 (7,950,330)
Other financing sources (uses): Transfers in. . . . . . . . . . . . . . . . . . - 2,980,338 - - 2,980,338 Transfers (out) . . . . . . . . . . . . . . . . - - (2,980,338) - (2,980,338) Total other financing sources (uses) . . . . . . - 2,980,338 (2,980,338) - -
Net change in fund balances . . . . . . . . . . (4,565,818) 483,127 (4,048,481) 180,842 (7,950,330)
Fund balances at beginning of year (restated) . 24,713,940 7,964,302 11,866,584 1,950,036 46,494,862 Fund balances at end of year. . . . . . . . . . 20,148,122$ 8,447,429$ 7,818,103$ 2,130,878$ 38,544,532$
FOR THE FISCAL YEAR ENDED JUNE 30, 2012
SEE ACCOMPANYING NOTES TO THE BASIC FINANCIAL STATEMENTS
WESTERVILLE CITY SCHOOL DISTRICT
STATEMENT OF REVENUES, EXPENDITURES AND CHANGES IN FUND BALANCESGOVERNMENTAL FUNDS
27
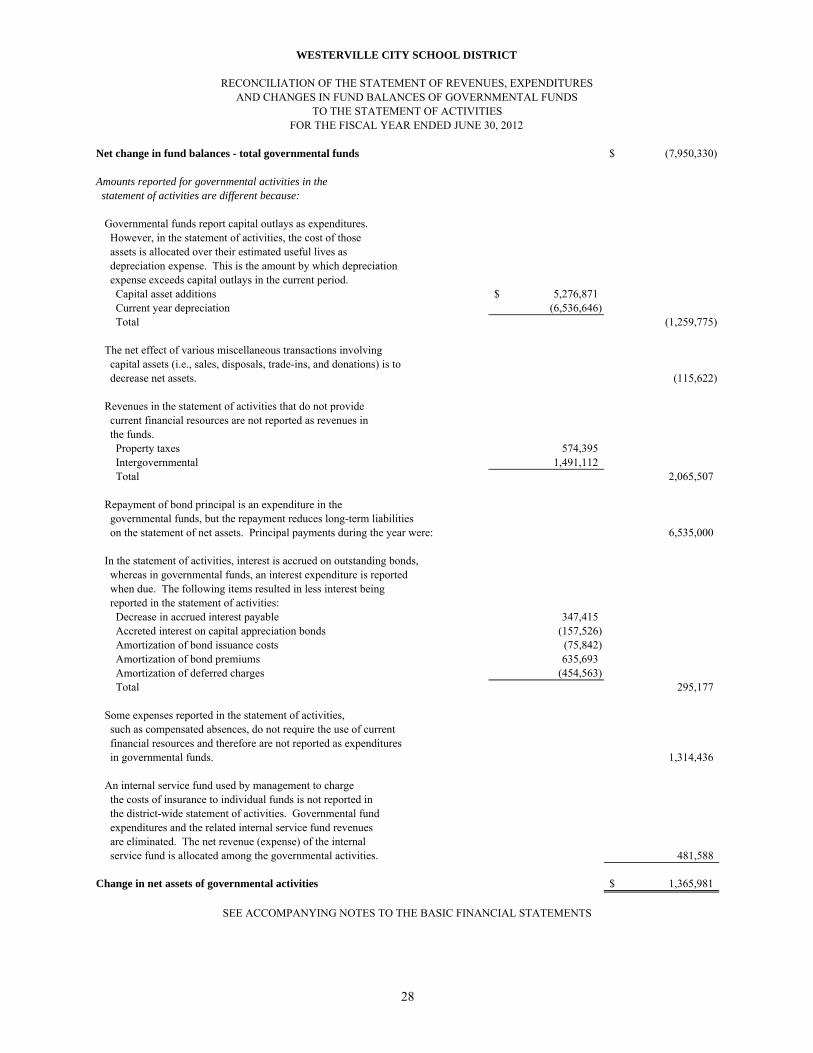
Net change in fund balances - total governmental funds (7,950,330)$
Amounts reported for governmental activities in the statement of activities are different because:
Governmental funds report capital outlays as expenditures. However, in the statement of activities, the cost of those assets is allocated over their estimated useful lives as depreciation expense. This is the amount by which depreciation expense exceeds capital outlays in the current period. Capital asset additions 5,276,871$ Current year depreciation (6,536,646) Total (1,259,775)
The net effect of various miscellaneous transactions involving capital assets (i.e., sales, disposals, trade-ins, and donations) is to decrease net assets. (115,622)
Revenues in the statement of activities that do not provide current financial resources are not reported as revenues in the funds. Property taxes 574,395 Intergovernmental 1,491,112 Total 2,065,507
Repayment of bond principal is an expenditure in the governmental funds, but the repayment reduces long-term liabilities on the statement of net assets. Principal payments during the year were: 6,535,000
In the statement of activities, interest is accrued on outstanding bonds, whereas in governmental funds, an interest expenditure is reported when due. The following items resulted in less interest being reported in the statement of activities: Decrease in accrued interest payable 347,415 Accreted interest on capital appreciation bonds (157,526) Amortization of bond issuance costs (75,842) Amortization of bond premiums 635,693 Amortization of deferred charges (454,563) Total 295,177
Some expenses reported in the statement of activities, such as compensated absences, do not require the use of current financial resources and therefore are not reported as expenditures in governmental funds. 1,314,436
An internal service fund used by management to charge the costs of insurance to individual funds is not reported in the district-wide statement of activities. Governmental fund expenditures and the related internal service fund revenues are eliminated. The net revenue (expense) of the internal service fund is allocated among the governmental activities. 481,588
Change in net assets of governmental activities 1,365,981$
SEE ACCOMPANYING NOTES TO THE BASIC FINANCIAL STATEMENTS
TO THE STATEMENT OF ACTIVITIESFOR THE FISCAL YEAR ENDED JUNE 30, 2012
WESTERVILLE CITY SCHOOL DISTRICT
RECONCILIATION OF THE STATEMENT OF REVENUES, EXPENDITURESAND CHANGES IN FUND BALANCES OF GOVERNMENTAL FUNDS
28

Variance withFinal Budget
PositiveOriginal Final Actual (Negative)
Revenues: Real Estate Taxes. . . . . . . . . . . . . . 90,500,000$ 90,798,402$ 73,652,401$ (17,146,001)$ Personal Property Taxes. . . . . . . . . . . 3,000,000 2,647,860 2,647,859 (1) State Revenue. . . . . . . . . . . . . . . . 30,428,387 31,188,437 31,244,918 56,481 Homestead/Rollback & TPP. . . . . . . . . 14,494,558 14,093,998 14,093,992 (6) Tuition, Fees, Interest & Misc. . . . . . . . 4,696,100 4,884,949 4,937,158 52,209 Transfers, Advances, Refund of Prior Year. . 296,884 492,884 492,376 (508) Total revenues . . . . . . . . . . . . . . . . . 143,415,929 144,106,530 127,068,704 (17,037,826)
Expenditures: Salaries and Wages 89,709,460 89,600,075 89,285,714 314,361 Benefits & Insurance 30,670,702 32,121,098 32,181,982 (60,884) Purchased Services 23,300,789 18,108,707 16,933,908 1,174,799 New & Replacement Equipment 318,914 308,949 269,798 39,151 Other Expenditures 3,147,217 7,764,894 6,991,805 773,089 Total expenditures . . . . . . . . . . . . . . 150,719,320 151,482,275 148,652,048 2,830,227
Net change in fund balance . . . . . . . . . (7,303,391) (7,375,745) (21,583,344) (14,207,599)
Fund balance at beginning of year . . . . . 28,304,540 28,304,540 28,304,540 - Prior year encumbrances appropriated . . 1,272,931 1,272,931 1,272,931 - Fund balance at end of year. . . . . . . . 22,274,080$ 22,201,726$ 7,994,127$ (14,207,599)$
GENERAL FUNDFOR THE FISCAL YEAR ENDED JUNE 30, 2012
Budgeted Amounts
SEE ACCOMPANYING NOTES TO THE BASIC FINANCIAL STATEMENTS
WESTERVILLE CITY SCHOOL DISTRICT
STATEMENT OF REVENUES, EXPENDITURES AND CHANGES INFUND BALANCE - BUDGET AND ACTUAL (NON-GAAP BUDGETARY BASIS)
29

Governmental Activities - Internal Service Funds
Assets: Current assets:Equity in pooled cash and investments. . . . . . . . . . . . . . 1,050,471$ Receivables: Accounts . . . . . . . . . . . . . . . . . 5,395
Total assets. . . . . . . . . . . . . . . . . 1,055,866
Liabilities:Accounts payable. . . . . . . . . . . . . . . 1,073 Accrued wages and benefits . . . . . . . . . 14,638 Pension obligation payable. . . . . . . . . . 3,369 Intergovernmental payable . . . . . . . . . . 135,289 Claims payable . . . . . . . . . . . . . . . . 241,905
Total liabilities . . . . . . . . . . . . . . . . 396,274
Net assets:Unrestricted. . . . . . . . . . . . . . . . . . 659,592
Total net assets . . . . . . . . . . . . . . . . 659,592$
WESTERVILLE CITY SCHOOL DISTRICT
SEE ACCOMPANYING NOTES TO THE BASIC FINANCIAL STATEMENTS
STATEMENT OF NET ASSETSPROPRIETARY FUNDS
JUNE 30, 2012
30
Governmental Activities - Internal Service Funds
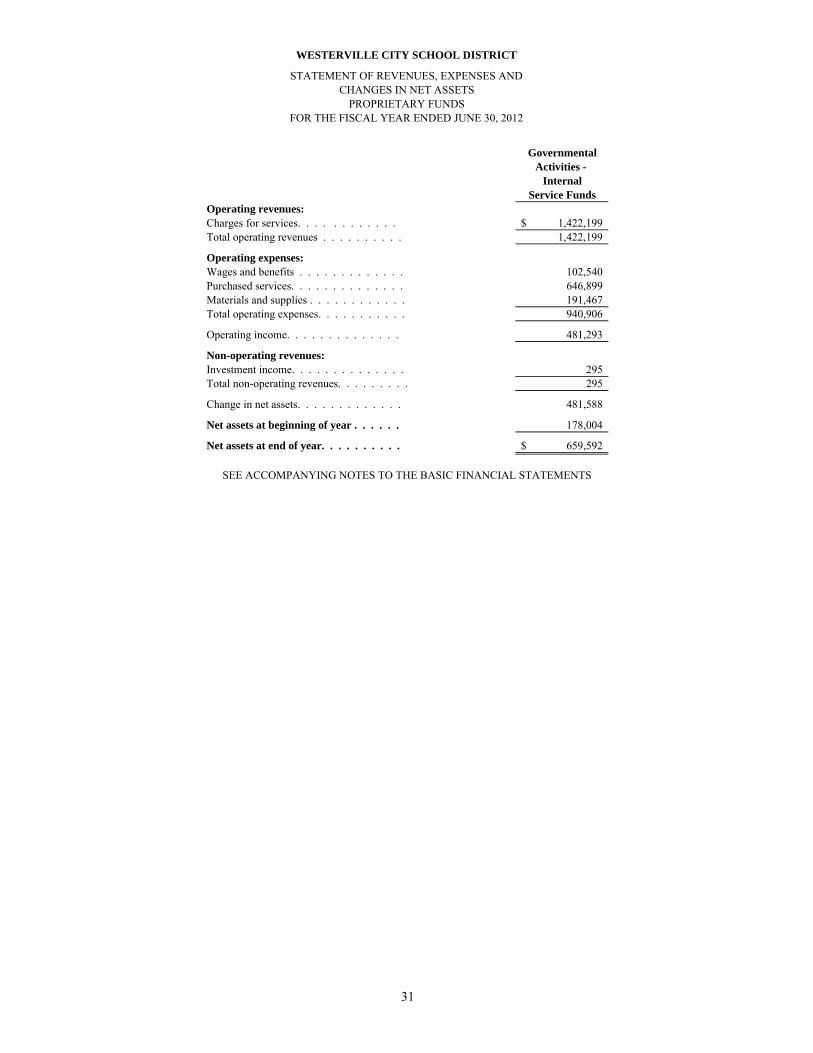
Operating revenues: Charges for services. . . . . . . . . . . . 1,422,199$ Total operating revenues . . . . . . . . . . 1,422,199
Operating expenses:Wages and benefits . . . . . . . . . . . . . 102,540 Purchased services. . . . . . . . . . . . . . 646,899 Materials and supplies . . . . . . . . . . . . 191,467 Total operating expenses. . . . . . . . . . . 940,906
Operating income. . . . . . . . . . . . . . 481,293
Non-operating revenues:Investment income. . . . . . . . . . . . . . 295 Total non-operating revenues. . . . . . . . . 295
Change in net assets. . . . . . . . . . . . . 481,588
Net assets at beginning of year . . . . . . 178,004
Net assets at end of year. . . . . . . . . . 659,592$
SEE ACCOMPANYING NOTES TO THE BASIC FINANCIAL STATEMENTS
WESTERVILLE CITY SCHOOL DISTRICT
STATEMENT OF REVENUES, EXPENSES ANDCHANGES IN NET ASSETS
PROPRIETARY FUNDSFOR THE FISCAL YEAR ENDED JUNE 30, 2012
31
Governmental Activities - Internal Service Funds
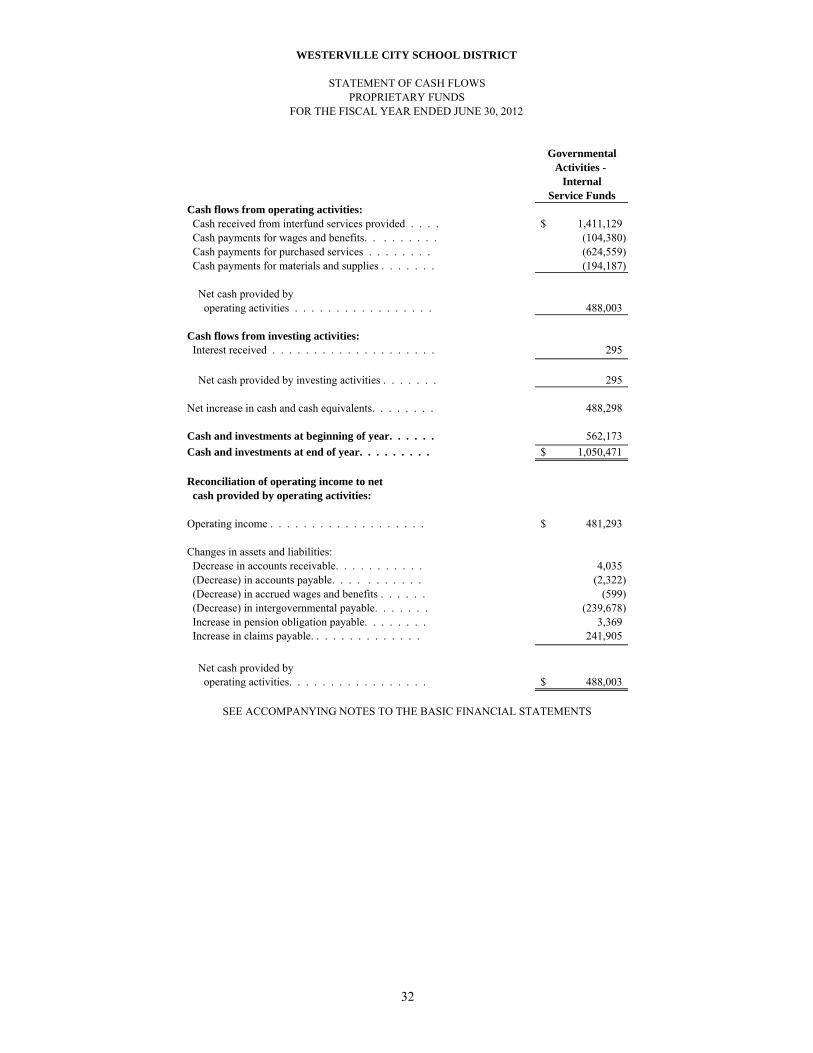
Cash flows from operating activities: Cash received from interfund services provided . . . . 1,411,129$ Cash payments for wages and benefits. . . . . . . . . (104,380) Cash payments for purchased services . . . . . . . . (624,559) Cash payments for materials and supplies . . . . . . . (194,187)
Net cash provided by operating activities . . . . . . . . . . . . . . . . . 488,003
Cash flows from investing activities: Interest received . . . . . . . . . . . . . . . . . . . . 295
Net cash provided by investing activities . . . . . . . 295
Net increase in cash and cash equivalents. . . . . . . . 488,298
Cash and investments at beginning of year. . . . . . 562,173 Cash and investments at end of year. . . . . . . . . 1,050,471$
Reconciliation of operating income to net cash provided by operating activities:
Operating income . . . . . . . . . . . . . . . . . . . 481,293$
Changes in assets and liabilities: Decrease in accounts receivable. . . . . . . . . . . 4,035 (Decrease) in accounts payable. . . . . . . . . . . (2,322) (Decrease) in accrued wages and benefits . . . . . . (599) (Decrease) in intergovernmental payable. . . . . . . (239,678) Increase in pension obligation payable. . . . . . . . 3,369 Increase in claims payable. . . . . . . . . . . . . . 241,905
Net cash provided by operating activities. . . . . . . . . . . . . . . . . 488,003$
SEE ACCOMPANYING NOTES TO THE BASIC FINANCIAL STATEMENTS
WESTERVILLE CITY SCHOOL DISTRICT
STATEMENT OF CASH FLOWSPROPRIETARY FUNDS
FOR THE FISCAL YEAR ENDED JUNE 30, 2012
32

Private Purpose Trust Scholarship Agency
Assets: Current assets:Equity in pooled cash and investments. . . . . . . . . . . . . . 55,521$ 398,591$
Total assets. . . . . . . . . . . . . . . . . 55,521 398,591$
Liabilities: Accounts payable. . . . . . . . . . . . . . . 995 2,360$ Due to others. . . . . . . . . . . . . . . . . - 396,231
Total liabilities . . . . . . . . . . . . . . . . 995 398,591$
Net assets: Held in trust for scholarships . . . . . . . . . 54,526
Total net assets . . . . . . . . . . . . . . . . 54,526$
SEE ACCOMPANYING NOTES TO THE BASIC FINANCIAL STATEMENTS
WESTERVILLE CITY SCHOOL DISTRICT
FIDUCIARY FUNDSJUNE 30, 2012
STATEMENT OF FIDUCIARY NET ASSETS
33

Private Purpose Trust Scholarship
Additions: Gifts and contributions. . . . . . . . . . . . 18,354$ Total additions. . . . . . . . . . . . . . . . 18,354
Deductions:Scholarships awarded . . . . . . . . . . . . 12,995
Change in net assets. . . . . . . . . . . . . 5,359
Net assets at beginning of year . . . . . . 49,167
Net assets at end of year. . . . . . . . . . 54,526$
SEE ACCOMPANYING NOTES TO THE BASIC FINANCIAL STATEMENTS
WESTERVILLE CITY SCHOOL DISTRICT
FIDUCIARY FUNDSFOR THE FISCAL YEAR ENDED JUNE 30, 2012
STATEMENT OF CHANGES IN FIDUCIARY NET ASSETS
34

WESTERVILLE CITY SCHOOL DISTRICT, OHIO
Notes to Basic Financial Statements For the Fiscal Year Ended June 30, 2012
35
(1) DESCRIPTION OF THE SCHOOL DISTRICT AND REPORTING ENTITY
The Westerville City School District (the District) was organized in the early 1850’s and is a fiscally independent political subdivision of the State of Ohio. The District is a city district as defined by Section 3311.02 of the Ohio Revised Code. The District operates under a locally elected five-member board and is responsible for the provision of public education to residents of the District. The District encompasses 52 square miles and provides services to approximately 14,844 students. The accompanying basic financial statements comply with GASB Statement No. 14, “The Financial Reporting Entity” as amended by GASB Statement No. 39, “Determining Whether Certain Organizations Are Component Units”. The reporting entity is composed of the primary government and component units. The primary government consists of all funds, departments, boards and agencies that are not legally separate from the District. For the District, this includes general operations, food service and student related activities of the District. Component units are legally separate organizations for which the District is financially accountable. The District is financially accountable for an organization if the District appoints a voting majority of the organization’s Governing Board and (1) the District is able to significantly influence the programs or services performed or provided by the organization; or (2) the District is legally entitled to or can otherwise access the organization’s resources; or (3) the District is legally obligated or has otherwise assumed the responsibility to finance the deficits of, or provide financial support to, the organization; or (4) the District is obligated for the debt of the organization. Component units may also include organizations that are fiscally dependent on the District in that the District approves the budget, the issuance of debt or the levying of taxes. Certain organizations are also included as component units if the nature and significance of the relationship between the primary government and the organization is such that exclusion by the primary government would render the primary governments financial statements incomplete or misleading. Based upon the application of these criteria, the District has no component units. The basic financial statements of the reporting entity include only those of the District (the primary government).
(2) SUMMARY OF SIGNIFICANT ACCOUNTING POLICIES
The financial statements of the District have been prepared in conformity with generally accepted accounting principles (GAAP) as applied to governmental units. The Governmental Accounting Standards Board (GASB) is the accepted standard-setting body for establishing governmental accounting and financial reporting principles. The District has elected, under GASB No. 20, to apply Financial Accounting Standards Board Statements and Interpretations issued on or before November 30, 1989, to its governmental and proprietary funds, except those that conflict with a GASB pronouncement. The District’s significant accounting policies are described below.
WESTERVILLE CITY SCHOOL DISTRICT, OHIO
Notes to Basic Financial Statements, Continued For the Fiscal Year Ended June 30, 2012
36
(a) Basis of Presentation The District’s basic financial statements consist of government-wide statements, including a statement of net assets and a statement of activities, and fund financial statements which provide a more detailed level of financial information. Government-wide Financial Statements – The statement of net assets and the statement of activities display information about the District as a whole. These statements include the financial activities of the primary government, except for fiduciary funds. Internal Service fund activity is eliminated to avoid overstatement of revenues and expenses. Interfund services provided and used are not eliminated in the process of consolidation. The government-wide statements are prepared using the economic resources measurement focus. All assets and liabilities associated with the operation of the District are included on the statement of net assets. This is the same approach used in the preparation of proprietary fund financial statements but differs from the manner in which governmental fund financial statements are prepared. Governmental fund financial statements therefore include a reconciliation with brief explanations to better identify the relationship between the governmental activities in the government-wide statements and the statements for governmental funds. The government-wide statement of activities presents a comparison between direct expenses and program revenues for each function or program of the governmental activities of the District. Direct expenses are those that are specifically associated with a service, program or department and therefore clearly indentifiable to a particular function. Program revenues include amounts paid by the recipient of goods and services offered by the program and grants and contributions that are restricted to meeting the operational or capital requirements of a particular program. Revenues not classified as program revenues are presented as general revenues of the District. The comparison of direct expenses with program revenues identifies the extent to which each governmental function is self-financing or draws from the general revenues of the District.
Fund Financial Statements – Fund financial statements report detailed information about the District. The focus of governmental fund financial statements is on major funds rather than reporting funds by type. Each major fund is reported in a separate column, and all nonmajor funds are aggregated into one column. Internal Service funds are combined and the totals are presented in a single column on the face of the proprietary fund statements. Fiduciary funds are reported by fund type.
WESTERVILLE CITY SCHOOL DISTRICT, OHIO
Notes to Basic Financial Statements, Continued For the Fiscal Year Ended June 30, 2012
37
The accounting and financial reporting treatment applied to a fund is determined by its measurement focus. All governmental funds are accounted for using a flow of current financial resources measurement focus. With this measurement focus, only current assets and current liabilities generally are included on the balance sheet. Operating statements of these funds present increases (i.e., revenues and other financing sources) and decreases (i.e., expenditures and other financing uses) in net current assets.
All proprietary funds are accounted for on a flow of economic resources measurement focus. With this measurement focus, all assets and all liabilities associated with the operations of these funds are included on the statement of net assets. Proprietary fund’s operating statements present increases (e.g., revenues) and decreases (e.g., expenses) in net total assets.
Proprietary funds distinguish operating revenues and expenses from non-operating items. Operating revenues and expenses generally result from providing services and producing and delivering goods in connection with a proprietary fund’s principal ongoing operation. The principal operating revenues of the District’s Internal Service funds are charges for services. Operating expenses for internal service funds include the cost of services. All revenues and expenses not meeting this definition are reported as non-operating revenues and expenses.
The private purpose trust fund is accounted for using a flow of economic resources measurement focus. Agency funds do not report a measurement focus as they do not report operations.
(b) Fund Accounting
The District uses funds to report on its financial position and the results of its operations. A fund is a separate accounting entity with a self-balancing set of accounts. Fund accounting is designed to demonstrate legal compliance and to aid financial management by segregating transactions related to certain school district activities or functions. Governmental Funds Governmental funds are those through which most governmental functions of the District are financed. Governmental fund reporting focuses on the sources, uses and balance of current financial resources. Expendable assets are assigned to the various governmental funds according to the purposes for which they may or must be used. Current liabilities are assigned to the fund from which they will be paid. The difference between governmental fund assets and liabilities is reported as fund balance. The following are the District’s major governmental funds:
General Fund – This Fund is the general operating fund of the District and is used to account for and report all financial resources except those required to be accounted for and reported in another fund.

WESTERVILLE CITY SCHOOL DISTRICT, OHIO
Notes to Basic Financial Statements, Continued For the Fiscal Year Ended June 30, 2012
38
Debt Service Fund - This Fund is used to account for the accumulation of resources for, and the payment of, governmental long-term debt principal, interest, and related costs. Permanent Improvement Fund - This Fund is used to account for financial resources to be used for the maintenance of capital facilities, technology and curriculum.
Other governmental funds of the District are used to account for specific revenue sources that are restricted or committed to an expenditure for specific purposes other than debt service or capital projects.
Proprietary Funds
Proprietary fund reporting focuses on the determination of operating income, changes in net assets, financial position and cash flows.
Internal Service Funds -Internal Service Funds are used to account for the financing of goods or services provided by one department or agency to other departments or agencies of the District on a cost reimbursement basis. Charges are intended only to recoup the total costs of such services.
Self Insurance Fund -The Self Insurance Fund is used to account for monies received from other funds as payment for providing medical and dental employee benefits.
Print Shop Fund - The Print Shop Fund is used to account for the monies received for printing and duplicating services provided by the Print Shop to all District departments and various community organizations.
Worker’s Compensation Fund - The Worker’s Compensation Fund is used to account for monies received from other funds as payment for providing Worker’s Compensation benefits to employees.
Fiduciary Funds
Fiduciary Funds are used to account for assets held by the District in a trustee capacity or as an agent for individuals, private organizations, other governmental units and/or other funds.
Private-purpose Trust Fund - A private-purpose trust fund accounts for resources, including both principal and earnings, which must be expended according to the provisions of the student scholarship agreements and are not available to support the District’s own programs.
Agency Funds - Agency funds are used to account for assets held by the District for staff, student activity programs that are managed by the students, and individuals for medical spending. Agency funds are purely custodial and thus do not involve measurement of results of operations.
WESTERVILLE CITY SCHOOL DISTRICT, OHIO
Notes to Basic Financial Statements, Continued For the Fiscal Year Ended June 30, 2012
39
(c) Basis of Accounting
The government-wide financial statements are reported using the economic resources measurement focus and accrual basis of accounting, as are the proprietary fund and private purpose trust fund of the fiduciary fund financial statements. The agency funds of the fiduciary funds do not have a measurement focus, but are reported using the accrual basis of accounting. Revenues are recorded when earned and expenses are recorded when a liability is incurred, regardless of the timing related to cash flows. Property taxes are recognized as revenues in the year for which they are levied. Grants and other similar items are recognized as revenue as soon as all eligibility requirements imposed by the provider have been met. Government fund financial statements are reported using the current economic financial resources measurement focus and the modified accrual basis of accounting. Revenues are recognized as soon as they are both measurable and available. Revenues are considered available when they are collectible within the current period or soon enough thereafter to pay liabilities of the current period. For this purpose, the District considers revenues to be available when they are collected within 60 days of the current fiscal period. Expenditures are generally recorded when a liability is incurred, as under accrual accounting. However, debt service principal expenditures, as well as expenditures related to compensated absences and claims and judgements, are recorded only when payment is due. Property taxes are recognized as revenue in the fiscal year for which taxes have been levied, provided they are collected and certified by the county auditor by the fiscal year-end. Additionally, taxes collected more than 30 days after year-end are recorded as a receivable with an offset to deferred revenue for the amounts not collected and available for advance by June 30 by the county auditor. Tuition, grants, fees and interest associated with the current fiscal period are all considered to be susceptible to accrual and so have been recognized as a receivable or revenue, or deferred revenue of the current fiscal period. All other revenue items are considered to be measurable and available only when the cash is received by the District. The preparation of the financial statements in conformity with GAAP requires management to make estimates and assumptions that affect the reported amounts of assets and liabilities at the date of the financial statements and the reported amounts of revenues and expenses during the reporting period. Actual results could differ from those estimates.
(d) Budgets
The District is required by state statute to adopt an annual appropriated cash basis budget for all funds other than agency funds. The specific timetable for the fiscal year 2012 was as follows:

WESTERVILLE CITY SCHOOL DISTRICT, OHIO
Notes to Basic Financial Statements, Continued For the Fiscal Year Ended June 30, 2012
40
1. Prior to January 15 of the preceding year, the Superintendent and Treasurer submit to the Board of Education a proposed operating budget for the fiscal year commencing the following July 1. The budget includes proposed expenditures and the means of financing for all funds. Public hearings are publicized and conducted to obtain taxpayers’ comments. The expressed purpose of this budget document is to reflect the need for existing (or increased) tax rates.
2. By no later than January 20, the Board-adopted budget is filed with the Franklin County Budget Commission for a tax rate determination. The original budget revenue amounts reported in the budgetary statement for the General Fund reflects the amounts set forth in this tax budget.
3. Prior to March 15, the Board of Education accepts by formal resolution, the tax rates as determined by the Budget Commission and receives the Commission's Certificate of Estimated Resources (the Certificate), which states the projected revenue for each fund. Prior to June 30, the District must revise its budget so that total contemplated expenditures from any fund during the ensuing year will not exceed the amount stated in the certificate. On or about July 1, the Certificate is amended to include any unencumbered balances from the preceding year as reported by the District Treasurer. The Certificate may be further amended during the year if projected increases or decreases in revenue are identified by the District Treasurer. The final budget amounts reported in the budgetary statement reflect the amounts set forth in the final amended Certificate issued for fiscal 2012.
4. By July 1, the annual appropriation resolution is legally enacted by the Board of
Education at the fund level for all funds, which is the legal level of budgetary control. This appropriation then serves as a basis for the original budget expenditure amounts reported in the budgetary statements for all funds. State statute permits a temporary appropriation to be effective until no later than October 1 of each year. Resolution appropriations by fund must be within the estimated resources as certified by the County Budget Commission and the total of expenditures and encumbrances may not exceed the appropriation totals.
5. Any revisions that alter the total of any fund appropriations must be approved by the
Board of Education. 6. Formal budgetary integration is employed as a management control device during
the year for all funds consistent with the general obligation bond indenture and other statutory provisions. All funds completed the year within the amount of their legally authorized appropriation.
7. Appropriation amounts are as originally adopted, or as amended by the Board of
Education through the year by supplemental appropriations which either reallocated, decreased or increased the originally appropriated amounts. All supplemental appropriations were legally adopted by the Board during fiscal 2012.
8. Unencumbered appropriations lapse at year-end. Encumbered appropriations are
carried forward to the succeeding fiscal year and need not be reappropriated.

WESTERVILLE CITY SCHOOL DISTRICT, OHIO
Notes to Basic Financial Statements, Continued For the Fiscal Year Ended June 30, 2012
41
Expenditures plus encumbrances may not legally exceed budgeted appropriations at the fund level for all funds.
Encumbrance accounting, under which purchase orders, contracts, and other commitments for the expenditure of funds are recorded in order to reserve that portion of the applicable appropriation, is employed in governmental funds.
9. The District prepares its budget on a basis of accounting that differs from GAAP. The actual results of operations are presented in the Statement of Revenues, Expenditures, and Changes in Fund Balances—Budget and Actual—General Fund in accordance with the budget basis of accounting. The major differences between the budgetary basis of accounting and GAAP are outlined.
Budget Basis GAAP Basis
Revenues are recorded when received in cash when susceptible to accrual
Expenditures are recorded when paid in cash when the liability is incurred
Encumbrances are recorded as the equivalent of an expenditure as a reservation of the fund balance
(e) Cash and Cash Equivalents
To improve cash management, cash received by the District is pooled. Monies for all funds are maintained in this pool. Individual fund integrity is maintained through the District records. Each fund’s interest in the pool is presented as “Equity in Pooled Cash and Investments”. Except for nonparticipating investment contracts, investments are reported at fair value which is based on quoted market rates. Nonparticipating investment contracts such as repurchase agreements and nonnegotiable certificates of deposit are reported at cost. STAR Ohio is an investment pool managed by the State Treasurer’s Office, which allows governments within the State to pool their funds for investment purposes. STAR Ohio is not registered with the Securities Exchange Commission as an investment company, but does operate in a manner similar to Rule 2a7 of the Investment Company Act of 1940. Investments in STAR Ohio are valued at STAR Ohio’s share price, which is the price the investment could be sold for on June 30, 2012. Interim deposits are used by the District to purchase legal investments. The Ohio Revised Code authorizes the District to invest in United States and State of Ohio bonds, notes and other obligations: bank certificates of deposits; banker’s acceptances; commercial paper notes rated prime and issued by United States corporations and STAR Ohio. During fiscal year 2012, investments were limited to STAR Ohio and repurchase agreements.
WESTERVILLE CITY SCHOOL DISTRICT, OHIO
Notes to Basic Financial Statements, Continued For the Fiscal Year Ended June 30, 2012
42
Under existing statutes, all investment earnings accrue to the General Fund except earnings specifically related to the Food Service, Worker’s Compensation, Private Purpose Trust and Auxiliary Funds. Interest credited to the General Fund during fiscal year 2012 was $34,940 which includes $16,575 assigned from other funds.
Restricted assets in the debt service fund represent cash equivalents for which use is limited by legal requirements. Restricted assets include matured bonds for which payment has not been requested.
(f) Inventories
On government-wide and fund financial statements, purchased inventories are presented at the lower of cost or market and donated commodities are presented at their entitlement value. Inventories are recorded on a first-in, first-out basis and are expensed when used. Inventories are accounted for using the consumption method which means that the costs of inventory items are recorded as expenditures in the governmental funds when consumed. On the fund financial statements, reported material and supplies inventory is equally offset by nonspendable fund balance in the governmental funds which indicates that it does not constitute available spendable resources even though it is a component of net current assets. Inventory consists of expendable supplies held for consumption, donated food, purchased food and non-food supplies.
(g) Prepaid Assets
Payments made to vendors for services that will benefit periods beyond June 30, 2012 are recorded as prepaid items using the consumption method. A current asset for the prepaid amount is recorded at the time of purchase and an expenditure/expense is recorded in the year in which services are consumed.
(h) Capital Assets and Depreciation General capital assets are those assets not specifically related to activities reported in the proprietary funds. These assets are reported in the government-wide statement of net assets but are not reported in the fund financial statements. All capital assets are capitalized at cost (or estimated historical cost) and updated for the cost of additions and retirements during the year. Donated capital assets are recorded at their fair market values as of the date donated. The District follows the policy of not capitalizing assets with a cost of less than $2,500 and a useful life of less than 2 years. The District does not maintain any infrastructure.

WESTERVILLE CITY SCHOOL DISTRICT, OHIO
Notes to Basic Financial Statements, Continued For the Fiscal Year Ended June 30, 2012
43
All reported capital assets, with the exception of land, are depreciated. Improvements are depreciated over the remaining useful lives of the related capital assets. Depreciation is computed using the straight-line method over the following useful lives: Description Useful Life Land Improvements 20 years Buildings & Improvements 10-50 years Furniture & Equipment 5-15 years Buses & Vehicles 7-10 years
(i) Compensated Absences The District follows GASB Statement No. 16, Accounting for Compensated Absences, which requires that a liability be accrued for sick leave if it is probable that the employee will be compensated through cash payment. Upon retirement, District employees are paid their accumulated balances up to a fixed number of days. This number is determined by negotiated agreements or board policy depending on the employee's classification. The entire compensated absence liability is reported in the government-wide financial statements. For governmental fund financial statements, the amount of accumulated vacation and sick leave of employees has been recorded as a current liability to the extent payments come due each period upon the occurrence of employee resignations or retirements. The balance of the liability is not recorded. For proprietary funds, the entire amount of compensated absences is recorded as an expense and liability of the fund.
(j) Unamortized Issuance Costs/Bond Premium and Discount/Accounting Gain or Loss On government-wide financial statements, issuance costs are deferred and amortized
over the term of the bonds using the straight-line method, which approximates the effective interest method. Unamortized issuance costs are recorded as a separate line item on the statement of net assets.
Bond premiums are deferred and amortized over the term of the bonds using the straight-
line method, which approximates the effective interest method. Bond premiums are presented as an addition to the face amount of the bonds.
For bond refunds resulting in the defeasance of the debt reported in the government-
wide financial statements, the difference between the reacquisition price and the net carrying amount of the old debt is deferred and amortized as a component of interest expense. This accounting gain or loss is amortized over the remaining life of the old debt or the life of the new debt, whichever is shorter, and is presented as an addition to or reduction of the face amount of the new debt.
On the governmental fund financial statements, issuance costs and bond premiums are
recognized in the current period.

WESTERVILLE CITY SCHOOL DISTRICT, OHIO
Notes to Basic Financial Statements, Continued For the Fiscal Year Ended June 30, 2012
44
(k) Accrued Liabilities and Long-Term Debt All accrued liabilities and long-term debt are reported in the entity-wide financial statements as well as the proprietary fund financial statements. For governmental fund financial statements, the accrued liabilities are generally reported as a governmental fund liability if due for payment as of the balance sheet date regardless of whether they will be liquidated with current financial resources. However, claims and judgments and compensated absences paid from governmental funds are reported as a liability in the fund financial statements only for the portion due for payment during the current year. Long-term debt paid from governmental funds is not recognized as a liability in the fund financial statements until due.
(l) Interfund Transactions Exchange transactions between funds are reported as revenues in the seller funds and as expenditures/expenses in the purchaser funds. Flows of cash or goods from one fund to another without requirement for repayment are reported as interfund transfers. Interfund transfers are reported as other financing sources/uses in governmental funds and after nonoperating revenues/expenses in proprietary funds. On fund financial statements, short-term interfund loans are classified as interfund receivables/payables. These amounts are eliminated in the statement of net assets.
(m) Fund Balances Fund balance is divided into five classifications based primarily on the extent to which the District is bound to observe constraints imposed upon the use of the resources in the governmental funds. The classifications are as follows:
Nonspendable - The nonspendable fund balance classification includes amounts that cannot be spent because they are not in spendable form or legally required to be maintained intact. The “not in spendable form” criterion includes items that are not expected to be converted to cash. It also includes the long-term amount of loans receivable. Restricted - Fund balance is reported as restricted when constraints are placed on the use of resources that are either externally imposed by creditors (such as through debt covenants), grantors, contributors, or laws or regulations of other governments, or imposed by law through constitutional provisions or enabling legislation.
WESTERVILLE CITY SCHOOL DISTRICT, OHIO
Notes to Basic Financial Statements, Continued For the Fiscal Year Ended June 30, 2012
45
Committed - The committed fund balance classification includes amounts that can be used only for the specific purposes imposed by a formal action (resolution) of the District Board of Education (the highest level of decision making authority). Those committed amounts cannot be used for any other purpose unless the District Board of Education removes or changes the specified use by taking the same type of action (resolution) it employed to previously commit those amounts. Committed fund balance also incorporates contractual obligations to the extent that existing resources in the fund have been specifically committed for use in satisfying those contractual requirements. Assigned - Amounts in the assigned fund balance classification are intended to be used by the District for specific purposes but do not meet the criteria to be classified as restricted nor committed. In governmental funds other than the general fund, assigned fund balance represents the remaining amount that is not restricted or committed. In the general fund, assigned amounts represent intended uses established by policies of the District Board of Education, which includes giving the Treasurer the authority to constrain monies for intended purposes. Unassigned - Unassigned fund balance is the residual classification for the general fund and includes all spendable amounts not contained in the other classifications. In other governmental funds, the unassigned classification is only used to report a deficit fund balance resulting from overspending for specific purposes for which amounts had been restricted, committed, or assigned.
The District applies restricted resources first when expenditures are incurred for purposes for which restricted and unrestricted (committed, assigned, and unassigned) fund balance is available. Similarly, within unrestricted fund balance, committed amounts are reduced first followed by assigned, and then unassigned amounts when expenditures are incurred for purposes for which amounts in any of the unrestricted fund balance classifications could be used.
(n) Net Assets Net assets represent the difference between assets and liabilities. Net assets invested in capital assets, net of related debt consists of capital assets, net of accumulated depreciation, reduced by the outstanding balance of any borrowing used for the acquisition, construction, or improvement of those assets. Net assets are reported as restricted when there are limitations imposed on their use either through the enabling legislation adopted by the District or through external restrictions imposed by creditors, grantors, or laws or regulations of other governments.
(o) Statement of Cash Flows For purposes of the statement of cash flows, the proprietary funds consider all highly liquid investments, with a maturity of three months or less when purchased, to be cash equivalents. In addition, all cash and investments of the pool are also considered to be cash equivalents, since they are available to the proprietary funds on demand.
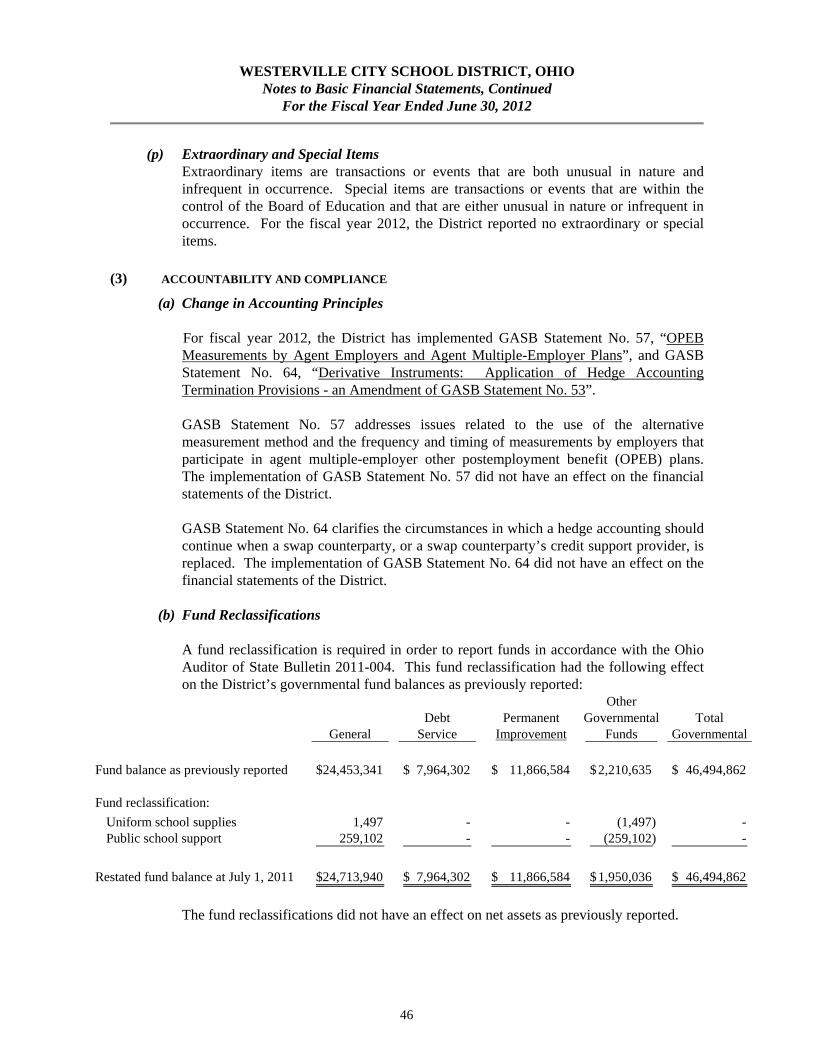
WESTERVILLE CITY SCHOOL DISTRICT, OHIO
Notes to Basic Financial Statements, Continued For the Fiscal Year Ended June 30, 2012
46
(p) Extraordinary and Special Items Extraordinary items are transactions or events that are both unusual in nature and infrequent in occurrence. Special items are transactions or events that are within the control of the Board of Education and that are either unusual in nature or infrequent in occurrence. For the fiscal year 2012, the District reported no extraordinary or special items.
(3) ACCOUNTABILITY AND COMPLIANCE
(a) Change in Accounting Principles
For fiscal year 2012, the District has implemented GASB Statement No. 57, “OPEB Measurements by Agent Employers and Agent Multiple-Employer Plans”, and GASB Statement No. 64, “Derivative Instruments: Application of Hedge Accounting Termination Provisions - an Amendment of GASB Statement No. 53”. GASB Statement No. 57 addresses issues related to the use of the alternative measurement method and the frequency and timing of measurements by employers that participate in agent multiple-employer other postemployment benefit (OPEB) plans. The implementation of GASB Statement No. 57 did not have an effect on the financial statements of the District. GASB Statement No. 64 clarifies the circumstances in which a hedge accounting should continue when a swap counterparty, or a swap counterparty’s credit support provider, is replaced. The implementation of GASB Statement No. 64 did not have an effect on the financial statements of the District.
(b) Fund Reclassifications A fund reclassification is required in order to report funds in accordance with the Ohio
Auditor of State Bulletin 2011-004. This fund reclassification had the following effect on the District’s governmental fund balances as previously reported:
OtherDebt Permanent Governmental Total
General Service Improvement Funds Governmental
Fund balance as previously reported 24,453,341$ 7,964,302$ 11,866,584$ 2,210,635$ 46,494,862$
Fund reclassification:
Uniform school supplies 1,497 - - (1,497) - Public school support 259,102 - - (259,102) -
Restated fund balance at July 1, 2011 24,713,940$ 7,964,302$ 11,866,584$ 1,950,036$ 46,494,862$
The fund reclassifications did not have an effect on net assets as previously reported.

WESTERVILLE CITY SCHOOL DISTRICT, OHIO
Notes to Basic Financial Statements, Continued For the Fiscal Year Ended June 30, 2012
47
(c) Deficit Fund Balance
Fund balances at June 30, 2012 included the following individual fund deficit: Nonmajor fund Deficit Miscellaneous State Grants $1,119 The general fund is liable for any deficits in this fund and provides transfers when cash is required, not when accruals occur. The deficit fund balance resulted from adjustments for accrued liabilities.
(4) DEPOSITS AND INVESTMENTS
State statutes classify monies held by the District into three categories.
Active deposits are public deposits necessary to meet current demands on the treasury. Such monies must be maintained either as cash in the District treasury, in commercial accounts payable or withdrawable on demand, including negotiable order of withdrawal (NOW) accounts, or in money market deposit accounts. Inactive deposits are public deposits that the Board of Education has identified as not required for use within the current five year period of designation of depositories. Inactive deposits must either be evidenced by certificates of deposit maturing not later than the end of the current period of designation of depositories, or by savings or deposit accounts including, but not limited to, passbook accounts.
Interim deposits are deposits of interim monies. Interim monies are those monies which are not needed for immediate use, but which will be needed before the end of the current period of designation of depositories. Interim deposits must be evidenced by time certificates of deposit maturing not more than one year from the date of deposit or by savings or deposit accounts including passbook accounts.
Interim monies may be deposited or invested in the following securities:
1. United States Treasury Notes, Bills, Bonds, or any other obligation or security issued by
the United States Treasury or any other obligation guaranteed as to principal and interest by the United States;
2. Bonds, notes, debentures, or any other obligations or securities issued by any federal
government agency or instrumentality, including, but not limited to, the Federal National Mortgage Association, Federal Home Loan Bank, Federal Farm Credit Bank, Federal Home Loan Mortgage Corporation, Government National Mortgage Association, and Student Loan Marketing Association. All federal agency securities shall be direct issuances of federal government agencies or instrumentalities;

WESTERVILLE CITY SCHOOL DISTRICT, OHIO
Notes to Basic Financial Statements, Continued For the Fiscal Year Ended June 30, 2012
48
3. Written repurchase agreements in the securities listed above provided that the market
value of the securities subject to the repurchase agreement must exceed the principal value of the agreement by at least two percent and be marked to market daily, and that the term of the agreement must not exceed thirty days;
4. Bonds and other obligations of the State of Ohio; 5. No-load money market mutual funds consisting exclusively of obligations described in
items (1) and (2) above and repurchase agreements secured by such obligations, provided that investments in securities described in this division are made only through eligible institutions;
6. The State Treasurer's investment pool (STAR Ohio); 7. Certain banker’s acceptance and commercial paper notes for a period not to exceed one
hundred eighty days from the purchase date in an amount not to exceed twenty-five percent of the interim monies available for investment at any one time; and,
8. Under limited circumstances, corporate debt interests rated in either of the two highest
classifications by at least two nationally recognized rating agencies. Protection of the District's deposits is provided by the Federal Deposit Insurance Corporation (FDIC), by eligible securities pledged by the financial institution as security for repayment, by surety company bonds deposited with the Treasurer by the financial institution or by a single collateral pool established by the financial institution to secure the repayment of all public monies deposited with the institution.
Investments in stripped principal or interest obligations reverse repurchase agreements and derivatives are prohibited. The issuance of taxable notes for the purpose of arbitrage, the use of leverage and short selling are also prohibited. An investment must mature within five years from the date of purchase unless matched to a specific obligation or debt of the District, and must be purchased with the expectation that it will be held to maturity. Investments may only be made through specified dealers and institutions. Payment for investments may be made only upon delivery of the securities representing the investments to the Treasurer or, if the securities are not represented by a certificate, upon receipt of confirmation of transfer from the custodian. (a) Deposits with Financial Institutions At June 30, 2012, the carrying amount of all District deposits was $3,800,119 exclusive
of the $20,833,556 in repurchase agreements included below. Based on the criteria described in GASB Statement No. 40, “Deposits and Investment Risk Disclosures”, as of June 30, 2012, $3,750,000 of the District’s bank balance of $4,000,000 was exposed to custodial risk as discussed below, while $250,000 was covered by the FDIC.

WESTERVILLE CITY SCHOOL DISTRICT, OHIO
Notes to Basic Financial Statements, Continued For the Fiscal Year Ended June 30, 2012
49
Custodial credit risk is the risk that, in the event of bank failure, the District’s deposits may not be returned. All deposits are collateralized with eligible securities in amounts equal to at least 105% of the carrying value of the deposits. Such collateral, as permitted by the Ohio Revised Code, is held in single financial institution collateral pools at Federal Reserve Banks, or at member banks of the federal reserve system, in the name of the respective depository bank and pledged as a pool of collateral against all of the public deposits it holds or as specific collateral held at the Federal Reserve Bank in the name of the District. The District has no deposit policy for custodial credit risk beyond the requirements of State statute. Although the securities were held by the pledging institutions’ trust department and all statutory requirements for the deposit of money had been followed, noncompliance with federal requirements could potentially subject the District to a successful claim by the FDIC.
(b) Investments As of June 30, 2012, the District had the following investments and maturities:
InvestmentMaturity6 Months
Investment Type Fair Value or LessSTAR Ohio 1,741,656$ 1,741,656$ Repurchase agreement 20,833,556 20,833,556
Total 22,575,212$ 22,575,212$
Interest Rate Risk: As a means of limiting its exposure to fair value losses arising from rising interest rates and according to State law, the District’s investment policy limits investment portfolio maturities to five years or less. Credit Risk: The federal agency securities that underlie the District’s repurchase agreement were rated AA+ and Aaa by Standard & Poor’s and Moody’s Investor Services, respectively. Standard & Poor’s has assigned STAR Ohio an AAAm money market rating. Ohio law requires that STAR Ohio maintain the highest rating provided by at least one nationally recognized standard rating service. The District’s investment policy does not specifically address credit risk beyond requiring the District to only invest in securities authorized by State statute.
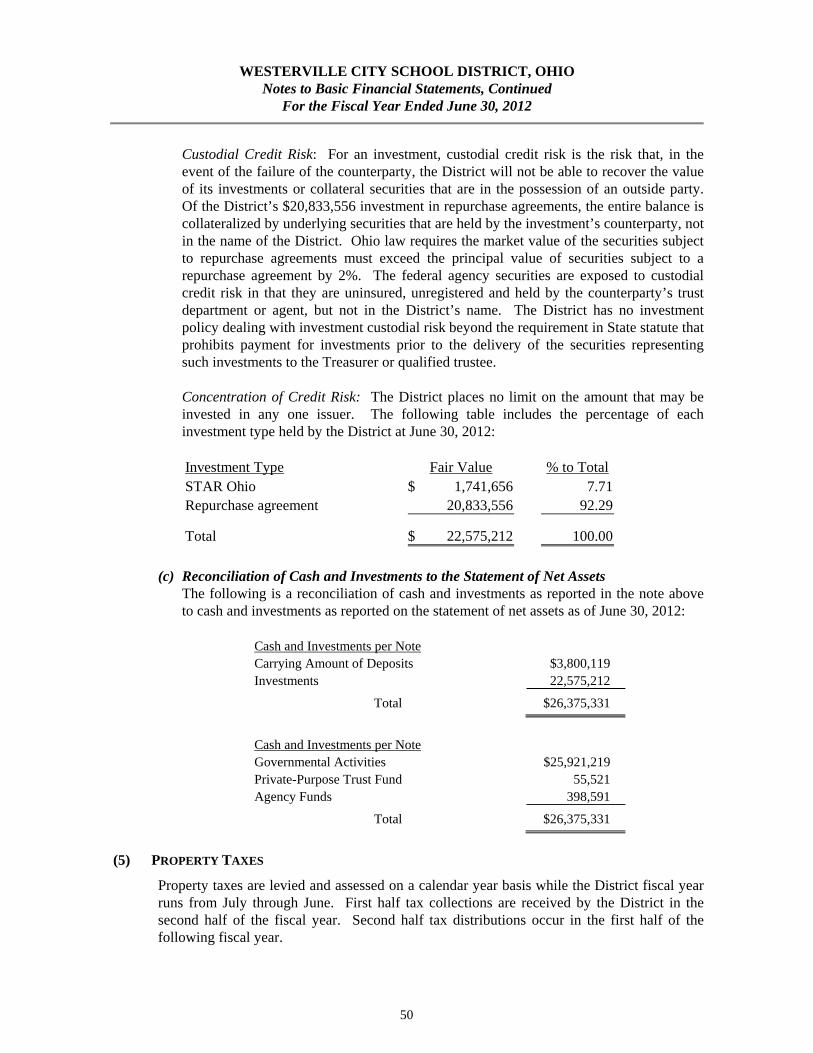
WESTERVILLE CITY SCHOOL DISTRICT, OHIO
Notes to Basic Financial Statements, Continued For the Fiscal Year Ended June 30, 2012
50
Custodial Credit Risk: For an investment, custodial credit risk is the risk that, in the event of the failure of the counterparty, the District will not be able to recover the value of its investments or collateral securities that are in the possession of an outside party. Of the District’s $20,833,556 investment in repurchase agreements, the entire balance is collateralized by underlying securities that are held by the investment’s counterparty, not in the name of the District. Ohio law requires the market value of the securities subject to repurchase agreements must exceed the principal value of securities subject to a repurchase agreement by 2%. The federal agency securities are exposed to custodial credit risk in that they are uninsured, unregistered and held by the counterparty’s trust department or agent, but not in the District’s name. The District has no investment policy dealing with investment custodial risk beyond the requirement in State statute that prohibits payment for investments prior to the delivery of the securities representing such investments to the Treasurer or qualified trustee. Concentration of Credit Risk: The District places no limit on the amount that may be invested in any one issuer. The following table includes the percentage of each investment type held by the District at June 30, 2012: Investment Type Fair Value % to TotalSTAR Ohio 1,741,656$ 7.71 Repurchase agreement 20,833,556 92.29
Total 22,575,212$ 100.00
(c) Reconciliation of Cash and Investments to the Statement of Net Assets
The following is a reconciliation of cash and investments as reported in the note above to cash and investments as reported on the statement of net assets as of June 30, 2012:
Cash and Investments per Note Carrying Amount of Deposits $3,800,119 Investments 22,575,212
Total $26,375,331
Cash and Investments per Note Governmental Activities $25,921,219 Private-Purpose Trust Fund 55,521 Agency Funds 398,591
Total $26,375,331
(5) PROPERTY TAXES
Property taxes are levied and assessed on a calendar year basis while the District fiscal year runs from July through June. First half tax collections are received by the District in the second half of the fiscal year. Second half tax distributions occur in the first half of the following fiscal year.

WESTERVILLE CITY SCHOOL DISTRICT, OHIO
Notes to Basic Financial Statements, Continued For the Fiscal Year Ended June 30, 2012
51
Property taxes include amounts levied against all real property and public utility property. Real property tax revenues received in calendar year 2012 represent the collection of calendar year 2011 taxes. Real property taxes received in calendar year 2012 were levied after April 1, 2011, on the assessed values as of January 1, 2011, the lien date. Assessed values for real property taxes are established by State statute at 35 percent of appraised market value. Real property taxes are payable annually or semiannually. If paid annually, payment is due December 31; if paid semiannually, the first payment is due December 31, with the remainder payable by June 20. Under certain circumstances, State statute permits alternate payment dates to be established. Public utility property tax revenues received in calendar year 2012 represent the collection of calendar year 2011 taxes. Public utility real and personal property taxes received in calendar year 2012 became a lien on December 31, 2010, were levied after April 1, 2011, and are collected with real property taxes. Public utility real property is assessed at 35 percent of true value; public utility tangible personal property is currently assessed at varying percentages of true value. The District receives property taxes from Franklin and Delaware Counties. The County Auditors periodically advance to the District its portion of the taxes collected. Second-half real property tax payments collected by the County by June 30, 2012, are available to finance fiscal year 2012 operations. The amount available as an advance at June 30, 2012 was $30,260,837 in the general fund, $2,565,283 in the debt service fund and $2,541,614 in the permanent improvement fund. This amount is recorded as revenue. The amount available for advance at June 30, 2011 was $13,733,250 in the general fund, $923,776 in the debt service fund and $938,560 in the permanent improvement fund. The amount of second-half real property taxes available for advance at fiscal year-end can vary based on the date the tax bills are sent.
Accrued property taxes receivable includes real property, public utility property and delinquent tangible personal property taxes which are measurable as of June 30, 2012 and for which there is an enforceable legal claim. Although total property tax collections for the next fiscal year are measurable, only the amount of real property taxes available as an advance at June 30 was levied to finance current fiscal year operations and is reported as revenue at fiscal year end. The portion of the receivable not levied to finance current fiscal year operations is offset by a credit to unearned revenue. On the accrual basis of accounting, collectible delinquent property taxes have been recorded as a receivable and revenue, while on a modified accrual basis of accounting the revenue has been deferred.
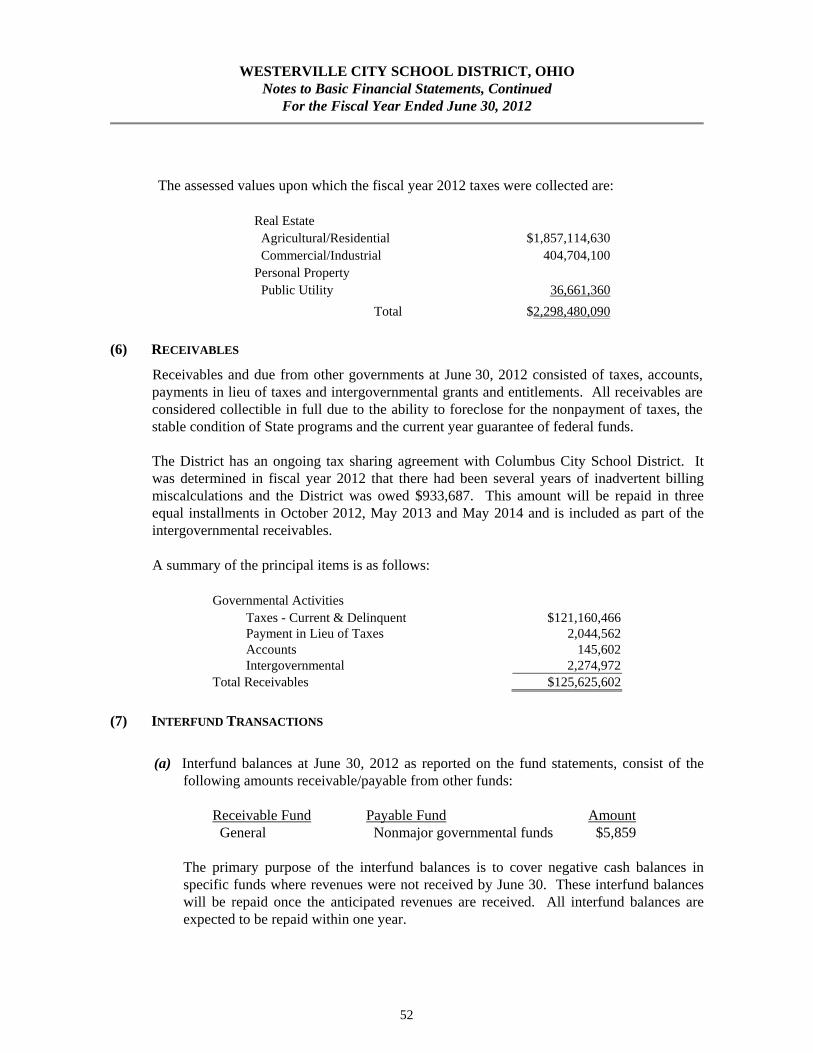
WESTERVILLE CITY SCHOOL DISTRICT, OHIO
Notes to Basic Financial Statements, Continued For the Fiscal Year Ended June 30, 2012
52
The assessed values upon which the fiscal year 2012 taxes were collected are:
Real Estate Agricultural/Residential $1,857,114,630 Commercial/Industrial 404,704,100 Personal Property Public Utility 36,661,360
Total $2,298,480,090
(6) RECEIVABLES
Receivables and due from other governments at June 30, 2012 consisted of taxes, accounts, payments in lieu of taxes and intergovernmental grants and entitlements. All receivables are considered collectible in full due to the ability to foreclose for the nonpayment of taxes, the stable condition of State programs and the current year guarantee of federal funds. The District has an ongoing tax sharing agreement with Columbus City School District. It was determined in fiscal year 2012 that there had been several years of inadvertent billing miscalculations and the District was owed $933,687. This amount will be repaid in three equal installments in October 2012, May 2013 and May 2014 and is included as part of the intergovernmental receivables.
A summary of the principal items is as follows:
Governmental Activities Taxes - Current & Delinquent $121,160,466 Payment in Lieu of Taxes 2,044,562 Accounts 145,602 Intergovernmental 2,274,972 Total Receivables $125,625,602
(7) INTERFUND TRANSACTIONS
(a) Interfund balances at June 30, 2012 as reported on the fund statements, consist of the
following amounts receivable/payable from other funds:
Receivable Fund Payable Fund Amount General Nonmajor governmental funds $5,859
The primary purpose of the interfund balances is to cover negative cash balances in specific funds where revenues were not received by June 30. These interfund balances will be repaid once the anticipated revenues are received. All interfund balances are expected to be repaid within one year.

WESTERVILLE CITY SCHOOL DISTRICT, OHIO
Notes to Basic Financial Statements, Continued For the Fiscal Year Ended June 30, 2012
53
Interfund balances between governmental funds are eliminated on the government-wide financial statements; therefore, no internal balances at June 30, 2012 are reported on the statement of net assets.
(b) Interfund transfers for the fiscal year ended June 30, 2012, consisted of the following, as reported on the fund statements:
Transfers from: Transfer to: Amount Permanent Improvement Debt Service $2,980,338
Transfers are used to move revenues from the fund that statute or budget required to collect them to the fund that statute or budget requires to expend them and to use unrestricted revenues collected in the general fund to finance various programs accounted for in other funds in accordance with budgetary authorizations. Transfers consisted of $2,980,338 from the permanent improvement fund to the debt service fund in order to cover a debt payment. Interfund transfers between governmental funds are eliminated on the government-wide financial statements. All transfers were made in compliance with Ohio Revised Code Sections 5705.14, 5705.15 and 5705.16.
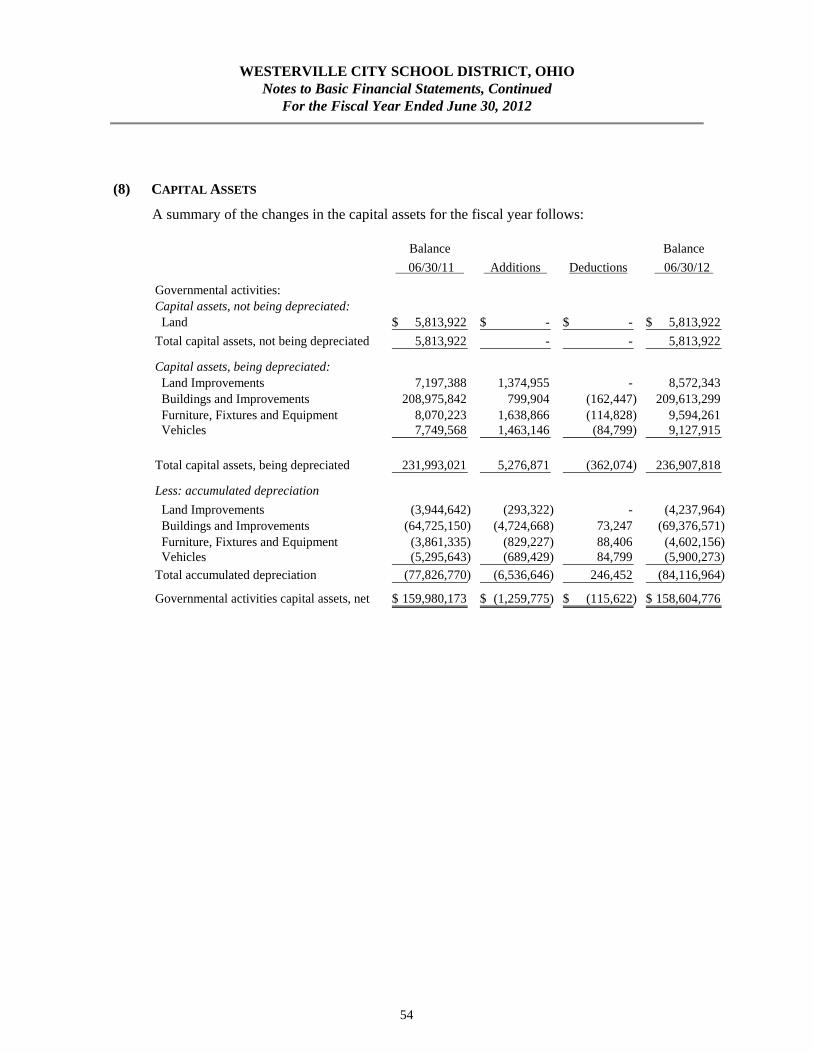
WESTERVILLE CITY SCHOOL DISTRICT, OHIO
Notes to Basic Financial Statements, Continued For the Fiscal Year Ended June 30, 2012
54
(8) CAPITAL ASSETS
A summary of the changes in the capital assets for the fiscal year follows:
Balance Balance
06/30/11 Additions Deductions 06/30/12
Governmental activities:Capital assets, not being depreciated: Land 5,813,922$ -$ -$ 5,813,922$
Total capital assets, not being depreciated 5,813,922 - - 5,813,922
Capital assets, being depreciated: Land Improvements 7,197,388 1,374,955 - 8,572,343 Buildings and Improvements 208,975,842 799,904 (162,447) 209,613,299 Furniture, Fixtures and Equipment 8,070,223 1,638,866 (114,828) 9,594,261 Vehicles 7,749,568 1,463,146 (84,799) 9,127,915
Total capital assets, being depreciated 231,993,021 5,276,871 (362,074) 236,907,818
Less: accumulated depreciation
Land Improvements (3,944,642) (293,322) - (4,237,964) Buildings and Improvements (64,725,150) (4,724,668) 73,247 (69,376,571) Furniture, Fixtures and Equipment (3,861,335) (829,227) 88,406 (4,602,156) Vehicles (5,295,643) (689,429) 84,799 (5,900,273) Total accumulated depreciation (77,826,770) (6,536,646) 246,452 (84,116,964)
Governmental activities capital assets, net 159,980,173$ (1,259,775)$ (115,622)$ 158,604,776$

WESTERVILLE CITY SCHOOL DISTRICT, OHIO
Notes to Basic Financial Statements, Continued For the Fiscal Year Ended June 30, 2012
55
Depreciation expense was charged to governmental functions as follows:
Instruction: Regular $3,317,496 Special 758,077 Vocational 20,391 Other 15,105 Support Services: Pupil 14,658 Staff 4,005 General Administration 771 School Administration 638,174 Fiscal Services 25 Business Services 26,037 Operations & Maintenance 213,012 Student Transportation 683,264 Central Services 569,316 Food Service Operations 45,362 Community Services 3,786 Extracurricular Activities 227,167 Total Depreciation Expense $6,536,646
(9) LONG-TERM OBLIGATIONS
All current obligation bonds outstanding were issued to provide funds for the acquisition and construction of equipment and facilities. The tax anticipation notes are related to various long-term capital projects and are accounted for as long-term obligations. All bonds and notes are general obligations of the District for which the full faith and credit of the District is pledged for repayment. Payments of principal and interest relating to these liabilities are recorded as expenditures in the Debt Service Fund. Long-term obligations currently outstanding are reported as follows:
Purpose
Date
Issued
Interest
Rate
Final
Maturity
Original
Amount
Balance at
June 30, 2012
Advance Bond Refunding (1) 04/07/04 3.72% 12/01/22 $49,970,687 $41,517,554
Advance Bond Refunding (2) 12/14/06 4.13% 12/01/27 48,365,000 45,741,786
Tax Anticipation Notes (3) 3/23/10 2.82% 12/01/20 24,415,000 23,428,908
$110,688,248
(1) Refunded portions of bonds previously issued on 9/15/95, 8/01/96 and 3/15/01.
(2) Refunded portions of bonds previously issued on 3/15/01.
(3) Notes issued in anticipation of the collection of proceeds of the 3.95 mill permanent improvement levy
approved by the electors of the school district at the election held May 5, 2009. Proceeds to be used for the
acquisition and construction of various long-term permanent improvements projects.

WESTERVILLE CITY SCHOOL DISTRICT, OHIO
Notes to Basic Financial Statements, Continued For the Fiscal Year Ended June 30, 2012
56
The following is a summary of the District's future annual debt service requirements to maturity for general obligation bonds and notes (principal amount does not include unamortized premium on note/bond issuance of $7,323,020, and deferred charges of $5,529,772:
Year ending June 30, Interest rates Principal Interest
2013 2.0 - 6.25 $6,615,000 $4,716,255 2014 2.0 - 6.25 6,875,000 4,448,668 2015 2.25 - 6.25 7,155,000 4,166,093 2016 3.0 - 6.25 7,435,000 3,853,300 2017 3.7 - 6.25 7,775,000 3,511,582 2018-2022 3.7 - 6.25 39,460,000 11,918,147 2023-2027 3.7 - 6.25 27,560,000 4,826,413 2028 3.7 - 6.25 6,020,000 150,500
Total $108,895,000 $37,590,958
The ORC provides that voted net general obligation debt of the District shall never exceed 9% of the total assessed valuation of the District. The ORC further provides that unvoted indebtedness shall not exceed 1/10 of 1% of the property valuation of the District.
The total voted and non-voted non-exempt debt of the District that could be issued subject to the 9% limitation described above is $215,310,637. The total District debt (including the Notes) subject to this limitation is $108,895,000. The total District unvoted debt that could be issued subject to the 1/10 of 1% limitation is $2,298,480. The District has no debt subject to such limitation, leaving $2,298,480 available for unvoted debt. Including the balance in the Debt Service Fund at June 30, 2012, the effects of these debt limitations at June 30, 2012 are a voted debt margin of $106,415,637 and an unvoted debt margin of $2,298,480. The aggregate amount of the District's unvoted debt is also subject to overlapping debt restrictions with the Westerville Public Library (the Library). As of June 30, 2012, the District and the Library have complied with the requirement that unvoted overlapping debt must not exceed 1% (10 mills) of the assessed property value.
In the opinion of management, the District has complied with all bond covenants.
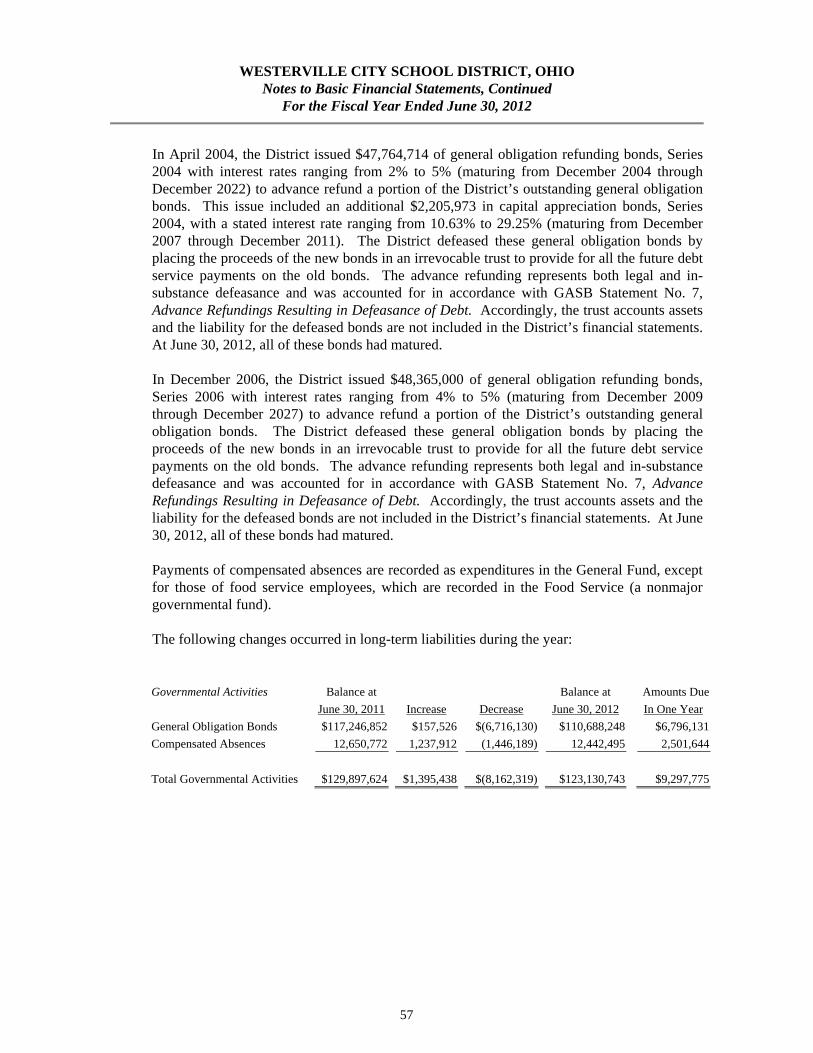
WESTERVILLE CITY SCHOOL DISTRICT, OHIO
Notes to Basic Financial Statements, Continued For the Fiscal Year Ended June 30, 2012
57
In April 2004, the District issued $47,764,714 of general obligation refunding bonds, Series 2004 with interest rates ranging from 2% to 5% (maturing from December 2004 through December 2022) to advance refund a portion of the District’s outstanding general obligation bonds. This issue included an additional $2,205,973 in capital appreciation bonds, Series 2004, with a stated interest rate ranging from 10.63% to 29.25% (maturing from December 2007 through December 2011). The District defeased these general obligation bonds by placing the proceeds of the new bonds in an irrevocable trust to provide for all the future debt service payments on the old bonds. The advance refunding represents both legal and in-substance defeasance and was accounted for in accordance with GASB Statement No. 7, Advance Refundings Resulting in Defeasance of Debt. Accordingly, the trust accounts assets and the liability for the defeased bonds are not included in the District’s financial statements. At June 30, 2012, all of these bonds had matured. In December 2006, the District issued $48,365,000 of general obligation refunding bonds, Series 2006 with interest rates ranging from 4% to 5% (maturing from December 2009 through December 2027) to advance refund a portion of the District’s outstanding general obligation bonds. The District defeased these general obligation bonds by placing the proceeds of the new bonds in an irrevocable trust to provide for all the future debt service payments on the old bonds. The advance refunding represents both legal and in-substance defeasance and was accounted for in accordance with GASB Statement No. 7, Advance Refundings Resulting in Defeasance of Debt. Accordingly, the trust accounts assets and the liability for the defeased bonds are not included in the District’s financial statements. At June 30, 2012, all of these bonds had matured. Payments of compensated absences are recorded as expenditures in the General Fund, except for those of food service employees, which are recorded in the Food Service (a nonmajor governmental fund). The following changes occurred in long-term liabilities during the year:
Governmental Activities
Balance at
June 30, 2011
Increase
Decrease
Balance at
June 30, 2012
Amounts Due
In One Year
General Obligation Bonds $117,246,852 $157,526 $(6,716,130) $110,688,248 $6,796,131
Compensated Absences 12,650,772 1,237,912 (1,446,189) 12,442,495 2,501,644
Total Governmental Activities $129,897,624 $1,395,438 $(8,162,319) $123,130,743 $9,297,775
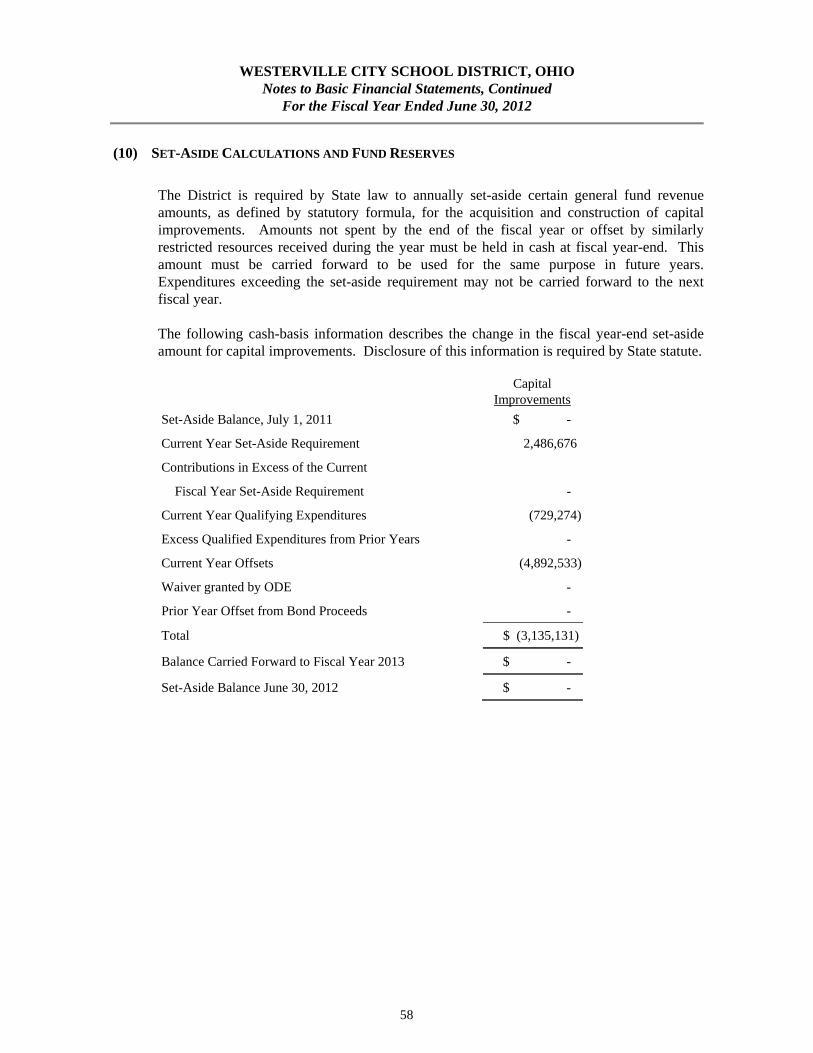
WESTERVILLE CITY SCHOOL DISTRICT, OHIO
Notes to Basic Financial Statements, Continued For the Fiscal Year Ended June 30, 2012
58
(10) SET-ASIDE CALCULATIONS AND FUND RESERVES
The District is required by State law to annually set-aside certain general fund revenue amounts, as defined by statutory formula, for the acquisition and construction of capital improvements. Amounts not spent by the end of the fiscal year or offset by similarly restricted resources received during the year must be held in cash at fiscal year-end. This amount must be carried forward to be used for the same purpose in future years. Expenditures exceeding the set-aside requirement may not be carried forward to the next fiscal year. The following cash-basis information describes the change in the fiscal year-end set-aside amount for capital improvements. Disclosure of this information is required by State statute.
Capital
Improvements
Set-Aside Balance, July 1, 2011 $ -
Current Year Set-Aside Requirement 2,486,676
Contributions in Excess of the Current
Fiscal Year Set-Aside Requirement -
Current Year Qualifying Expenditures (729,274)
Excess Qualified Expenditures from Prior Years -
Current Year Offsets (4,892,533)
Waiver granted by ODE -
Prior Year Offset from Bond Proceeds -
Total $ (3,135,131)
Balance Carried Forward to Fiscal Year 2013 $ -
Set-Aside Balance June 30, 2012 $ -
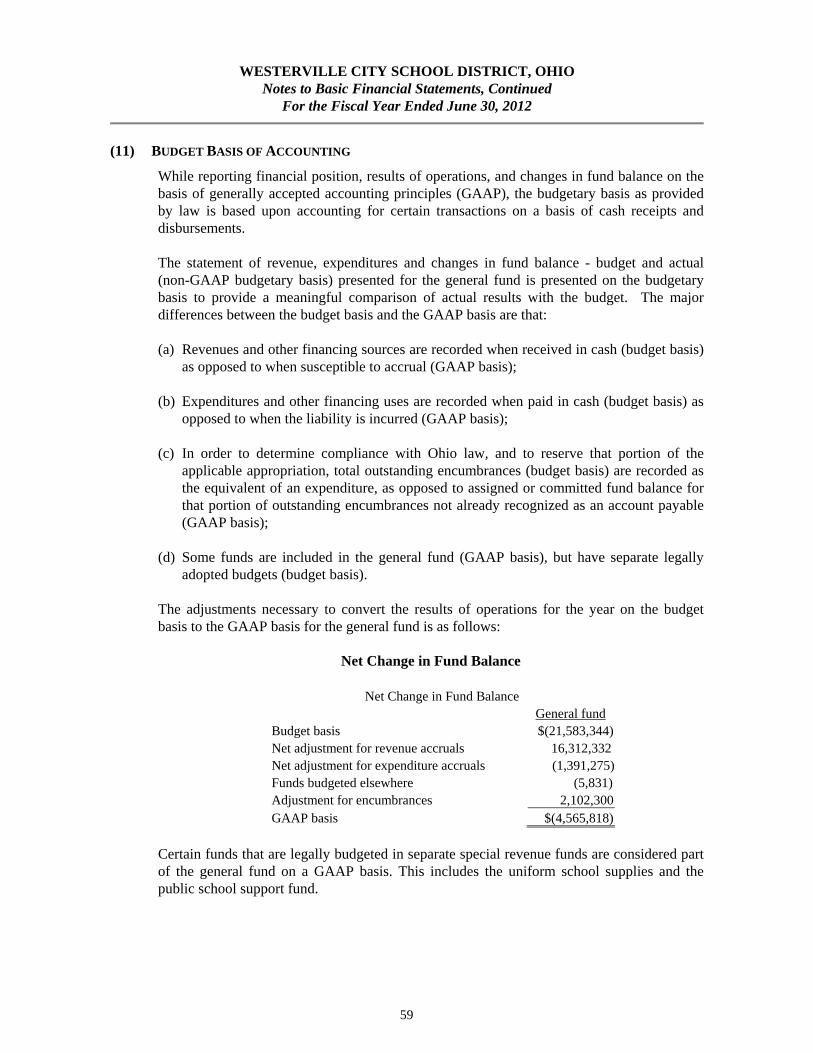
WESTERVILLE CITY SCHOOL DISTRICT, OHIO
Notes to Basic Financial Statements, Continued For the Fiscal Year Ended June 30, 2012
59
(11) BUDGET BASIS OF ACCOUNTING
While reporting financial position, results of operations, and changes in fund balance on the basis of generally accepted accounting principles (GAAP), the budgetary basis as provided by law is based upon accounting for certain transactions on a basis of cash receipts and disbursements. The statement of revenue, expenditures and changes in fund balance - budget and actual (non-GAAP budgetary basis) presented for the general fund is presented on the budgetary basis to provide a meaningful comparison of actual results with the budget. The major differences between the budget basis and the GAAP basis are that: (a) Revenues and other financing sources are recorded when received in cash (budget basis)
as opposed to when susceptible to accrual (GAAP basis); (b) Expenditures and other financing uses are recorded when paid in cash (budget basis) as
opposed to when the liability is incurred (GAAP basis); (c) In order to determine compliance with Ohio law, and to reserve that portion of the
applicable appropriation, total outstanding encumbrances (budget basis) are recorded as the equivalent of an expenditure, as opposed to assigned or committed fund balance for that portion of outstanding encumbrances not already recognized as an account payable (GAAP basis);
(d) Some funds are included in the general fund (GAAP basis), but have separate legally adopted budgets (budget basis).
The adjustments necessary to convert the results of operations for the year on the budget basis to the GAAP basis for the general fund is as follows:
Net Change in Fund Balance
Net Change in Fund Balance General fund Budget basis $(21,583,344) Net adjustment for revenue accruals 16,312,332 Net adjustment for expenditure accruals (1,391,275) Funds budgeted elsewhere (5,831) Adjustment for encumbrances 2,102,300 GAAP basis $(4,565,818)
Certain funds that are legally budgeted in separate special revenue funds are considered part of the general fund on a GAAP basis. This includes the uniform school supplies and the public school support fund.

WESTERVILLE CITY SCHOOL DISTRICT, OHIO
Notes to Basic Financial Statements, Continued For the Fiscal Year Ended June 30, 2012
60
(12) EMPLOYEE RETIREMENT SYSTEMS
(a) School Employees Retirement System
Plan Description - The District contributes to the School Employees Retirement System (SERS), a cost-sharing, multiple-employer defined benefit pension plan. SERS provides retirement, disability, survivor benefits, annual cost-of-living adjustments, and death benefits to plan members and beneficiaries. Authority to establish and amend benefits is provided by Chapter 3309 of the Ohio Revised Code. SERS issues a publicly available, stand-alone financial report that includes financial statements and required supplementary information. That report may be obtained by writing to the School Employees Retirement System, 300 East Broad Street, Suite 100, Columbus, Ohio 43215-3746. It is also posted on the SERS’ Ohio website, www.ohsers.org, under “Employers/Audit Resources”.
Funding Policy - Plan members are required to contribute 10 percent of their annual covered salary and the District is required to contribute at an actuarially determined rate. The current District rate is 14 percent of annual covered payroll. A portion of the District’s contribution is used to fund pension obligations with the remainder being used to fund health care benefits. For fiscal year 2012, 12.65 percent and 0.05 percent of annual covered salary was the portion used to fund pension obligations and death benefits, respectively. The contribution requirements of plan members and employers are established and may be amended by the SERS’ Retirement Board up to a statutory maximum amount of 10 percent for plan members and 14 percent for employers. Chapter 3309 of the Ohio Revised Code provides statutory authority for member and employer contributions. The District’s required contributions for pension obligations and death benefits to SERS for the fiscal years ended June 30, 2012, 2011 and 2010 were $2,323,325, $2,255,906 and $2,348,656, respectively; 71.33 percent has been contributed for fiscal year 2012 and 100 percent for fiscal years 2011 and 2010.
(b) State Teachers Retirement System of Ohio Plan Description - The District participates in the State Teachers Retirement System of Ohio (STRS Ohio), a cost-sharing, multiple-employer public employee retirement plan. STRS Ohio provides retirement and disability benefits to members and death and survivor benefits to beneficiaries. STRS Ohio issues a stand-alone financial report that may be obtained by writing to STRS Ohio, 275 E. Broad St., Columbus, OH 43215-3771, by calling (888) 227-7877, or by visiting the STRS Ohio website at www.strsoh.org, under “Publications”.
\
WESTERVILLE CITY SCHOOL DISTRICT, OHIO
Notes to Basic Financial Statements, Continued For the Fiscal Year Ended June 30, 2012
61
New members have a choice of three retirement plans, a Defined Benefit (DB) Plan, a Defined Contribution (DC) Plan and a Combined Plan. The DB plan offers an annual retirement allowance based on final average salary times a percentage that varies based on years of service, or an allowance based on a member’s lifetime contributions and earned interest matched by STRS Ohio funds divided by an actuarially determined annuity factor. The DC Plan allows members to place all their member contributions and employer contributions equal to 10.5 percent of earned compensation into an investment account. Investment decisions are made by the member. A member is eligible to receive a retirement benefit at age 50 and termination of employment. The member may elect to receive a lifetime monthly annuity or a lump sum withdrawal. The Combined Plan offers features of both the DC Plan and the DB Plan. In the Combined Plan, member contributions are invested by the member, and employer contributions are used to fund the defined benefit payment at a reduced level from the regular DB Plan. The DB portion of the Combined Plan payment is payable to a member on or after age 60; the DC portion of the account may be taken as a lump sum or converted to a lifetime monthly annuity at age 50. Benefits are established by Chapter 3307 of the Ohio Revised Code.
A DB or Combined Plan member with five or more years credited service who becomes disabled may qualify for a disability benefit. Eligible spouses and dependents of these active members who die before retirement may qualify for survivor benefits. Members in the DC Plan who become disabled are entitled only to their account balance. If a member of the DC Plan dies before retirement benefits begin, the member’s designated beneficiary is entitled to receive the member’s account balance. Funding Policy - For fiscal year 2012, plan members were required to contribute 10 percent of their annual covered salaries. The District was required to contribute 14 percent; 13 percent was the portion used to fund pension obligations. Contribution rates are established by the State Teachers Retirement Board, upon recommendations of its consulting actuary, not to exceed statutory maximum rates of 10 percent for members and 14 percent for employers. Chapter 3307 of the Ohio Revised Code provides statutory authority for member and employer contributions.
The District’s required contributions for pension obligations to STRS Ohio for the fiscal years ended June 30, 2012, 2011 and 2010 were $9,878,070, $10,061,429 and $9,476,887, respectively; 81.13 percent has been contributed for fiscal year 2012 and 100 percent for fiscal years 2011 and 2010. Contributions to the DC and Combined Plans for fiscal year 2012 were $465,406 made by the District and $332,433 made by the plan members.
(c) Social Security System
Effective July 1, 1991, all employees not otherwise covered by the SERS/STRS Ohio have an option to choose Social Security or the SERS/STRS Ohio. As of June 30, 2012, certain members of the Board of Education have elected Social Security. The District’s liability is 6.2 percent of wages paid.

WESTERVILLE CITY SCHOOL DISTRICT, OHIO
Notes to Basic Financial Statements, Continued For the Fiscal Year Ended June 30, 2012
62
(13) POSTEMPLOYMENT BENEFITS
(a) School Employees Retirement System Plan Description - The District participates in two cost-sharing, multiple employer postemployment benefit plans administered by the School Employees Retirement System (SERS) for non-certificated retirees and their beneficiaries, a Health Care Plan and a Medicare Part B Plan. The Health Care Plan includes hospitalization and physicians' fees through several types of plans including HMO’s, PPO’s, Medicare Advantage, and traditional indemnity plans. A prescription drug program is also available to those who elect health coverage. SERS employs two third-party administrators and a pharmacy benefit manager to manage the self-insurance and prescription drug plans, respectively. The Medicare Part B Plan reimburses Medicare Part B premiums paid by eligible retirees and beneficiaries as set forth in Section 3309.69 of the Ohio Revised Code. Qualified benefit recipients who pay Medicare Part B premiums may apply for and receive a monthly reimbursement from SERS. The reimbursement amount is limited by statute to the lesser of the January 1, 1999 Medicare Part B premium or the current premium. The Medicare Part B premium for calendar year 2011 (latest information available) was $96.40 for most participants, but could be as high as $369.10 per month depending on their income and the SERS’ reimbursement to retirees was $45.50. Benefit provisions and the obligations to contribute are established by the System based on authority granted by State statute. The financial reports of both Plans are included in the SERS Comprehensive Annual Financial Report which is available by contacting SERS at 300 East Broad St., Suite 100, Columbus, Ohio 43215-3746. It is also posted on the SERS’ Ohio website, www.ohsers.org, under “Employers/Audit Resources”. Funding Policy - State statute permits SERS to fund the health care benefits through employer contributions. Each year, after the allocation for statutorily required benefits, the Retirement Board allocates the remainder of the employer contribution of 14 percent of covered payroll to the Health Care Fund. The Health Care Fund was established and is administered in accordance with Internal Revenue Code Section 105(e). For 2012, 0.55 percent of covered payroll was allocated to health care. An additional health care surcharge on employers is collected for employees earning less than an actuarially determined minimum compensation amount, pro-rated according to service credit earned. Statutes provide that no employer shall pay a health care surcharge greater than 2.0 percent of that employer’s SERS-covered payroll; nor may SERS collect in aggregate more than 1.5 percent of the statewide SERS-covered payroll for the health care surcharge. For fiscal year 2012, the actuarially determined amount was $35,800.
Active members do not contribute to the postemployment benefit plans. The Retirement Board establishes the rules for the premiums paid by the retirees for health care coverage for themselves and their dependents or for their surviving beneficiaries. Premiums vary depending on the plan selected, qualified years of service, Medicare eligibility and retirement status.

WESTERVILLE CITY SCHOOL DISTRICT, OHIO
Notes to Basic Financial Statements, Continued For the Fiscal Year Ended June 30, 2012
63
The District’s contributions for health care (including surcharge) for the fiscal years ended June 30, 2012, 2011 and 2010 were $320,613, $500,788 and $362,075, respectively;71.33 percent has been contributed for fiscal year 2012 and 100 percent for fiscal years 2011 and 2010. The Retirement Board, acting with advice of the actuary, allocates a portion of the employer contribution to the Medicare B Fund. For fiscal year 2012, this actuarially required allocation was 0.75 percent of covered payroll. The District’s contributions for Medicare Part B for the fiscal years ended June 30, 2012, 2011, and 2010 were $137,204, $145,173 and $139,670, respectively; 71.33 percent has been contributed for fiscal year 2012 and 100 percent for fiscal years 2011 and 2010.
(b) State Teachers Retirement System of Ohio
Plan Description - The District contributes to the cost sharing, multiple employer defined benefit Health Plan (the “Plan”) administered by the State Teachers Retirement System of Ohio (STRS Ohio) for eligible retirees who participated in the defined benefit or combined pension plans offered by STRS Ohio. Benefits include hospitalization, physicians’ fees, prescription drugs and reimbursement of monthly Medicare Part B premiums. The Plan is included in the report of STRS Ohio which may be obtained by visiting www.strsoh.org, under “Publications” or by calling (888) 227-7877. Funding Policy - Ohio law authorizes STRS Ohio to offer the Plan and gives the Retirement Board authority over how much, if any, of the health care costs will be absorbed by STRS Ohio. Active employee members do not contribute to the Plan. All benefit recipients pay a monthly premium. Under Ohio law, funding for post-employment health care may be deducted from employer contributions. For 2012, STRS Ohio allocated employer contributions equal to 1 percent of covered payroll to the Health Care Stabilization Fund. The District’s contributions for health care for the fiscal years ended June 30, 2012, 2011 and 2010 were $759,852, $773,956 and $728,991, respectively; 81.13 percent has been contributed for fiscal year 2012 and 100 percent for fiscal years 2011 and 2010.
(14) CONTINGENCIES
(a) Grants and ADM The Auditor of State is currently performing a statewide review of supporting documentation for student attendance data reported to the Ohio Department of Education. The results of this review are still pending and will be reported separately to the Ohio Department of Education at a later date.
WESTERVILLE CITY SCHOOL DISTRICT, OHIO
Notes to Basic Financial Statements, Continued For the Fiscal Year Ended June 30, 2012
64
The District received financial assistance from federal and State agencies in the form of grants. The expenditure of funds received under these programs generally requires compliance with terms and conditions specified in the grant agreements and is subject to audit by the grantor agencies. Any disallowed claims resulting from such audits could become a liability of the general fund or other applicable funds. This also encompasses the Auditor of State’s ongoing review of student attendance data. However, the effect of any such disallowed claims on the overall financial position of the District at June 30, 2012, if applicable, cannot be determined at this time.
(b) Litigation There are currently a few matters in litigation with the District as a defendant. It is the opinion of management that the potential claims against the District not covered by insurance would not materially affect the financial statements.
(15) JOINTLY GOVERNED ORGANIZATIONS
Metropolitan Educational Council (MEC) – The District is a participant in MEC. MEC is an association of public school districts within the boundaries of Franklin, Delaware, Union, Pickaway, Madison and Fairfield counties. The organization was formed for the purpose of applying modern technology with the aid of computers and other electronic equipment to administrative and instructional functions among member districts. The governing board of MEC consists of one representative of each of the member districts. Financial information can be obtained from Sue Ward, who serves as fiscal officer, at 2100 City Gate Drive, Columbus, Ohio 43219-3591.
(16) RELATED ORGANIZATION
The Westerville School District Library is a political subdivision of the State of Ohio created under Chapter 3375 of the Ohio Revised Code. The Library is governed by Board of Trustees appointed by the Westerville City School District Board of Education. The Board of Trustees possesses its own contracting and budgetary authority, hires and fires personnel and does not depend on the School District for operating subsidies. Although the School District does serve as the taxing authority and may issue tax related debt on behalf of the Library, its role is limited to a ministerial function. The determination to request approval of a tax, the tax rate and purpose are discretionary decisions made solely by the Board of Trustees. Financial information may be obtained from the Westerville School District Library at 126 South State Street, Westerville, Ohio 43081.
(17) RISK MANAGEMENT
For fiscal year 2012, the District was enrolled in the retrospective rating plan for worker’s compensation. The retrospective rating plan allows an employer to assume a portion of the risk in return for a possible reduction in premiums. The greater the assumed risk, the greater the potential reduction in premiums.

WESTERVILLE CITY SCHOOL DISTRICT, OHIO
Notes to Basic Financial Statements, Continued For the Fiscal Year Ended June 30, 2012
65
Employers who have a consistent claims history and proven safety practices will benefit most from the retrospective rating. The employer can customize the retrospective rating plan to control the amount of risk assumed and the potential savings by selecting the maximum premium and claims costs they are willing to pay. Employers may benefit from retrospective rating because of lower initial premiums and realized cash flow advantages, which increase as premiums are saved. The District’s Workers’ Compensation program is accounted for in the workers’ compensation internal service fund which pays for all claims, claim reserves and administrative costs of the program. The general fund generates revenues by charging each fund a percentage rate determined by the Bureau for the payroll during the reporting period. The claims liability of $241,905 is recorded based on an actuarial determination of future claims. The claims liability is expected to be paid within one year. Changes in claims activity for current and prior fiscal year are as follows: The District is exposed to various risks of loss related to torts, theft of, damage to, and destruction of assets, errors and omissions, injuries to employees and natural disasters. The District contracts with an insurance carrier for property insurance and general liability insurance. Professional liability is protected by a $1,000,000 single occurrence limit, $2,000,000 general aggregate limit, $2,000,000 umbrella aggregate limit and no deductible. Vehicles are also covered and have a $500 deductible for comprehensive and a $2,000 deductible for collision. Automotive liability has a $1,000,000 combined single limit of liability. Settlements have not exceeded coverage in any of the last three years, and there has been no reduction in coverage from the prior years. Post employment health care is provided to plan participants or their beneficiaries through the respective retirement systems discussed in Note 13. As such, no funding is required by the District. The District provides life insurance and accidental death and dismemberment insurance to all employees in an amount related to the employee’s position, ranging from $30,000 to $392,000.
(18) CONTRACTUAL COMMITMENTS
The District had the following outstanding contractual commitments at fiscal year end:
Vendor Purpose Amount
Cardinal Bus Sales Bus Purchase $897,176 Design-Build Solutions, Inc. Renovations 398,837 Capital City Electric Renovations 349,750 Heiberger Paving, Inc. Renovations 321,336 McGraw-Hill Textbooks 127,368
Total $2,094,467
WESTERVILLE CITY SCHOOL DISTRICT, OHIO
Notes to Basic Financial Statements, Continued For the Fiscal Year Ended June 30, 2012
66
(19) OTHER COMMITMENTS
The District utilizes encumbrance accounting as part of its budgetary controls. Encumbrances outstanding at year-end may be reported as part of restricted, committed, or assigned classifications of fund balance. At year end, the District’s commitments for encumbrances in the governmental funds were as follows:
Fund Type
Year-End Encumbrances
General Fund $671,196 Permanent Improvement Fund 1,577,774 Nonmajor Governmental Funds 180,069
Total $2,429,039
(20) SUBSEQUENT EVENT
On August 30, 2012 the District issued $27,320,000 in Series 2012 Refunding Bonds. The issuance includes $27,200,000 in Current Interest Bonds, with interest rates ranging 0.45% to 3.04%, and $120,000 in Capital Appreciation Bonds with a stated interest rate of 65.58%. These bonds will be used to advance refund a portion of the Series 2004 General Obligation Bonds.
COMBINING STATEMENTS AND INDIVIDUAL FUND SCHEDULES
67

THIS PAGE IS INTENTIONALLY LEFT BLANK
68
WESTERVILLE CITY SCHOOL DISTRICT MAJOR FUNDS
Debt Service Fund
Permanent Improvement Fund
A fund provided to account for transactions related to the acquiring, constructing or improving of permanent improvements andthe purchase of textbooks and computers as are authorized by Section 5705, Ohio Revised Code.
General Fund
The General fund accounts for and reports all Financial resources not accounted for and reported in another fund. These general fund's activities include, but are not limited to, general instruction, pupil services, operation and maintenance of facilities, student transportation and administration.
Other Major Funds
The Debt Service Fund is used to account for the accumulation of resources and payment of general obligation bond principal and interest and certain other long-term obligations from governmental resources when the District is obligated in some manner forthe payment.
69

Variance withFinal Budget-
Original Final PositiveBudget Budget Actual (Negative)
Debt Service
Total revenue and other sources. . . . . . . . . . . . 10,387,000$ 11,805,510$ 10,367,494$ (1,438,016)$ Total expenditures and other uses . . . . . . . . . . 11,557,569 11,557,569 11,525,874 31,695
Net change in fund balance . . . . . . . . . . . . . (1,170,569) 247,941 (1,158,380) (1,406,321)
Fund balance at beginning of year. . . . . . . . . . . 7,040,526 7,040,526 7,040,526 - Fund balance at end of year . . . . . . . . . . . . . . 5,869,957$ 7,288,467$ 5,882,146$ (1,406,321)$
Permanent Improvement
Total revenue and other sources. . . . . . . . . . . . 7,665,844$ 9,035,584$ 7,649,339$ (1,386,245)$ Total expenditures and other uses . . . . . . . . . . 14,782,901 17,782,901 15,863,192 1,919,709
Net change in fund balance . . . . . . . . . . . . . (7,117,057) (8,747,317) (8,213,853) 533,464
Fund balance at beginning of year. . . . . . . . . . . 7,118,342 7,118,342 7,118,342 - Prior year encumbrances appropriated. . . . . . . . . 4,771,283 4,771,283 4,771,283 - Fund balance at end of year . . . . . . . . . . . . . . 4,772,568$ 3,142,308$ 3,675,772$ 533,464$
FOR THE FISCAL YEAR ENDED JUNE 30, 2012
WESTERVILLE CITY SCHOOL DISTRICT
SCHEDULE OF REVENUES, EXPENDITURES AND CHANGES INFUND BALANCE - BUDGET AND ACTUAL (NON-GAAP BUDGETARY BASIS)
70
WESTERVILLE CITY SCHOOL DISTRICTOTHER GOVERNMENTAL FUNDS
Food Service
Other Local
District Managed
Auxiliary Services
Management Information System
Data Communications
Alternative Schools
Other State
Education Jobs
Race to the Top
IDEA, Part B
This fund is provided to account for financial transactions related to the District managed food service operation.
Other Governmental Funds are established to account for revenues from specific sources, which legally, or otherwise, are restricted toexpenditure for specific purposes. A description of the District's Other Governmental Funds follows:
This fund is used to account for proceeds of specific revenue sources except state and federal grants that are legally restricted toexpenditures for specified purposes.
This fund is provided to account for those student activity programs that have student participation in the activity, but do not havestudent management of the programs. This fund would usually include athletic programs but could also include band, cheerleaders,and other similar types of activities.
This fund is provided to account for State of Ohio monies that provide services and materials to pupils attending non-public schoolswithin the District.
A fund used to account for monies received from the State of Ohio for alternative educational programs for existing and new at-riskand delinquent youth.
This fund is used to account for various monies received from State of Ohio that are not classified elsewhere.
This fund is provided to account for monies received from the State of Ohio for expenses supporting the establishment, maintenanceand upgrade of data communication links from the schools to the Metropolitan Educational Council, data acquisition site, and furtherto the Ohio Department of Education.
This fund is provided to account for monies received from the State of Ohio for expenses associated with implementation of therequirements of the Educational Management Information System (EMIS).
This fund accounts for federal monies whose purpose is to create education jobs for the 2010-2011 school year. Jobs funded underthis program include those that provide educational and related services for early childhood, elementary, and secondary education.
This fund is provided to account for Federal monies which assist in providing an appropriate public education to all children withdisabilities.
A fund used to account for revenues that are restricted to provide for either a new program or expansion of an existing program to supportinitiatives in the following areas: standards and assessments; using date to improve instruction; great teachers and leaders; and turningaround the lowest achieving schools.
71

WESTERVILLE CITY SCHOOL DISTRICTOTHER GOVERNMENTAL FUNDS
Vocational Education: Carl D. Perkins
Title II-D
Title III
Transition Program for Refugee Children
Title I
Preschool Handicapped
Title II-A
Other Federal
The following funds are included in the general fund (GAAP basis), but have separate legally adopted budgets (budget basis):
Uniform School Supplies
Public School Support
This fund is used to account for Federal monies to provide Local educational agencies to meet the special needs of educationallydeproved children.
This fund is provided to improve State academic achievement through technology in schools, to assist student in becomingtechnologically literate by the end of eighth grade, and; to encourage effective integration of technology with teacher training andcurriculum development to establish successful research-based instructional methods.
This fund is used to account for the purchase and sale of school supplies as adopted by the Board of Education for use in the schoolsof the District.
This fund is used to account for Federal monies to develop and carry out elementary and secondary school programs, includingactivities at the pre-school level, to meet the educational needs of children of limited English proficiency.
This fund is used to account Federal monies to provide educational services to meet educational needs of refugee children who areenrolled in public elementay and secondary schools.
Nonmajor Special Revenue Funds (Continued)
This fund is provided to account for specific extra-curricular revenue sources, other than taxes (i.e. profits from vending machines,sales of pictures, etc.), that are restricted to expenditures for specified purposes approved by board resolution. Such expenditures mayinclude curricular and extra-curricular related purchases.
This fund is used to account for various Federal monies that are not classified elsewhere.
This fund is used to account for Federal monies to hire additional classroom teachers in grades 1 through 3, so that the number ofstudents per teacher will be reduced.
This fund is used to account for Federal monies which addresses the improvement and expansion of services for handicapped childrenagres three through five.
This fund is provided to account for Federal monies received for expenses relating to the development of secondary vocationaleducational programs.
72

THIS PAGE IS INTENTIONALLY LEFT BLANK
73

Food Other District AuxilliaryService Local Managed Services
Assets:Equity in pooled cash and investments. . . . . . . . . . . . . . . . 1,468,790$ 23,603$ 711,901$ 265,591$ Receivables:
Accounts . . . . . . . . . . . . . . . . . . . 23,837 - - - Intergovernmental. . . . . . . . . . . . . . . - - - -
Materials and supplies inventory. . . . . . . . . 28,811 - - - Total assets . . . . . . . . . . . . . . . . . . . 1,521,438$ 23,603$ 711,901$ 265,591$
Liabilities: Accounts payable . . . . . . . . . . . . . . . . 4,923$ 5,340$ 21,493$ 70,368$ Accrued wages and benefits. . . . . . . . . . . 166,328 - 515 53,088 Interfund loans payable. . . . . . . . . . . . . - - - - Intergovernmental payable . . . . . . . . . . . 2,061 - 2 646 Pension obligation payable . . . . . . . . . . . 122,515 - 803 7,775 Total liabilities. . . . . . . . . . . . . . . . . . . . . 295,827 5,340 22,813 131,877
Fund balances:Nonspendable: Materials and supplies inventory. . . . . . . 28,811 - - - Restricted: Food service operations . . . . . . . . . . . 1,196,800 - - - Non-public schools . . . . . . . . . . . . . - - - 133,714 Special education . . . . . . . . . . . . . . - - - - Targeted academic assistance . . . . . . . . - - - - Vocational education. . . . . . . . . . . . . - - - - Extracurricular. . . . . . . . . . . . . . . - - 689,088 - Other purposes. . . . . . . . . . . . . . . . - 18,263 - - Unassigned (deficit) . . . . . . . . . . . . . - - - -
Total fund balances (deficit) . . . . . . . . . . . . . 1,225,611 18,263 689,088 133,714
Total liabilities and fund balances . . . . . . . . . . 1,521,438$ 23,603$ 711,901$ 265,591$
Special Revenue
OTHER GOVERNMENTAL FUNDSJUNE 30, 2012
WESTERVILLE CITY SCHOOL DISTRICT
COMBINING BALANCE SHEET
74
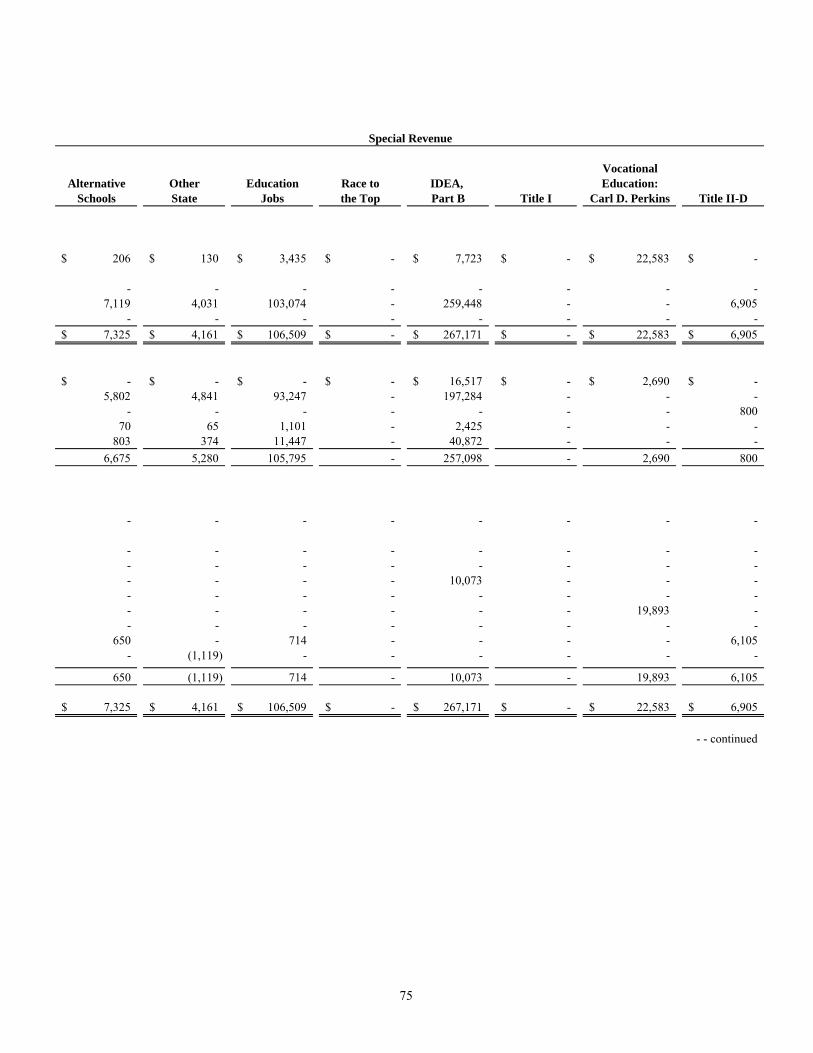
VocationalAlternative Other Education Race to IDEA, Education:
Schools State Jobs the Top Part B Title I Carl D. Perkins Title II-D
206$ 130$ 3,435$ -$ 7,723$ -$ 22,583$ -$
- - - - - - - - 7,119 4,031 103,074 - 259,448 - - 6,905
- - - - - - - - 7,325$ 4,161$ 106,509$ -$ 267,171$ -$ 22,583$ 6,905$
-$ -$ -$ -$ 16,517$ -$ 2,690$ -$ 5,802 4,841 93,247 - 197,284 - - -
- - - - - - - 800 70 65 1,101 - 2,425 - - -
803 374 11,447 - 40,872 - - - 6,675 5,280 105,795 - 257,098 - 2,690 800
- - - - - - - -
- - - - - - - - - - - - - - - - - - - - 10,073 - - - - - - - - - - - - - - - - - 19,893 - - - - - - - - -
650 - 714 - - - - 6,105 - (1,119) - - - - - -
650 (1,119) 714 - 10,073 - 19,893 6,105
7,325$ 4,161$ 106,509$ -$ 267,171$ -$ 22,583$ 6,905$
- - continued
Special Revenue
75
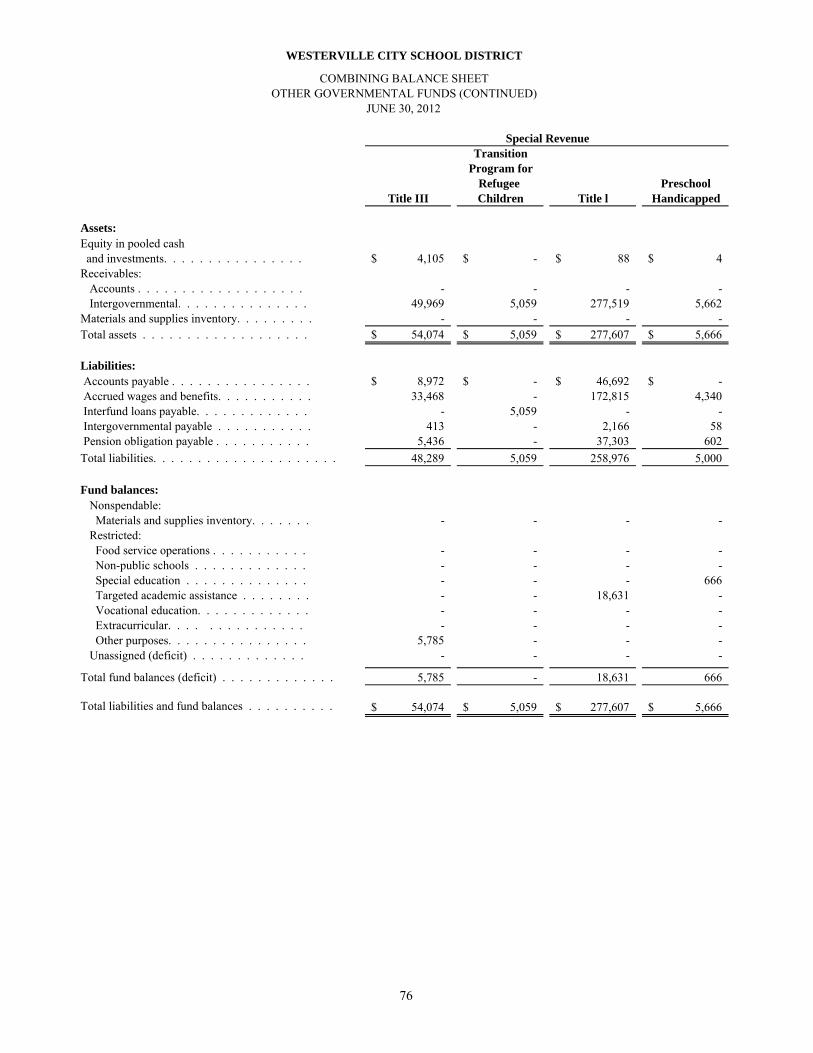
TransitionProgram for
Refugee PreschoolTitle III Children Title l Handicapped
Assets:Equity in pooled cash and investments. . . . . . . . . . . . . . . . 4,105$ -$ 88$ 4$ Receivables:
Accounts . . . . . . . . . . . . . . . . . . . - - - - Intergovernmental. . . . . . . . . . . . . . . 49,969 5,059 277,519 5,662
Materials and supplies inventory. . . . . . . . . - - - - Total assets . . . . . . . . . . . . . . . . . . . 54,074$ 5,059$ 277,607$ 5,666$
Liabilities: Accounts payable . . . . . . . . . . . . . . . . 8,972$ -$ 46,692$ -$ Accrued wages and benefits. . . . . . . . . . . 33,468 - 172,815 4,340 Interfund loans payable. . . . . . . . . . . . . - 5,059 - - Intergovernmental payable . . . . . . . . . . . 413 - 2,166 58 Pension obligation payable . . . . . . . . . . . 5,436 - 37,303 602 Total liabilities. . . . . . . . . . . . . . . . . . . . . 48,289 5,059 258,976 5,000
Fund balances:Nonspendable: Materials and supplies inventory. . . . . . . - - - - Restricted: Food service operations . . . . . . . . . . . - - - - Non-public schools . . . . . . . . . . . . . - - - - Special education . . . . . . . . . . . . . . - - - 666 Targeted academic assistance . . . . . . . . - - 18,631 - Vocational education. . . . . . . . . . . . . - - - - Extracurricular. . . . . . . . . . . . . . . - - - - Other purposes. . . . . . . . . . . . . . . . 5,785 - - - Unassigned (deficit) . . . . . . . . . . . . . - - - -
Total fund balances (deficit) . . . . . . . . . . . . . 5,785 - 18,631 666
Total liabilities and fund balances . . . . . . . . . . 54,074$ 5,059$ 277,607$ 5,666$
Special Revenue
COMBINING BALANCE SHEETOTHER GOVERNMENTAL FUNDS (CONTINUED)
JUNE 30, 2012
WESTERVILLE CITY SCHOOL DISTRICT
76

TotalOther
Other GovernemntalTitle II - A Federal Funds
2,944$ -$ 2,511,103$
- - 23,837 26,879 - 745,665
- - 28,811 29,823$ -$ 3,309,416$
2,674$ -$ 179,669$ 20,861 - 752,589
- - 5,859 272 - 9,279
3,212 - 231,142 27,019 - 1,178,538
- - 28,811
- - 1,196,800 - - 133,714 - - 10,739
2,804 - 21,435 - - 19,893 - - 689,088 - - 31,517 - - (1,119)
2,804 - 2,130,878
29,823$ -$ 3,309,416$
Special Revenue
77

Food Other District AuxilliaryService Local Managed Services
Revenues:From local sources: Earnings on investments . . . . . . . . . . . 599$ -$ -$ 118$ Charges for services . . . . . . . . . . . . . 2,283,149 - - - Extracurricular. . . . . . . . . . . . . . . . - - 889,119 - Contributions and donations. . . . . . . . . 5,200 60,724 76,288 - Other local revenues . . . . . . . . . . . . . 3,075 - 11,646 - Intergovernmental - state . . . . . . . . . . . 40,117 - - 805,103 Intergovernmental - federal . . . . . . . . . . 2,362,765 - - - Total revenues . . . . . . . . . . . . . . . . . 4,694,905 60,724 977,053 805,221
Expenditures:Current: Instruction: Regular. . . . . . . . . . . . . . . . . . . - 38,147 - - Special . . . . . . . . . . . . . . . . . . . - 21,775 - - Vocational . . . . . . . . . . . . . . . . . - - - - Other . . . . . . . . . . . . . . . . . . . . - - - - Support services: Pupil . . . . . . . . . . . . . . . . . . . . - - 22 - Instructional staff . . . . . . . . . . . . . . - 6,885 - - Administration . . . . . . . . . . . . . . . - - - - Fiscal . . . . . . . . . . . . . . . . . . . . - - - 20,660 Pupil transportation . . . . . . . . . . . . . - 1,526 - - Central . . . . . . . . . . . . . . . . . . . - - - - Operation of non-instructional services:
Operation of non-instructional . . . . . . . - 490 - 700,850 Food service operations. . . . . . . . . . . 4,498,250 - - -
Extracurricular activities . . . . . . . . . . . - - 1,052,874 - Total expenditures . . . . . . . . . . . . . . 4,498,250 68,823 1,052,896 721,510
Net change in fund balances . . . . . . . . . . 196,655 (8,099) (75,843) 83,711
Fund balances at beginning of year. . . . . . . 1,028,956 26,362 764,931 50,003 Fund balances (deficit) at end of year. . . . . . 1,225,611$ 18,263$ 689,088$ 133,714$
WESTERVILLE CITY SCHOOL DISTRICT
FOR THE FISCAL YEAR ENDED JUNE 30, 2012OTHER GOVERNMENTAL FUNDS
COMBINING STATEMENT OF REVENUES, EXPENDITURES AND CHANGES IN FUND BALANCES
Special Revenue
78
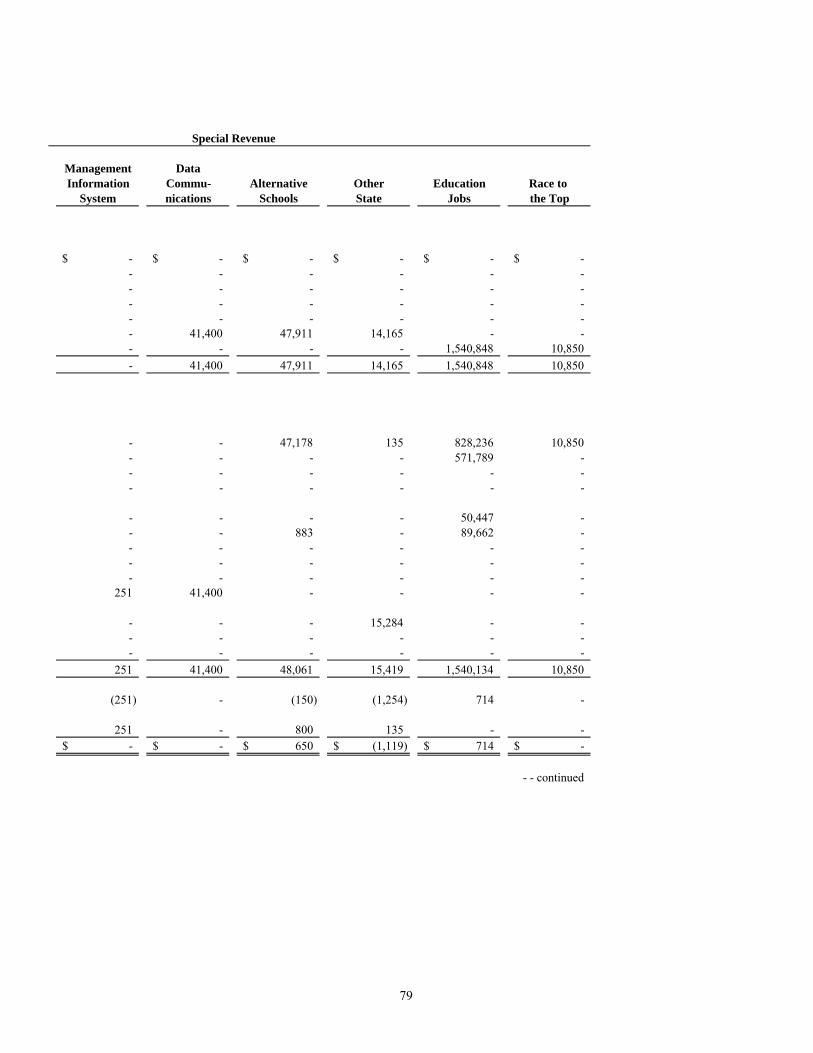
Management Data Information Commu- Alternative Other Education Race to
System nications Schools State Jobs the Top
-$ -$ -$ -$ -$ -$ - - - - - - - - - - - - - - - - - - - - - - - - - 41,400 47,911 14,165 - - - - - - 1,540,848 10,850 - 41,400 47,911 14,165 1,540,848 10,850
- - 47,178 135 828,236 10,850 - - - - 571,789 - - - - - - - - - - - - -
- - - - 50,447 - - - 883 - 89,662 - - - - - - - - - - - - - - - - - - -
251 41,400 - - - -
- - - 15,284 - - - - - - - - - - - - - -
251 41,400 48,061 15,419 1,540,134 10,850
(251) - (150) (1,254) 714 -
251 - 800 135 - - -$ -$ 650$ (1,119)$ 714$ -$
- - continued
Special Revenue
79
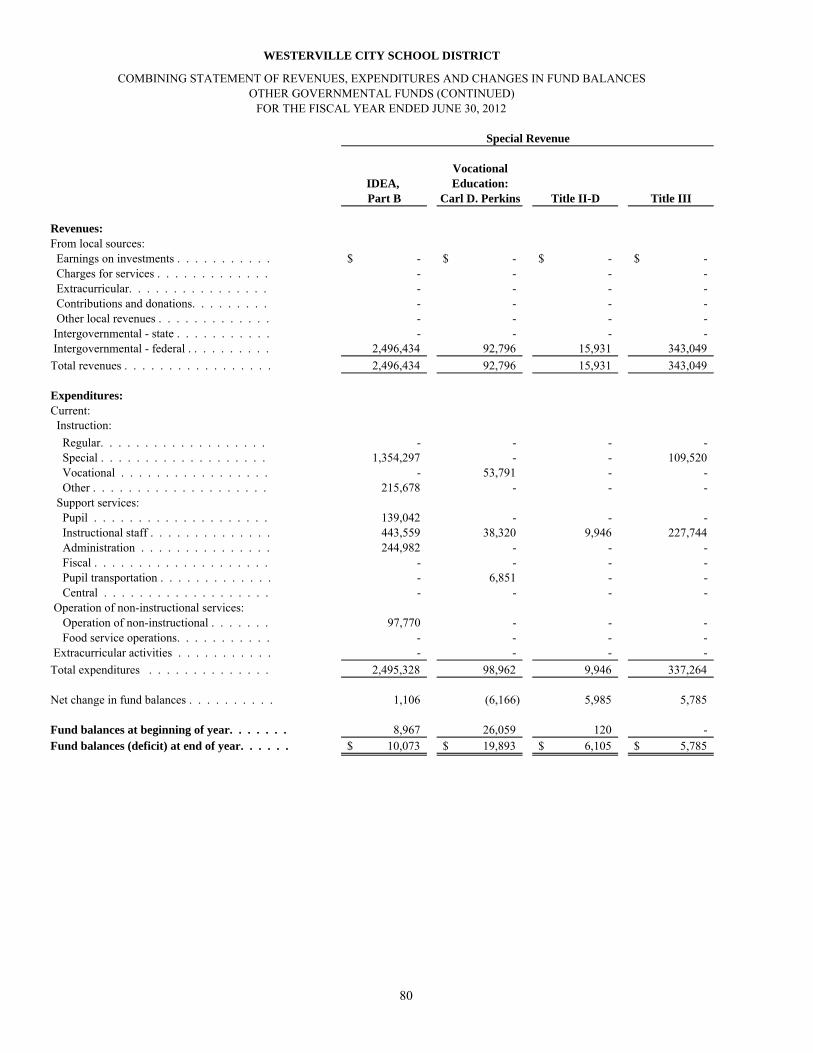
Vocational
IDEA, Education:Part B Carl D. Perkins Title II-D Title III
Revenues:From local sources: Earnings on investments . . . . . . . . . . . -$ -$ -$ -$ Charges for services . . . . . . . . . . . . . - - - - Extracurricular. . . . . . . . . . . . . . . . - - - - Contributions and donations. . . . . . . . . - - - - Other local revenues . . . . . . . . . . . . . - - - - Intergovernmental - state . . . . . . . . . . . - - - - Intergovernmental - federal . . . . . . . . . . 2,496,434 92,796 15,931 343,049 Total revenues . . . . . . . . . . . . . . . . . 2,496,434 92,796 15,931 343,049
Expenditures:Current: Instruction: Regular. . . . . . . . . . . . . . . . . . . - - - - Special . . . . . . . . . . . . . . . . . . . 1,354,297 - - 109,520 Vocational . . . . . . . . . . . . . . . . . - 53,791 - - Other . . . . . . . . . . . . . . . . . . . . 215,678 - - - Support services: Pupil . . . . . . . . . . . . . . . . . . . . 139,042 - - - Instructional staff . . . . . . . . . . . . . . 443,559 38,320 9,946 227,744 Administration . . . . . . . . . . . . . . . 244,982 - - - Fiscal . . . . . . . . . . . . . . . . . . . . - - - - Pupil transportation . . . . . . . . . . . . . - 6,851 - - Central . . . . . . . . . . . . . . . . . . . - - - - Operation of non-instructional services:
Operation of non-instructional . . . . . . . 97,770 - - - Food service operations. . . . . . . . . . . - - - -
Extracurricular activities . . . . . . . . . . . - - - - Total expenditures . . . . . . . . . . . . . . 2,495,328 98,962 9,946 337,264
Net change in fund balances . . . . . . . . . . 1,106 (6,166) 5,985 5,785
Fund balances at beginning of year. . . . . . . 8,967 26,059 120 - Fund balances (deficit) at end of year. . . . . . 10,073$ 19,893$ 6,105$ 5,785$
OTHER GOVERNMENTAL FUNDS (CONTINUED)FOR THE FISCAL YEAR ENDED JUNE 30, 2012
COMBINING STATEMENT OF REVENUES, EXPENDITURES AND CHANGES IN FUND BALANCES
Special Revenue
WESTERVILLE CITY SCHOOL DISTRICT
80
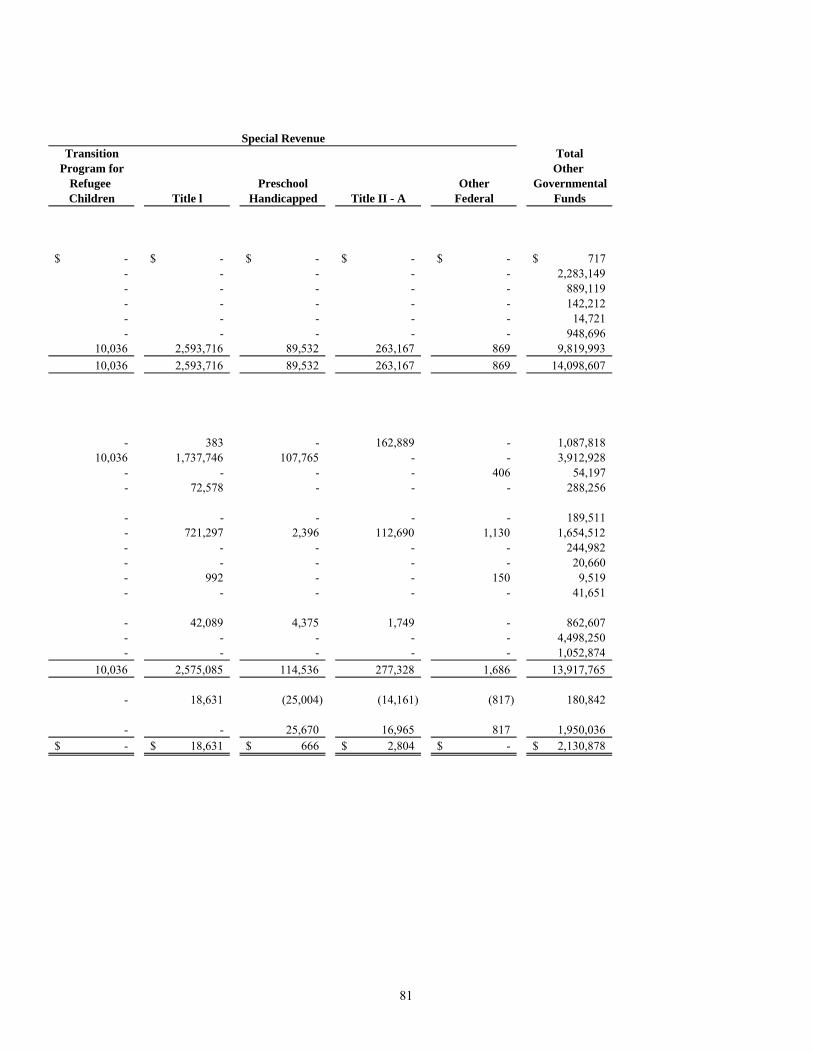
Transition TotalProgram for Other
Refugee Preschool Other GovernmentalChildren Title l Handicapped Title II - A Federal Funds
-$ -$ -$ -$ -$ 717$ - - - - - 2,283,149 - - - - - 889,119 - - - - - 142,212 - - - - - 14,721 - - - - - 948,696
10,036 2,593,716 89,532 263,167 869 9,819,993 10,036 2,593,716 89,532 263,167 869 14,098,607
- 383 - 162,889 - 1,087,818 10,036 1,737,746 107,765 - - 3,912,928
- - - - 406 54,197 - 72,578 - - - 288,256
- - - - - 189,511 - 721,297 2,396 112,690 1,130 1,654,512 - - - - - 244,982 - - - - - 20,660 - 992 - - 150 9,519 - - - - - 41,651
- 42,089 4,375 1,749 - 862,607 - - - - - 4,498,250 - - - - - 1,052,874
10,036 2,575,085 114,536 277,328 1,686 13,917,765
- 18,631 (25,004) (14,161) (817) 180,842
- - 25,670 16,965 817 1,950,036 -$ 18,631$ 666$ 2,804$ -$ 2,130,878$
Special Revenue
81

Variance withFinal Budget-
Original Final PositiveBudget Budget Actual (Negative)
Special Revenue
Food Service
Total revenue and other sources. . . . . . . . . . . . 4,909,000$ 4,953,900$ 4,754,413$ (199,487)$ Total expenditures and other uses . . . . . . . . . . 4,541,311 4,631,311 4,530,157 101,154
Net change in fund balance . . . . . . . . . . . . . 367,689 322,589 224,256 (98,333)
Fund balance at beginning of year. . . . . . . . . . . 1,026,020 1,026,020 1,026,020 - Prior year encumbrances appropriated. . . . . . . . . 140,774 140,774 140,774 - Fund balance at end of year . . . . . . . . . . . . . . 1,534,483$ 1,489,383$ 1,391,050$ (98,333)$
Uniform School Supplies
Total revenue and other sources. . . . . . . . . . . . 350,000$ 360,000$ 311,824$ (48,176)$ Total expenditures and other uses . . . . . . . . . . 347,454 345,454 324,300 21,154
Net change in fund balance . . . . . . . . . . . . . 2,546 14,546 (12,476) (27,022)
Fund balance at beginning of year. . . . . . . . . . . 22 22 22 - Prior year encumbrances appropriated. . . . . . . . . 12,454 12,454 12,454 - Fund balance at end of year . . . . . . . . . . . . . . 15,022$ 27,022$ -$ (27,022)$
Public School Support
Total revenue and other sources. . . . . . . . . . . . 293,397$ 379,697$ 364,102$ (15,595)$ Total expenditures and other uses . . . . . . . . . . 394,400 426,900 380,092 46,808
Net change in fund balance . . . . . . . . . . . . . (101,003) (47,203) (15,990) 31,213
Fund balance at beginning of year. . . . . . . . . . . 242,037 242,037 242,037 - Prior year encumbrances appropriated. . . . . . . . . 19,400 19,400 19,400 - Fund balance at end of year . . . . . . . . . . . . . . 160,434$ 214,234$ 245,447$ 31,213$
FOR THE FISCAL YEAR ENDED JUNE 30, 2012
WESTERVILLE CITY SCHOOL DISTRICT
SCHEDULE OF REVENUES, EXPENDITURES AND CHANGES INFUND BALANCE - BUDGET AND ACTUAL (NON-GAAP BUDGETARY BASIS)
82
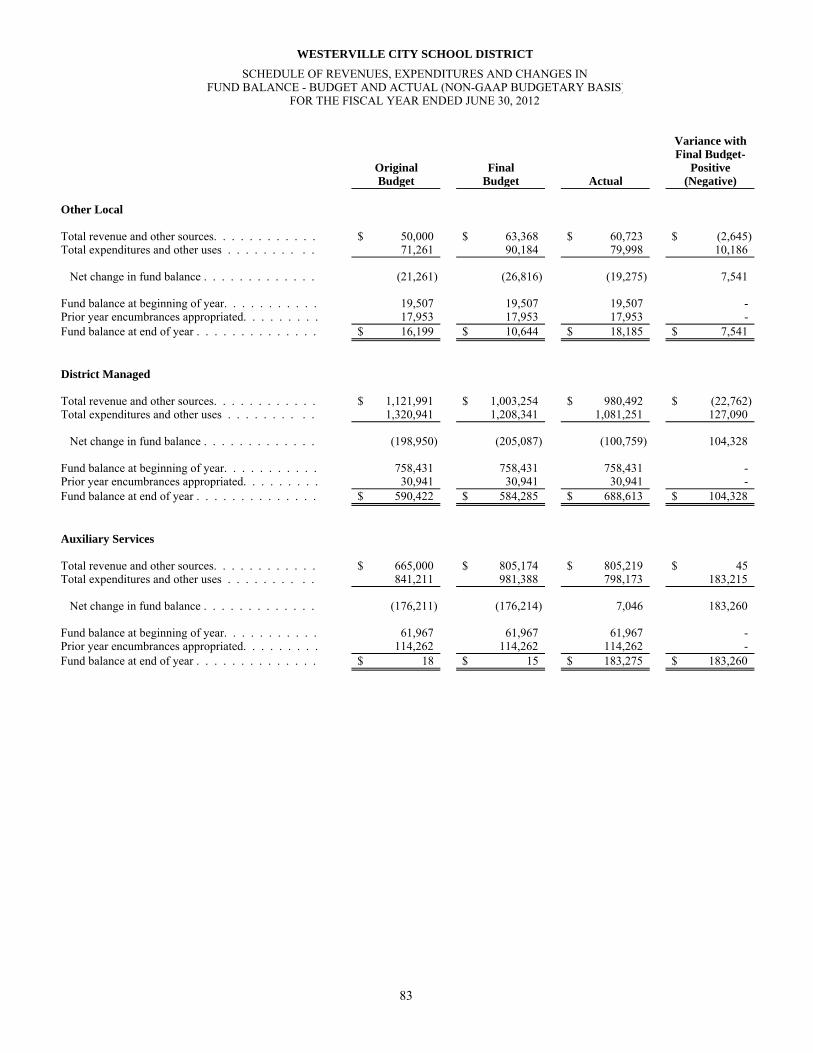
Variance withFinal Budget-
Original Final PositiveBudget Budget Actual (Negative)
Other Local
Total revenue and other sources. . . . . . . . . . . . 50,000$ 63,368$ 60,723$ (2,645)$ Total expenditures and other uses . . . . . . . . . . 71,261 90,184 79,998 10,186
Net change in fund balance . . . . . . . . . . . . . (21,261) (26,816) (19,275) 7,541
Fund balance at beginning of year. . . . . . . . . . . 19,507 19,507 19,507 - Prior year encumbrances appropriated. . . . . . . . . 17,953 17,953 17,953 - Fund balance at end of year . . . . . . . . . . . . . . 16,199$ 10,644$ 18,185$ 7,541$
District Managed
Total revenue and other sources. . . . . . . . . . . . 1,121,991$ 1,003,254$ 980,492$ (22,762)$ Total expenditures and other uses . . . . . . . . . . 1,320,941 1,208,341 1,081,251 127,090
Net change in fund balance . . . . . . . . . . . . . (198,950) (205,087) (100,759) 104,328
Fund balance at beginning of year. . . . . . . . . . . 758,431 758,431 758,431 - Prior year encumbrances appropriated. . . . . . . . . 30,941 30,941 30,941 - Fund balance at end of year . . . . . . . . . . . . . . 590,422$ 584,285$ 688,613$ 104,328$
Auxiliary Services
Total revenue and other sources. . . . . . . . . . . . 665,000$ 805,174$ 805,219$ 45$ Total expenditures and other uses . . . . . . . . . . 841,211 981,388 798,173 183,215
Net change in fund balance . . . . . . . . . . . . . (176,211) (176,214) 7,046 183,260
Fund balance at beginning of year. . . . . . . . . . . 61,967 61,967 61,967 - Prior year encumbrances appropriated. . . . . . . . . 114,262 114,262 114,262 - Fund balance at end of year . . . . . . . . . . . . . . 18$ 15$ 183,275$ 183,260$
FOR THE FISCAL YEAR ENDED JUNE 30, 2012
WESTERVILLE CITY SCHOOL DISTRICT
SCHEDULE OF REVENUES, EXPENDITURES AND CHANGES INFUND BALANCE - BUDGET AND ACTUAL (NON-GAAP BUDGETARY BASIS)
83

Variance withFinal Budget-
Original Final PositiveBudget Budget Actual (Negative)
Management Information System
Total revenue and other sources. . . . . . . . . . . . 8,400$ -$ -$ -$ Total expenditures and other uses . . . . . . . . . . 8,650 250 250 -
Net change in fund balance . . . . . . . . . . . . . (250) (250) (250) -
Fund balance at beginning of year. . . . . . . . . . . 50 50 50 - Prior year encumbrances appropriated. . . . . . . . . 200 200 200 - Fund balance at end of year . . . . . . . . . . . . . . -$ -$ -$ -$
Data Communications
Total revenue and other sources. . . . . . . . . . . . 46,000$ 41,400$ 41,400$ -$ Total expenditures and other uses . . . . . . . . . . 46,000 41,400 41,400 -
Net change in fund balance . . . . . . . . . . . . . - - - -
Fund balance at beginning of year. . . . . . . . . . . - - - - Fund balance at end of year . . . . . . . . . . . . . . -$ -$ -$ -$
Alternative Schools
Total revenue and other sources. . . . . . . . . . . . 56,652$ 57,539$ 50,419$ (7,120)$ Total expenditures and other uses . . . . . . . . . . 56,779 57,666 50,341 7,325
Net change in fund balance . . . . . . . . . . . . . (127) (127) 78 205
Fund balance at beginning of year. . . . . . . . . . . 127 127 127 - Fund balance at end of year . . . . . . . . . . . . . . -$ -$ 205$ 205$
FOR THE FISCAL YEAR ENDED JUNE 30, 2012
WESTERVILLE CITY SCHOOL DISTRICT
SCHEDULE OF REVENUES, EXPENDITURES AND CHANGES INFUND BALANCE - BUDGET AND ACTUAL (NON-GAAP BUDGETARY BASIS)
84
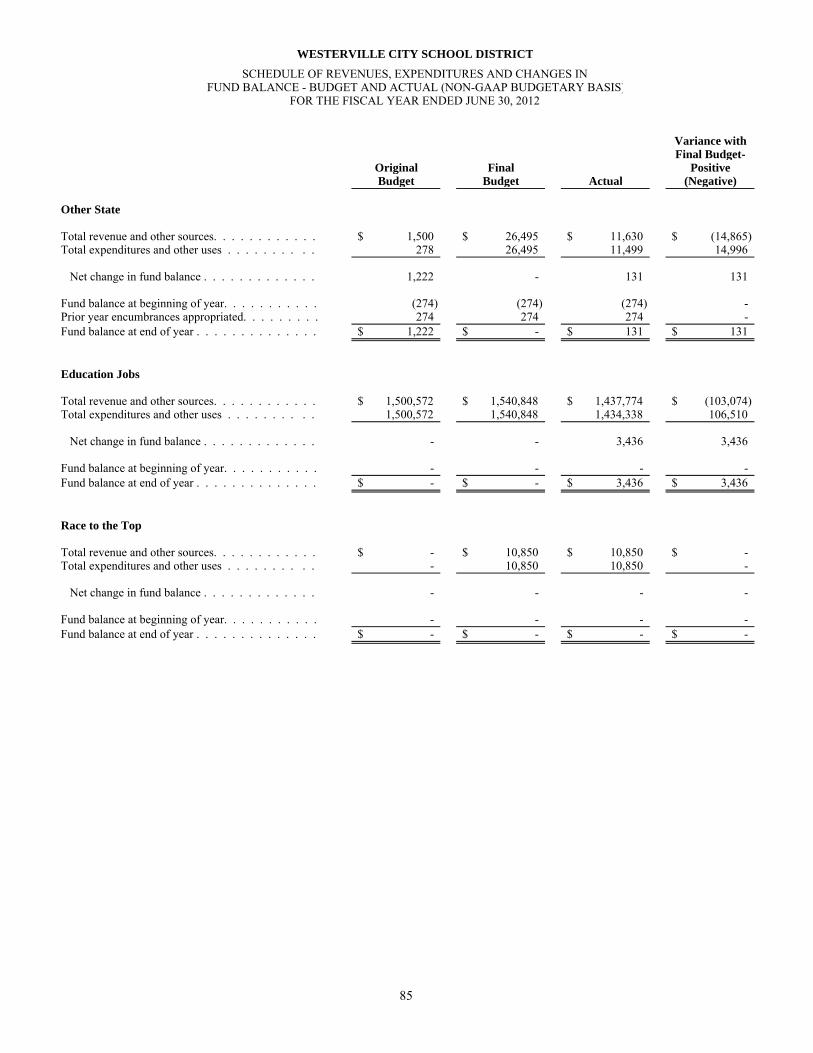
Variance withFinal Budget-
Original Final PositiveBudget Budget Actual (Negative)
Other State
Total revenue and other sources. . . . . . . . . . . . 1,500$ 26,495$ 11,630$ (14,865)$ Total expenditures and other uses . . . . . . . . . . 278 26,495 11,499 14,996
Net change in fund balance . . . . . . . . . . . . . 1,222 - 131 131
Fund balance at beginning of year. . . . . . . . . . . (274) (274) (274) - Prior year encumbrances appropriated. . . . . . . . . 274 274 274 - Fund balance at end of year . . . . . . . . . . . . . . 1,222$ -$ 131$ 131$
Education Jobs
Total revenue and other sources. . . . . . . . . . . . 1,500,572$ 1,540,848$ 1,437,774$ (103,074)$ Total expenditures and other uses . . . . . . . . . . 1,500,572 1,540,848 1,434,338 106,510
Net change in fund balance . . . . . . . . . . . . . - - 3,436 3,436
Fund balance at beginning of year. . . . . . . . . . . - - - - Fund balance at end of year . . . . . . . . . . . . . . -$ -$ 3,436$ 3,436$
Race to the Top
Total revenue and other sources. . . . . . . . . . . . -$ 10,850$ 10,850$ -$ Total expenditures and other uses . . . . . . . . . . - 10,850 10,850 -
Net change in fund balance . . . . . . . . . . . . . - - - -
Fund balance at beginning of year. . . . . . . . . . . - - - - Fund balance at end of year . . . . . . . . . . . . . . -$ -$ -$ -$
FOR THE FISCAL YEAR ENDED JUNE 30, 2012
WESTERVILLE CITY SCHOOL DISTRICT
SCHEDULE OF REVENUES, EXPENDITURES AND CHANGES INFUND BALANCE - BUDGET AND ACTUAL (NON-GAAP BUDGETARY BASIS)
85
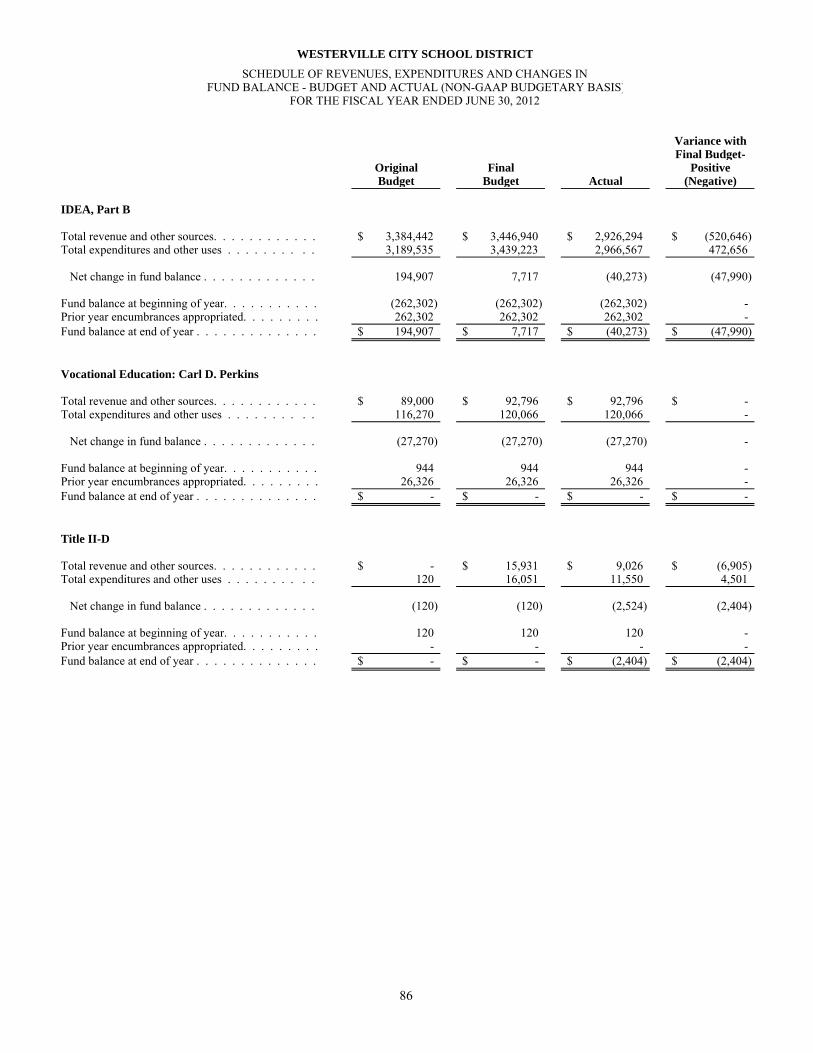
Variance withFinal Budget-
Original Final PositiveBudget Budget Actual (Negative)
IDEA, Part B
Total revenue and other sources. . . . . . . . . . . . 3,384,442$ 3,446,940$ 2,926,294$ (520,646)$ Total expenditures and other uses . . . . . . . . . . 3,189,535 3,439,223 2,966,567 472,656
Net change in fund balance . . . . . . . . . . . . . 194,907 7,717 (40,273) (47,990)
Fund balance at beginning of year. . . . . . . . . . . (262,302) (262,302) (262,302) - Prior year encumbrances appropriated. . . . . . . . . 262,302 262,302 262,302 - Fund balance at end of year . . . . . . . . . . . . . . 194,907$ 7,717$ (40,273)$ (47,990)$
Vocational Education: Carl D. Perkins
Total revenue and other sources. . . . . . . . . . . . 89,000$ 92,796$ 92,796$ -$ Total expenditures and other uses . . . . . . . . . . 116,270 120,066 120,066 -
Net change in fund balance . . . . . . . . . . . . . (27,270) (27,270) (27,270) -
Fund balance at beginning of year. . . . . . . . . . . 944 944 944 - Prior year encumbrances appropriated. . . . . . . . . 26,326 26,326 26,326 - Fund balance at end of year . . . . . . . . . . . . . . -$ -$ -$ -$
Title II-D
Total revenue and other sources. . . . . . . . . . . . -$ 15,931$ 9,026$ (6,905)$ Total expenditures and other uses . . . . . . . . . . 120 16,051 11,550 4,501
Net change in fund balance . . . . . . . . . . . . . (120) (120) (2,524) (2,404)
Fund balance at beginning of year. . . . . . . . . . . 120 120 120 - Prior year encumbrances appropriated. . . . . . . . . - - - - Fund balance at end of year . . . . . . . . . . . . . . -$ -$ (2,404)$ (2,404)$
FOR THE FISCAL YEAR ENDED JUNE 30, 2012
WESTERVILLE CITY SCHOOL DISTRICT
SCHEDULE OF REVENUES, EXPENDITURES AND CHANGES INFUND BALANCE - BUDGET AND ACTUAL (NON-GAAP BUDGETARY BASIS)
86
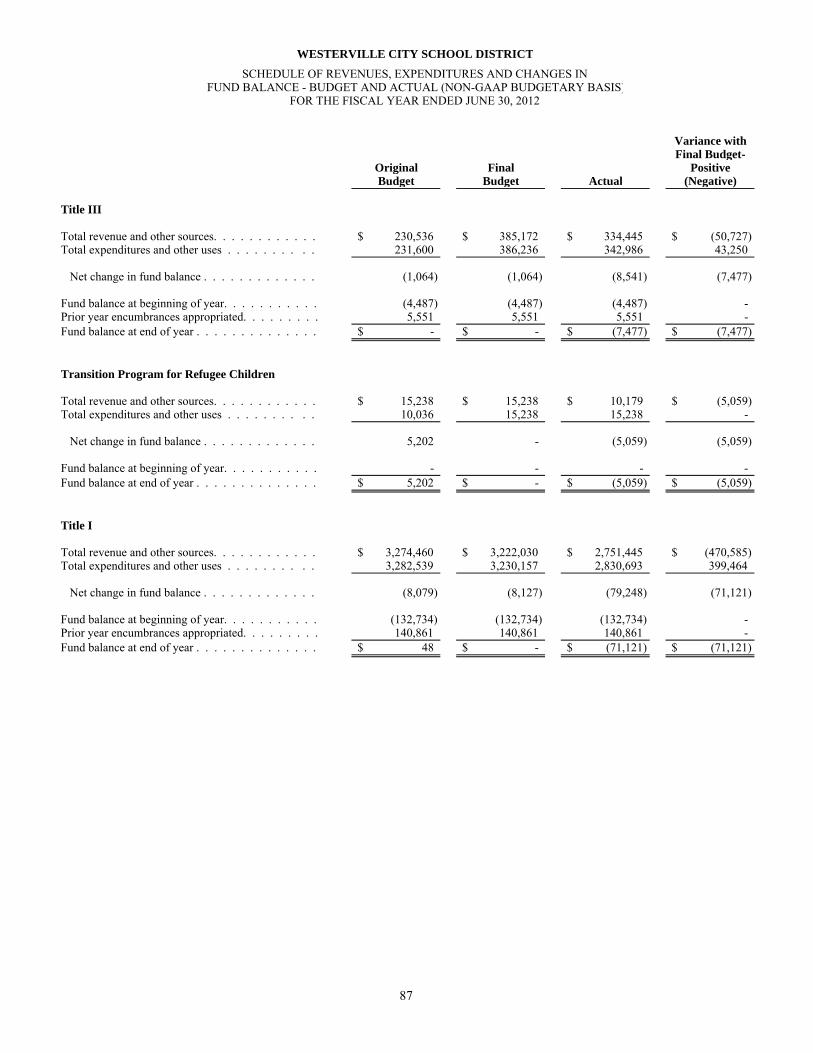
Variance withFinal Budget-
Original Final PositiveBudget Budget Actual (Negative)
Title III
Total revenue and other sources. . . . . . . . . . . . 230,536$ 385,172$ 334,445$ (50,727)$ Total expenditures and other uses . . . . . . . . . . 231,600 386,236 342,986 43,250
Net change in fund balance . . . . . . . . . . . . . (1,064) (1,064) (8,541) (7,477)
Fund balance at beginning of year. . . . . . . . . . . (4,487) (4,487) (4,487) - Prior year encumbrances appropriated. . . . . . . . . 5,551 5,551 5,551 - Fund balance at end of year . . . . . . . . . . . . . . -$ -$ (7,477)$ (7,477)$
Transition Program for Refugee Children
Total revenue and other sources. . . . . . . . . . . . 15,238$ 15,238$ 10,179$ (5,059)$ Total expenditures and other uses . . . . . . . . . . 10,036 15,238 15,238 -
Net change in fund balance . . . . . . . . . . . . . 5,202 - (5,059) (5,059)
Fund balance at beginning of year. . . . . . . . . . . - - - - Fund balance at end of year . . . . . . . . . . . . . . 5,202$ -$ (5,059)$ (5,059)$
Title I
Total revenue and other sources. . . . . . . . . . . . 3,274,460$ 3,222,030$ 2,751,445$ (470,585)$ Total expenditures and other uses . . . . . . . . . . 3,282,539 3,230,157 2,830,693 399,464
Net change in fund balance . . . . . . . . . . . . . (8,079) (8,127) (79,248) (71,121)
Fund balance at beginning of year. . . . . . . . . . . (132,734) (132,734) (132,734) - Prior year encumbrances appropriated. . . . . . . . . 140,861 140,861 140,861 - Fund balance at end of year . . . . . . . . . . . . . . 48$ -$ (71,121)$ (71,121)$
FOR THE FISCAL YEAR ENDED JUNE 30, 2012
WESTERVILLE CITY SCHOOL DISTRICT
SCHEDULE OF REVENUES, EXPENDITURES AND CHANGES INFUND BALANCE - BUDGET AND ACTUAL (NON-GAAP BUDGETARY BASIS)
87
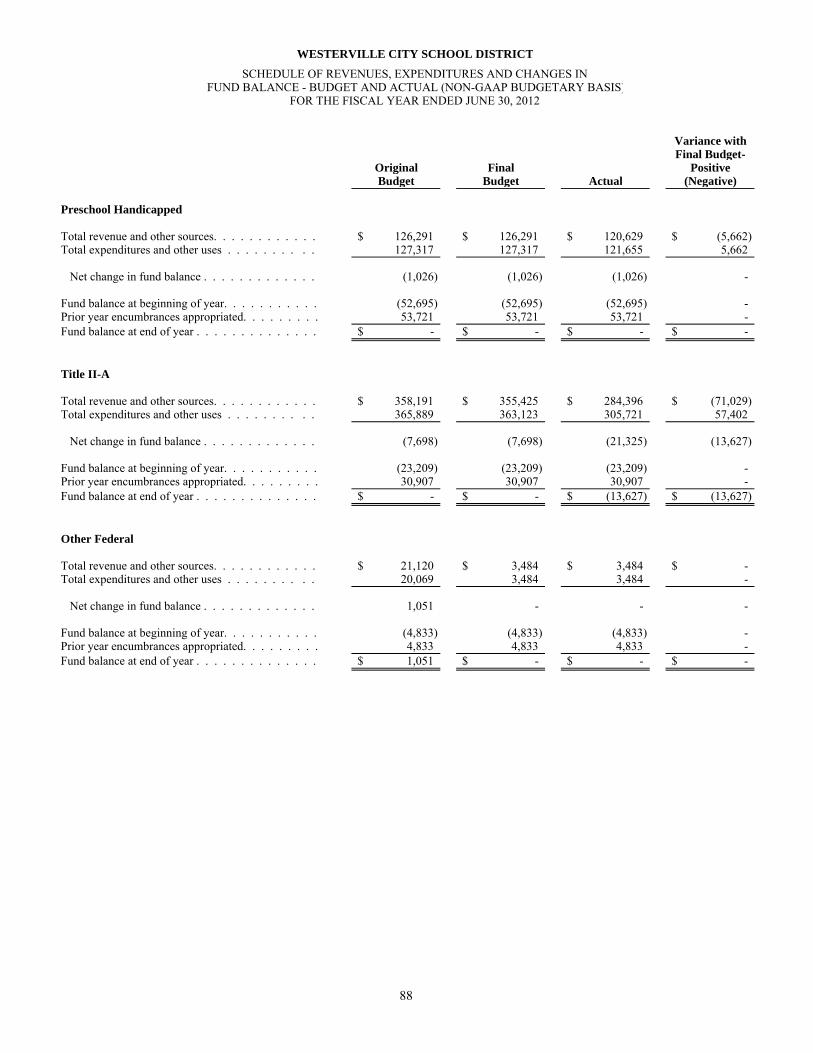
Variance withFinal Budget-
Original Final PositiveBudget Budget Actual (Negative)
Preschool Handicapped
Total revenue and other sources. . . . . . . . . . . . 126,291$ 126,291$ 120,629$ (5,662)$ Total expenditures and other uses . . . . . . . . . . 127,317 127,317 121,655 5,662
Net change in fund balance . . . . . . . . . . . . . (1,026) (1,026) (1,026) -
Fund balance at beginning of year. . . . . . . . . . . (52,695) (52,695) (52,695) - Prior year encumbrances appropriated. . . . . . . . . 53,721 53,721 53,721 - Fund balance at end of year . . . . . . . . . . . . . . -$ -$ -$ -$
Title II-A
Total revenue and other sources. . . . . . . . . . . . 358,191$ 355,425$ 284,396$ (71,029)$ Total expenditures and other uses . . . . . . . . . . 365,889 363,123 305,721 57,402
Net change in fund balance . . . . . . . . . . . . . (7,698) (7,698) (21,325) (13,627)
Fund balance at beginning of year. . . . . . . . . . . (23,209) (23,209) (23,209) - Prior year encumbrances appropriated. . . . . . . . . 30,907 30,907 30,907 - Fund balance at end of year . . . . . . . . . . . . . . -$ -$ (13,627)$ (13,627)$
Other Federal
Total revenue and other sources. . . . . . . . . . . . 21,120$ 3,484$ 3,484$ -$ Total expenditures and other uses . . . . . . . . . . 20,069 3,484 3,484 -
Net change in fund balance . . . . . . . . . . . . . 1,051 - - -
Fund balance at beginning of year. . . . . . . . . . . (4,833) (4,833) (4,833) - Prior year encumbrances appropriated. . . . . . . . . 4,833 4,833 4,833 - Fund balance at end of year . . . . . . . . . . . . . . 1,051$ -$ -$ -$
FOR THE FISCAL YEAR ENDED JUNE 30, 2012
WESTERVILLE CITY SCHOOL DISTRICT
SCHEDULE OF REVENUES, EXPENDITURES AND CHANGES INFUND BALANCE - BUDGET AND ACTUAL (NON-GAAP BUDGETARY BASIS)
88

WESTERVILLE CITY SCHOOL DISTRICTINTERNAL SERVICE FUNDS
Self Insurance
Print Shop
Worker's Compensation
This fund is used to account for monies received from other funds as payment for providing Worker's Compensation benefits toemployees.
This fund is used to account for monies received for printing and duplicating services provided by the Print Shop to all Dsitrictdepartments and various community organizations.
A fund provided to account for monies received from other funds as payment for providing medical and dental employee benefits.The District's self-funded health and dental plans are currently inactive as indicated in Note 17 to the financial statements. The SelfInsurance Fund may make payments for services provided to employees, for reimbursement to employees who have paidproviders, to third party administrators for claim payment administration, for stop-loss coverage, or any other reinsurance orsimilar purposes.
Internal Service Funds are established to account for the financing of goods or services provided by one department or agency ofthe District to other departments or agencies on a cost reimbursement basis. Charges are intended only to recoup the total cost ofsuch services. A description of the District's Internal Service Funds follows:
89
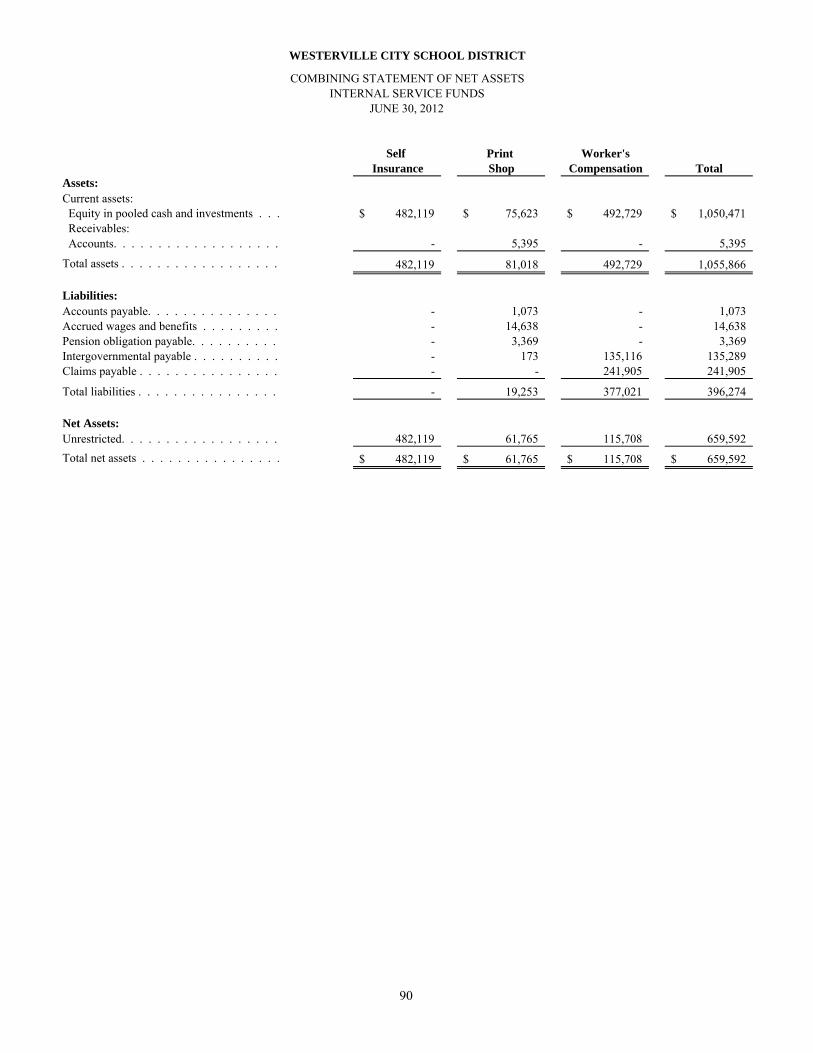
Self Print Worker'sInsurance Shop Compensation Total
Assets:Current assets: Equity in pooled cash and investments . . . 482,119$ 75,623$ 492,729$ 1,050,471$ Receivables: Accounts. . . . . . . . . . . . . . . . . . . - 5,395 - 5,395
Total assets . . . . . . . . . . . . . . . . . . 482,119 81,018 492,729 1,055,866
Liabilities:Accounts payable. . . . . . . . . . . . . . . - 1,073 - 1,073 Accrued wages and benefits . . . . . . . . . - 14,638 - 14,638 Pension obligation payable. . . . . . . . . . - 3,369 - 3,369 Intergovernmental payable . . . . . . . . . . - 173 135,116 135,289 Claims payable . . . . . . . . . . . . . . . . - - 241,905 241,905
Total liabilities . . . . . . . . . . . . . . . . - 19,253 377,021 396,274
Net Assets:Unrestricted. . . . . . . . . . . . . . . . . . 482,119 61,765 115,708 659,592 Total net assets . . . . . . . . . . . . . . . . 482,119$ 61,765$ 115,708$ 659,592$
JUNE 30, 2012
WESTERVILLE CITY SCHOOL DISTRICT
COMBINING STATEMENT OF NET ASSETSINTERNAL SERVICE FUNDS
90

Self Print Worker'sInsurance Shop Compensation Total
Operating revenues:Charges for services . . . . . . . . . . . . 483,663$ 266,279$ 672,257$ 1,422,199$
Total operating revenues . . . . . . . . . . 483,663 266,279 672,257 1,422,199
Operating expenses:Wages and benefits . . . . . . . . . . . . . - 102,540 - 102,540 Purchased services. . . . . . . . . . . . . . - 1,073 645,826 646,899 Materials and supplies . . . . . . . . . . . . 9,139 182,328 - 191,467
Total operating expenses. . . . . . . . . . . 9,139 285,941 645,826 940,906
Operating income. . . . . . . . . . . . . . . 474,524 (19,662) 26,431 481,293
Non-operating revenues: Investment income . . . . . . . . . . . . . . - - 295 295
Total non-operating revenues. . . . . . . . . - - 295 295
Change in net assets. . . . . . . . . . . . . . 474,524 (19,662) 26,726 481,588
Net assets at beginning of year . . . . . . . 7,595 81,427 88,982 178,004
Net assets at end of year. . . . . . . . . . . 482,119$ 61,765$ 115,708$ 659,592$
INTERNAL SERVICE FUNDSFOR THE FISCAL YEAR ENDED JUNE 30, 2012
WESTERVILLE CITY SCHOOL DISTRICT
COMBINING STATEMENT OF REVENUES, EXPENSES,AND CHANGES IN NET ASSETS
91
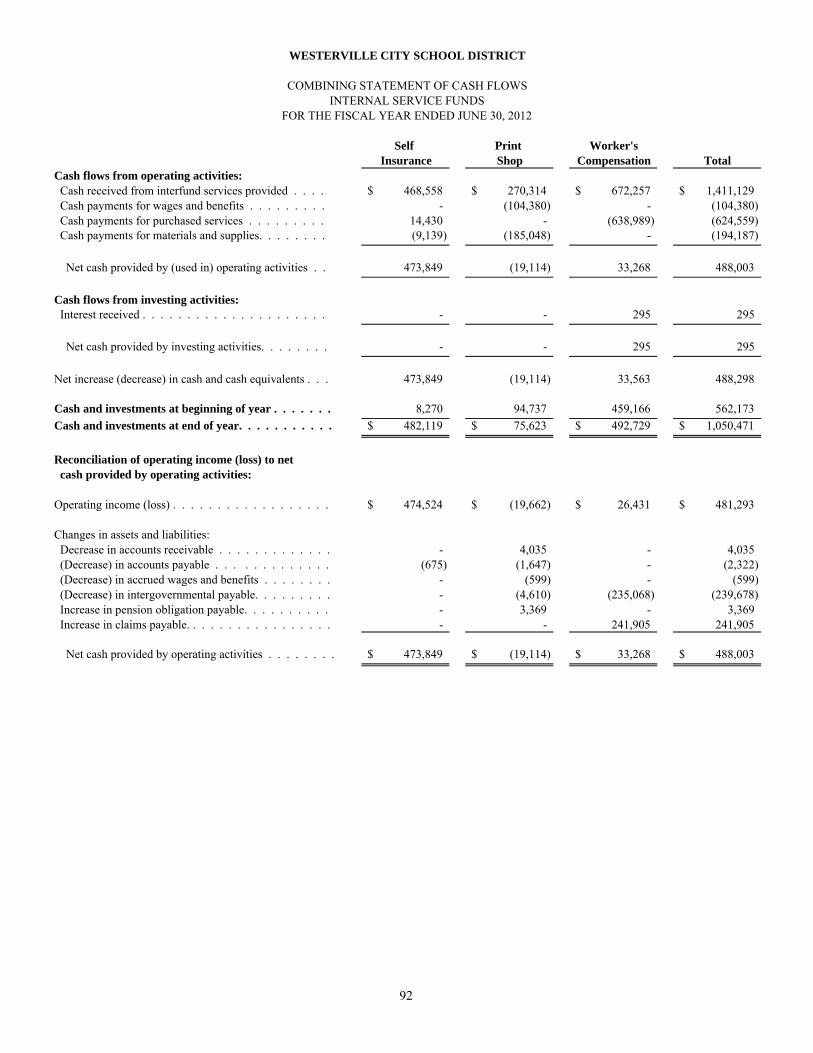
Self Print Worker'sInsurance Shop Compensation Total
Cash flows from operating activities: Cash received from interfund services provided . . . . 468,558$ 270,314$ 672,257$ 1,411,129$ Cash payments for wages and benefits . . . . . . . . . - (104,380) - (104,380) Cash payments for purchased services . . . . . . . . . 14,430 - (638,989) (624,559) Cash payments for materials and supplies. . . . . . . . (9,139) (185,048) - (194,187)
Net cash provided by (used in) operating activities . . 473,849 (19,114) 33,268 488,003
Cash flows from investing activities: Interest received . . . . . . . . . . . . . . . . . . . . . - - 295 295
Net cash provided by investing activities. . . . . . . . - - 295 295
Net increase (decrease) in cash and cash equivalents . . . 473,849 (19,114) 33,563 488,298
Cash and investments at beginning of year . . . . . . . 8,270 94,737 459,166 562,173 Cash and investments at end of year. . . . . . . . . . . 482,119$ 75,623$ 492,729$ 1,050,471$
Reconciliation of operating income (loss) to net cash provided by operating activities:
Operating income (loss) . . . . . . . . . . . . . . . . . . 474,524$ (19,662)$ 26,431$ 481,293$
Changes in assets and liabilities: Decrease in accounts receivable . . . . . . . . . . . . . - 4,035 - 4,035 (Decrease) in accounts payable . . . . . . . . . . . . . (675) (1,647) - (2,322) (Decrease) in accrued wages and benefits . . . . . . . . - (599) - (599) (Decrease) in intergovernmental payable. . . . . . . . . - (4,610) (235,068) (239,678) Increase in pension obligation payable. . . . . . . . . . - 3,369 - 3,369 Increase in claims payable. . . . . . . . . . . . . . . . . - - 241,905 241,905
Net cash provided by operating activities . . . . . . . . 473,849$ (19,114)$ 33,268$ 488,003$
FOR THE FISCAL YEAR ENDED JUNE 30, 2012
WESTERVILLE CITY SCHOOL DISTRICT
COMBINING STATEMENT OF CASH FLOWSINTERNAL SERVICE FUNDS
92
WESTERVILLE CITY SCHOOL DISTRICTAGENCY FUNDS
District Agency
Student Managed Activity
Section 125 Cafeteria Plan
This fund is used to account for deposits made by employees through payroll deductions who elect to use the plan as a medicalspending account or for dependent childcare. Employees have until the end of March of the following year to spend the monies intheir account. Any monies not spent become the property of the District. The District has determined it to be the best practice toretain the unspent monies from the prior years within this fund, to continue to finance the plan and to properly account for itsintended use.
Agency funds are established to account for assets held by the District on behalf of other individuals, staff or students. In anagency fund, assets equal liabilities, and the fund balance is zero. A description of the Agancy Funds follows:
A fund used to account for those assets held by a school district as an agency for individuals or staff.
This fund is used to account for those student activity programs which have student participation in the activity and have studentsinvolved in the management of the program. This typically includes those student activities which consist of student body, studentpresident, student treasurer and faculty advisor.
93
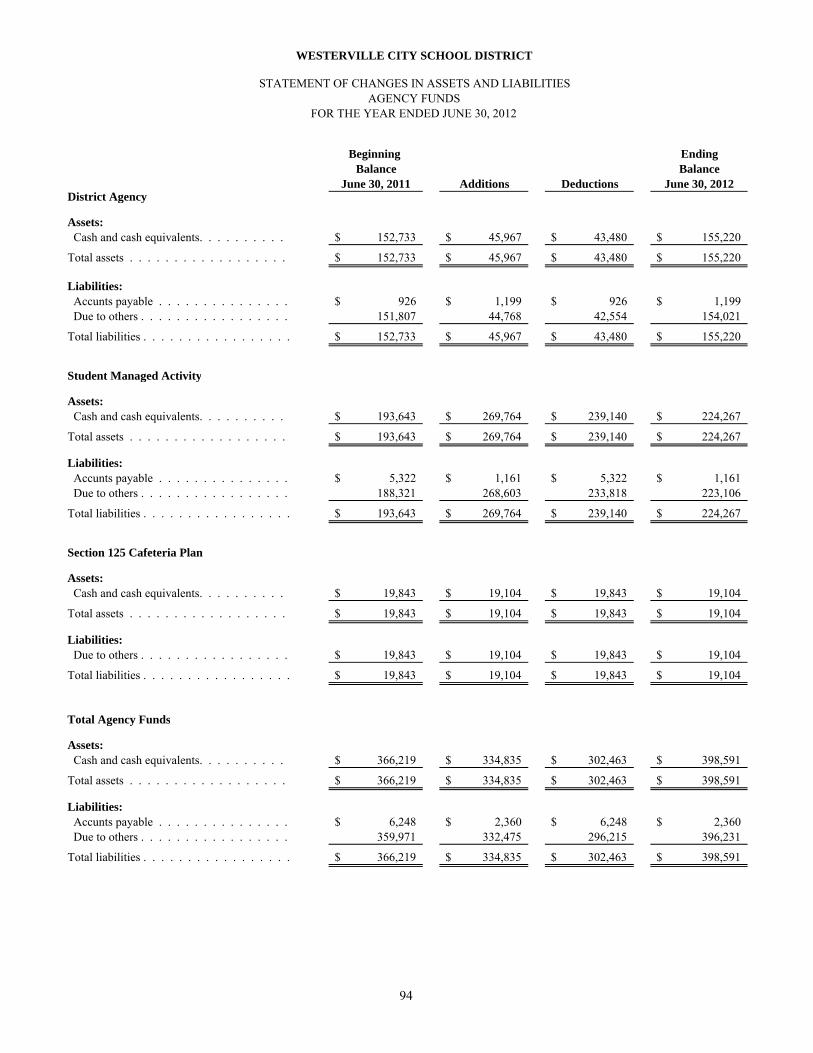
Beginning EndingBalance Balance
June 30, 2011 Additions Deductions June 30, 2012District Agency
Assets: Cash and cash equivalents. . . . . . . . . . 152,733$ 45,967$ 43,480$ 155,220$
Total assets . . . . . . . . . . . . . . . . . . 152,733$ 45,967$ 43,480$ 155,220$
Liabilities: Accunts payable . . . . . . . . . . . . . . . 926$ 1,199$ 926$ 1,199$ Due to others . . . . . . . . . . . . . . . . . 151,807 44,768 42,554 154,021
Total liabilities . . . . . . . . . . . . . . . . . 152,733$ 45,967$ 43,480$ 155,220$
Student Managed Activity
Assets: Cash and cash equivalents. . . . . . . . . . 193,643$ 269,764$ 239,140$ 224,267$
Total assets . . . . . . . . . . . . . . . . . . 193,643$ 269,764$ 239,140$ 224,267$
Liabilities: Accunts payable . . . . . . . . . . . . . . . 5,322$ 1,161$ 5,322$ 1,161$ Due to others . . . . . . . . . . . . . . . . . 188,321 268,603 233,818 223,106
Total liabilities . . . . . . . . . . . . . . . . . 193,643$ 269,764$ 239,140$ 224,267$
Section 125 Cafeteria Plan
Assets: Cash and cash equivalents. . . . . . . . . . 19,843$ 19,104$ 19,843$ 19,104$
Total assets . . . . . . . . . . . . . . . . . . 19,843$ 19,104$ 19,843$ 19,104$
Liabilities: Due to others . . . . . . . . . . . . . . . . . 19,843$ 19,104$ 19,843$ 19,104$
Total liabilities . . . . . . . . . . . . . . . . . 19,843$ 19,104$ 19,843$ 19,104$
Total Agency Funds
Assets: Cash and cash equivalents. . . . . . . . . . 366,219$ 334,835$ 302,463$ 398,591$
Total assets . . . . . . . . . . . . . . . . . . 366,219$ 334,835$ 302,463$ 398,591$
Liabilities: Accunts payable . . . . . . . . . . . . . . . 6,248$ 2,360$ 6,248$ 2,360$ Due to others . . . . . . . . . . . . . . . . . 359,971 332,475 296,215 396,231
Total liabilities . . . . . . . . . . . . . . . . . 366,219$ 334,835$ 302,463$ 398,591$
FOR THE YEAR ENDED JUNE 30, 2012
WESTERVILLE CITY SCHOOL DISTRICT
STATEMENT OF CHANGES IN ASSETS AND LIABILITIESAGENCY FUNDS
94
95
STATISTICAL SECTION This part of the Westerville City School District’s comprehensive annual financial report presents detailed information as a context for understanding what the information in the financial statements, note disclosures, and required supplementary information says about the District’s overall financial health. Contents Page Financial Trends 96 These schedules contain trend information to help the reader understand how the District’s financial performance and well-being have changed over time. Revenue Capacity 104 These schedules contain information to help the reader assess the affordability of the District’s most significant local revenue source, the property tax. Debt Capacity 108 These schedules present information to help the reader assess the affordability of the District’s current levels of outstanding debt and the District’s ability to issue additional debt in the future. Demographic and Economic Information 111 These schedules offer demographic and economic indicators to help the reader understand the environment within which the District’s financial activities take place. Operating Information 113
These schedules contain service data to help the reader understand how the information in the District’s financial report relates to the services the District provides and the activities it performs.
Sources: Unless otherwise noted, the information in these schedules is derived from the comprehensive annual financial reports for the relevant year.

Wes
terv
ille
Cit
y S
choo
l Dis
tric
tN
et A
sset
s by
Com
pone
ntL
ast T
en F
isca
l Yea
rs(a
ccru
al b
asis
of
acco
unti
ng)
2012
2011
2010
2009
2008
2007
2006
2005
2004
2003
Gov
ernm
enta
l act
ivit
ies
Inve
sted
in c
apit
al a
sset
s, n
et o
f re
late
d de
bt$4
8,78
8,49
4$4
6,26
0,20
4$5
0,78
2,10
0$4
7,77
4,04
2$4
4,98
6,76
4$4
0,84
5,62
8$3
5,23
1,18
7$3
1,40
8,92
4$3
3,40
9,50
1$3
1,49
2,20
2R
estr
icte
d18
,891
,453
17,5
35,8
8112
,385
,358
14,2
77,6
6815
,928
,778
13,8
34,8
3516
,606
,468
16,7
44,9
7211
,435
,146
9,60
2,81
4U
nres
tric
ted
17,3
35,5
4619
,853
,427
14,9
16,0
556,
060,
190
10,3
83,1
1712
,915
,770
6,18
2,25
43,
216,
719
(3,9
93,1
59)
4,13
5,47
2T
otal
gov
ernm
enta
l act
ivit
ies
net a
sset
s$8
5,01
5,49
3$8
3,64
9,51
2$7
8,08
3,51
3$6
8,11
1,90
0$7
1,29
8,65
9$6
7,59
6,23
3$5
8,01
9,90
9$5
1,37
0,61
5$4
0,85
1,48
8$4
5,23
0,48
8
Sou
rce:
Sch
ool d
istr
ict f
inan
cial
rec
ords
96

Wes
terv
ille
Cit
y S
choo
l Dis
tric
tC
hang
e in
Net
Ass
ets
Las
t Ten
Fis
cal Y
ears
(acc
rual
bas
is o
f ac
coun
ting
)
2012
2011
2010
2009
2008
2007
2006
2005
2004
2003
Exp
ense
s:G
over
nmen
tal a
ctiv
itie
s:In
stru
ctio
nR
egul
ar$7
7,03
8,15
2$6
9,98
3,17
2$6
9,46
3,57
8$6
7,44
9,75
4$6
5,45
6,07
0$6
2,93
1,90
8$5
8,99
9,13
3$5
8,55
6,13
0$6
1,66
9,86
5$5
2,09
0,73
6S
peci
al22
,144
,035
23,7
47,9
0121
,153
,825
21,7
88,8
4119
,601
,737
17,7
08,5
3415
,871
,474
13,8
19,9
6612
,162
,246
10,3
30,1
95V
ocat
iona
l25
2,32
891
5,47
754
8,89
159
3,15
767
8,72
262
4,81
052
6,25
440
4,29
92,
266,
230
2,55
0,80
6O
ther
inst
ruct
ion
855,
741
4,97
0,33
44,
568,
165
4,55
8,04
23,
482,
504
3,12
6,17
02,
438,
333
2,33
7,01
81,
835,
688
1,65
6,43
4S
uppo
rt s
ervi
ces
Pup
ils
12,3
20,4
7612
,816
,822
11,3
40,9
9611
,253
,575
10,3
63,6
709,
526,
679
8,68
1,92
28,
100,
767
7,60
1,62
76,
443,
665
Sta
ff
9,13
3,13
26,
401,
728
5,24
2,39
45,
541,
038
4,60
3,91
34,
291,
972
4,03
1,85
24,
055,
364
4,43
1,09
44,
826,
578
Gen
eral
adm
inis
trat
ion
1,42
4,00
31,
728,
752
1,65
1,41
61,
456,
641
1,53
6,81
81,
610,
376
1,40
4,57
31,
413,
567
1,44
5,68
11,
397,
792
Sch
ool a
dmin
istr
atio
n12
,508
,555
11,8
88,6
0811
,245
,165
10,7
91,2
8310
,033
,797
9,30
9,73
39,
419,
003
8,42
2,10
78,
383,
725
9,24
9,70
6F
isca
l ser
vice
s2,
628,
335
2,80
4,65
02,
625,
949
1,63
2,21
92,
417,
545
2,30
4,47
91,
874,
309
1,90
9,42
51,
515,
452
1,76
0,51
1B
usin
ess
serv
ices
818,
150
1,20
4,08
395
2,09
798
8,94
41,
000,
857
1,87
3,82
41,
635,
460
1,49
6,59
31,
104,
154
1,24
9,15
9O
pera
tion
& m
aint
enan
ce12
,980
,201
16,0
24,9
9214
,131
,404
13,6
24,0
3413
,857
,342
13,6
21,6
0511
,689
,529
11,6
52,3
3410
,977
,422
10,6
14,1
95S
tude
nt tr
ansp
orta
tion
8,81
6,14
98,
815,
697
8,47
3,89
77,
987,
307
7,40
1,67
46,
921,
601
6,59
6,26
86,
196,
437
5,77
1,95
25,
671,
020
Cen
tral
ser
vice
s2,
392,
018
2,73
1,95
83,
553,
586
3,51
4,15
72,
459,
665
1,44
6,37
51,
398,
019
1,02
2,33
61,
144,
924
1,73
8,58
2F
ood
serv
ice
oper
atio
ns4,
540,
831
4,49
8,89
74,
262,
060
4,12
0,88
54,
091,
536
4,12
9,34
63,
796,
039
3,41
1,07
13,
572,
551
3,33
1,47
5C
omm
unit
y se
rvic
es1,
081,
274
1,04
8,00
298
5,40
41,
190,
109
873,
719
984,
663
673,
863
897,
810
690,
830
649,
801
Ext
ra-c
urri
cula
r ac
tivi
ties
3,33
3,92
63,
320,
713
3,15
6,52
02,
888,
932
2,84
5,87
22,
652,
863
2,55
0,71
52,
357,
322
2,78
8,68
62,
024,
729
Inte
rest
and
fis
cal c
harg
es4,
592,
392
5,62
7,15
55,
665,
429
5,56
6,38
75,
780,
535
5,90
2,82
26,
258,
362
6,41
2,72
95,
788,
941
7,08
6,26
2T
otal
gov
ernm
enta
l act
ivit
ies
expe
nses
176,
859,
698
178,
528,
941
169,
020,
776
164,
945,
305
156,
485,
976
148,
967,
760
137,
845,
108
132,
465,
275
133,
151,
068
122,
671,
646
Sou
rce:
Sch
ool d
istr
ict f
inan
cial
rec
ords
97

Westerville City School DistrictChange in Net Assets, continued Last Ten Fiscal Years(accrual basis of accounting)
2012 2011 2010 2009 2008Program revenuesGovernmental activities:Charges for services and sales
InstructionRegular $1,330,006 $1,377,360 $1,283,750 $1,283,887 $1,307,979Special 384,891 302,016 405,395 196,923 191,520Pupil 285,892 - - - -Operations and maintenance 620,748 - - - -
Food service 2,286,224 2,755,355 2,757,264 2,799,032 2,752,314Extra-curricular activities 1,216,395 1,488,255 1,410,889 1,355,317 1,331,796
Operating grants and contributions 13,775,709 10,502,282 9,498,432 7,869,476 7,086,656Capital grants and contributions 3,800 - - - -Total governmental activities
program revenues 19,903,665 16,425,268 15,355,730 13,504,635 12,670,265
Net (expense)/revenueGovernmental activities ($156,956,033) ($162,103,673) ($153,665,046) ($151,440,670) ($143,815,711)
General revenues and other changesin net assets
Governmental activities:Property taxes levied for:
General purposes $93,253,033 $97,182,551 $92,703,533 $80,868,900 $78,858,985Debt service 8,098,833 8,092,890 10,695,455 10,612,532 9,537,826Capital projects 8,102,942 7,539,296 5,273,876 5,290,857 5,208,015
Grants and entitlements not restricted to specific programs 45,138,161 52,556,276 52,929,017 49,181,194 47,212,653
Insurance recoveries - - - - 3,438,753Payment in lieu of taxes 2,385,150 1,279,078 1,117,132 974,418 680,171Investment income 35,235 87,739 54,648 459,231 1,432,458Loss on sale of capital assets - - - - Miscellaneous 374,973 931,842 862,998 866,779 759,064Win-Win settlement 933,687 - - - -
Total governmental activities 158,322,014 167,669,672 163,636,659 148,253,911 147,127,925
Change in net assetsGovernmental activities $1,365,981 $5,565,999 $9,971,613 ($3,186,759) $3,312,214
Source: School district financial records
98

2007 2006 2005 2004 2003Program revenuesGovernmental activities:Charges for services and sales
InstructionRegular $1,781,314 $1,532,562 $1,226,651 $1,168,628 $1,009,760Special 67,226 30,487 41,937 21,623 8,400Pupil - - - - -Operations and maintenance - - - - -
Food service 2,739,899 2,748,022 2,754,240 2,744,280 2,713,577Extra-curricular activities 1,219,200 1,560,020 1,866,271 1,065,844 940,944
Operating grants and contributions 6,639,262 6,400,235 6,327,386 5,397,703 4,825,747Capital grants and contributions - - - 319,871 6,547Total governmental activities
program revenues 12,446,901 12,271,326 12,216,485 10,717,949 9,504,975
Net (expense)/revenueGovernmental activities ($136,520,859) ($125,573,782) ($120,248,790) ($122,433,119) ($113,166,671)
General revenues and other changesin net assets
Governmental activities:Property taxes levied for:
General purposes $82,850,463 $70,312,884 $69,808,534 $58,753,446 $56,040,935Debt service 10,092,937 10,310,165 11,008,652 10,796,918 9,699,373Capital projects 5,400,744 5,577,545 5,335,310 4,308,694 3,938,029
Grants and entitlements not restricted to specific programs 44,906,266 43,015,156 43,063,290 42,954,970 40,769,790
Insurance recoveries - - - - - Payment in lieu of taxes - - - - - Investment income 1,785,049 1,288,592 757,239 402,890 1,397,004Loss on sale of capital assets - - (45,647) - - Miscellaneous 1,322,802 1,718,734 840,539 848,547 981,987Win-Win settlement - - - - -
Total governmental activities 146,358,261 132,223,076 130,767,917 118,065,465 112,827,118
Change in net assetsGovernmental activities $9,837,402 $6,649,294 $10,519,127 ($4,367,654) ($339,553)
99
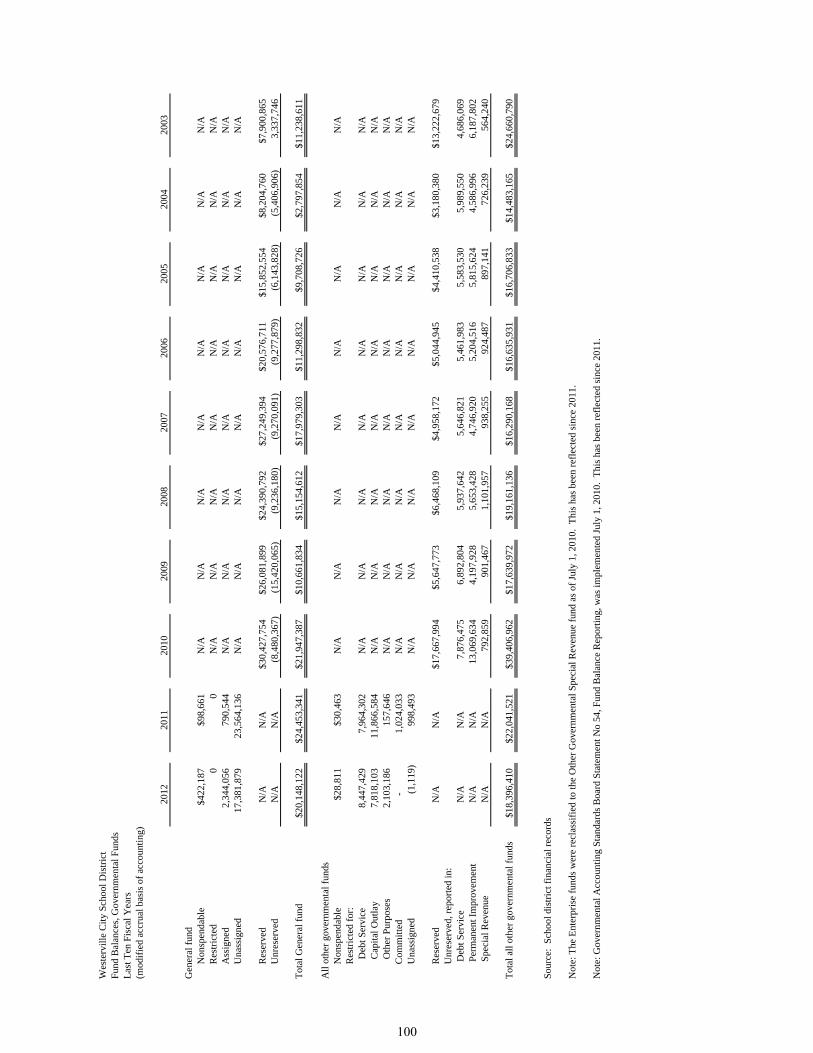
Wes
terv
ille
Cit
y S
choo
l Dis
tric
tF
und
Bal
ance
s, G
over
nmen
tal F
unds
Las
t Ten
Fis
cal Y
ears
(mod
ifie
d ac
crua
l bas
is o
f ac
coun
ting
)
2012
2011
2010
2009
2008
2007
2006
2005
2004
2003
Gen
eral
fun
dN
onsp
enda
ble
$422
,187
$98,
661
N/A
N/A
N/A
N/A
N/A
N/A
N/A
N/A
Res
tric
ted
00
N/A
N/A
N/A
N/A
N/A
N/A
N/A
N/A
Ass
igne
d2,
344,
056
790,
544
N/A
N/A
N/A
N/A
N/A
N/A
N/A
N/A
Una
ssig
ned
17,3
81,8
7923
,564
,136
N/A
N/A
N/A
N/A
N/A
N/A
N/A
N/A
Res
erve
dN
/AN
/A$3
0,42
7,75
4$2
6,08
1,89
9$2
4,39
0,79
2$2
7,24
9,39
4$2
0,57
6,71
1$1
5,85
2,55
4$8
,204
,760
$7,9
00,8
65U
nres
erve
dN
/AN
/A(8
,480
,367
)(1
5,42
0,06
5)(9
,236
,180
)(9
,270
,091
)(9
,277
,879
)(6
,143
,828
)(5
,406
,906
)3,
337,
746
Tot
al G
ener
al f
und
$20,
148,
122
$24,
453,
341
$21,
947,
387
$10,
661,
834
$15,
154,
612
$17,
979,
303
$11,
298,
832
$9,7
08,7
26$2
,797
,854
$11,
238,
611
All
oth
er g
over
nmen
tal f
unds
Non
spen
dabl
e$2
8,81
1$3
0,46
3N
/AN
/AN
/AN
/AN
/AN
/AN
/AN
/AR
estr
icte
d fo
r: D
ebt S
ervi
ce8,
447,
429
7,96
4,30
2N
/AN
/AN
/AN
/AN
/AN
/AN
/AN
/A C
apit
al O
utla
y7,
818,
103
11,8
66,5
84N
/AN
/AN
/AN
/AN
/AN
/AN
/AN
/A O
ther
Pur
pose
s2,
103,
186
157,
646
N/A
N/A
N/A
N/A
N/A
N/A
N/A
N/A
Com
mit
ted
-1,
024,
033
N/A
N/A
N/A
N/A
N/A
N/A
N/A
N/A
Una
ssig
ned
(1,1
19)
998,
493
N/A
N/A
N/A
N/A
N/A
N/A
N/A
N/A
Res
erve
dN
/AN
/A$1
7,66
7,99
4$5
,647
,773
$6,4
68,1
09$4
,958
,172
$5,0
44,9
45$4
,410
,538
$3,1
80,3
80$1
3,22
2,67
9U
nres
erve
d, r
epor
ted
in:
Deb
t Ser
vice
N/A
N/A
7,87
6,47
56,
892,
804
5,93
7,64
25,
646,
821
5,46
1,98
35,
583,
530
5,98
9,55
04,
686,
069
Per
man
ent I
mpr
ovem
ent
N/A
N/A
13,0
69,6
344,
197,
928
5,65
3,42
84,
746,
920
5,20
4,51
65,
815,
624
4,58
6,99
66,
187,
802
Spe
cial
Rev
enue
N/A
N/A
792,
859
901,
467
1,10
1,95
793
8,25
592
4,48
789
7,14
172
6,23
956
4,24
0
Tot
al a
ll o
ther
gov
ernm
enta
l fun
ds$1
8,39
6,41
0$2
2,04
1,52
1$3
9,40
6,96
2$1
7,63
9,97
2$1
9,16
1,13
6$1
6,29
0,16
8$1
6,63
5,93
1$1
6,70
6,83
3$1
4,48
3,16
5$2
4,66
0,79
0
Sou
rce:
Sch
ool d
istr
ict f
inan
cial
rec
ords
Not
e: T
he E
nter
pris
e fu
nds
wer
e re
clas
sifi
ed to
the
Oth
er G
over
nmen
tal S
peci
al R
even
ue f
und
as o
f Ju
ly 1
, 201
0. T
his
has
been
ref
lect
ed s
ince
201
1.
Not
e: G
over
nmen
tal A
ccou
ntin
g S
tand
ards
Boa
rd S
tate
men
t No
54, F
und
Bal
ance
Rep
orti
ng, w
as im
plem
ente
d Ju
ly 1
, 201
0. T
his
has
been
ref
lect
ed s
ince
201
1.
100

101
Westerville City School District
Westerville, Ohio
(This page left intentionally blank)

Westerville City School DistrictChanges in Fund Balances, Governmental FundsLast Ten Fiscal Years(modified accrual basis of accounting)
2012 2011 2010 2009 2008Revenues:From local sources
Taxes $108,880,413 $112,396,958 $108,538,581 $96,035,461 $93,041,686Extracurricular 1,480,081 1,488,255 1,410,889 1,355,317 1,331,796Tuition and fees 1,145,130 1,679,376 1,448,710 1,241,502 1,260,389Customer sales and services 2,283,149 2,755,355 N/A N/A N/AInvestment income 35,657 87,187 53,787 435,765 1,364,612
Payment in lieu of taxes 2,385,150 1,279,078 1,117,132 974,418 680,171Intergovernmental - state 48,531,131 51,597,664 51,330,484 50,719,372 48,774,564Intergovernmental - federal 9,819,993 11,952,761 8,627,884 4,791,082 4,180,663Other revenue 1,814,913 1,048,321 896,921 918,238 789,189
Total revenues 176,375,617 184,284,955 173,424,388 156,471,155 151,423,070
Expenditures:Instructional
Regular 71,201,427 66,458,161 66,266,194 64,155,120 58,719,818Special 20,784,931 22,876,833 20,453,616 20,884,904 18,651,131Vocational 212,194 888,488 523,561 567,680 644,768Other 840,636 4,807,010 4,401,401 4,397,956 3,330,470
Support ServicesPupils 12,299,051 12,869,176 11,270,648 11,175,462 10,304,731Staff 9,085,119 6,349,461 5,298,758 5,528,096 4,627,808General administration 1,424,110 1,728,431 1,651,416 1,456,641 1,536,818School administration 11,299,484 11,323,936 10,825,911 10,201,514 9,648,630Fiscal services 2,620,580 2,793,321 2,948,045 1,629,092 2,399,553Business services 860,314 1,174,471 903,218 953,696 969,238Operation & maintenance 12,927,669 15,635,931 13,878,489 13,414,960 13,742,638Student transportation 8,183,791 8,331,020 7,947,634 7,436,535 6,969,000Central services 2,322,652 2,384,339 2,422,504 3,435,033 2,276,147Food service operations 4,498,250 4,455,617 600 1,500 23,650Community services 978,110 1,055,554 982,797 1,175,295 872,641Extra-curricular activities 3,152,392 3,194,118 2,998,384 2,819,478 2,771,679
Capital outlay 10,212,668 20,716,089 1,947,983 2,877,972 6,848,222Debt Service:
Principal retirement 6,535,000 7,660,000 7,095,000 5,700,000 5,580,000Interest 4,887,569 5,178,619 4,420,045 4,674,163 4,898,604
Total expenditures 184,325,947 199,880,575 166,236,204 162,485,097 154,815,546
Excess (deficiency) of revenues over (under) expenditures (7,950,330) (15,595,620) 7,188,184 (6,013,942) (3,392,476)
Other financing sources (uses):Proceeds from refunding bonds - - - - - Premium on issuance of bonds - - - - - Payment to bond agent - - - - - Tax Anticipation Notes issued - - 24,415,000 - - Premium on tax anticipation notes - - 1,488,342 - - Transfers in 2,980,338 467,959 2,687,736 - - Transfers out (2,980,338) (467,959) (2,726,719) - - Insurance recoveries - - - - 3,438,753
Total other financing sources (uses) - - 25,864,359 - 3,438,753
Net change in fund balances ($7,950,330) ($15,595,620) $33,052,543 ($6,013,942) $46,277
Debt service as a percentage of noncapital expenditures 6.56% 7.17% 7.01% 6.50% 6.95%
Source: School district financial records
Note: The Enterprise funds were reclassified to the Other Governmental Special Revenue fund as of July 1, 2010. This has been reflected since 2011.
102
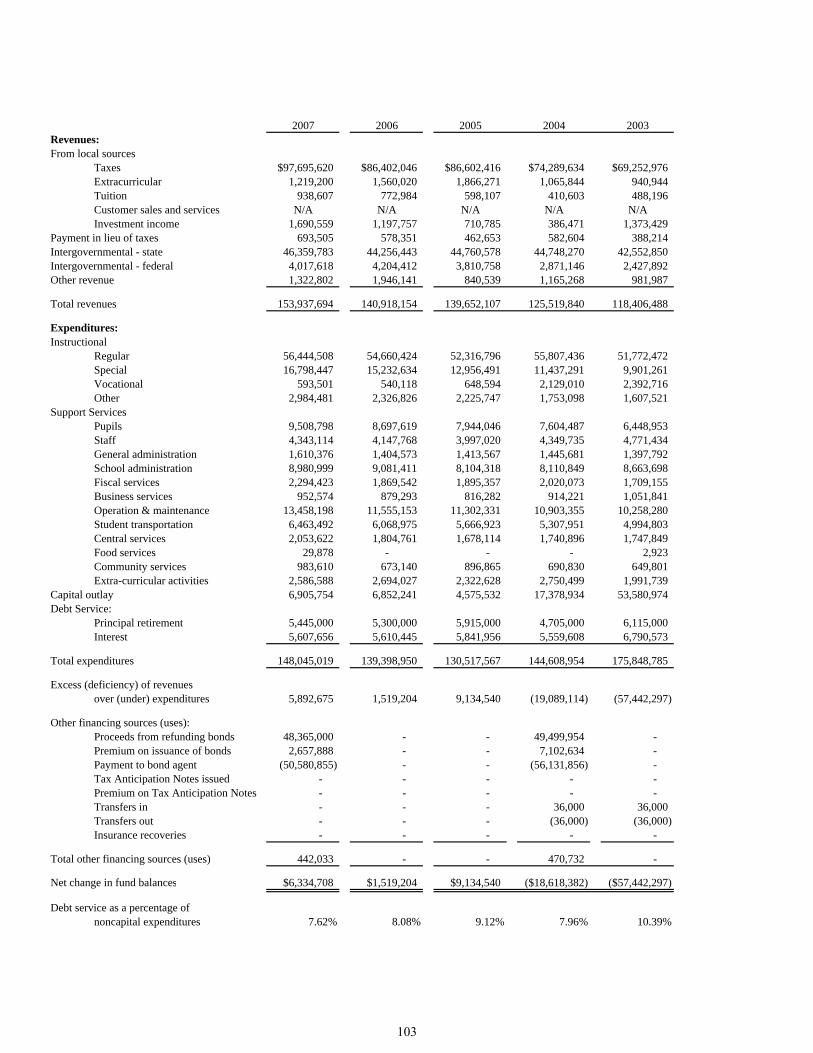
2007 2006 2005 2004 2003Revenues:From local sources
Taxes $97,695,620 $86,402,046 $86,602,416 $74,289,634 $69,252,976Extracurricular 1,219,200 1,560,020 1,866,271 1,065,844 940,944Tuition 938,607 772,984 598,107 410,603 488,196Customer sales and services N/A N/A N/A N/A N/AInvestment income 1,690,559 1,197,757 710,785 386,471 1,373,429
Payment in lieu of taxes 693,505 578,351 462,653 582,604 388,214Intergovernmental - state 46,359,783 44,256,443 44,760,578 44,748,270 42,552,850Intergovernmental - federal 4,017,618 4,204,412 3,810,758 2,871,146 2,427,892Other revenue 1,322,802 1,946,141 840,539 1,165,268 981,987
Total revenues 153,937,694 140,918,154 139,652,107 125,519,840 118,406,488
Expenditures:Instructional
Regular 56,444,508 54,660,424 52,316,796 55,807,436 51,772,472Special 16,798,447 15,232,634 12,956,491 11,437,291 9,901,261Vocational 593,501 540,118 648,594 2,129,010 2,392,716Other 2,984,481 2,326,826 2,225,747 1,753,098 1,607,521
Support ServicesPupils 9,508,798 8,697,619 7,944,046 7,604,487 6,448,953Staff 4,343,114 4,147,768 3,997,020 4,349,735 4,771,434General administration 1,610,376 1,404,573 1,413,567 1,445,681 1,397,792School administration 8,980,999 9,081,411 8,104,318 8,110,849 8,663,698Fiscal services 2,294,423 1,869,542 1,895,357 2,020,073 1,709,155Business services 952,574 879,293 816,282 914,221 1,051,841Operation & maintenance 13,458,198 11,555,153 11,302,331 10,903,355 10,258,280Student transportation 6,463,492 6,068,975 5,666,923 5,307,951 4,994,803Central services 2,053,622 1,804,761 1,678,114 1,740,896 1,747,849Food services 29,878 - - - 2,923Community services 983,610 673,140 896,865 690,830 649,801Extra-curricular activities 2,586,588 2,694,027 2,322,628 2,750,499 1,991,739
Capital outlay 6,905,754 6,852,241 4,575,532 17,378,934 53,580,974Debt Service:
Principal retirement 5,445,000 5,300,000 5,915,000 4,705,000 6,115,000Interest 5,607,656 5,610,445 5,841,956 5,559,608 6,790,573
Total expenditures 148,045,019 139,398,950 130,517,567 144,608,954 175,848,785
Excess (deficiency) of revenues over (under) expenditures 5,892,675 1,519,204 9,134,540 (19,089,114) (57,442,297)
Other financing sources (uses):Proceeds from refunding bonds 48,365,000 - - 49,499,954 - Premium on issuance of bonds 2,657,888 - - 7,102,634 - Payment to bond agent (50,580,855) - - (56,131,856) - Tax Anticipation Notes issued - - - - - Premium on Tax Anticipation Notes - - - - - Transfers in - - - 36,000 36,000Transfers out - - - (36,000) (36,000)Insurance recoveries - - - - -
Total other financing sources (uses) 442,033 - - 470,732 -
Net change in fund balances $6,334,708 $1,519,204 $9,134,540 ($18,618,382) ($57,442,297)
Debt service as a percentage of noncapital expenditures 7.62% 8.08% 9.12% 7.96% 10.39%
103
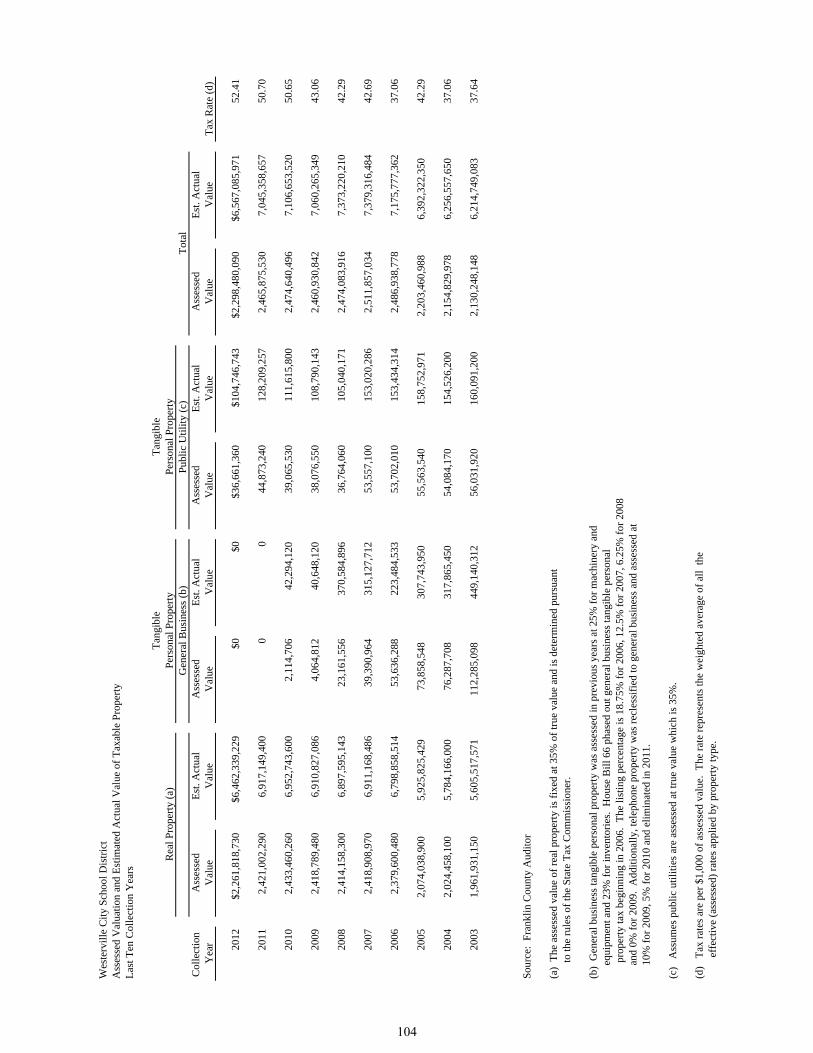
Wes
terv
ille
Cit
y S
choo
l Dis
tric
tA
sses
sed
Val
uati
on a
nd E
stim
ated
Act
ual V
alue
of
Tax
able
Pro
pert
yL
ast T
en C
olle
ctio
n Y
ears
Col
lect
ion
Ass
esse
dE
st. A
ctua
lA
sses
sed
Est
. Act
ual
Ass
esse
dE
st. A
ctua
lA
sses
sed
Est
. Act
ual
Yea
rV
alue
Val
ueV
alue
Val
ueV
alue
Val
ueV
alue
Val
ueT
ax R
ate
(d)
2012
$2,2
61,8
18,7
30$6
,462
,339
,229
$0$0
$36,
661,
360
$104
,746
,743
$2,2
98,4
80,0
90$6
,567
,085
,971
52.4
1
2011
2,42
1,00
2,29
06,
917,
149,
400
00
44,8
73,2
4012
8,20
9,25
72,
465,
875,
530
7,04
5,35
8,65
750
.70
2010
2,43
3,46
0,26
06,
952,
743,
600
2,11
4,70
642
,294
,120
39,0
65,5
3011
1,61
5,80
02,
474,
640,
496
7,10
6,65
3,52
050
.65
2009
2,41
8,78
9,48
06,
910,
827,
086
4,06
4,81
240
,648
,120
38,0
76,5
5010
8,79
0,14
32,
460,
930,
842
7,06
0,26
5,34
943
.06
2008
2,41
4,15
8,30
06,
897,
595,
143
23,1
61,5
5637
0,58
4,89
636
,764
,060
105,
040,
171
2,47
4,08
3,91
67,
373,
220,
210
42.2
9
2007
2,41
8,90
8,97
06,
911,
168,
486
39,3
90,9
6431
5,12
7,71
253
,557
,100
153,
020,
286
2,51
1,85
7,03
47,
379,
316,
484
42.6
9
2006
2,37
9,60
0,48
06,
798,
858,
514
53,6
36,2
8822
3,48
4,53
353
,702
,010
153,
434,
314
2,48
6,93
8,77
87,
175,
777,
362
37.0
6
2005
2,07
4,03
8,90
05,
925,
825,
429
73,8
58,5
4830
7,74
3,95
055
,563
,540
158,
752,
971
2,20
3,46
0,98
86,
392,
322,
350
42.2
9
2004
2,02
4,45
8,10
05,
784,
166,
000
76,2
87,7
0831
7,86
5,45
054
,084
,170
154,
526,
200
2,15
4,82
9,97
86,
256,
557,
650
37.0
6
2003
1,96
1,93
1,15
05,
605,
517,
571
112,
285,
098
449,
140,
312
56,0
31,9
2016
0,09
1,20
02,
130,
248,
148
6,21
4,74
9,08
337
.64
Sou
rce:
Fra
nkli
n C
ount
y A
udit
or
(a)
The
ass
esse
d va
lue
of r
eal p
rope
rty
is f
ixed
at 3
5% o
f tr
ue v
alue
and
is d
eter
min
ed p
ursu
ant
to th
e ru
les
of th
e S
tate
Tax
Com
mis
sion
er.
(b)
Gen
eral
bus
ines
s ta
ngib
le p
erso
nal p
rope
rty
was
ass
esse
d in
pre
viou
s ye
ars
at 2
5% f
or m
achi
nery
and
equ
ipm
ent a
nd 2
3% f
or in
vent
orie
s. H
ouse
Bil
l 66
phas
ed o
ut g
ener
al b
usin
ess
tang
ible
per
sona
l
pr
oper
ty ta
x be
ginn
ing
in 2
006.
The
list
ing
perc
enta
ge is
18.
75%
for
200
6, 1
2.5%
for
200
7, 6
.25%
for
200
8
and
0%
for
200
9. A
ddit
iona
lly,
tele
phon
e pr
oper
ty w
as r
ecle
ssif
ied
to g
ener
al b
usin
ess
and
asse
ssed
at
1
0% f
or 2
009,
5%
for
201
0 an
d el
imin
ated
in 2
011.
(c)
Ass
umes
pub
lic
util
itie
s ar
e as
sess
ed a
t tru
e va
lue
whi
ch is
35%
.
(d)
Tax
rat
es a
re p
er $
1,00
0 of
ass
esse
d va
lue.
The
rat
e re
pres
ents
the
wei
ghte
d av
erag
e of
all
the
e
ffec
tive
(as
sess
ed)
rate
s ap
plie
d by
pro
pert
y ty
pe.
Tot
alR
eal P
rope
rty
(a)
Per
sona
l Pro
pert
yT
angi
ble
Per
sona
l Pro
pert
yT
angi
ble
Gen
eral
Bus
ines
s (b
)P
ubli
c U
tili
ty (
c)
104

Wes
terv
ille
Cit
y S
choo
l Dis
tric
tP
rope
rty
Tax
Rat
es D
irec
t and
Ove
rlap
ping
Gov
ernm
ents
Las
t Ten
Col
lect
ion
Yea
rs(p
er $
1,00
0 of
Ass
esse
d V
alua
tion
)
Tax
Yea
r/W
este
rvil
leC
olle
ctio
nP
erm
anen
tT
otal
Fra
nkli
nD
elaw
are
Cit
y of
Cit
y of
Ble
ndon
Gen
oaP
lain
Sha
ron
Min
erva
Cor
p.Y
ear
Gen
. Fd.
Bon
dIm
prov
emen
tU
nvot
edD
irec
tC
ount
yC
ount
yW
este
rvil
leC
olum
bus
Tow
nshi
pT
owns
hip
Tow
nshi
pT
owns
hip
Par
k C
orp.
(Gen
oa)
2011
/201
261
.60
3.85
3.95
3.80
73.2
018
.07
6.65
20.3
03.
1429
.10
11.3
015
.35
23.5
016
.05
20.3
0R
es/A
gr40
.65
3.85
3.79
3.80
52.0
917
.19
6.65
13.4
13.
1418
.08
11.3
010
.16
19.2
416
.05
13.4
1C
omm
/Ind
43.2
43.
853.
953.
8054
.84
17.7
56.
6515
.31
3.14
20.9
111
.30
7.75
20.8
116
.05
15.3
1
2010
/201
161
.60
3.60
3.95
3.80
72.9
518
.07
6.65
20.3
03.
1429
.10
11.3
015
.35
23.5
016
.05
23.3
0
2009
/201
061
.60
4.90
2.70
3.80
73.0
018
.07
6.64
17.7
03.
1426
.56
9.40
15.3
523
.50
15.9
517
.70
2008
/200
965
.40
4.90
2.70
3.80
76.8
018
.02
5.85
17.7
03.
1426
.56
9.40
15.3
523
.50
15.9
517
.70
2007
/200
861
.60
4.40
2.70
3.80
72.5
018
.49
5.65
17.6
43.
1426
.51
9.40
12.8
523
.50
15.9
517
.64
2006
/200
761
.60
4.40
2.70
3.80
72.5
018
.44
5.65
17.6
03.
1426
.55
10.1
013
.15
23.5
016
.09
17.6
0
2005
/200
656
.30
4.51
2.70
3.80
67.3
118
.44
5.67
17.9
73.
1425
.02
10.1
013
.27
23.5
016
.09
17.9
7
2004
/200
556
.30
5.21
2.70
3.80
68.0
118
.44
5.61
17.9
53.
1425
.05
12.8
013
.37
23.5
016
.08
17.9
5
2003
/200
452
.30
5.40
2.70
3.80
64.2
017
.64
5.61
18.0
63.
1425
.07
12.8
013
.12
23.5
016
.13
18.0
6
2002
/200
351
.30
5.40
2.70
3.80
63.2
017
.64
5.61
17.8
53.
1425
.40
12.8
013
.43
23.5
016
.13
17.8
5
Sou
rce:
Fra
nkli
n C
ount
y A
udit
or -
Dat
a is
pre
sent
ed o
n a
Col
lect
ion
Yea
r ba
sis
beca
use
that
is th
e m
anne
r in
whi
ch th
e in
form
atio
n is
mai
ntai
ned
by th
e C
ount
y A
udit
or
Fig
ures
for
res
iden
tial
/agr
icul
tura
l (up
per)
and
com
mer
cial
/ind
ustr
ial (
low
er)
for
the
curr
ent c
olle
ctio
n ye
ar o
nly
refl
ect "
effe
ctiv
e" m
illa
ge.
All
oth
er f
igur
es r
efle
ct
v
oted
mil
lage
.
Ohi
o R
evis
ed C
ode
Sec
tion
s 57
05.0
2 an
d 57
05.0
7 re
quir
es a
ny m
illa
ge e
xcee
ding
the
"unv
oted
"
o
r "i
nsid
e" m
illa
ge c
an o
nly
be d
one
by a
vot
e of
the
peop
le.
Wes
terv
ille
Cit
y S
choo
l Dis
tric
tV
oted
105
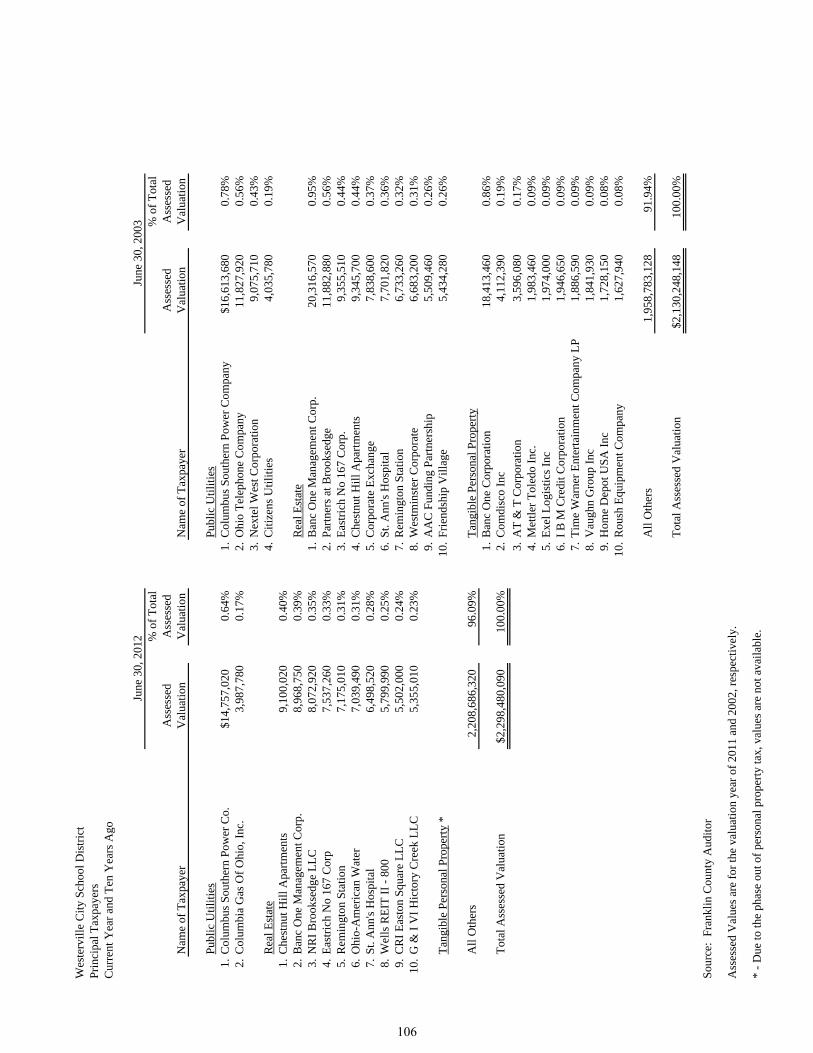
Wes
terv
ille
Cit
y S
choo
l Dis
tric
tP
rinc
ipal
Tax
paye
rsC
urre
nt Y
ear
and
Ten
Yea
rs A
go
% o
f T
otal
% o
f T
otal
Ass
esse
dA
sses
sed
Ass
esse
dA
sses
sed
Nam
e of
Tax
paye
rV
alua
tion
Val
uati
onN
ame
of T
axpa
yer
Val
uati
onV
alua
tion
Pub
lic
Uti
liti
esP
ubli
c U
tili
ties
1.C
olum
bus
Sou
ther
n P
ower
Co.
$14,
757,
020
0.64
%1.
Col
umbu
s S
outh
ern
Pow
er C
ompa
ny$1
6,61
3,68
00.
78%
2.C
olum
bia
Gas
Of
Ohi
o, I
nc.
3,98
7,78
00.
17%
2.O
hio
Tel
epho
ne C
ompa
ny11
,827
,920
0.56
%3.
Nex
tel W
est C
orpo
rati
on9,
075,
710
0.43
%R
eal E
stat
e4.
Cit
izen
s U
tili
ties
4,03
5,78
00.
19%
1.C
hest
nut H
ill A
part
men
ts9,
100,
020
0.40
%2.
Ban
c O
ne M
anag
emen
t Cor
p.8,
968,
750
0.39
%R
eal E
stat
e3.
NR
I B
rook
sedg
e L
LC
8,07
2,92
00.
35%
1.B
anc
One
Man
agem
ent C
orp.
20,3
16,5
700.
95%
4.E
astr
ich
No
167
Cor
p7,
537,
260
0.33
%2.
Par
tner
s at
Bro
okse
dge
11,8
82,8
800.
56%
5.R
emin
gton
Sta
tion
7,17
5,01
00.
31%
3.E
astr
ich
No
167
Cor
p.9,
355,
510
0.44
%6.
Ohi
o-A
mer
ican
Wat
er7,
039,
490
0.31
%4.
Che
stnu
t Hil
l Apa
rtm
ents
9,34
5,70
00.
44%
7.S
t. A
nn's
Hos
pita
l6,
498,
520
0.28
%5.
Cor
pora
te E
xcha
nge
7,83
8,60
00.
37%
8.W
ells
RE
IT I
I -
800
5,79
9,99
00.
25%
6.S
t. A
nn's
Hos
pita
l7,
701,
820
0.36
%9.
CR
I E
asto
n S
quar
e L
LC
5,50
2,00
00.
24%
7.R
emin
gton
Sta
tion
6,73
3,26
00.
32%
10.
G &
I V
I H
icto
ry C
reek
LL
C5,
355,
010
0.23
%8.
Wes
tmin
ster
Cor
pora
te6,
683,
200
0.31
%9.
AA
C F
undi
ng P
artn
ersh
ip5,
509,
460
0.26
%T
angi
ble
Per
sona
l Pro
pert
y *
10.
Fri
ends
hip
Vil
lage
5,43
4,28
00.
26%
All
Oth
ers
2,20
8,68
6,32
096
.09%
Tan
gibl
e P
erso
nal P
rope
rty
1.B
anc
One
Cor
pora
tion
18,4
13,4
600.
86%
Tot
al A
sses
sed
Val
uati
on$2
,298
,480
,090
100.
00%
2.C
omdi
sco
Inc
4,11
2,39
00.
19%
3.A
T &
T C
orpo
rati
on3,
596,
080
0.17
%4.
Met
tler
Tol
edo
Inc.
1,98
3,46
00.
09%
5.E
xel L
ogis
tics
Inc
1,97
4,00
00.
09%
6.I
B M
Cre
dit C
orpo
rati
on1,
946,
650
0.09
%7.
Tim
e W
arne
r E
nter
tain
men
t Com
pany
LP
1,88
6,59
00.
09%
8.V
augh
n G
roup
Inc
1,84
1,93
00.
09%
9.H
ome
Dep
ot U
SA
Inc
1,72
8,15
00.
08%
10.
Rou
sh E
quip
men
t Com
pany
1,62
7,94
00.
08%
All
Oth
ers
1,95
8,78
3,12
891
.94%
Tot
al A
sses
sed
Val
uati
on$2
,130
,248
,148
100.
00%
Sou
rce:
Fra
nkli
n C
ount
y A
udit
or
Ass
esse
d V
alue
s ar
e fo
r th
e va
luat
ion
year
of
2011
and
200
2, r
espe
ctiv
ely.
* -
Due
to th
e ph
ase
out o
f pe
rson
al p
rope
rty
tax,
val
ues
are
not a
vail
able
.
June
30,
201
2Ju
ne 3
0, 2
003
106
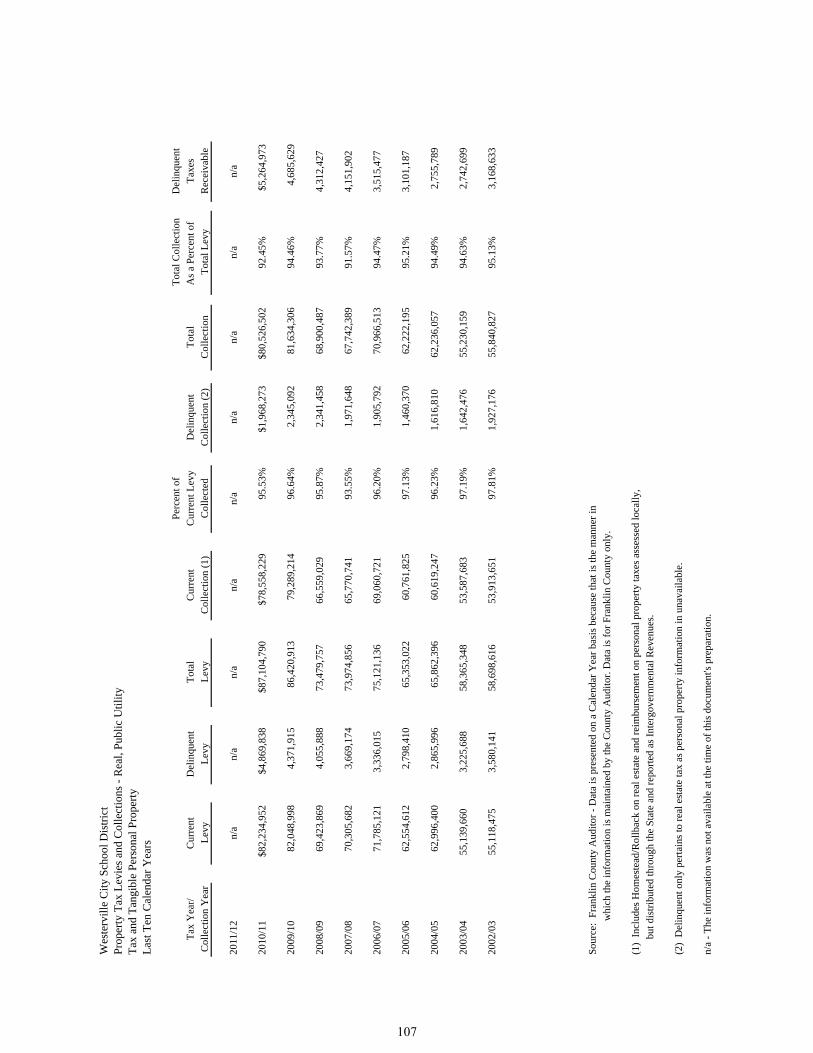
Wes
terv
ille
Cit
y S
choo
l Dis
tric
tP
rope
rty
Tax
Lev
ies
and
Col
lect
ions
- R
eal,
Pub
lic
Uti
lity
T
ax a
nd T
angi
ble
Per
sona
l Pro
pert
yL
ast T
en C
alen
dar
Yea
rs
Per
cent
of
Tot
al C
olle
ctio
nD
elin
quen
t
Tax
Yea
r/C
urre
ntD
elin
quen
tT
otal
Cur
rent
Cur
rent
Lev
yD
elin
quen
tT
otal
As
a P
erce
nt o
f T
axes
Col
lect
ion
Yea
rL
evy
Lev
yL
evy
Col
lect
ion
(1)
Col
lect
edC
olle
ctio
n (2
)C
olle
ctio
nT
otal
Lev
yR
ecei
vabl
e
2011
/12
n/a
n/a
n/a
n/a
n/a
n/a
n/a
n/a
n/a
2010
/11
$82,
234,
952
$4,8
69,8
38$8
7,10
4,79
0$7
8,55
8,22
995
.53%
$1,9
68,2
73$8
0,52
6,50
292
.45%
$5,2
64,9
73
2009
/10
82,0
48,9
984,
371,
915
86,4
20,9
1379
,289
,214
96.6
4%2,
345,
092
81,6
34,3
0694
.46%
4,68
5,62
9
2008
/09
69,4
23,8
694,
055,
888
73,4
79,7
57
66
,559
,029
95.8
7%2,
341,
458
68,9
00,4
8793
.77%
4,31
2,42
7
2007
/08
70,3
05,6
823,
669,
174
73,9
74,8
56
65
,770
,741
93.5
5%1,
971,
648
67,7
42,3
8991
.57%
4,15
1,90
2
2006
/07
71,7
85,1
213,
336,
015
75
,121
,136
69,0
60,7
2196
.20%
1,90
5,79
270
,966
,513
94.4
7%3,
515,
477
2005
/06
62,5
54,6
122,
798,
410
65,3
53,0
2260
,761
,825
97.1
3%1,
460,
370
62,2
22,1
9595
.21%
3,10
1,18
7
2004
/05
62,9
96,4
002,
865,
996
65,8
62,3
9660
,619
,247
96.2
3%1,
616,
810
62,2
36,0
5794
.49%
2,75
5,78
9
2003
/04
55,1
39,6
603,
225,
688
58,3
65,3
4853
,587
,683
97.1
9%1,
642,
476
55,2
30,1
5994
.63%
2,74
2,69
9
2002
/03
55,1
18,4
753,
580,
141
58,6
98,6
1653
,913
,651
97.8
1%1,
927,
176
55,8
40,8
2795
.13%
3,16
8,63
3
Sou
rce:
Fra
nkli
n C
ount
y A
udit
or -
Dat
a is
pre
sent
ed o
n a
Cal
enda
r Y
ear
basi
s be
caus
e th
at is
the
man
ner
in
whi
ch th
e in
form
atio
n is
mai
ntai
ned
by th
e C
ount
y A
udit
or. D
ata
is f
or F
rank
lin
Cou
nty
only
.
(1)
Inc
lude
s H
omes
tead
/Rol
lbac
k on
rea
l est
ate
and
reim
burs
emen
t on
pers
onal
pro
pert
y ta
xes
asse
ssed
loca
lly,
but d
istr
ibut
ed th
roug
h th
e S
tate
and
rep
orte
d as
Int
ergo
vern
men
tal R
even
ues.
(2)
Del
inqu
ent o
nly
pert
ains
to r
eal e
stat
e ta
x as
per
sona
l pro
pert
y in
form
atio
n in
una
vail
able
.
n/a
- T
he in
form
atio
n w
as n
ot a
vail
able
at t
he ti
me
of th
is d
ocum
ent's
pre
para
tion
.
107
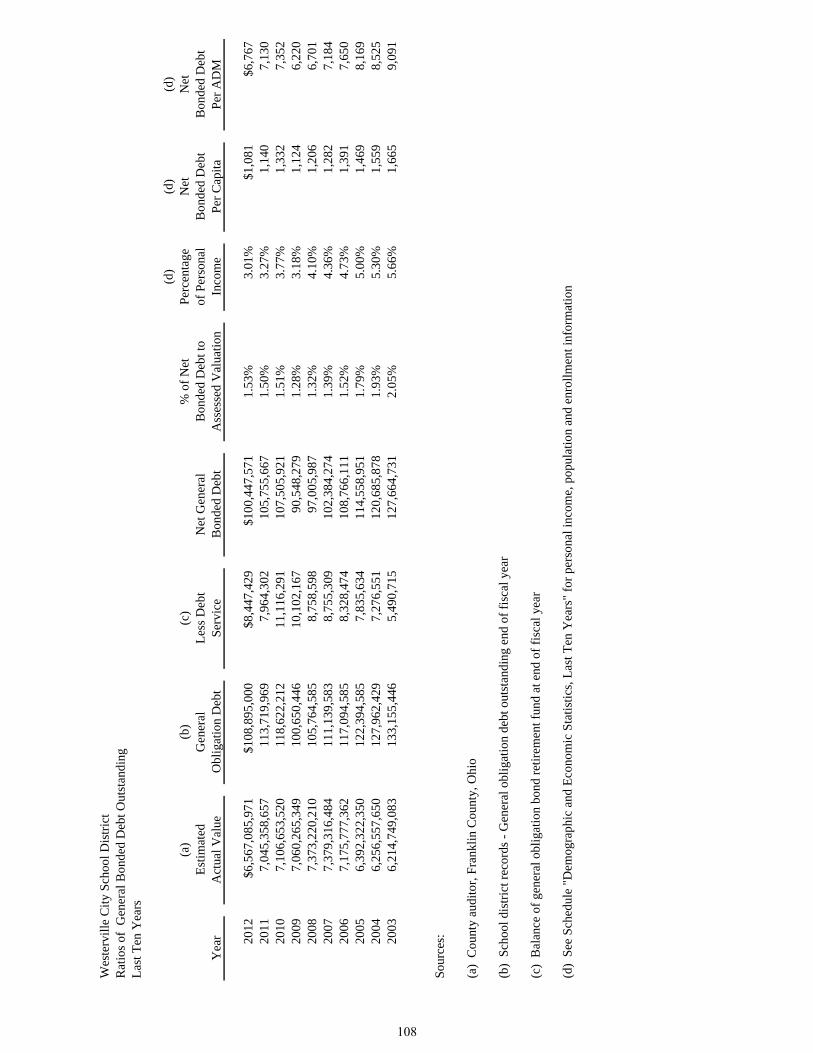
Wes
terv
ille
Cit
y S
choo
l Dis
tric
tR
atio
s of
Gen
eral
Bon
ded
Deb
t Out
stan
ding
Las
t Ten
Yea
rs
(d)
(d)
(d)
(a)
(b)
(c)
% o
f N
etP
erce
ntag
eN
etN
etE
stim
ated
Gen
eral
Les
s D
ebt
Net
Gen
eral
Bon
ded
Deb
t to
of P
erso
nal
Bon
ded
Deb
tB
onde
d D
ebt
Yea
rA
ctua
l Val
ueO
blig
atio
n D
ebt
Ser
vice
Bon
ded
Deb
tA
sses
sed
Val
uati
onIn
com
eP
er C
apit
aP
er A
DM
2012
$6,5
67,0
85,9
71$1
08,8
95,0
00$8
,447
,429
$100
,447
,571
1.53
%3.
01%
$1,0
81$6
,767
2011
7,04
5,35
8,65
711
3,71
9,96
97,
964,
302
105,
755,
667
1.50
%3.
27%
1,14
07,
130
2010
7,10
6,65
3,52
011
8,62
2,21
211
,116
,291
107,
505,
921
1.51
%3.
77%
1,33
27,
352
2009
7,06
0,26
5,34
910
0,65
0,44
610
,102
,167
90,5
48,2
791.
28%
3.18
%1,
124
6,22
020
087,
373,
220,
210
105,
764,
585
8,75
8,59
897
,005
,987
1.32
%4.
10%
1,20
66,
701
2007
7,37
9,31
6,48
411
1,13
9,58
38,
755,
309
102,
384,
274
1.39
%4.
36%
1,28
27,
184
2006
7,17
5,77
7,36
211
7,09
4,58
58,
328,
474
108,
766,
111
1.52
%4.
73%
1,39
17,
650
2005
6,39
2,32
2,35
012
2,39
4,58
57,
835,
634
114,
558,
951
1.79
%5.
00%
1,46
98,
169
2004
6,25
6,55
7,65
012
7,96
2,42
97,
276,
551
120,
685,
878
1.93
%5.
30%
1,55
98,
525
2003
6,21
4,74
9,08
313
3,15
5,44
65,
490,
715
127,
664,
731
2.05
%5.
66%
1,66
59,
091
Sou
rces
:
(a)
Cou
nty
audi
tor,
Fra
nkli
n C
ount
y, O
hio
(b)
Sch
ool d
istr
ict r
ecor
ds -
Gen
eral
obl
igat
ion
debt
out
stan
ding
end
of
fisc
al y
ear
(c)
Bal
ance
of
gene
ral o
blig
atio
n bo
nd r
etir
emen
t fun
d at
end
of
fisc
al y
ear
(d)
See
Sch
edul
e "D
emog
raph
ic a
nd E
cono
mic
Sta
tist
ics,
Las
t Ten
Yea
rs"
for
pers
onal
inco
me,
pop
ulat
ion
and
enro
llm
ent i
nfor
mat
ion
108
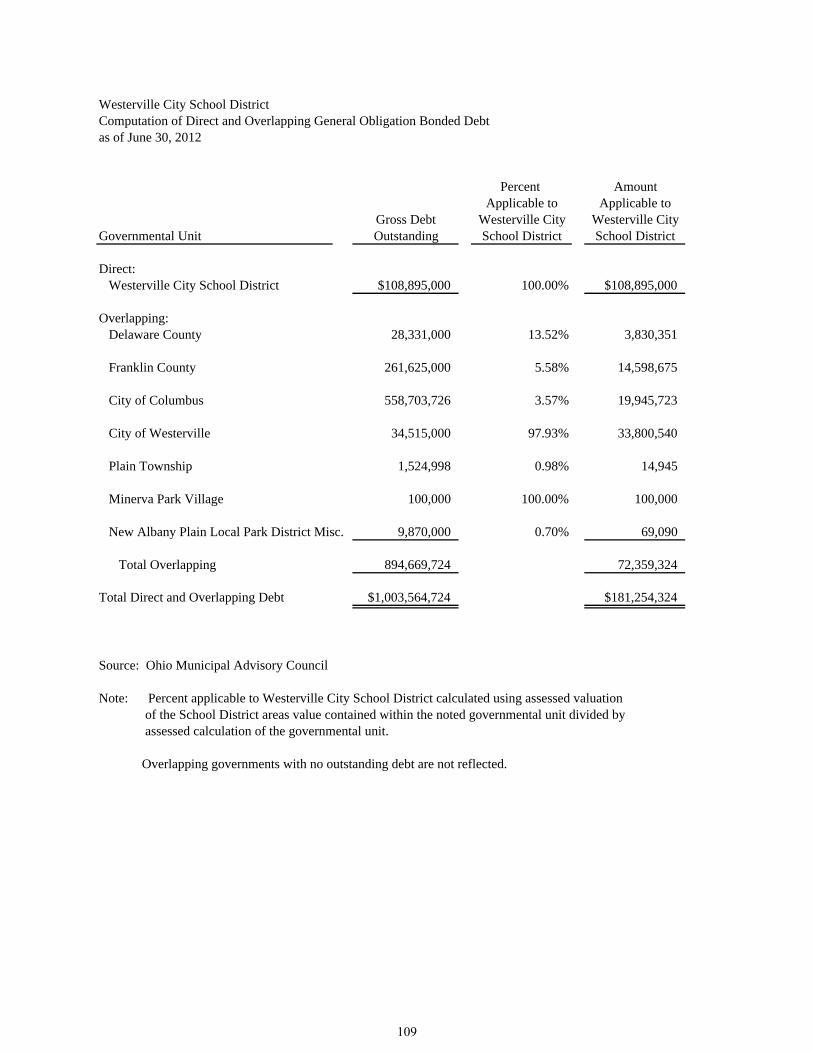
Westerville City School DistrictComputation of Direct and Overlapping General Obligation Bonded Debtas of June 30, 2012
Percent AmountApplicable to Applicable to
Gross Debt Westerville City Westerville CityGovernmental Unit Outstanding School District School District
Direct: Westerville City School District $108,895,000 100.00% $108,895,000
Overlapping: Delaware County 28,331,000 13.52% 3,830,351
Franklin County 261,625,000 5.58% 14,598,675
City of Columbus 558,703,726 3.57% 19,945,723
City of Westerville 34,515,000 97.93% 33,800,540
Plain Township 1,524,998 0.98% 14,945
Minerva Park Village 100,000 100.00% 100,000
New Albany Plain Local Park District Misc. 9,870,000 0.70% 69,090
Total Overlapping 894,669,724 72,359,324
Total Direct and Overlapping Debt $1,003,564,724 $181,254,324
Source: Ohio Municipal Advisory Council
Note: Percent applicable to Westerville City School District calculated using assessed valuation of the School District areas value contained within the noted governmental unit divided by assessed calculation of the governmental unit.
Overlapping governments with no outstanding debt are not reflected.
109

Wes
terv
ille
Cit
y S
choo
lsL
egal
Deb
t Mar
gin
Info
rmat
ion
as o
f Ju
ne 3
0, 2
012
Ass
esse
d V
alua
tion
$2,2
98,4
80,0
90
Vot
ed a
nd U
nvot
ed D
ebt L
imit
- 9
% o
f A
sses
sed
Val
uati
on$2
06,8
63,2
08
Bal
ance
in D
ebt S
ervi
ce F
und
$8,4
47,4
29
Tot
al D
ebt O
utst
andi
ng$1
08,8
95,0
00
Les
s: E
xem
pted
Deb
t$0
Net
sub
ject
to 9
% li
mit
$108
,895
,000
Tot
al L
egal
Vot
ed D
ebt M
argi
n$1
06,4
15,6
37
2012
2011
2010
2009
2008
2007
2006
2005
2004
2003
Deb
t Lim
it$2
15,3
10,6
37.1
0$2
29,8
93,1
00$2
33,8
33,9
36$2
31,5
85,9
43$2
31,4
26,1
50$2
34,8
22,4
42$2
32,1
52,9
64$2
06,1
47,1
23$2
01,2
11,2
49$1
97,2
13,0
48
Tot
al N
et D
ebt A
ppli
cabl
e to
Lim
it$1
08,8
95,0
0011
3,71
9,96
911
8,62
2,21
210
0,65
0,44
610
5,76
4,58
511
1,13
9,58
311
7,09
4,58
512
2,39
4,58
512
7,96
2,42
913
3,15
5,44
6
Leg
al D
ebt M
argi
n$1
06,4
15,6
37$1
16,1
73,1
31$1
15,2
11,7
24$1
30,9
35,4
97$1
25,6
61,5
65$1
23,6
82,8
59$1
15,0
58,3
79$8
3,75
2,53
8$7
3,24
8,82
0$6
4,05
7,60
2
Tot
al N
et D
ebt A
ppli
cabl
e to
the
Lim
it
as a
Per
cent
age
of D
ebt L
imit
50.5
8%49
.47%
50.7
3%43
.46%
45.7
0%47
.33%
50.4
4%59
.37%
63.6
0%67
.52%
Sou
rce:
Fra
nkli
n C
ount
y A
udit
or a
nd S
choo
l Dis
tric
t fin
anci
al r
ecor
ds
Not
e:
Ohi
o B
ond
Law
set
s a
lim
it o
f 9%
for
vot
ed d
ebt a
nd 1
/10
of a
% f
or u
nvot
ed d
ebt.
Vot
ed d
ebt m
argi
ns a
re d
eter
min
ed w
itho
ut r
efer
ence
to a
ppli
cabl
e m
onie
s in
the
scho
ol d
istr
ict's
Deb
t Ser
vice
fun
d.
110

Westerville City School DistrictDemographic and Economic StatisticsLast Ten Years
(b)% of Population
(a) (b) (c) 25 Years & older (d)MORPC Per Capita Personal Unemployment with Bachelor's Enrollment
Year Population Income Income Rate Degree or Higher Membership
2012 92,959 $35,887 $3,336,019,633 6.6% 49.9% 14,8442011 92,789 $34,899 $3,238,243,311 6.8% 51.7% 14,8332010 80,702 $35,328 $2,851,040,256 7.6% 50.7% 14,6222009 80,536 $35,328 $2,845,175,808 5.7% 50.7% 14,5582008 80,404 $29,401 $2,363,958,004 4.0% 44.6% 14,4772007 79,891 $29,401 $2,348,875,291 3.9% 44.6% 14,2522006 78,213 $29,401 $2,299,540,413 4.1% 44.6% 14,2172005 77,964 $29,401 $2,292,219,564 4.4% 44.6% 14,0232004 77,415 $29,401 $2,276,078,415 4.2% 44.6% 14,1562003 76,680 $29,401 $2,254,468,680 3.7% 44.6% 14,043
Sources:
(a) Mid Ohio Regional Planning Commission
(b) US Census Bureau 2000 and 2006-2010 American Community Survey
(c) U.S. Department of Labor, Bureau of Labor Statistics
(d) Per School District records - Educational Management Information System
111

Westerville City School DistrictPrincipal EmployersCurrent Year and Ten Years Ago
December 2011
Employer Employees
Percentage of Total Employment Type of Business
1 J. P. Morgan Chase (Bank One) 6,365 10.8% Banking & Financial Services2 Mount Carmel Health Systems 2,618 4.4% Health Care3 Westerville City Schools 2,274 3.8% Public Education4 Otterbein College 1,895 3.2% Private College5 CMS Subsidiary 1,343 2.3% Membership Services6 Alliance Data Systems, Inc. 999 1.7% Finance Credit Services7 Inchord Communications/Gerbig Snell 808 1.4% Marketing and Advertising8 City of Westerville 843 1.4% Municipal Government9 Heartland Employment 756 1.3% Financial Services10 Worthington Cylinder 666 1.1% Industrial
Total 18,567 31.4%
December 2002
Employer Employees
Percentage of Total Employment Type of Business
1 J. P. Morgan Chase (Bank One) 4,630 8.2% Banking & Financial Services2 Westerville City Schools 2,188 3.9% Public Education3 Mount Carmel Health (St. Ann's) 2,063 3.6% Health Care4 Otterbein College 1,461 2.6% Private College5 CMS Subsidiary 1,412 2.5% Membership Services6 Alliance Data Systems, Inc. 1,219 2.2% Finance Credit Services7 City of Westerville 843 1.5% Muncipal Government8 Cheryl's Cookies (1-800-Flowers) 801 1.4% Retail Food9 Meijer Stores 768 1.4% Retail Food10 Worthington Cylinder 727 1.3% Industrial
Total 16,112 28.6%
Note: Information for total city employment only, District infomation was not available
Source: City of Westerville Division of Taxation, Comprehensive Annual Financial Report December 31, 2011
112

Westerville City School DistrictStaffing Statistics - Full Time Equivalents (FTE) by Type and FunctionLast Nine Fiscal Years
2012 2011 2010 2009 2008 2007 2006 2005 2004Professional staff:
Teaching staff: Elementary 410.50 415.95 433.07 403.41 383.94 375.50 355.00 339.00 348.00 Middle 195.50 208.80 232.25 232.40 231.85 208.50 193.00 184.00 224.00 High 246.83 257.35 271.65 278.35 267.30 252.00 231.00 220.00 240.00
Administrators: Certificated 54.50 56.50 55.50 55.50 56.80 56.00 55.00 55.00 59.00 Classified 14.00 16.00 16.00 16.00 17.25 18.00 15.00 15.00 15.00
Guidance counselors 29.00 32.00 32.00 32.00 30.00 29.00 29.00 28.00 28.00Social Workers 6.50 0.00 1.00 1.00 2.00 2.00 - - -Psychologists 13.00 16.70 14.20 14.20 14.60 15.00 11.00 12.00 11.00Nurses 10.00 9.84 10.00 10.00 9.40 8.00 7.00 7.00 7.00Speech 21.30 21.30 19.10 19.10 18.55 19.00 15.00 15.00 15.00Adapted phys ed. - OT/PT 17.40 12.60 5.00 5.00 13.60 14.00 12.00 11.00 10.00Media specialist 10.00 15.00 15.00 14.00 15.00 15.00 15.00 15.00 15.00
Support staff: Secretarial 98.90 113.62 113.62 114.87 114.87 110.00 104.00 103.00 103.00 ESL paraprofessionals 20.41 20.56 20.56 20.92 20.92 20.00 20.00 20.00 20.00 Educational Interpreter 1.62 1.62 - - - - - 1.00 1.00 Job Coaches 3.88 4.73 4.73 4.45 4.45 4.00 2.00 4.00 4.00 Health Aides 8.85 8.86 8.86 8.86 8.86 9.00 9.00 7.00 7.00 Recess aides/crossing guards 20.79 23.10 23.10 24.50 24.50 26.00 20.00 19.00 19.00 Building/duty monitors 6.72 13.41 12.60 12.54 12.54 11.00 11.00 12.00 12.00 Parent Mentor 1.00 0.75 0.75 0.75 0.75 1.00 1.00 0.00 0.00 Community Relations Facilitator 1.00 1.00 1.00 1.00 1.00 2.00 1.00 1.00 1.00 IMS personnel 6.00 8.00 8.00 8.00 8.00 7.00 7.00 7.00 7.00 Printers 2.00 2.00 2.00 2.00 2.00 2.00 2.00 2.00 2.00 Food service 51.03 52.10 52.10 52.61 52.61 52.00 56.00 52.25 53.00 Nutrition Education Specialist - - - 0.50 0.50 1.00 1.00 1.00 1.00 Custodial 71.75 87.75 88.75 88.75 88.75 89.00 86.00 86.00 86.00 Maintenance 17.00 18.00 17.00 17.00 17.00 16.00 16.00 16.00 16.00 HVAC 4.00 4.00 4.00 4.00 4.00 4.00 3.00 3.00 3.00 Bus drivers 67.70 82.23 82.23 77.10 77.10 76.00 73.00 72.00 81.00 Mechanics 7.00 7.00 7.00 7.00 7.00 7.00 7.00 7.00 7.00 Warehouse 5.00 5.00 5.00 5.00 5.00 5.00 5.00 5.00 5.00
Total 1,423.18 1,515.77 1,556.07 1,530.81 1,510.14 1,454.00 1,362.00 1,319.25 1,400.00
Function 2012 2011 2010 2009 2008 2007 2006 2005 2004Governmental activities:Instruction 878.74 909.01 962.26 939.53 908.46 859.00 803.50 767.50 840.50Support services: Pupils 120.05 115.30 105.16 105.16 112.01 111.00 98.00 95.00 93.00 Instructional staff 53.51 67.01 69.70 70.04 70.04 71.50 65.50 65.50 65.50 School administration 95.40 108.62 106.12 107.37 112.92 107.50 98.00 100.00 100.00 Fiscal services 11.00 11.00 11.00 11.00 11.00 10.00 10.00 10.00 10.00 Business services 9.50 11.50 11.50 11.50 11.50 11.50 11.50 11.50 11.50 Operation & maintenance 96.25 114.25 114.25 114.25 114.25 113.50 108.50 108.50 108.50 Student transportation 80.70 95.23 95.23 90.10 90.10 90.00 87.00 86.00 95.00 Central services 17.00 21.00 19.00 19.00 17.00 17.00 13.00 13.00 13.00Food service operations 54.03 55.10 55.10 56.11 56.11 56.00 60.00 56.25 57.00Community services 1.00 1.75 0.75 0.75 0.75 1.00 1.00 0.00 0.00Extra-curricular activities 6.00 6.00 6.00 6.00 6.00 6.00 6.00 6.00 6.00
Total governmental activities 1,423.18 1,515.77 1,556.07 1,530.81 1,510.14 1,454.00 1,362.00 1,319.25 1,400.00
Source - School District records, information not available prior to 2004
113

Westerville City School DistrictOperating Indicators by FunctionLast Eight Fiscal Years
2012 2011 2010 2009 2008 2007 2006 2005Governmental ActivitiesInstruction Regular and special Enrollment (Students) 14,844 14,833 14,622 14,558 14,477 14,467 14,217 14,023 Graduation rate N/A 93.3% 93.3% 93.4% 91.9% 95.8% 94.6% 94.6%Support services - pupil % of students going on to higher education 69.6% 70.0% 85.0% 85.0% 84.5% 79.0% 79.0% 84.0% % of students with disabilities 13.3% 12.5% 11.7% 11.7% 12.1% 11.6% 11.2% 11.3% % of limited English proficient students 8.1% 8.4% 8.8% 7.8% 7.1% 7.4% 6.3% 4.2%School administration Student attendance rate 95.8% 95.7% 95.9% 95.6% 95.6% 95.4% 95.4%Fiscal Purchase orders processed 8,197 9,947 9,636 10,049 9,895 9,876 9,477 9,173 Nonpayroll checks issued 10,673 11,217 10,802 11,170 10,991 11,571 11,628 11,459Business Facility rentals permits issued 370 416 378 332 312 303 265 268Maintenance Maintenance work orders completed 7,102 7,686 7,315 7,057 7,172 7,192 5,913 5,330 District square footage maintained by custodians and maintenance staff 2,167,028 2,168,660 2,112,955 2,112,955 2,112,955 2,115,276 2,115,276 2,115,276 District acreage maintained by grounds staff 412 412 403 403 403 403 403 403Transportation Avg. public and parochial students transported daily 8,785 11,293 10,325 10,640 10,671 8,401 8,502 7,939 Avg. daily bus stops 4,313 5,384 5,564 5,820 6,216 4,961 6,126 5,836Central Information technology services work orders completed 8,916 6,610 6,418 6,072 4,126 2,857 2,785 2,526Food service operations Breakfasts served to students 353,366 321,048 295,104 156,346 177,601 138,900 105,625 85,587 Lunches served to students 951,909 708,789 661,529 622,748 620,376 628,488 622,037 602,386Extra-curricular activities High school varsity teams 60 60 60 60 60 60 60 60
Source - School District Records and Ohio Department of Education Report Card Data
N/A - Calculation not available from Ohio Department of Education
Information not available prior to 2005.
Note: Business-Type Activities were reclassified to Governmental Activities as of July 1, 2010. This has been reflected in all years presented.
114

Westerville City School DistrictCapital Assets by Function/ProgramLast Nine Fiscal Years
2012 2011 2010 2009 2008 2007 2006 2005 2004Governmental ActivitiesRegular Instruction
Land/improvements $10,019,143 $9,704,221 $9,690,088 $9,690,088 $9,653,688 $9,396,188 $9,396,188 $9,392,188 $9,392,188Buildings/improvements 196,698,599 196,110,779 186,946,789 187,013,330 187,065,017 184,756,845 182,885,105 179,800,709 178,855,973Furniture/equipment 2,161,555 2,060,243 2,278,700 2,293,383 2,313,267 2,194,641 2,032,256 2,082,672 2,003,496Vehicles 19,500 19,500 5,100 5,100 5,100 - - - -
Special InstructionLand/improvements 3,114 - - - - - - - - Buildings/improvements 1,304,234 1,300,260 - - - - - - - Furniture/equipment 181,637 115,372 97,385 96,665 85,091 79,469 73,094 68,314 57,196
Vocational InstructionBuildings/improvements - - 110,873 110,873 110,873 110,873 110,873 127,357 127,357Furniture/equipment - 5,038 5,038 5,038 5,038 5,038 5,038 5,038 5,038Vehicles 21,479 21,479 21,479 21,479 17,279 17,279 - - -
Pupil SupportLand/improvements 3,550 3,550 3,550 3,550 3,550 3,550 3,550 - - Buildings/improvements 312,235 312,235 312,235 312,235 312,235 312,235 312,235 - - Furniture/equipment 44,360 29,267 37,382 33,599 33,599 33,599 25,142 31,934 31,934
Instructional Support StaffFurniture/equipment 66,400 66,400 66,400 87,534 24,279 10,579 10,579 10,379 10,379
General AdministrationFurniture/equipment 7,712 7,712 - - - - - - -
School AdministrationBuildings/improvements 1,325,177 1,286,547 - - - - - - - Furniture/equipment 242,471 211,741 240,967 240,967 240,967 127,921 53,916 63,258 73,850
Fiscal ServicesFurniture/equipment 0 5,900 13,376 13,376 13,376 13,376 13,376 13,376 13,376
Business servicesBuildings/improvements 371,703 367,265 96,600 96,600 96,600 96,600 96,600 96,600 96,600Furniture/equipment 60,433 33,907 33,907 33,907 33,907 49,015 49,015 61,810 61,810Vehicles 138,498 101,065 101,065 101,065 101,065 101,065 101,065 48,769 48,769
Operation & maintenanceLand/improvements 818,129 810,889 810,889 424,038 368,112 365,607 248,620 28,926 28,926Buildings/improvements 3,412,115 3,406,849 3,354,284 3,344,317 2,764,203 2,751,812 2,705,699 2,701,530 2,701,530Furniture/equipment 882,711 849,489 777,594 697,625 646,064 529,916 521,797 483,329 482,499Vehicles 536,946 563,789 552,289 585,688 585,688 515,627 529,779 510,504 597,563
Student transportationLand/improvements 294,084 294,084 294,084 294,083 294,083 294,084 294,084 294,084 294,084Buildings/improvements 1,522,948 1,537,948 34,648 34,648 34,648 34,648 31,700 31,700 31,700Furniture/equipment 180,133 169,281 120,215 95,549 82,602 73,277 48,277 48,277 48,277Buses 8,362,723 6,994,966 7,454,228 6,920,283 6,681,420 6,302,986 6,259,176 6,078,877 6,505,227
Central servicesBuildings/improvements 3,440,603 3,440,603 288,201 288,201 288,201 288,201 288,201 288,201 288,201Furniture/equipment 3,959,165 2,781,666 1,980,122 1,856,664 1,407,719 1,262,331 1,259,306 1,203,668 1,201,070
Food service operationsBuildings/improvements 12,330 - - - - - - - - Furniture/equipment 1,148,619 1,127,123 1,128,640 1,133,419 1,212,010 1,209,478 1,076,136 1,076,142 1,073,387Vehicles 48,769 48,769 48,769 48,769 48,769 48,769 48,769 48,769 48,769
Community servicesFurniture/equipment 49,338 22,387 6,832 6,832 6,832 6,832 3,942 - -
Extra-curricular activitiesLand/improvements 3,248,245 2,198,567 1,630,604 1,630,604 799,590 752,047 282,237 194,420 22,511 Buildings/improvements 1,213,357 1,213,357 542,483 542,483 542,483 537,478 537,478 537,478 537,478Furniture/equipment 609,725 584,695 517,623 427,907 347,139 290,503 270,938 258,376 237,111
Total governmental activities capital assets $242,721,740 $237,806,943 $219,602,439 $218,489,899 $216,224,494 $212,571,869 $209,574,171 $205,586,685 $204,876,299
Source - School District records, information not available prior to 2004
115
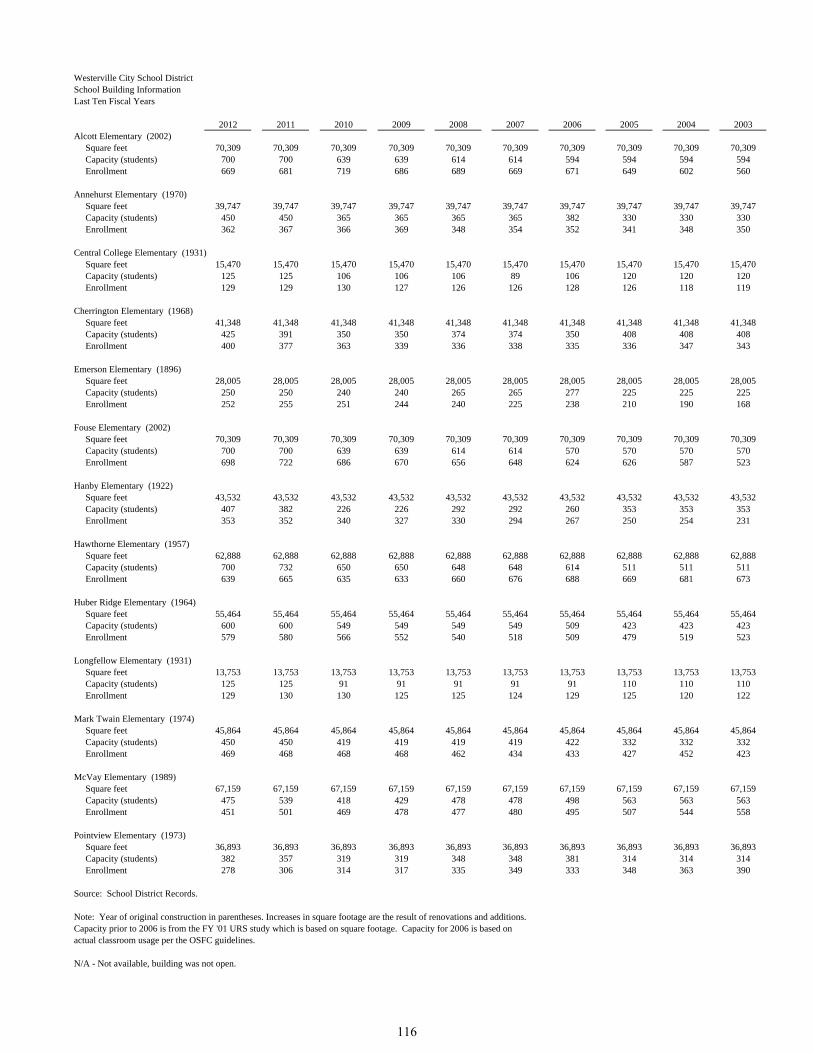
Westerville City School DistrictSchool Building InformationLast Ten Fiscal Years
2012 2011 2010 2009 2008 2007 2006 2005 2004 2003Alcott Elementary (2002) Square feet 70,309 70,309 70,309 70,309 70,309 70,309 70,309 70,309 70,309 70,309 Capacity (students) 700 700 639 639 614 614 594 594 594 594 Enrollment 669 681 719 686 689 669 671 649 602 560
Annehurst Elementary (1970) Square feet 39,747 39,747 39,747 39,747 39,747 39,747 39,747 39,747 39,747 39,747 Capacity (students) 450 450 365 365 365 365 382 330 330 330 Enrollment 362 367 366 369 348 354 352 341 348 350
Central College Elementary (1931) Square feet 15,470 15,470 15,470 15,470 15,470 15,470 15,470 15,470 15,470 15,470 Capacity (students) 125 125 106 106 106 89 106 120 120 120 Enrollment 129 129 130 127 126 126 128 126 118 119
Cherrington Elementary (1968) Square feet 41,348 41,348 41,348 41,348 41,348 41,348 41,348 41,348 41,348 41,348 Capacity (students) 425 391 350 350 374 374 350 408 408 408 Enrollment 400 377 363 339 336 338 335 336 347 343
Emerson Elementary (1896) Square feet 28,005 28,005 28,005 28,005 28,005 28,005 28,005 28,005 28,005 28,005 Capacity (students) 250 250 240 240 265 265 277 225 225 225 Enrollment 252 255 251 244 240 225 238 210 190 168
Fouse Elementary (2002) Square feet 70,309 70,309 70,309 70,309 70,309 70,309 70,309 70,309 70,309 70,309 Capacity (students) 700 700 639 639 614 614 570 570 570 570 Enrollment 698 722 686 670 656 648 624 626 587 523
Hanby Elementary (1922) Square feet 43,532 43,532 43,532 43,532 43,532 43,532 43,532 43,532 43,532 43,532 Capacity (students) 407 382 226 226 292 292 260 353 353 353 Enrollment 353 352 340 327 330 294 267 250 254 231
Hawthorne Elementary (1957) Square feet 62,888 62,888 62,888 62,888 62,888 62,888 62,888 62,888 62,888 62,888 Capacity (students) 700 732 650 650 648 648 614 511 511 511 Enrollment 639 665 635 633 660 676 688 669 681 673
Huber Ridge Elementary (1964) Square feet 55,464 55,464 55,464 55,464 55,464 55,464 55,464 55,464 55,464 55,464 Capacity (students) 600 600 549 549 549 549 509 423 423 423 Enrollment 579 580 566 552 540 518 509 479 519 523
Longfellow Elementary (1931) Square feet 13,753 13,753 13,753 13,753 13,753 13,753 13,753 13,753 13,753 13,753 Capacity (students) 125 125 91 91 91 91 91 110 110 110 Enrollment 129 130 130 125 125 124 129 125 120 122
Mark Twain Elementary (1974) Square feet 45,864 45,864 45,864 45,864 45,864 45,864 45,864 45,864 45,864 45,864 Capacity (students) 450 450 419 419 419 419 422 332 332 332 Enrollment 469 468 468 468 462 434 433 427 452 423
McVay Elementary (1989) Square feet 67,159 67,159 67,159 67,159 67,159 67,159 67,159 67,159 67,159 67,159 Capacity (students) 475 539 418 429 478 478 498 563 563 563 Enrollment 451 501 469 478 477 480 495 507 544 558
Pointview Elementary (1973) Square feet 36,893 36,893 36,893 36,893 36,893 36,893 36,893 36,893 36,893 36,893 Capacity (students) 382 357 319 319 348 348 381 314 314 314 Enrollment 278 306 314 317 335 349 333 348 363 390
Source: School District Records.
Note: Year of original construction in parentheses. Increases in square footage are the result of renovations and additions.Capacity prior to 2006 is from the FY '01 URS study which is based on square footage. Capacity for 2006 is based on actual classroom usage per the OSFC guidelines.
N/A - Not available, building was not open.
116
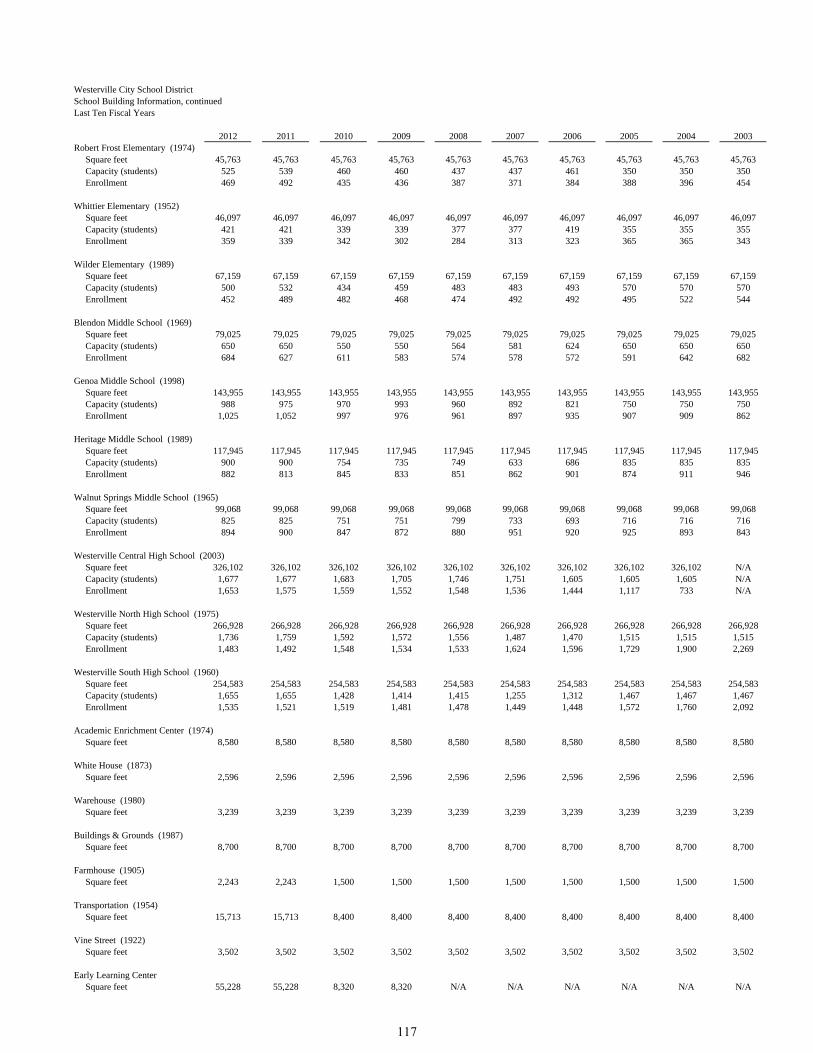
Westerville City School DistrictSchool Building Information, continuedLast Ten Fiscal Years
2012 2011 2010 2009 2008 2007 2006 2005 2004 2003Robert Frost Elementary (1974) Square feet 45,763 45,763 45,763 45,763 45,763 45,763 45,763 45,763 45,763 45,763 Capacity (students) 525 539 460 460 437 437 461 350 350 350 Enrollment 469 492 435 436 387 371 384 388 396 454
Whittier Elementary (1952) Square feet 46,097 46,097 46,097 46,097 46,097 46,097 46,097 46,097 46,097 46,097 Capacity (students) 421 421 339 339 377 377 419 355 355 355 Enrollment 359 339 342 302 284 313 323 365 365 343
Wilder Elementary (1989) Square feet 67,159 67,159 67,159 67,159 67,159 67,159 67,159 67,159 67,159 67,159 Capacity (students) 500 532 434 459 483 483 493 570 570 570 Enrollment 452 489 482 468 474 492 492 495 522 544
Blendon Middle School (1969) Square feet 79,025 79,025 79,025 79,025 79,025 79,025 79,025 79,025 79,025 79,025 Capacity (students) 650 650 550 550 564 581 624 650 650 650 Enrollment 684 627 611 583 574 578 572 591 642 682
Genoa Middle School (1998) Square feet 143,955 143,955 143,955 143,955 143,955 143,955 143,955 143,955 143,955 143,955 Capacity (students) 988 975 970 993 960 892 821 750 750 750 Enrollment 1,025 1,052 997 976 961 897 935 907 909 862
Heritage Middle School (1989) Square feet 117,945 117,945 117,945 117,945 117,945 117,945 117,945 117,945 117,945 117,945 Capacity (students) 900 900 754 735 749 633 686 835 835 835 Enrollment 882 813 845 833 851 862 901 874 911 946
Walnut Springs Middle School (1965) Square feet 99,068 99,068 99,068 99,068 99,068 99,068 99,068 99,068 99,068 99,068 Capacity (students) 825 825 751 751 799 733 693 716 716 716 Enrollment 894 900 847 872 880 951 920 925 893 843
Westerville Central High School (2003) Square feet 326,102 326,102 326,102 326,102 326,102 326,102 326,102 326,102 326,102 N/A Capacity (students) 1,677 1,677 1,683 1,705 1,746 1,751 1,605 1,605 1,605 N/A Enrollment 1,653 1,575 1,559 1,552 1,548 1,536 1,444 1,117 733 N/A
Westerville North High School (1975) Square feet 266,928 266,928 266,928 266,928 266,928 266,928 266,928 266,928 266,928 266,928 Capacity (students) 1,736 1,759 1,592 1,572 1,556 1,487 1,470 1,515 1,515 1,515 Enrollment 1,483 1,492 1,548 1,534 1,533 1,624 1,596 1,729 1,900 2,269
Westerville South High School (1960) Square feet 254,583 254,583 254,583 254,583 254,583 254,583 254,583 254,583 254,583 254,583 Capacity (students) 1,655 1,655 1,428 1,414 1,415 1,255 1,312 1,467 1,467 1,467 Enrollment 1,535 1,521 1,519 1,481 1,478 1,449 1,448 1,572 1,760 2,092
Academic Enrichment Center (1974) Square feet 8,580 8,580 8,580 8,580 8,580 8,580 8,580 8,580 8,580 8,580
White House (1873) Square feet 2,596 2,596 2,596 2,596 2,596 2,596 2,596 2,596 2,596 2,596
Warehouse (1980) Square feet 3,239 3,239 3,239 3,239 3,239 3,239 3,239 3,239 3,239 3,239
Buildings & Grounds (1987) Square feet 8,700 8,700 8,700 8,700 8,700 8,700 8,700 8,700 8,700 8,700
Farmhouse (1905) Square feet 2,243 2,243 1,500 1,500 1,500 1,500 1,500 1,500 1,500 1,500
Transportation (1954) Square feet 15,713 15,713 8,400 8,400 8,400 8,400 8,400 8,400 8,400 8,400
Vine Street (1922) Square feet 3,502 3,502 3,502 3,502 3,502 3,502 3,502 3,502 3,502 3,502
Early Learning Center Square feet 55,228 55,228 8,320 8,320 N/A N/A N/A N/A N/A N/A
117

Wes
terv
ille
Cit
y S
choo
l Dis
tric
tE
duca
tion
al a
nd O
pera
ting
Sta
tist
ics
Las
t Ten
Sch
ool Y
ears
2002
-03
2003
-04
2004
-05
2005
-06
2006
-07
2007
-08
2008
-09
2009
-10
2010
-11
2011
-12
3rd
Gra
de A
chie
vem
ent T
ests
:
Rea
ding
N/A
87%
85%
87%
88%
87%
86%
86%
90%
88%
M
ath
N/A
N/A
77%
83%
90%
89%
88%
84%
92%
90%
4th
Gra
de P
rofi
cien
cy/A
chie
vem
ent T
ests
:
Wri
ting
87%
88%
88%
90%
86%
87%
90%
N/A
N/A
N/A
R
eadi
ng78
%83
%88
%84
%90
%91
%89
%87
%91
%92
%
Mat
hem
atic
s73
%78
%72
%86
%85
%81
%88
%86
%85
%91
%
Cit
izen
ship
77%
74%
77%
N/A
N/A
N/A
N/A
N/A
N/A
N/A
S
cien
ce69
%75
%66
%N
/AN
/AN
/AN
/AN
/AN
/AN
/A
5th
Gra
de A
chie
vem
ent T
ests
R
eadi
ngN
/AN
/A84
%85
%88
%82
%86
%85
%83
%88
%
Mat
hem
atic
sN
/AN
/AN
/A69
%67
%67
%75
%80
%79
%82
%
Sci
ence
N/A
N/A
N/A
N/A
75%
74%
82%
82%
82%
82%
S
ocia
l Stu
dies
N/A
N/A
N/A
N/A
69%
73%
77%
N/A
N/A
N/A
6th
Gra
de P
rofi
cien
cy/A
chie
vem
ent T
ests
:
Wri
ting
85%
95%
90%
N/A
N/A
N/A
N/A
N/A
N/A
N/A
R
eadi
ng74
%71
%76
%89
%81
%86
%86
%91
%91
%90
%
Mat
hem
atic
s66
%72
%72
%76
%79
%83
%82
%84
%85
%86
%
Cit
izen
ship
83%
80%
82%
N/A
N/A
N/A
N/A
N/A
N/A
N/A
S
cien
ce78
%73
%73
%N
/AN
/AN
/AN
/AN
/AN
/AN
/A
7th
Gra
de A
chie
vem
ent T
ests
:
Rea
ding
N/A
N/A
N/A
88%
85%
84%
86%
86%
84%
87%
M
athe
mat
ics
N/A
N/A
74%
81%
84%
79%
86%
81%
87%
85%
W
riti
ngN
/AN
/AN
/AN
/A91
%87
%85
%N
/AN
/AN
/A
8th
Gra
de A
chie
vem
ent T
ests
:
Rea
ding
N/A
N/A
89%
86%
88%
88%
83%
88%
90%
91%
M
athe
mat
ics
N/A
N/A
78%
80%
83%
82%
84%
83%
82%
89%
S
cien
ceN
/AN
/AN
/AN
/A69
%70
%71
%75
%77
%84
%
Soc
ial S
tudi
esN
/AN
/AN
/AN
/A60
%68
%65
%N
/AN
/AN
/A
9th
Gra
de P
rofi
cien
cy T
ests
:
Wri
ting
97%
98%
N/A
N/A
N/A
N/A
N/A
N/A
N/A
N/A
R
eadi
ng97
%98
%N
/AN
/AN
/AN
/AN
/AN
/AN
/AN
/A
Mat
hem
atic
s89
%92
%N
/AN
/AN
/AN
/AN
/AN
/AN
/AN
/A
Cit
izen
ship
94%
96%
N/A
N/A
N/A
N/A
N/A
N/A
N/A
N/A
S
cien
ce91
%94
%N
/AN
/AN
/AN
/AN
/AN
/AN
/AN
/A
10th
Gra
de O
hio
Gra
duat
ion
Tes
t:
Wri
ting
N/A
N/A
86%
93%
94%
93%
95%
92%
94%
93%
R
eadi
ngN
/A77
%96
%95
%90
%92
%91
%92
%93
%93
%
Mat
hem
atic
sN
/A69
%91
%91
%87
%89
%90
%91
%92
%91
%
Soc
ial S
tudi
esN
/AN
/A90
%90
%84
%91
%90
%93
%91
%91
%
Sci
ence
N/A
N/A
84%
84%
79%
85%
85%
83%
85%
87%
11th
Gra
de O
hio
Gra
duat
ion
Tes
t:(a
)
Wri
ting
N/A
N/A
N/A
N/A
N/A
N/A
N/A
N/A
N/A
97%
R
eadi
ngN
/AN
/AN
/AN
/AN
/AN
/AN
/AN
/AN
/A97
%
Mat
hem
atic
sN
/ AN
/AN
/AN
/AN
/AN
/AN
/AN
/AN
/A96
%
Soc
ial S
tudi
esN
/AN
/AN
/AN
/AN
/AN
/AN
/AN
/AN
/A95
%
Sci
ence
N/A
N/A
N/A
N/A
N/A
N/A
N/A
N/A
N/A
93%
118
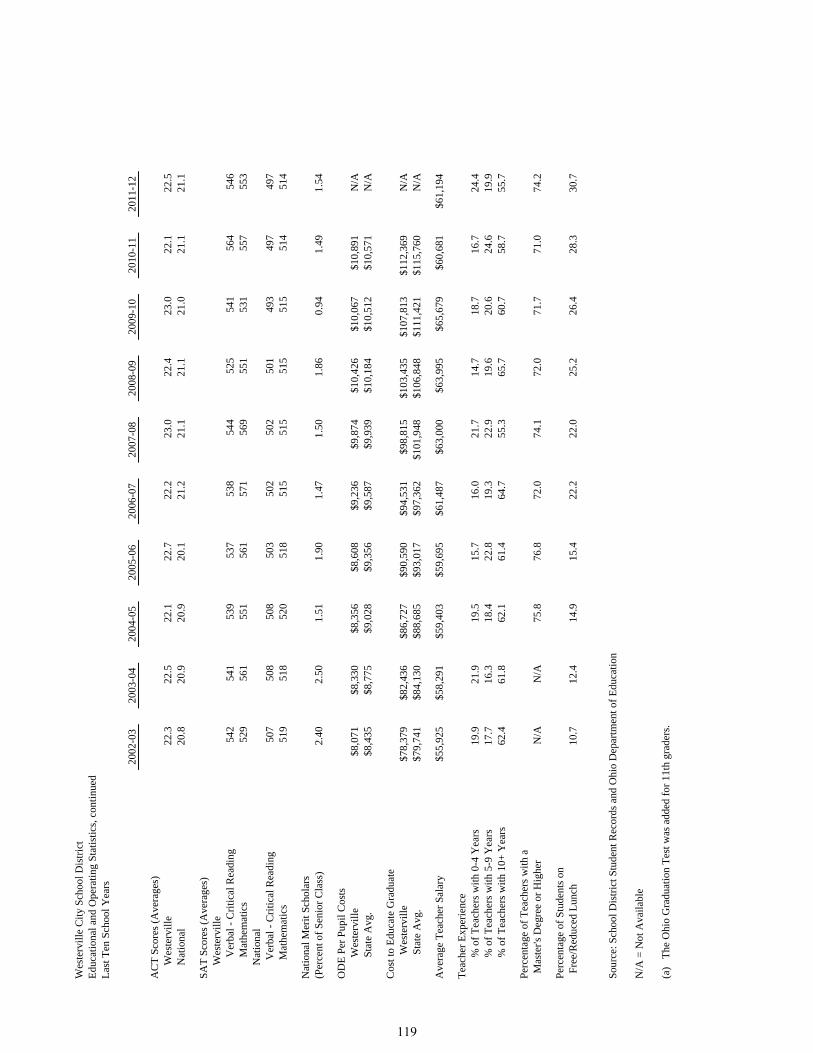
Wes
terv
ille
Cit
y S
choo
l Dis
tric
tE
duca
tion
al a
nd O
pera
ting
Sta
tist
ics,
con
tinu
edL
ast T
en S
choo
l Yea
rs
2002
-03
2003
-04
2004
-05
2005
-06
2006
-07
2007
-08
2008
-09
2009
-10
2010
-11
2011
-12
AC
T S
core
s (A
vera
ges)
W
este
rvil
le22
.322
.522
.122
.722
.223
.022
.423
.022
.122
.5
Nat
iona
l20
.820
.920
.920
.121
.221
.121
.121
.021
.121
.1
SA
T S
core
s (A
vera
ges)
W
este
rvil
le
V
erba
l - C
riti
cal R
eadi
ng54
254
153
953
753
854
452
554
156
454
6
M
athe
mat
ics
529
561
551
561
571
569
551
531
557
553
N
atio
nal
Ver
bal -
Cri
tica
l Rea
ding
507
508
508
503
502
502
501
493
497
497
Mat
hem
atic
s51
951
852
051
851
551
551
551
551
451
4
Nat
iona
l Mer
it S
chol
ars
(Per
cent
of
Sen
ior
Cla
ss)
2.40
2.50
1.51
1.90
1.47
1.50
1.86
0.94
1.49
1.54
OD
E P
er P
upil
Cos
ts
W
este
rvil
le$8
,071
$8,3
30$8
,356
$8,6
08$9
,236
$9,8
74$1
0,42
6$1
0,06
7$1
0,89
1N
/A
S
tate
Avg
.$8
,435
$8,7
75$9
,028
$9,3
56$9
,587
$9,9
39$1
0,18
4$1
0,51
2$1
0,57
1N
/A
Cos
t to
Edu
cate
Gra
duat
e
Wes
terv
ille
$78,
379
$82,
436
$86,
727
$90,
590
$94,
531
$98,
815
$103
,435
$107
,813
$112
,369
N/A
S
tate
Avg
.$7
9,74
1$8
4,13
0$8
8,68
5$9
3,01
7$9
7,36
2$1
01,9
48$1
06,8
48$1
11,4
21$1
15,7
60N
/A
Ave
rage
Tea
cher
Sal
ary
$55,
925
$58,
291
$59,
403
$59,
695
$61,
487
$63,
000
$6
3,99
5$6
5,67
9$6
0,68
1$6
1,19
4
Tea
cher
Exp
erie
nce
% o
f T
each
ers
wit
h 0-
4 Y
ears
19.9
21.9
19.5
15.7
16.0
21.7
14.7
18.7
16.7
24.4
% o
f T
each
ers
wit
h 5-
9 Y
ears
17.7
16.3
18.4
22.8
19.3
22.9
19.6
20.6
24.6
19.9
% o
f T
each
ers
wit
h 10
+ Y
ears
62.4
61.8
62.1
61.4
64.7
55.3
65.7
60.7
58.7
55.7
Per
cent
age
of T
each
ers
wit
h a
Mas
ter's
Deg
ree
or H
ighe
rN
/AN
/A75
.876
.872
.074
.172
.071
.771
.074
.2
Per
cent
age
of S
tude
nts
on
Fre
e/R
educ
ed L
unch
10.7
12.4
14.9
15.4
22.2
22.0
25.2
26.4
28.3
30.7
Sou
rce:
Sch
ool D
istr
ict S
tude
nt R
ecor
ds a
nd O
hio
Dep
artm
ent o
f E
duca
tion
N/A
= N
ot A
vail
able
(a)
The
Ohi
o G
radu
atio
n T
est w
as a
dded
for
11t
h gr
ader
s.
119
120
Westerville City School District
Westerville, Ohio
(This page left intentionally blank)