western region technical attachment february 13, 1996 ... · scan echo areal coverage is 75 percent...
TRANSCRIPT

Western Region Technical Attachment No. 96-04
February 13, 1996
INITIAL COMPARISON OF WSR-88D PRECIPITATION PRODUCTS AND RAIN GAGE PRECIPITATION FOR
NORTHWESTERN CALIFORNIA
Linnae M. Neyman - NWSO Eureka, CA
Introduction
The accuracy of the one hour precipation (OHP) and storm total precipation (STP) in estimating maritime airmass precipitation in mountainous areas is initially explored to begin to identify strengths and weaknesses. Five separate OHP accumulations from a network of rain gages spanning two cases were compared to the corresponding OHP products from the KBHX radar (Eureka) in northwest California. These data were from two separate days. Also, a seven hour rain gage accumulation estimate was compared to the corresponding STP product from one case. Results indicate fairly large discrepancies between gage and radar data. Possible strategies are presented to improve the accuracy of these products.
Method
Hourly rain gage data were obtained from California alert network gages in Del Norte, Humboldt, Mendocino, and Trinity Counties in northwest California. Storm totals were also obtained from cooperative observers in Shelter Cove and Fortuna, and from the National Weather Service gage in Eureka. Figure 1 shows the types and locations of the gages used in this study. These data were compared to the OHP and STP products from the KBHX radar by visual inspection of the four times magnified radar charts.
The OHP radar precipitation estimate was considered to agree with the gage estimate if the radar precipitation value in a range bin at or adjoining the rain gage locat ion was within ±0.05 inches of the rain gage amount. This was chosen because the Fischer Porter rain gages read out in 0.1 0 inch increments. The radar STP estimate and the gage accumulation were in agreement if the precipitation value in a range bin at or adjoining the rain gage location was within 0.10 inches of the rain gage amount.
Case 1: April 13, 1995
A strong, fast moving storm brought one to three inches of rain to the radar area over about 18 hours. Precipitation areas moved north northeast, training over the same locations as the system moved east. The precipitation was mostly low topped and stratiform in character, with most echo tops below 20,000 ft MSL.

OHP products from 00 to 01 UTC and 01 to 02 UTC were compared to rain gage estimates from the same time periods, in Table 1. Nineteen rain gages were used each hour for a total of 38 samples. The radar estimates agreed with 52 percent of the rain gage estimates.
Case 2: April 27, 1995
A weaker, slower moving storm as compared to the previous case, brought around 0.75 to 1.50 inches of rain over three days. This was also stratiform type precipitation with low storm tops.
OHP products from 10 to 11 UTC, 11 to 12 UTC and 12 to 13 UTC were compared to the rain gage estimates for the same time frames (Table 2). Sixteen rain gages were used for the comparison, providing 48 samples in three hours. Sixty-eight percent of the samples agreed.
Also, the radar STP product from 07 to 14 UTC was compared to the rain gage estimates and cooperative observer reports for the same time period (Table 2). Nineteen rain gage totals were compared to STP values, with 8 values (42 percent) falling within the 0.10 inch tolerance allowed.
Results
Underestimation
The OHP product estimated less rainfall than the verification data for 34 percent of the measurements for both cases. This is partially due to the radar beam overshooting the low topped stratiform precipitation at a distance from the RDA. Beam blockage also is a problem at KBHX due to higher terrain northeast through southeast of the RDA.
Radar underestimation of precipitation due to the beam overshooting the precipitation could be at least partially mitigated by using an elevation angle lower than 0.5 degrees. Then the radar beam would sample precipitation out to greater ranges where the beam is not blocked by terrain. Using a negative elevation angle was suggested by Haro (1995) as a way to improve sampling of lower stratiform layers for the Reno radar. Reynolds (1995) states that a zero degree elevation slice would be needed to significantly improve the precipitation estimates in shallow warm cloud systems sampled by the Monterey radar.
Overestimation
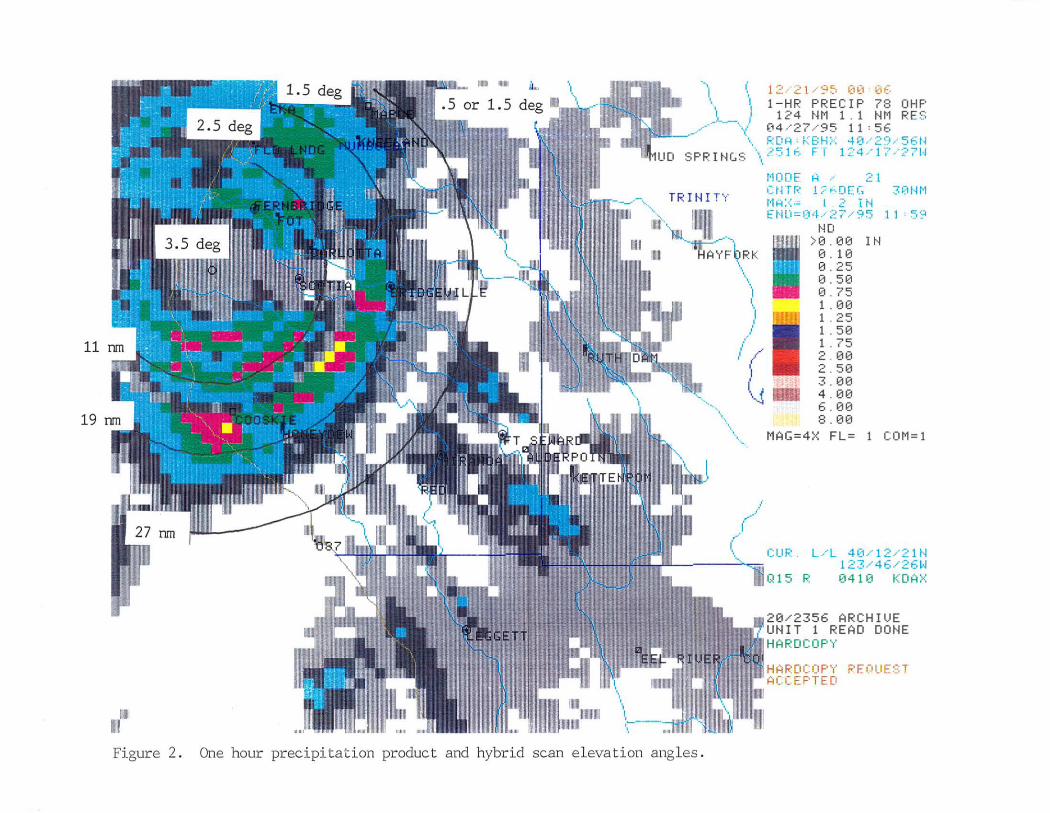
The OHP product estimated more rainfall than the gages did for 8 percent of the samples. All events occurred in case 2. This was probably mostly due to bright band contamination. Bright bands, rings of higher reflectivity surrounding the radar, result when the beam samples the melting level of the precipitation. On April 27 at 12Z, the upper-air sounding
2

at Medford, Oregon (MFR) crossed zero degrees Celsius at 7500 ft MSL. This height corresponds to the height of the bright band on Figure 2 that extends from southwest of Cooskie to west of Bridgeville. These bright band reflectivities are converted to high precipitation estimates.
The STP product (Figure 3) shows the accumulated effect of precipitation overestimation. Radar-estimated storm totals were higher than the rain gage accumulations in 37 percent of the samples. 26 percent of the STP values were very high, ~ 200% of the gage value (Table 2). Figures 2 and 3 are examples of precipitation products with several bright bands, each associated with a slice of the hybrid scan (see Appendix for an explanation of the hybrid scan and other precipitation processing tools). A partial solution to the bright band problem within 27 nm of the radar is to further modify the hybrid scan to use lower elevation angles. This could remove most of the bright band problem within that radius by using the reflectivity data from a lower level.
The bi-scan maximization technique (Appendix) could make the bright band problem beyond 27 nm worse by choosing the elevation angle with the highest reflectivity. One possible way to mitigate the problem of overestimating precipitation beyond 27 nm is to turn off bi -scan maximization, and force the algorithms to use the lowest elevation. A request has been approved to do this at KBHX.
Conclusion
Bright band contamination likely caused overestimation of precipitation by the radar in 12 percent of the samples, while beam blockage and the beam overshooting precipitation tops appeared to cause underestimation in 29 percent of the samples at KBHX radar. These problems degrade the usefulness of the radar precipitation products.
Although the sample size was small, this study provided ideas about possible ways to increase the accuracy of the OHP and the STP products. These were:
1. Modify the hybrid scan to use lower elevation angles within 27 nm of the RDA for precipitation processing during bright band contamination;
2. Have a switch to turn off bi-scan maximization if that would help to minimize bright band contamination beyond 27 nm;
3. Allow hill top radars to use a zero degree elevation angle to keep the beam in the precipitation for a greater distance. This would maximize the usable range of the radar where terrain permits.
Research is planned to use archive II data on the Scientific Applications Computer workstation to test some of these ideas this winter. A future study will gather enough data to make a radar/ rain gage comparison for each gage. Also, research to compare upper
3

air data with the quantity and elevation of bright band contamination may prove useful in an attempt to mitigate the problem, i.e., identifying a melting level of the day and assigning a best hybrid scan for the situation.
Acknowledgments: The author wishes to thank Mel Nordquist, Mary Cairns and Dennis Gettman for their helpful contributions to this Technical Attachment ..
References
Operations Training Branch, 1994: WSR-880 Operations Training Student Guide. Operational Support Facility; Norman OK; Topic 8 Lesson 5 pp 9-13.
Haro, J.A. , 1995: Problems associated with a mountain top radar's precipitation products during a stratiform precipitation event. Western Region Technical Attachment No. 95-18.
Reynolds, O.W. , 1995: The Warm Rain Process and WSR-880. Western Region Technical Attachment No. 95-08.
4

Appendix
Radar Precipitation Processing Tools
Several different precipitation processing adjustments affect radar precipitation estimates.
The hybrid scan attempts to sample the reflectivity at 3000 ft AGL for precipitation processing (OTB 1994) by using the following angles and ranges. Since KBHX is located at 2516 ft MSL the beam centerline heights are included below.
degrees 3.4 2.4 1.5 0 . 5 or 1.5
nm 1 - 11
11-19 19-27 27-124
beam centerline (ft MSL) 2720 - 6750 5510-7630 5720-7350 4480 - 20380 7350-33360
The KBHX radar is near a hilltop with surrounding terrain that varies from sea level to 5500 ft MSL within a radius of 30 nm around the RDA. The precipitation processing algorithms employ a modified hybrid scan and an occultation data file to minimize the effects of beam blockage.
The tilt test is used to reject the 0.5 degree scan for precipitation processing if the 0.5 scan echo areal coverage is 75 percent greater than echo areal coverage in the 1.5 degree scan. The 75 percent threshold approved by the WSR-880 Operational Support Facility for the tilt test at BHX was a modification of the original 50 percent MXPCT value.
If the 0.5 degree elevation angle passes the tilt test, the angle that is used for precipitation processing from 27-124 nm is decided by the modified hybrid scan and the bi-scan maximization technique. Bi-scan maximization is designed to reduce the effects of beam losses at far ranges due to blockage and non-standard propagation (OTB 1994). If the tilt test is passed, the radar uses the highest reflectivity detected at the 0.5 and the 1.5 degree elevation scans to calculate precipitation for each range bin.
5

Table 1. RAIN GAGE VS OHP 4/13/95
* = OHP verified with rain gage H = OHP higher than rain gage L = OHP lower than rain gage
00 - 01 UTC . ..... ..... GAGE NAME GAGE RADAR RMRKS ELK VALLEY . 20 0 L GASQUET . 20 . 0 1 - . 09 L DR FINE BR .16 . 01- . 09 L ORLEANS . 20 0 L ORICK . 12 . 10 - . 4 9 * HOOPA .30 . 10- . 49 * OKANE .30 . 10 - . 49 * MUD SPRINGS .08 .01-.09 * BRIDGEVILLE . 10 . 10-.49 * RUTH DAM . 20 .10-.49 * HONEYDEW . 20 .01-.09 L MI RANDA .24 .10 - .49 * FT SEWARD .16 .10-.49 * KETTENPOM . 28 .10 - .49 * LEGGETT . 36 .01 - . 09 L COVELO 0 0 * WILLITS 0 0 * YORKVILLE 0 0 * NWS EKA . 06 0 L
6
01 - 02 UTC . . .... . .. .. GAGE RADAR RMRKS .10 0 L .10 .01-.09 * . 20 0 L .10 0 L . 12 0 * .10 . 01-.09 * . 10 .10- . 49 * . 18 0 L . 10 . 01-.09 * . 20 0 L . 20 . 01- . 09 L . 1 6 .10- . 49 * .12 .01 - . 09 * .26 0 L . 20 0 L . 28 .01- . 09 L . 16 0 L . 0 0 L . 08 .10 - . 49 *

Table 2. RAIN GAGE AND COOPERATIVE OBSERVER VS RADAR 4/27/95
* = OHP verified with rain gage H = OHP higher than rain gage L = OHP lower than ra in gage
10 - 11 UTC ..... . . .. . . GAGE NAME GAGE RADAR RMRK~
ELK VALLEY 0 0 * GASQUET .10 .01 - . 09 * DR FINE BR .04 0 * ORLEANS 0 0 * ORICK .08 .01 -.09 * HOOPA 0 .10- .24 H MUD SPRNGS 0 0 * BRIDGEVILLE . 20 . 01- . 09 L RUTH DAM 0 0 * HONEYDEW .10 .25-.49 H MIRANDA .12 .25-.49 H FT SEWARD . 12 . 10-.24 * KETTENPOM 0 0 * COVELO 0 0 * WILLITS 0 0 * YORKVILLE 0 0 *
12 - 13 UTC ........... GAGE NAME GAGE RADAR RMRKS ELK VALLEY . 10 0 L GASQUET .10 0 * DR FINE BR .20 0 L ORLEANS . 1 0 0 L ORICK .16 . 10-.24 * HOOPA .10 . 1 0- .24 * MUD SPRNGS .04 0 * BRIDGEVILLE 0 0 * RUTH DAM .10 . 0 1 - . 09 * HONEYDEW .10 . 0 1 - . 09 * MIRANDA .04 . 01- . 09 * FT SEWARD 0 . 0 1 - .09 * KETTENPOM .10 . 01-.09 * COVELO .20 . 01 -. 09 L WILLITS .04 0 * YORKVILLE .10 0 L NWS EUREKA SHELTER COV FORTUNA
7
11 - 12 UTC . . ... . ..... GAGE RADAR RMRKS
0 0 * 0 0 *
.12 .01 - .09 *
.20 .01-.09 L
.08 .01-.09 *
. 10 .10-.24 *
.02 .01- . 09 * 0 .25-.49 H 0 .01-.09 H
.10 .25- . 49 H
.04 .10 - .24 H
.08 .01-.09 *
. 06 .01 - . 09 *
.04 .01-.09 *
.08 0 L 0 0 *
STP 07 - 14 UTC ....... GAGE RADAR RMRKS Cr adar/aaa el
.20 .01-.29 *
.30 .01- . 29 *
.52 .01-.29 L ( . 55)
.30 .01-.29 *
.52 .60-.99 *
.30 .60-.99 H (2 . 00)
.04 .01-.29 *
.40 .60 - .99 H (1.50)
.10 .01-.29 *
.40 2 . 0-2.5 H ( 5. 00)
.48 1.0-1.5 H (2. 08)
.44 .01 -.29 L ( . 65)
.28 .01-.29 *
. 28 .01-.29 *
.32 0 L ( 0)
.40 0 L ( 0)
.42 2.0-2 . 5 H (4.76)
.80 1.0-1.5 H (1.25)
.55 1.5-2.0 H (2.72)

\~, ~i J._ ........ ~-· ... .. .... ~· .... L---· -··· ._7,_..,. .... ~.--- .. ·--- .._.._....,..~··-r· .. - ··-·
Dr Finf §r. ·+Elk{ valley
l~ Ga~quet t)(r ~
~ \ \ .. ·.
• I
I I ~ +0,:- 1 e an S .~rL':• Orick 'J _ • .-_. 1'
p ~:. • -•'1 I j ~- ~---------------
/ t-··-.. 11 f _..1 \ I, ·-. -, I
.. } .,1 \-··-.1 ,.1 ~ +Hoop~ ~
i- ,•. 1\·-.. -·· .... ') ~ ·'
MXEureka ~~ ~Mud Springsr)
I I
/· xFor tuna \ l .• - ... .J .. ~
10 r ·
~l "- +Bridge v 11 e _{' _ _,_--·--·---•
....... ---1 .---- ---
J - - --+Ruth oay __ f'-- ·. __ .. -~oney~ew oFt· Seward ~ ~'\.. oMira da - I ~·
"'· .... ~ s Ke t ten porn ,1. r.-' l ·--..~ ~I I {
l~Shel ter Co\ e _ ,.,....J )
...._\ ;I ___ / \ ~ cCovilo 1 l \ _ _)_l .• ,l
\ . l-, - L, f~ (. L - '~
x - 4" or 8" gage (0.01 in.) t __ __.....---..:,_~ s -Storage (0.02 in.) \l oWil ilts i· ,.L
1 ____ ., ..
o -Tipping Bucket (0.04 in.) 'l ~ + - Fischer Porter ( 0.10 in. ) '\ 1 '-~---1 I I
.a , J I
· ~~l l~ r ,_, ,. \ l, •
1 ~:.. I I ·
•
i, ,_,. 1._:_.__. ,r ! ... --Figure 1. Rain gage l ocat~~n , 1 ....------~~ • r
and type. "'~ +Yorkvih~ \_ ·-.-1_ I ..... ....--r -.... ;a \ ~-• ..... : •.. -_J ... } •. ~
·... • , I I ·-.. __ ... .. .. ·r- ~-~ .. 1._1 I ~
I 11 I
\ l ...
~~~~
I
SPRINC.S
12 -· 2 1 ,· 9~· 01::1 6 6 1-HR PRECIP 78 OHP
12 4 NM 1 . 1 NM RES ~14 / 27 /95 11 =5 6
\ ROR ·K8H~ 40/ 2? / 5 6 N \ ? 5 l t=. F" T 1 ::::· 4 / l ·,~ · "? 7 l~
'· f•100E H .. · 2 1 C t~fF.' l :;: r . [I[C, 3~Hm
r·1R:<-= l ;;:: 1 N EN0= 0 4 /27 / 95 11 ~9
NO >0 . 00 1 N
0 . 10 0 . 25 0 . 50 0 . 75 1 . 00 1 . 25 1 . 50 1 . 75 2 . 00 2 . 50 3 . 00
1m 4 . 00 6 . 00 8 . 00
\~ MAG=4 X FL= 1 COM=l
CUR. L/ L 4 0 / 12 / 2 1N ~-~:\ :;~:ar:·~:~:~ · · '·-· if'-· ' t · -~ -.. ~... 1 2 3 / 4 6 / 2 6 w
Q15 R 0410 KOA X
20 / 2356 AR CHIVE UNIT 1 READ DONE HARD COP \'
HARD CO PY PEOUEST ACCEP TED
Figure 2 . One hour precipitation product and hybrid scan elevation angl es .

Figure 3. Storm total precipitation product and hybrid scan elevations .
l 1 2 / 2 ~j ... ~::.. 23 5:·· l STM PRECIP 80 \ 124 Nt1 1 . 1 NM l 04 / 27 -'95 14. 05
STP P.ES
f.~ OH' tO·:H>: 41J .· .:::·"' / !::•t:. ~l 2 516 FT 1 2 4 ' 1 ,· . ··::.· ~' l·i t·1A :·<= 3 . ~: I tl t·10DE A / ~: 1 CNTR 8 ? 0E G l UNM 8EG; 04 '27·95 02 : J3
, : .!' E!W..:134.' 2 <'·'9 '5 l 4 0 7' NO
>B. 0 IN 0 .3 0.6 1 . 0 1 . 5 2.0 2.5 3.0 4.0 5.0 6.0 8.0
10.0 12.0 15.0
FL= 1 CfJt1= 1
CUR . L/L 40 / 30/ 28N 12 4 / 04 / 29 l·J
Q15 R 0410 KDA X
20 / 2356 ARCHIVE UNIT 1 READ DONE HARDCOP\'
HAR DCOP Y REOUES T ACCEPTED