west wind laboratory, inc - golden gate bridge ... wind laboratory, inc ggb sds 2 table of contents...
TRANSCRIPT

WEST WIND LABORATORY, INC
GGB SDS
1
WIND STUDY GOLDEN GATE BRIDGE for HNTB Job No. 13-03 10 June 2013 by Jon D. Raggett, PhD, PE President, West Wind Laboratory, Inc.

WEST WIND LABORATORY, INC
GGB SDS
2
TABLE OF CONTENTS CHAPTER TITLE PAGE A INTRODUCTION AND OBJECTIVES 3 B STABILITY ANALYSES
BRIDGE WITH SDS AND AERODYNAMIC ENHANCEMENTS 10
C WIND LOAD INPUT FOR A FATIGUE ANALYSIS
OF THE NET STRUTS 29 APPENDIX TITLE PAGE 1 WIND ENVIRONMENT AT THE SITE 63 2 FACILITY 65 3 PROCEDURE TO PREDICT FULL BRIDGE MOTIONS
IN STRONG TURBULENT WINDS 67 4 IDENTIFICATION PROCEDURE FOR FLUTTER
DERIVATIVES FROM SECTION MODEL TESTS 71 5 MODEL 79 6 AERODYNAMIC INPUT PARAMETERS 84 7 BRIDGE INPUT PARAMETERS
FINAL BRIDGE CONFIGURATION 94 8 REFERENCES 109
WEST WIND LABORATORY, INC
GGB SDS
3
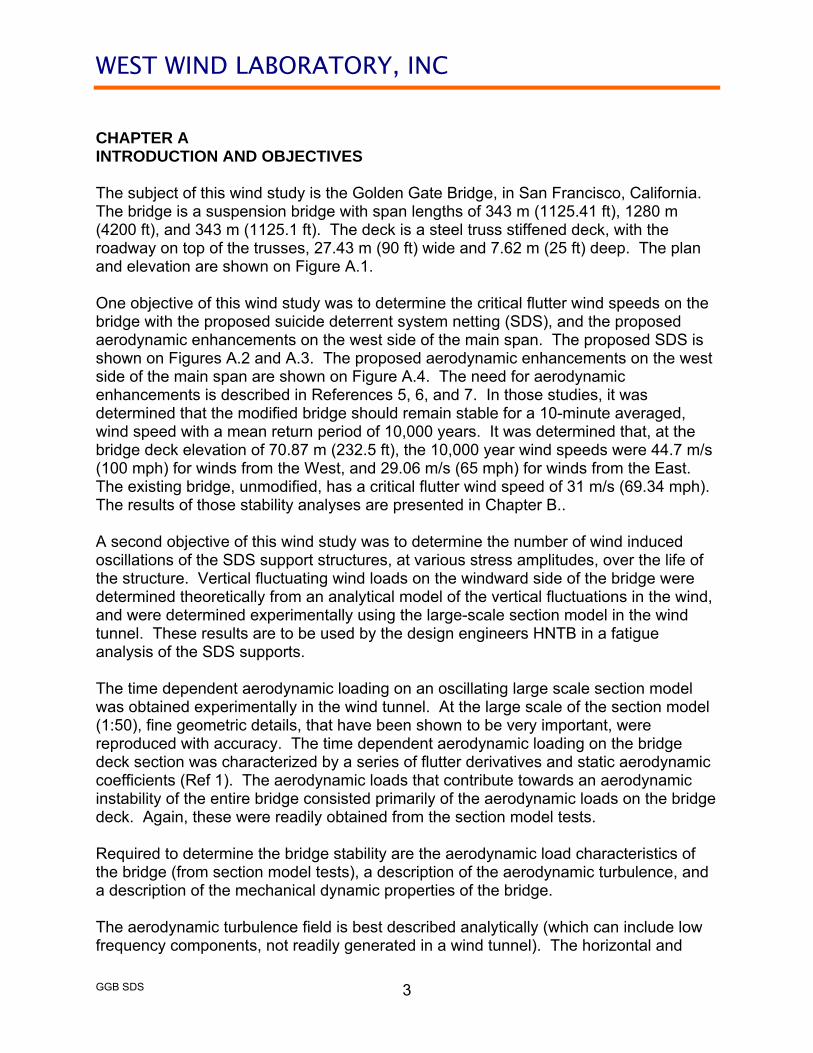
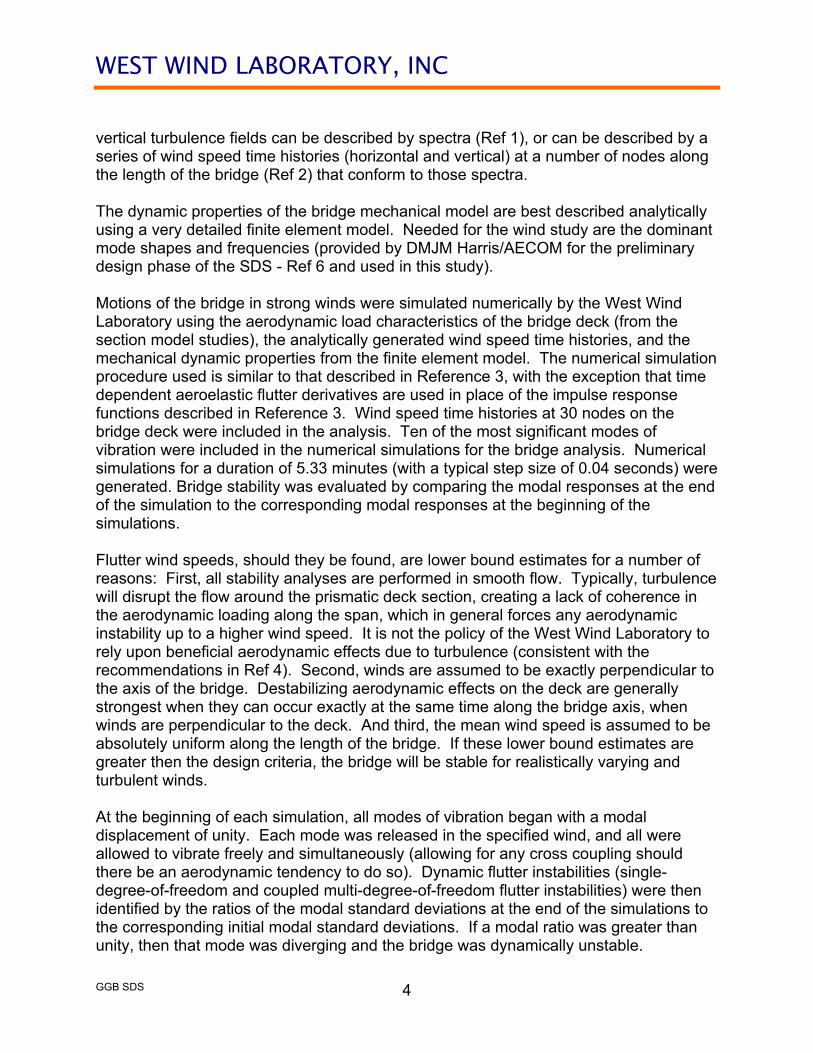
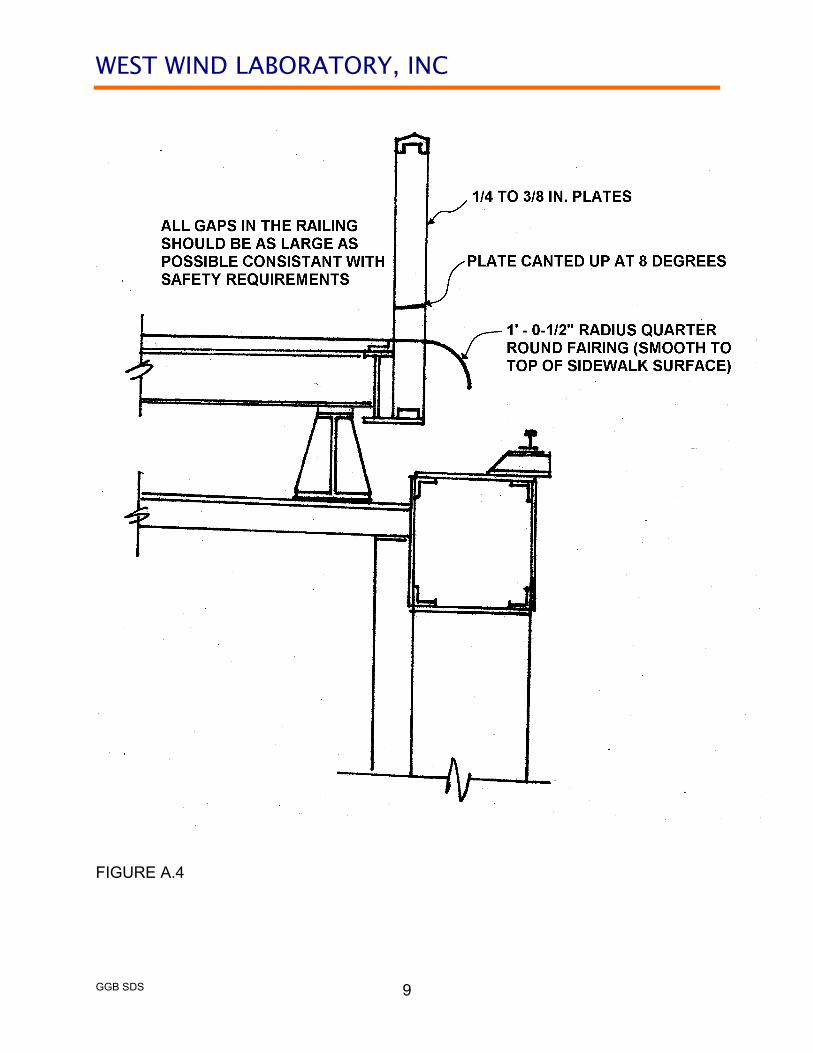
CHAPTER A INTRODUCTION AND OBJECTIVES The subject of this wind study is the Golden Gate Bridge, in San Francisco, California. The bridge is a suspension bridge with span lengths of 343 m (1125.41 ft), 1280 m (4200 ft), and 343 m (1125.1 ft). The deck is a steel truss stiffened deck, with the roadway on top of the trusses, 27.43 m (90 ft) wide and 7.62 m (25 ft) deep. The plan and elevation are shown on Figure A.1. One objective of this wind study was to determine the critical flutter wind speeds on the bridge with the proposed suicide deterrent system netting (SDS), and the proposed aerodynamic enhancements on the west side of the main span. The proposed SDS is shown on Figures A.2 and A.3. The proposed aerodynamic enhancements on the west side of the main span are shown on Figure A.4. The need for aerodynamic enhancements is described in References 5, 6, and 7. In those studies, it was determined that the modified bridge should remain stable for a 10-minute averaged, wind speed with a mean return period of 10,000 years. It was determined that, at the bridge deck elevation of 70.87 m (232.5 ft), the 10,000 year wind speeds were 44.7 m/s (100 mph) for winds from the West, and 29.06 m/s (65 mph) for winds from the East. The existing bridge, unmodified, has a critical flutter wind speed of 31 m/s (69.34 mph). The results of those stability analyses are presented in Chapter B.. A second objective of this wind study was to determine the number of wind induced oscillations of the SDS support structures, at various stress amplitudes, over the life of the structure. Vertical fluctuating wind loads on the windward side of the bridge were determined theoretically from an analytical model of the vertical fluctuations in the wind, and were determined experimentally using the large-scale section model in the wind tunnel. These results are to be used by the design engineers HNTB in a fatigue analysis of the SDS supports. The time dependent aerodynamic loading on an oscillating large scale section model was obtained experimentally in the wind tunnel. At the large scale of the section model (1:50), fine geometric details, that have been shown to be very important, were reproduced with accuracy. The time dependent aerodynamic loading on the bridge deck section was characterized by a series of flutter derivatives and static aerodynamic coefficients (Ref 1). The aerodynamic loads that contribute towards an aerodynamic instability of the entire bridge consisted primarily of the aerodynamic loads on the bridge deck. Again, these were readily obtained from the section model tests. Required to determine the bridge stability are the aerodynamic load characteristics of the bridge (from section model tests), a description of the aerodynamic turbulence, and a description of the mechanical dynamic properties of the bridge. The aerodynamic turbulence field is best described analytically (which can include low frequency components, not readily generated in a wind tunnel). The horizontal and
WEST WIND LABORATORY, INC
GGB SDS
4
vertical turbulence fields can be described by spectra (Ref 1), or can be described by a series of wind speed time histories (horizontal and vertical) at a number of nodes along the length of the bridge (Ref 2) that conform to those spectra. The dynamic properties of the bridge mechanical model are best described analytically using a very detailed finite element model. Needed for the wind study are the dominant mode shapes and frequencies (provided by DMJM Harris/AECOM for the preliminary design phase of the SDS - Ref 6 and used in this study). Motions of the bridge in strong winds were simulated numerically by the West Wind Laboratory using the aerodynamic load characteristics of the bridge deck (from the section model studies), the analytically generated wind speed time histories, and the mechanical dynamic properties from the finite element model. The numerical simulation procedure used is similar to that described in Reference 3, with the exception that time dependent aeroelastic flutter derivatives are used in place of the impulse response functions described in Reference 3. Wind speed time histories at 30 nodes on the bridge deck were included in the analysis. Ten of the most significant modes of vibration were included in the numerical simulations for the bridge analysis. Numerical simulations for a duration of 5.33 minutes (with a typical step size of 0.04 seconds) were generated. Bridge stability was evaluated by comparing the modal responses at the end of the simulation to the corresponding modal responses at the beginning of the simulations. Flutter wind speeds, should they be found, are lower bound estimates for a number of reasons: First, all stability analyses are performed in smooth flow. Typically, turbulence will disrupt the flow around the prismatic deck section, creating a lack of coherence in the aerodynamic loading along the span, which in general forces any aerodynamic instability up to a higher wind speed. It is not the policy of the West Wind Laboratory to rely upon beneficial aerodynamic effects due to turbulence (consistent with the recommendations in Ref 4). Second, winds are assumed to be exactly perpendicular to the axis of the bridge. Destabilizing aerodynamic effects on the deck are generally strongest when they can occur exactly at the same time along the bridge axis, when winds are perpendicular to the deck. And third, the mean wind speed is assumed to be absolutely uniform along the length of the bridge. If these lower bound estimates are greater then the design criteria, the bridge will be stable for realistically varying and turbulent winds. At the beginning of each simulation, all modes of vibration began with a modal displacement of unity. Each mode was released in the specified wind, and all were allowed to vibrate freely and simultaneously (allowing for any cross coupling should there be an aerodynamic tendency to do so). Dynamic flutter instabilities (single-degree-of-freedom and coupled multi-degree-of-freedom flutter instabilities) were then identified by the ratios of the modal standard deviations at the end of the simulations to the corresponding initial modal standard deviations. If a modal ratio was greater than unity, then that mode was diverging and the bridge was dynamically unstable.

WEST WIND LABORATORY, INC
GGB SDS
5
Critical threshold wind speeds used typically are 10-minute averaged wind speeds (to allow a sufficient time for an instability to develop). Since an instability can lead to a catastrophic failure of the bridge, such instabilities should be avoided at all cost. Should an instability be identified, it should not occur for a wind less than a very extreme event. The wind speed criteria used for this study are presented in Appendix 1.
WEST WIND LABORATORY, INC
GGB SDS
6
FIGURE A.1
WEST WIND LABORATORY, INC
GGB SDS
7
FIGURE A.2

WEST WIND LABORATORY, INC
GGB SDS
8
FIGURE A.3
WEST WIND LABORATORY, INC
GGB SDS
9
FIGURE A.4

WEST WIND LABORATORY, INC
GGB SDS
10
CHAPTER B STABILITY ANALYSES BRIDGE WITH SDS AND AERODYNAMIC ENHANCEMENTS Stability analyses were performed for the existing bridge configuration which is defined specifically in Appendix 7. Aerodynamic stability analyses were performed for eight cases. Those cases are defined in Table B.1. CASE FAIRINGS SDS ANGLE OF INCIDENCE (DEGREES) 10 WINDWARD NO 0 20 LEEWARD NO 0 30 WINDWARD YES 0 40 WINDWARD YES -3 50 WINDWARD YES +3 60 LEEWARD YES 0 70 LEEWARD YES -3 80 LEEWARD YES +3 TABLE B.1 - CASES STUDIED Cases 10 and 20 are the bases, without the SDS, to be used for comparison, and to be used to evaluate specifically the effect of the SDS on the aerodynamic stability of the GGB, Flutter wind speeds, should they be found, are lower bound estimates for a number of reasons: The stability of the bridge is evaluated primarily from the smooth flow results. Typically, turbulence will disrupt the flow around the prismatic deck section, creating a lack of coherence in the aerodynamic loading along the span, which in general forces any aerodynamic instability up to a higher wind speed. It is not the policy of the West Wind Laboratory to rely upon beneficial aerodynamic effects due to turbulence (consistent with the recommendations in Ref 4). Second, winds are assumed to be exactly perpendicular to the axis of the bridge. Destabilizing aerodynamic effects on the deck are generally strongest when they can occur exactly at the same time along the bridge axis, when winds are perpendicular to the deck. And third, the mean wind speed is assumed to be absolutely uniform along the length of the bridge. If these lower bound estimates are greater than the design criteria, the bridge will be stable for realistically varying and turbulent winds. At the beginning of each simulation, all modes of vibration began with a modal displacement of unity. Each mode was released in the specified wind, and all were allowed to vibrate freely and simultaneously (allowing for any cross coupling should
WEST WIND LABORATORY, INC
GGB SDS
11
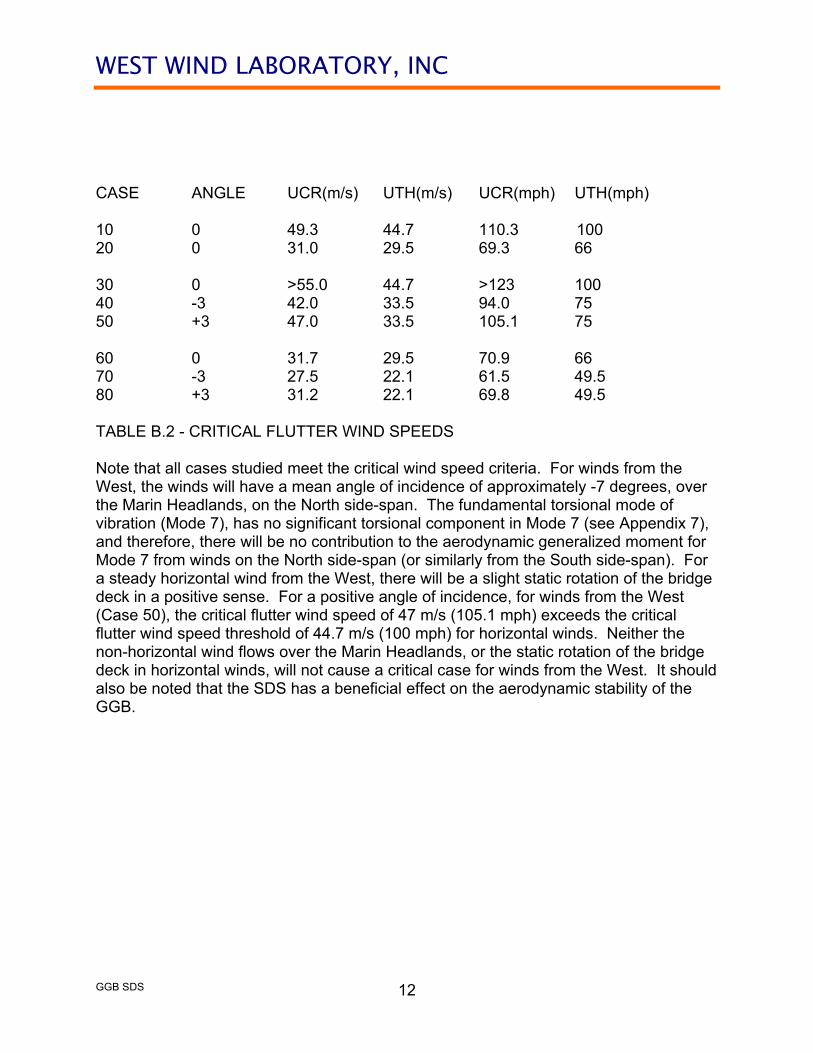
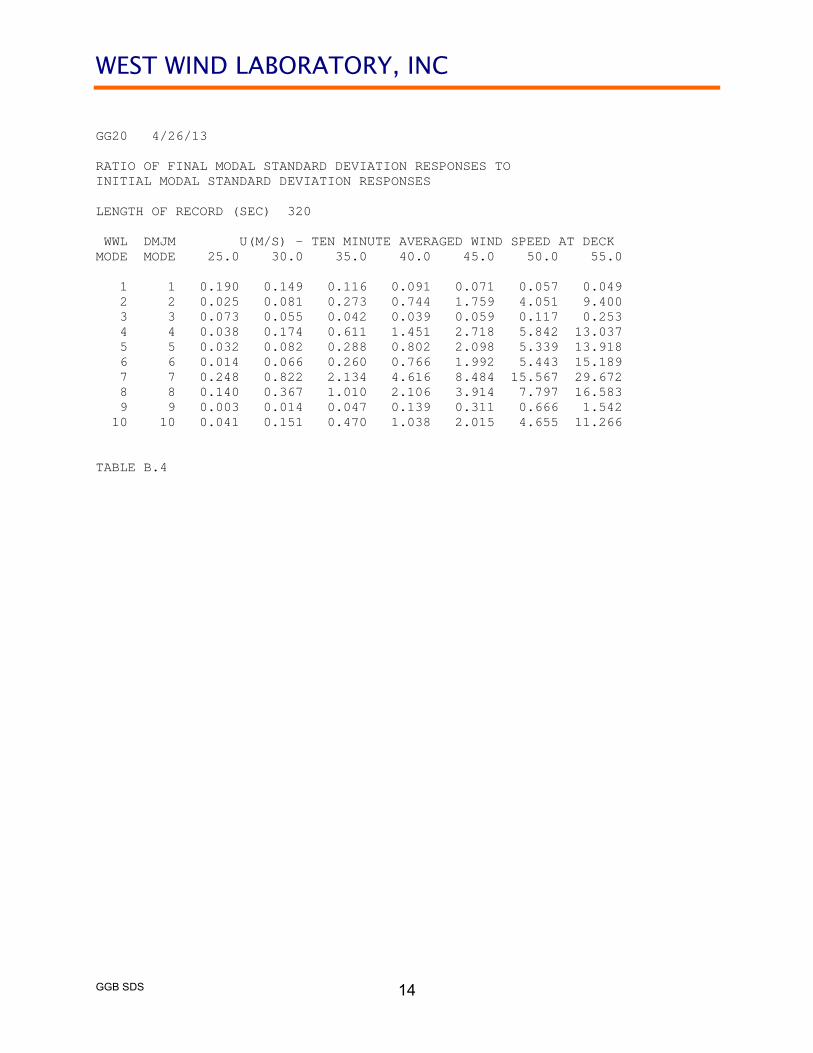
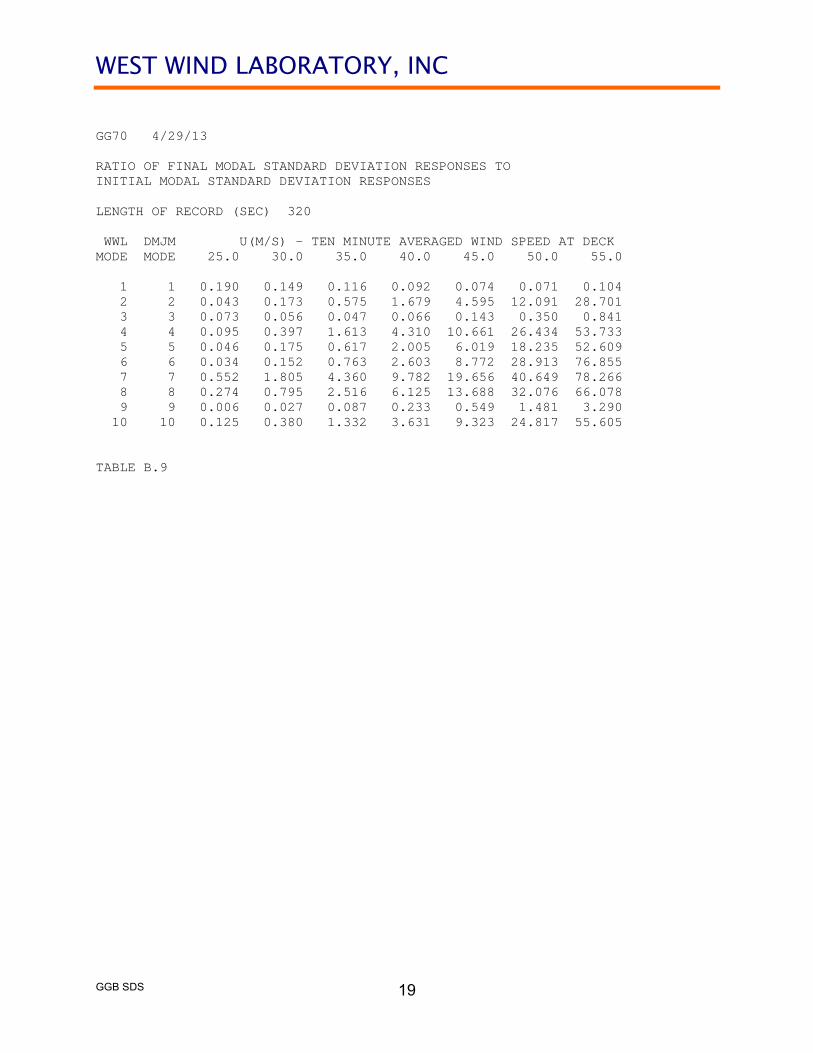
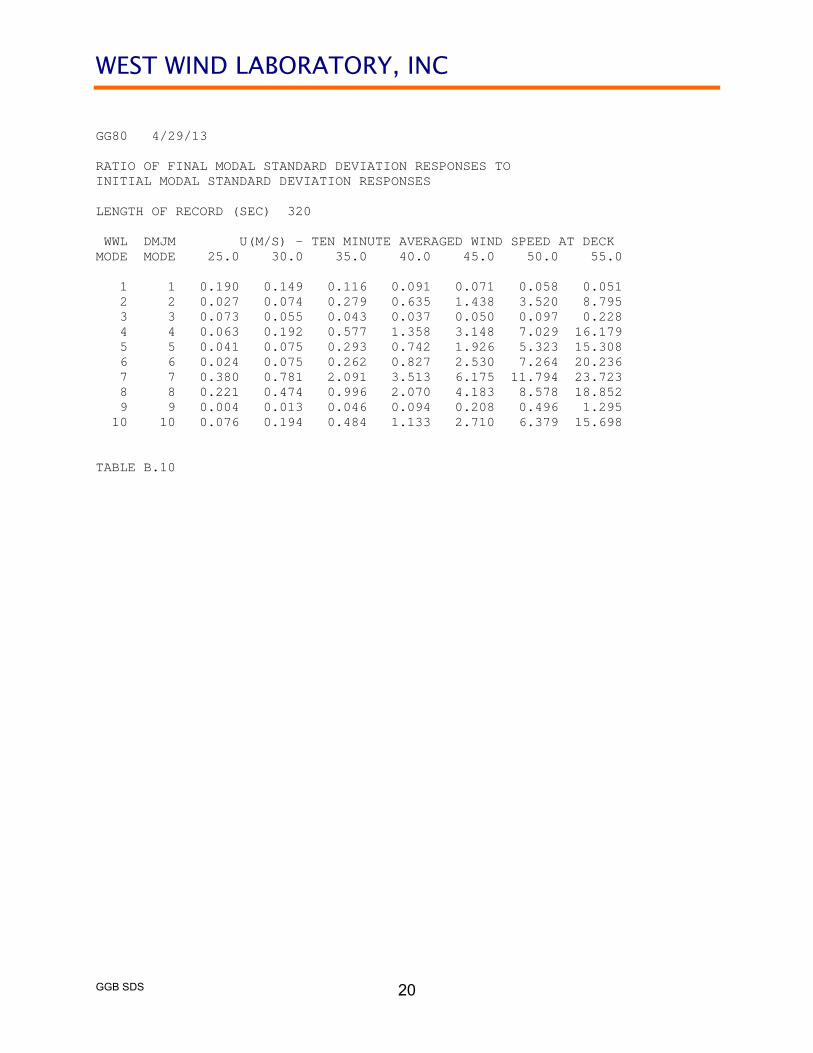
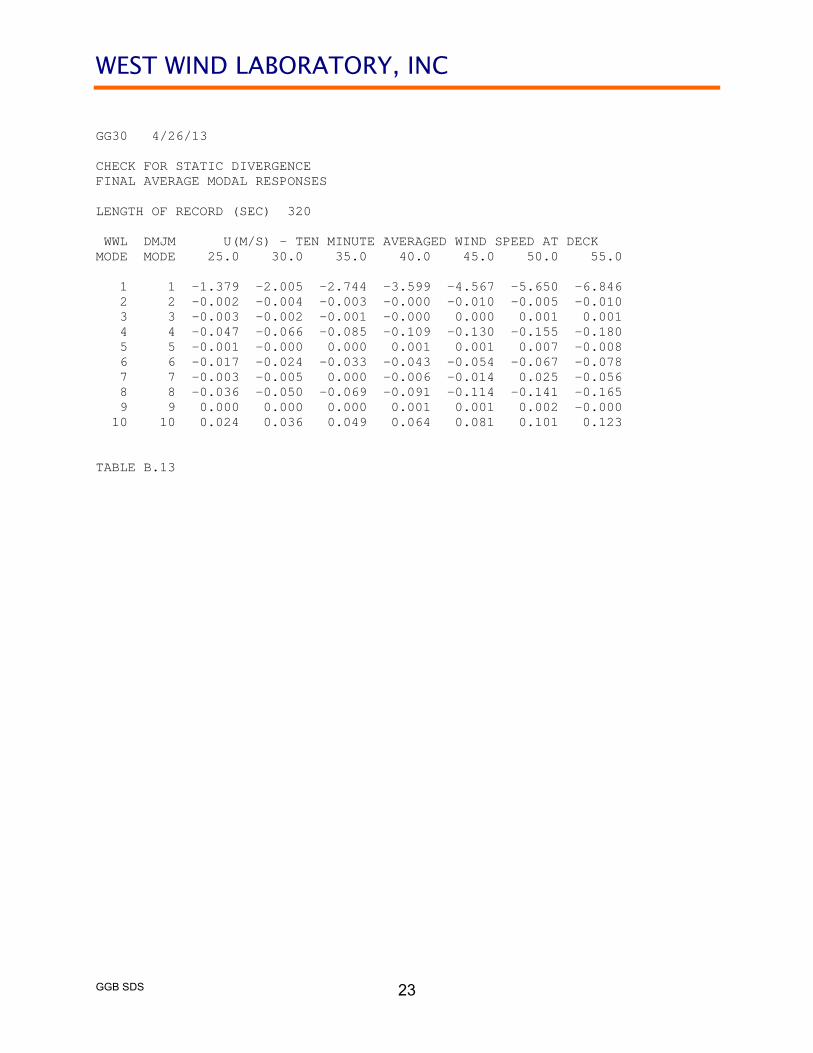
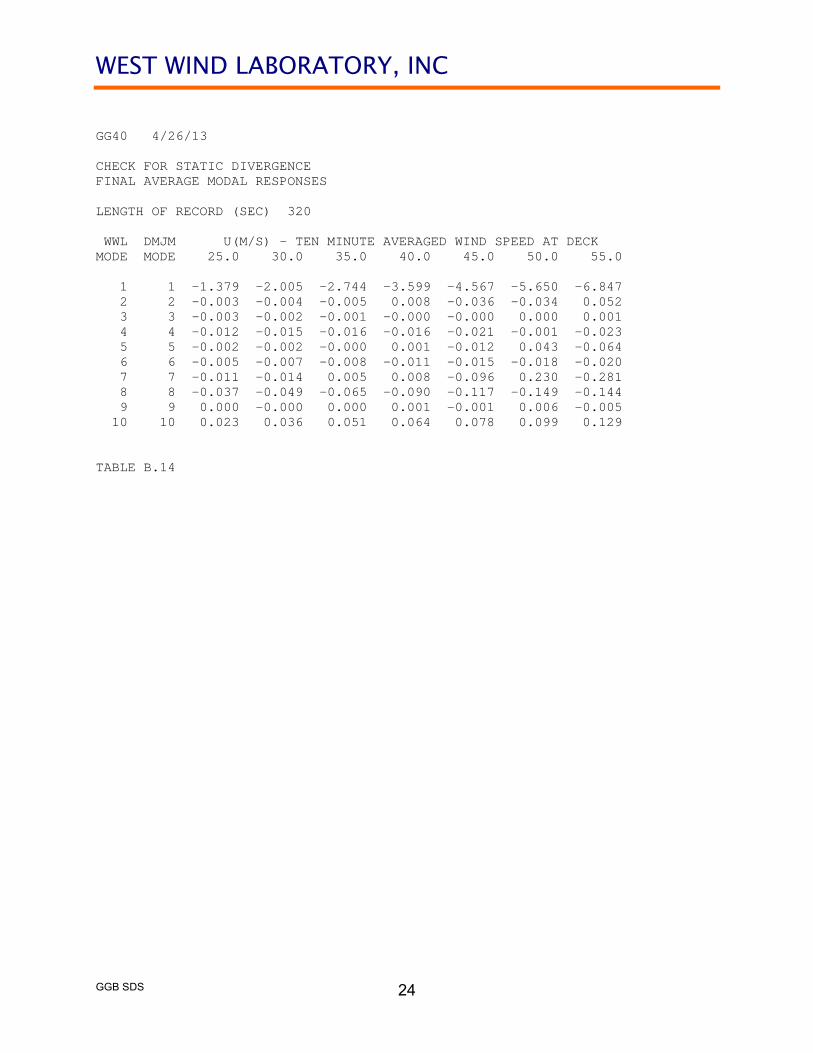
there be an aerodynamic tendency to do so). Dynamic flutter instabilities (single-degree-of-freedom and coupled multi-degree-of-freedom flutter instabilities) were then identified by the ratios of the modal standard deviations at the end of the simulations to the corresponding initial modal standard deviations. If a modal ratio was greater than unity, then that mode was diverging and the bridge was dynamically unstable. The modal ratios are shown in Tables B.3 through B. 10 for Cases 10 through 80 respectively. Another form of an aeroelastic instability is static divergence (at a specified wind speed the bridge deforms without bound, but without oscillations). Final modal deformations at various wind speed are presented in Tables B.11 through B.18 for Cases 10 through 80 respectively. While some Mode 1 (sway) responses are very large at the end of the numerical simulations, those motions are expected and do not represent a static divergence. No static divergence instabilities were identified for any mode of vibration for any of the eight cases studied. Critical threshold wind speeds used typically are 10-minute averaged wind speeds (to allow a sufficient time for an instability to develop). Since an instability can lead to a catastrophic failure of the bridge, such instabilities should be avoided at all cost. Should an instability be identified, it should not occur for a wind less than a very extreme event. A wind speed with a return period of at least 10,000 years was used as critical flutter threshold wind speed for the final configuration. In Appendix 1 the maximum 10-minute averaged wind speed, at the site, at the bridge deck elevation of 70.87 m (232.5 ft) , with a return period of 10,000 years, was determined to be 44.7 m/s (100 mph) for winds from the West, and 29.50 m/s (66 mph) for winds from the East, for horizontal winds. Wind speeds for non-horizontal winds are less likely to occur. It is standard practice to use reduced critical flutter wind speed thresholds for non-horizontal winds. For mean wind angles of incidence of plus or minus 3 degrees, critical flutter wind speeds equal to 0.75 of the corresponding 0 degree angle of incidence values typically were used. For mean wind angles of incidence of plus or minus 3 degrees, the corresponding critical flutter wind speed thresholds, UTH, are 33.53 m/s (75 mph) for winds from the West, and 22.13 m/s (49.50 mph) for winds from the East. Stability analyses were performed for mean wind speeds up to 55 m/s (123.03 mph). No instabilities were identified up to this wind speed for Case 30 (fairing to windward - West wind - with the SDS). For all other cases, a torsional instability did occur (Mode 7) for wind speeds less than 55 m/s (123.03 mph). Critical flutter wind speeds, UCR, identified (from Tables B.3 through B.10) are summarized in Table B.2.
WEST WIND LABORATORY, INC
GGB SDS
12
CASE ANGLE UCR(m/s) UTH(m/s) UCR(mph) UTH(mph) 10 0 49.3 44.7 110.3 100 20 0 31.0 29.5 69.3 66 30 0 >55.0 44.7 >123 100 40 -3 42.0 33.5 94.0 75 50 +3 47.0 33.5 105.1 75 60 0 31.7 29.5 70.9 66 70 -3 27.5 22.1 61.5 49.5 80 +3 31.2 22.1 69.8 49.5 TABLE B.2 - CRITICAL FLUTTER WIND SPEEDS Note that all cases studied meet the critical wind speed criteria. For winds from the West, the winds will have a mean angle of incidence of approximately -7 degrees, over the Marin Headlands, on the North side-span. The fundamental torsional mode of vibration (Mode 7), has no significant torsional component in Mode 7 (see Appendix 7), and therefore, there will be no contribution to the aerodynamic generalized moment for Mode 7 from winds on the North side-span (or similarly from the South side-span). For a steady horizontal wind from the West, there will be a slight static rotation of the bridge deck in a positive sense. For a positive angle of incidence, for winds from the West (Case 50), the critical flutter wind speed of 47 m/s (105.1 mph) exceeds the critical flutter wind speed threshold of 44.7 m/s (100 mph) for horizontal winds. Neither the non-horizontal wind flows over the Marin Headlands, or the static rotation of the bridge deck in horizontal winds, will not cause a critical case for winds from the West. It should also be noted that the SDS has a beneficial effect on the aerodynamic stability of the GGB.

WEST WIND LABORATORY, INC
GGB SDS
13
GG10 4/26/13 RATIO OF FINAL MODAL STANDARD DEVIATION RESPONSES TO INITIAL MODAL STANDARD DEVIATION RESPONSES LENGTH OF RECORD (SEC) 320 WWL DMJM U(M/S) - TEN MINUTE AVERAGED WIND SPEED AT DECK MODE MODE 25.0 30.0 35.0 40.0 45.0 50.0 55.0 1 1 0.190 0.149 0.116 0.091 0.071 0.056 0.044 2 2 0.018 0.024 0.032 0.048 0.112 0.237 0.631 3 3 0.073 0.055 0.042 0.031 0.024 0.020 0.025 4 4 0.021 0.043 0.074 0.135 0.237 0.549 0.980 5 5 0.042 0.031 0.040 0.054 0.142 0.319 0.933 6 6 0.008 0.017 0.032 0.068 0.147 0.469 1.078 7 7 0.100 0.128 0.231 0.350 0.643 1.124 2.419 8 8 0.071 0.101 0.131 0.217 0.330 0.735 1.276 9 9 0.001 0.002 0.004 0.008 0.017 0.031 0.075 10 10 0.034 0.049 0.068 0.115 0.192 0.496 0.960 TABLE B.3
WEST WIND LABORATORY, INC
GGB SDS
14
GG20 4/26/13 RATIO OF FINAL MODAL STANDARD DEVIATION RESPONSES TO INITIAL MODAL STANDARD DEVIATION RESPONSES LENGTH OF RECORD (SEC) 320 WWL DMJM U(M/S) - TEN MINUTE AVERAGED WIND SPEED AT DECK MODE MODE 25.0 30.0 35.0 40.0 45.0 50.0 55.0 1 1 0.190 0.149 0.116 0.091 0.071 0.057 0.049 2 2 0.025 0.081 0.273 0.744 1.759 4.051 9.400 3 3 0.073 0.055 0.042 0.039 0.059 0.117 0.253 4 4 0.038 0.174 0.611 1.451 2.718 5.842 13.037 5 5 0.032 0.082 0.288 0.802 2.098 5.339 13.918 6 6 0.014 0.066 0.260 0.766 1.992 5.443 15.189 7 7 0.248 0.822 2.134 4.616 8.484 15.567 29.672 8 8 0.140 0.367 1.010 2.106 3.914 7.797 16.583 9 9 0.003 0.014 0.047 0.139 0.311 0.666 1.542 10 10 0.041 0.151 0.470 1.038 2.015 4.655 11.266 TABLE B.4

WEST WIND LABORATORY, INC
GGB SDS
15
GG30 4/26/13 RATIO OF FINAL MODAL STANDARD DEVIATION RESPONSES TO INITIAL MODAL STANDARD DEVIATION RESPONSES LENGTH OF RECORD (SEC) 320 WWL DMJM U(M/S) - TEN MINUTE AVERAGED WIND SPEED AT DECK MODE MODE 25.0 30.0 35.0 40.0 45.0 50.0 55.0 1 1 0.190 0.149 0.116 0.091 0.071 0.056 0.044 2 2 0.017 0.022 0.033 0.035 0.047 0.102 0.164 3 3 0.073 0.055 0.042 0.031 0.023 0.018 0.014 4 4 0.022 0.026 0.057 0.138 0.124 0.230 0.410 5 5 0.041 0.031 0.038 0.038 0.057 0.135 0.246 6 6 0.008 0.010 0.025 0.072 0.076 0.185 0.436 7 7 0.088 0.097 0.206 0.234 0.260 0.502 0.648 8 8 0.077 0.057 0.098 0.221 0.163 0.292 0.528 9 9 0.001 0.001 0.003 0.005 0.007 0.014 0.019 10 10 0.031 0.035 0.048 0.121 0.103 0.206 0.399 TABLE B.5

WEST WIND LABORATORY, INC
GGB SDS
16
GG40 4/26/13 RATIO OF FINAL MODAL STANDARD DEVIATION RESPONSES TO INITIAL MODAL STANDARD DEVIATION RESPONSES LENGTH OF RECORD (SEC) 320 WWL DMJM U(M/S) - TEN MINUTE AVERAGED WIND SPEED AT DECK MODE MODE 25.0 30.0 35.0 40.0 45.0 50.0 55.0 1 1 0.190 0.149 0.116 0.091 0.071 0.056 0.044 2 2 0.029 0.032 0.043 0.100 0.367 0.642 0.800 3 3 0.073 0.055 0.042 0.031 0.027 0.029 0.030 4 4 0.048 0.106 0.158 0.234 0.639 1.692 2.686 5 5 0.046 0.047 0.052 0.114 0.458 0.859 1.183 6 6 0.018 0.043 0.072 0.125 0.456 1.618 3.146 7 7 0.226 0.316 0.355 0.644 1.986 2.845 2.911 8 8 0.132 0.220 0.267 0.344 0.870 2.209 3.352 9 9 0.003 0.005 0.007 0.015 0.049 0.086 0.096 10 10 0.061 0.105 0.135 0.183 0.535 1.535 2.539 TABLE B.6

WEST WIND LABORATORY, INC
GGB SDS
17
GG50 4/26/13 RATIO OF FINAL MODAL STANDARD DEVIATION RESPONSES TO INITIAL MODAL STANDARD DEVIATION RESPONSES LENGTH OF RECORD (SEC) 320 WWL DMJM U(M/S) - TEN MINUTE AVERAGED WIND SPEED AT DECK MODE MODE 25.0 30.0 35.0 40.0 45.0 50.0 55.0 1 1 0.190 0.149 0.116 0.091 0.071 0.056 0.045 2 2 0.017 0.019 0.057 0.128 0.141 0.925 5.390 3 3 0.073 0.055 0.042 0.032 0.024 0.034 0.163 4 4 0.024 0.045 0.119 0.305 0.301 0.789 5.046 5 5 0.038 0.033 0.062 0.143 0.166 1.325 8.701 6 6 0.009 0.018 0.053 0.154 0.196 0.670 5.608 7 7 0.108 0.194 0.442 0.783 0.706 3.783 17.967 8 8 0.091 0.117 0.216 0.477 0.417 1.044 6.395 9 9 0.001 0.003 0.009 0.020 0.020 0.129 0.727 10 10 0.032 0.057 0.110 0.262 0.240 0.689 4.710 TABLE B.7

WEST WIND LABORATORY, INC
GGB SDS
18
GG60 4/26/13 RATIO OF FINAL MODAL STANDARD DEVIATION RESPONSES TO INITIAL MODAL STANDARD DEVIATION RESPONSES LENGTH OF RECORD (SEC) 320 WWL DMJM U(M/S) - TEN MINUTE AVERAGED WIND SPEED AT DECK MODE MODE 25.0 30.0 35.0 40.0 45.0 50.0 55.0 1 1 0.190 0.149 0.116 0.091 0.073 0.072 0.098 2 2 0.026 0.066 0.360 1.561 4.627 11.991 28.610 3 3 0.073 0.055 0.044 0.060 0.144 0.339 0.800 4 4 0.051 0.142 0.705 2.618 9.678 24.258 50.998 5 5 0.033 0.068 0.396 1.788 6.043 17.926 50.854 6 6 0.019 0.055 0.312 1.589 8.301 26.161 69.700 7 7 0.280 0.665 2.735 8.851 19.939 41.273 78.430 8 8 0.177 0.295 1.128 3.757 13.062 30.009 63.945 9 9 0.003 0.011 0.056 0.234 0.650 1.626 3.593 10 10 0.061 0.134 0.575 2.163 8.518 22.382 52.140 TABLE B.8
WEST WIND LABORATORY, INC
GGB SDS
19
GG70 4/29/13 RATIO OF FINAL MODAL STANDARD DEVIATION RESPONSES TO INITIAL MODAL STANDARD DEVIATION RESPONSES LENGTH OF RECORD (SEC) 320 WWL DMJM U(M/S) - TEN MINUTE AVERAGED WIND SPEED AT DECK MODE MODE 25.0 30.0 35.0 40.0 45.0 50.0 55.0 1 1 0.190 0.149 0.116 0.092 0.074 0.071 0.104 2 2 0.043 0.173 0.575 1.679 4.595 12.091 28.701 3 3 0.073 0.056 0.047 0.066 0.143 0.350 0.841 4 4 0.095 0.397 1.613 4.310 10.661 26.434 53.733 5 5 0.046 0.175 0.617 2.005 6.019 18.235 52.609 6 6 0.034 0.152 0.763 2.603 8.772 28.913 76.855 7 7 0.552 1.805 4.360 9.782 19.656 40.649 78.266 8 8 0.274 0.795 2.516 6.125 13.688 32.076 66.078 9 9 0.006 0.027 0.087 0.233 0.549 1.481 3.290 10 10 0.125 0.380 1.332 3.631 9.323 24.817 55.605 TABLE B.9
WEST WIND LABORATORY, INC
GGB SDS
20
GG80 4/29/13 RATIO OF FINAL MODAL STANDARD DEVIATION RESPONSES TO INITIAL MODAL STANDARD DEVIATION RESPONSES LENGTH OF RECORD (SEC) 320 WWL DMJM U(M/S) - TEN MINUTE AVERAGED WIND SPEED AT DECK MODE MODE 25.0 30.0 35.0 40.0 45.0 50.0 55.0 1 1 0.190 0.149 0.116 0.091 0.071 0.058 0.051 2 2 0.027 0.074 0.279 0.635 1.438 3.520 8.795 3 3 0.073 0.055 0.043 0.037 0.050 0.097 0.228 4 4 0.063 0.192 0.577 1.358 3.148 7.029 16.179 5 5 0.041 0.075 0.293 0.742 1.926 5.323 15.308 6 6 0.024 0.075 0.262 0.827 2.530 7.264 20.236 7 7 0.380 0.781 2.091 3.513 6.175 11.794 23.723 8 8 0.221 0.474 0.996 2.070 4.183 8.578 18.852 9 9 0.004 0.013 0.046 0.094 0.208 0.496 1.295 10 10 0.076 0.194 0.484 1.133 2.710 6.379 15.698 TABLE B.10

WEST WIND LABORATORY, INC
GGB SDS
21
GG10 4/26/13 CHECK FOR STATIC DIVERGENCE FINAL AVERAGE MODAL RESPONSES LENGTH OF RECORD (SEC) 320 WWL DMJM U(M/S) - TEN MINUTE AVERAGED WIND SPEED AT DECK MODE MODE 25.0 30.0 35.0 40.0 45.0 50.0 55.0 1 1 -1.379 -2.005 -2.744 -3.599 -4.567 -5.650 -6.847 2 2 -0.002 -0.004 -0.007 -0.002 -0.000 -0.018 0.042 3 3 -0.003 -0.002 -0.001 -0.000 0.000 0.001 0.001 4 4 -0.047 -0.066 -0.086 -0.109 -0.131 -0.152 -0.190 5 5 -0.001 -0.001 0.001 0.003 -0.004 0.016 -0.049 6 6 -0.017 -0.024 -0.033 -0.043 -0.054 -0.067 -0.077 7 7 -0.003 -0.009 0.002 0.012 -0.051 0.077 -0.233 8 8 -0.036 -0.052 -0.066 -0.089 -0.116 -0.141 -0.157 9 9 0.000 0.000 0.000 0.001 -0.000 0.003 -0.004 10 10 0.024 0.035 0.050 0.065 0.080 0.101 0.125 TABLE B.11

WEST WIND LABORATORY, INC
GGB SDS
22
GG20 4/26/13 CHECK FOR STATIC DIVERGENCE FINAL AVERAGE MODAL RESPONSES LENGTH OF RECORD (SEC) 320 WWL DMJM U(M/S) - TEN MINUTE AVERAGED WIND SPEED AT DECK MODE MODE 25.0 30.0 35.0 40.0 45.0 50.0 55.0 1 1 -1.379 -2.005 -2.745 -3.599 -4.568 -5.648 -6.849 2 2 -0.002 0.001 -0.004 0.004 -0.164 0.418 -1.010 3 3 -0.003 -0.002 -0.001 0.000 -0.003 0.007 -0.015 4 4 -0.046 -0.067 -0.092 -0.128 -0.161 -0.073 -0.333 5 5 -0.000 -0.002 -0.008 -0.023 0.009 0.048 -0.211 6 6 -0.017 -0.025 -0.034 -0.045 -0.059 -0.038 -0.131 7 7 0.004 -0.033 -0.123 -0.264 0.025 0.304 -0.972 8 8 -0.037 -0.056 -0.061 -0.065 -0.058 -0.135 -0.172 9 9 0.000 -0.000 -0.001 -0.005 0.006 -0.001 0.004 10 10 0.024 0.033 0.049 0.066 0.089 0.132 0.068 TABLE B.12
WEST WIND LABORATORY, INC
GGB SDS
23
GG30 4/26/13 CHECK FOR STATIC DIVERGENCE FINAL AVERAGE MODAL RESPONSES LENGTH OF RECORD (SEC) 320 WWL DMJM U(M/S) - TEN MINUTE AVERAGED WIND SPEED AT DECK MODE MODE 25.0 30.0 35.0 40.0 45.0 50.0 55.0 1 1 -1.379 -2.005 -2.744 -3.599 -4.567 -5.650 -6.846 2 2 -0.002 -0.004 -0.003 -0.000 -0.010 -0.005 -0.010 3 3 -0.003 -0.002 -0.001 -0.000 0.000 0.001 0.001 4 4 -0.047 -0.066 -0.085 -0.109 -0.130 -0.155 -0.180 5 5 -0.001 -0.000 0.000 0.001 0.001 0.007 -0.008 6 6 -0.017 -0.024 -0.033 -0.043 -0.054 -0.067 -0.078 7 7 -0.003 -0.005 0.000 -0.006 -0.014 0.025 -0.056 8 8 -0.036 -0.050 -0.069 -0.091 -0.114 -0.141 -0.165 9 9 0.000 0.000 0.000 0.001 0.001 0.002 -0.000 10 10 0.024 0.036 0.049 0.064 0.081 0.101 0.123 TABLE B.13
WEST WIND LABORATORY, INC
GGB SDS
24
GG40 4/26/13 CHECK FOR STATIC DIVERGENCE FINAL AVERAGE MODAL RESPONSES LENGTH OF RECORD (SEC) 320 WWL DMJM U(M/S) - TEN MINUTE AVERAGED WIND SPEED AT DECK MODE MODE 25.0 30.0 35.0 40.0 45.0 50.0 55.0 1 1 -1.379 -2.005 -2.744 -3.599 -4.567 -5.650 -6.847 2 2 -0.003 -0.004 -0.005 0.008 -0.036 -0.034 0.052 3 3 -0.003 -0.002 -0.001 -0.000 -0.000 0.000 0.001 4 4 -0.012 -0.015 -0.016 -0.016 -0.021 -0.001 -0.023 5 5 -0.002 -0.002 -0.000 0.001 -0.012 0.043 -0.064 6 6 -0.005 -0.007 -0.008 -0.011 -0.015 -0.018 -0.020 7 7 -0.011 -0.014 0.005 0.008 -0.096 0.230 -0.281 8 8 -0.037 -0.049 -0.065 -0.090 -0.117 -0.149 -0.144 9 9 0.000 -0.000 0.000 0.001 -0.001 0.006 -0.005 10 10 0.023 0.036 0.051 0.064 0.078 0.099 0.129 TABLE B.14

WEST WIND LABORATORY, INC
GGB SDS
25
GG50 4/26/13 CHECK FOR STATIC DIVERGENCE FINAL AVERAGE MODAL RESPONSES LENGTH OF RECORD (SEC) 320 WWL DMJM U(M/S) - TEN MINUTE AVERAGED WIND SPEED AT DECK MODE MODE 25.0 30.0 35.0 40.0 45.0 50.0 55.0 1 1 -1.379 -2.005 -2.744 -3.599 -4.567 -5.650 -6.847 2 2 -0.002 -0.004 -0.005 0.007 0.010 -0.109 0.720 3 3 -0.003 -0.002 -0.001 -0.000 0.000 -0.001 0.007 4 4 -0.082 -0.117 -0.155 -0.200 -0.245 -0.275 -0.472 5 5 -0.000 0.000 0.003 0.005 -0.001 0.057 -0.487 6 6 -0.029 -0.042 -0.056 -0.075 -0.094 -0.116 -0.149 7 7 -0.000 -0.012 0.016 0.020 -0.034 0.269 -1.907 8 8 -0.036 -0.051 -0.065 -0.092 -0.116 -0.141 -0.160 9 9 0.000 0.000 0.001 0.001 0.000 0.009 -0.042 10 10 0.024 0.035 0.051 0.064 0.081 0.103 0.095 TABLE B.15

WEST WIND LABORATORY, INC
GGB SDS
26
GG60 4/26/13 CHECK FOR STATIC DIVERGENCE FINAL AVERAGE MODAL RESPONSES LENGTH OF RECORD (SEC) 320 WWL DMJM U(M/S) - TEN MINUTE AVERAGED WIND SPEED AT DECK MODE MODE 25.0 30.0 35.0 40.0 45.0 50.0 55.0 1 1 -1.379 -2.005 -2.744 -3.598 -4.567 -5.653 -6.946 2 2 -0.001 -0.005 -0.017 0.162 -0.482 -1.079 1.057 3 3 -0.003 -0.002 -0.002 0.003 -0.006 -0.024 0.052 4 4 -0.047 -0.066 -0.079 -0.124 -0.024 -0.235 -0.910 5 5 -0.000 -0.001 0.015 -0.049 0.322 -0.446 1.494 6 6 -0.017 -0.025 -0.031 -0.049 -0.026 -0.019 -1.166 7 7 0.003 -0.033 0.155 -0.416 1.874 -1.529 3.059 8 8 -0.039 -0.051 -0.052 -0.136 0.002 0.338 -1.947 9 9 0.000 -0.000 0.003 -0.009 0.043 0.001 -0.028 10 10 0.023 0.035 0.058 0.041 0.167 0.292 -0.980 TABLE B.16

WEST WIND LABORATORY, INC
GGB SDS
27
GG70 4/29/13 CHECK FOR STATIC DIVERGENCE FINAL AVERAGE MODAL RESPONSES LENGTH OF RECORD (SEC) 320 WWL DMJM U(M/S) - TEN MINUTE AVERAGED WIND SPEED AT DECK MODE MODE 25.0 30.0 35.0 40.0 45.0 50.0 55.0 1 1 -1.379 -2.005 -2.744 -3.599 -4.566 -5.643 -6.937 2 2 -0.003 -0.014 0.021 0.008 0.689 -1.140 3.516 3 3 -0.003 -0.002 -0.001 -0.000 0.012 0.003 -0.014 4 4 -0.012 -0.015 -0.002 -0.056 -0.039 0.405 0.750 5 5 -0.002 -0.004 0.022 -0.096 -0.056 1.237 -3.309 6 6 -0.005 -0.006 -0.005 -0.022 -0.036 0.121 1.126 7 7 -0.030 -0.056 0.261 -0.806 -0.285 4.589 -8.095 8 8 -0.035 -0.036 -0.067 -0.136 -0.252 -0.279 2.887 9 9 -0.000 -0.000 0.004 -0.013 -0.015 0.077 -0.097 10 10 0.024 0.040 0.057 0.028 0.017 0.170 1.852 TABLE B.17

WEST WIND LABORATORY, INC
GGB SDS
28
GG80 4/29/13 CHECK FOR STATIC DIVERGENCE FINAL AVERAGE MODAL RESPONSES LENGTH OF RECORD (SEC) 320 WWL DMJM U(M/S) - TEN MINUTE AVERAGED WIND SPEED AT DECK MODE MODE 25.0 30.0 35.0 40.0 45.0 50.0 55.0 1 1 -1.379 -2.005 -2.744 -3.598 -4.567 -5.650 -6.852 2 2 -0.000 -0.001 -0.025 0.062 -0.104 -0.518 0.969 3 3 -0.003 -0.002 -0.002 0.001 -0.001 -0.007 -0.004 4 4 -0.082 -0.119 -0.157 -0.196 -0.216 -0.251 -0.615 5 5 -0.000 -0.001 0.002 -0.012 0.105 0.016 -0.988 6 6 -0.029 -0.043 -0.056 -0.072 -0.090 -0.075 -0.276 7 7 0.003 -0.039 -0.000 -0.114 0.546 0.093 -2.504 8 8 -0.040 -0.058 -0.050 -0.101 -0.097 -0.000 0.014 9 9 0.000 -0.000 0.001 -0.002 0.013 0.017 -0.038 10 10 0.023 0.032 0.055 0.062 0.098 0.175 0.140 TABLE B.18
WEST WIND LABORATORY, INC
GGB SDS
29
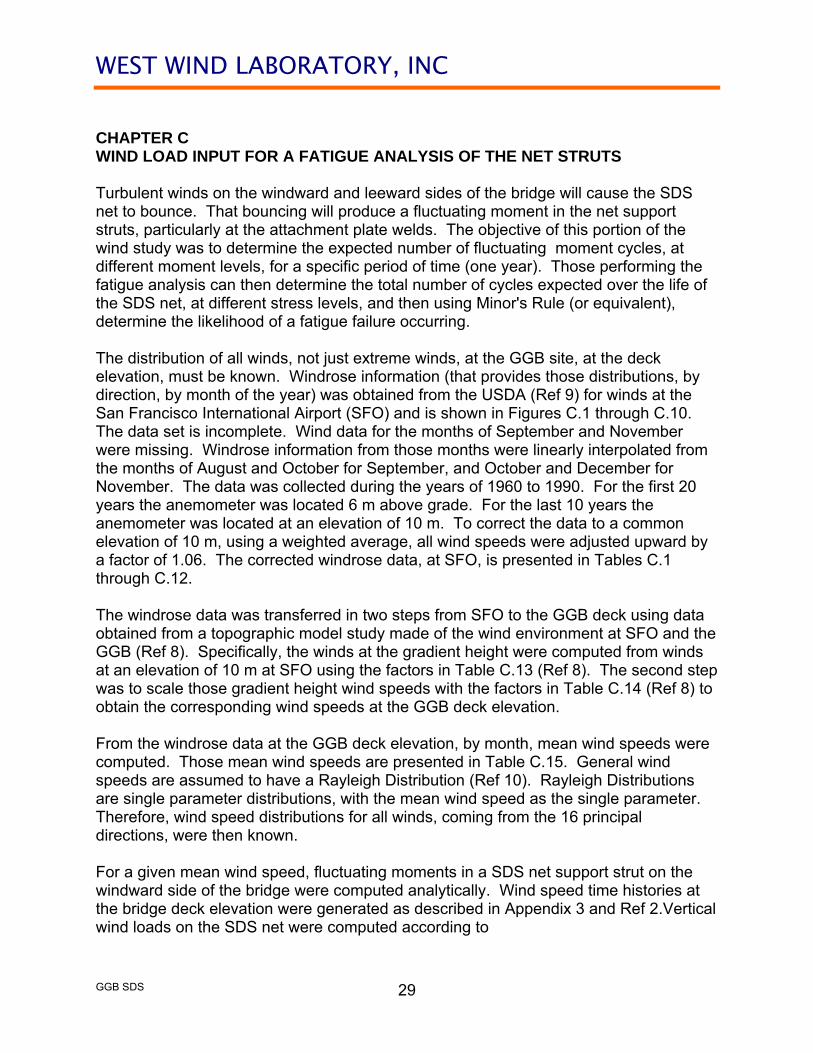
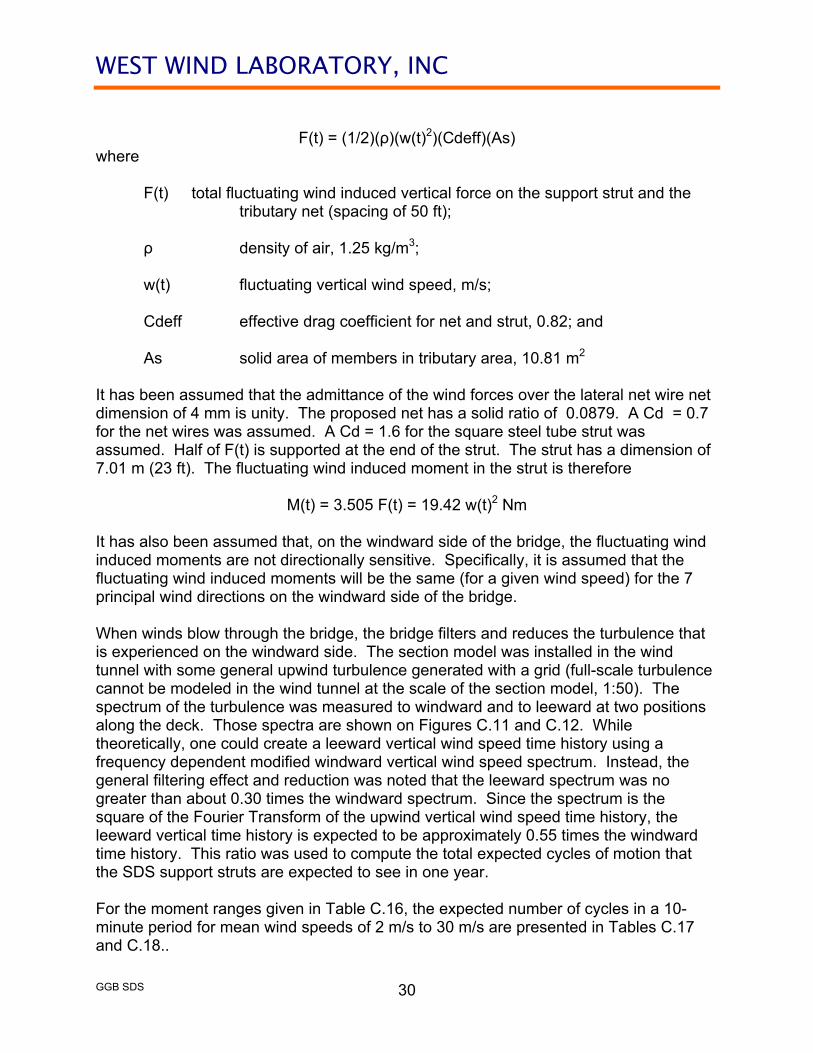
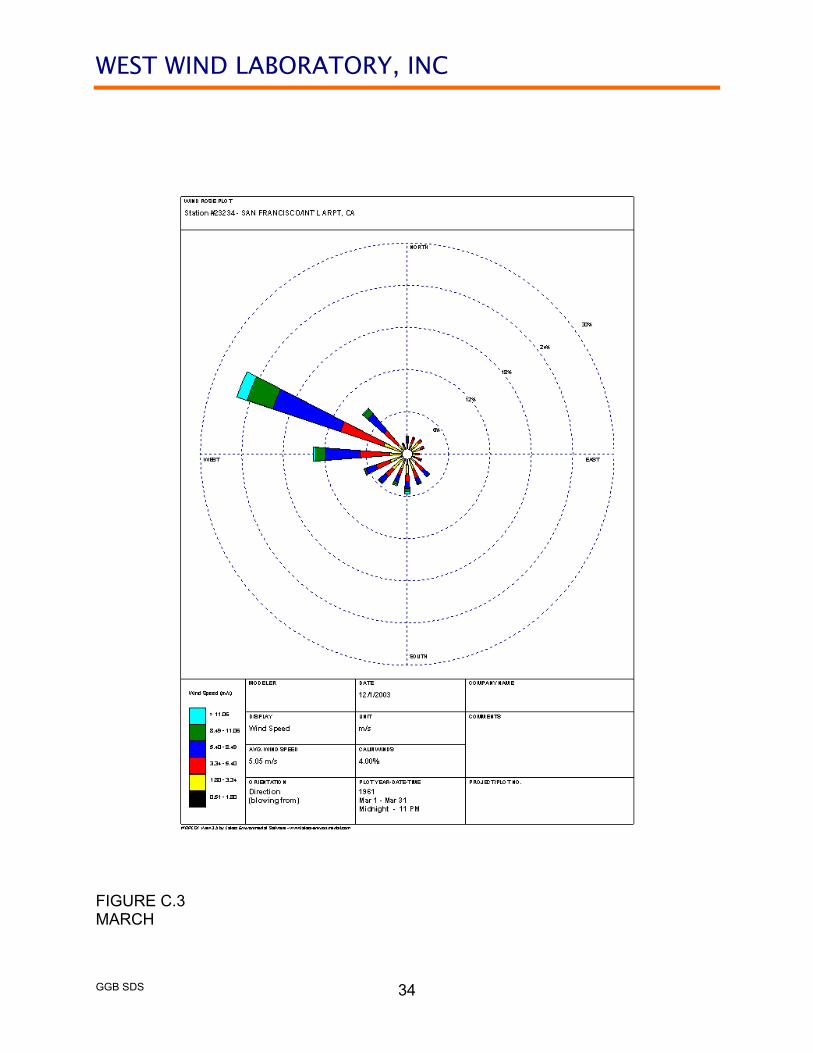
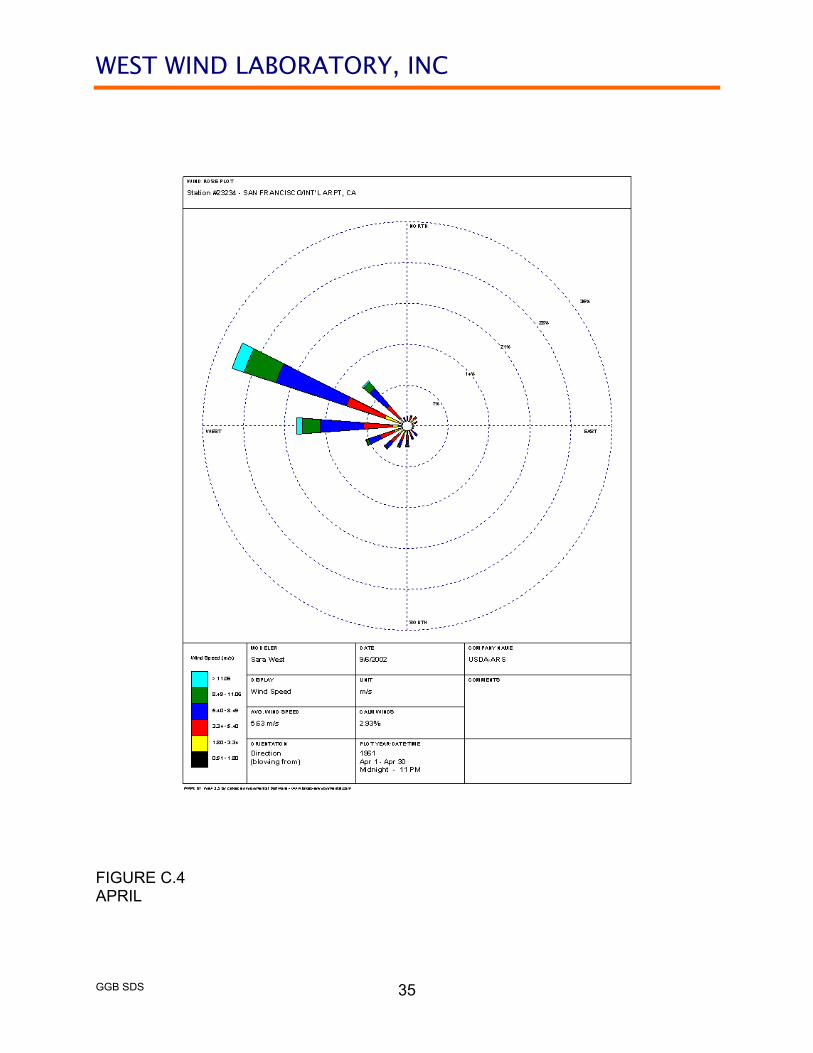
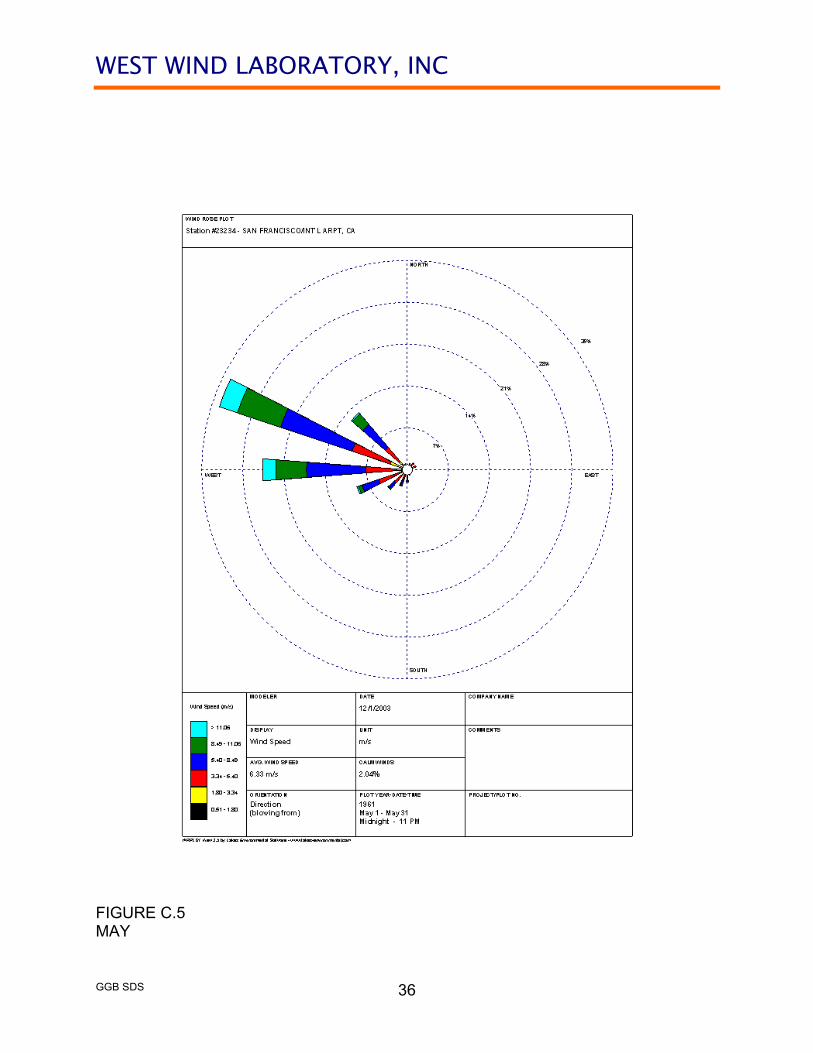
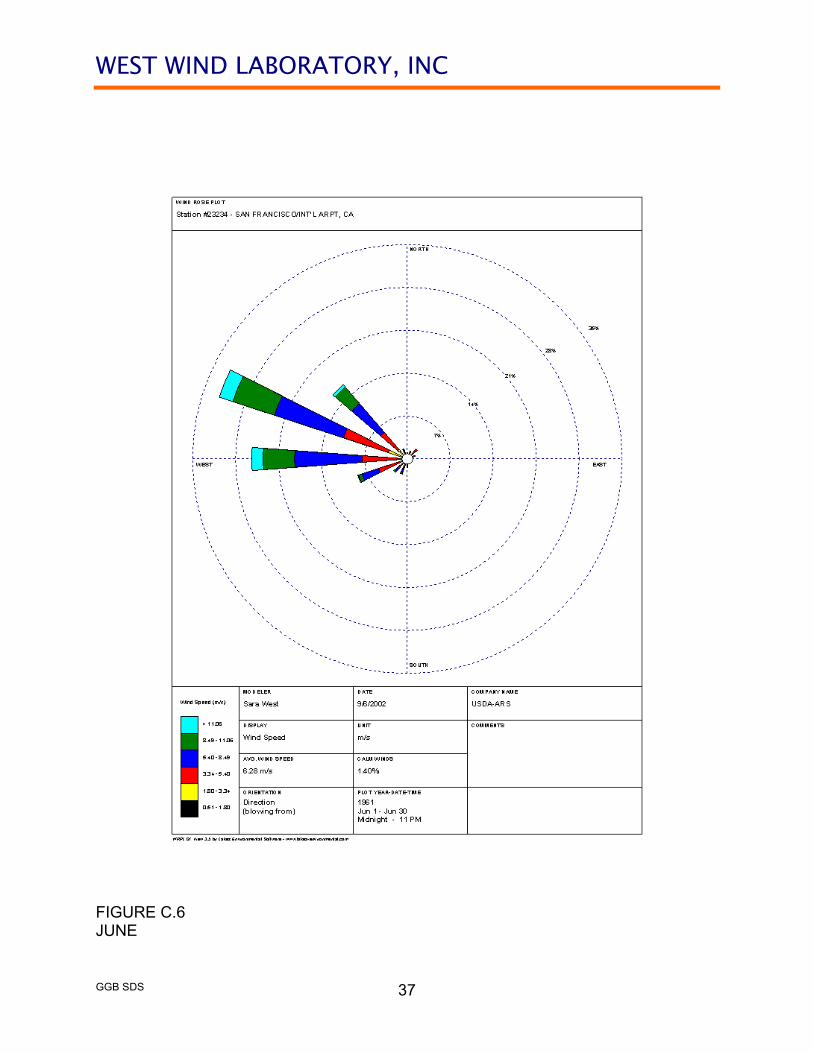
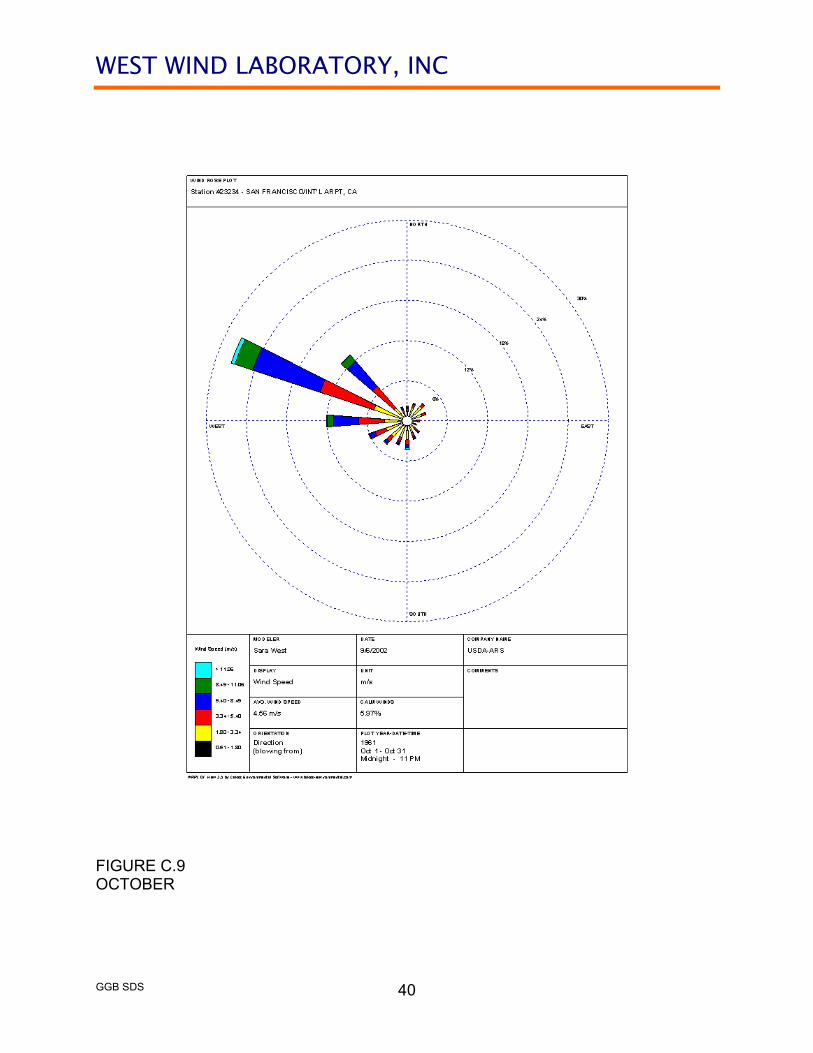
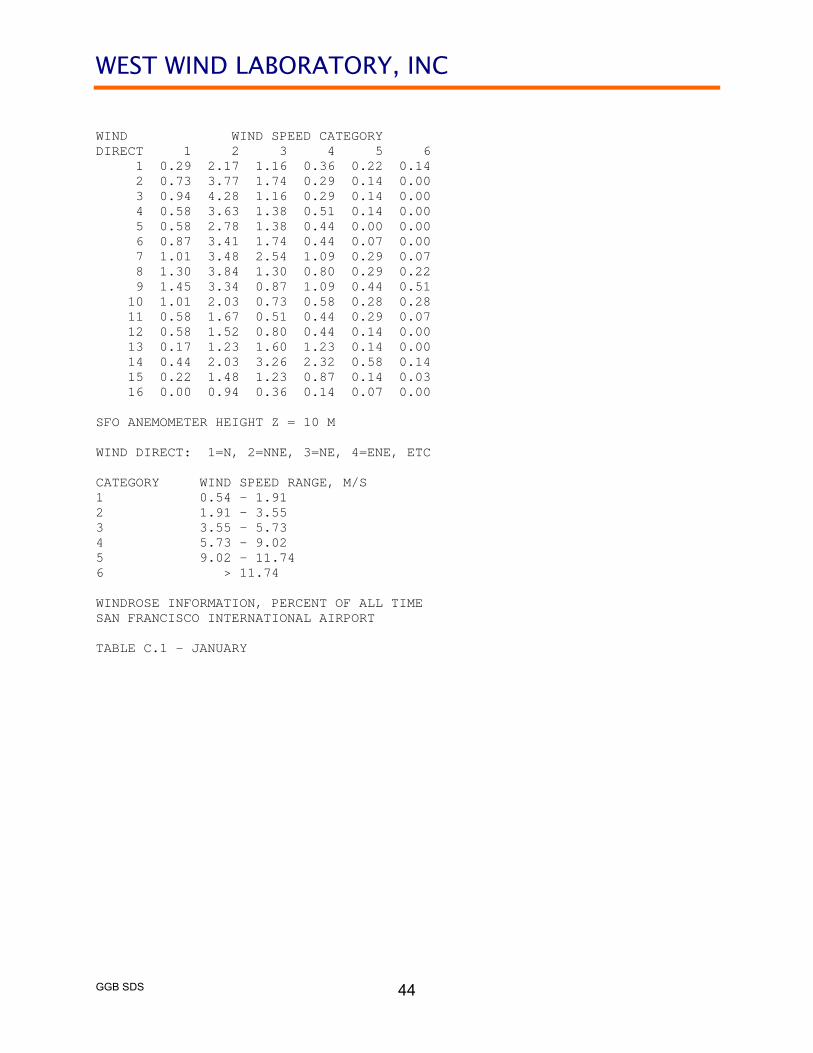
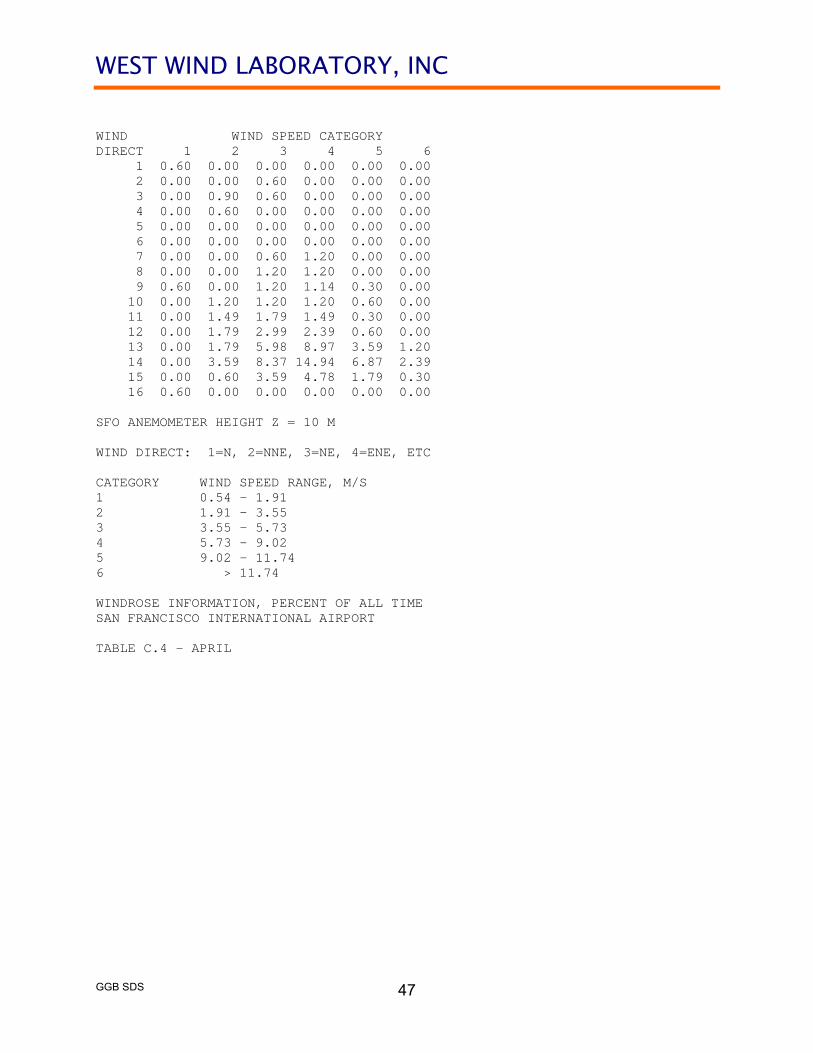
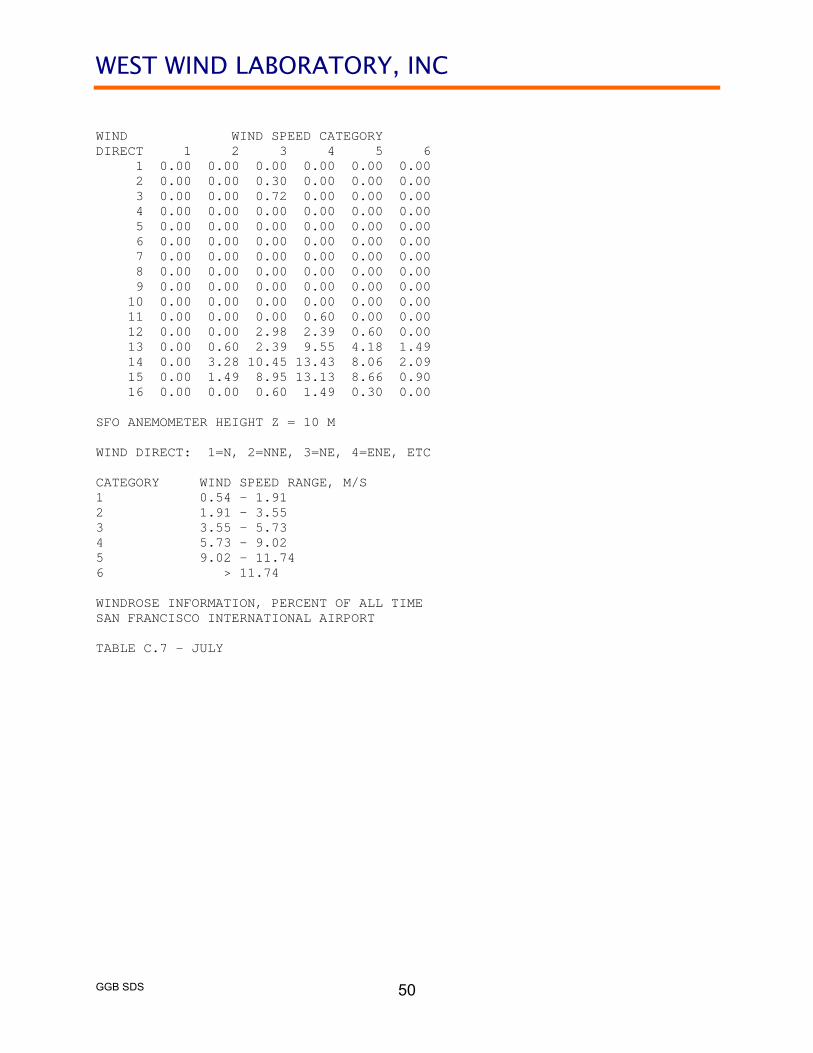
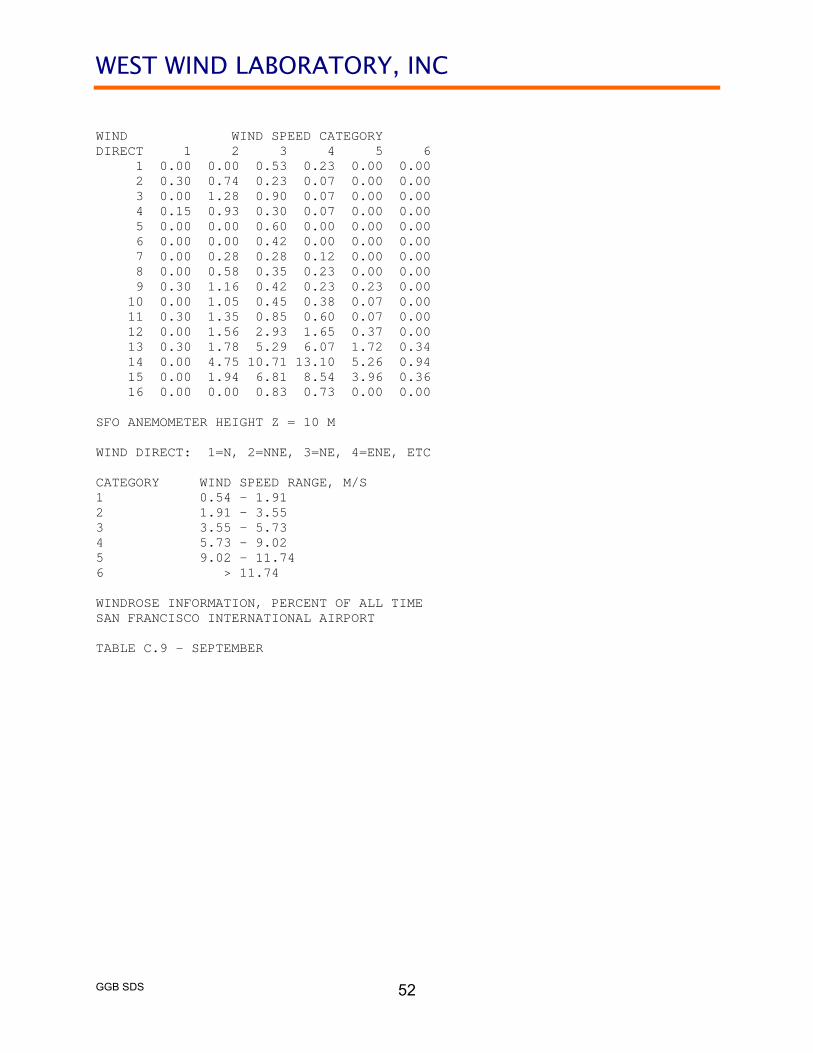
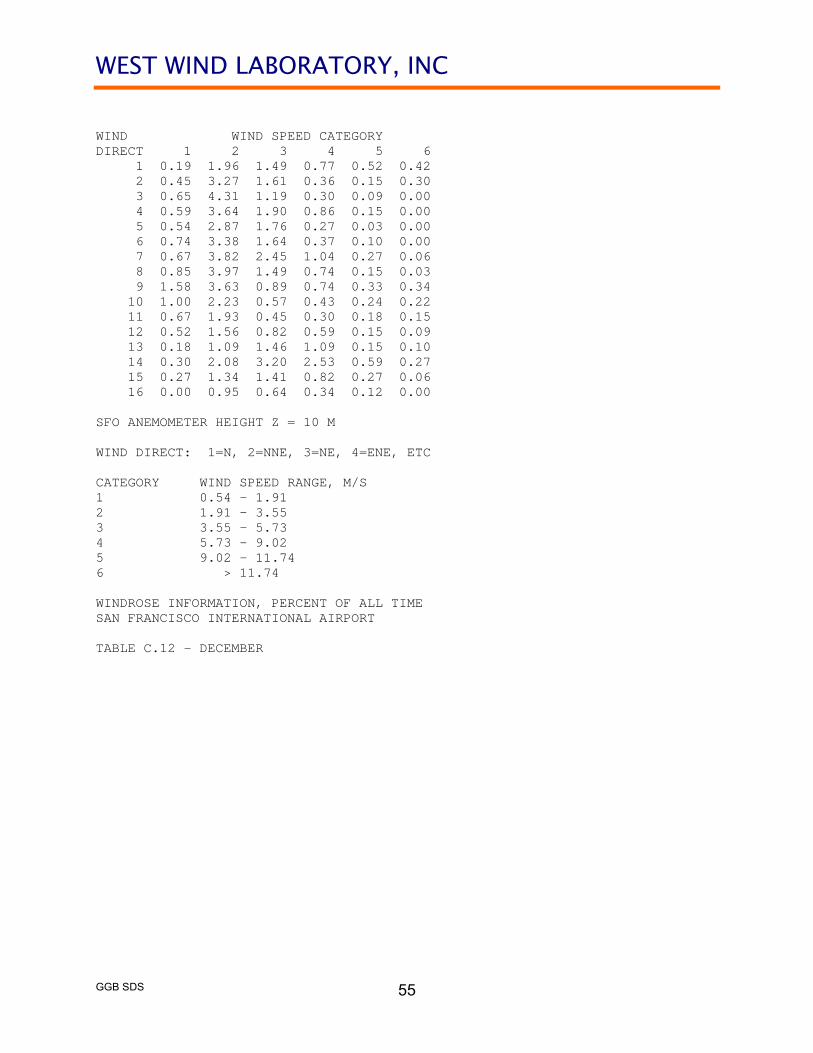
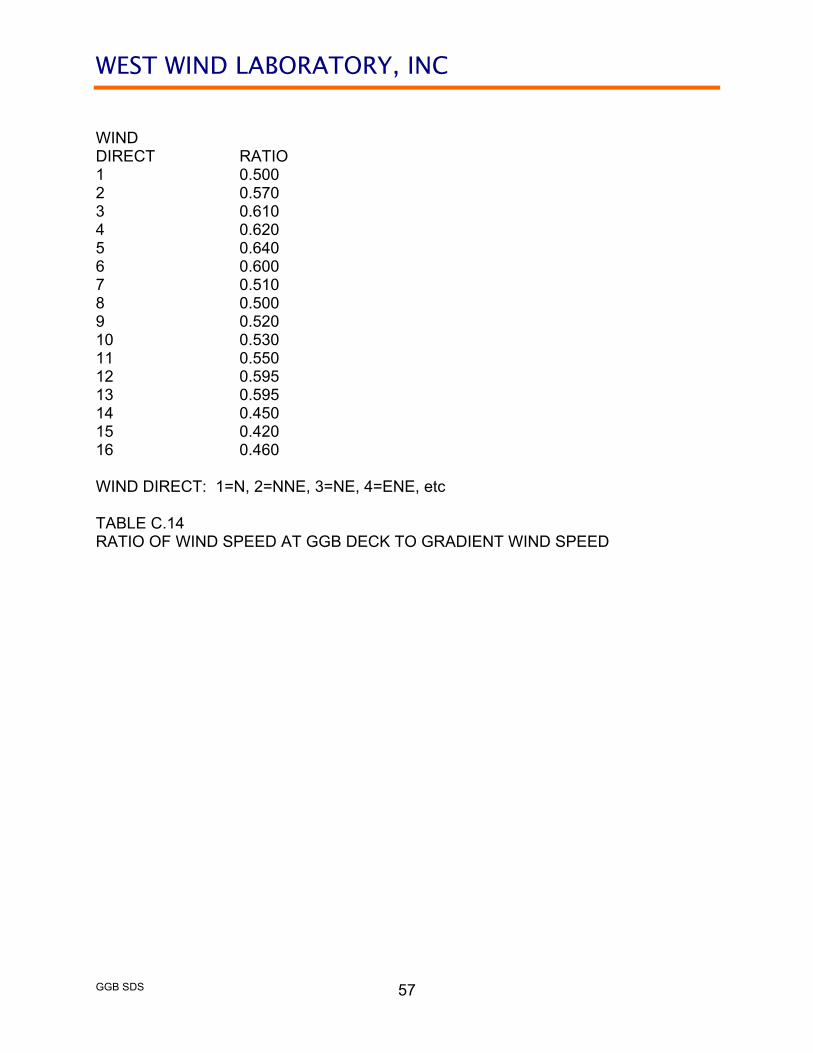
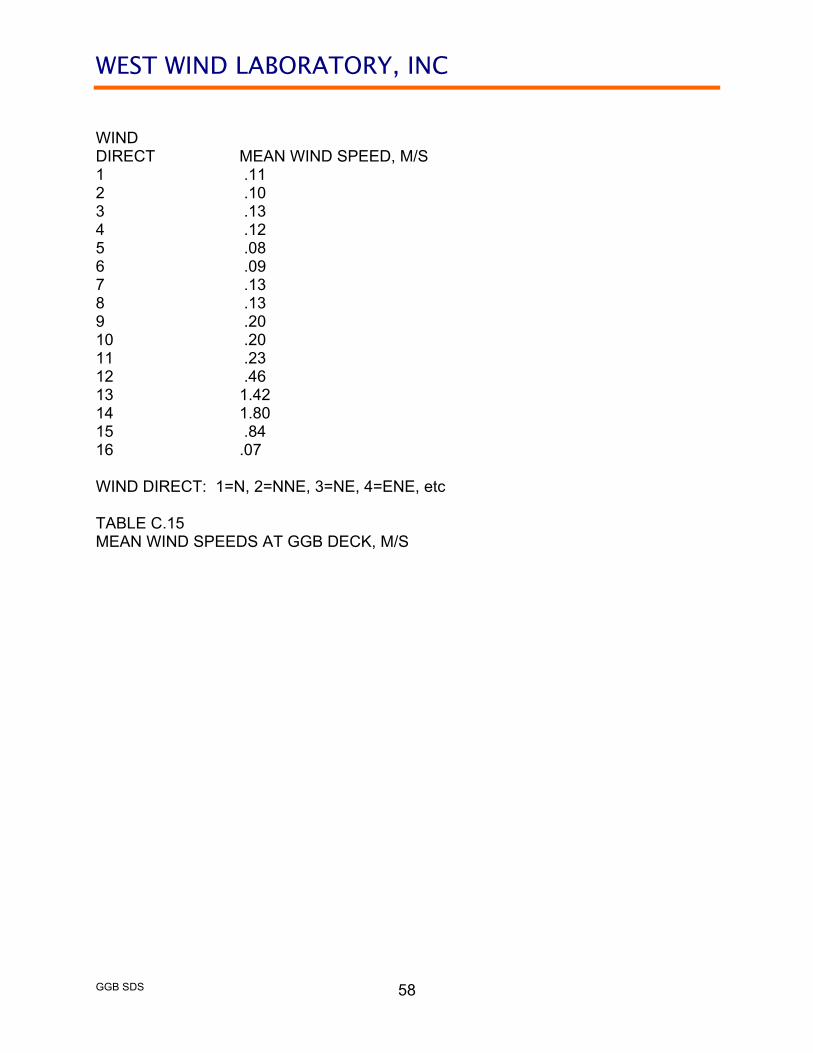
CHAPTER C WIND LOAD INPUT FOR A FATIGUE ANALYSIS OF THE NET STRUTS Turbulent winds on the windward and leeward sides of the bridge will cause the SDS net to bounce. That bouncing will produce a fluctuating moment in the net support struts, particularly at the attachment plate welds. The objective of this portion of the wind study was to determine the expected number of fluctuating moment cycles, at different moment levels, for a specific period of time (one year). Those performing the fatigue analysis can then determine the total number of cycles expected over the life of the SDS net, at different stress levels, and then using Minor's Rule (or equivalent), determine the likelihood of a fatigue failure occurring. The distribution of all winds, not just extreme winds, at the GGB site, at the deck elevation, must be known. Windrose information (that provides those distributions, by direction, by month of the year) was obtained from the USDA (Ref 9) for winds at the San Francisco International Airport (SFO) and is shown in Figures C.1 through C.10. The data set is incomplete. Wind data for the months of September and November were missing. Windrose information from those months were linearly interpolated from the months of August and October for September, and October and December for November. The data was collected during the years of 1960 to 1990. For the first 20 years the anemometer was located 6 m above grade. For the last 10 years the anemometer was located at an elevation of 10 m. To correct the data to a common elevation of 10 m, using a weighted average, all wind speeds were adjusted upward by a factor of 1.06. The corrected windrose data, at SFO, is presented in Tables C.1 through C.12. The windrose data was transferred in two steps from SFO to the GGB deck using data obtained from a topographic model study made of the wind environment at SFO and the GGB (Ref 8). Specifically, the winds at the gradient height were computed from winds at an elevation of 10 m at SFO using the factors in Table C.13 (Ref 8). The second step was to scale those gradient height wind speeds with the factors in Table C.14 (Ref 8) to obtain the corresponding wind speeds at the GGB deck elevation. From the windrose data at the GGB deck elevation, by month, mean wind speeds were computed. Those mean wind speeds are presented in Table C.15. General wind speeds are assumed to have a Rayleigh Distribution (Ref 10). Rayleigh Distributions are single parameter distributions, with the mean wind speed as the single parameter. Therefore, wind speed distributions for all winds, coming from the 16 principal directions, were then known. For a given mean wind speed, fluctuating moments in a SDS net support strut on the windward side of the bridge were computed analytically. Wind speed time histories at the bridge deck elevation were generated as described in Appendix 3 and Ref 2.Vertical wind loads on the SDS net were computed according to
WEST WIND LABORATORY, INC
GGB SDS
30
F(t) = (1/2)(ρ)(w(t)2)(Cdeff)(As) where
F(t) total fluctuating wind induced vertical force on the support strut and the tributary net (spacing of 50 ft);
ρ density of air, 1.25 kg/m3;
w(t) fluctuating vertical wind speed, m/s;
Cdeff effective drag coefficient for net and strut, 0.82; and
As solid area of members in tributary area, 10.81 m2
It has been assumed that the admittance of the wind forces over the lateral net wire net dimension of 4 mm is unity. The proposed net has a solid ratio of 0.0879. A Cd = 0.7 for the net wires was assumed. A Cd = 1.6 for the square steel tube strut was assumed. Half of F(t) is supported at the end of the strut. The strut has a dimension of 7.01 m (23 ft). The fluctuating wind induced moment in the strut is therefore
M(t) = 3.505 F(t) = 19.42 w(t)2 Nm It has also been assumed that, on the windward side of the bridge, the fluctuating wind induced moments are not directionally sensitive. Specifically, it is assumed that the fluctuating wind induced moments will be the same (for a given wind speed) for the 7 principal wind directions on the windward side of the bridge. When winds blow through the bridge, the bridge filters and reduces the turbulence that is experienced on the windward side. The section model was installed in the wind tunnel with some general upwind turbulence generated with a grid (full-scale turbulence cannot be modeled in the wind tunnel at the scale of the section model, 1:50). The spectrum of the turbulence was measured to windward and to leeward at two positions along the deck. Those spectra are shown on Figures C.11 and C.12. While theoretically, one could create a leeward vertical wind speed time history using a frequency dependent modified windward vertical wind speed spectrum. Instead, the general filtering effect and reduction was noted that the leeward spectrum was no greater than about 0.30 times the windward spectrum. Since the spectrum is the square of the Fourier Transform of the upwind vertical wind speed time history, the leeward vertical time history is expected to be approximately 0.55 times the windward time history. This ratio was used to compute the total expected cycles of motion that the SDS support struts are expected to see in one year. For the moment ranges given in Table C.16, the expected number of cycles in a 10-minute period for mean wind speeds of 2 m/s to 30 m/s are presented in Tables C.17 and C.18..

WEST WIND LABORATORY, INC
GGB SDS
31
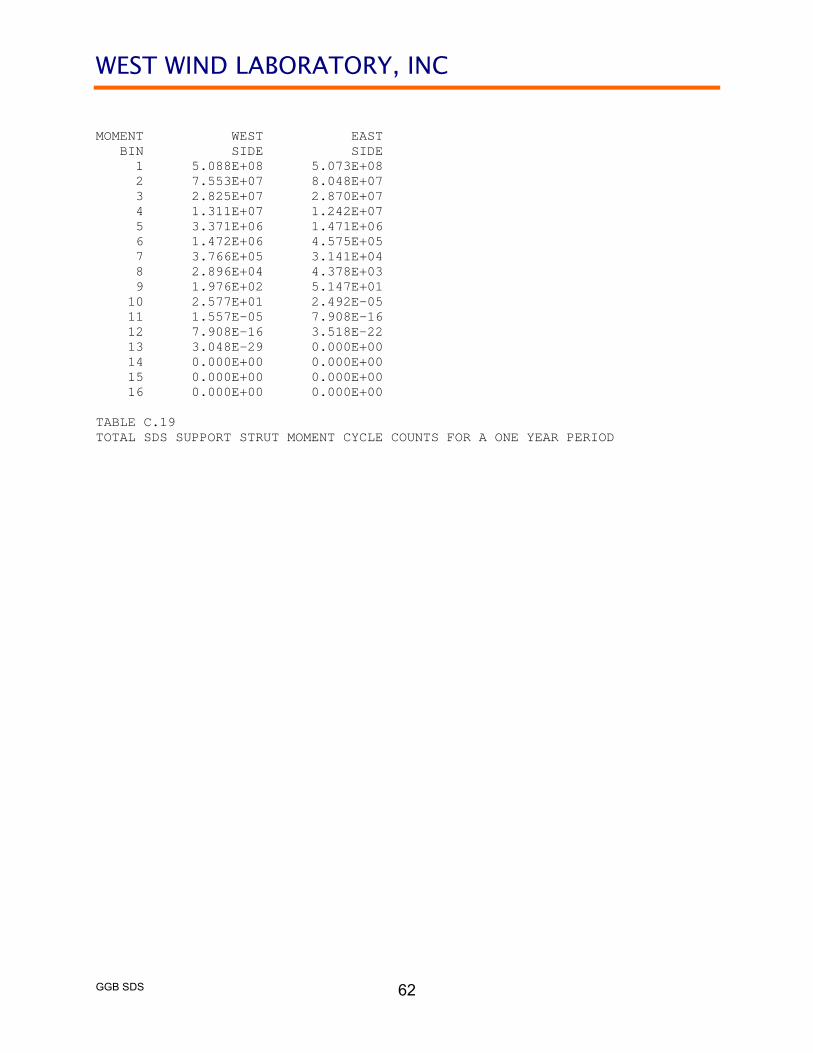
Using the probability distributions of the expected winds at the GGB deck, for the 16 principal wind directions, using 15 wind speed ranges from 2 m/s to 30 m/s, and using the fluctuating moment cycle counts obtained for specific wind speeds, the total fluctuating moment cycle counts expected in a one-year period were computed. For the SDS support struts on the West side of the GGB, cycle counts were computed including contributions from winds coming from the windward directions of SSW, SW, WSW, W, WNW, NW, and NNW, and contributions from winds from the leeward directions of NNE, NE, ENE, E, ESE, SE, and SSE. For the SDS support struts on the East side of the GGB, contributions to the total cycle counts were from the same winds, but the West winds were now on the leeward side, and the East winds were now on the windward side. For the moment ranges described in Table C.16, the total cycle counts expected in ONE YEAR for SDS support struts on the West and East sides of the GGB are shown in Table C.19.

WEST WIND LABORATORY, INC
GGB SDS
32
FIGURE C.1 JANUARY

WEST WIND LABORATORY, INC
GGB SDS
33
FIGURE C.2 FEBRUARY
WEST WIND LABORATORY, INC
GGB SDS
34
FIGURE C.3 MARCH
WEST WIND LABORATORY, INC
GGB SDS
35
FIGURE C.4 APRIL
WEST WIND LABORATORY, INC
GGB SDS
36
FIGURE C.5 MAY
WEST WIND LABORATORY, INC
GGB SDS
37
FIGURE C.6 JUNE

WEST WIND LABORATORY, INC
GGB SDS
38
FIGURE C.7 JULY

WEST WIND LABORATORY, INC
GGB SDS
39
FIGURE C.8 AUGUST
WEST WIND LABORATORY, INC
GGB SDS
40
FIGURE C.9 OCTOBER

WEST WIND LABORATORY, INC
GGB SDS
41
FIGURE C.10 DECEMBER

WEST WIND LABORATORY, INC
GGB SDS
42
‐50
0
50
100
150
200
250
300
0 50 100 150 200 250 300 350
(FREQUENCY)
WINDWARDNET
LEEWARDNET
FIGURE C.11 VERTICAL WIND SPEED SPECTRA, POSITION 1

WEST WIND LABORATORY, INC
GGB SDS
43
‐100
0
100
200
300
400
500
600
700
800
900
0 50 100 150 200 250 300 350
(FREQUENCY)
WINDWARDNET
LEEWARDNET
FIGURE C.12 VERTICAL WIND SPEED SPECTRA, POSITION 2
WEST WIND LABORATORY, INC
GGB SDS
44
WIND WIND SPEED CATEGORY DIRECT 1 2 3 4 5 6 1 0.29 2.17 1.16 0.36 0.22 0.14 2 0.73 3.77 1.74 0.29 0.14 0.00 3 0.94 4.28 1.16 0.29 0.14 0.00 4 0.58 3.63 1.38 0.51 0.14 0.00 5 0.58 2.78 1.38 0.44 0.00 0.00 6 0.87 3.41 1.74 0.44 0.07 0.00 7 1.01 3.48 2.54 1.09 0.29 0.07 8 1.30 3.84 1.30 0.80 0.29 0.22 9 1.45 3.34 0.87 1.09 0.44 0.51 10 1.01 2.03 0.73 0.58 0.28 0.28 11 0.58 1.67 0.51 0.44 0.29 0.07 12 0.58 1.52 0.80 0.44 0.14 0.00 13 0.17 1.23 1.60 1.23 0.14 0.00 14 0.44 2.03 3.26 2.32 0.58 0.14 15 0.22 1.48 1.23 0.87 0.14 0.03 16 0.00 0.94 0.36 0.14 0.07 0.00 SFO ANEMOMETER HEIGHT Z = 10 M WIND DIRECT: 1=N, 2=NNE, 3=NE, 4=ENE, ETC CATEGORY WIND SPEED RANGE, M/S 1 0.54 - 1.91 2 1.91 - 3.55 3 3.55 - 5.73 4 5.73 - 9.02 5 9.02 - 11.74 6 > 11.74 WINDROSE INFORMATION, PERCENT OF ALL TIME SAN FRANCISCO INTERNATIONAL AIRPORT TABLE C.1 - JANUARY

WEST WIND LABORATORY, INC
GGB SDS
45
WIND WIND SPEED CATEGORY DIRECT 1 2 3 4 5 6 1 0.32 0.95 0.91 0.79 0.32 0.00 2 0.00 2.52 0.95 0.32 0.00 0.00 3 0.00 3.63 0.69 0.16 0.00 0.00 4 0.00 2.90 0.79 0.32 0.00 0.00 5 0.00 2.52 0.91 0.32 0.00 0.00 6 0.00 2.21 1.26 0.32 0.00 0.00 7 0.00 2.59 1.89 0.95 0.32 0.00 8 0.00 2.84 1.26 0.63 0.16 0.00 9 0.63 2.84 1.26 0.95 0.38 0.28 10 0.32 2.21 0.63 0.79 0.32 0.47 11 0.47 1.89 0.91 0.79 0.38 0.32 12 0.00 2.52 1.26 0.79 0.32 0.00 13 0.32 1.58 2.84 2.68 0.60 0.16 14 0.00 3.94 6.63 7.41 1.96 0.63 15 0.00 2.05 2.59 2.49 0.60 0.16 16 0.00 0.63 0.63 0.32 0.16 0.00 SFO ANEMOMETER HEIGHT Z = 10 M WIND DIRECT: 1=N, 2=NNE, 3=NE, 4=ENE, ETC CATEGORY WIND SPEED RANGE, M/S 1 0.54 - 1.91 2 1.91 - 3.55 3 3.55 - 5.73 4 5.73 - 9.02 5 9.02 - 11.74 6 > 11.74 WINDROSE INFORMATION, PERCENT OF ALL TIME SAN FRANCISCO INTERNATIONAL AIRPORT TABLE C.2 - FEBRUARY

WEST WIND LABORATORY, INC
GGB SDS
46
WIND WIND SPEED CATEGORY DIRECT 1 2 3 4 5 6 1 0.00 0.00 1.05 0.86 0.19 0.00 2 0.00 1.10 0.72 0.29 0.00 0.00 3 0.00 1.67 0.62 0.14 0.00 0.00 4 0.00 1.43 0.48 0.10 0.00 0.00 5 0.00 0.38 0.62 0.00 0.00 0.00 6 0.00 0.00 1.43 0.24 0.00 0.00 7 0.00 0.96 1.58 0.96 0.24 0.00 8 0.00 1.43 1.67 1.29 0.24 0.00 9 0.86 1.34 1.19 1.05 0.57 0.38 10 0.00 1.62 1.19 1.10 0.48 0.19 11 0.00 2.39 1.43 1.43 0.24 0.00 12 0.00 2.06 2.39 1.82 0.29 0.00 13 0.00 2.06 4.92 5.74 1.67 0.48 14 0.00 3.35 7.65 11.95 4.64 1.77 15 0.00 1.19 3.20 3.58 0.96 0.19 16 0.00 0.00 0.72 0.24 0.00 0.00 SFO ANEMOMETER HEIGHT Z = 10 M WIND DIRECT: 1=N, 2=NNE, 3=NE, 4=ENE, ETC CATEGORY WIND SPEED RANGE, M/S 1 0.54 - 1.91 2 1.91 - 3.55 3 3.55 - 5.73 4 5.73 - 9.02 5 9.02 - 11.74 6 > 11.74 WINDROSE INFORMATION, PERCENT OF ALL TIME SAN FRANCISCO INTERNATIONAL AIRPORT TABLE C.3 - MARCH
WEST WIND LABORATORY, INC
GGB SDS
47
WIND WIND SPEED CATEGORY DIRECT 1 2 3 4 5 6 1 0.60 0.00 0.00 0.00 0.00 0.00 2 0.00 0.00 0.60 0.00 0.00 0.00 3 0.00 0.90 0.60 0.00 0.00 0.00 4 0.00 0.60 0.00 0.00 0.00 0.00 5 0.00 0.00 0.00 0.00 0.00 0.00 6 0.00 0.00 0.00 0.00 0.00 0.00 7 0.00 0.00 0.60 1.20 0.00 0.00 8 0.00 0.00 1.20 1.20 0.00 0.00 9 0.60 0.00 1.20 1.14 0.30 0.00 10 0.00 1.20 1.20 1.20 0.60 0.00 11 0.00 1.49 1.79 1.49 0.30 0.00 12 0.00 1.79 2.99 2.39 0.60 0.00 13 0.00 1.79 5.98 8.97 3.59 1.20 14 0.00 3.59 8.37 14.94 6.87 2.39 15 0.00 0.60 3.59 4.78 1.79 0.30 16 0.60 0.00 0.00 0.00 0.00 0.00 SFO ANEMOMETER HEIGHT Z = 10 M WIND DIRECT: 1=N, 2=NNE, 3=NE, 4=ENE, ETC CATEGORY WIND SPEED RANGE, M/S 1 0.54 - 1.91 2 1.91 - 3.55 3 3.55 - 5.73 4 5.73 - 9.02 5 9.02 - 11.74 6 > 11.74 WINDROSE INFORMATION, PERCENT OF ALL TIME SAN FRANCISCO INTERNATIONAL AIRPORT TABLE C.4 - APRIL

WEST WIND LABORATORY, INC
GGB SDS
48
WIND WIND SPEED CATEGORY DIRECT 1 2 3 4 5 6 1 0.00 0.00 0.00 0.00 0.00 0.00 2 0.00 0.00 0.28 0.00 0.00 0.00 3 0.00 0.00 0.56 0.11 0.00 0.00 4 0.00 0.00 0.83 0.00 0.00 0.00 5 0.00 0.00 0.00 0.00 0.00 0.00 6 0.00 0.00 0.00 0.00 0.00 0.00 7 0.00 0.00 0.00 0.00 0.00 0.00 8 0.00 0.00 0.00 0.00 0.00 0.00 9 0.00 0.00 1.00 0.39 0.00 0.00 10 0.00 0.00 0.89 0.72 0.17 0.00 11 0.00 0.45 1.78 1.50 0.33 0.00 12 0.00 0.56 4.23 3.62 0.67 0.33 13 0.00 1.00 6.12 11.97 6.12 2.67 14 0.00 2.23 7.96 15.03 8.91 3.90 15 0.00 0.95 3.67 5.96 2.73 0.28 16 0.00 0.00 0.00 0.00 0.00 0.00 SFO ANEMOMETER HEIGHT Z = 10 M WIND DIRECT: 1=N, 2=NNE, 3=NE, 4=ENE, ETC CATEGORY WIND SPEED RANGE, M/S 1 0.54 - 1.91 2 1.91 - 3.55 3 3.55 - 5.73 4 5.73 - 9.02 5 9.02 - 11.74 6 > 11.74 WINDROSE INFORMATION, PERCENT OF ALL TIME SAN FRANCISCO INTERNATIONAL AIRPORT TABLE C.5 - MAY

WEST WIND LABORATORY, INC
GGB SDS
49
WIND WIND SPEED CATEGORY DIRECT 1 2 3 4 5 6 1 0.00 0.00 0.27 0.00 0.00 0.00 2 0.00 0.00 0.53 0.00 0.00 0.00 3 0.00 0.27 1.06 0.00 0.00 0.00 4 0.00 0.00 0.53 0.00 0.00 0.00 5 0.00 0.00 0.00 0.00 0.00 0.00 6 0.00 0.00 0.00 0.00 0.00 0.00 7 0.00 0.00 0.00 0.00 0.00 0.00 8 0.00 0.00 0.00 0.00 0.00 0.00 9 0.00 0.00 0.53 0.00 0.00 0.00 10 0.00 0.00 0.80 1.06 0.00 0.00 11 0.00 0.00 1.06 1.06 0.00 0.00 12 0.00 0.27 4.41 3.29 0.80 0.00 13 0.00 0.00 7.44 12.75 5.95 2.23 14 0.00 2.76 8.77 13.55 8.24 2.66 15 0.00 1.33 4.25 7.17 3.99 0.53 16 0.00 0.00 1.06 0.00 0.00 0.00 SFO ANEMOMETER HEIGHT Z = 10 M WIND DIRECT: 1=N, 2=NNE, 3=NE, 4=ENE, ETC CATEGORY WIND SPEED RANGE, M/S 1 0.54 - 1.91 2 1.91 - 3.55 3 3.55 - 5.73 4 5.73 - 9.02 5 9.02 - 11.74 6 > 11.74 WINDROSE INFORMATION, PERCENT OF ALL TIME SAN FRANCISCO INTERNATIONAL AIRPORT TABLE C.6 - JUNE
WEST WIND LABORATORY, INC
GGB SDS
50
WIND WIND SPEED CATEGORY DIRECT 1 2 3 4 5 6 1 0.00 0.00 0.00 0.00 0.00 0.00 2 0.00 0.00 0.30 0.00 0.00 0.00 3 0.00 0.00 0.72 0.00 0.00 0.00 4 0.00 0.00 0.00 0.00 0.00 0.00 5 0.00 0.00 0.00 0.00 0.00 0.00 6 0.00 0.00 0.00 0.00 0.00 0.00 7 0.00 0.00 0.00 0.00 0.00 0.00 8 0.00 0.00 0.00 0.00 0.00 0.00 9 0.00 0.00 0.00 0.00 0.00 0.00 10 0.00 0.00 0.00 0.00 0.00 0.00 11 0.00 0.00 0.00 0.60 0.00 0.00 12 0.00 0.00 2.98 2.39 0.60 0.00 13 0.00 0.60 2.39 9.55 4.18 1.49 14 0.00 3.28 10.45 13.43 8.06 2.09 15 0.00 1.49 8.95 13.13 8.66 0.90 16 0.00 0.00 0.60 1.49 0.30 0.00 SFO ANEMOMETER HEIGHT Z = 10 M WIND DIRECT: 1=N, 2=NNE, 3=NE, 4=ENE, ETC CATEGORY WIND SPEED RANGE, M/S 1 0.54 - 1.91 2 1.91 - 3.55 3 3.55 - 5.73 4 5.73 - 9.02 5 9.02 - 11.74 6 > 11.74 WINDROSE INFORMATION, PERCENT OF ALL TIME SAN FRANCISCO INTERNATIONAL AIRPORT TABLE C.7 - JULY

WEST WIND LABORATORY, INC
GGB SDS
51
WIND WIND SPEED CATEGORY DIRECT 1 2 3 4 5 6 1 0.00 0.00 0.00 0.00 0.00 0.00 2 0.60 0.00 0.00 0.00 0.00 0.00 3 0.00 0.00 1.19 0.00 0.00 0.00 4 0.30 0.00 0.00 0.00 0.00 0.00 5 0.00 0.00 0.00 0.00 0.00 0.00 6 0.00 0.00 0.00 0.00 0.00 0.00 7 0.00 0.00 0.00 0.00 0.00 0.00 8 0.00 0.00 0.00 0.00 0.00 0.00 9 0.60 0.00 0.00 0.00 0.00 0.00 10 0.00 0.00 0.30 0.30 0.00 0.00 11 0.60 0.00 0.60 0.60 0.00 0.00 12 0.00 0.00 3.87 2.38 0.60 0.00 13 0.60 0.30 5.96 7.75 2.38 0.60 14 0.00 4.17 11.62 13.71 7.15 1.19 15 0.00 1.79 8.64 11.32 6.56 0.72 16 0.00 0.00 0.60 1.19 0.00 0.00 SFO ANEMOMETER HEIGHT Z = 10 M WIND DIRECT: 1=N, 2=NNE, 3=NE, 4=ENE, ETC CATEGORY WIND SPEED RANGE, M/S 1 0.54 - 1.91 2 1.91 - 3.55 3 3.55 - 5.73 4 5.73 - 9.02 5 9.02 - 11.74 6 > 11.74 WINDROSE INFORMATION, PERCENT OF ALL TIME SAN FRANCISCO INTERNATIONAL AIRPORT TABLE C.8 - AUGUST
WEST WIND LABORATORY, INC
GGB SDS
52
WIND WIND SPEED CATEGORY DIRECT 1 2 3 4 5 6 1 0.00 0.00 0.53 0.23 0.00 0.00 2 0.30 0.74 0.23 0.07 0.00 0.00 3 0.00 1.28 0.90 0.07 0.00 0.00 4 0.15 0.93 0.30 0.07 0.00 0.00 5 0.00 0.00 0.60 0.00 0.00 0.00 6 0.00 0.00 0.42 0.00 0.00 0.00 7 0.00 0.28 0.28 0.12 0.00 0.00 8 0.00 0.58 0.35 0.23 0.00 0.00 9 0.30 1.16 0.42 0.23 0.23 0.00 10 0.00 1.05 0.45 0.38 0.07 0.00 11 0.30 1.35 0.85 0.60 0.07 0.00 12 0.00 1.56 2.93 1.65 0.37 0.00 13 0.30 1.78 5.29 6.07 1.72 0.34 14 0.00 4.75 10.71 13.10 5.26 0.94 15 0.00 1.94 6.81 8.54 3.96 0.36 16 0.00 0.00 0.83 0.73 0.00 0.00 SFO ANEMOMETER HEIGHT Z = 10 M WIND DIRECT: 1=N, 2=NNE, 3=NE, 4=ENE, ETC CATEGORY WIND SPEED RANGE, M/S 1 0.54 - 1.91 2 1.91 - 3.55 3 3.55 - 5.73 4 5.73 - 9.02 5 9.02 - 11.74 6 > 11.74 WINDROSE INFORMATION, PERCENT OF ALL TIME SAN FRANCISCO INTERNATIONAL AIRPORT TABLE C.9 - SEPTEMBER

WEST WIND LABORATORY, INC
GGB SDS
53
WIND WIND SPEED CATEGORY DIRECT 1 2 3 4 5 6 1 0.00 0.00 1.07 0.46 0.00 0.00 2 0.00 1.48 0.46 0.14 0.00 0.00 3 0.00 2.55 0.60 0.14 0.00 0.00 4 0.00 1.85 0.60 0.14 0.00 0.00 5 0.00 0.00 1.20 0.00 0.00 0.00 6 0.00 0.00 0.83 0.00 0.00 0.00 7 0.00 0.56 0.56 0.23 0.00 0.00 8 0.00 1.16 0.69 0.46 0.00 0.00 9 0.00 2.32 0.83 0.46 0.46 0.00 10 0.00 2.08 0.60 0.46 0.14 0.00 11 0.00 2.69 1.11 0.60 0.14 0.00 12 0.00 3.10 1.99 0.93 0.14 0.00 13 0.00 3.24 4.63 4.40 1.07 0.09 14 0.00 5.33 9.82 12.51 3.38 0.69 15 0.00 2.08 5.00 5.79 1.39 0.00 16 0.00 0.00 1.07 0.28 0.00 0.00 SFO ANEMOMETER HEIGHT Z = 10 M WIND DIRECT: 1=N, 2=NNE, 3=NE, 4=ENE, ETC CATEGORY WIND SPEED RANGE, M/S 1 0.54 - 1.91 2 1.91 - 3.55 3 3.55 - 5.73 4 5.73 - 9.02 5 9.02 - 11.74 6 > 11.74 WINDROSE INFORMATION, PERCENT OF ALL TIME SAN FRANCISCO INTERNATIONAL AIRPORT TABLE C.10 - OCTOBER

WEST WIND LABORATORY, INC
GGB SDS
54
WIND WIND SPEED CATEGORY DIRECT 1 2 3 4 5 6 1 0.10 1.03 1.29 0.63 0.27 0.22 2 0.23 2.42 1.06 0.25 0.08 0.16 3 0.34 3.48 0.91 0.22 0.05 0.00 4 0.31 2.79 1.29 0.52 0.08 0.00 5 0.28 1.51 1.49 0.14 0.02 0.00 6 0.39 1.77 1.26 0.20 0.05 0.00 7 0.35 2.27 1.55 0.66 0.14 0.03 8 0.45 2.64 1.11 0.61 0.08 0.02 9 0.83 3.01 0.87 0.61 0.39 0.18 10 0.52 2.16 0.58 0.45 0.19 0.12 11 0.35 2.29 0.76 0.44 0.16 0.08 12 0.27 2.30 1.38 0.75 0.14 0.05 13 0.09 2.11 2.97 2.66 0.58 0.10 14 0.16 3.63 6.35 7.28 1.92 0.47 15 0.14 1.69 3.12 3.18 0.80 0.03 16 0.00 0.50 0.84 0.31 0.06 0.00 SFO ANEMOMETER HEIGHT Z = 10 M WIND DIRECT: 1=N, 2=NNE, 3=NE, 4=ENE, ETC CATEGORY WIND SPEED RANGE, M/S 1 0.54 - 1.91 2 1.91 - 3.55 3 3.55 - 5.73 4 5.73 - 9.02 5 9.02 - 11.74 6 > 11.74 WINDROSE INFORMATION, PERCENT OF ALL TIME SAN FRANCISCO INTERNATIONAL AIRPORT TABLE C.11 - NOVEMBER
WEST WIND LABORATORY, INC
GGB SDS
55
WIND WIND SPEED CATEGORY DIRECT 1 2 3 4 5 6 1 0.19 1.96 1.49 0.77 0.52 0.42 2 0.45 3.27 1.61 0.36 0.15 0.30 3 0.65 4.31 1.19 0.30 0.09 0.00 4 0.59 3.64 1.90 0.86 0.15 0.00 5 0.54 2.87 1.76 0.27 0.03 0.00 6 0.74 3.38 1.64 0.37 0.10 0.00 7 0.67 3.82 2.45 1.04 0.27 0.06 8 0.85 3.97 1.49 0.74 0.15 0.03 9 1.58 3.63 0.89 0.74 0.33 0.34 10 1.00 2.23 0.57 0.43 0.24 0.22 11 0.67 1.93 0.45 0.30 0.18 0.15 12 0.52 1.56 0.82 0.59 0.15 0.09 13 0.18 1.09 1.46 1.09 0.15 0.10 14 0.30 2.08 3.20 2.53 0.59 0.27 15 0.27 1.34 1.41 0.82 0.27 0.06 16 0.00 0.95 0.64 0.34 0.12 0.00 SFO ANEMOMETER HEIGHT Z = 10 M WIND DIRECT: 1=N, 2=NNE, 3=NE, 4=ENE, ETC CATEGORY WIND SPEED RANGE, M/S 1 0.54 - 1.91 2 1.91 - 3.55 3 3.55 - 5.73 4 5.73 - 9.02 5 9.02 - 11.74 6 > 11.74 WINDROSE INFORMATION, PERCENT OF ALL TIME SAN FRANCISCO INTERNATIONAL AIRPORT TABLE C.12 - DECEMBER

WEST WIND LABORATORY, INC
GGB SDS
56
WIND DIRECT RATIO 1 2.326 2 1.961 3 2.020 4 2.020 5 2.020 6 2.020 7 2.020 8 2.150 9 2.300 10 2.500 11 2.500 12 2.326 13 2.273 14 2.062 15 2.041 16 2.083 WIND DIRECT: 1=N, 2=NNE, 3=NE, 4=ENE, etc TABLE C.13 RATIO OF GRADIENT WIND SPEED TO WIND SPEED AT SFO AT Z = 10 M
WEST WIND LABORATORY, INC
GGB SDS
57
WIND DIRECT RATIO 1 0.500 2 0.570 3 0.610 4 0.620 5 0.640 6 0.600 7 0.510 8 0.500 9 0.520 10 0.530 11 0.550 12 0.595 13 0.595 14 0.450 15 0.420 16 0.460 WIND DIRECT: 1=N, 2=NNE, 3=NE, 4=ENE, etc TABLE C.14 RATIO OF WIND SPEED AT GGB DECK TO GRADIENT WIND SPEED
WEST WIND LABORATORY, INC
GGB SDS
58
WIND DIRECT MEAN WIND SPEED, M/S 1 .11 2 .10 3 .13 4 .12 5 .08 6 .09 7 .13 8 .13 9 .20 10 .20 11 .23 12 .46 13 1.42 14 1.80 15 .84 16 .07 WIND DIRECT: 1=N, 2=NNE, 3=NE, 4=ENE, etc TABLE C.15 MEAN WIND SPEEDS AT GGB DECK, M/S

WEST WIND LABORATORY, INC
GGB SDS
59
BIN MOMENT RANGE, Nm 1 0.0625 - 0.125 2 0 - 0.125 3 0.125 - 0.25 4 0.25 - 0.5 5 0.5 - 1 6 1 - 2 7 2 - 4 8 4 - 8 9 8 - 16 10 16 - 32 11 32 - 64 12 64 - 128 13 128 - 256 14 256 - 512 15 512 - 1024 16 > 1024 TABLE C.16 SDS SUPPORT STRUT MOMENT BINS

WEST WIND LABORATORY, INC
GGB SDS
60
MOMENT BIN U(M/S) 1 2 3 4 5 6 7 8 9 10 11 12 13 14 15 2 645 147 43 22 0 0 0 0 0 0 0 0 0 0 0 4 269 105 166 182 104 42 10 0 0 0 0 0 0 0 0 6 164 70 77 157 175 163 60 24 0 0 0 0 0 0 0 8 112 45 77 77 140 182 171 68 23 3 0 0 0 0 0 10 76 30 55 83 105 138 184 152 87 12 0 0 0 0 0 12 50 29 55 83 84 121 177 174 97 60 10 0 0 0 0 14 45 7 42 56 88 138 137 170 118 99 32 0 0 0 0 16 43 15 40 58 57 97 138 151 145 138 74 7 0 0 0 18 20 23 41 42 82 86 104 166 133 120 79 36 0 0 0 20 13 15 35 50 59 78 98 150 161 152 105 42 8 0 0 22 10 12 36 23 31 71 92 106 170 169 167 65 10 0 0 24 10 6 19 36 29 64 84 112 155 195 177 92 19 0 0 26 6 14 10 24 45 67 78 93 120 170 177 129 28 4 0 28 7 8 14 28 30 52 72 86 110 142 210 124 62 3 0 30 2 8 14 30 33 52 68 95 145 147 197 124 70 15 2 TABLE C.17 MOMENT CYCLE COUNTS, WINDWARD SIDE, T = 10 MINUTES

WEST WIND LABORATORY, INC
GGB SDS
61
MOMENT BIN U(M/S) 1 2 3 4 5 6 7 8 9 10 11 12 13 14 15 2 771 62 24 0 0 0 0 0 0 0 0 0 0 0 0 4 350 179 159 136 42 12 0 0 0 0 0 0 0 0 0 6 216 83 146 176 162 77 26 4 0 0 0 0 0 0 0 8 150 73 80 118 193 170 79 28 6 0 0 0 0 0 0 10 96 59 75 103 130 177 176 92 16 0 0 0 0 0 0 12 75 47 84 85 121 157 185 108 62 16 0 0 0 0 0 14 51 36 46 89 138 133 164 122 110 41 0 0 0 0 0 16 56 32 61 60 78 144 139 157 145 82 7 0 0 0 0 18 37 36 44 79 87 95 159 130 137 84 37 6 0 0 0 20 25 35 47 56 72 100 142 163 154 111 42 18 0 0 0 22 18 33 27 26 72 90 88 172 183 170 69 14 0 0 0 24 15 18 35 29 59 83 113 140 197 179 98 35 0 0 0 26 18 10 21 39 73 71 87 119 166 177 129 46 8 0 0 28 13 11 30 28 46 71 80 112 135 205 134 76 7 0 0 30 7 14 27 37 46 62 95 138 150 180 140 80 22 2 0 TABLE C.18 MOMENT CYCLE COUNTS, LEEWARD SIDE, T = 10 MINUTES
WEST WIND LABORATORY, INC
GGB SDS
62
MOMENT WEST EAST BIN SIDE SIDE 1 5.088E+08 5.073E+08 2 7.553E+07 8.048E+07 3 2.825E+07 2.870E+07 4 1.311E+07 1.242E+07 5 3.371E+06 1.471E+06 6 1.472E+06 4.575E+05 7 3.766E+05 3.141E+04 8 2.896E+04 4.378E+03 9 1.976E+02 5.147E+01 10 2.577E+01 2.492E-05 11 1.557E-05 7.908E-16 12 7.908E-16 3.518E-22 13 3.048E-29 0.000E+00 14 0.000E+00 0.000E+00 15 0.000E+00 0.000E+00 16 0.000E+00 0.000E+00 TABLE C.19 TOTAL SDS SUPPORT STRUT MOMENT CYCLE COUNTS FOR A ONE YEAR PERIOD

WEST WIND LABORATORY, INC
GGB SDS
63
APPENDIX 1 WIND ENVIRONMENT AT THE SITE
A detailed analysis of historical winds was not made for this study, but the results of a previous study, made specifically for the Golden Gate Bridge, Highway and Transportation District were used (Ref 8). For a bridge that is a vital transportation link in a major disaster, it is appropriate that the design wind speed be a wind speed with a return period of at least 100 years. An omnidirectional, one hour averaged wind speed, at the bridge deck elevation, with a return period of 100 years, was found to be 76 mph (Ref 8). An aeroelastic flutter instability can be catastrophic (as it was for the Tacoma Narrows Bridge), and is to be avoided at all cost. Consequently, it is appropriate to specify that an aeroelastic flutter instability should not occur for a wind speed with a return period less than 10,000 to 100,000 years. From the referenced historical wind speed analysis (Ref 8), such an appropriate critical flutter wind speed criterion was determined to be 100 mph. This is a 10-minute averaged wind speed at the bridge deck elevation (70.87 m). Strong winds are most likely to come from the south and the west. See Figure 1.1, taken from Ref 8. Also note that, at the site, the percentage of time that strong winds (with a return period of 100 years or more) come from the east is three orders of magnitude lower than the percentage of time that strong winds come from the west. Probabilities are proportional to the percentages, and return periods are proportional to the inverse of the probabilities. Therefore, the return period for equal wind speeds from the east will have a return period approximately 1000 times longer than the return period for a comparable wind speed from the west. Obviously winds from the west are critical. An omnidirectional 100 year wind (essentially equal to a 100 year wind from the south or the west) of 34 m/s (76 mph) was determined. It is reasonable to assume, therefore, from Figure 1.1 in Ref 8 that this wind speed, 34 m/s (76 mph, would have a return period of 100000 years for winds from the east. Assuming that the distribution of annual extremes at the site, for winds from the east, are similar to those from the west, it can be computed that for winds from the east, an hour averaged wind speed of 20.6 m/s (46 mph) would have a return period of 100 years, and a 10-minute averaged wind speed of 29.5 m/s (66 mph) would have return period of 10000 years. These are approximate values, but are suitable for the analyses for these non-critical directions. Note that winds from the south may also be likely. However, winds that are essentially perpendicular to the axis of the bridge (the axis of the bridge is north-south) are critical from a stability and buffeting point of view.

WEST WIND LABORATORY, INC
GGB SDS
64
FIGURE 1.1

WEST WIND LABORATORY, INC
GGB SDS
65
APPENDIX 2 FACILITY All wind tunnel tests were performed in the 1 x 1.65 m wind tunnel designed specifically for section model testing, owned and operated by the West Wind Laboratory. A schematic drawing of this wind tunnel and a photograph of it, are shown on Figure 2.1.

WEST WIND LABORATORY, INC
GGB SDS
66
FIGURE 2.1 1 X 1.65 m WIND TUNNEL

WEST WIND LABORATORY, INC
GGB SDS
67
APPENDIX 3 PROCEDURE TO PREDICT FULL BRIDGE MOTIONS IN STRONG TURBULENT WINDS The procedure described here differs from that presented in Ref 3 only in the description of the aerodynamic loads on the bridge deck. Otherwise, they are the same. Specifically, the bridge deck is divided into finite sized elements. On each, the aerodynamic load is computed including motion dependent terms and buffeting terms. Generalized actions are computed for each mode. The response of each mode is computed for the next time step using these generalized actions, the total physical bridge motions are then computed, new aerodynamic loads are computed on each element using these elemental physical motions, and the process is once again repeated for the next step in time. The three dimensional flow field was generated analytically as described in Ref 2. Chen, Matsumoto, and Kareem describe in Ref 3 the motion dependent aerodynamic loads, in the time domain, for arbitrary motions, in terms of impulse functions. While not as elegant mathematically, the motion dependent aerodynamic loads can also be described directly in terms of the aeroelastic flutter derivatives. This description is computationally more efficient and it eliminates numerical uncertainties associated with one additional series of transformations (to obtain impulse functions from flutter derivatives). Central to this description is the assumption that the motion dependent aerodynamic loads can be described as the superposition of modal, motion dependent, aerodynamic loads. This has been demonstrated to be valid for years. See Appendix 4. Motion dependent aerodynamic lift, Lij , and moment, Mij , on the ith deck element, due to the jth mode of vibration can be given by Simiu and Scanlan (Ref 1) Lij = 1/2ρU2B(KH1ij*((dhij / dt) / U) + KH2ij*(B(dαij / dt) / U) + K2H3ij*ij + K2H4ij*(hij/B)) (3.1) Mij = 1/2ρU2B2(KA1ij*(dhij / dt) / U) + KA2ij*(B(dαij / dt) / U) + K2Aij*ij + K2A 4ij*(hij/B)) (3.2) where ρ = air density, K = B/U and = 2n, and A1ij*, A2ij*, A3ij*, A4ij*, H1ij*, H2ij*, H3ij*, and H4ij* aeroelastic flutter derivatives. See Figure 3.1 for positive coordinate directions, and positive action directions. The aeroelastic flutter derivatives can be interpreted as frequency dependent aerodynamic stiffness and damping terms, valid for steady, decaying, or diverging harmonic motions. The flutter derivatives typically are obtained as those damping and stiffness terms that must have existed to produce the observed,

WEST WIND LABORATORY, INC
GGB SDS
68
superimposed torsional and vertical motions of a section model, each with its own frequency of vibration.
At the onset of each simulation, in smooth or turbulent flow, each mode is given a unit modal displacement. They are all released simultaneously. Although the bridge motion may look arbitrary and erratic, each mode of vibration typically is a slowly varying harmonic motion at a single frequency for which the flutter derivatives are valid. At the onset, each mode of vibration typically will vibrate near its aerodynamically stiffened (or softened) natural frequency. As the motion progresses, various modes will couple aerodynamically and gradually change their frequency to some other, but single, frequency of vibration. The use of impulse functions, in convolution integrals, to describe the motion dependent aerodynamic loads on a bridge deck, is essentially equivalent to the use of continuously variable (with respect to frequency) flutter derivatives in (3.1) and (3.2). Because the products of K or K2 and the flutter derivatives vary so slowly with frequency, the flutter derivatives can be varied at finite steps in time (as required), instead of being varied continuously, without loss of precision (certainly with respect to the experimental errors associated with the experimentally obtained flutter derivatives and associated impulse functions). In this procedure, at 20 second intervals (in a 10-minute simulation) all products of K or K2 and the corresponding flutter derivatives are re-evaluated, for each element, for each mode of vibration, based upon the average frequency of vibration for the preceding 20-second time segment, for the mode in question and based upon the average wind speed for that 20-second time segment. The average 20-second wind
WEST WIND LABORATORY, INC
GGB SDS
69
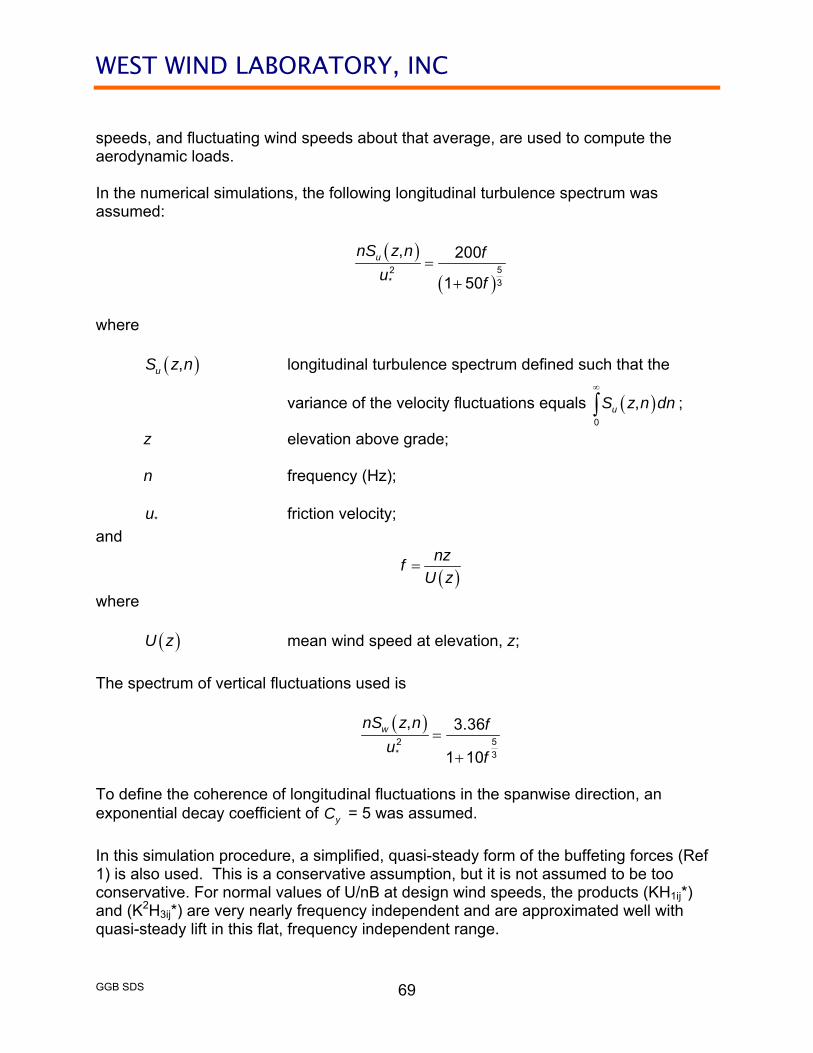
speeds, and fluctuating wind speeds about that average, are used to compute the aerodynamic loads. In the numerical simulations, the following longitudinal turbulence spectrum was assumed:
52
* 3
, 200
1 50
unS z n f
u f
where ,uS z n longitudinal turbulence spectrum defined such that the
variance of the velocity fluctuations equals 0
,uS z n dn
;
z elevation above grade; n frequency (Hz); *u friction velocity;
and
nzf
U z
where U z mean wind speed at elevation, z;
The spectrum of vertical fluctuations used is
52* 3
, 3.36
1 10
wnS z n f
uf
To define the coherence of longitudinal fluctuations in the spanwise direction, an exponential decay coefficient of yC = 5 was assumed.
In this simulation procedure, a simplified, quasi-steady form of the buffeting forces (Ref 1) is also used. This is a conservative assumption, but it is not assumed to be too conservative. For normal values of U/nB at design wind speeds, the products (KH1ij*) and (K2H3ij*) are very nearly frequency independent and are approximated well with quasi-steady lift in this flat, frequency independent range.
WEST WIND LABORATORY, INC
GGB SDS
70
The step size in all simulations is 0.04 seconds. Bridge motions are simulated for a duration of 5.33 minutes (8,000 total steps in the simulation).

WEST WIND LABORATORY, INC
GGB SDS
71
APPENDIX 4 IDENTIFICATION PROCEDURE FOR FLUTTER DERIVATIVES FROM SECTION MODEL TESTS A linear description of the motion of this section model, for small motions, is m(d2h / dt2) + ch(dh / dt) + khh = LI (4.1) I(d2α / dt2) + cα(dα / dt) + kαα = MI (4.2) where m mass of section model; I rotational inertia of section model; ch damping coefficient for vertical motion c damping coefficient for torsional motion kh vertical stiffness; k torsional stiffness; and l model length. L and M, and positive coordinate and action directions are presented in Appendix 3. It is assumed here that the bridge deck is symmetrical about its centerline, so there are no mechanical coupling terms. The linear description of the motion is valid because motions are constrained to be very small. Any motion that becomes large is of academic interest only, and is to be avoided at all costs by the bridge designer. If a large motion is expected over the life span of the bridge, the bridge deck geometry, structure, or energy dissipation capability is changed until that motion is again expected to be small. The linear description of small bridge structure motions is well established. In this form, all of the aeroelastic flutter coefficients are dimensionless. For the description of the identification procedure here, consider the simplified description (d2h / dt2) + 2ωhζh(dh / dt) + ωh
2h = H1(dh / dt) + H2(dα / dt) + H3α + H4h (4.3) (d2α / dt2) + 2ωαζα(dα / dt) + ωα
2α = A1(dh / dt) + A2(dα / dt) + A3α + Ahh (4.4)
WEST WIND LABORATORY, INC
GGB SDS
72
where ωh
2 = kh m ωα
2 = k I ζh = ch 2ωhm ζα = cα 2ωα I and H1 and A1 are related to their respective H1* and A1* in an obvious manner. Again the H1 and A1 are not constants, but are functions of the wind speed U, or the reduced velocity U/nB, or a form of its inverse (the reduced frequency) K = ωB/U. Let Equations 4.3 and 4.4 be rearranged one more time for convenience, to the following form: (d2h / dt2) + (2ωhζh - H1)(dh / dt) + (ωh
2 - H4)h = H2(dα / dt) + H3α (4.5) (d2α / dt2) + (2ωαζα - A2)(dα / dt) + (ωα
2 - A3)α = A1(dh / dt) + A4h (4.6) Consider first, the single Equation 4.5. This is simply the equation of motion of a single-degree-of-freedom oscillator with dynamic response characteristics ω and ζ where ω2 = ωh
2 - H4 (4.7) and 2ζω = 2ζhωh - H1 (4.8) subject to the forcing function F(t) = H2(dα / dt) + H3α The frequency ω typically will be close to the circular frequency for vertical motion, ωh. The general solution to this equation (4.5) for an interval of time from t1 to t2, can be described as a linear combination of four solutions: h(t) = Y1y1(t) + Y2y2(t) + Y3y3(t) + Y4y4(t) (4.9) where
WEST WIND LABORATORY, INC
GGB SDS
73
y1(t) the response of the oscillator to a unit displacement at t1; y2(t) the response of the oscillator to a unit velocity at t1;
y3(t) the response of the oscillator to the "forcing function", (dα / dt), with zero initial conditions at t1; and
y4(t) the response of the oscillator to the "forcing function", (t), with
zero initial conditions at t1; and
The coefficients Y1, Y2, Y3, and Y4 are assumed, in this linear representation of the motion, to be constants for a given ω, ζ, and reduced velocity U/nB for the particular test. The four solutions are transient solutions. The solutions y1(t) and y2(t) are obviously exponentially varying (not necessarily decaying) harmonic functions with circular frequency, ω, and viscous damping coefficient, ζ (which is not necessarily positive). Since the torsional motions of the section model, α(t) and α(t), are also likely to be exponentially varying harmonic motions, the responses y3(t) and y4(t) are likely to be as well. These responses, y3(t) and y4(t), however will have a frequency equal to the circular frequency of the measured torsional motion, which in turn, typically is very close to the still-air torsional frequency, ωα. The objective for Equation 4.5 is again to identify, from recorded section model motions h(t) and α(t), and from the wind-off dynamic response characteristics ωh, ωα, ζh, and ζα, the four flutter coefficients H1, H2, H3, and H4. If ωh and ζh are known (the observed dynamic response characteristics for the vertical motion with wind speed U), then H1 and H4 can be determined from Equations 4.7 and 4.8. If the observed response is decomposed in the form of Equation 4.9, then it follows that H2 = Y3 and H3 = Y4. A combined exhaustive search procedure (educated trial and error approach) and a linear-least-squares fitting procedure in the time domain is used to identify ω, ζ, Y3, and Y4. In order for the response to be decomposed into the four transient responses as defined by Equation 4.9, the section model test set-up must be designed specifically to make that decomposition possible. All four transient responses, y1(t), y2(t), y3(t), and y4(t) are exponentially varying harmonic functions. If the vertical motion frequency and the torsional motion frequency are similar, there is no way that the response can be decomposed uniquely as shown in Equation 4.9. Whether or not the frequencies are separated, in reality, for the full-scale bridge, they must be separated in the section model test if this procedure is to be used. Since the objective from the section model test is to determine the flutter coefficients (not simulate the actual bridge behavior), the two section model frequencies can be separated as much as possible, by any amount that is convenient, in order to maximize the accuracy of the data to be collected. Once

WEST WIND LABORATORY, INC
GGB SDS
74
the flutter coefficients have been identified, they then can be used in an analytical model of the full bridge, including all modes of vibration, as outlined in Ref 1 to predict the critical flutter velocities, should they exist. The precise identification procedure (for coefficients H1, H2, H3, and H4 from Equation 4.5) follows directly: Define one more response X(t) = Y1y1(t) + Y2y2(t) + Y3y3(t) + Y4y4(t) (4.10) where the Y's and the y(t)'s are defined as before, for t1<t<t2. If the Y's, ω, and ζ will be found such that the squared error E t2 E = ∫ (X(t) - h(t))2dt (4.11) t1 is least. First, for a given wind speed U, the model is perturbed such that significant, but still small, vertical and torsional motions are produced. A sample of the transient motions (either decaying motions or diverging motions) is recorded, i.e., h(t) and α(t) for t1<t2. It is assumed that the wind-off dynamic response characteristics have previously been recorded. Second, values of ω and ζ are assumed. For this set of values, a linear-least-squares fitting procedure is used to determine the optimal values of Y1, Y2, Y3, and Y4, and the squared error E is computed using Equation 4.11. A modified version of a steepest descent procedure is used, with respect to the variables ω and ζ (and at each step the best-fit values of Y1, Y2, Y3, and Y4 are recalculated). In this manner an optimal set of ω, ζ, Y1, Y2, Y3, and Y4, are found from which the H1, H2, H3, H4, and in turn, the H1*, H2*, H3*, and H4* are found. It is assumed that these best-fit values of the flutter coefficients are in fact the best estimates of those true values for the section model. The exact procedure is repeated using Equation 4.6 to determine the torsional flutter coefficients A1*, A2*, A3* and A4*. There is no way to prove that this procedure will converge to the proper values of the flutter coefficients, but years of use seems to indicate that it will. Again, there is the possibility that a set of flutter coefficients is found that is locally optimal, but not globally optimal. The likelihood of that occurring is greatly reduced if small steps are made in incrementing the wind speed from one speed to another, and if the previous best-fit values of ω and ζ are used as initial estimates for the next wind speed (starting with wind-off values for the first step).
WEST WIND LABORATORY, INC
GGB SDS
75
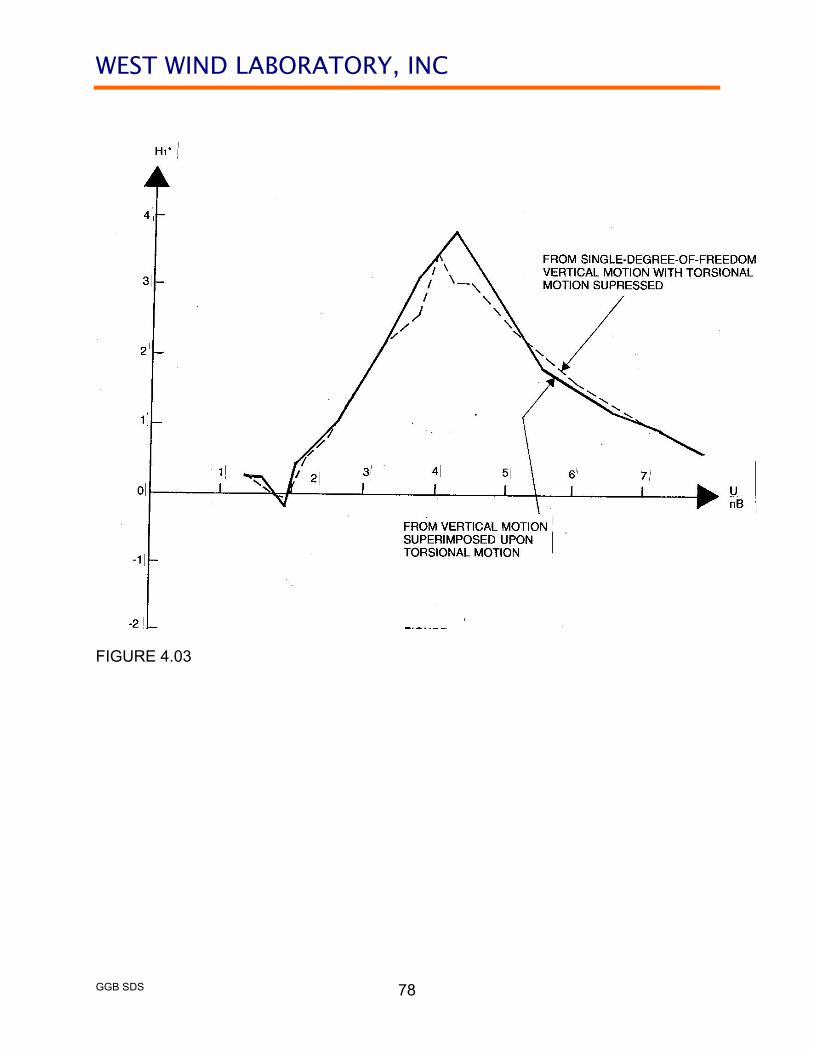
This identification procedure relies heavily upon the assumption that the mechanical vibrations of the model, and the unsteady aerodynamic loads are linear functions of the model motion. Shown on Figure 4.1, 4.2, and 4.3 are sets of two curves of A2* and H1* that were obtained for two different bridge sections. One A2* curve in a set was obtained from observed torsional motions with the vertical motion suppressed. The second A2* curve in the set was obtained using the procedure described in this paper from torsional motions that were superimposed upon vertical motions. Similarly, one H1* curve in a set was obtained from observed vertical motions with torsional motion suppressed. The second H1* curve in the set was obtained using the procedure described in this paper from vertical motions that were superimposed upon torsional motions. The good agreement between the two curves in each set verifies that validity of the assumption of linearity in the aerodynamic loads.

WEST WIND LABORATORY, INC
GGB SDS
76
FIGURE 4.01

WEST WIND LABORATORY, INC
GGB SDS
77
FIGURE 4.02
WEST WIND LABORATORY, INC
GGB SDS
78
FIGURE 4.03
WEST WIND LABORATORY, INC
GGB SDS
79
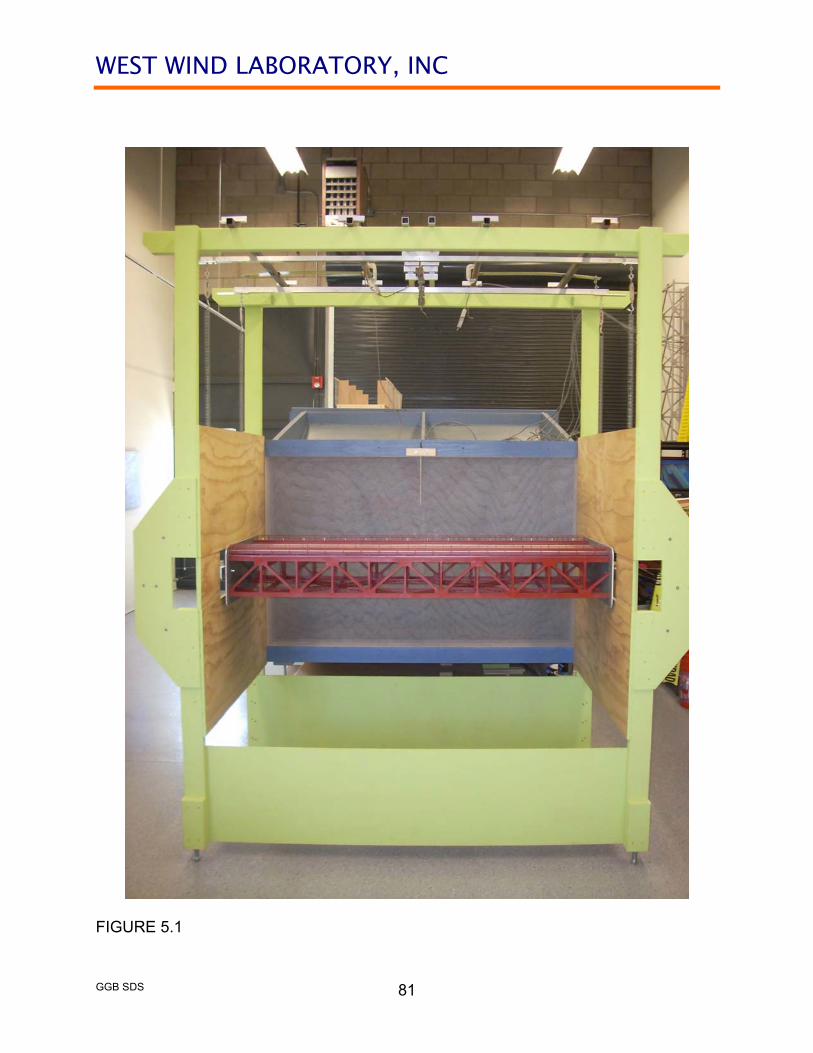
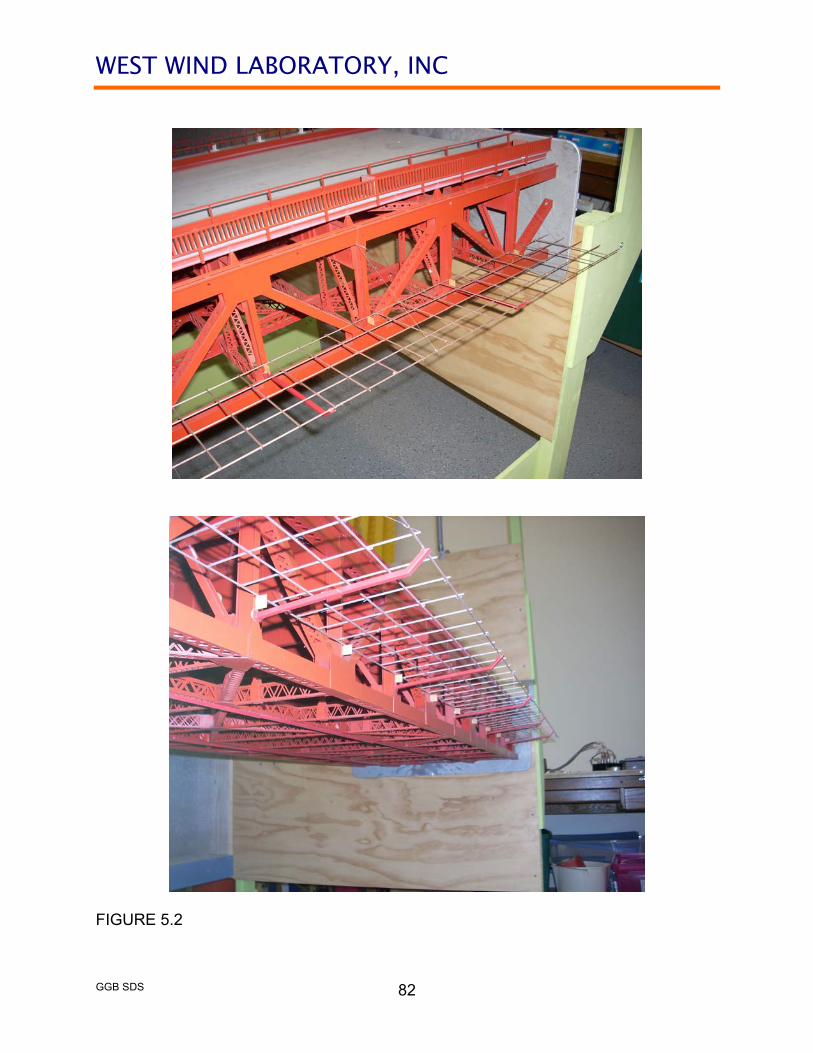
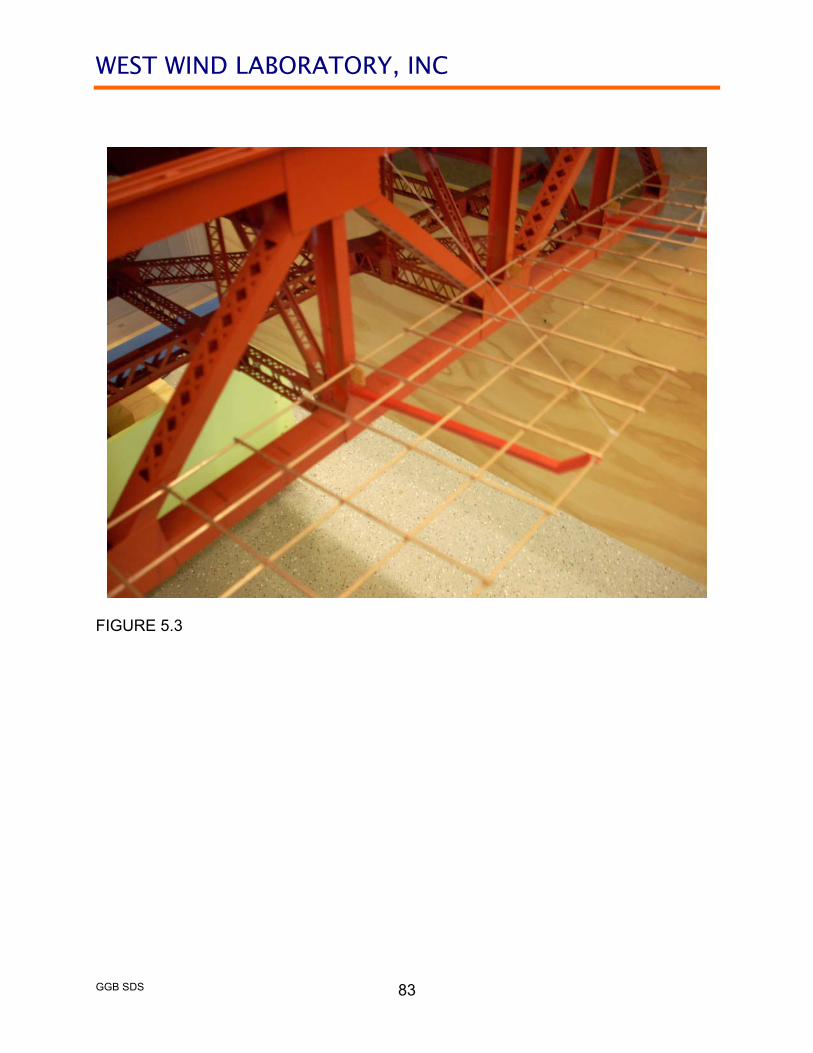
APPENDIX 5 MODEL Required for this study was a single 1:50th scale model of a portion of the bridge deck (81.28 m (266.67 ft) long). The model was constructed for a previous wind study (Ref 5), and has been modified to include railings between the roadway and sidewalk, to include moveable traffic barriers, and to include various aerodynamic enhancement configurations. The model is constructed of laser-cut plastic. For this study the model was modified to include the single-fairing aerodynamic enhancements on the Western edge of the bridge (Ref 7), and the proposed suicide deterrent net system (SDS) on both sides. The model with those modifications are shown on Figures 5.1 through 5.3. Wind tunnel tests on models in the wind tunnel (even at a relatively large scale of 1:50) can never be modeled satisfying Reynolds Number similitude. If the model has sharp edges, separation points in the flows around the model will occur at those sharp edges on the model and on the full-scale bridge. Therefore, those flows will be similar as will the pressures distributions. Errors in the wind flows and pressure distributions associated with the inevitable Reynolds Number mismatch can occur around smooth curved surfaces, and through small openings. Typical modeling techniques have been used to minimize errors in the results due to that Reynolds Number mismatch. At low Reynolds Numbers, the boundary layer flow over a curved surface will be laminar. At full scale, over that smooth surface, the boundary layer will be turbulent. The flow will separate from the smooth curved surface at different points on that surface for the two different boundary layers (laminar and turbulent). Therefore, the smooth surface (of the fairing) was artificially roughened (with fine sand) to force the development of a turbulent boundary layer, even at the low values of Reynolds Number. Flows through railings and nets can also be Reynolds Number dependent. As the opening size in the railing or net gets smaller and smaller, what was otherwise turbulent flow becomes laminar flow, and the resistance to that flow (through the openings) gets artificially high. The full-scale net has wires that are approximately 4 mm (3/16 in) in diameter, with spacings of about 100 mm (4 in). If the net were modeled to be geometrically correct, the wires would be 0.08 mm (0.003 in) in diameter with a typical spacing of about 2 mm (0.08 in). The flow through the net would be at a very low Reynolds Number with a disproportionally high resistance to flow. Ideally, to minimize Reynolds Number effects, the Reynolds Number of the flow through the modeled net should be as close as possible to the Reynolds Number of the flow through the full-scale net. When the mesh size of the full-scale net is small, the full-scale net should be used as well on the model. The mesh size of the full-scale SDS net is too large to be used on the model as well, so a large-scale model of it (approximately 1:3 scale) was used. Member sizes were large (round members with a diameter of 1.56 mm (1/16 in)) with a spacing of 39 by 35 mm (1.42 by 1.38 in). The modeled and full-scale members were both round, and the ratio of projected solid area to gross area was the same for
WEST WIND LABORATORY, INC
GGB SDS
80
the modeled and full-scale net. Therefore, the resistance to the flow through the net will be similar (with minimal Reynolds Number effect), and the modeled net will still have a small enough mesh size so the smoothed, distribution of flow through the net will be similar to the smoothed, distribution of the flow through the full-scale net. The railing on the Western edge of the bridge deck was modeled similarly. Specifically, the opening size between the railing pickets were not modeled to be geometrically similar to the full-scale opening size, but were modeled as being larger. The members in the model and on the full-scale bridge are sharp edged, and again, the ratio of the projected solid area to the projected gross area are the same. Therefore, the aerodynamic flow through the modeled railing and full-scale railing will be similar, and Reynolds Number effects will be minimized.
WEST WIND LABORATORY, INC
GGB SDS
81
FIGURE 5.1
WEST WIND LABORATORY, INC
GGB SDS
82
FIGURE 5.2
WEST WIND LABORATORY, INC
GGB SDS
83
FIGURE 5.3

WEST WIND LABORATORY, INC
GGB SDS
84
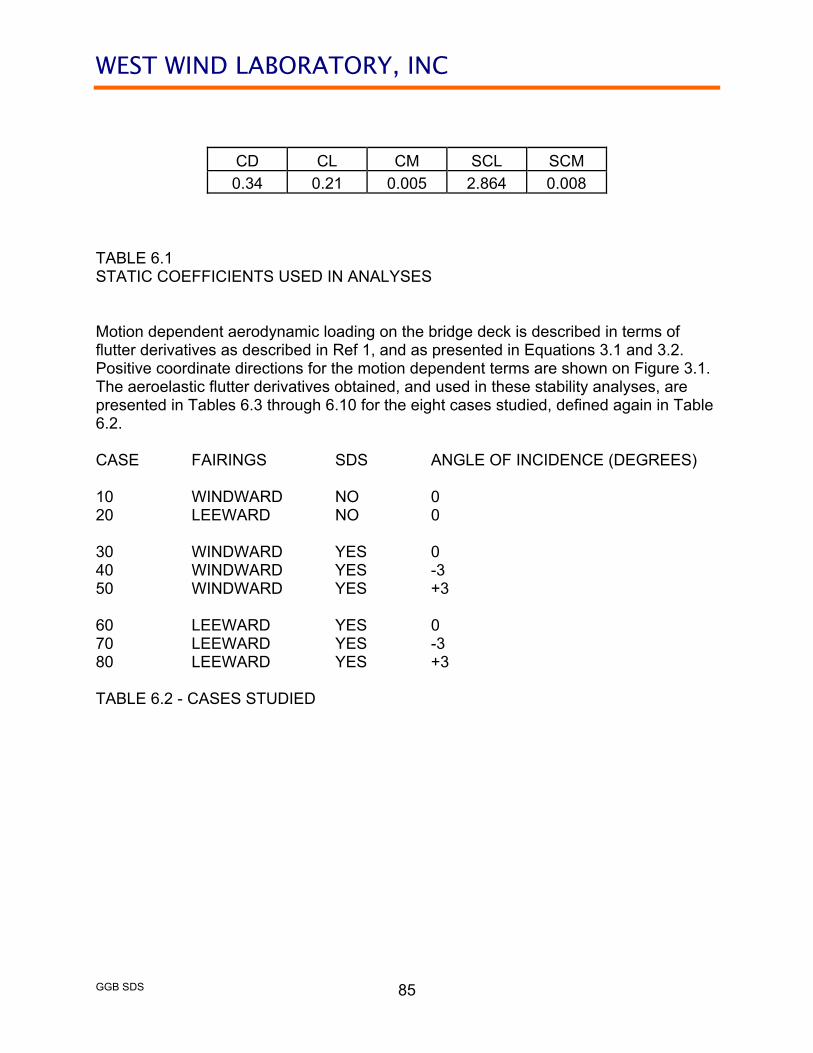
APPENDIX 6 AERODYNAMIC INPUT PARAMETERS Required for the simulation procedure are static and dynamic aerodynamic characteristics of the bridge deck. These characteristics were obtained from large scale models of a section of the bridge deck in the wind tunnel, as described elsewhere in this report. Static aerodynamic coefficients are used to describe the steady state lift, drag, and moment on the deck section, and were obtained by D = (1/2ρU2)(B)(I)(CD) L = (1/2ρU2)(B)(I)(CL) M = (1/2ρU2)(B)(I)(CM) where D drag on section model, N; L lift on section model, N; M moment about section model axis, N*m; ρ density of air, 1.25 kg/m^3; U mean wind speed, m/s;
B model reference length, 0.54864 m (model bridge deck width); I model length, 1.6256 m; and CD, CL, CM dimensionless aerodynamic coefficients. Positive coordinate directions are shown in Figure 6.1. Buffeting analyses were not performed on the bridge in this study, only stability analyses. Only the drag coefficient, CD, will be of significance in the stability analyses. Static coefficients for the bridge deck, from the Reference 7 study, were used for this study. Those static coefficients are shown in Table 6.1. SCL and SCM are the slopes of the lift and moment coefficients respectively.
WEST WIND LABORATORY, INC
GGB SDS
85
CD CL CM SCL SCM
0.34 0.21 0.005 2.864 0.008 TABLE 6.1 STATIC COEFFICIENTS USED IN ANALYSES Motion dependent aerodynamic loading on the bridge deck is described in terms of flutter derivatives as described in Ref 1, and as presented in Equations 3.1 and 3.2. Positive coordinate directions for the motion dependent terms are shown on Figure 3.1. The aeroelastic flutter derivatives obtained, and used in these stability analyses, are presented in Tables 6.3 through 6.10 for the eight cases studied, defined again in Table 6.2. CASE FAIRINGS SDS ANGLE OF INCIDENCE (DEGREES) 10 WINDWARD NO 0 20 LEEWARD NO 0 30 WINDWARD YES 0 40 WINDWARD YES -3 50 WINDWARD YES +3 60 LEEWARD YES 0 70 LEEWARD YES -3 80 LEEWARD YES +3 TABLE 6.2 - CASES STUDIED

WEST WIND LABORATORY, INC
GGB SDS
86
GG10 4/26/13 U/nB A1 A4 H1 H4 0.6225 -0.0755 -0.0565 -0.0349 -0.0407 0.9244 -0.1253 -0.0182 -0.1854 -0.1577 1.3083 -0.1497 -0.0460 -0.3386 -0.1664 1.6403 -0.2054 -0.0649 -0.4503 -0.2393 2.1179 -0.2888 -0.0517 -0.6176 -0.4219 2.5238 -0.3394 -0.0701 -0.8750 -0.6026 2.7532 -0.3842 -0.0632 -1.2049 -0.6779 3.0922 -0.4372 -0.0549 -1.6200 -0.7473 3.7453 -0.4882 -0.0176 -2.0081 -0.3722 4.2885 -0.5147 -0.1262 -2.5488 -0.4805 4.7680 -0.4847 -0.0158 -2.4216 -0.1021 5.3833 -0.5085 0.0439 -2.7557 0.1759 6.1615 -0.4976 0.1299 -2.8858 0.0064 6.7398 -0.5540 0.1930 -3.1497 0.2812 7.1311 -0.5684 0.1544 -3.2801 0.0122 7.5600 -0.5532 0.1495 -3.2754 -0.0091 8.2062 -0.5784 0.1298 -3.7465 -0.0922 8.8517 -0.6300 0.2346 -4.3338 0.1193 9.4866 -0.5439 0.1624 -3.6808 -0.3520 9.8852 -0.5962 0.1955 -4.1096 -0.0733 10.4901 -0.7889 0.3655 -5.0246 -0.0348 11.2019 -0.7080 0.3809 -4.3690 -0.1467 12.4243 -0.7199 0.4566 -4.4605 0.1027 13.3366 -0.8382 0.2470 -3.8335 -0.6662 U/nB A2 A3 H2 H3 0.4677 -0.0064 0.3101 0.1025 0.3315 0.6972 -0.0142 0.3765 0.1216 0.3990 0.9890 -0.0264 0.3902 0.1685 0.4372 1.2436 -0.0392 0.4079 0.2340 0.5348 1.6067 -0.0515 0.4156 0.3047 0.5960 1.9200 -0.0587 0.4197 0.3842 0.6603 2.1107 -0.0727 0.4538 0.3351 0.7337 2.3756 -0.0852 0.5040 0.3324 0.9167 2.8800 -0.0881 0.5727 0.3965 1.3071 3.3053 -0.0908 0.6358 0.3552 1.5545 3.6730 -0.0822 0.6889 0.7002 1.9203 4.1644 -0.0653 0.7663 0.7921 2.4041 4.7941 -0.0600 0.8808 1.1412 2.6999 5.2666 -0.0235 0.8837 1.2707 3.2655 5.5906 -0.0225 0.9496 1.3767 3.4392 5.9431 -0.0294 1.0518 1.5223 3.7817 6.4992 -0.0049 1.1665 1.7154 4.4656 7.0085 0.0281 1.2668 1.9024 4.5622 7.5626 0.0443 1.3250 2.2161 5.0675 7.9008 0.0476 1.3792 2.1834 5.4587 8.4810 0.0738 1.5195 2.3717 6.7483 9.1148 0.1067 1.7082 2.9950 7.1321 10.1415 0.1368 2.0315 3.8984 8.2531 11.1523 0.1900 2.3680 4.0785 9.9214 TABLE 6.3

WEST WIND LABORATORY, INC
GGB SDS
87
GG20 4/26/13 U/nB A1 A4 H1 H4 0.5692 -0.0652 -0.2363 -0.0237 -0.0286 0.9675 -0.0838 -0.1913 -0.1085 -0.1356 1.1965 -0.1263 -0.2105 -0.2583 -0.1668 1.6725 -0.2545 -0.2539 -0.2999 -0.1772 2.1854 -0.3414 -0.2364 -0.4873 -0.5482 2.5580 -0.4265 -0.1839 -0.8034 -0.8521 2.7999 -0.4916 -0.1756 -1.1206 -1.0627 3.2552 -0.5121 -0.1504 -1.6991 -1.1107 3.7551 -0.4922 -0.1411 -2.3748 -0.8098 4.4821 -0.4750 -0.0157 -2.9440 -0.5009 4.8995 -0.4781 0.0816 -3.0623 -0.3953 5.4196 -0.5271 0.0506 -3.1519 -0.4928 6.0408 -0.4811 0.1006 -3.5146 -0.1343 6.6026 -0.5027 0.1582 -3.8634 0.0506 7.2467 -0.4218 0.2507 -4.0773 0.3455 7.8807 -0.5032 0.3007 -4.8688 0.1706 8.2857 -0.5291 0.2527 -4.2711 -0.1906 8.9282 -0.4950 0.2851 -4.4947 -0.0698 9.4502 -0.5648 0.3342 -5.2199 -0.4859 10.1338 -0.5586 0.3870 -4.8197 0.3541 U/nB A2 A3 H2 H3 0.4313 -0.0020 0.1736 0.0765 0.0774 0.7336 -0.0029 0.2473 0.1318 0.1565 0.9075 -0.0102 0.2668 0.1662 0.1592 1.2650 -0.0221 0.2562 0.2694 0.3143 1.6764 -0.0713 0.2425 0.3554 0.3268 1.9710 -0.0821 0.2656 0.3766 0.3551 2.1665 -0.0919 0.3197 0.3600 0.4042 2.5313 -0.1017 0.3920 0.2130 0.5581 2.9319 -0.0897 0.4845 0.0745 0.9881 3.5019 -0.0498 0.6345 0.0924 1.4946 3.8416 -0.0276 0.6960 0.2953 1.8600 4.2506 0.0122 0.7397 0.3565 2.1722 4.7428 0.0170 0.7658 0.6054 2.6789 5.2038 0.0860 0.8647 0.6946 3.2365 5.7049 0.1361 0.9425 1.0044 3.9446 6.2408 0.1979 1.0182 0.9673 4.3654 6.6269 0.2309 1.0554 1.3645 4.8517 7.1491 0.2693 1.0675 1.6944 5.5509 7.6278 0.3023 1.0642 1.4984 6.1410 8.1596 0.3389 1.0606 2.1245 6.9037 TABLE 6.4

WEST WIND LABORATORY, INC
GGB SDS
88
GG30 4/26/13 U/nB A1 A4 H1 H4 0.6225 -0.0755 -0.0565 -0.0349 -0.0407 0.9244 -0.1253 -0.0182 -0.1854 -0.1577 1.3083 -0.1497 -0.0460 -0.3386 -0.1664 1.6403 -0.2054 -0.0649 -0.4503 -0.2393 2.1179 -0.2888 -0.0517 -0.6176 -0.4219 2.5238 -0.3394 -0.0701 -0.8750 -0.6026 2.7532 -0.3842 -0.0632 -1.2049 -0.6779 3.0922 -0.4372 -0.0549 -1.6200 -0.7473 3.7453 -0.4882 -0.0176 -2.0081 -0.3722 4.2885 -0.5147 -0.1262 -2.5488 -0.4805 4.7680 -0.4847 -0.0158 -2.4216 -0.1021 5.3833 -0.5085 0.0439 -2.7557 0.1759 6.1615 -0.4976 0.1299 -2.8858 0.0064 6.7398 -0.5540 0.1930 -3.1497 0.2812 7.1311 -0.5684 0.1544 -3.2801 0.0122 7.5600 -0.5532 0.1495 -3.2754 -0.0091 8.2062 -0.5784 0.1298 -3.7465 -0.0922 8.8517 -0.6300 0.2346 -4.3338 0.1193 9.4866 -0.5439 0.1624 -3.6808 -0.3520 9.8852 -0.5962 0.1955 -4.1096 -0.0733 10.4901 -0.7889 0.3655 -5.0246 -0.0348 11.2019 -0.7080 0.3809 -4.3690 -0.1467 12.4243 -0.7199 0.4566 -4.4605 0.1027 13.3366 -0.8382 0.2470 -3.8335 -0.6662 U/nB A2 A3 H2 H3 0.4677 -0.0394 0.4079 0.1025 0.3315 0.6972 -0.0160 0.3402 0.1216 0.3990 0.9890 -0.0140 0.2883 0.1685 0.4372 1.2436 -0.0308 0.3310 0.2340 0.5348 1.6067 -0.0648 0.3919 0.3047 0.5960 1.9200 -0.0630 0.4136 0.3842 0.6603 2.1107 -0.0562 0.4174 0.3351 0.7337 2.3756 -0.0635 0.4407 0.3324 0.9167 2.8800 -0.0822 0.5293 0.3965 1.3071 3.3053 -0.0865 0.5698 0.3552 1.5545 3.6730 -0.0825 0.6642 0.7002 1.9203 4.1644 -0.0605 0.6656 0.7921 2.4041 4.7941 -0.0488 0.8534 1.1412 2.6999 5.2666 -0.0859 0.9627 1.2707 3.2655 5.5906 -0.0853 1.0200 1.3767 3.4392 5.9431 -0.0572 1.1601 1.5223 3.7817 6.4992 -0.0409 1.3506 1.7154 4.4656 7.0085 0.0184 1.4426 1.9024 4.5622 7.5626 0.0424 1.4163 2.2161 5.0675 7.9008 0.0095 1.4771 2.1834 5.4587 8.4810 -0.0184 1.7182 2.3717 6.7483 9.1148 0.0096 1.7945 2.9950 7.1321 10.1415 0.0567 2.0332 3.8984 8.2531 11.1523 0.0347 2.4169 4.0785 9.9214 TABLE 6.5

WEST WIND LABORATORY, INC
GGB SDS
89
GG40 4/26/13 U/nB A1 A4 H1 H4 0.4863 -0.0207 0.0009 -0.0069 -0.0696 0.8951 -0.0853 0.0104 -0.0789 -0.1082 1.1749 -0.1174 0.0270 -0.2099 -0.2416 1.6762 -0.2101 0.0201 -0.3445 -0.3302 2.1340 -0.2634 0.0273 -0.4915 -0.4811 2.5422 -0.3439 0.0667 -0.7932 -0.6376 2.8264 -0.3885 0.0508 -1.0886 -0.8061 3.3610 -0.4112 0.0537 -1.5058 -0.7227 3.8076 -0.4761 0.0675 -2.0295 -0.5328 4.4976 -0.5004 0.0858 -2.3721 -0.1350 4.8381 -0.4449 0.1460 -2.5553 -0.1701 5.3490 -0.5288 0.2026 -2.5438 -0.0692 6.0553 -0.5480 0.1492 -2.7252 -0.1455 6.7156 -0.5525 0.2641 -3.0159 0.0319 7.2239 -0.5997 0.2721 -2.9927 0.1218 7.6439 -0.5252 0.2958 -2.8818 0.1010 8.1999 -0.7263 0.2632 -3.2527 0.0157 8.8643 -0.6507 0.3819 -3.6644 0.1220 9.3481 -0.5919 0.4898 -3.8085 0.1408 10.0401 -0.7204 0.4939 -4.2689 0.2155 10.7318 -0.8080 0.5741 -4.8380 -0.0039 11.5118 -0.6446 0.5004 -4.1931 0.1339 12.2169 -0.9266 0.5278 -5.3736 -0.9529 13.5381 -0.9123 0.5972 -5.0555 -0.5152 U/nB A2 A3 H2 H3 0.3687 -0.0026 0.2988 0.0242 0.4851 0.6795 -0.0079 0.3362 0.1083 0.5560 0.8910 -0.0205 0.3302 0.1712 0.5800 1.2746 -0.0403 0.3765 0.2617 0.6596 1.6274 -0.0570 0.3514 0.3428 0.7342 1.9453 -0.0668 0.3919 0.3472 0.8011 2.1707 -0.0677 0.4190 0.3525 0.8981 2.5834 -0.0678 0.5311 0.3464 1.1100 2.9347 -0.0870 0.5293 0.3760 1.4547 3.4596 -0.0643 0.6913 0.3887 1.9735 3.7524 -0.0505 0.7132 0.5963 2.2533 4.1597 -0.0304 0.8255 0.9085 2.6643 4.7316 0.0180 0.9436 1.0429 2.8902 5.2501 0.0592 1.0529 1.4588 3.2892 5.6651 0.0414 1.0199 1.5910 3.8178 6.0024 0.0608 1.1444 1.7566 3.9569 6.4952 0.0747 1.2149 2.0007 4.4855 7.0702 0.0677 1.2707 2.0485 5.0515 7.4702 0.0834 1.3865 2.3002 5.4353 8.0758 0.1227 1.5176 2.6741 6.2080 8.6857 0.2012 1.7291 2.8468 6.5797 9.3733 0.2328 1.8647 3.4822 7.6303 10.2549 0.2270 2.0982 3.0396 8.9558 11.4535 0.1966 2.5569 4.2804 10.2965 TABLE 6.6
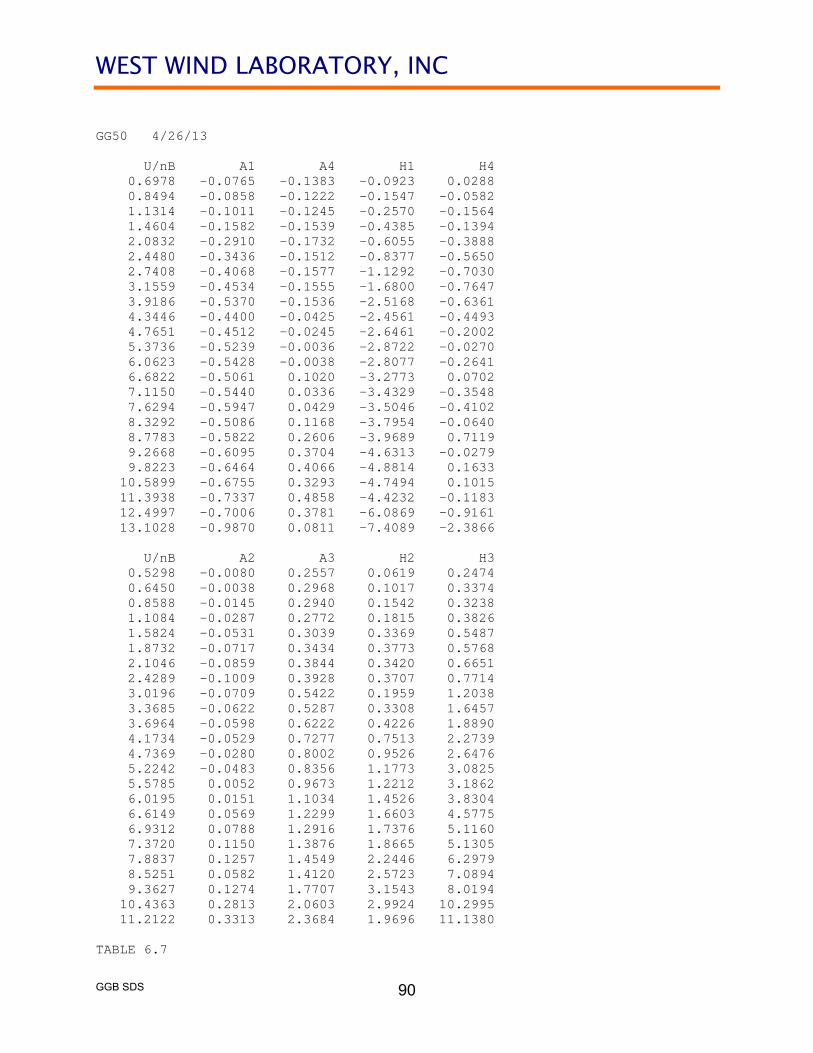
WEST WIND LABORATORY, INC
GGB SDS
90
GG50 4/26/13 U/nB A1 A4 H1 H4 0.6978 -0.0765 -0.1383 -0.0923 0.0288 0.8494 -0.0858 -0.1222 -0.1547 -0.0582 1.1314 -0.1011 -0.1245 -0.2570 -0.1564 1.4604 -0.1582 -0.1539 -0.4385 -0.1394 2.0832 -0.2910 -0.1732 -0.6055 -0.3888 2.4480 -0.3436 -0.1512 -0.8377 -0.5650 2.7408 -0.4068 -0.1577 -1.1292 -0.7030 3.1559 -0.4534 -0.1555 -1.6800 -0.7647 3.9186 -0.5370 -0.1536 -2.5168 -0.6361 4.3446 -0.4400 -0.0425 -2.4561 -0.4493 4.7651 -0.4512 -0.0245 -2.6461 -0.2002 5.3736 -0.5239 -0.0036 -2.8722 -0.0270 6.0623 -0.5428 -0.0038 -2.8077 -0.2641 6.6822 -0.5061 0.1020 -3.2773 0.0702 7.1150 -0.5440 0.0336 -3.4329 -0.3548 7.6294 -0.5947 0.0429 -3.5046 -0.4102 8.3292 -0.5086 0.1168 -3.7954 -0.0640 8.7783 -0.5822 0.2606 -3.9689 0.7119 9.2668 -0.6095 0.3704 -4.6313 -0.0279 9.8223 -0.6464 0.4066 -4.8814 0.1633 10.5899 -0.6755 0.3293 -4.7494 0.1015 11.3938 -0.7337 0.4858 -4.4232 -0.1183 12.4997 -0.7006 0.3781 -6.0869 -0.9161 13.1028 -0.9870 0.0811 -7.4089 -2.3866 U/nB A2 A3 H2 H3 0.5298 -0.0080 0.2557 0.0619 0.2474 0.6450 -0.0038 0.2968 0.1017 0.3374 0.8588 -0.0145 0.2940 0.1542 0.3238 1.1084 -0.0287 0.2772 0.1815 0.3826 1.5824 -0.0531 0.3039 0.3369 0.5487 1.8732 -0.0717 0.3434 0.3773 0.5768 2.1046 -0.0859 0.3844 0.3420 0.6651 2.4289 -0.1009 0.3928 0.3707 0.7714 3.0196 -0.0709 0.5422 0.1959 1.2038 3.3685 -0.0622 0.5287 0.3308 1.6457 3.6964 -0.0598 0.6222 0.4226 1.8890 4.1734 -0.0529 0.7277 0.7513 2.2739 4.7369 -0.0280 0.8002 0.9526 2.6476 5.2242 -0.0483 0.8356 1.1773 3.0825 5.5785 0.0052 0.9673 1.2212 3.1862 6.0195 0.0151 1.1034 1.4526 3.8304 6.6149 0.0569 1.2299 1.6603 4.5775 6.9312 0.0788 1.2916 1.7376 5.1160 7.3720 0.1150 1.3876 1.8665 5.1305 7.8837 0.1257 1.4549 2.2446 6.2979 8.5251 0.0582 1.4120 2.5723 7.0894 9.3627 0.1274 1.7707 3.1543 8.0194 10.4363 0.2813 2.0603 2.9924 10.2995 11.2122 0.3313 2.3684 1.9696 11.1380 TABLE 6.7
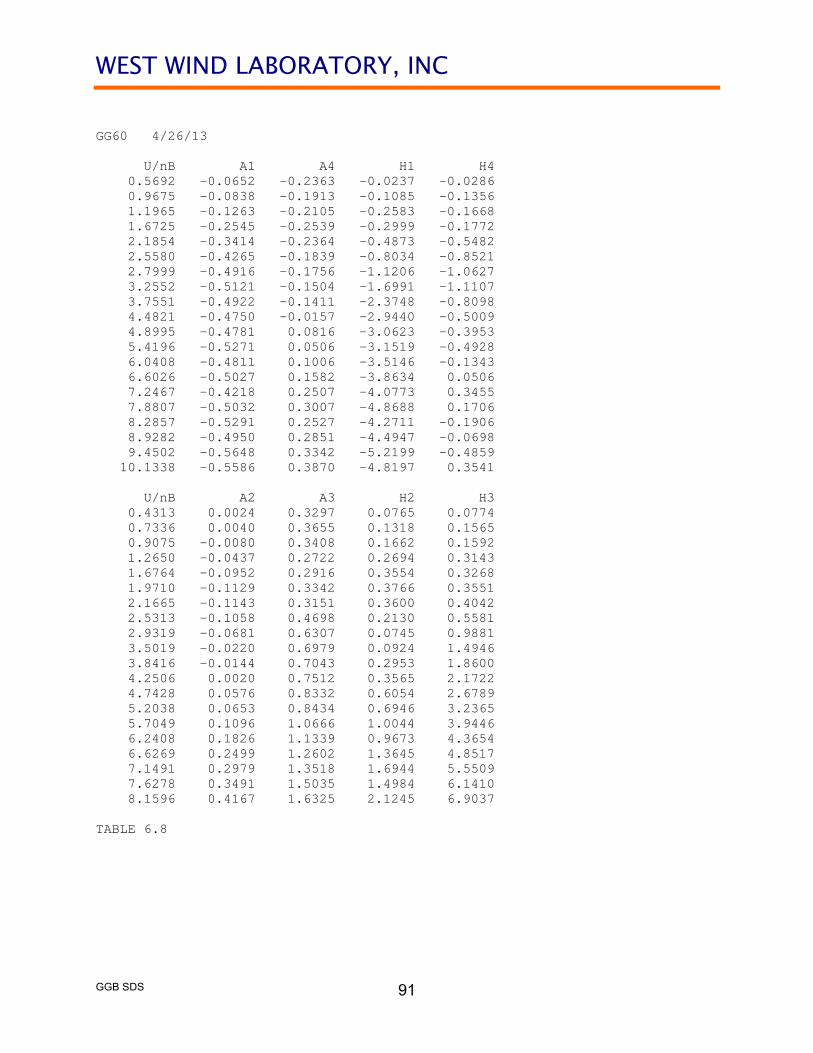
WEST WIND LABORATORY, INC
GGB SDS
91
GG60 4/26/13 U/nB A1 A4 H1 H4 0.5692 -0.0652 -0.2363 -0.0237 -0.0286 0.9675 -0.0838 -0.1913 -0.1085 -0.1356 1.1965 -0.1263 -0.2105 -0.2583 -0.1668 1.6725 -0.2545 -0.2539 -0.2999 -0.1772 2.1854 -0.3414 -0.2364 -0.4873 -0.5482 2.5580 -0.4265 -0.1839 -0.8034 -0.8521 2.7999 -0.4916 -0.1756 -1.1206 -1.0627 3.2552 -0.5121 -0.1504 -1.6991 -1.1107 3.7551 -0.4922 -0.1411 -2.3748 -0.8098 4.4821 -0.4750 -0.0157 -2.9440 -0.5009 4.8995 -0.4781 0.0816 -3.0623 -0.3953 5.4196 -0.5271 0.0506 -3.1519 -0.4928 6.0408 -0.4811 0.1006 -3.5146 -0.1343 6.6026 -0.5027 0.1582 -3.8634 0.0506 7.2467 -0.4218 0.2507 -4.0773 0.3455 7.8807 -0.5032 0.3007 -4.8688 0.1706 8.2857 -0.5291 0.2527 -4.2711 -0.1906 8.9282 -0.4950 0.2851 -4.4947 -0.0698 9.4502 -0.5648 0.3342 -5.2199 -0.4859 10.1338 -0.5586 0.3870 -4.8197 0.3541 U/nB A2 A3 H2 H3 0.4313 0.0024 0.3297 0.0765 0.0774 0.7336 0.0040 0.3655 0.1318 0.1565 0.9075 -0.0080 0.3408 0.1662 0.1592 1.2650 -0.0437 0.2722 0.2694 0.3143 1.6764 -0.0952 0.2916 0.3554 0.3268 1.9710 -0.1129 0.3342 0.3766 0.3551 2.1665 -0.1143 0.3151 0.3600 0.4042 2.5313 -0.1058 0.4698 0.2130 0.5581 2.9319 -0.0681 0.6307 0.0745 0.9881 3.5019 -0.0220 0.6979 0.0924 1.4946 3.8416 -0.0144 0.7043 0.2953 1.8600 4.2506 0.0020 0.7512 0.3565 2.1722 4.7428 0.0576 0.8332 0.6054 2.6789 5.2038 0.0653 0.8434 0.6946 3.2365 5.7049 0.1096 1.0666 1.0044 3.9446 6.2408 0.1826 1.1339 0.9673 4.3654 6.6269 0.2499 1.2602 1.3645 4.8517 7.1491 0.2979 1.3518 1.6944 5.5509 7.6278 0.3491 1.5035 1.4984 6.1410 8.1596 0.4167 1.6325 2.1245 6.9037 TABLE 6.8
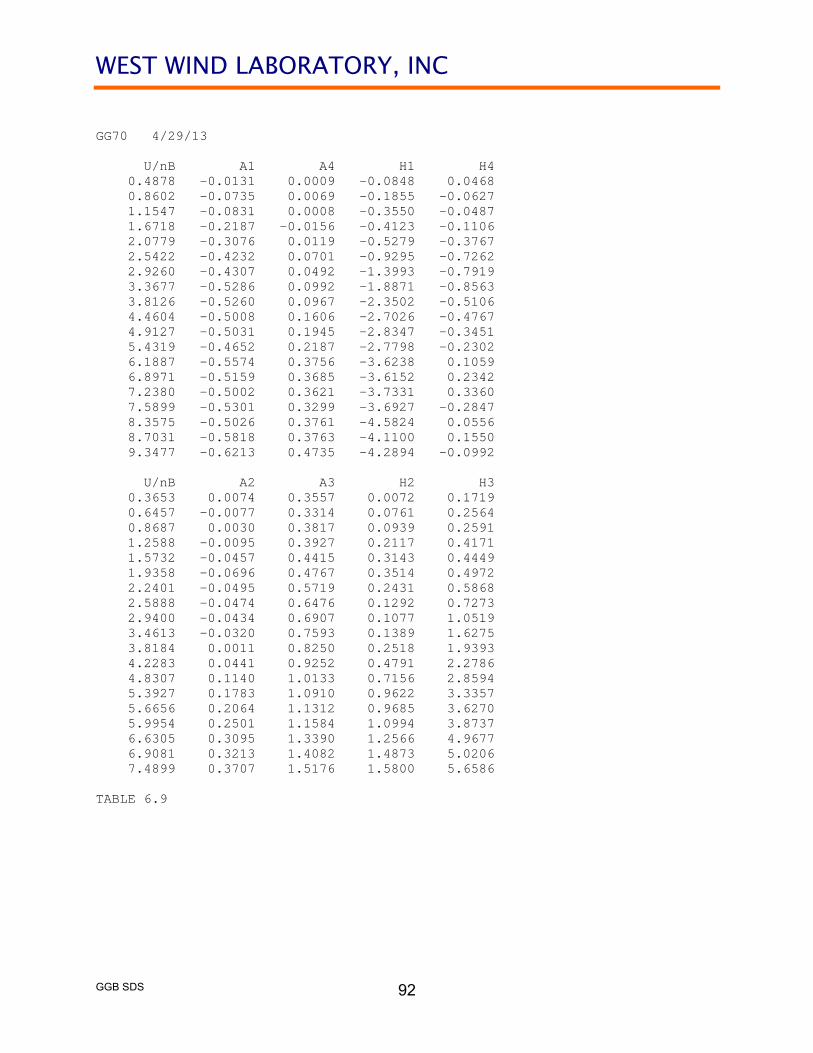
WEST WIND LABORATORY, INC
GGB SDS
92
GG70 4/29/13 U/nB A1 A4 H1 H4 0.4878 -0.0131 0.0009 -0.0848 0.0468 0.8602 -0.0735 0.0069 -0.1855 -0.0627 1.1547 -0.0831 0.0008 -0.3550 -0.0487 1.6718 -0.2187 -0.0156 -0.4123 -0.1106 2.0779 -0.3076 0.0119 -0.5279 -0.3767 2.5422 -0.4232 0.0701 -0.9295 -0.7262 2.9260 -0.4307 0.0492 -1.3993 -0.7919 3.3677 -0.5286 0.0992 -1.8871 -0.8563 3.8126 -0.5260 0.0967 -2.3502 -0.5106 4.4604 -0.5008 0.1606 -2.7026 -0.4767 4.9127 -0.5031 0.1945 -2.8347 -0.3451 5.4319 -0.4652 0.2187 -2.7798 -0.2302 6.1887 -0.5574 0.3756 -3.6238 0.1059 6.8971 -0.5159 0.3685 -3.6152 0.2342 7.2380 -0.5002 0.3621 -3.7331 0.3360 7.5899 -0.5301 0.3299 -3.6927 -0.2847 8.3575 -0.5026 0.3761 -4.5824 0.0556 8.7031 -0.5818 0.3763 -4.1100 0.1550 9.3477 -0.6213 0.4735 -4.2894 -0.0992 U/nB A2 A3 H2 H3 0.3653 0.0074 0.3557 0.0072 0.1719 0.6457 -0.0077 0.3314 0.0761 0.2564 0.8687 0.0030 0.3817 0.0939 0.2591 1.2588 -0.0095 0.3927 0.2117 0.4171 1.5732 -0.0457 0.4415 0.3143 0.4449 1.9358 -0.0696 0.4767 0.3514 0.4972 2.2401 -0.0495 0.5719 0.2431 0.5868 2.5888 -0.0474 0.6476 0.1292 0.7273 2.9400 -0.0434 0.6907 0.1077 1.0519 3.4613 -0.0320 0.7593 0.1389 1.6275 3.8184 0.0011 0.8250 0.2518 1.9393 4.2283 0.0441 0.9252 0.4791 2.2786 4.8307 0.1140 1.0133 0.7156 2.8594 5.3927 0.1783 1.0910 0.9622 3.3357 5.6656 0.2064 1.1312 0.9685 3.6270 5.9954 0.2501 1.1584 1.0994 3.8737 6.6305 0.3095 1.3390 1.2566 4.9677 6.9081 0.3213 1.4082 1.4873 5.0206 7.4899 0.3707 1.5176 1.5800 5.6586 TABLE 6.9
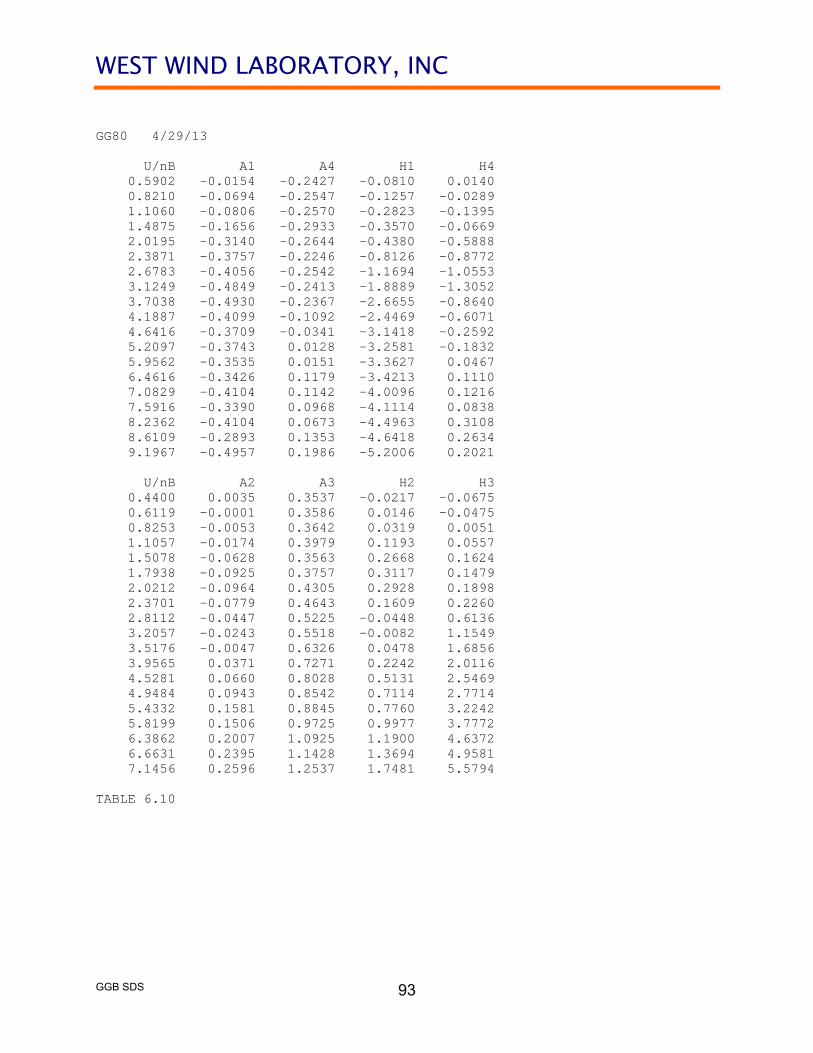
WEST WIND LABORATORY, INC
GGB SDS
93
GG80 4/29/13 U/nB A1 A4 H1 H4 0.5902 -0.0154 -0.2427 -0.0810 0.0140 0.8210 -0.0694 -0.2547 -0.1257 -0.0289 1.1060 -0.0806 -0.2570 -0.2823 -0.1395 1.4875 -0.1656 -0.2933 -0.3570 -0.0669 2.0195 -0.3140 -0.2644 -0.4380 -0.5888 2.3871 -0.3757 -0.2246 -0.8126 -0.8772 2.6783 -0.4056 -0.2542 -1.1694 -1.0553 3.1249 -0.4849 -0.2413 -1.8889 -1.3052 3.7038 -0.4930 -0.2367 -2.6655 -0.8640 4.1887 -0.4099 -0.1092 -2.4469 -0.6071 4.6416 -0.3709 -0.0341 -3.1418 -0.2592 5.2097 -0.3743 0.0128 -3.2581 -0.1832 5.9562 -0.3535 0.0151 -3.3627 0.0467 6.4616 -0.3426 0.1179 -3.4213 0.1110 7.0829 -0.4104 0.1142 -4.0096 0.1216 7.5916 -0.3390 0.0968 -4.1114 0.0838 8.2362 -0.4104 0.0673 -4.4963 0.3108 8.6109 -0.2893 0.1353 -4.6418 0.2634 9.1967 -0.4957 0.1986 -5.2006 0.2021 U/nB A2 A3 H2 H3 0.4400 0.0035 0.3537 -0.0217 -0.0675 0.6119 -0.0001 0.3586 0.0146 -0.0475 0.8253 -0.0053 0.3642 0.0319 0.0051 1.1057 -0.0174 0.3979 0.1193 0.0557 1.5078 -0.0628 0.3563 0.2668 0.1624 1.7938 -0.0925 0.3757 0.3117 0.1479 2.0212 -0.0964 0.4305 0.2928 0.1898 2.3701 -0.0779 0.4643 0.1609 0.2260 2.8112 -0.0447 0.5225 -0.0448 0.6136 3.2057 -0.0243 0.5518 -0.0082 1.1549 3.5176 -0.0047 0.6326 0.0478 1.6856 3.9565 0.0371 0.7271 0.2242 2.0116 4.5281 0.0660 0.8028 0.5131 2.5469 4.9484 0.0943 0.8542 0.7114 2.7714 5.4332 0.1581 0.8845 0.7760 3.2242 5.8199 0.1506 0.9725 0.9977 3.7772 6.3862 0.2007 1.0925 1.1900 4.6372 6.6631 0.2395 1.1428 1.3694 4.9581 7.1456 0.2596 1.2537 1.7481 5.5794 TABLE 6.10

WEST WIND LABORATORY, INC
GGB SDS
94
APPENDIX 7 BRIDGE INPUT PARAMETERS FINAL BRIDGE CONFIGURATION Required for the analysis of the bridge performance in strong winds are the parameters that describe the dynamic response of the mechanical bridge system. These were obtained from DMJM Harris / AECOM for the final bridge configuration for a previous study (Ref 6). For the numerical simulations performed in this study, wind load time histories were generated. at 30 locations along the bridge deck. Mode shape information at these 30 locations were extracted from the finite element model provided by DMJM Harris / AECOM and is presented here. For use in the numerical simulation procedure, the positive coordinate directions (non-standard) shown in Figure 7.1 were used. Furthermore, the mode shapes were renormalized such that for dominant sway modes, the maximum transverse deflection was set to 1.0; for dominant vertical modes, the maximum vertical deflection at the bridge centerline was set to 1.0; and for dominant torsional modes, the maximum vertical deflection at the bridge deck edge was set to 1.0. The mechanical damping of for all modes of vibration for the bridge was assumed to be 0.006. This value was determined experimentally using a system identification procedure and motion data on the full-scale bridge (Ref 5). The most significant 10 modes of vibration that are most likely to be excited by winds (i.e., those modes of vibration that had the highest percentage of total modal kinetic energy associated with deck sway, vertical motion, and torsional motion about a longitudinal axis) were included simultaneously in the numerical simulations. The parameters that describe these 10 modes of vibration, reformatted to the positive coordinate directions shown on Figure 7.1 and renormalized as described previously, are presented in the tables following Figure 7.1 (Tables 7.1 through 7.12).
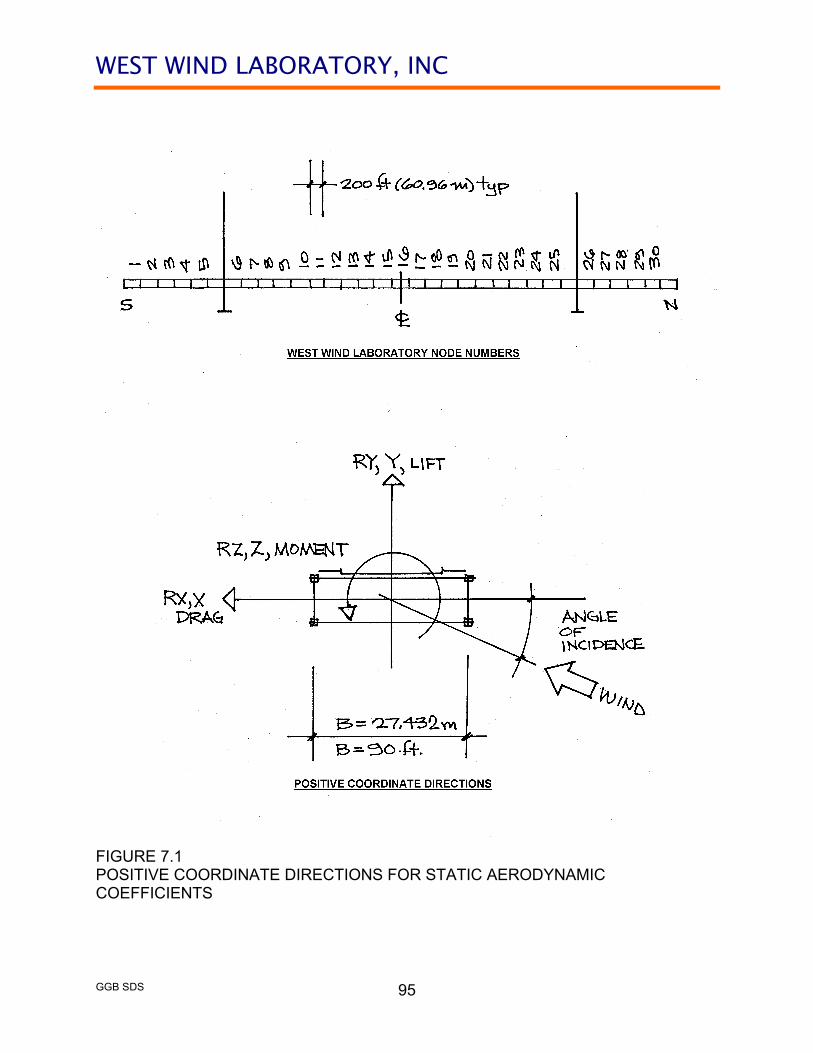
WEST WIND LABORATORY, INC
GGB SDS
95
FIGURE 7.1 POSITIVE COORDINATE DIRECTIONS FOR STATIC AERODYNAMIC COEFFICIENTS

WEST WIND LABORATORY, INC
GGB SDS
96
WWL AECOM NODE NODE
1 100580 2 101380 3 102180 4 102980 5 103780 6 105330 7 106130 8 106930 9 107730
10 108530 11 109330 12 110130 13 110930 14 111730 15 112530 16 212530 17 211730 18 210930 19 210130 20 209330 21 208530 22 207730 23 206930 24 206130 25 205330 26 203780 27 202980 28 202180 29 201380 30 200580
FIGURE 7.1 (Cont) POSITIVE COORDINATE DIRECTIONS FOR STATIC AERODYNAMIC COEFFICIENTS

WEST WIND LABORATORY, INC
GGB SDS
97
GOLDEN GATE BRIDGE 4/26/13 B(M)= 27.432 NUMBER OF MODES= 10 NUMBER OF NODES= 30 NODE DL(M) M(KG/M) MMI(KG*M^2/M) 1 60.96 29123 4.168E+06 2 60.96 29123 4.168E+06 3 60.96 29123 4.168E+06 4 60.96 29123 4.168E+06 5 60.96 29123 4.168E+06 6 60.96 29123 4.168E+06 7 60.96 29123 4.168E+06 8 60.96 29123 4.168E+06 9 60.96 29123 4.168E+06 10 60.96 29123 4.168E+06 11 60.96 29123 4.168E+06 12 60.96 29123 4.168E+06 13 60.96 29123 4.168E+06 14 60.96 29123 4.168E+06 15 60.96 29123 4.168E+06 16 60.96 29123 4.168E+06 17 60.96 29123 4.168E+06 18 60.96 29123 4.168E+06 19 60.96 29123 4.168E+06 20 60.96 29123 4.168E+06 21 60.96 29123 4.168E+06 22 60.96 29123 4.168E+06 23 60.96 29123 4.168E+06 24 60.96 29123 4.168E+06 25 60.96 29123 4.168E+06 26 60.96 29123 4.168E+06 27 60.96 29123 4.168E+06 28 60.96 29123 4.168E+06 29 60.96 29123 4.168E+06 30 60.96 29123 4.168E+06 TABLE 7.1
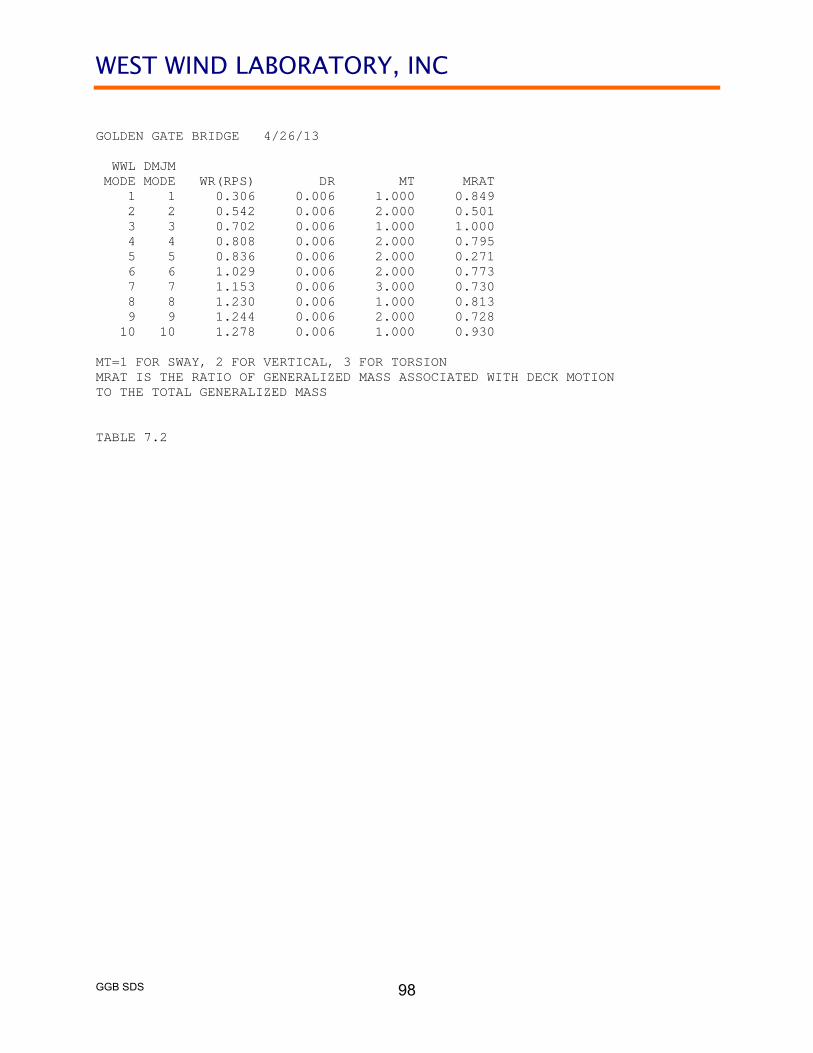
WEST WIND LABORATORY, INC
GGB SDS
98
GOLDEN GATE BRIDGE 4/26/13 WWL DMJM MODE MODE WR(RPS) DR MT MRAT 1 1 0.306 0.006 1.000 0.849 2 2 0.542 0.006 2.000 0.501 3 3 0.702 0.006 1.000 1.000 4 4 0.808 0.006 2.000 0.795 5 5 0.836 0.006 2.000 0.271 6 6 1.029 0.006 2.000 0.773 7 7 1.153 0.006 3.000 0.730 8 8 1.230 0.006 1.000 0.813 9 9 1.244 0.006 2.000 0.728 10 10 1.278 0.006 1.000 0.930 MT=1 FOR SWAY, 2 FOR VERTICAL, 3 FOR TORSION MRAT IS THE RATIO OF GENERALIZED MASS ASSOCIATED WITH DECK MOTION TO THE TOTAL GENERALIZED MASS TABLE 7.2

WEST WIND LABORATORY, INC
GGB SDS
99
GOLDEN GATE BRIDGE 4/26/13 WWL MODE 1 DMJM MODE 1 NODE RX RY RZ 1 -0.0004 0.0000 0.0000 2 -0.0009 0.0000 0.0000 3 -0.0013 0.0000 0.0000 4 -0.0015 0.0000 0.0000 5 -0.0016 0.0000 0.0000 6 -0.1461 0.0000 0.0000 7 -0.3033 0.0000 0.0000 8 -0.4506 0.0000 -0.0001 9 -0.5844 0.0000 -0.0001 10 -0.7023 0.0000 -0.0002 11 -0.8022 0.0000 -0.0002 12 -0.8827 0.0000 -0.0002 13 -0.9424 0.0000 -0.0001 14 -0.9813 0.0000 -0.0001 15 -1.0000 0.0000 0.0000 16 -1.0000 0.0000 0.0000 17 -0.9814 0.0000 -0.0001 18 -0.9426 0.0000 -0.0002 19 -0.8830 0.0000 -0.0002 20 -0.8025 0.0000 -0.0002 21 -0.7025 0.0000 -0.0002 22 -0.5843 0.0000 -0.0001 23 -0.4503 0.0000 -0.0001 24 -0.3031 0.0000 0.0000 25 -0.1459 0.0000 0.0000 26 -0.0015 0.0000 0.0000 27 -0.0014 0.0000 0.0000 28 -0.0012 0.0000 0.0000 29 -0.0008 0.0000 0.0000 30 -0.0003 0.0000 0.0000 TABLE 7.3
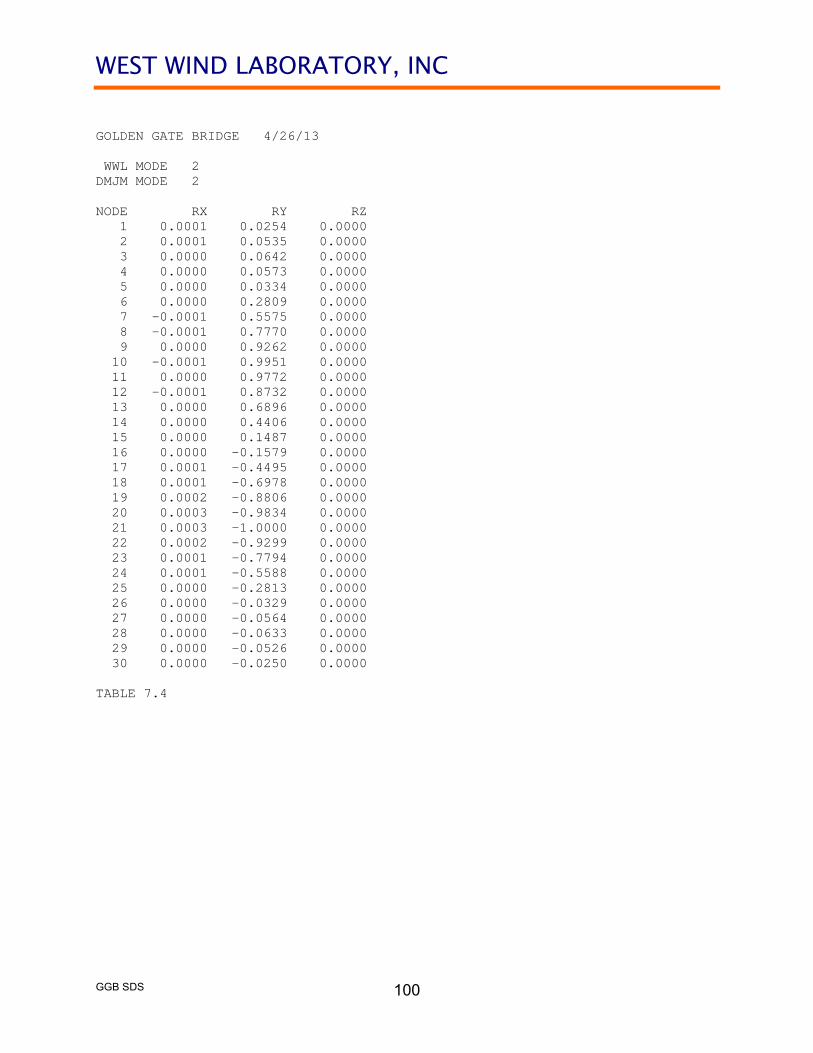
WEST WIND LABORATORY, INC
GGB SDS
100
GOLDEN GATE BRIDGE 4/26/13 WWL MODE 2 DMJM MODE 2 NODE RX RY RZ 1 0.0001 0.0254 0.0000 2 0.0001 0.0535 0.0000 3 0.0000 0.0642 0.0000 4 0.0000 0.0573 0.0000 5 0.0000 0.0334 0.0000 6 0.0000 0.2809 0.0000 7 -0.0001 0.5575 0.0000 8 -0.0001 0.7770 0.0000 9 0.0000 0.9262 0.0000 10 -0.0001 0.9951 0.0000 11 0.0000 0.9772 0.0000 12 -0.0001 0.8732 0.0000 13 0.0000 0.6896 0.0000 14 0.0000 0.4406 0.0000 15 0.0000 0.1487 0.0000 16 0.0000 -0.1579 0.0000 17 0.0001 -0.4495 0.0000 18 0.0001 -0.6978 0.0000 19 0.0002 -0.8806 0.0000 20 0.0003 -0.9834 0.0000 21 0.0003 -1.0000 0.0000 22 0.0002 -0.9299 0.0000 23 0.0001 -0.7794 0.0000 24 0.0001 -0.5588 0.0000 25 0.0000 -0.2813 0.0000 26 0.0000 -0.0329 0.0000 27 0.0000 -0.0564 0.0000 28 0.0000 -0.0633 0.0000 29 0.0000 -0.0526 0.0000 30 0.0000 -0.0250 0.0000 TABLE 7.4
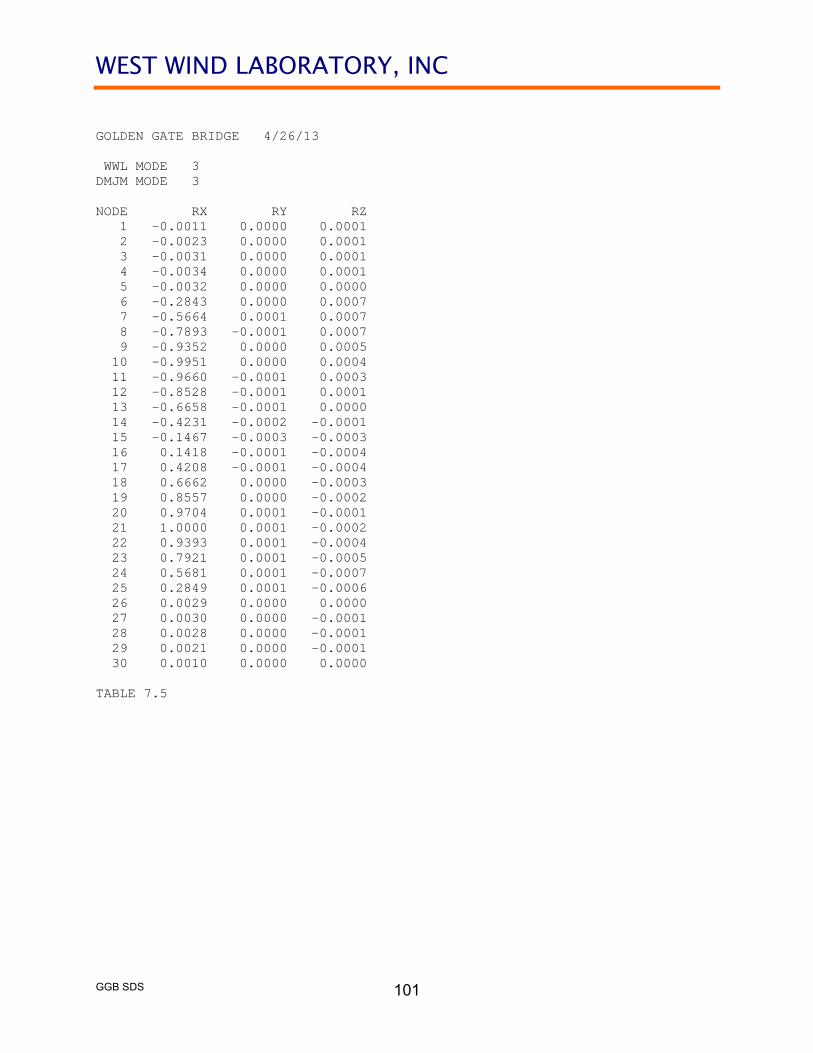
WEST WIND LABORATORY, INC
GGB SDS
101
GOLDEN GATE BRIDGE 4/26/13 WWL MODE 3 DMJM MODE 3 NODE RX RY RZ 1 -0.0011 0.0000 0.0001 2 -0.0023 0.0000 0.0001 3 -0.0031 0.0000 0.0001 4 -0.0034 0.0000 0.0001 5 -0.0032 0.0000 0.0000 6 -0.2843 0.0000 0.0007 7 -0.5664 0.0001 0.0007 8 -0.7893 -0.0001 0.0007 9 -0.9352 0.0000 0.0005 10 -0.9951 0.0000 0.0004 11 -0.9660 -0.0001 0.0003 12 -0.8528 -0.0001 0.0001 13 -0.6658 -0.0001 0.0000 14 -0.4231 -0.0002 -0.0001 15 -0.1467 -0.0003 -0.0003 16 0.1418 -0.0001 -0.0004 17 0.4208 -0.0001 -0.0004 18 0.6662 0.0000 -0.0003 19 0.8557 0.0000 -0.0002 20 0.9704 0.0001 -0.0001 21 1.0000 0.0001 -0.0002 22 0.9393 0.0001 -0.0004 23 0.7921 0.0001 -0.0005 24 0.5681 0.0001 -0.0007 25 0.2849 0.0001 -0.0006 26 0.0029 0.0000 0.0000 27 0.0030 0.0000 -0.0001 28 0.0028 0.0000 -0.0001 29 0.0021 0.0000 -0.0001 30 0.0010 0.0000 0.0000 TABLE 7.5

WEST WIND LABORATORY, INC
GGB SDS
102
GOLDEN GATE BRIDGE 4/26/13 WWL MODE 4 DMJM MODE 4 NODE RX RY RZ 1 0.0003 0.1316 0.0000 2 0.0003 0.2810 0.0000 3 0.0003 0.3397 0.0000 4 0.0002 0.3019 0.0000 5 0.0001 0.1743 0.0000 6 0.0000 0.1171 0.0000 7 0.0000 0.1911 0.0000 8 0.0000 0.1798 0.0000 9 0.0001 0.0826 0.0000 10 0.0001 -0.0863 0.0000 11 0.0001 -0.3035 0.0000 12 0.0001 -0.5373 0.0000 13 0.0000 -0.7526 0.0000 14 -0.0001 -0.9157 0.0000 15 -0.0001 -1.0000 0.0000 16 0.0004 -0.9920 0.0000 17 0.0003 -0.8922 0.0000 18 0.0001 -0.7158 0.0000 19 0.0000 -0.4906 0.0000 20 -0.0001 -0.2516 0.0000 21 -0.0003 -0.0343 0.0000 22 -0.0003 0.1297 0.0000 23 -0.0001 0.2178 0.0000 24 -0.0001 0.2171 0.0000 25 0.0000 0.1297 0.0000 26 0.0001 0.1678 0.0000 27 0.0001 0.2905 0.0000 28 0.0001 0.3268 0.0000 29 0.0002 0.2703 0.0000 30 0.0001 0.1265 0.0000 TABLE 7.6

WEST WIND LABORATORY, INC
GGB SDS
103
GOLDEN GATE BRIDGE 4/26/13 WWL MODE 5 DMJM MODE 5 NODE RX RY RZ 1 0.0003 0.1121 0.0000 2 0.0003 0.2396 0.0000 3 0.0002 0.2899 0.0000 4 0.0002 0.2575 0.0000 5 0.0001 0.1484 0.0000 6 0.0000 -0.2509 0.0000 7 0.0001 -0.5174 0.0000 8 0.0002 -0.7477 0.0000 9 0.0001 -0.9115 0.0000 10 0.0001 -0.9845 0.0000 11 0.0000 -0.9537 0.0000 12 0.0001 -0.8220 0.0000 13 0.0000 -0.6054 0.0000 14 -0.0001 -0.3310 0.0000 15 -0.0002 -0.0287 0.0000 16 -0.0003 0.2734 0.0000 17 -0.0006 0.5499 0.0000 18 -0.0007 0.7769 0.0000 19 -0.0009 0.9327 0.0000 20 -0.0009 1.0000 0.0000 21 -0.0009 0.9733 0.0000 22 -0.0007 0.8585 0.0000 23 -0.0003 0.6747 0.0000 24 -0.0002 0.4493 0.0000 25 -0.0001 0.2117 0.0000 26 -0.0001 -0.1914 0.0000 27 -0.0001 -0.3320 0.0000 28 -0.0002 -0.3736 0.0000 29 -0.0002 -0.3088 0.0000 30 -0.0001 -0.1443 0.0000 TABLE 7.7

WEST WIND LABORATORY, INC
GGB SDS
104
GOLDEN GATE BRIDGE 4/26/13 WWL MODE 6 DMJM MODE 6 NODE RX RY RZ 1 0.0007 0.2673 0.0000 2 0.0008 0.5797 0.0000 3 0.0007 0.7064 0.0000 4 0.0005 0.6265 0.0000 5 0.0002 0.3581 0.0000 6 0.0000 -0.3399 0.0000 7 0.0001 -0.6736 0.0000 8 0.0001 -0.9080 0.0000 9 -0.0001 -0.9962 0.0000 10 -0.0001 -0.9206 0.0000 11 -0.0001 -0.6961 0.0000 12 -0.0001 -0.3728 0.0000 13 0.0000 -0.0233 0.0000 14 0.0001 0.2700 0.0000 15 0.0002 0.4362 0.0000 16 -0.0007 0.4358 0.0000 17 -0.0005 0.2687 0.0000 18 -0.0001 -0.0255 0.0000 19 0.0002 -0.3758 0.0000 20 0.0005 -0.6997 0.0000 21 0.0006 -0.9245 0.0000 22 0.0006 -1.0000 0.0000 23 0.0002 -0.9111 0.0000 24 0.0002 -0.6757 0.0000 25 0.0001 -0.3408 0.0000 26 0.0001 0.3625 0.0000 27 0.0002 0.6340 0.0000 28 0.0003 0.7149 0.0000 29 0.0003 0.5866 0.0000 30 0.0002 0.2705 0.0000 TABLE 7.8

WEST WIND LABORATORY, INC
GGB SDS
105
GOLDEN GATE BRIDGE 4/26/13 WWL MODE 7 DMJM MODE 7 NODE RX RY RZ 1 0.0027 0.0000 -0.0003 2 0.0049 0.0000 -0.0006 3 0.0059 0.0000 -0.0007 4 0.0058 0.0000 -0.0006 5 0.0045 0.0000 -0.0004 6 -0.1171 0.0001 0.0221 7 -0.1827 0.0000 0.0412 8 -0.2264 0.0004 0.0568 9 -0.2438 0.0001 0.0677 10 -0.2375 -0.0002 0.0729 11 -0.2111 -0.0002 0.0718 12 -0.1692 -0.0002 0.0645 13 -0.1160 -0.0001 0.0517 14 -0.0571 0.0005 0.0346 15 0.0030 0.0015 0.0145 16 0.0507 0.0007 -0.0072 17 0.0865 0.0003 -0.0286 18 0.1138 0.0001 -0.0474 19 0.1335 0.0001 -0.0618 20 0.1467 0.0001 -0.0704 21 0.1549 0.0001 -0.0725 22 0.1570 0.0001 -0.0678 23 0.1486 0.0002 -0.0572 24 0.1243 0.0000 -0.0417 25 0.0875 0.0000 -0.0223 26 -0.0008 -0.0001 -0.0003 27 -0.0008 -0.0002 -0.0004 28 -0.0006 -0.0003 -0.0005 29 -0.0002 -0.0002 -0.0004 30 0.0003 -0.0001 -0.0002 TABLE 7.9

WEST WIND LABORATORY, INC
GGB SDS
106
GOLDEN GATE BRIDGE 4/26/13 WWL MODE 8 DMJM MODE 8 NODE RX RY RZ 1 0.0608 0.0000 -0.0103 2 0.0982 0.0001 -0.0194 3 0.1124 0.0004 -0.0228 4 0.1052 0.0005 -0.0205 5 0.0756 0.0006 -0.0128 6 -0.3503 0.0001 -0.0012 7 -0.6804 0.0002 -0.0002 8 -0.8943 0.0001 0.0049 9 -0.9601 -0.0004 0.0140 10 -0.8780 -0.0009 0.0260 11 -0.6736 -0.0012 0.0399 12 -0.3958 -0.0012 0.0540 13 -0.1041 -0.0008 0.0669 14 0.1376 -0.0006 0.0769 15 0.2742 -0.0003 0.0832 16 0.2786 0.0001 0.0850 17 0.1453 0.0005 0.0819 18 -0.1002 0.0007 0.0741 19 -0.4021 0.0008 0.0625 20 -0.6935 0.0006 0.0487 21 -0.9111 0.0003 0.0344 22 -1.0000 -0.0002 0.0214 23 -0.9320 -0.0005 0.0111 24 -0.7094 -0.0005 0.0043 25 -0.3672 -0.0003 0.0012 26 0.0770 0.0002 -0.0131 27 0.1074 -0.0002 -0.0210 28 0.1149 -0.0004 -0.0233 29 0.1005 -0.0005 -0.0198 30 0.0622 -0.0003 -0.0105 TABLE 7.10

WEST WIND LABORATORY, INC
GGB SDS
107
GOLDEN GATE BRIDGE 4/26/13 WWL MODE 9 DMJM MODE 9 NODE RX RY RZ 1 0.0011 0.3666 0.0000 2 0.0014 0.8117 0.0000 3 0.0013 1.0000 0.0000 4 0.0010 0.8854 0.0000 5 0.0005 0.5005 0.0000 6 0.0001 0.0469 0.0000 7 0.0003 0.0835 0.0000 8 0.0003 0.0915 0.0000 9 0.0004 0.0704 0.0000 10 0.0004 0.0289 0.0000 11 0.0003 -0.0190 0.0000 12 0.0001 -0.0572 0.0000 13 0.0000 -0.0724 0.0000 14 -0.0001 -0.0591 0.0000 15 -0.0002 -0.0227 0.0000 16 -0.0002 0.0226 0.0000 17 -0.0002 0.0590 0.0000 18 0.0000 0.0721 0.0000 19 0.0001 0.0568 0.0000 20 0.0003 0.0185 0.0000 21 0.0004 -0.0295 0.0000 22 0.0005 -0.0710 0.0000 23 0.0004 -0.0919 0.0000 24 0.0003 -0.0838 0.0000 25 0.0001 -0.0470 0.0000 26 -0.0002 -0.4968 0.0000 27 -0.0004 -0.8790 0.0000 28 -0.0005 -0.9928 0.0000 29 -0.0005 -0.8061 0.0000 30 -0.0003 -0.3642 0.0000 TABLE 7.11
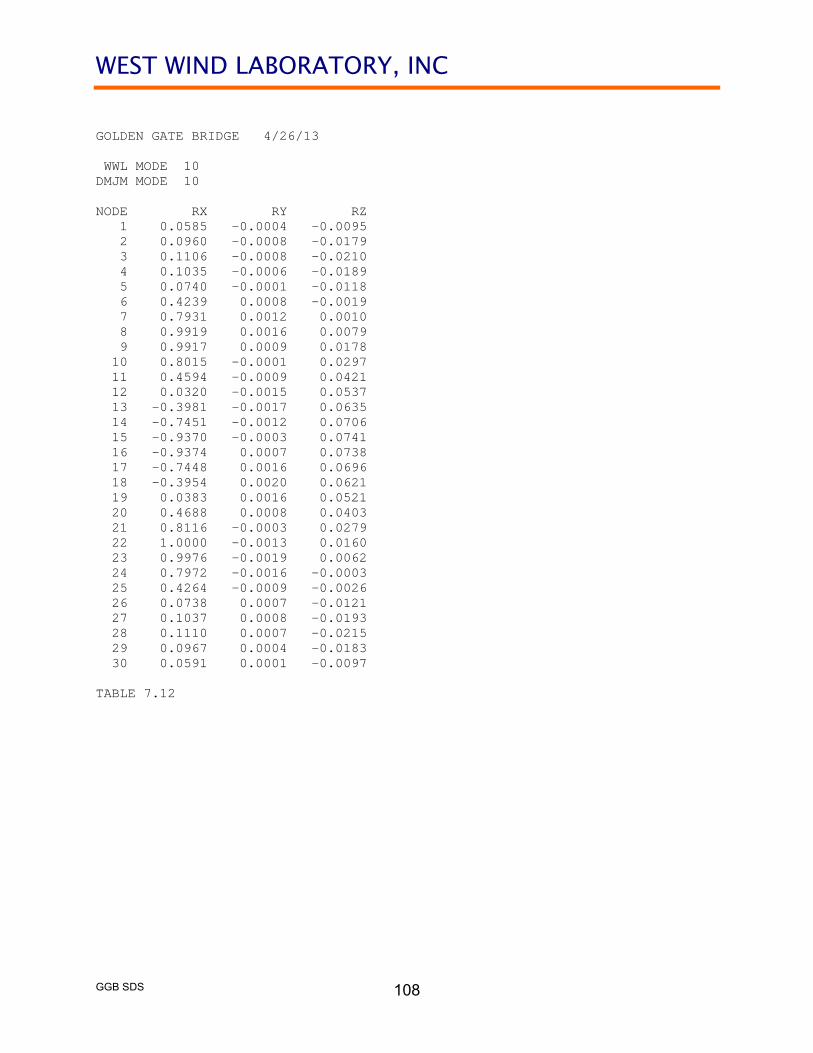
WEST WIND LABORATORY, INC
GGB SDS
108
GOLDEN GATE BRIDGE 4/26/13 WWL MODE 10 DMJM MODE 10 NODE RX RY RZ 1 0.0585 -0.0004 -0.0095 2 0.0960 -0.0008 -0.0179 3 0.1106 -0.0008 -0.0210 4 0.1035 -0.0006 -0.0189 5 0.0740 -0.0001 -0.0118 6 0.4239 0.0008 -0.0019 7 0.7931 0.0012 0.0010 8 0.9919 0.0016 0.0079 9 0.9917 0.0009 0.0178 10 0.8015 -0.0001 0.0297 11 0.4594 -0.0009 0.0421 12 0.0320 -0.0015 0.0537 13 -0.3981 -0.0017 0.0635 14 -0.7451 -0.0012 0.0706 15 -0.9370 -0.0003 0.0741 16 -0.9374 0.0007 0.0738 17 -0.7448 0.0016 0.0696 18 -0.3954 0.0020 0.0621 19 0.0383 0.0016 0.0521 20 0.4688 0.0008 0.0403 21 0.8116 -0.0003 0.0279 22 1.0000 -0.0013 0.0160 23 0.9976 -0.0019 0.0062 24 0.7972 -0.0016 -0.0003 25 0.4264 -0.0009 -0.0026 26 0.0738 0.0007 -0.0121 27 0.1037 0.0008 -0.0193 28 0.1110 0.0007 -0.0215 29 0.0967 0.0004 -0.0183 30 0.0591 0.0001 -0.0097 TABLE 7.12
WEST WIND LABORATORY, INC
GGB SDS
109
APPENDIX 8 REFERENCES 1. Simiu, E., and Scanlan, R. H. Wind Effects on Structures, Third Edition, John
Wiley & Sons, New York, 1996. 2. Yinghong Cao, Haifan Xiang, and Ying Zhou, "Simulation of Stochastic Wind
Velocity Field on Long-Span Bridges", Journal of Engineering Mechanics, Vol. 126, No. 1, ASCE, January, 2000
3. Xinzhong Chen, Masaru Matsumoto, and Ahsan Kareem, "Time Domain Flutter
and Buffeting Response Analysis of Bridges", Journal of Engineering Mechanics, Vol. 126, No. 1, ASCE, January, 2000
4. British Highways Agency, Design Manual for Roads and Bridges, BD 37/01,
Loads for Highway Bridges and BD 49/01 Rules for Aeroedynamic Effects on Bridges.
.5. "Section Model Wind Tunnel Studies, Golden Gate Bridge Seismic and Wind
Retrofit, San Franciso, California", West Wind Laboratory, Inc., June 1995. .6. "Wind Study, Golden Gate Bridge, Horizontal Net Suicide Deterrent System, San
Francisco, California", West Wind Laboratory, Inc., Januaray 2009, Revised January 2011.
7. Wind Study, Golden Gate Bridge, Simplified Aerodynamic Enhancements", West
Wind Laboratory, Inc., August 23, 2012, Revised August 27, 2012, Revised October 10, 2012.
8. "A Study of Wind Data and Topographic Effects for Golden Gate Bridge", Report
93-144F-5-1, RWDI, Guelph, Ontario, November 19, 1993. 9. U. S. Department of Agriculture (NRCS) Natural Resources Conservation
Service, www.wcc.nrcs.usda.gov/climate/windrose.html 10. Liu, Henry, Wind Engineering, A Handbook for Structural Engineers, Prentice
Hall, Englewood Cliffs, New Jersey, 1991.