west virginia cancer registry - wv dhhrdhhr.wv.gov/oeps/cancer/documents/wvcr 2012 annual...
TRANSCRIPT

West Virginia Cancer Registry 2012 Annual Report
Cancer Incidence in West Virginia, 1993-2009
2010 Provisional Data
Bureau for Public Health 350 Capitol Street, Room 125
Charleston, WV 25301
Earl Ray Tomblin, Governor Rocco S. Fucillo, Cabinet Secretary

ii
Earl Ray Tomblin
Governor
Rocco S. Fucillo Cabinet Secretary, Department of Health and Human Resources
Marian L. Swinker, MD, MPH
Commissioner and State Health Officer, Bureau for Public Health
Loretta Haddy, PhD, MA, MS Director, Office of Epidemiology and Prevention Services
Alana Hudson, PhD, MPH
Epidemiologist, West Virginia Cancer Registry

iii
Report Prepared by:
Alana Hudson, PhD, MPH
Epidemiologist, West Virginia Cancer Registry
West Virginia Cancer Registry Staff
Vacant Director Alana Hudson, PhD, MPH Epidemiologist Darlene Maxwell, CTR Data Quality/Training Leslie Boner, CTR Data Quality/Training Stephen Williams Data Quality Judy Arbogast Systems Management Pamela Boyd, CTR, RHIT Amanda Smith Vacant Jena Webb
Surveillance Surveillance Surveillance
Support Services
www.cancerregistry.wv.gov The West Virginia Cancer Registry (WVCR) acknowledges the Centers for Disease Control and Prevention for its support of the WVCR staff and the development and distribution of this report under cooperative agreement number U58/CCU000768 awarded to the West Virginia Department of Health and Human Resources. Its contents are solely the responsibility of the authors and do not necessarily represent the official views of the CDC.

iv
TABLE OF CONTENTS
Executive Summary ...................................................................................................... 1 West Virginia Cancer Registry Overview .............................................................. 2 Technical Notes .............................................................................................................. 4 Tables ................................................................................................................................ 6 Five Leading Cancer Incidence Rates by Race among Males ........................................................................................................7
Five Leading Cancer Incidence Rates by Race among Females ...................................................................................................8
Age-Adjusted Cancer Incidence Rates & Counts by Select Cancer Sites ..................................................................................9
Age-Adjusted Cancer Incidence Rates & Counts by Select Cancer Sites & Gender for Whites ................................... 10
Age-Adjusted Cancer Incidence Rates & Counts by Select Cancer Sites & Gender for Blacks..................................... 11
Annual Age-Adjusted Incidence Rates for Select Cancer Sites by Year of Diagnosis ...................................................... 12
Annual Age-Adjusted Incidence Rates for Select Cancer Sites by Year of Diagnosis, Males ...................................... 13
Annual Age-Adjusted Incidence Rates for Select Cancer Sites by Year of Diagnosis, Females ................................... 14
Age-Specific Incidence Rates for Select Cancer Sites, Males & Females ............................................................................... 15
Age-Specific Incidence Rates for Select Cancer Sites, Males ...................................................................................................... 16
Age-Specific Incidence Rates for Select Cancer Sites, Females ................................................................................................. 17
Age-Adjusted Cancer Incidence Rates by Select Cancer Sites, West Virginia & United States ................................... 18
Age-Adjusted Cancer Incidence Rates by Select Cancer Sites & Gender, West Virginia & United States .............. 19
Age-Adjusted Average Annual All Site Cancer Incidence Rates & Counts by County ..................................................... 20
Age-Adjusted Average Annual Oral Cavity & Pharynx Cancer Incidence Rates & Counts by County ...................... 21
Age-Adjusted Average Annual Esophageal Cancer Incidence Rates & Counts by County ............................................ 22
Age-Adjusted Average Annual Stomach Cancer Incidence Rates & Counts by County .................................................. 23
Age-Adjusted Average Annual Small Intestine Cancer Incidence Rates & Counts by County..................................... 24
Age-Adjusted Average Annual Colorectal Cancer Incidence Rates & Counts by County............................................... 25
Age-Adjusted Average Annual Liver & Intrahepatic Bile Duct Cancer Incidence Rates & Counts by County ...... 26
Age-Adjusted Average Annual Gallbladder Cancer Incidence Rates & Counts by County............................................ 27
Age-Adjusted Average Annual Pancreatic Cancer Incidence Rates & Counts by County .............................................. 28
Age-Adjusted Average Annual Larynx Cancer Incidence Rates & Counts by County ..................................................... 29

v
Age-Adjusted Average Annual Lung & Bronchus Cancer Incidence Rates & Counts by County ................................ 30
Age-Adjusted Average Annual Bone & Joint Cancer Incidence Rates & Counts by County .......................................... 31
Age-Adjusted Average Annual Soft Tissue Cancer Incidence Rates & Counts by County ............................................. 32
Age-Adjusted Average Annual Melanoma Skin Cancer Incidence Rates & Counts by County .................................... 33
Age-Adjusted Average Annual Urinary Bladder Cancer Incidence Rates & Counts by County .................................. 34
Age-Adjusted Average Annual Kidney & Renal Pelvis Cancer Incidence Rates & Counts by County ...................... 35
Age-Adjusted Average Annual Brain & Other Nervous System Cancer Incidence Rates & Counts by County .... 36
Age-Adjusted Average Annual Thyroid Cancer Incidence Rates & Counts by County ................................................... 37
Age-Adjusted Average Annual Hodgkin’s Lymphoma Incidence Rates & Counts by County ...................................... 38
Age-Adjusted Average Annual Non-Hodgkin’s Lymphoma Incidence Rates & Counts by County ........................... 39
Age-Adjusted Average Annual Myeloma Cancer Incidence Rates & Counts by County ................................................. 40
Age-Adjusted Average Annual Leukemia Incidence Rates & Counts by County ............................................................... 41
Age-Adjusted Average Annual Female Breast Cancer Incidence Rates & Counts by County ...................................... 42
Age-Adjusted Average Annual Cervical Cancer Incidence Rates & Counts by County ................................................... 43
Age-Adjusted Average Annual Corpus & Uterus Cancer Incidence Rates & Counts by County ................................. 44
Age-Adjusted Average Annual Ovarian Cancer Incidence Rates & Counts by County ................................................... 45
Age-Adjusted Average Annual Prostate Cancer Incidence Rates & Counts by County .................................................. 46
Age-Adjusted Average Annual Testicular Cancer Incidence Rates & Counts by County ............................................... 47
Provisional Age-Adjusted Cancer Incidence Rates & Counts by Select Cancer Sites, 2010 ......................................... 48
Age-Adjusted Cancer Mortality Rates for Select Cancer Sites, West Virginia & United States .................................. 49
Age-Adjusted Cancer Mortality Rates for Select Cancer Sites by Gender, West Virginia & United States ............ 50

1
EXECUTIVE SUMMARY A total of 55,235 new cases (approximately 11,047 cases annually) of invasive (and in situ urinary bladder) cancer were diagnosed among West Virginia residents between 2005 and 2009. During this time period, 29,002 cases (52.5 %) were diagnosed among males and 26,233 cases (47.5 %) were diagnosed among females. The incidence rates for all cancer sites combined for men and women in West Virginia significantly exceed national rates. For both the United States and the State as a whole, the incidence rates for all types of cancer combined are higher for men than for women. The overall average annual age-adjusted incidence rate for all cancers combined is 577.5 per 100,000 for West Virginia men and 442.6 per 100,000 for West Virginia women. The most common cancers diagnosed among West Virginia residents include lung and bronchus (18.6%), prostate (13.0%), female breast (11.9%), and colon and rectum (10.7%). These four cancer sites account for more than 54% of West Virginia’s cancer burden. Other cancers commonly reported in West Virginia include urinary bladder (4.8%), non-Hodgkin’s lymphoma (4.0%), melanoma of the skin (3.7%), kidney and renal pelvis (3.4%) and corpus and uterus (3.2%). Prostate cancer is the most common cancer in men, accounting for nearly a quarter (24.8%) of cancer cases in men. Breast cancer is the most common cancer in West Virginia women, accounting for a quarter (25.1%) of all cancers diagnosed in women. Lung cancer and colorectal cancer were the second and third most commonly diagnosed cancers in both sexes. Cancer can occur at any age. For most cancer sites the risk of developing cancer increases with age, from birth through ages 75 to 84. Cancer risk then decreases slightly among those aged 85 and older. However, this is not true for all cancers. Some cancers, such as thyroid cancer and testicular cancer, peak at much younger ages. Statewide geographic differences in incidence rates were noted for specific cancer types. There are a variety of reasons why cancer incidence rates differ by county. These differences could reflect random variation or differences in exposures to risk factors (e.g. smoking, diet, physical inactivity) and cancer screening practices.
Cancer is the second leading cause of death in West Virginia and the United States. During the 2004 to 2008 time period, West Virginia’s all-site cancer mortality rate was significantly higher than the all-site cancer mortality rate of the United States. For West Virginia and the nation as a whole, the cancer mortality rates for all types of cancer combined are greater for men as compared to women. The age-adjusted mortality rate for all cancer combined was 257.1 per 100,000 for West Virginia men and 174.0 per 100,000 for West Virginia women. Lung cancer remains the leading cause of death due to cancers among men and women in West Virginia and the United States.

2
WEST VIRGINIA CANCER REGISTRY OVERVIEW
History The West Virginia Cancer Registry (WVCR) was established by the West Virginia Department of Health and Human Resources in 1991 as a breast and cervical cancer registry. In 1993, the WVCR became an all-site registry, collecting data on all cancers except basal and squamous cell carcinoma of the skin and in situ cervical cancer. In 2002, the WVCR began collecting data on non-malignant brain and other central nervous system tumors (CNS). WVCR is funded by both State and Federal funding, with the latter administered through a cooperative agreement with the Centers for Disease Control and Prevention’s National Program of Cancer Registries. Chapter 16-5A-2a of the West Virginia Code and Title 64, West Virginia Administrative Rules, Division of Health, Cancer Registry, Series 68, provide the legal basis for the WVCR.
Mission The West Virginia Cancer Registry will collect and analyze cancer data to determine incidence rates by anatomical site, sex, race, geographic location, and other factors and monitor trends in cancer incidence among West Virginia residents.
Geographic Coverage The West Virginia Cancer Registry collects information on all cancers diagnosed and/or treated in the state of West Virginia and, through lawful reciprocal data sharing agreements, all cancers diagnosed and/or treated among West Virginia residents by health care providers outside the state of West Virginia. A resident is defined as a person reporting a West Virginia address at the time of diagnosis.
Temporal Coverage The West Virginia Cancer Registry’s reference date (the date after which reportable cancer cases must be included in the registry) is January 1, 1993 for all cancer sites. The reference date for benign brain and CNS neoplasms is January 1, 2002.
Confidentiality All West Virginia Cancer Registry employees sign a confidentiality pledge that meets the requirements of applicable state laws as well as the requirements of the Health Insurance Portability and Accountability Act (HIPAA). West Virginia Code protects the confidentiality of both patient and health care provider. Legal analysis of the applicable state laws concerning the establishment and operation of the West Virginia Cancer Registry found that the West Virginia laws were, with one exception (specification of de-identification methodology), more stringent than HIPAA.

3
Identifiable Data Release West Virginia Code permits release of identified data ONLY under these circumstances: 1. Data provided by a facility or reporter may be provided back to that facility or reporter
as a failsafe in the event of catastrophic data loss. However, ONLY data provided by the facility or reporter may be provided. Additional information provided by other sources may NOT be disclosed.
2. When a lawful reciprocal data sharing agreement exists, WVCR may provide identified data about another state or territory’s residents or tribal entity’s members diagnosed and/or treated in West Virginia back to the state/territory/tribal entity, which, in turn, is to provide WVCR with identified data on West Virginia residents.
3. Upon written consent signed by the patient or the patient’s legal representative and specifying the cancer registry, identified data may be provided to researchers whose study protocols have met the prevailing institutional review board standards and whose protocols have been reviewed and approved by the West Virginia Cancer Registry Advisory Committee.
Funding The West Virginia Cancer Registry is funded by appropriations made by the State of West Virginia and by the Centers for Disease Control and Prevention’s (CDC) National Program of Cancer Registries (NPCR).
Certification The West Virginia Cancer Registry is subject to certification by the North American Association of Central Cancer Registries (NAACCR). Certification is based on timeliness, completeness and data quality. WVCR was certified at the “silver” level for diagnosis years 1997 and 1998 and at the “gold” (highest) level for diagnosis years 1999 through 2009 (the most recent year for which certification results were available at the time of this writing). In addition, West Virginia Cancer Registry data meet the 24-month standards of the National Program of Cancer Registries (NPCR).
Data Usage The West Virginia Cancer Registry is committed to the use of cancer incidence data as a critical component of cancer control and publishes this annual report on cancer incidence in West Virginia to be used by state, community-based, regional and national cancer control groups. WVCR also provides de-identified summary data (rates and distributions of stage at diagnosis) for use by the American Cancer Society and provides de-identified data to the Centers for Disease Control and Prevention for the publication United States Cancer Statistics and to the North American Association of Central Cancer Registries for the Cancer in North America (CINA) publications. Researchers may obtain access to de-identified case level data under strict controls including approval by the relevant institutional review board and the West Virginia Cancer Registry Advisory Committee.

4
TECHNICAL NOTES
Statistical Terms Cancer Incidence Rate: A cancer incidence rate is defined as the number of new cancer cases that occur for a specified population at risk for developing the disease, during a specified time period. Cancer rates are most commonly expressed as the number of cancers per 100,000 population. Cancer Mortality Rate: A cancer mortality rate is the number of deaths from cancer that occur during a specified period of time for a particular population, and is commonly expressed as the number of deaths due to cancer per 100,000 population. Age-adjusted Rate: A rate that is statistically modified to account for the different age distributions between populations. The rates in this report are age-adjusted using the 2000 U.S. standard population. Age-specific Rate: The age-specific cancer incidence rate is calculated by dividing the total number of cancer events observed in a given age-group (for example, 65-69 years) during a specified time period by the total population at risk in that age group, and is usually expressed as an annual rate per 100,000 population. Confidence Interval: A confidence interval (CI) is a range of values for a variable of interest (e.g., a rate) that has a specified probability of containing the true population value. The 95% (CI) is one of the most common levels of confidence reported.
National Comparisons For national comparisons, the WVCR uses United States Cancer Statistics (USCS) age-adjusted (2000 Standard) average annual incidence and mortality rates per 100,000.
Case Counts State and county data are presented as total counts for the 5-year period (2005-2009) unless otherwise noted. For an average annual count, divide the 5-year count by 5.
Provisional 2010 Counts National Program of Cancer Registries (NPCR) Program Standards require that, when data are estimated to be 90% complete, provisional case counts or case distributions be provided. It is critical to bear in mind that 2010 data are provisional. It is expected that they will change. Moreover, it is likely that the amount of change will vary by primary site, sex, and county of residence. These factors all predict the likelihood of being seen at a non-West Virginia facility (e.g., persons with certain types of cancer and persons who live in border counties are more likely to be diagnosed and treated out-of-state) and data provided by other states under data

5
exchange agreements typically are not provided to WVCR until at least 18 months after diagnosis. Thus, while these data provide guidance as to what to expect once 2010 data are complete, they are not to be used as final verified case counts. WVCR estimates that, as of this writing, the data are 91% to 96% complete.
Data Analysis SEER*Stat software (version 7.0.5) was used to calculate all cancer incidence rates and counts presented in this report. All rates were expressed per 100,000 population. Age-adjusted rates were standardized to the 2000 U.S. standard population (19 age groups).
Data Suppression Rates generated from small numbers should be interpreted with caution. For this report, rates were suppressed where counts were less than four.

6
TABLES The tables on the following pages summarize cancer incidence and mortality data for West Virginia for all cancers combined and select cancer types.

Rank All Races White Black
1 Prostate138.7 (135.5-142.0)
Prostate136.6 (133.4-140.0)
Prostate224.1 (197.6-253.1)
2 Lung & Bronchus112.9 (109.9-115.9)
Lung & Bronchus113.1 (110.1-116.2)
Lung & Bronchus121.9 (102.8-143.4)
3 Colon & Rectum61.9 (59.7-64.2)
Colon & Rectum61.8 (59.6-64.1)
Colon & Rectum70.9 (56.4-87.7)
4 Urinary Bladder39.3 (37.6-41.2)
Urinary Bladder40.0 (38.2-41.9)
Kidney & Renal Pelvis24.2 (16.5-34.2)
5 Non-Hodgkin Lymphoma24.1 (22.7-25.6)
Non-Hodgkin Lymphoma24.3 (22.9-25.8)
Urinary Bladder20.9 (13.2-31.0)
Five Leading Average Annual Cancer Incidence Rates (95% Confidence Intervals) by Race among Males, West Virginia, 2005-2009
Rates are per 100,000 and age-adjusted to the 2000 US Standard Population (19 age groups - Census P25-1130); Confidence intervals (CI) are 95% for rates.Source: West Virginia Cancer Registry
7

Rank All Races White Black
1 Breast112.3 (109.6-115.1)
Breast112.6 (109.8-115.5)
Breast100.9 (85.7-118.0)
2 Lung & Bronchus73.8 (71.6-76.0)
Lung & Bronchus74.6 (72.4-76.8)
Lung & Bronchus52.8 (42.2-65.3)
3 Colon & Rectum45.5 (43.8-47.2)
Colon & Rectum45.5 (43.8-47.3)
Colon & Rectum48.6 (38.6-60.4)
4 Corpus & Uterus, NOS30.0 (28.5-31.4)
Corpus & Uterus, NOS29.7 (28.3-31.2)
Corpus & Uterus, NOS20.6 (14.1-28.9)
5 Non-Hodgkin Lymphoma16.9 (15.9-18.0)
Melanoma of the Skin17.1 (16.0-18.3)
Non-Hodgkin Lymphoma12.3 (7.4-19.1)
Five Leading Average Annual Cancer Incidence Rates (95% Confidence Intervals) by Race among Females, West Virginia, 2005-2009
Rates are per 100,000 and age-adjusted to the 2000 US Standard Population (19 age groups - Census P25-1130); Confidence intervals (CI) are 95% for rates.Source: West Virginia Cancer Registry
8

Can
cer
Site
Rat
eL
ower
C
IU
pper
C
I5-
Yea
rC
ount
Rat
eL
ower
C
IU
pper
C
I5-
Yea
rC
ount
Rat
eL
ower
C
IU
pper
C
I5-
Yea
rC
ount
All
Site
s49
7.8
493.
650
2.0
5523
557
7.5
570.
858
4.3
2900
244
2.6
437.
144
8.1
2623
3O
ral C
avity
& P
hary
nx11
.310
.712
.012
6317
.316
.218
.590
36.
15.
56.
836
0Es
opha
gus
5.3
4.9
5.8
615
9.6
8.7
10.5
504
1.8
1.5
2.2
111
Stom
ach
5.6
5.1
6.0
630
7.8
7.1
8.7
392
3.8
3.4
4.4
238
Smal
l Int
estin
e2.
01.
72.
322
42.
42.
02.
912
31.
61.
32.
010
1C
olon
& R
ectu
m52
.751
.354
.159
1161
.959
.764
.230
7145
.543
.847
.228
40Li
ver &
Intra
hepa
tic B
ile D
uct
4.9
4.5
5.4
553
7.1
6.4
7.9
364
3.0
2.6
3.5
189
Gal
lbla
dder
1.2
1.0
1.4
129
0.7
0.5
1.0
321.
51.
21.
997
Panc
reas
10.5
9.9
11.1
1197
12.6
11.6
13.6
634
8.7
8.0
9.5
563
Lary
nx5.
45.
05.
861
49.
18.
310
.048
22.
21.
92.
713
2Lu
ng &
Bro
nchu
s90
.588
.892
.310
266
112.
910
9.9
115.
957
0273
.871
.676
.045
64B
ones
& Jo
ints
1.0
0.8
1.2
941.
20.
91.
656
0.8
0.5
1.1
38So
ft Ti
ssue
incl
udin
g H
eart
3.4
3.0
3.8
351
4.0
3.4
4.6
191
3.0
2.5
3.5
160
Mel
anom
a of
the
Skin
19.3
18.5
20.2
2018
23.5
22.1
24.9
1151
16.5
15.4
17.7
867
Bre
ast
60.8
59.3
62.3
6655
1.6
1.3
2.0
7611
2.3
109.
611
5.1
6579
Cer
vix
Ute
ri---
------
------
------
---9.
99.
010
.847
8C
orpu
s & U
teru
s, N
OS
------
------
------
------
30.0
28.5
31.4
1753
Ova
ry---
------
------
------
---12
.811
.913
.875
3Pr
osta
te---
------
---13
8.7
135.
514
2.0
7202
------
------
Test
is---
------
---5.
64.
96.
323
8---
------
---U
rinar
y B
ladd
er23
.422
.624
.426
5039
.337
.641
.219
2011
.510
.712
.473
0K
idne
y &
Ren
al P
elvi
s17
.216
.518
.018
8822
.621
.223
.911
2512
.912
.013
.976
3B
rain
& O
ther
Ner
vous
Sys
tem
7.3
6.8
7.9
757
8.6
7.8
9.5
415
6.3
5.6
7.0
342
Thyr
oid
11.5
10.9
12.3
1138
6.0
5.3
6.7
290
16.9
15.7
18.1
848
Hod
gkin
Lym
phom
a2.
82.
53.
226
53.
12.
63.
713
92.
62.
13.
112
6N
on-H
odgk
in L
ymph
oma
20.1
19.2
20.9
2224
24.1
22.7
25.6
1200
16.9
15.9
18.0
1024
Mye
lom
a5.
55.
15.
962
06.
76.
07.
433
14.
64.
15.
228
9Le
ukem
ia13
.813
.114
.614
8217
.316
.118
.682
411
.310
.412
.265
8
Sour
ce: W
est V
irgin
ia C
ance
r Reg
istry
Mal
e &
Fem
ale
Mal
eFe
mal
e
Age
-Adj
uste
d A
vera
ge A
nnua
l Can
cer
Inci
denc
e R
ates
(95%
Con
fiden
ce In
terv
als)
and
5-Y
ear
Cou
nts
by S
elec
t Can
cer
Site
s, W
est V
irgi
nia,
200
5-20
09
Rat
es a
re p
er 1
00,0
00 a
nd a
ge-a
djus
ted
to th
e 20
00 U
S St
anda
rd P
opul
atio
n (1
9 ag
e gr
oups
- C
ensu
s P25
-113
0);
Con
fiden
ce in
terv
als (
CI)
are
95%
fo
r rat
es.
9

Can
cer
Site
Rat
eL
ower
C
IU
pper
C
I5-
Yea
rC
ount
Rat
eL
ower
C
IU
pper
C
I5-
Yea
rC
ount
Rat
eL
ower
C
IU
pper
C
I5-
Yea
rC
ount
All
Site
s49
9.4
495.
150
3.7
5352
157
7.8
570.
958
4.7
2806
244
5.1
439.
545
0.8
2545
9O
ral C
avity
& P
hary
nx11
.410
.812
.112
3217
.416
.318
.787
96.
25.
66.
935
3Es
opha
gus
5.4
5.0
5.9
601
9.7
8.9
10.6
495
1.7
1.4
2.1
106
Stom
ach
5.4
5.0
5.9
596
7.7
6.9
8.5
372
3.7
3.3
4.3
224
Smal
l Int
estin
e1.
91.
62.
220
72.
31.
92.
811
31.
61.
31.
994
Col
on &
Rec
tum
52.7
51.3
54.1
5714
61.8
59.6
64.1
2970
45.5
43.8
47.3
2744
Live
r & In
trahe
patic
Bile
Duc
t4.
84.
45.
252
27.
06.
27.
834
33.
02.
53.
417
9G
allb
ladd
er1.
21.
01.
412
50.
70.
40.
929
1.5
1.2
1.9
96Pa
ncre
as10
.610
.011
.211
6612
.811
.813
.862
28.
78.
09.
554
4La
rynx
5.4
5.0
5.9
593
9.1
8.3
10.0
464
2.3
1.9
2.7
129
Lung
& B
ronc
hus
91.1
89.3
92.9
9994
113.
111
0.1
116.
255
3374
.672
.476
.844
61B
ones
& Jo
ints
1.0
0.8
1.2
911.
20.
91.
655
0.7
0.5
1.1
36So
ft Ti
ssue
incl
udin
g H
eart
3.4
3.0
3.7
336
3.9
3.4
4.5
182
2.9
2.5
3.5
154
Mel
anom
a of
the
Skin
20.0
19.1
20.9
2012
24.3
22.9
25.8
1149
17.1
16.0
18.3
863
Bre
ast
60.9
59.4
62.5
6447
1.6
1.2
2.0
7411
2.6
109.
811
5.5
6373
Cer
vix
Ute
ri---
------
------
------
---9.
78.
810
.645
1C
orpu
s & U
teru
s, N
OS
------
------
------
------
29.7
28.3
31.2
1676
Ova
ry---
------
------
------
---13
.112
.114
.173
7Pr
osta
te---
------
---13
6.6
133.
414
0.0
6871
------
------
Test
is---
------
---5.
85.
16.
623
7---
------
---U
rinar
y B
ladd
er23
.923
.024
.826
1040
.038
.241
.918
9211
.710
.912
.671
8K
idne
y &
Ren
al P
elvi
s17
.316
.518
.118
3222
.621
.224
.010
8713
.012
.114
.074
5B
rain
& O
ther
Ner
vous
Sys
tem
7.5
7.0
8.1
744
8.8
7.9
9.7
408
6.4
5.7
7.2
336
Thyr
oid
11.6
10.9
12.3
1097
5.9
5.2
6.7
277
17.1
15.9
18.3
820
Hod
gkin
Lym
phom
a2.
82.
53.
225
53.
12.
63.
713
52.
62.
13.
112
0N
on-H
odgk
in L
ymph
oma
20.2
19.4
21.1
2165
24.3
22.9
25.8
1169
17.0
16.0
18.1
996
Mye
lom
a5.
34.
95.
858
56.
65.
97.
431
64.
43.
95.
026
9Le
ukem
ia14
.013
.214
.714
3917
.416
.218
.779
611
.510
.612
.464
3
Sour
ce: W
est V
irgin
ia C
ance
r Reg
istry
Rat
es a
re p
er 1
00,0
00 a
nd a
ge-a
djus
ted
to th
e 20
00 U
S St
anda
rd P
opul
atio
n (1
9 ag
e gr
oups
- C
ensu
s P25
-113
0);
Con
fiden
ce in
terv
als (
CI)
are
95%
for r
ates
.
Mal
e &
Fem
ale
Mal
eFe
mal
e
Age
-Adj
uste
d A
vera
ge A
nnua
l Can
cer
Inci
denc
e R
ates
(95%
Con
fiden
ce In
terv
als)
and
5-Y
ear
Cou
nts
by S
elec
t Can
cer
Site
s and
Gen
der
for
Whi
tes,
Wes
t Vir
gini
a, 2
005-
2009
10

Can
cer
Site
Rat
eL
ower
C
IU
pper
C
I5-
Yea
r C
ount
Rat
eL
ower
C
IU
pper
C
I5-
Yea
r C
ount
Rat
eL
ower
C
IU
pper
C
I5-
Yea
r C
ount
All
Site
s46
5.2
440.
749
0.7
1383
617.
657
3.6
663.
979
135
9.9
331.
139
0.6
592
Ora
l Cav
ity &
Pha
rynx
9.2
6.0
13.5
2614
.38.
422
.519
5.0
2.0
10.1
7Es
opha
gus
3.8
1.9
6.7
115.
51.
911
.76
2.9
0.9
6.9
5St
omac
h10
.16.
714
.529
14.9
8.7
23.7
186.
43.
111
.511
Smal
l Int
estin
e5.
43.
08.
716
8.1
3.8
14.9
103.
11.
17.
06
Col
on &
Rec
tum
57.7
49.3
67.0
173
70.9
56.4
87.7
8948
.638
.660
.484
Live
r & In
trahe
patic
Bile
Duc
t7.
74.
911
.524
11.2
6.4
18.3
174.
21.
78.
77
Gal
lbla
dder
1.4
0.4
3.5
4^
^^
^^
^^
^Pa
ncre
as8.
85.
812
.728
6.9
3.2
13.1
1010
.46.
116
.618
Lary
nx5.
63.
38.
818
9.7
5.3
16.3
15^
^^
^Lu
ng &
Bro
nchu
s82
.272
.093
.324
112
1.9
102.
814
3.4
154
52.8
42.2
65.3
87B
ones
& Jo
ints
^^
^^
^^
^^
^^
^^
Soft
Tiss
ue in
clud
ing
Hea
rt4.
22.
37.
214
4.6
1.9
9.4
83.
91.
48.
46
Mel
anom
a of
the
Skin
^^
^^
0.0
0.0
2.6
0^
^^
^B
reas
t55
.547
.264
.816
2^
^^
^10
0.9
85.7
118.
016
0C
ervi
x U
teri
------
------
------
------
8.5
4.6
14.4
14C
orpu
s & U
teru
s, N
OS
------
------
------
------
20.6
14.1
28.9
33O
vary
------
------
------
------
5.5
2.5
10.5
9Pr
osta
te---
------
---22
4.1
197.
625
3.1
277
------
------
Test
is---
------
---0.
00.
02.
60
------
------
Urin
ary
Bla
dder
12.8
9.0
17.7
3720
.913
.231
.025
6.8
3.5
12.1
12K
idne
y &
Ren
al P
elvi
s16
.111
.921
.250
24.2
16.5
34.2
3410
.25.
816
.616
Bra
in &
Oth
er N
ervo
us S
yste
m3.
01.
45.
510
3.5
1.1
8.2
52.
60.
86.
25
Thyr
oid
7.3
4.6
11.1
225.
22.
210
.58
8.9
4.8
15.0
14H
odgk
in L
ymph
oma
2.4
1.1
4.7
9^
^^
^3.
61.
37.
86
Non
-Hod
gkin
Lym
phom
a14
.210
.219
.341
15.6
9.5
24.0
2112
.37.
419
.120
Mye
lom
a11
.17.
615
.732
11.2
5.8
19.3
1311
.56.
918
.019
Leuk
emia
11.2
7.8
15.7
3514
.28.
622
.021
8.4
4.6
14.2
14
^ St
atis
tic n
ot d
ispl
ayed
due
to fe
wer
than
4 c
ases
.So
urce
: Wes
t Virg
inia
Can
cer R
egis
try
Age
-Adj
uste
d A
vera
ge A
nnua
l Can
cer
Inci
denc
e R
ates
(95%
Con
fiden
ce In
terv
als)
and
5-Y
ear
Cou
nts
by S
elec
t Can
cer
Site
s and
Gen
der
for
Bla
cks,
Wes
t Vir
gini
a, 2
005-
2009
Rat
es a
re p
er 1
00,0
00 a
nd a
ge-a
djus
ted
to th
e 20
00 U
S St
anda
rd P
opul
atio
n (1
9 ag
e gr
oups
- C
ensu
s P25
-113
0);
Con
fiden
ce in
terv
als (
CI)
are
95%
for
rate
s.
Mal
e &
Fem
ale
Mal
eFe
mal
e
11

1993
1994
1995
1996
1997
1998
1999
2000
2001
2002
2003
2004
2005
2006
2007
2008
2009
All
Site
s45
4.6
458.
746
2.8
472.
849
9.1
497.
250
1.3
501.
351
4.0
500.
848
6.7
494.
550
4.7
507.
451
3.2
491.
147
3.3
Ora
l Cav
ity &
Pha
rynx
11.0
10.7
11.2
10.4
9.7
10.8
10.6
11.0
9.9
10.5
11.1
10.4
11.5
10.7
12.2
12.8
9.6
Esop
hagu
s4.
34.
74.
14.
25.
25.
14.
85.
15.
35.
16.
65.
05.
05.
45.
45.
15.
9St
omac
h6.
56.
17.
47.
56.
75.
65.
15.
86.
45.
96.
56.
95.
85.
25.
55.
75.
6Sm
all I
ntes
tine
1.2
1.5
1.0
1.0
1.5
1.0
1.4
1.5
1.4
1.5
1.8
1.7
1.6
2.1
1.9
2.2
2.2
Col
on &
Rec
tum
56.5
56.0
55.7
56.8
62.6
60.0
61.6
61.7
63.4
63.2
63.0
60.2
55.1
55.1
53.6
52.0
47.9
Live
r & In
trahe
patic
Bile
Duc
t2.
63.
53.
63.
94.
64.
54.
03.
93.
94.
24.
14.
73.
64.
55.
95.
45.
2G
allb
ladd
er1.
20.
91.
21.
11.
10.
81.
10.
90.
70.
61.
11.
31.
41.
51.
20.
80.
9Pa
ncre
as8.
59.
510
.38.
611
.09.
48.
69.
910
.39.
39.
411
.29.
711
.010
.610
.510
.5La
rynx
5.2
6.4
5.8
5.7
5.9
5.9
6.2
5.9
5.8
5.7
5.5
4.8
5.6
5.0
5.5
5.5
5.4
Lung
& B
ronc
hus
83.0
86.1
86.5
89.9
95.4
94.0
94.9
92.6
93.8
91.6
86.2
89.9
96.1
93.1
89.5
91.1
83.2
Bon
es &
Join
ts0.
81.
21.
01.
11.
10.
90.
70.
91.
20.
81.
21.
11.
00.
80.
91.
11.
1So
ft Ti
ssue
incl
udin
g H
eart
2.4
2.5
2.0
2.1
2.3
2.7
3.0
2.8
3.4
2.9
3.4
3.1
3.2
3.1
3.6
3.4
3.6
Mel
anom
a of
the
Skin
10.5
10.3
10.4
15.1
14.6
15.9
15.0
15.6
17.0
16.8
15.7
19.5
18.2
18.0
19.1
19.6
21.9
Bre
ast (
Mal
e &
Fem
ale)
64.5
62.1
64.3
66.8
64.8
68.5
69.7
65.6
66.4
61.5
63.5
64.1
63.5
61.5
61.7
56.5
60.8
Urin
ary
Bla
dder
22.2
21.7
20.7
21.6
24.7
25.8
24.9
23.4
24.5
24.9
23.1
22.6
24.6
23.6
23.6
23.7
21.8
Kid
ney
& R
enal
Pel
vis
11.3
10.4
12.5
12.3
12.4
11.4
12.4
13.1
14.3
14.6
13.0
15.3
17.7
16.8
17.0
16.9
17.8
Bra
in &
Oth
er N
ervo
us S
yste
m6.
37.
47.
56.
86.
96.
26.
96.
97.
47.
28.
08.
16.
97.
68.
47.
26.
6Th
yroi
d2.
73.
64.
53.
86.
36.
37.
67.
48.
38.
56.
78.
210
.511
.311
.512
.711
.7H
odgk
in L
ymph
oma
3.4
2.5
2.4
3.2
3.4
2.6
3.3
2.6
2.9
2.6
2.3
2.0
3.2
2.8
2.4
3.8
1.9
Non
-Hod
gkin
Lym
phom
a15
.815
.917
.918
.717
.920
.119
.917
.718
.719
.019
.720
.618
.621
.222
.219
.818
.6M
yelo
ma
5.3
5.7
6.2
5.5
5.0
5.8
4.5
4.7
5.7
5.9
6.0
5.3
5.6
5.9
5.5
5.0
5.3
Leuk
emia
11.3
12.3
12.3
12.6
12.8
13.0
14.8
13.8
13.4
11.5
12.9
14.0
14.3
13.9
14.7
13.4
13.0
Sour
ce: W
est V
irgin
ia C
ance
r Reg
istry
Ann
ual A
ge-A
djus
ted
Inci
denc
e R
ates
for
Sele
ct C
ance
r Si
tes b
y Y
ear
of D
iagn
osis
, Mal
es a
nd F
emal
es, W
est V
irgi
nia,
199
3-20
09
Can
cer
Site
Yea
r of
Dia
gnos
is
Rat
es a
re p
er 1
00,0
00 a
nd a
ge-a
djus
ted
to th
e 20
00 U
S St
anda
rd P
opul
atio
n (1
9 ag
e gr
oups
- C
ensu
s P25
-113
0).
12

1993
1994
1995
1996
1997
1998
1999
2000
2001
2002
2003
2004
2005
2006
2007
2008
2009
All
Site
s55
6.9
553.
054
6.1
557.
159
3.0
595.
559
1.0
596.
461
5.6
593.
456
9.9
576.
958
6.1
598.
460
2.7
567.
353
5.3
Ora
l Cav
ity &
Pha
rynx
17.8
15.1
17.6
16.1
15.9
16.4
15.9
15.8
17.7
15.6
16.7
15.4
18.3
16.4
19.2
18.5
14.2
Esop
hagu
s8.
38.
37.
86.
89.
49.
48.
210
.08.
69.
511
.48.
68.
310
.09.
39.
910
.4St
omac
h10
.610
.011
.211
.19.
68.
57.
78.
99.
29.
57.
99.
78.
66.
18.
57.
78.
3Sm
all I
ntes
tine
1.4
1.4
1.0
1.1
2.0
0.9
2.1
1.5
1.0
1.5
1.8
2.0
1.7
2.4
2.3
2.9
2.8
Col
on &
Rec
tum
66.0
64.0
64.1
65.6
71.1
74.6
73.9
73.5
73.4
72.2
75.2
71.8
68.3
63.4
63.5
57.7
57.0
Live
r & In
trahe
patic
Bile
Duc
t3.
14.
14.
55.
57.
46.
45.
66.
15.
76.
46.
26.
25.
76.
18.
48.
27.
3G
allb
ladd
er0.
91.
20.
60.
7^
0.5
1.0
0.7
0.0
^0.
70.
60.
81.
00.
6^
0.8
Panc
reas
8.9
10.6
11.3
11.1
13.4
12.8
10.7
12.1
12.7
11.0
10.7
11.9
11.6
13.9
13.9
11.8
11.7
Lary
nx9.
911
.89.
410
.110
.911
.010
.99.
910
.39.
78.
38.
010
.08.
49.
19.
38.
9Lu
ng &
Bro
nchu
s11
7.1
122.
712
5.3
122.
913
3.4
128.
712
8.0
125.
012
2.1
119.
711
3.1
121.
612
0.5
120.
011
0.0
109.
610
5.3
Bon
es &
Join
ts1.
12.
00.
81.
31.
71.
11.
11.
20.
80.
71.
61.
10.
81.
01.
31.
31.
7So
ft Ti
ssue
incl
udin
g H
eart
2.4
2.0
2.0
2.5
3.0
3.6
4.2
3.5
3.5
3.7
3.4
3.8
3.9
2.9
3.5
4.7
4.6
Mel
anom
a of
the
Skin
12.6
12.2
12.5
16.8
18.6
17.9
19.5
19.4
21.6
20.3
19.7
24.6
22.6
22.5
21.7
24.6
26.1
Bre
ast (
Mal
e)0.
90.
60.
81.
40.
70.
50.
51.
11.
21.
41.
22.
01.
62.
01.
11.
32.
0Pr
osta
te15
3.5
147.
713
1.1
136.
213
9.6
148.
814
8.6
163.
716
2.4
152.
413
0.3
127.
213
5.9
151.
415
8.2
132.
711
6.5
Test
is4.
95.
84.
96.
04.
64.
45.
15.
64.
14.
55.
75.
05.
85.
06.
15.
35.
6U
rinar
y B
ladd
er38
.837
.236
.438
.942
.944
.740
.939
.742
.940
.940
.339
.140
.240
.240
.540
.435
.4K
idne
y &
Ren
al P
elvi
s15
.113
.917
.216
.414
.816
.916
.917
.319
.120
.017
.720
.522
.423
.322
.221
.922
.9B
rain
& O
ther
Ner
vous
Sys
tem
6.7
9.2
7.6
6.9
7.8
7.0
8.0
7.8
8.3
9.0
9.3
8.9
7.9
9.8
8.5
8.1
8.4
Thyr
oid
2.2
1.9
2.3
2.1
2.4
3.9
3.5
3.8
4.5
3.9
2.9
4.3
6.6
6.1
5.8
5.6
5.8
Hod
gkin
Lym
phom
a4.
63.
22.
23.
83.
52.
83.
43.
03.
13.
52.
51.
63.
13.
33.
23.
62.
2N
on-H
odgk
in L
ymph
oma
18.8
17.9
21.2
21.0
19.0
23.6
23.1
19.9
23.0
20.2
23.9
24.1
23.3
24.4
25.8
24.0
23.1
Mye
lom
a6.
87.
58.
57.
66.
67.
65.
44.
87.
76.
96.
67.
46.
55.
96.
97.
46.
6Le
ukem
ia15
.315
.815
.717
.018
.615
.118
.717
.118
.215
.117
.919
.716
.817
.519
.018
.215
.1
Sour
ce: W
est V
irgin
ia C
ance
r Reg
istry
Can
cer
Site
Ann
ual A
ge-A
djus
ted
Inci
denc
e R
ates
for
Sele
ct C
ance
r Si
tes b
y Y
ear
of D
iagn
osis
, Mal
es, W
est V
irgi
nia,
199
3-20
09
^ St
atis
tic n
ot d
ispl
ayed
due
to fe
wer
than
4 c
ases
.R
ates
are
per
100
,000
and
age
-adj
uste
d to
the
2000
US
Stan
dard
Pop
ulat
ion
(19
age
grou
ps -
Cen
sus P
25-1
130)
.
Yea
r of
Dia
gnos
is
13

1993
1994
1995
1996
1997
1998
1999
2000
2001
2002
2003
2004
2005
2006
2007
2008
2009
All
Site
s39
6.2
405.
141
5.0
425.
044
2.4
436.
744
7.4
441.
744
6.4
438.
443
2.3
441.
445
0.4
443.
244
9.8
438.
243
1.4
Ora
l Cav
ity &
Pha
rynx
5.9
7.2
5.7
5.5
4.2
6.4
5.9
7.2
3.7
6.0
6.3
5.9
5.5
5.9
5.8
7.7
5.6
Esop
hagu
s1.
41.
71.
42.
12.
01.
82.
21.
22.
71.
72.
52.
22.
01.
62.
11.
22.
1St
omac
h3.
73.
64.
95.
04.
93.
63.
53.
14.
43.
65.
74.
93.
84.
43.
44.
13.
6Sm
all I
ntes
tine
1.0
1.5
1.0
1.0
1.0
1.1
1.0
1.3
1.6
1.6
1.8
1.3
1.5
1.7
1.6
1.7
1.6
Col
on &
Rec
tum
50.6
50.3
49.9
50.9
56.3
49.4
53.8
53.3
55.5
56.6
53.8
51.5
45.0
48.4
45.8
47.4
40.9
Live
r & In
trahe
patic
Bile
Duc
t2.
23.
02.
82.
82.
62.
92.
82.
22.
42.
82.
53.
32.
03.
13.
72.
83.
4G
allb
ladd
er1.
60.
81.
61.
41.
71.
01.
31.
11.
30.
71.
41.
71.
91.
91.
81.
10.
9Pa
ncre
as8.
38.
89.
46.
89.
47.
27.
18.
28.
37.
98.
310
.68.
28.
97.
99.
39.
4La
rynx
1.6
2.2
3.2
2.4
1.9
1.8
2.4
2.7
2.2
2.3
3.1
2.2
1.9
2.2
2.4
2.4
2.4
Lung
& B
ronc
hus
59.1
60.8
59.3
66.9
68.5
69.9
70.8
69.6
73.1
70.5
66.8
67.6
77.8
72.7
74.6
77.5
66.1
Bon
es &
Join
ts0.
60.
41.
30.
90.
60.
70.
40.
71.
61.
00.
81.
11.
10.
70.
70.
90.
4So
ft Ti
ssue
incl
udin
g H
eart
2.4
3.0
1.9
2.0
1.8
1.9
2.1
2.2
3.5
2.0
3.2
2.7
2.6
3.2
3.6
2.5
2.9
Mel
anom
a of
the
Skin
9.2
8.9
9.1
13.9
12.1
14.6
11.6
12.9
13.8
14.7
12.6
16.3
15.1
14.5
17.7
16.1
19.3
Bre
ast (
Fem
ale)
116.
311
1.9
115.
512
0.4
117.
612
4.4
127.
112
0.4
121.
211
2.6
116.
911
7.7
116.
811
3.3
114.
510
4.3
112.
7C
ervi
x U
teri
14.1
14.7
15.6
12.7
15.0
11.7
13.8
11.1
12.3
9.3
9.6
9.7
10.7
9.0
9.5
10.1
10.1
Cor
pus &
Ute
rus,
NO
S23
.326
.424
.725
.831
.027
.227
.129
.626
.828
.327
.629
.032
.228
.428
.627
.133
.3O
vary
13.1
16.7
19.6
15.4
17.4
17.6
15.6
17.7
15.4
15.9
15.8
13.2
13.3
13.9
12.2
13.5
11.2
Urin
ary
Bla
dder
10.9
11.1
10.1
9.6
12.0
13.2
13.6
12.3
11.1
13.1
10.3
10.0
13.0
11.1
10.7
11.2
11.5
Kid
ney
& R
enal
Pel
vis
8.7
8.0
8.7
9.2
10.5
6.7
9.0
9.8
10.5
10.1
8.8
11.1
13.7
11.8
12.6
12.7
13.6
Bra
in &
Oth
er N
ervo
us S
yste
m5.
85.
87.
26.
66.
25.
56.
06.
06.
65.
56.
67.
45.
95.
88.
36.
45.
0Th
yroi
d3.
25.
16.
65.
59.
98.
411
.310
.911
.813
.010
.212
.214
.216
.316
.919
.617
.4H
odgk
in L
ymph
oma
2.2
1.8
2.5
2.6
3.2
2.4
3.2
2.1
2.7
1.8
2.0
2.5
3.3
2.3
1.6
4.1
1.6
Non
-Hod
gkin
Lym
phom
a13
.714
.115
.516
.917
.217
.617
.716
.115
.317
.816
.817
.414
.918
.719
.616
.514
.8M
yelo
ma
4.3
4.6
4.6
4.2
3.9
4.2
3.8
4.6
4.4
5.0
5.5
4.0
5.1
5.9
4.3
3.2
4.4
Leuk
emia
7.9
9.9
10.0
9.3
8.6
11.5
12.0
11.3
9.7
8.6
9.1
9.1
12.3
11.0
11.5
9.8
11.6
Sour
ce: W
est V
irgin
ia C
ance
r Reg
istry
Ann
ual A
ge-A
djus
ted
Inci
denc
e R
ates
for
Sele
ct C
ance
r Si
tes b
y Y
ear
of D
iagn
osis
, Fem
ales
, Wes
t Vir
gini
a, 1
993-
2009
Can
cer
Site
Rat
es a
re p
er 1
00,0
00 a
nd a
ge-a
djus
ted
to th
e 20
00 U
S St
anda
rd P
opul
atio
n (1
9 ag
e gr
oups
- C
ensu
s P25
-113
0).
^ St
atis
tic n
ot d
ispl
ayed
due
to fe
wer
than
4 c
ases
.
Yea
r of
Dia
gnos
is
14

<11-
45-
910
-14
15-1
920
-24
25-2
930
-34
35-3
940
-44
45-4
950
-54
55-5
960
-64
65-6
970
-74
75-7
980
-84
85+
All
Site
s31
.523
.411
.510
.422
.036
.165
.710
2.0
152.
325
6.2
401.
363
2.6
933.
013
69.5
1902
.722
29.9
2471
.024
36.2
2099
.0O
ral C
avity
& P
hary
nx0.
00.
00.
20.
20.
50.
51.
61.
83.
68.
315
.224
.828
.040
.735
.637
.233
.836
.132
.2Es
opha
gus
0.0
0.0
0.0
0.0
0.0
0.0
0.0
0.0
0.5
2.3
5.0
8.4
14.4
19.9
23.7
18.8
21.7
26.2
19.4
Stom
ach
0.0
0.0
0.0
0.0
0.0
0.3
0.7
0.9
1.2
1.8
3.1
6.8
9.9
17.3
21.5
25.1
23.5
37.5
35.0
Smal
l Int
estin
e0.
00.
00.
00.
00.
20.
00.
20.
21.
40.
50.
73.
24.
64.
77.
77.
08.
911
.713
.9C
olon
& R
ectu
m0.
00.
00.
00.
00.
51.
03.
76.
611
.118
.836
.165
.585
.212
3.8
191.
424
6.6
291.
736
3.6
326.
0Li
ver &
Intra
hepa
tic B
ile D
uct
1.9
0.5
0.2
0.0
0.2
0.0
0.0
0.7
0.7
1.3
4.7
7.8
8.9
13.6
17.0
20.3
27.4
30.5
21.7
Gal
lbla
dder
0.0
0.0
0.0
0.0
0.0
0.0
0.0
0.4
0.0
0.5
0.4
0.7
1.2
1.9
4.0
5.1
9.6
8.9
10.6
Panc
reas
0.0
0.0
0.0
0.0
0.0
0.0
0.2
0.7
0.7
2.3
6.9
9.5
22.3
28.3
38.0
44.2
65.8
73.1
71.6
Lary
nx0.
00.
00.
00.
00.
00.
00.
20.
00.
72.
37.
49.
213
.523
.022
.022
.422
.415
.98.
3Lu
ng &
Bro
nchu
s0.
00.
00.
00.
00.
20.
70.
73.
16.
520
.652
.893
.115
0.2
262.
042
2.5
530.
856
7.7
509.
733
1.5
Bon
es &
Join
ts0.
00.
00.
60.
61.
70.
80.
90.
20.
71.
10.
60.
41.
11.
02.
23.
92.
50.
93.
3So
ft Ti
ssue
incl
udin
g H
eart
3.8
1.4
0.6
0.9
1.5
2.6
0.9
1.5
1.7
2.4
2.9
3.9
5.2
4.9
9.9
11.8
12.4
11.2
14.4
Mel
anom
a of
the
Skin
0.0
0.2
0.0
1.3
2.4
5.6
9.1
13.7
19.3
17.5
23.4
28.3
34.9
40.0
52.6
56.9
63.7
63.2
61.6
Bre
ast (
Mal
e &
Fem
ale)
0.0
0.0
0.0
0.0
0.2
0.3
3.3
12.9
28.9
57.6
81.7
96.3
132.
717
1.7
200.
519
9.7
253.
323
0.0
218.
2U
rinar
y B
ladd
er0.
00.
20.
20.
00.
30.
31.
01.
31.
45.
89.
919
.133
.058
.787
.213
5.9
150.
816
3.0
164.
9K
idne
y &
Ren
al P
elvi
s3.
82.
40.
40.
20.
30.
51.
43.
57.
413
.618
.325
.637
.244
.165
.268
.476
.570
.348
.3B
rain
& O
ther
Ner
vous
Sys
tem
6.7
4.3
3.1
3.0
1.4
2.0
4.9
4.7
3.8
5.5
6.9
7.4
13.6
18.9
18.3
19.1
25.3
20.1
19.4
Thyr
oid
0.0
0.0
0.0
0.2
3.4
3.8
8.6
12.6
14.9
19.9
18.6
22.5
17.3
24.0
23.0
19.1
19.6
11.2
7.2
Hod
gkin
Lym
phom
a0.
00.
00.
00.
93.
95.
04.
42.
92.
73.
91.
92.
32.
92.
94.
23.
96.
04.
73.
3N
on-H
odgk
in L
ymph
oma
0.0
0.7
1.0
0.7
1.0
1.2
2.3
4.4
6.3
11.4
15.0
24.4
34.3
53.6
82.7
84.4
100.
010
0.7
97.2
Mye
lom
a1.
00.
00.
00.
00.
00.
00.
00.
00.
21.
13.
27.
59.
513
.419
.528
.441
.332
.826
.1Le
ukem
ia1.
99.
74.
62.
02.
42.
23.
73.
35.
37.
58.
113
.421
.927
.337
.354
.261
.571
.297
.2R
ates
are
per
100
,000
.So
urce
: Wes
t Virg
inia
Can
cer R
egis
try
Can
cer
Site
Age
Gro
upA
ge-S
peci
fic In
cide
nce
Rat
es fo
r Se
lect
Can
cer
Site
s, M
ales
and
Fem
ales
, Wes
t Vir
gini
a, 2
005-
2009
15

<11-
45-
910
-14
15-1
920
-24
25-2
930
-34
35-3
940
-44
45-4
950
-54
55-5
960
-64
65-6
970
-74
75-7
980
-84
85+
All
Site
s44
.625
.812
.09.
018
.332
.064
.880
.810
1.7
168.
133
7.8
638.
810
10.3
1602
.723
42.6
2857
.131
72.4
3289
.530
73.5
Ora
l Cav
ity &
Pha
rynx
0.0
0.0
0.0
0.0
0.3
0.0
1.7
1.8
4.8
10.1
24.0
39.7
42.4
62.6
59.2
59.7
49.7
56.9
53.9
Esop
hagu
s0.
00.
00.
00.
00.
00.
00.
00.
00.
73.
39.
015
.025
.136
.342
.134
.236
.250
.840
.9St
omac
h0.
00.
00.
00.
00.
00.
31.
00.
41.
02.
34.
58.
513
.923
.927
.534
.930
.367
.857
.6Sm
all I
ntes
tine
0.0
0.0
0.0
0.0
0.3
0.0
0.0
0.4
1.0
0.7
0.9
3.2
5.3
6.8
9.9
10.7
11.0
14.5
14.9
Col
on &
Rec
tum
0.0
0.0
0.0
0.0
0.3
0.6
3.5
7.6
10.7
20.3
42.1
72.0
104.
015
0.7
222.
828
3.2
344.
544
7.8
399.
3Li
ver &
Intra
hepa
tic B
ile D
uct
1.9
0.9
0.0
0.0
0.0
0.0
0.0
1.5
1.0
1.6
6.9
14.4
14.9
17.9
22.8
30.9
34.5
50.8
20.4
Gal
lbla
dder
0.0
0.0
0.0
0.0
0.0
0.0
0.0
0.4
0.0
0.3
0.3
0.6
0.3
1.6
1.0
3.4
6.7
3.6
7.4
Panc
reas
0.0
0.0
0.0
0.0
0.0
0.0
0.0
0.4
1.4
2.9
8.4
13.2
26.0
35.1
45.7
51.7
80.0
88.3
78.0
Lary
nx0.
00.
00.
00.
00.
00.
00.
30.
01.
02.
99.
915
.621
.038
.335
.838
.944
.632
.722
.3Lu
ng &
Bro
nchu
s0.
00.
00.
00.
00.
30.
60.
73.
65.
818
.349
.310
7.5
177.
431
5.0
513.
664
9.5
737.
972
3.7
538.
6B
ones
& Jo
ints
0.0
0.0
0.4
0.7
2.3
1.6
1.0
0.0
0.3
1.3
0.9
0.6
1.9
1.6
2.1
4.7
3.4
1.2
3.7
Soft
Tiss
ue in
clud
ing
Hea
rt5.
60.
90.
40.
40.
72.
61.
01.
82.
12.
33.
66.
26.
26.
811
.914
.111
.016
.922
.3M
elan
oma
of th
e Sk
in0.
00.
50.
01.
11.
31.
68.
011
.217
.511
.425
.232
.043
.357
.465
.484
.597
.710
2.9
126.
3B
reas
t (M
ale)
0.0
0.0
0.0
0.0
0.0
0.0
0.0
0.4
0.3
0.3
0.3
2.4
1.9
3.6
5.2
6.7
12.6
2.4
22.3
Pros
tate
0.0
0.5
0.0
0.0
0.0
0.0
0.0
0.0
0.7
7.8
36.4
128.
727
9.2
477.
274
3.1
843.
478
9.3
666.
963
3.3
Test
is0.
00.
00.
00.
42.
310
.318
.414
.910
.77.
26.
34.
42.
21.
20.
51.
30.
80.
01.
9U
rinar
y B
ladd
er0.
00.
00.
40.
00.
70.
31.
01.
81.
47.
213
.528
.850
.892
.514
2.8
222.
126
5.3
296.
532
8.7
Kid
ney
& R
enal
Pel
vis
5.6
1.4
0.4
0.4
0.3
0.3
1.7
4.7
10.7
15.7
24.9
35.0
44.6
54.6
76.3
88.6
107.
099
.287
.3B
rain
& O
ther
Ner
vous
Sys
tem
11.2
5.5
4.1
2.5
1.6
1.9
5.2
6.9
3.8
3.9
8.7
7.3
15.2
23.9
23.4
20.1
32.9
20.6
31.6
Thyr
oid
0.0
0.0
0.0
0.0
1.6
0.0
4.2
6.2
4.5
11.1
7.2
12.0
10.5
11.2
19.7
16.1
13.5
4.8
0.0
Hod
gkin
Lym
phom
a0.
00.
00.
01.
12.
64.
85.
92.
93.
45.
62.
12.
43.
42.
44.
24.
06.
74.
85.
6N
on-H
odgk
in L
ymph
oma
0.0
1.4
1.5
0.7
1.3
1.3
3.5
4.7
6.9
11.8
18.0
31.1
40.5
63.4
98.1
92.6
111.
213
5.5
143.
0M
yelo
ma
0.0
0.0
0.0
0.0
0.0
0.0
0.0
0.0
0.3
2.0
4.2
8.5
11.8
14.4
24.9
33.6
47.2
33.9
46.4
Leuk
emia
3.7
10.1
3.8
1.8
2.3
2.9
4.5
4.0
5.5
6.9
8.7
19.4
23.8
33.5
42.6
73.8
88.4
99.2
135.
6R
ates
are
per
100
,000
.St
atis
tic c
ould
not
be
calc
ulat
ed.
Can
cer
Site
Age
-Spe
cific
Inci
denc
e R
ates
for
Sele
ct C
ance
r Si
tes,
Mal
es, W
est V
irgi
nia,
200
5-20
09A
ge G
roup
16

<11-
45-
910
-14
15-1
920
-24
25-2
930
-34
35-3
940
-44
45-4
950
-54
55-5
960
-64
65-6
970
-74
75-7
980
-84
85+
All
Site
s17
.620
.810
.911
.825
.840
.466
.712
3.4
202.
534
3.0
462.
462
6.7
857.
411
46.5
1503
.917
14.7
1958
.418
97.3
1683
.3O
ral C
avity
& P
hary
nx0.
00.
00.
40.
40.
71.
01.
41.
82.
46.
46.
710
.513
.919
.814
.118
.722
.222
.923
.0Es
opha
gus
0.0
0.0
0.0
0.0
0.0
0.0
0.0
0.0
0.3
1.3
1.2
2.0
3.9
4.2
7.1
6.1
11.1
10.7
10.3
Stom
ach
0.0
0.0
0.0
0.0
0.0
0.3
0.4
1.5
1.4
1.3
1.7
5.1
6.0
11.1
16.0
17.1
18.5
18.3
25.3
Smal
l Int
estin
e0.
00.
00.
00.
00.
00.
00.
40.
01.
70.
30.
63.
13.
92.
75.
63.
97.
49.
913
.5C
olon
& R
ectu
m0.
00.
00.
00.
00.
71.
43.
95.
511
.617
.430
.459
.366
.898
.016
2.9
216.
625
3.0
310.
429
4.7
Live
r & In
trahe
patic
Bile
Duc
t2.
00.
00.
40.
00.
30.
00.
00.
00.
31.
02.
61.
43.
09.
511
.811
.622
.217
.622
.2G
allb
ladd
er0.
00.
00.
00.
00.
00.
00.
00.
40.
00.
60.
60.
92.
12.
36.
66.
611
.712
.211
.9Pa
ncre
as0.
00.
00.
00.
00.
00.
00.
41.
10.
01.
65.
56.
018
.721
.731
.138
.055
.463
.468
.9La
rynx
0.0
0.0
0.0
0.0
0.0
0.0
0.0
0.0
0.3
1.6
4.9
3.1
6.0
8.4
9.4
8.8
6.2
5.4
2.4
Lung
& B
ronc
hus
0.0
0.0
0.0
0.0
0.0
0.7
0.7
2.6
7.2
22.8
56.1
79.2
123.
621
1.3
339.
943
3.2
443.
337
4.6
243.
2B
ones
& Jo
ints
0.0
0.0
0.8
0.4
1.0
0.0
0.7
0.4
1.0
1.0
0.3
0.3
0.3
0.4
2.4
3.3
1.8
0.8
3.2
Soft
Tiss
ue in
clud
ing
Hea
rt2.
01.
90.
81.
52.
42.
70.
71.
11.
42.
62.
31.
74.
23.
18.
09.
913
.57.
611
.1M
elan
oma
of th
e Sk
in0.
00.
00.
01.
53.
59.
810
.216
.121
.123
.521
.724
.726
.623
.341
.034
.238
.838
.234
.1B
reas
t (Fe
mal
e)0.
00.
00.
00.
00.
30.
76.
725
.657
.311
3.9
160.
018
7.0
260.
533
2.6
377.
535
8.3
429.
137
3.8
301.
8C
ervi
x U
teri
0.0
0.0
0.0
0.0
0.0
2.0
6.7
13.9
18.4
22.5
19.1
18.2
13.3
14.9
10.4
8.3
12.9
7.6
7.9
Cor
pus &
Ute
rus,
NO
S0.
00.
00.
00.
00.
00.
33.
99.
917
.426
.135
.363
.692
.210
1.1
97.4
90.9
78.8
71.9
57.0
Ova
ry0.
00.
00.
00.
01.
01.
42.
54.
85.
510
.616
.225
.029
.927
.840
.040
.252
.946
.644
.4U
rinar
y B
ladd
er0.
00.
50.
00.
00.
00.
31.
10.
71.
44.
56.
49.
615
.726
.336
.765
.067
.178
.795
.1K
idne
y &
Ren
al P
elvi
s2.
03.
40.
40.
00.
30.
71.
12.
24.
111
.611
.916
.529
.933
.955
.151
.854
.252
.031
.7B
rain
& O
ther
Ner
vous
Sys
tem
2.0
2.9
1.9
3.4
1.0
2.0
4.6
2.6
3.8
7.1
5.2
7.4
12.1
14.1
13.7
18.2
19.7
19.9
14.3
Thyr
oid
0.0
0.0
0.0
0.4
5.2
7.8
13.1
19.0
25.2
28.6
29.5
32.6
23.9
36.2
25.9
21.5
24.0
15.3
10.3
Hod
gkin
Lym
phom
a0.
00.
00.
00.
85.
25.
12.
82.
92.
02.
31.
72.
32.
43.
44.
23.
95.
54.
62.
4N
on-H
odgk
in L
ymph
oma
0.0
0.0
0.4
0.8
0.7
1.0
1.1
4.0
5.8
10.9
12.2
17.9
28.1
44.2
68.7
77.7
91.7
78.7
77.6
Mye
lom
a2.
00.
00.
00.
00.
00.
00.
00.
00.
00.
32.
36.
57.
312
.614
.624
.336
.932
.117
.4Le
ukem
ia0.
09.
25.
52.
32.
41.
42.
82.
65.
18.
07.
57.
719
.921
.432
.538
.041
.953
.580
.8R
ates
are
per
100
,000
.St
atis
tic c
ould
not
be
calc
ulat
ed.
Can
cer
Site
Age
-Spe
cific
Inci
denc
e R
ates
for
Sele
ct C
ance
r Si
tes,
Fem
ales
, Wes
t Vir
gini
a, 2
005-
2009
Age
Gro
up
17

Can
cer
Site
Rat
eL
ower
CI
Upp
er C
IR
ate
Low
er C
IU
pper
CI
All
Site
s49
7.8
493.
650
2.0
472.
247
1.9
472.
6O
ral C
avity
& P
hary
nx11
.310
.712
.010
.910
.911
.0Es
opha
gus
5.3
4.9
5.8
5.0
4.9
5.0
Stom
ach
5.6
5.1
6.0
6.7
6.6
6.7
Smal
l Int
estin
e2.
01.
72.
32.
12.
12.
1C
olon
& R
ectu
m52
.751
.354
.146
.246
.146
.3Li
ver &
Intra
hepa
tic B
ile D
uct
4.9
4.5
5.4
6.6
6.5
6.6
Gal
lbla
dder
1.2
1.0
1.4
1.1
1.1
1.1
Panc
reas
10.5
9.9
11.1
11.9
11.8
11.9
Lary
nx5.
45.
05.
83.
93.
93.
9Lu
ng &
Bro
nchu
s90
.588
.892
.367
.767
.667
.8B
ones
& Jo
ints
1.0
0.8
1.2
0.9
1.9
1.0
Soft
Tiss
ue in
clud
ing
Hea
rt3.
43.
03.
83.
23.
23.
2M
elan
oma
of th
e Sk
in19
.318
.520
.219
.119
.019
.2B
reas
t (M
ale
& F
emal
e)60
.859
.362
.366
.065
.966
.2U
rinar
y B
ladd
er23
.422
.624
.421
.121
.021
.2K
idne
y &
Ren
al P
elvi
s17
.216
.518
.015
.715
.615
.7B
rain
& O
ther
Ner
vous
Sys
tem
7.3
6.8
7.9
6.7
6.7
6.7
Thyr
oid
11.5
10.9
12.3
11.7
11.6
11.7
Hod
gkin
Lym
phom
a2.
82.
53.
22.
82.
82.
8N
on-H
odgk
in L
ymph
oma
20.1
19.2
20.9
19.3
19.2
19.3
Mye
lom
a5.
55.
15.
95.
85.
75.
8Le
ukem
ia13
.813
.114
.612
.412
.412
.5
Sour
ce: W
est V
irgin
ia C
ance
r Reg
istry
and
The
Uni
ted
Stat
es C
ance
r Sta
tistic
s (U
SCS)
Age
-Adj
uste
d A
vera
ge A
nnua
l Can
cer
Inci
denc
e R
ates
(95%
Con
fiden
ce In
terv
als)
by
Sel
ect C
ance
r Si
tes,
Wes
t Vir
gini
a an
d U
nite
d St
ates
, 200
5-20
09M
ale
& F
emal
eW
est V
irgi
nia
Uni
ted
Stat
es
Rat
es a
re p
er 1
00,0
00 a
nd a
ge-a
djus
ted
to th
e 20
00 U
S St
anda
rd P
opul
atio
n (1
9 ag
e gr
oups
- C
ensu
s P25
-113
0);
Con
fiden
ce in
terv
als (
CI)
are
95%
for r
ates
.
18

Can
cer
Site
Rat
eL
ower
CI
Upp
er C
IR
ate
Low
er C
IU
pper
CI
Rat
eL
ower
CI
Upp
er C
IR
ate
Low
er C
IU
pper
CI
All
Site
s57
7.5
570.
858
4.3
550.
154
9.5
550.
644
2.6
437.
144
8.1
417.
841
7.3
418.
2O
ral C
avity
& P
hary
nx17
.316
.218
.516
.416
.416
.56.
15.
56.
86.
26.
16.
2Es
opha
gus
9.6
8.7
10.5
8.7
8.6
8.8
1.8
1.5
2.2
1.9
1.9
2.0
Stom
ach
7.8
7.1
8.7
9.3
9.2
9.4
3.8
3.4
4.4
4.6
4.6
4.7
Smal
l Int
estin
e2.
42.
02.
92.
42.
42.
51.
61.
32.
01.
81.
81.
8C
olon
& R
ectu
m61
.959
.764
.253
.853
.654
.045
.543
.847
.240
.240
.140
.3Li
ver &
Intra
hepa
tic B
ile D
uct
7.1
6.4
7.9
10.2
10.2
10.3
3.0
2.6
3.5
3.4
3.4
3.5
Gal
lbla
dder
0.7
0.5
1.0
0.8
0.8
0.8
1.5
1.2
1.9
1.4
1.3
1.4
Panc
reas
12.6
11.6
13.6
13.6
13.5
13.6
8.7
8.0
9.5
10.5
10.4
10.5
Lary
nx9.
18.
310
.06.
86.
86.
92.
21.
92.
71.
51.
51.
5Lu
ng &
Bro
nchu
s11
2.9
109.
911
5.9
83.5
83.3
83.7
73.8
71.6
76.0
56.1
55.9
56.2
Bon
es &
Join
ts1.
20.
91.
61.
11.
11.
10.
80.
51.
10.
80.
80.
8So
ft Ti
ssue
incl
udin
g H
eart
4.0
3.4
4.6
3.8
3.7
3.8
3.0
2.5
3.5
2.7
2.7
2.8
Mel
anom
a of
the
Skin
23.5
22.1
24.9
24.2
24.1
24.4
16.5
15.4
17.7
15.5
15.4
15.6
Bre
ast
1.6
1.3
2.0
1.4
1.4
1.4
112.
310
9.6
115.
112
1.9
121.
712
2.2
Cer
vix
Ute
ri---
------
------
---9.
99.
010
.88.
18.
08.
2C
orpu
s & U
teru
s, N
OS
------
------
------
30.0
28.5
31.4
23.5
23.4
23.6
Ova
ry---
------
------
---12
.811
.913
.812
.512
.412
.6Pr
osta
te13
8.7
135.
514
2.0
151.
415
1.1
151.
6---
------
------
---Te
stis
5.6
4.9
6.3
5.3
5.3
5.4
------
------
------
Urin
ary
Bla
dder
39.3
37.6
41.2
37.2
37.1
37.4
11.5
10.7
12.4
9.3
9.2
9.3
Kid
ney
& R
enal
Pel
vis
22.6
21.2
23.9
21.2
21.1
21.3
12.9
12.0
13.9
11.1
11.1
11.2
Bra
in &
Oth
er N
ervo
us S
yste
m8.
67.
89.
57.
97.
87.
96.
35.
67.
05.
75.
75.
8Th
yroi
d6.
05.
36.
75.
85.
86.
016
.915
.718
.117
.317
.217
.4H
odgk
in L
ymph
oma
3.1
2.6
3.7
3.2
3.1
3.2
2.6
2.1
3.1
2.5
2.5
2.5
Non
-Hod
gkin
Lym
phom
a24
.122
.725
.623
.223
.123
.316
.915
.918
.016
.116
.116
.2M
yelo
ma
6.7
6.0
7.4
7.2
7.1
7.3
4.6
4.1
5.2
4.7
4.6
4.7
Leuk
emia
17.3
16.1
18.6
16.0
15.9
16.1
11.3
10.4
12.2
9.7
9.6
9.7
Sour
ce: W
est V
irgin
ia C
ance
r Reg
istry
and
The
Uni
ted
Stat
es C
ance
r Sta
tistic
s (U
SCS)
Rat
es a
re p
er 1
00,0
00 a
nd a
ge-a
djus
ted
to th
e 20
00 U
S St
anda
rd P
opul
atio
n (1
9 ag
e gr
oups
- C
ensu
s P25
-113
0);
Con
fiden
ce in
terv
als (
CI)
are
95%
for r
ates
.
Age
-Adj
uste
d A
vera
ge A
nnua
l Can
cer
Inci
denc
e R
ates
(95%
Con
fiden
ce In
terv
als)
by
Sel
ect C
ance
r Si
tes a
nd G
ende
r, W
est V
irgi
nia
and
Uni
ted
Stat
es, 2
005-
2009
Mal
eFe
mal
eW
est V
irgi
nia
Uni
ted
Stat
esW
est V
irgi
nia
Uni
ted
Stat
es
19

County Rate Lower CI Upper CI 5-Year CountWest Virginia 497.8 493.6 502.0 55,235
Barbour 515.0 470.0 563.4 497Berkeley 482.9 463.3 503.2 2,364Boone 536.2 498.4 576.2 775Braxton 433.5 391.3 479.4 398Brooke 413.4 382.2 446.7 683Cabell 590.1 569.9 610.9 3,344Calhoun 477.0 415.5 545.8 228Clay 570.2 510.1 635.6 337Doddridge 336.7 283.0 398.2 147Fayette 530.6 504.0 558.4 1,535Gilmer 524.6 454.8 602.8 214Grant 343.5 303.3 387.9 283Greenbrier 527.4 497.8 558.5 1,245Hampshire 594.8 553.7 638.3 805Hancock 559.7 527.8 593.3 1,196Hardy 390.7 348.4 437.1 322Harrison 516.6 494.8 539.1 2,186Jackson 524.2 490.9 559.3 947Jefferson 415.7 390.6 442.0 1,070Kanawha 542.7 529.5 556.2 6,605Lewis 543.2 500.3 589.1 606Lincoln 546.8 506.8 589.3 712Logan 569.5 537.3 603.3 1,204McDowell 497.5 461.3 536.0 728Marion 511.3 487.5 535.9 1,831Marshall 446.1 418.1 475.7 978Mason 470.1 437.0 505.2 773Mercer 528.8 506.2 552.2 2,150Mineral 460.4 427.5 495.3 752Mingo 566.6 528.4 606.9 848Monongalia 469.6 448.0 492.0 1,816Monroe 456.3 412.7 503.6 421Morgan 394.9 357.6 435.4 426Nicholas 474.9 441.6 510.1 787Ohio 561.7 534.4 590.1 1,700Pendleton 378.1 326.9 436.0 210Pleasants 428.4 369.6 494.4 195Pocahontas 428.5 376.4 486.7 258Preston 464.3 433.3 497.0 862Putnam 477.6 453.1 503.1 1,472Raleigh 459.5 440.4 479.2 2,253Randolph 483.4 451.1 517.6 860Ritchie 455.3 404.3 511.5 301Roane 456.9 414.1 503.3 433Summers 409.7 369.3 453.8 387Taylor 407.9 369.3 449.8 417Tucker 486.9 426.2 554.8 246Tyler 428.2 377.3 484.8 267Upshur 469.7 434.3 507.3 678Wayne 363.4 339.9 388.3 914Webster 506.2 449.9 567.9 308Wetzel 543.2 499.6 589.9 604Wirt 572.1 493.7 660.1 198Wood 501.2 482.4 520.6 2,753Wyoming 491.8 455.3 530.5 706
Age-Adjusted Average Annual All Site Cancer Incidence Rates & 5-Year Counts by County, 2005-2009
Rates are per 100,000 and age-adjusted to the 2000 US Standard Population (19 age groups); CI=Confidence intervals (95% for rates).
20

County Rate Lower CI Upper CI 5-Year CountWest Virginia 11.3 10.7 12.0 1,263
Barbour 9.6 4.6 18.4 10Berkeley 10.8 8.1 14.1 57Boone 10.7 5.9 17.9 15Braxton 11.2 5.2 21.4 10Brooke 7.1 3.6 13.0 12Cabell 13.4 10.5 17.0 73Calhoun 19.5 8.4 39.3 9Clay 12.9 5.5 26.2 8Doddridge ^ ^ ^ ^Fayette 16.0 11.5 21.6 45Gilmer 11.8 3.8 29.4 5Grant 5.9 1.9 15.0 5Greenbrier 10.6 6.7 16.1 24Hampshire 26.8 18.5 37.6 35Hancock 13.0 8.4 19.3 26Hardy 5.1 1.3 13.7 4Harrison 12.3 9.2 16.2 53Jackson 9.9 5.7 16.2 17Jefferson 9.3 6.0 13.9 25Kanawha 13.2 11.2 15.4 161Lewis 6.7 2.9 13.8 8Lincoln 17.3 10.8 26.5 22Logan 17.9 12.5 24.9 37McDowell 10.4 5.7 17.6 15Marion 12.7 9.1 17.3 43Marshall 7.7 4.4 12.8 17Mason 11.8 7.3 18.5 21Mercer 10.0 7.0 14.0 38Mineral 10.8 6.3 17.4 18Mingo 13.2 8.1 20.5 21Monongalia 7.9 5.3 11.3 31Monroe 14.5 7.6 25.5 13Morgan 9.3 4.6 17.5 11Nicholas 9.1 5.3 15.0 17Ohio 13.0 9.3 17.9 41Pendleton ^ ^ ^ ^Pleasants 13.0 4.8 29.7 6Pocahontas 10.6 4.2 23.9 7Preston 8.1 4.5 13.5 15Putnam 11.3 7.9 15.7 37Raleigh 10.4 7.7 13.7 52Randolph 7.2 3.8 12.6 13Ritchie ^ ^ ^ ^Roane 12.0 5.9 22.0 11Summers 10.8 5.4 20.6 11Taylor 12.8 6.8 22.4 13Tucker 15.7 5.9 34.9 7Tyler 17.4 8.6 32.6 11Upshur 11.4 6.2 19.1 15Wayne 8.1 5.0 12.6 21Webster 10.4 4.1 22.9 7Wetzel 10.3 5.3 18.8 12Wirt 21.5 9.2 44.4 8Wood 10.1 7.6 13.2 57Wyoming 6.0 2.6 12.2 8
^ Statistic not displayed due to fewer than 4 cases.
Age-Adjusted Average Annual Oral Cavity & Pharynx Cancer Incidence Rates & 5-Year Counts by County, 2005-2009
Rates are per 100,000 and age-adjusted to the 2000 US Standard Population (19 age groups); CI=Confidence intervals (95% for rates).
21

County Rate Lower CI Upper CI 5-Year CountWest Virginia 5.3 4.9 5.8 615
Barbour 7.7 3.3 15.8 8Berkeley 9.7 7.1 12.9 49Boone 6.9 3.4 12.8 11Braxton ^ ^ ^ ^Brooke 3.9 1.5 8.6 7Cabell 6.6 4.6 9.1 37Calhoun ^ ^ ^ ^Clay ^ ^ ^ ^Doddridge 0.0 0.0 11.0 0Fayette 7.4 4.6 11.2 23Gilmer ^ ^ ^ ^Grant 7.3 2.6 17.2 6Greenbrier 4.9 2.5 9.0 12Hampshire 8.1 4.0 14.9 11Hancock 4.7 2.2 9.0 10Hardy 5.9 1.9 14.5 5Harrison 3.7 2.0 6.1 15Jackson 6.4 3.3 11.6 12Jefferson 3.2 1.5 6.1 10Kanawha 4.5 3.4 5.9 59Lewis 7.6 3.4 15.0 9Lincoln 8.4 4.0 15.6 10Logan 6.6 3.6 11.1 15McDowell 4.2 1.5 9.7 6Marion 4.6 2.7 7.5 18Marshall 9.0 5.5 14.1 21Mason 2.1 0.6 6.1 4Mercer 4.7 2.9 7.3 21Mineral 4.2 1.7 9.1 7Mingo 6.3 3.0 11.9 10Monongalia 3.8 2.1 6.2 16Monroe 4.2 1.1 11.8 4Morgan 5.7 2.3 12.7 7Nicholas 3.8 1.4 8.7 6Ohio 7.9 5.1 12.1 24Pendleton 0.0 0.0 10.4 0Pleasants 0.0 0.0 10.5 0Pocahontas ^ ^ ^ ^Preston 8.4 4.8 13.9 16Putnam 7.6 4.8 11.5 23Raleigh 5.0 3.1 7.5 24Randolph 3.8 1.5 8.1 7Ritchie 5.9 1.6 16.5 4Roane 8.2 3.2 17.5 7Summers 5.0 1.6 13.1 5Taylor ^ ^ ^ ^Tucker ^ ^ ^ ^Tyler ^ ^ ^ ^Upshur 5.0 2.2 10.3 8Wayne 5.2 2.8 8.9 14Webster ^ ^ ^ ^Wetzel 3.3 0.9 9.5 4Wirt ^ ^ ^ ^Wood 2.9 1.7 4.7 17Wyoming 8.4 4.2 15.1 12
^ Statistic not displayed due to fewer than 4 cases.
Age-Adjusted Average Annual Esophageal Cancer Incidence Rates & 5-Year Counts by County, 2005-2009
Rates are per 100,000 and age-adjusted to the 2000 US Standard Population (19 age groups); CI=Confidence intervals (95% for rates).
22

County Rate Lower CI Upper CI 5-Year CountWest Virginia 5.6 5.1 6.0 630
Barbour 8.6 3.6 17.5 8Berkeley 5.3 3.5 7.9 26Boone 6.5 2.9 12.5 9Braxton 11.9 6.1 21.6 12Brooke 7.6 4.0 13.6 13Cabell 6.1 4.3 8.6 36Calhoun ^ ^ ^ ^Clay 13.7 5.9 27.4 8Doddridge ^ ^ ^ ^Fayette 6.4 3.7 10.2 18Gilmer 11.5 3.7 28.8 5Grant 7.9 3.2 17.5 7Greenbrier 4.8 2.3 9.0 11Hampshire 4.4 1.6 10.0 6Hancock 5.9 3.2 10.3 14Hardy 8.0 2.9 17.9 6Harrison 5.3 3.3 8.1 23Jackson 4.7 2.1 9.2 9Jefferson 6.1 3.5 10.1 16Kanawha 6.0 4.7 7.5 76Lewis 3.2 0.9 9.0 4Lincoln 5.4 2.1 11.4 7Logan 6.5 3.5 11.1 14McDowell 7.6 3.7 14.1 11Marion 7.5 4.9 11.0 28Marshall 5.4 2.8 9.8 12Mason 4.8 2.0 9.8 8Mercer 6.8 4.5 9.9 29Mineral 4.4 1.9 9.1 8Mingo 4.5 1.8 9.6 7Monongalia 3.6 1.9 6.0 14Monroe 6.4 2.3 14.9 6Morgan ^ ^ ^ ^Nicholas 5.5 2.5 10.8 9Ohio 7.1 4.3 11.1 22Pendleton ^ ^ ^ ^Pleasants 0.0 0.0 10.5 0Pocahontas ^ ^ ^ ^Preston 2.3 0.7 5.8 5Putnam 4.7 2.6 7.9 15Raleigh 4.3 2.7 6.7 21Randolph 7.1 3.7 12.5 13Ritchie 13.5 6.1 26.6 9Roane 5.5 1.7 13.4 5Summers 6.9 2.8 15.6 7Taylor 5.4 2.0 12.5 6Tucker ^ ^ ^ ^Tyler ^ ^ ^ ^Upshur 6.5 2.9 12.8 9Wayne 2.5 0.9 5.7 6Webster ^ ^ ^ ^Wetzel ^ ^ ^ ^Wirt ^ ^ ^ ^Wood 3.8 2.3 5.9 21Wyoming 7.3 3.4 13.9 10
^ Statistic not displayed due to fewer than 4 cases.
Age-Adjusted Average Annual Stomach Cancer Incidence Rates & 5-Year Counts by County, 2005-2009
Rates are per 100,000 and age-adjusted to the 2000 US Standard Population (19 age groups); CI=Confidence intervals (95% for rates).
23

County Rate Lower CI Upper CI 5-Year CountWest Virginia 2.0 1.7 2.3 224
Barbour ^ ^ ^ ^Berkeley 2.3 1.2 4.1 12Boone 5.6 2.4 11.3 8Braxton ^ ^ ^ ^Brooke ^ ^ ^ ^Cabell 1.9 0.9 3.6 10Calhoun ^ ^ ^ ^Clay 0.0 0.0 7.4 0Doddridge 0.0 0.0 11.0 0Fayette 1.6 0.5 4.0 5Gilmer ^ ^ ^ ^Grant ^ ^ ^ ^Greenbrier 3.8 1.8 7.4 10Hampshire ^ ^ ^ ^Hancock 1.8 0.5 5.2 4Hardy ^ ^ ^ ^Harrison 0.9 0.2 2.5 4Jackson 3.0 1.1 7.0 6Jefferson 2.0 0.6 4.8 5Kanawha 2.2 1.4 3.2 27Lewis ^ ^ ^ ^Lincoln ^ ^ ^ ^Logan ^ ^ ^ ^McDowell ^ ^ ^ ^Marion 3.7 2.0 6.5 14Marshall 1.9 0.5 5.1 4Mason ^ ^ ^ ^Mercer 2.0 0.9 4.1 9Mineral ^ ^ ^ ^Mingo ^ ^ ^ ^Monongalia 1.7 0.7 3.6 7Monroe 4.7 1.5 12.2 5Morgan ^ ^ ^ ^Nicholas ^ ^ ^ ^Ohio 1.2 0.3 3.4 4Pendleton 0.0 0.0 10.4 0Pleasants ^ ^ ^ ^Pocahontas ^ ^ ^ ^Preston 2.2 0.6 5.9 4Putnam 2.1 0.7 4.6 6Raleigh 0.8 0.2 2.3 4Randolph 0.0 0.0 2.6 0Ritchie ^ ^ ^ ^Roane ^ ^ ^ ^Summers 0.0 0.0 6.1 0Taylor ^ ^ ^ ^Tucker 0.0 0.0 11.7 0Tyler ^ ^ ^ ^Upshur ^ ^ ^ ^Wayne ^ ^ ^ ^Webster ^ ^ ^ ^Wetzel 4.6 1.5 11.5 5Wirt 0.0 0.0 13.7 0Wood 2.3 1.2 4.1 12Wyoming ^ ^ ^ ^
^ Statistic not displayed due to fewer than 4 cases.
Age-Adjusted Average Annual Small Intestine Cancer Incidence Rates & 5-Year Counts by County, 2005-2009
Rates are per 100,000 and age-adjusted to the 2000 US Standard Population (19 age groups); CI=Confidence intervals (95% for rates).
24

County Rate Lower CI Upper CI 5-Year CountWest Virginia 52.7 51.3 54.1 5,911
Barbour 57.4 43.4 74.9 57Berkeley 53.5 47.0 60.7 255Boone 58.5 46.5 72.9 84Braxton 52.6 38.6 70.4 48Brooke 41.4 32.0 52.9 70Cabell 65.2 58.8 72.2 384Calhoun 49.1 31.9 73.7 26Clay 40.2 25.6 60.4 24Doddridge 49.7 30.8 76.9 22Fayette 62.8 54.0 72.7 187Gilmer 66.3 44.2 96.7 29Grant 38.8 26.5 55.6 33Greenbrier 59.5 50.0 70.5 144Hampshire 58.2 46.0 72.9 80Hancock 56.1 46.5 67.3 124Hardy 45.3 31.8 62.9 38Harrison 53.7 46.9 61.2 232Jackson 42.5 33.4 53.4 77Jefferson 48.9 40.4 58.7 122Kanawha 52.4 48.4 56.7 656Lewis 72.6 57.5 90.6 82Lincoln 52.9 40.9 67.5 68Logan 65.4 54.8 77.6 137McDowell 49.5 38.5 62.8 72Marion 50.6 43.4 58.7 185Marshall 47.8 39.1 58.2 107Mason 51.0 40.6 63.4 85Mercer 58.5 51.3 66.6 245Mineral 54.7 43.8 67.7 89Mingo 65.3 52.7 80.1 97Monongalia 48.9 42.1 56.6 188Monroe 40.2 28.3 56.0 38Morgan 38.0 27.1 52.3 41Nicholas 51.0 40.6 63.5 85Ohio 49.0 41.4 57.7 155Pendleton 39.5 24.3 62.0 22Pleasants 48.1 29.6 74.7 21Pocahontas 39.9 25.3 60.8 24Preston 50.0 40.2 61.6 92Putnam 36.0 29.4 43.7 106Raleigh 56.4 49.9 63.6 279Randolph 64.8 53.5 78.0 118Ritchie 51.6 35.5 73.1 34Roane 42.6 30.6 58.3 42Summers 38.4 27.1 53.7 38Taylor 46.3 34.0 61.9 48Tucker 65.4 44.4 94.1 33Tyler 40.7 26.5 60.9 26Upshur 60.2 48.0 74.6 87Wayne 40.1 32.5 48.9 101Webster 59.0 40.8 83.1 35Wetzel 58.6 44.8 75.8 64Wirt 71.5 45.4 108.1 24Wood 49.3 43.5 55.6 271Wyoming 55.8 44.0 69.9 80
Age-Adjusted Average Annual Colorectal Cancer Incidence Rates & 5-Year Counts by County, 2005-2009
Rates are per 100,000 and age-adjusted to the 2000 US Standard Population (19 age groups); CI=Confidence intervals (95% for rates).
25

County Rate Lower CI Upper CI 5-Year CountWest Virginia 4.9 4.5 5.4 553
Barbour 6.1 2.2 14.0 6Berkeley 6.0 4.0 8.7 30Boone 4.9 1.9 10.4 7Braxton ^ ^ ^ ^Brooke 2.3 0.6 6.5 4Cabell 7.0 5.0 9.6 41Calhoun 0.0 0.0 10.8 0Clay ^ ^ ^ ^Doddridge ^ ^ ^ ^Fayette 4.6 2.5 7.9 14Gilmer ^ ^ ^ ^Grant ^ ^ ^ ^Greenbrier 3.3 1.4 6.8 8Hampshire 11.9 6.8 19.7 16Hancock 5.6 3.0 10.1 13Hardy ^ ^ ^ ^Harrison 5.7 3.7 8.6 25Jackson 4.5 1.9 9.3 8Jefferson 4.0 2.0 7.4 11Kanawha 5.0 3.9 6.5 62Lewis ^ ^ ^ ^Lincoln 6.5 2.8 13.2 8Logan 3.8 1.6 7.7 8McDowell 4.2 1.7 9.3 7Marion 4.2 2.3 7.2 14Marshall 7.7 4.4 12.7 17Mason 4.8 2.1 9.8 8Mercer 5.4 3.4 8.3 23Mineral 5.1 2.2 10.4 8Mingo 9.1 4.8 15.7 13Monongalia 4.1 2.3 6.7 16Monroe ^ ^ ^ ^Morgan ^ ^ ^ ^Nicholas 3.9 1.6 8.5 7Ohio 6.4 3.8 10.2 20Pendleton 8.5 1.9 24.1 4Pleasants ^ ^ ^ ^Pocahontas ^ ^ ^ ^Preston 2.7 1.0 6.4 6Putnam 2.3 0.9 4.9 7Raleigh 6.0 4.0 8.7 30Randolph 5.4 2.4 10.6 9Ritchie ^ ^ ^ ^Roane 4.2 1.1 11.7 4Summers ^ ^ ^ ^Taylor ^ ^ ^ ^Tucker ^ ^ ^ ^Tyler 0.0 0.0 8.7 0Upshur 6.8 3.2 12.8 10Wayne 4.7 2.4 8.5 12Webster ^ ^ ^ ^Wetzel 5.5 2.0 12.7 6Wirt ^ ^ ^ ^Wood 5.2 3.5 7.6 30Wyoming 3.3 0.9 8.6 4
^ Statistic not displayed due to fewer than 4 cases.
Age-Adjusted Average Annual Liver & Intrahepatic Bile Duct Cancer Incidence Rates & 5-Year Counts by County, 2005-2009
Rates are per 100,000 and age-adjusted to the 2000 US Standard Population (19 age groups); CI=Confidence intervals (95% for rates).
26

County Rate Lower CI Upper CI 5-Year CountWest Virginia 1.2 1.0 1.4 129
Barbour ^ ^ ^ ^Berkeley 1.2 0.4 2.8 6Boone 3.7 1.2 8.7 5Braxton ^ ^ ^ ^Brooke ^ ^ ^ ^Cabell ^ ^ ^ ^Calhoun 0.0 0.0 10.8 0Clay ^ ^ ^ ^Doddridge 0.0 0.0 11.0 0Fayette ^ ^ ^ ^Gilmer 0.0 0.0 11.9 0Grant 0.0 0.0 6.5 0Greenbrier ^ ^ ^ ^Hampshire ^ ^ ^ ^Hancock 3.1 1.1 7.2 6Hardy 0.0 0.0 5.6 0Harrison 1.4 0.6 3.0 7Jackson ^ ^ ^ ^Jefferson 1.7 0.4 4.3 4Kanawha 0.9 0.5 1.6 12Lewis ^ ^ ^ ^Lincoln ^ ^ ^ ^Logan ^ ^ ^ ^McDowell 0.0 0.0 3.3 0Marion 1.2 0.3 3.3 4Marshall ^ ^ ^ ^Mason ^ ^ ^ ^Mercer 1.7 0.7 3.6 8Mineral ^ ^ ^ ^Mingo ^ ^ ^ ^Monongalia 1.2 0.4 2.9 5Monroe 0.0 0.0 5.7 0Morgan 0.0 0.0 4.8 0Nicholas ^ ^ ^ ^Ohio 1.2 0.3 3.5 4Pendleton 0.0 0.0 10.4 0Pleasants 0.0 0.0 10.5 0Pocahontas 0.0 0.0 9.2 0Preston ^ ^ ^ ^Putnam 1.7 0.5 4.1 5Raleigh ^ ^ ^ ^Randolph ^ ^ ^ ^Ritchie 0.0 0.0 7.5 0Roane ^ ^ ^ ^Summers ^ ^ ^ ^Taylor ^ ^ ^ ^Tucker 0.0 0.0 11.7 0Tyler ^ ^ ^ ^Upshur ^ ^ ^ ^Wayne ^ ^ ^ ^Webster ^ ^ ^ ^Wetzel ^ ^ ^ ^Wirt ^ ^ ^ ^Wood 1.1 0.4 2.4 6Wyoming ^ ^ ^ ^
^ Statistic not displayed due to fewer than 4 cases.
Age-Adjusted Average Annual Gallbladder Cancer Incidence Rates & 5-Year Counts by County, 2005-2009
Rates are per 100,000 and age-adjusted to the 2000 US Standard Population (19 age groups); CI=Confidence intervals (95% for rates).
27

County Rate Lower CI Upper CI 5-Year CountWest Virginia 10.5 9.9 11.1 1,197
Barbour 15.9 8.9 26.7 15Berkeley 9.2 6.6 12.5 43Boone 11.9 6.9 19.3 17Braxton 9.0 3.8 18.4 8Brooke 8.8 5.0 14.9 16Cabell 13.6 10.8 17.0 81Calhoun 7.4 2.0 21.4 4Clay ^ ^ ^ ^Doddridge 7.7 2.0 22.2 4Fayette 11.5 8.0 16.3 34Gilmer 14.1 5.1 32.4 6Grant ^ ^ ^ ^Greenbrier 10.8 7.2 15.9 28Hampshire 12.3 7.1 20.1 17Hancock 14.2 9.7 20.3 33Hardy 10.4 4.4 21.1 8Harrison 8.7 6.2 12.1 39Jackson 11.0 6.7 17.3 20Jefferson 7.1 4.1 11.3 18Kanawha 10.6 8.9 12.6 136Lewis 12.6 7.0 21.4 15Lincoln 8.3 4.1 15.2 11Logan 11.1 7.0 16.7 24McDowell 5.7 2.6 11.4 9Marion 12.0 8.7 16.2 45Marshall 6.1 3.3 10.6 14Mason 10.4 6.0 17.1 17Mercer 14.7 11.2 19.0 62Mineral 11.7 7.1 18.5 20Mingo 12.2 7.2 19.5 18Monongalia 10.8 7.7 14.6 42Monroe 7.9 3.4 16.7 8Morgan 5.8 2.3 12.9 7Nicholas 9.3 5.3 15.4 16Ohio 9.8 6.7 14.0 34Pendleton 14.6 6.6 29.9 9Pleasants 9.5 2.6 25.3 4Pocahontas 8.4 2.7 21.4 5Preston 9.6 5.7 15.4 18Putnam 9.7 6.5 14.0 30Raleigh 8.8 6.4 11.9 44Randolph 9.5 5.5 15.5 17Ritchie 8.4 3.0 19.7 6Roane 4.8 1.5 12.1 5Summers 7.5 3.0 16.5 7Taylor 12.0 6.1 21.5 12Tucker 18.2 8.7 36.1 10Tyler 12.2 5.2 25.6 8Upshur 8.4 4.3 15.1 12Wayne 8.5 5.2 13.1 21Webster 13.0 5.1 27.5 7Wetzel 9.9 4.8 18.7 11Wirt 17.3 6.2 39.6 6Wood 13.3 10.5 16.7 77Wyoming 8.5 4.5 15.0 13
^ Statistic not displayed due to fewer than 4 cases.
Age-Adjusted Average Annual Pancreatic Cancer Incidence Rates & 5-Year Counts by County, 2005-2009
Rates are per 100,000 and age-adjusted to the 2000 US Standard Population (19 age groups); CI=Confidence intervals (95% for rates).
28

County Rate Lower CI Upper CI 5-Year CountWest Virginia 5.4 5.0 5.8 614
Barbour 4.8 1.5 12.1 5Berkeley 3.3 1.9 5.4 17Boone 10.8 6.1 17.9 16Braxton 7.3 2.6 16.3 6Brooke 3.5 1.3 8.3 6Cabell 6.7 4.7 9.3 38Calhoun ^ ^ ^ ^Clay 16.4 7.8 31.0 10Doddridge 0.0 0.0 11.0 0Fayette 7.0 4.2 11.1 19Gilmer 0.0 0.0 11.9 0Grant ^ ^ ^ ^Greenbrier 4.6 2.4 8.5 12Hampshire 5.8 2.7 11.6 9Hancock 5.8 3.1 10.4 13Hardy 4.7 1.2 12.8 4Harrison 6.5 4.4 9.5 29Jackson 6.7 3.6 11.8 13Jefferson 3.8 1.8 7.2 10Kanawha 5.6 4.4 7.2 71Lewis 4.0 1.3 10.1 5Lincoln 12.2 7.1 20.0 17Logan 11.6 7.5 17.4 25McDowell 8.3 4.4 14.7 13Marion 5.2 3.1 8.3 19Marshall 2.7 1.0 6.2 6Mason 6.4 3.1 12.0 11Mercer 5.8 3.5 9.1 21Mineral ^ ^ ^ ^Mingo 10.2 5.9 16.6 17Monongalia 3.2 1.7 5.6 13Monroe 5.5 1.7 13.9 5Morgan ^ ^ ^ ^Nicholas 6.0 2.9 11.4 10Ohio 4.6 2.5 8.0 14Pendleton 6.2 1.7 18.8 4Pleasants 10.1 3.2 25.3 5Pocahontas 5.8 1.6 17.3 4Preston 3.8 1.5 8.1 7Putnam 3.3 1.6 6.0 11Raleigh 5.2 3.4 7.7 27Randolph 5.1 2.3 10.0 9Ritchie 6.8 2.2 17.3 5Roane 3.3 0.9 9.6 4Summers 4.2 1.1 12.1 4Taylor 3.7 1.0 10.2 4Tucker ^ ^ ^ ^Tyler ^ ^ ^ ^Upshur 3.6 1.1 8.9 5Wayne 6.3 3.5 10.4 16Webster ^ ^ ^ ^Wetzel 6.5 2.6 14.0 7Wirt 12.3 3.2 33.2 4Wood 3.0 1.7 4.9 17Wyoming 5.8 2.4 11.9 8
^ Statistic not displayed due to fewer than 4 cases.
Age-Adjusted Average Annual Larynx Cancer Incidence Rates & 5-Year Counts by County, 2005-2009
Rates are per 100,000 and age-adjusted to the 2000 US Standard Population (19 age groups); CI=Confidence intervals (95% for rates).
29

County Rate Lower CI Upper CI 5-Year CountWest Virginia 90.5 88.8 92.3 10,266
Barbour 73.6 57.6 93.1 73Berkeley 89.4 81.0 98.5 430Boone 144.1 124.8 165.6 206Braxton 78.6 61.4 99.5 73Brooke 72.4 60.2 86.7 126Cabell 105.3 97.1 114.1 621Calhoun 98.6 72.7 131.8 49Clay 106.1 81.8 135.7 66Doddridge 57.7 36.8 87.0 25Fayette 112.3 100.4 125.4 329Gilmer 88.4 62.6 122.4 39Grant 46.4 33.2 64.0 41Greenbrier 93.5 81.7 106.8 231Hampshire 107.6 90.9 126.8 150Hancock 97.1 84.4 111.5 213Hardy 43.6 30.6 60.8 37Harrison 93.8 84.9 103.5 409Jackson 99.9 86.0 115.6 187Jefferson 66.0 56.1 77.1 165Kanawha 97.5 92.1 103.2 1,227Lewis 95.4 78.3 115.5 110Lincoln 137.7 118.3 159.4 185Logan 130.7 115.7 147.2 280McDowell 111.7 95.2 130.4 167Marion 91.8 82.1 102.4 338Marshall 67.6 57.0 79.7 149Mason 89.9 76.0 105.8 151Mercer 89.8 80.9 99.4 381Mineral 84.9 71.3 100.6 140Mingo 133.5 115.4 153.8 200Monongalia 61.7 54.0 70.2 234Monroe 71.0 54.5 91.4 66Morgan 90.1 73.1 110.2 100Nicholas 85.1 71.6 100.5 144Ohio 87.6 77.4 99.0 276Pendleton 56.3 38.2 81.3 32Pleasants 75.6 52.1 106.8 34Pocahontas 86.7 64.7 114.7 53Preston 70.0 58.4 83.3 132Putnam 79.5 69.7 90.3 243Raleigh 79.1 71.5 87.4 399Randolph 66.9 55.4 80.2 121Ritchie 83.2 62.6 109.0 56Roane 89.5 71.7 110.8 89Summers 80.4 63.4 101.3 77Taylor 94.1 76.2 115.2 98Tucker 70.2 49.6 98.4 38Tyler 65.3 47.4 89.0 44Upshur 82.7 68.7 99.0 124Wayne 86.3 75.2 98.7 221Webster 113.1 87.9 143.9 71Wetzel 94.6 77.5 114.8 109Wirt 101.8 71.3 142.2 37Wood 92.2 84.3 100.6 516Wyoming 105.6 89.3 124.2 154
Age-Adjusted Average Annual Lung & Bronchus Cancer Incidence Rates & 5-Year Counts by County, 2005-2009
Rates are per 100,000 and age-adjusted to the 2000 US Standard Population (19 age groups); CI=Confidence intervals (95% for rates).
30

County Rate Lower CI Upper CI 5-Year CountWest Virginia 1.0 0.8 1.2 94
Barbour ^ ^ ^ ^Berkeley ^ ^ ^ ^Boone 0.0 0.0 3.0 0Braxton 0.0 0.0 5.2 0Brooke ^ ^ ^ ^Cabell 0.9 0.2 2.4 4Calhoun 0.0 0.0 10.8 0Clay 0.0 0.0 7.4 0Doddridge 0.0 0.0 11.0 0Fayette ^ ^ ^ ^Gilmer ^ ^ ^ ^Grant ^ ^ ^ ^Greenbrier ^ ^ ^ ^Hampshire ^ ^ ^ ^Hancock ^ ^ ^ ^Hardy ^ ^ ^ ^Harrison ^ ^ ^ ^Jackson 0.0 0.0 2.6 0Jefferson ^ ^ ^ ^Kanawha 1.2 0.7 2.1 14Lewis ^ ^ ^ ^Lincoln ^ ^ ^ ^Logan ^ ^ ^ ^McDowell ^ ^ ^ ^Marion ^ ^ ^ ^Marshall 0.0 0.0 2.3 0Mason ^ ^ ^ ^Mercer 1.1 0.3 2.9 4Mineral ^ ^ ^ ^Mingo 3.3 0.9 8.3 4Monongalia 1.2 0.4 3.0 5Monroe 0.0 0.0 5.7 0Morgan 0.0 0.0 4.8 0Nicholas ^ ^ ^ ^Ohio ^ ^ ^ ^Pendleton ^ ^ ^ ^Pleasants 0.0 0.0 10.5 0Pocahontas 0.0 0.0 9.2 0Preston ^ ^ ^ ^Putnam ^ ^ ^ ^Raleigh 1.2 0.4 2.9 5Randolph ^ ^ ^ ^Ritchie ^ ^ ^ ^Roane 0.0 0.0 5.0 0Summers 0.0 0.0 6.1 0Taylor 0.0 0.0 4.7 0Tucker ^ ^ ^ ^Tyler 0.0 0.0 8.7 0Upshur 0.0 0.0 3.2 0Wayne 0.0 0.0 1.8 0Webster ^ ^ ^ ^Wetzel ^ ^ ^ ^Wirt 0.0 0.0 13.7 0Wood 0.8 0.2 2.2 4Wyoming ^ ^ ^ ^
^ Statistic not displayed due to fewer than 4 cases.
Age-Adjusted Average Annual Bone & Joint Cancer Incidence Rates & 5-Year Counts by County, 2005-2009
Rates are per 100,000 and age-adjusted to the 2000 US Standard Population (19 age groups); CI=Confidence intervals (95% for rates).
31

County Rate Lower CI Upper CI 5-Year CountWest Virginia 3.4 3.0 3.8 351
Barbour ^ ^ ^ ^Berkeley 3.2 1.8 5.3 15Boone 4.0 1.4 9.2 6Braxton ^ ^ ^ ^Brooke ^ ^ ^ ^Cabell 2.9 1.6 4.9 15Calhoun ^ ^ ^ ^Clay ^ ^ ^ ^Doddridge ^ ^ ^ ^Fayette 2.9 1.1 6.0 7Gilmer ^ ^ ^ ^Grant ^ ^ ^ ^Greenbrier 3.4 1.3 7.4 7Hampshire ^ ^ ^ ^Hancock 2.8 1.0 6.5 6Hardy ^ ^ ^ ^Harrison 3.5 1.9 6.1 13Jackson 5.9 2.8 11.1 10Jefferson 2.8 1.1 5.8 7Kanawha 4.2 3.0 5.7 46Lewis ^ ^ ^ ^Lincoln 3.5 0.9 9.0 4Logan 4.3 1.7 8.9 7McDowell 4.3 1.3 10.2 5Marion 2.8 1.3 5.3 10Marshall 3.5 1.4 7.6 7Mason ^ ^ ^ ^Mercer 3.9 2.1 6.7 14Mineral 2.9 0.9 7.2 5Mingo 2.7 0.7 7.1 4Monongalia 6.6 4.2 9.9 25Monroe 5.7 1.8 14.3 5Morgan 4.3 1.4 11.0 5Nicholas ^ ^ ^ ^Ohio 2.9 1.2 5.9 8Pendleton ^ ^ ^ ^Pleasants ^ ^ ^ ^Pocahontas ^ ^ ^ ^Preston 4.0 1.4 8.8 6Putnam 3.3 1.5 6.2 9Raleigh 4.4 2.7 6.9 20Randolph ^ ^ ^ ^Ritchie ^ ^ ^ ^Roane 4.7 1.2 12.7 4Summers ^ ^ ^ ^Taylor ^ ^ ^ ^Tucker ^ ^ ^ ^Tyler ^ ^ ^ ^Upshur ^ ^ ^ ^Wayne 1.9 0.6 4.7 5Webster ^ ^ ^ ^Wetzel 4.3 1.4 10.9 5Wirt ^ ^ ^ ^Wood 2.7 1.5 4.7 14Wyoming 2.8 0.7 7.7 4
^ Statistic not displayed due to fewer than 4 cases.
Age-Adjusted Average Annual Soft Tissue Cancer Incidence Rates & 5-Year Counts by County, 2005-2009
Rates are per 100,000 and age-adjusted to the 2000 US Standard Population (19 age groups); CI=Confidence intervals (95% for rates).
32

County Rate Lower CI Upper CI 5-Year CountWest Virginia 19.3 18.5 20.2 2,018
Barbour 20.0 11.5 32.6 17Berkeley 16.8 13.4 20.8 86Boone 17.9 11.3 27.0 24Braxton 21.1 12.4 33.9 18Brooke 8.2 4.1 14.8 12Cabell 24.9 20.7 29.8 131Calhoun ^ ^ ^ ^Clay 17.9 8.1 34.2 9Doddridge 12.6 3.4 31.9 4Fayette 16.8 12.3 22.6 47Gilmer 20.1 8.2 41.8 8Grant 15.5 7.5 28.8 11Greenbrier 24.5 18.2 32.4 54Hampshire 19.4 12.5 29.0 25Hancock 13.3 8.4 20.2 25Hardy 10.1 4.3 20.6 8Harrison 19.8 15.5 24.9 77Jackson 14.8 9.4 22.2 25Jefferson 13.4 9.4 18.7 37Kanawha 26.7 23.7 30.0 305Lewis 14.2 8.0 23.8 16Lincoln 19.3 12.2 29.2 23Logan 19.6 13.9 27.0 40McDowell 15.6 9.3 24.5 20Marion 20.4 15.7 26.2 69Marshall 14.6 9.8 21.2 30Mason 21.1 14.3 30.2 32Mercer 23.2 18.3 29.1 81Mineral 9.4 5.1 16.1 14Mingo 21.8 14.8 31.1 32Monongalia 17.5 13.5 22.3 68Monroe 18.7 10.4 31.4 16Morgan 14.8 8.4 24.7 16Nicholas 27.0 19.3 36.9 42Ohio 22.2 16.7 29.1 59Pendleton 9.9 2.9 25.3 5Pleasants 14.3 5.6 31.1 7Pocahontas 26.0 14.2 44.7 15Preston 16.8 11.1 24.5 29Putnam 26.9 21.2 33.7 79Raleigh 15.9 12.4 20.0 75Randolph 15.3 9.9 22.7 26Ritchie 19.0 9.8 33.9 13Roane 19.0 11.1 30.8 18Summers 20.2 12.2 32.4 20Taylor 11.6 5.9 20.8 12Tucker 15.5 6.6 33.0 8Tyler 13.6 5.8 28.1 8Upshur 13.7 7.9 22.3 17Wayne 8.2 5.0 12.8 21Webster 10.8 4.1 24.0 7Wetzel 16.7 9.3 27.8 16Wirt 18.0 6.4 41.0 6Wood 26.4 22.0 31.4 135Wyoming 10.9 6.2 18.0 17
^ Statistic not displayed due to fewer than 4 cases.
Age-Adjusted Average Annual Melanoma Skin Cancer Incidence Rates & 5-Year Counts by County, 2005-2009
Rates are per 100,000 and age-adjusted to the 2000 US Standard Population (19 age groups); CI=Confidence intervals (95% for rates).
33

County Rate Lower CI Upper CI 5-Year CountWest Virginia 23.4 22.6 24.4 2,650
Barbour 22.2 13.7 34.3 21Berkeley 21.9 17.8 26.7 102Boone 23.0 15.6 32.7 32Braxton 22.0 13.4 34.6 20Brooke 20.5 14.2 29.1 35Cabell 24.4 20.6 28.9 144Calhoun 24.2 12.4 44.0 12Clay 22.8 12.4 38.9 14Doddridge 15.9 6.2 34.4 7Fayette 24.7 19.2 31.2 72Gilmer 19.4 8.8 38.7 9Grant 10.4 4.7 21.0 9Greenbrier 28.2 22.0 35.9 71Hampshire 30.1 21.6 41.1 42Hancock 28.4 21.8 36.6 64Hardy 21.3 12.3 34.6 17Harrison 26.1 21.4 31.6 110Jackson 24.7 18.1 33.3 46Jefferson 24.7 18.6 32.0 59Kanawha 23.4 20.8 26.3 294Lewis 23.8 15.5 35.3 26Lincoln 16.8 10.4 25.8 22Logan 23.2 17.0 31.0 48McDowell 23.7 16.4 33.4 35Marion 27.1 22.1 33.0 104Marshall 26.0 19.7 33.8 59Mason 25.0 17.8 34.3 41Mercer 29.5 24.5 35.3 126Mineral 18.8 12.6 27.1 30Mingo 25.0 17.3 35.0 35Monongalia 24.2 19.5 29.7 92Monroe 25.1 16.0 38.1 24Morgan 13.9 7.7 23.7 15Nicholas 21.3 14.9 29.9 36Ohio 28.3 22.8 34.9 96Pendleton 23.0 12.5 40.6 14Pleasants 21.8 10.4 41.4 10Pocahontas 24.2 13.4 41.4 15Preston 16.6 11.3 23.7 32Putnam 25.6 20.1 32.1 76Raleigh 21.4 17.6 26.0 108Randolph 26.6 19.5 35.5 48Ritchie 16.3 8.1 30.3 11Roane 23.1 14.4 35.6 22Summers 14.9 8.1 26.0 14Taylor 10.9 5.4 19.9 11Tucker 23.5 12.5 42.7 13Tyler 19.1 9.8 34.7 12Upshur 17.5 11.5 25.8 27Wayne 13.8 9.5 19.4 34Webster 23.4 13.0 39.8 15Wetzel 24.7 16.6 35.9 30Wirt 38.3 20.2 67.0 13Wood 23.5 19.7 28.0 133Wyoming 30.7 22.1 41.7 43
Age-Adjusted Average Annual Urinary Bladder Cancer Incidence Rates & 5-Year Countsby County, 2005-2009
Rates are per 100,000 and age-adjusted to the 2000 US Stndard Population (19 age groups); CI=Confidence intervals (95% for rates).
34

County Rate Lower CI Upper CI 5-Year CountWest Virginia 17.2 16.5 18.0 1,888
Barbour 22.4 13.9 34.6 22Berkeley 20.1 16.3 24.5 99Boone 15.2 9.1 23.7 20Braxton 12.0 5.9 22.2 11Brooke 15.6 10.1 23.3 26Cabell 18.8 15.3 22.8 107Calhoun 7.7 2.1 21.9 4Clay 26.1 14.5 43.8 15Doddridge 8.9 2.4 24.5 4Fayette 13.7 9.7 19.0 39Gilmer 29.8 15.2 53.6 12Grant 19.9 10.4 34.7 14Greenbrier 14.4 9.7 20.6 33Hampshire 27.1 19.0 37.8 37Hancock 21.4 15.6 29.0 46Hardy 16.6 9.2 28.2 15Harrison 17.7 13.8 22.3 74Jackson 19.8 13.8 27.7 36Jefferson 9.9 6.5 14.5 28Kanawha 19.9 17.5 22.7 242Lewis 22.2 14.1 33.4 24Lincoln 15.5 9.4 24.2 20Logan 19.0 13.4 26.1 40McDowell 17.2 10.8 26.0 24Marion 18.8 14.3 24.2 64Marshall 11.8 7.6 17.7 26Mason 17.5 11.6 25.6 29Mercer 16.7 12.9 21.4 67Mineral 15.6 9.9 23.5 24Mingo 15.7 10.1 23.5 25Monongalia 15.1 11.4 19.6 58Monroe 18.7 10.7 31.0 17Morgan 15.1 8.2 25.6 15Nicholas 15.0 9.4 22.7 24Ohio 20.8 15.7 27.1 59Pendleton 9.1 2.2 25.2 4Pleasants 13.6 4.9 30.8 6Pocahontas 16.6 7.9 32.2 10Preston 16.8 11.2 24.4 29Putnam 19.0 14.4 24.7 59Raleigh 15.4 12.1 19.4 77Randolph 14.8 9.7 21.8 27Ritchie 15.3 7.2 29.2 10Roane 11.8 5.8 21.7 11Summers 8.4 3.6 17.8 8Taylor 14.4 7.7 24.7 14Tucker 11.0 4.0 26.8 6Tyler 27.1 14.4 46.8 14Upshur 11.4 6.7 18.3 18Wayne 12.3 8.3 17.6 31Webster 12.7 4.9 27.2 7Wetzel 24.0 15.8 35.4 28Wirt 33.4 16.5 61.1 11Wood 17.4 14.0 21.4 93Wyoming 16.9 10.8 25.4 25
Age-Adjusted Average Annual Kidney & Renal Pelvis Cancer Incidence Rates & 5-Year Counts by County, 2005-2009
Rates are per 100,000 and age-adjusted to the 2000 US Standard Population (19 age groups); CI=Confidence intervals (95% for rates).
35

County Rate Lower CI Upper CI 5-Year CountWest Virginia 7.3 6.8 7.9 757
Barbour 11.1 5.0 21.4 9Berkeley 5.7 3.8 8.3 29Boone 9.8 5.1 16.9 13Braxton 9.6 3.8 19.9 7Brooke 3.4 0.8 8.9 4Cabell 7.8 5.5 10.7 41Calhoun ^ ^ ^ ^Clay 9.4 3.0 22.3 5Doddridge ^ ^ ^ ^Fayette 6.3 3.7 10.2 18Gilmer ^ ^ ^ ^Grant 6.3 1.6 16.9 4Greenbrier 8.1 4.4 13.5 16Hampshire 6.9 3.2 13.2 10Hancock 4.5 1.8 9.4 8Hardy 9.6 3.8 20.2 7Harrison 7.2 4.8 10.6 28Jackson 7.6 4.0 13.3 13Jefferson 6.5 3.8 10.6 17Kanawha 8.5 6.8 10.4 95Lewis 10.3 5.1 18.9 11Lincoln 5.7 2.2 12.0 7Logan 9.9 6.0 15.5 20McDowell 8.2 3.8 15.4 10Marion 8.7 5.7 12.9 27Marshall 5.6 2.7 10.4 11Mason 5.3 2.2 10.9 8Mercer 9.4 6.4 13.4 34Mineral 3.5 1.4 7.7 7Mingo 8.3 4.2 14.7 12Monongalia 3.5 1.9 6.0 14Monroe 6.4 1.9 15.9 5Morgan 8.1 3.4 16.6 8Nicholas 11.1 6.3 18.2 17Ohio 11.0 7.1 16.2 28Pendleton ^ ^ ^ ^Pleasants 7.9 2.1 22.1 4Pocahontas 12.6 4.8 27.8 7Preston 9.2 5.3 15.1 17Putnam 6.1 3.7 9.7 19Raleigh 7.2 5.0 10.3 33Randolph 7.7 3.9 13.7 12Ritchie 12.8 5.3 26.5 8Roane ^ ^ ^ ^Summers ^ ^ ^ ^Taylor 9.6 4.0 19.1 8Tucker 9.8 2.4 27.1 4Tyler ^ ^ ^ ^Upshur 8.6 4.2 15.7 11Wayne 4.2 2.0 7.9 10Webster ^ ^ ^ ^Wetzel 14.1 7.3 24.7 13Wirt ^ ^ ^ ^Wood 7.7 5.5 10.5 41Wyoming 5.3 2.3 11.0 8
^ Statistic not displayed due to fewer than 4 cases.
Age-Adjusted Average Annual Brain & Other Nervous System Cancer Incidence Rates & 5-Year Countsby County, 2005-2009
Rates are per 100,000 and age-adjusted to the 2000 US Standard Population (19 age groups); CI=Confidence intervals (95% for rates).
36

County Rate Lower CI Upper CI 5-Year CountWest Virginia 11.5 10.9 12.3 1,138
Barbour 9.9 4.4 19.3 9Berkeley 8.9 6.4 11.9 45Boone 9.9 5.5 16.7 15Braxton 7.2 2.3 16.8 5Brooke 16.5 10.1 25.5 22Cabell 18.5 14.7 22.9 86Calhoun 12.1 3.1 31.0 4Clay 17.3 8.1 32.6 10Doddridge ^ ^ ^ ^Fayette 9.6 6.1 14.3 25Gilmer ^ ^ ^ ^Grant ^ ^ ^ ^Greenbrier 7.6 4.2 12.7 16Hampshire 13.4 7.4 22.2 15Hancock 13.4 8.5 20.2 25Hardy 17.3 8.5 31.1 11Harrison 15.7 11.9 20.4 58Jackson 16.8 10.8 24.9 26Jefferson 5.9 3.4 9.5 17Kanawha 13.1 10.9 15.5 140Lewis 5.3 1.9 12.1 6Lincoln 11.0 6.1 18.5 15Logan 15.3 10.3 21.9 31McDowell 9.9 5.3 17.0 14Marion 7.9 5.0 11.8 24Marshall 11.0 6.8 16.8 23Mason 11.3 6.2 18.9 15Mercer 9.4 6.3 13.5 31Mineral 9.5 5.0 16.4 13Mingo 7.1 3.4 13.3 10Monongalia 10.9 7.8 14.8 43Monroe 7.0 2.8 15.5 7Morgan 6.1 1.9 14.7 5Nicholas 15.4 9.4 23.8 21Ohio 24.1 17.8 31.9 54Pendleton 11.2 2.8 29.2 4Pleasants 12.4 4.0 29.9 5Pocahontas ^ ^ ^ ^Preston 11.9 7.1 18.8 19Putnam 10.4 7.1 14.7 33Raleigh 10.9 7.9 14.7 45Randolph 9.1 4.9 15.5 14Ritchie 16.6 6.9 32.9 8Roane 5.1 1.6 12.7 5Summers 11.5 5.4 22.0 10Taylor 10.3 4.6 19.9 9Tucker 18.3 6.8 39.7 7Tyler 7.5 1.8 20.8 4Upshur 15.6 9.3 24.6 19Wayne 12.7 8.4 18.6 28Webster 9.1 3.3 21.2 6Wetzel 14.1 6.7 25.7 11Wirt ^ ^ ^ ^Wood 9.6 7.0 12.9 47Wyoming 9.1 4.5 16.6 11
^ Statistic not displayed due to fewer than 4 cases.
Age-Adjusted Average Annual Thyroid Cancer Incidence Rates & 5-Year Counts by County, 2005-2009
Rates are per 100,000 and age-adjusted to the 2000 US Standard Population (19 age groups); CI=Confidence intervals (95% for rates).
37

County Rate Lower CI Upper CI 5-Year CountWest Virginia 2.8 2.5 3.2 265
Barbour ^ ^ ^ ^Berkeley 1.8 0.9 3.4 10Boone ^ ^ ^ ^Braxton ^ ^ ^ ^Brooke ^ ^ ^ ^Cabell 3.9 2.3 6.2 19Calhoun ^ ^ ^ ^Clay ^ ^ ^ ^Doddridge 0.0 0.0 11.0 0Fayette 2.8 1.1 5.9 7Gilmer ^ ^ ^ ^Grant 8.5 2.3 21.0 4Greenbrier 4.0 1.5 8.4 7Hampshire 4.1 1.1 10.4 4Hancock 5.3 2.2 10.6 8Hardy ^ ^ ^ ^Harrison 3.2 1.6 5.8 11Jackson ^ ^ ^ ^Jefferson 2.7 1.1 5.7 7Kanawha 3.7 2.5 5.1 35Lewis ^ ^ ^ ^Lincoln ^ ^ ^ ^Logan ^ ^ ^ ^McDowell 3.1 0.8 8.4 4Marion 2.7 1.1 5.4 8Marshall 4.4 1.7 9.2 7Mason 2.6 0.7 7.0 4Mercer 1.6 0.5 3.8 5Mineral ^ ^ ^ ^Mingo 3.9 1.3 9.2 5Monongalia 2.9 1.5 5.0 15Monroe ^ ^ ^ ^Morgan ^ ^ ^ ^Nicholas 4.8 1.8 10.2 7Ohio 2.9 1.0 6.3 6Pendleton 0.0 0.0 10.4 0Pleasants 0.0 0.0 10.5 0Pocahontas ^ ^ ^ ^Preston ^ ^ ^ ^Putnam 1.4 0.4 3.6 4Raleigh 2.9 1.5 5.2 12Randolph ^ ^ ^ ^Ritchie 0.0 0.0 7.5 0Roane 7.9 2.8 17.4 6Summers ^ ^ ^ ^Taylor ^ ^ ^ ^Tucker 0.0 0.0 11.7 0Tyler 0.0 0.0 8.7 0Upshur ^ ^ ^ ^Wayne 2.1 0.6 5.3 4Webster 7.7 2.0 20.5 4Wetzel ^ ^ ^ ^Wirt 0.0 0.0 13.7 0Wood 4.5 2.6 7.1 18Wyoming ^ ^ ^ ^
^ Statistic not displayed due to fewer than 4 cases.
Age-Adjusted Average Annual Hodgkin's Lymphoma Incidence Rates & 5-Year Counts by County, 2005-2009
Rates are per 100,000 and age-adjusted to the 2000 US Standard Population (19 age groups); CI=Confidence intervals (95% for rates).
38

County Rate Lower CI Upper CI 5-Year CountWest Virginia 20.1 19.2 20.9 2,224
Barbour 16.9 9.8 27.6 17Berkeley 16.6 13.1 20.7 80Boone 16.3 10.5 24.4 25Braxton 15.0 8.4 25.5 15Brooke 17.7 11.8 26.0 30Cabell 22.6 18.8 27.0 129Calhoun 27.9 14.3 49.9 13Clay 25.8 14.4 43.0 15Doddridge ^ ^ ^ ^Fayette 20.9 15.8 27.1 60Gilmer 17.7 7.6 36.8 8Grant 25.7 15.6 40.4 21Greenbrier 18.8 13.5 25.7 43Hampshire 21.5 14.3 31.1 30Hancock 26.6 20.0 34.9 57Hardy 17.3 9.6 29.3 15Harrison 21.3 17.1 26.3 92Jackson 22.7 16.2 31.1 41Jefferson 16.3 11.6 22.3 41Kanawha 21.5 18.9 24.3 259Lewis 20.8 12.7 32.1 21Lincoln 24.1 16.3 34.5 31Logan 17.6 12.3 24.5 37McDowell 16.3 10.5 24.5 25Marion 25.6 20.4 31.7 89Marshall 21.1 15.3 28.6 45Mason 19.2 13.0 27.7 31Mercer 18.8 14.8 23.8 77Mineral 29.0 21.0 39.2 45Mingo 19.0 12.5 27.7 28Monongalia 26.6 21.7 32.4 102Monroe 15.8 8.4 27.6 14Morgan 13.2 7.3 22.6 15Nicholas 21.0 14.4 29.7 34Ohio 24.8 19.3 31.4 76Pendleton 28.4 14.7 50.2 14Pleasants 19.3 8.8 37.9 9Pocahontas 7.4 1.7 21.2 4Preston 13.9 9.0 20.7 26Putnam 20.8 15.9 26.7 63Raleigh 18.0 14.4 22.3 89Randolph 21.0 14.7 29.3 37Ritchie 9.8 3.9 21.4 7Roane 16.6 9.2 27.9 15Summers 20.9 12.8 33.0 21Taylor 18.2 10.9 29.0 19Tucker 26.0 13.2 47.5 12Tyler 14.7 6.7 29.2 9Upshur 19.7 13.1 28.7 29Wayne 12.2 8.2 17.5 31Webster 12.6 5.0 26.8 7Wetzel 22.0 14.3 33.0 26Wirt 22.0 8.7 46.6 7Wood 20.4 16.8 24.7 112Wyoming 16.9 10.7 25.5 24
^ Statistic not displayed due to fewer than 4 cases.
Age-Adjusted Average Annual Non-Hodgkin's Lymphoma Incidence Rates & 5-Year Countsby County, 2005-2009
Rates are per 100,000 and age-adjusted to the 2000 US Standard Population (19 age groups); CI=Confidence intervals (95% for rates).
39

County Rate Lower CI Upper CI 5-Year CountWest Virginia 5.5 5.1 5.9 620
Barbour 6.8 2.7 14.6 7Berkeley 5.2 3.3 7.7 25Boone 3.4 1.1 8.3 5Braxton 5.0 1.6 12.5 5Brooke 2.7 0.7 7.5 4Cabell 5.4 3.7 7.6 32Calhoun 8.1 2.2 22.7 4Clay ^ ^ ^ ^Doddridge ^ ^ ^ ^Fayette 5.2 2.9 8.7 15Gilmer 0.0 0.0 11.9 0Grant ^ ^ ^ ^Greenbrier 6.2 3.5 10.5 16Hampshire 5.2 2.1 11.2 7Hancock 2.2 0.7 5.7 5Hardy 5.6 1.8 14.0 5Harrison 7.3 5.0 10.4 32Jackson 4.3 1.8 8.8 8Jefferson 7.1 4.3 11.1 20Kanawha 5.7 4.4 7.2 71Lewis ^ ^ ^ ^Lincoln 3.3 0.9 8.7 4Logan 5.0 2.5 9.2 11McDowell 5.6 2.4 11.3 8Marion 8.7 5.9 12.5 31Marshall 5.0 2.5 9.2 11Mason 3.5 1.3 8.0 6Mercer 9.4 6.7 13.0 40Mineral 7.7 4.0 13.7 12Mingo 5.2 2.2 10.6 8Monongalia 6.0 3.8 8.9 24Monroe 5.1 1.6 13.1 5Morgan 6.6 2.6 14.4 7Nicholas 5.5 2.5 10.9 9Ohio 4.3 2.3 7.4 14Pendleton ^ ^ ^ ^Pleasants ^ ^ ^ ^Pocahontas ^ ^ ^ ^Preston 6.3 3.2 11.3 12Putnam 4.8 2.7 8.1 15Raleigh 3.9 2.4 6.1 20Randolph 5.3 2.4 10.2 9Ritchie 7.3 2.3 18.3 5Roane 6.4 2.3 14.5 6Summers 6.4 2.3 15.2 6Taylor 3.7 1.0 10.2 4Tucker 7.3 2.0 21.7 4Tyler 9.8 3.6 22.8 6Upshur 5.6 2.4 11.3 8Wayne 2.7 1.1 5.7 7Webster 6.6 1.8 18.1 4Wetzel 4.3 1.4 10.8 5Wirt ^ ^ ^ ^Wood 5.6 3.8 8.0 32Wyoming 6.6 3.1 12.6 10
^ Statistic not displayed due to fewer than 4 cases.
Age-Adjusted Average Annual Myeloma Incidence Rates & 5-Year Countsby County, 2005-2009
Rates are per 100,000 and age-adjusted to the 2000 US Standard Population (19 age groups); CI=Confidence intervals (95% for rates).
40

County Rate Lower CI Upper CI 5-Year CountWest Virginia 13.8 13.1 14.6 1,482
Barbour 17.4 9.8 28.8 16Berkeley 11.5 8.6 15.1 53Boone 15.7 9.7 24.0 22Braxton 14.2 7.2 25.4 12Brooke 13.0 7.9 20.4 21Cabell 17.2 13.9 21.0 98Calhoun 18.2 7.5 37.9 8Clay 16.5 7.0 32.6 8Doddridge 13.8 4.2 33.2 5Fayette 17.4 12.7 23.3 47Gilmer 14.6 4.4 35.4 5Grant 15.3 7.4 28.5 11Greenbrier 15.1 10.2 21.5 33Hampshire 12.6 6.9 21.0 15Hancock 12.7 8.3 18.9 28Hardy ^ ^ ^ ^Harrison 13.0 9.8 17.1 55Jackson 19.6 13.5 27.8 34Jefferson 8.4 5.0 13.0 20Kanawha 14.4 12.3 16.8 173Lewis 11.3 5.5 20.6 11Lincoln 17.0 10.4 26.3 21Logan 14.7 9.6 21.4 28McDowell 11.3 6.4 18.9 16Marion 14.0 10.2 18.7 48Marshall 14.9 10.1 21.4 32Mason 17.7 11.5 26.0 27Mercer 17.3 13.3 22.3 66Mineral 11.0 6.3 17.8 17Mingo 18.6 12.1 27.4 27Monongalia 9.6 6.7 13.4 37Monroe 12.9 6.2 24.0 11Morgan 9.9 4.6 19.0 10Nicholas 13.4 8.4 20.5 23Ohio 9.5 6.5 13.6 33Pendleton 11.5 4.6 26.0 7Pleasants 11.4 3.6 27.9 5Pocahontas 10.9 4.3 24.4 7Preston 18.2 12.2 26.1 31Putnam 12.3 8.6 17.0 37Raleigh 14.9 11.5 19.0 69Randolph 13.2 8.1 20.3 22Ritchie 5.8 1.6 16.2 4Roane 15.2 7.9 26.7 13Summers 17.4 9.6 29.6 15Taylor 8.1 3.5 16.4 8Tucker 8.7 2.7 23.6 5Tyler 17.7 8.3 33.9 10Upshur 18.8 11.9 28.2 24Wayne 7.8 4.6 12.5 18Webster 17.4 8.2 33.1 10Wetzel 9.0 4.2 17.4 10Wirt 19.6 7.6 42.7 7Wood 15.1 12.0 18.9 82Wyoming 17.0 10.7 25.8 24
^ Statistic not displayed due to fewer than 4 cases.
Age-Adjusted Average Annual Leukemia Incidence Rates & 5-Year Counts by County, 2005-2009
Rates are per 100,000 and age-adjusted to the 2000 US Standard Population (19 age groups); CI=Confidence intervals (95% for rates).
41
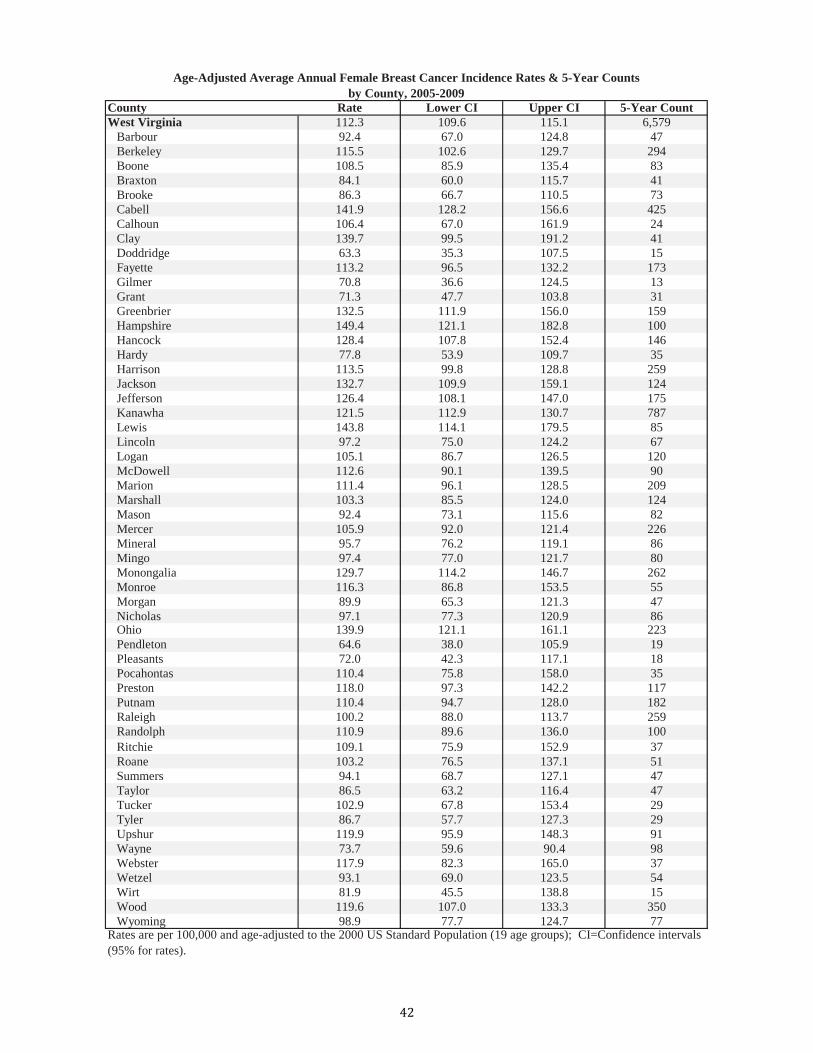
County Rate Lower CI Upper CI 5-Year CountWest Virginia 112.3 109.6 115.1 6,579
Barbour 92.4 67.0 124.8 47Berkeley 115.5 102.6 129.7 294Boone 108.5 85.9 135.4 83Braxton 84.1 60.0 115.7 41Brooke 86.3 66.7 110.5 73Cabell 141.9 128.2 156.6 425Calhoun 106.4 67.0 161.9 24Clay 139.7 99.5 191.2 41Doddridge 63.3 35.3 107.5 15Fayette 113.2 96.5 132.2 173Gilmer 70.8 36.6 124.5 13Grant 71.3 47.7 103.8 31Greenbrier 132.5 111.9 156.0 159Hampshire 149.4 121.1 182.8 100Hancock 128.4 107.8 152.4 146Hardy 77.8 53.9 109.7 35Harrison 113.5 99.8 128.8 259Jackson 132.7 109.9 159.1 124Jefferson 126.4 108.1 147.0 175Kanawha 121.5 112.9 130.7 787Lewis 143.8 114.1 179.5 85Lincoln 97.2 75.0 124.2 67Logan 105.1 86.7 126.5 120McDowell 112.6 90.1 139.5 90Marion 111.4 96.1 128.5 209Marshall 103.3 85.5 124.0 124Mason 92.4 73.1 115.6 82Mercer 105.9 92.0 121.4 226Mineral 95.7 76.2 119.1 86Mingo 97.4 77.0 121.7 80Monongalia 129.7 114.2 146.7 262Monroe 116.3 86.8 153.5 55Morgan 89.9 65.3 121.3 47Nicholas 97.1 77.3 120.9 86Ohio 139.9 121.1 161.1 223Pendleton 64.6 38.0 105.9 19Pleasants 72.0 42.3 117.1 18Pocahontas 110.4 75.8 158.0 35Preston 118.0 97.3 142.2 117Putnam 110.4 94.7 128.0 182Raleigh 100.2 88.0 113.7 259Randolph 110.9 89.6 136.0 100Ritchie 109.1 75.9 152.9 37Roane 103.2 76.5 137.1 51Summers 94.1 68.7 127.1 47Taylor 86.5 63.2 116.4 47Tucker 102.9 67.8 153.4 29Tyler 86.7 57.7 127.3 29Upshur 119.9 95.9 148.3 91Wayne 73.7 59.6 90.4 98Webster 117.9 82.3 165.0 37Wetzel 93.1 69.0 123.5 54Wirt 81.9 45.5 138.8 15Wood 119.6 107.0 133.3 350Wyoming 98.9 77.7 124.7 77
Age-Adjusted Average Annual Female Breast Cancer Incidence Rates & 5-Year Counts by County, 2005-2009
Rates are per 100,000 and age-adjusted to the 2000 US Standard Population (19 age groups); CI=Confidence intervals (95% for rates).
42

County Rate Lower CI Upper CI 5-Year CountWest Virginia 9.9 9.0 10.8 478
Barbour ^ ^ ^ ^Berkeley 7.6 4.6 11.7 20Boone 6.1 2.0 15.1 5Braxton ^ ^ ^ ^Brooke 7.7 2.4 18.6 5Cabell 10.6 6.5 16.1 22Calhoun ^ ^ ^ ^Clay ^ ^ ^ ^Doddridge 17.2 4.7 47.9 4Fayette 13.6 7.8 21.9 18Gilmer 28.7 7.0 74.4 4Grant ^ ^ ^ ^Greenbrier 10.6 4.9 20.1 10Hampshire 16.6 7.4 31.6 9Hancock 8.5 3.0 18.5 6Hardy ^ ^ ^ ^Harrison 12.2 7.7 18.5 24Jackson 8.5 3.0 18.7 6Jefferson 7.6 3.6 14.1 10Kanawha 13.0 10.0 16.6 68Lewis 19.2 8.9 36.7 10Lincoln 8.3 2.6 19.7 5Logan 9.4 4.2 18.1 9McDowell 17.4 8.7 31.3 12Marion 10.7 5.8 17.8 15Marshall 9.1 3.8 18.3 8Mason 9.5 4.0 19.6 8Mercer 10.3 5.9 16.8 17Mineral 7.7 2.7 17.5 6Mingo 11.3 4.8 22.5 8Monongalia 10.1 5.9 16.0 18Monroe ^ ^ ^ ^Morgan 11.1 3.4 27.1 5Nicholas 11.9 5.0 23.8 8Ohio 10.8 5.7 18.5 14Pendleton ^ ^ ^ ^Pleasants ^ ^ ^ ^Pocahontas ^ ^ ^ ^Preston 5.7 1.8 13.8 5Putnam 6.9 3.2 12.9 10Raleigh 8.6 5.1 13.5 20Randolph 7.6 2.6 17.2 6Ritchie ^ ^ ^ ^Roane 20.2 8.4 40.8 8Summers ^ ^ ^ ^Taylor ^ ^ ^ ^Tucker ^ ^ ^ ^Tyler ^ ^ ^ ^Upshur 12.0 5.0 24.4 8Wayne 5.5 2.0 12.2 6Webster 22.1 7.0 51.6 5Wetzel ^ ^ ^ ^Wirt ^ ^ ^ ^Wood 8.6 5.1 13.5 19Wyoming 9.0 3.2 20.1 6
^ Statistic not displayed due to fewer than 4 cases.
Age-Adjusted Average Annual Cervical Cancer Incidence Rates & 5-Year Counts by County, 2005-2009
Rates are per 100,000 and age-adjusted to the 2000 US Standard Population (19 age groups); CI=Confidence intervals (95% for rates).
43

County Rate Lower CI Upper CI 5-Year CountWest Virginia 30.0 28.5 31.4 1,753
Barbour 46.7 29.2 71.3 23Berkeley 28.7 22.5 36.0 75Boone 25.4 15.5 39.6 21Braxton 8.5 2.2 23.8 4Brooke 25.3 15.1 40.3 20Cabell 36.1 29.4 44.0 107Calhoun 30.2 11.9 65.7 7Clay 41.2 21.8 71.9 13Doddridge 21.4 7.9 51.9 6Fayette 34.7 25.8 46.0 53Gilmer 16.9 4.5 48.6 4Grant 14.0 5.6 32.0 7Greenbrier 30.2 21.0 42.5 37Hampshire 36.6 24.1 53.9 28Hancock 30.2 20.3 43.6 32Hardy 35.3 19.5 59.5 15Harrison 42.2 33.9 51.9 95Jackson 28.0 18.1 41.7 26Jefferson 20.8 13.9 29.9 30Kanawha 27.4 23.4 32.0 175Lewis 23.9 12.9 41.5 14Lincoln 26.1 15.0 42.5 17Logan 42.9 31.5 57.3 49McDowell 29.6 18.9 44.9 24Marion 27.6 20.5 36.6 53Marshall 22.9 14.5 34.7 25Mason 25.0 15.4 38.9 22Mercer 24.5 18.0 32.7 51Mineral 37.8 25.8 54.0 33Mingo 29.9 19.4 44.5 26Monongalia 28.5 21.5 37.1 58Monroe 16.9 7.7 34.3 9Morgan 38.6 24.4 59.5 23Nicholas 22.8 13.4 36.6 19Ohio 37.0 28.0 48.2 62Pendleton 27.0 10.3 60.3 7Pleasants 35.3 14.9 72.7 8Pocahontas 29.9 11.1 65.0 7Preston 33.3 22.8 47.4 33Putnam 29.4 21.8 39.0 51Raleigh 33.8 27.0 41.9 91Randolph 39.6 27.3 56.0 35Ritchie 28.5 13.5 54.9 10Roane 26.2 13.6 46.5 13Summers 24.1 12.6 43.6 13Taylor 16.7 7.5 33.2 9Tucker 34.8 15.3 71.8 9Tyler 28.9 12.9 58.0 9Upshur 31.3 19.8 47.5 24Wayne 25.5 17.6 36.1 34Webster 15.6 4.5 40.0 5Wetzel 28.3 15.8 47.6 16Wirt 29.6 9.1 73.3 5Wood 30.2 24.0 37.5 86Wyoming 32.6 20.8 49.3 25
Age-Adjusted Average Annual Corpus & Uterus, NOS Cancer Incidence Rates & 5-Year Counts by County, 2005-2009
Rates are per 100,000 and age-adjusted to the 2000 US Standard Population (19 age groups); CI=Confidence intervals (95% for rates).
44

County Rate Lower CI Upper CI 5-Year CountWest Virginia 12.8 11.9 13.8 753
Barbour ^ ^ ^ ^Berkeley 15.4 10.9 21.2 39Boone 7.8 3.1 17.0 7Braxton 14.0 6.0 29.7 8Brooke 8.0 3.1 17.9 7Cabell 18.4 13.5 24.5 51Calhoun ^ ^ ^ ^Clay 19.0 6.8 42.9 6Doddridge ^ ^ ^ ^Fayette 17.3 11.2 25.8 27Gilmer ^ ^ ^ ^Grant ^ ^ ^ ^Greenbrier 12.9 7.2 21.8 16Hampshire 23.3 12.5 39.7 14Hancock 11.6 6.3 20.5 14Hardy 14.0 5.1 31.9 6Harrison 10.8 6.9 16.3 25Jackson 6.6 2.0 15.9 5Jefferson 17.2 11.0 25.9 24Kanawha 11.8 9.3 14.9 80Lewis 19.2 9.0 36.5 10Lincoln 22.7 12.5 38.0 15Logan 8.2 3.9 15.5 10McDowell 10.3 4.7 20.7 9Marion 13.0 8.1 19.9 24Marshall 14.3 8.1 23.8 17Mason 17.9 10.2 29.8 16Mercer 13.0 8.3 19.5 27Mineral 6.5 2.3 15.1 6Mingo 13.0 6.5 23.8 11Monongalia 9.8 6.0 15.3 20Monroe 10.4 3.3 26.3 5Morgan 7.8 2.5 20.5 5Nicholas 10.7 4.8 21.1 9Ohio 11.9 7.2 19.1 20Pendleton 18.4 5.2 49.1 5Pleasants ^ ^ ^ ^Pocahontas 12.4 3.4 36.5 4Preston 12.8 6.8 22.5 13Putnam 15.2 9.7 22.7 25Raleigh 11.3 7.6 16.3 31Randolph 7.6 2.9 16.6 7Ritchie 16.7 6.0 39.1 6Roane 16.8 7.2 34.2 8Summers 9.6 3.0 25.3 5Taylor ^ ^ ^ ^Tucker ^ ^ ^ ^Tyler 18.8 4.4 49.9 4Upshur 18.2 9.8 31.4 14Wayne 7.5 3.5 14.4 10Webster 13.8 4.4 35.6 5Wetzel 14.0 5.7 29.5 8Wirt ^ ^ ^ ^Wood 15.0 10.7 20.4 43Wyoming 12.5 5.9 24.0 10
^ Statistic not displayed due to fewer than 4 cases.
Age-Adjusted Average Annual Ovarian Cancer Incidence Rates & 5-Year Counts by County, 2005-2009
Rates are per 100,000 and age-adjusted to the 2000 US Standard Population (19 age groups); CI=Confidence intervals (95% for rates).
45

County Rate Lower CI Upper CI 5-Year CountWest Virginia 138.7 135.5 142.0 7,202
Barbour 152.0 117.5 193.9 70Berkeley 133.3 118.5 149.5 318Boone 107.0 83.3 135.5 75Braxton 114.2 85.2 150.8 53Brooke 142.4 116.8 172.5 110Cabell 153.8 139.0 169.9 398Calhoun 112.4 74.2 166.0 28Clay 128.3 90.9 177.0 40Doddridge 107.8 66.0 167.2 23Fayette 107.4 90.2 127.1 142Gilmer 148.0 99.1 214.4 30Grant 101.6 74.1 137.6 46Greenbrier 136.4 115.0 160.9 149Hampshire 120.6 95.8 150.2 85Hancock 201.5 174.0 232.4 196Hardy 130.6 96.4 173.7 54Harrison 139.9 123.3 158.2 263Jackson 153.7 128.5 182.8 134Jefferson 101.8 83.7 122.6 121Kanawha 158.4 147.9 169.4 868Lewis 148.1 116.3 186.4 77Lincoln 134.2 106.2 167.5 83Logan 130.1 107.4 156.3 126McDowell 126.7 99.9 158.8 81Marion 150.6 132.2 171.1 246Marshall 141.9 119.2 168.0 143Mason 132.8 107.9 162.1 102Mercer 166.4 147.9 186.6 302Mineral 136.6 110.9 166.8 107Mingo 138.5 110.7 171.4 94Monongalia 162.1 143.6 182.4 289Monroe 158.2 122.5 202.0 69Morgan 98.8 73.4 131.0 53Nicholas 125.9 102.1 154.0 101Ohio 188.2 165.5 213.3 254Pendleton 96.1 63.7 142.1 28Pleasants 129.9 87.6 187.8 31Pocahontas 91.8 61.4 134.4 30Preston 154.7 129.6 183.4 139Putnam 141.5 122.8 162.4 217Raleigh 118.1 103.9 133.7 262Randolph 166.7 140.0 197.2 144Ritchie 118.9 83.5 165.4 39Roane 114.4 85.5 150.6 55Summers 101.1 73.6 137.4 45Taylor 110.3 82.6 144.9 55Tucker 145.3 102.0 203.9 37Tyler 121.5 86.3 168.7 40Upshur 112.4 88.5 141.0 79Wayne 75.5 60.7 93.1 93Webster 100.6 66.9 146.7 30Wetzel 197.5 161.0 240.5 107Wirt 138.6 85.6 213.5 23Wood 129.7 116.0 144.7 336Wyoming 118.3 92.9 148.9 82
Age-Adjusted Average Annual Prostate Cancer Incidence Rates & 5-Year Counts by County, 2005-2009
Rates are per 100,000 and age-adjusted to the 2000 US Standard Population (19 age groups); CI=Confidence intervals (95% for rates).
46

County Rate Lower CI Upper CI 5-Year CountWest Virginia 5.6 4.9 6.3 238
Barbour ^ ^ ^ ^Berkeley 3.9 1.8 7.2 10Boone ^ ^ ^ ^Braxton ^ ^ ^ ^Brooke ^ ^ ^ ^Cabell 4.4 2.0 8.3 9Calhoun 0.0 0.0 22.1 0Clay 0.0 0.0 15.5 0Doddridge 0.0 0.0 22.9 0Fayette 6.3 2.5 13.1 7Gilmer 0.0 0.0 24.0 0Grant 0.0 0.0 13.0 0Greenbrier 11.6 5.2 22.0 9Hampshire ^ ^ ^ ^Hancock ^ ^ ^ ^Hardy ^ ^ ^ ^Harrison 5.8 2.6 11.0 9Jackson 6.7 1.8 16.8 4Jefferson 9.9 5.1 17.5 12Kanawha 7.9 5.4 11.0 34Lewis 10.3 2.8 26.2 4Lincoln ^ ^ ^ ^Logan 9.5 4.1 19.0 8McDowell ^ ^ ^ ^Marion ^ ^ ^ ^Marshall ^ ^ ^ ^Mason ^ ^ ^ ^Mercer 2.7 0.7 7.0 4Mineral 6.6 1.8 16.9 4Mingo ^ ^ ^ ^Monongalia 7.1 3.8 12.2 14Monroe ^ ^ ^ ^Morgan ^ ^ ^ ^Nicholas ^ ^ ^ ^Ohio 9.5 4.4 17.8 10Pendleton 0.0 0.0 20.3 0Pleasants ^ ^ ^ ^Pocahontas ^ ^ ^ ^Preston ^ ^ ^ ^Putnam 3.7 1.2 8.7 5Raleigh 6.3 3.2 11.1 12Randolph 5.3 1.5 13.9 4Ritchie ^ ^ ^ ^Roane 14.6 4.6 34.2 5Summers ^ ^ ^ ^Taylor ^ ^ ^ ^Tucker ^ ^ ^ ^Tyler 0.0 0.0 17.8 0Upshur ^ ^ ^ ^Wayne 7.0 2.8 14.5 7Webster ^ ^ ^ ^Wetzel ^ ^ ^ ^Wirt 0.0 0.0 28.4 0Wood 6.8 3.7 11.6 14Wyoming 11.6 4.2 25.2 6
^ Statistic not displayed due to fewer than 4 cases.
Age-Adjusted Average Annual Testicular Cancer Incidence Rates & 5-Year Counts by County, 2005-2009
Rates are per 100,000 and age-adjusted to the 2000 US Standard Population (19 age groups); CI=Confidence intervals (95% for rates).
47

Can
cer
Site
Rat
eL
ower
C
IU
pper
C
IC
ount
Rat
eL
ower
C
IU
pper
C
IC
ount
Rat
eL
ower
C
IU
pper
C
IC
ount
All
Site
s42
4.0
415.
543
2.5
9963
463.
745
0.6
476.
850
6939
9.5
388.
041
1.1
4894
Ora
l Cav
ity &
Pha
rynx
11.3
9.9
12.7
274
17.3
14.8
19.8
196
5.9
4.6
7.2
78Es
opha
gus
4.6
3.7
5.4
113
8.8
7.0
10.6
981.
10.
51.
715
Stom
ach
5.6
4.7
6.6
134
8.3
6.6
10.1
913.
62.
54.
743
Smal
l Int
estin
e1.
61.
12.
237
1.6
0.9
2.4
191.
60.
92.
418
Col
on &
Rec
tum
41.6
38.9
44.2
973
46.5
42.3
50.7
503
37.1
33.7
40.6
470
Live
r & In
trahe
patic
Bile
Duc
t3.
93.
14.
793
5.9
4.4
7.4
632.
31.
43.
130
Gal
lbla
dder
0.9
0.5
1.3
220.
60.
11.
07
1.2
0.6
1.8
15Pa
ncre
as8.
77.
59.
920
79.
57.
611
.410
28.
16.
59.
710
5La
rynx
5.1
4.2
6.1
125
8.1
6.4
9.8
912.
81.
83.
734
Lung
& B
ronc
hus
70.4
67.0
73.8
1716
85.3
79.8
90.9
947
58.7
54.5
63.0
769
Bon
es &
Join
ts0.
50.
20.
911
0.9
0.2
1.5
8^
^^
^So
ft Ti
ssue
incl
udin
g H
eart
2.4
1.7
3.1
503.
01.
94.
129
2.0
1.1
2.8
21M
elan
oma
of th
e Sk
in18
.316
.520
.140
622
.419
.525
.423
815
.212
.817
.616
8B
reas
t57
.153
.960
.313
151.
00.
41.
611
107.
610
1.5
113.
613
04C
ervi
x U
teri
------
------
------
------
10.3
8.3
12.4
107
Cor
pus &
Ute
rus,
NO
S---
------
------
------
---26
.223
.329
.133
5O
vary
------
------
------
------
12.2
10.1
14.3
140
Pros
tate
------
------
103.
497
.410
9.4
1203
------
------
Test
is---
------
---6.
44.
78.
253
------
------
Urin
ary
Bla
dder
19.8
18.0
21.6
468
33.6
30.0
37.2
348
9.3
7.6
11.0
120
Kid
ney
& R
enal
Pel
vis
15.2
13.6
16.8
360
18.0
15.4
20.6
199
13.0
11.0
15.1
161
Bra
in &
Oth
er N
ervo
us S
yste
m5.
74.
76.
812
06.
65.
08.
366
5.1
3.6
6.5
54Th
yroi
d14
.012
.415
.728
76.
75.
18.
369
21.3
18.3
24.2
218
Hod
gkin
Lym
phom
a3.
22.
34.
057
3.7
2.4
5.0
332.
61.
53.
724
Non
-Hod
gkin
Lym
phom
a17
.515
.819
.241
018
.816
.121
.520
016
.514
.218
.821
0M
yelo
ma
4.5
3.6
5.3
109
5.4
4.0
6.8
593.
82.
74.
850
Leuk
emia
11.3
9.9
12.7
257
14.4
12.0
16.8
148
8.9
7.2
10.6
109
^ St
atis
tic n
ot d
ispl
ayed
due
to fe
wer
than
4 c
ases
.
Mal
e &
Fem
ale
Mal
eFe
mal
e
Age
-Adj
uste
d C
ance
r In
cide
nce
Rat
es (9
5% C
onfid
ence
Inte
rval
s) a
nd C
ount
s by
Sele
ct C
ance
r Si
tes,
Wes
t Vir
gini
a, 2
010
PRO
VIS
ION
AL
Rat
es a
re p
er 1
00,0
00 a
nd a
ge-a
djus
ted
to th
e 20
00 U
S St
anda
rd P
opul
atio
n (1
9 ag
e gr
oups
- C
ensu
s P25
-113
0);
Con
fiden
ce in
terv
als (
CI)
are
95%
fo
r rat
es.
48

Can
cer
Site
Rat
eL
ower
CI
Upp
er C
IR
ate
Low
er C
IU
pper
CI
All
Site
s20
7.8
205.
221
0.5
181.
318
1.1
181.
5O
ral C
avity
& P
hary
nx2.
92.
63.
22.
52.
52.
5Es
opha
gus
4.5
4.1
4.9
4.3
4.3
4.4
Stom
ach
3.0
2.7
3.4
3.7
3.7
3.8
Smal
l Int
estin
e0.
30.
20.
50.
40.
40.
4C
olon
& R
ectu
m20
.119
.320
.917
.217
.117
.2Li
ver &
Intra
hepa
tic B
ile D
uct
4.5
4.1
5.0
5.3
5.3
5.4
Gal
lbla
dder
0.7
0.6
0.9
0.6
0.6
0.6
Panc
reas
9.5
8.9
10.1
10.8
10.8
10.9
Lary
nx1.
91.
62.
21.
21.
21.
2Lu
ng &
Bro
nchu
s66
.965
.468
.451
.651
.551
.7B
ones
& Jo
ints
0.4
0.3
0.6
0.4
0.4
0.5
Soft
Tiss
ue in
clud
ing
Hea
rt1.
31.
11.
61.
31.
31.
3M
elan
oma
of th
e Sk
in3.
12.
83.
52.
72.
72.
7M
ale
and
Fem
ale
Bre
ast
13.5
12.8
14.2
13.2
13.1
13.3
Urin
ary
Bla
dder
4.9
4.5
5.3
4.4
4.3
4.4
Kid
ney
& R
enal
Pel
vis
4.7
4.3
5.1
4.0
4.0
4.1
Bra
in &
Oth
er N
ervo
us S
yste
m4.
74.
35.
14.
34.
24.
3Th
yroi
d0.
40.
30.
50.
50.
50.
5H
odgk
in L
ymph
oma
0.4
0.3
0.6
0.4
0.4
0.4
Non
-Hod
gkin
Lym
phom
a7.
87.
38.
46.
76.
76.
8M
yelo
ma
3.6
3.2
3.9
3.5
3.5
3.5
Leuk
emia
7.6
7.1
8.1
7.1
7.1
7.2
Sour
ce: T
he U
nite
d St
ates
Can
cer S
tatis
tics (
USC
S)
Age
-Adj
uste
d A
vera
ge A
nnua
l Can
cer
Mor
talit
y R
ates
(95%
Con
fiden
ce In
terv
als)
fo
r Se
lect
Can
cer
Site
s, W
est V
irgi
nia
and
Uni
ted
Stat
es, 2
004-
2008
Mal
e &
Fem
ale
Wes
t Vir
gini
aU
nite
d St
ates
Rat
es a
re p
er 1
00,0
00 a
nd a
ge-a
djus
ted
to th
e 20
00 U
S St
anda
rd P
opul
atio
n (1
9 ag
e gr
oups
- C
ensu
s P25
-113
0);
Con
fiden
ce in
terv
als (
CI)
are
95%
for r
ates
.
49

Can
cer
Site
Rat
eL
ower
CI
Upp
er C
IR
ate
Low
er C
IU
pper
CI
Rat
eL
ower
CI
Upp
er C
IR
ate
Low
er C
IU
pper
CI
All
Site
s25
7.1
252.
526
1.8
223.
122
2.7
223.
417
4.0
170.
817
7.4
153.
315
3.0
153.
5O
ral C
avity
& P
hary
nx4.
33.
85.
03.
93.
83.
91.
51.
21.
91.
41.
41.
4Es
opha
gus
8.1
7.3
9.0
7.8
7.7
7.8
1.5
1.3
1.9
1.6
1.6
1.7
Stom
ach
4.2
3.7
4.9
5.2
5.1
5.2
2.2
1.8
2.6
2.7
2.6
2.7
Smal
l Int
estin
e0.
40.
30.
70.
50.
40.
5^
^^
0.3
0.3
0.3
Col
on &
Rec
tum
24.4
22.9
25.8
20.7
20.6
20.8
16.9
15.9
18.0
14.5
14.4
14.6
Live
r & In
trahe
patic
Bile
Duc
t6.
25.
56.
97.
97.
87.
93.
12.
73.
63.
23.
23.
3G
allb
ladd
er0.
40.
30.
70.
50.
40.
51.
00.
71.
30.
80.
80.
8Pa
ncre
as11
.710
.812
.812
.512
.412
.67.
67.
08.
39.
49.
49.
5La
rynx
3.2
2.7
3.8
2.2
2.1
2.2
0.8
0.6
1.0
0.5
0.4
0.5
Lung
& B
ronc
hus
89.1
86.4
91.8
67.4
67.2
67.6
50.8
49.0
52.6
40.1
40.0
40.3
Bon
es &
Join
ts0.
50.
30.
70.
50.
50.
60.
40.
20.
60.
40.
30.
4So
ft Ti
ssue
incl
udin
g H
eart
1.7
1.3
2.1
1.5
1.4
1.5
1.1
0.8
1.4
1.1
1.1
1.2
Mel
anom
a of
the
Skin
4.5
3.9
5.2
4.0
4.0
4.1
2.1
1.7
2.5
1.7
1.7
1.7
Bre
ast
0.4
0.2
0.6
0.3
0.3
0.3
23.9
22.7
25.2
23.5
23.4
23.6
Cer
vix
Ute
ri---
------
------
---2.
92.
43.
42.
42.
42.
4C
orpu
s Ute
ri---
------
------
---2.
31.
92.
71.
91.
92.
0O
vary
------
------
------
8.9
8.1
9.6
8.4
8.4
8.5
Pros
tate
21.6
20.2
23.0
24.4
24.3
24.5
------
------
------
Test
is^
^^
0.2
0.2
0.3
------
------
------
Urin
ary
Bla
dder
8.0
7.2
8.9
7.7
7.6
7.7
2.7
2.3
3.2
2.2
2.2
2.3
Kid
ney
& R
enal
Pel
vis
6.3
5.6
7.0
5.9
5.8
5.9
3.4
2.9
3.9
2.7
2.6
2.7
Bra
in &
Oth
er N
ervo
us S
yste
m5.
54.
96.
25.
25.
25.
33.
93.
44.
53.
53.
43.
5Th
yroi
d^
^^
0.5
0.5
0.5
0.5
0.3
0.7
0.5
0.5
0.5
Hod
gkin
Lym
phom
a0.
40.
30.
70.
50.
50.
50.
40.
20.
60.
30.
30.
3N
on-H
odgk
in L
ymph
oma
9.6
8.7
10.5
8.6
8.5
8.6
6.5
5.9
7.2
5.4
5.3
5.4
Mye
lom
a4.
94.
35.
64.
44.
44.
52.
62.
23.
12.
82.
82.
9Le
ukem
ia10
.19.
211
.19.
79.
69.
75.
95.
36.
55.
45.
35.
4
^ St
atis
tic n
ot d
ispl
ayed
due
to fe
wer
than
4 c
ases
.So
urce
: Wes
t Virg
inia
Can
cer R
egis
try a
nd T
he U
nite
d St
ates
Can
cer S
tatis
tics (
USC
S)
Rat
es a
re p
er 1
00,0
00 a
nd a
ge-a
djus
ted
to th
e 20
00 U
S St
anda
rd P
opul
atio
n (1
9 ag
e gr
oups
- C
ensu
s P25
-113
0);
Con
fiden
ce in
terv
als (
CI)
are
95%
for r
ates
.
Age
-Adj
uste
d A
vera
ge A
nnua
l Can
cer
Mor
talit
y R
ates
(95%
Con
fiden
ce In
terv
als)
for
Sele
ct C
ance
r Si
tes b
y G
ende
r,
Wes
t Vir
gini
a an
d U
nite
d St
ates
, 200
4-20
08M
ale
Fem
ale
Wes
t Vir
gini
aU
nite
d St
ates
Wes
t Vir
gini
aU
nite
d St
ates
50