west fork des moines river and heron lake tmdl ... fork des moines river and . heron lake . tmdl...
TRANSCRIPT

West Fork Des Moines River and Heron Lake
TMDL Implementation Plan
September 2009
Submitted by: Heron Lake Watershed District
In cooperation with the TMDL Advisory and Technical Committees
wq-iw7-13c

Preface
This implementation plan was written by the Heron Lake Watershed District (HLWD), with the assistance of the Advisory Committee, and Technical Committee, and guidance from the Minnesota Pollution Control Agency (MPCA) based on the report West Fork Des Moines River Watershed Total Maximum Daily Load Final Report: Excess Nutrients (North and South Heron Lake), Turbidity, and Fecal Coliform Bacteria Impairments. Advisory Committee and Technical Committee members that helped develop this plan are: Advisory Committee Karen Johansen City of Currie Jeff Like Taylor Co-op Clark Lingbeek Pheasants Forever Don Louwagie Minnesota Soybean Growers Rich Perrine Martin County SWCD Randy Schmitz City of Brewster Michael Hanson Cottonwood County Tom Kresko Minnesota Department of Natural Resources - Windom Technical Committee Kelli Daberkow Minnesota Pollution Control Agency Jan Voit Heron Lake Watershed District Ross Behrends Heron Lake Watershed District Melanie Raine Heron Lake Watershed District Wayne Smith Nobles County Gordon Olson Jackson County Chris Hansen Murray County Pam Flitter Martin County Roger Schroeder Lyon County Kyle Krier Pipestone County and Soil and Water Conservation District Ed Lenz Nobles Soil and Water Conservation District Brian Nyborg Jackson Soil and Water Conservation District Howard Konkol Murray Soil and Water Conservation District Kay Clark Cottonwood Soil and Water Conservation District Rose Anderson Lyon Soil and Water Conservation District Kathy Smith Martin Soil and Water Conservation District Steve Beckel City of Jackson Mike Haugen City of Windom Jason Rossow City of Lakefield Kevin Nelson City of Okabena Dwayne Haffield City of Worthington Bob Krebs Swift Brands, Inc. Mark Vaniman United States Fish and Wildlife Service Lucas Youngsma Department of Natural Resources – Marshall Randy Markl Department of Natural Resources – Windom Todd Kolander Department of Natural Resources – Mankato Judy Markl Department of Natural Resources - Talcot Lake WMA Matt Drewitz Board of Water and Soil Resources Stephanie McLain Natural Resources Conservation Service – Nobles County

Joel Poppe Natural Resources Conservation Service – Jackson County Brian Christiansen Natural Resources Conservation Service – Murray County April Sullivan Natural Resources Conservation Service – Cottonwood County Carissa Spencer Natural Resources Conservation Service – Martin County Jerry Purdin Natural Resources Conservation Service – Pipestone County Jamie Thomazin Natural Resources Conservation Service – Lyon County Don Hagen Silver Lake Watershed Coordinator

Table of Contents
Preface ............................................................................................................................................. 2 1.0 Implementation Plan Executive Summary ................................................................................ 5 2.0 TMDL Report Summary ........................................................................................................... 6
2.1 Project History ....................................................................................................................... 6 2.2 Watershed Characteristics ..................................................................................................... 6 2.3 Impairments ........................................................................................................................... 7 2.4 Sources of Impairments ......................................................................................................... 8 2.5 Measurable Water Quality Goals ........................................................................................ 13 2.6 Wasteload and Load Allocations ......................................................................................... 15
3.0 Priority Management Areas .................................................................................................... 17 4.0 Stakeholder Input Process ....................................................................................................... 17 5.0 Nonpoint Source Management Actions and Analysis ............................................................ 20
5.1.1 Evaluation of Management Actions for Bacteria ............................................................. 20 5.2.2 Selection of Bacteria Actions ........................................................................................... 27 5.3.1 Evaluation of Management Actions for Turbidity ........................................................... 27 5.3.2 Selection of Turbidity Actions ......................................................................................... 32 5.4.1 Evaluation of Management Actions for Excess Nutrients ................................................ 32 5.4.2 Selection of Excess Nutrients Actions.............................................................................. 36 5.5.1 Evaluation of Additional Management Actions ............................................................... 37 5.5.2 Selection of Additional Actions ....................................................................................... 38
6.0 Point Source Management Actions and Analysis ................................................................... 40 6.1 Stakeholder Input Process ................................................................................................... 40 6.2 SSTS/Unsewered Communities .......................................................................................... 40 6.3 Municipal Separate Storm Sewer System (MS4) ................................................................ 41 6.3.1 Stormwater Management Strategy ................................................................................... 42 6.3.2 Tracking and Verification Monitoring ............................................................................. 45 6.3.3 General Compliance Schedule.......................................................................................... 45 6.4 WWTFs ............................................................................................................................... 46 6.5 Selection of Point Source Actions ....................................................................................... 46
7.0 Identification and Summary of Implementation Objectives and Action Items ...................... 46 Objective 1. Protect banks from erosion and runoff through buffer programs ......................... 46 Objective 2. Address Nonpoint Source Pollution through cropland changes ........................... 47 Objective 3. Provide flood storage opportunities ...................................................................... 49 Objective 4. Feedlot Management ............................................................................................. 50 Objective 5. Initiate Urban BMP Programs ............................................................................... 51 Objective 6. Address In-lake Phosphorus Loading in Heron Lake ........................................... 52 Objective 7. Address Point Source Pollution ............................................................................ 52 Objective 8. Provide Educational Opportunities ....................................................................... 53 Objective 9. Effectiveness Monitoring ...................................................................................... 56 Objective 10. Project Administration ........................................................................................ 59
8.0 Roles and Responsibilities of Project Partners ....................................................................... 61 9.0 Timeline .................................................................................................................................. 62 10.0 Adaptive Management Process ............................................................................................. 64 11.0 Budget ................................................................................................................................... 65 Appendices .................................................................................................................................... 67

1.0 Implementation Plan Executive Summary In 2003, the MPCA, Cottonwood County, and HLWD made the determination that it was in the best interests of both local organizations to conduct a Total Maximum Daily Load (TMDL) study in partnership. Initial efforts were conducted through a Clean Water Partnership Grant. In 2005, Barr Engineering was hired to write the TMDL Report. EPA approved the TMDL assessment in December 2008. Section 2 of this plan summarizes the findings of the TMDL assessment. To meet the water quality goals, a 10 percent to 86 percent reduction in bacteria, a 20 percent to 90 percent reduction in turbidity, and a 79 percent reduction in phosphorus is needed. The full report can be found online at http://www.pca.state.mn.us/water/tmdl/project-westforkdesmoines.html. Throughout the project, an Advisory Committee and a Technical Committee assisted in providing input and information. On February 12, 2009, the kickoff meeting was held to bring all participants to the same level of understanding of the TMDL process. On March 5, 2009, the committees met to receive information about fecal coliform bacteria, identify action strategies, and conduct a ballot vote for the two best actions to address bacteria. On March 26, 2009, the committees met to receive a summary of the fecal coliform bacteria meeting, learn about turbidity, identify action strategies, and conduct a ballot vote on the two best actions to address turbidity. On April 7, 2009, North and South Heron Lake riparian landowners were invited to receive information about the TMDL Report and excess nutrients and provide input regarding acceptable actions to address water quality problems in both the watershed and the lake system. On April 16, 2009, the committees met to receive a summary of the turbidity meeting, learn about excess nutrients and the TMDL report implications, identify action strategies, and conduct a ballot vote on the two best actions to address phosphorus. On April 27, 2009, water plan coordinators and SWCD staff met to review the voting results and make recommendations regarding the chosen actions and staffing needs. On May 21, 2009, the committees met to review the draft plan and provide direction regarding chosen actions and additional actions needed. It was important to engage the public in this process through newsletters, newspaper articles, and the HLWD and MPCA websites. Detailed information regarding this process is explained in Sections 4, Appendix 2 through Appendix 7, and also in Appendix 8. Section 5 and 6 list 123 actions that were identified through the meetings as potential strategies to address the impairments. Section 7 is the direct result of the ballot voting and discussion of action items. Roles and responsibilities will change with each action item depending on the project and are explained in Section 8, along with a listing of the project partners. Section 9 lays out a ten-year timeline for the project. Probability of successfully completing the action items in the plan will depend on funding. The success of this plan will also rely on the adaptability as described in Section 10. An annual meeting of the Advisory and Technical Committees is planned to review project progress, water quality data, and new information that may develop. The WFDMR TMDL Implementation Plan has a total dollar figure of $63,196,802.50 if all action items were funded with $23,407,845.00 cash, $22,188,957.50 in kind, and $17,600,000.00 in loans (Section 11).

2.0 TMDL Report Summary
2.1 Project History In 2003, the MPCA, Cottonwood County, and HLWD made the determination that it was in the best interests of both local organizations to conduct a Total Maximum Daily Load (TMDL) study in partnership. Cottonwood County became the local lead agency for the WFDMR TMDL Study. The HLWD’s role was to assist in public education efforts. Houston Engineering was hired to develop the TMDL, but due to contracting issues, the contract was terminated. In 2005, Barr Engineering was hired to write the TMDL. Also at that time, Cottonwood County hired a watershed coordinator. An Advisory committee was developed and three meetings were held. Two public meetings were also held. Cottonwood County and the HLWD worked together to prepare, conduct, and summarize the meetings. The West Fork Des Moines River Watershed Total Maximum Daily Load Final Report: Excess Nutrients (North and South Heron Lake), Turbidity, and Fecal Coliform Bacteria Impairments (referred to TMDL Report from this point forward) was completed and submitted to the Environmental Protection Agency (EPA) in October 2008. The TMDL Report was approved by EPA on December 18, 2008.
2.2 Watershed Characteristics The WFDMR watershed is located in southwestern Minnesota and is a part of the Western Corn Belt Plains and Northern Glaciated Plans ecoregions. The watershed extends across seven counties: Murray, Cottonwood, Jackson, and Nobles, and a small portion of Pipestone, Lyon, and Martin. It covers an area of 1,333 square miles. The river originates in the northwestern part of the watershed from several lakes including its principal source, Lake Shetek. The WFDMR flows from the Lake Shetek outlet near Currie in a southeasterly direction for 94 miles to the Minnesota/Iowa border and eventually enters the Mississippi River at Keokuk, Iowa. Although the WFDMR has not gone through significant channelization, other alterations to the waterbody have occurred in the form of dams, which are located at several locations along the WFDMR. These include dams at the lower ends of Lake Shetek and Talcot Lake and in the cities of Windom and Jackson. Smaller dams include those on the outlets of North Heron Lake, Fulda Lakes, the Graham Lakes, and a fish barrier on the Heron Lake outlet. The river is mainly slow, flat water, except for some moderate rapids near Kilen Woods State Park. The overall gradient from the Talcot Lake dam to the City of Jackson is approximately 2.1 feet per mile. The WFDMR is used for fishing, hunting, and canoeing in the summer and snowmobiling and ice fishing in the winter. The dominant land use in the WFDMR watershed is row crop agriculture (approximately 85.5 percent), with 9.5 percent pasture/open, 3 percent water/marsh, 1.5 percent urban, and 0.5 percent forested. Land adjacent to the stream is utilized for pasture, cropland, urban development, and recreation. The population of the watershed is 22,069 with approximately 8,828 households based on US Census and county estimates. The annual average precipitation

on the watershed ranges from 25 to 29 inches along the northwest to northeast gradient. Runoff patterns also increase along the same gradient. North Heron Lake and South Heron Lake were once a nationally recognized migratory waterfowl habitat with over 700,000 staging canvasbacks, 50,000 nesting Franklin’s gulls, and large numbers of other birds. Today the lake is primarily used by smaller flocks of mallards and other puddle ducks, mainly for refuge during migration.
2.3 Impairments 2.3.1 Fecal Coliform Bacteria The MPCA listed 15 stream reaches in the WFDMR watershed as impaired for fecal coliform bacteria (a human health concern that limits recreational use of the water) on the 2002, 2004, and 2006 Impaired Waters Lists. Table 1 lists the 15 reaches that were addressed in the TMDL Report. Data used for assessment was collected through several endeavors from 1994-2004. Table 1: Fecal Coliform Bacteria Impairments
REACH DESCRIPTION YR LIST UNIT ID 1 Beaver Creek CD 20 to Des Moines R 02 07100001-503 2 County Ditch 20 Headwaters to Beaver Cr 02 07100001-504 3 Des Moines River Beaver Cr to Lime Cr 04 07100001-546 4 Des Moines River Lime Cr to Heron Lk Outlet 04 07100001-533 5 Des Moines River Windom Dam to Jackson Dam 04 07100001-501 6 Des Moines River JD 66 to IA border 04 07100002-501 7 Elk Creek Headwaters to Okabena Cr 06 07100001-507 8 Jack Creek JD 26 to Heron Lk 06 07100001-509 9 Lake Shetek Inlet Headwaters to Lk Shetek 02 07100001-502 10 Lime Creek Lime Lk to Des Moines R 04 07100001-535
11 Lower Lk Sarah Outlet Unnamed Cr on Lk Sarah Outlet to Lk Shetek inlet 02 07100001-508
12 Okabena Creek Elk Cr to South Heron Lk 06 07100001-506 13 Unnamed Creek Unnamed Cr to Lk Shetek 02 07100001-519 14 Unnamed Creek Unnamed Cr to Unnamed Cr 02 07100001-517 15 Upper Lk Sarah Outlet Lk Sarah Outlet to first Unnamed Cr 02 07100001-513

2.3.2 Turbidity The MPCA listed 15 stream reaches in the WFDMR watershed as impaired for turbidity (a measure of cloudiness of water that affects aquatic life) on the 2002, 2004, and 2006 impaired waters lists. Table 2 lists the 15 reaches that were addressed in the TMDL Report. Data used for assessment was collected through several endeavors from 1994-2004. Table 2: Turbidity Impairments
REACH DESCRIPTION YR LIST UNIT ID 1 Beaver Creek CD 20 to Des Moines R 04 07100001-503 2 Des Moines River Beaver Cr to Lime Cr 04 07100001-546 3 Des Moines River Lime Cr to Heron Lk Outlet 04 07100001-533 4 Des Moines River Windom Dam to Jackson Dam 98 07100001-501 5 Des Moines River Jackson Dam to JD 66 02 07100001-541 6 Des Moines River JD 66 to IA border 02 07100002-501 7 Des Moines River Heron Lk Outlet to Windom Dam 06 07100001-524 8 Des Moines River Lk Shetek to Beaver Cr 06 07100001-545 9 Division Creek Heron Lk to Okabena Cr 06 07100001-529 10 Elk Creek Headwaters to Okabena Cr 06 07100001-507 11 Heron Lake Outlet Heron Lk (32-0057-01) to Des Moines R 06 07100001-527 12 Jack Creek JD 26 to Heron Lk 06 07100001-509 13 Jack Creek, North Branch Headwaters to Jack Cr 06 07100001-505 14 Lime Creek Lime Lk to Des Moines R 04 07100001-535 15 Okabena Creek Elk Cr to South Heron Lk 06 07100001-506 2.3.3 Excess Nutrients The MPCA listed North Heron Lake and South Heron Lake as impaired due to excess nutrients (which limits both its recreational use and ecological/wildlife function) in 2006. Related to the Heron Lake nutrient impairment is a listing for pH in the Heron Lake outlet. Data used for assessment was collected through several endeavors from 1992-2002. Table 3: pH and Excess Nutrient Impairments IMPAIRMENT REACH DESCRIPTION YEAR
LISTED ASSESSMENT UNIT ID
/ DNR LAKE #
1 pH Heron Lake Outlet
Heron Lk (32-0057-01) to Des Moines R 06 07100001-527
2 Excess Nutrients North Heron Lake 02 32-0057-05
3 Excess Nutrients South Heron Lake 02 32-0057-07
2.4 Sources of Impairments 2.4.1 Bacteria The dominant factors for levels of fecal coliform bacteria (will be referred to as bacteria from this point forward) are time of year and occurrence of runoff-producing rainfall events. Both summer samples and wet samples were much higher than spring samples and dry samples, respectively; often five to ten times higher. Regarding the seasonal differences, spring geometric means were well below the 200 organisms/100 mL standard and summer values were generally above it. Explanations for seasonal differences likely include a greater percentage of wet sampling days during summer versus the spring and the growth of bacteria in sediments and riparian areas during summer months. Elevated summer-dry values may be indicative of contributions by a continuous-type source that is present mainly in the summer (e.g., cattle

in/near streams) and/or warmer temperatures. In addition, many sites showed a significant percent exceedence of the 2,000 organisms/100 mL portion of the standard. According to the TMDL Report, there are four sources of bacteria: humans, wildlife, pets, and livestock. The sources were derived from the 2000 US census data separated between rural and community residents, the Minnesota Department of Natural Resources (DNR) – Wildlife Section, the American Veterinary Medical Association, and from county feedlot inventories respectively. The amount of bacteria produced daily by each animal type was obtained from a variety of sources, which are all recommended in EPA’s guidance document Protocol for Developing Pathogen TMDLs. The estimated bacteria produced from each source is shown in Table 4. Table 4: Bacteria Production by Source
Type Percent Type Percent Pets 0.3% Dairy 2% Wildlife 0.2% Poultry 0.1% Humans 0.3% Sheep 8% Beef 32% Horse 0.1% Swine 57%
The total bacteria produced by each source type were categorized by application type/method. For humans, this meant calculating the number of people that had adequately treated and inadequately treated wastewater for both rural and urban populations. For livestock, assumptions were based on professional judgment by county staff. Livestock assumptions were divided into five categories: feedlots or stockpiles without runoff controls, overgrazed pasture near streams or waterways, other pasture, surface-applied manure to fields, and incorporated/injected manure in fields. The assumptions were then paired with bacteria estimates to calculate loads. Table 5 illustrates the estimated delivery potential by county. Livestock-related activities show the greatest potential due to the shear amount of bacteria produced versus humans, wildlife, or pets, although inadequate septic systems show a contribution during dry periods.

Table 5: Bacteria Delivery Potential by County “very low to none” (less than 1%) “moderate” (5-20%) “low” (1-5%) “high” (greater than 20%)
Nobles County Cottonwood County
Source Spr-wet
Spr-dry
Sum-wet
Sum-dry
Spr-wet
Spr-dry
Sum-wet
Sum-dry
Feedlots or stockpiles without runoff controls Overgrazed pasture near streams or waterways
Other pasture
Surface-applied manure Incorporated / injected manure Failing / inadequate septic systems
Deer + other wildlife Dogs+cats in city—waste not collected Dogs and cats outside city
Jackson County Murray County
Source Spr-wet
Spr-dry
Sum-wet
Sum-dry
Spr-wet
Spr-dry
Sum-wet
Sum-dry
Feedlots or stockpiles without runoff controls Overgrazed pasture near streams or waterways
Other pasture
Surface-applied manure Incorporated / injected manure Failing / inadequate septic systems
Deer + other wildlife Dogs+cats in city—waste not collected Dogs and cats outside city
2.4.2 Turbidity Conclusions regarding turbidity sources were based largely on analysis/interpretation of the available data and information. Various sources of information used in the analysis include water quality data, soils and land use information. A comparison of historical data indicates about 40 percent of the water yield at the United States Geological Survey station in Jackson is related to anthropogenic sources. A simplified turbidity conceptual model was used to identify
several possible sources and pathways. The following is a list of external and internal sources. It should be noted that the internal sources are usually related to external sources.
External Sources • • Feedlots with pollution hazards • Livestock in riparian zone • Row cropland • Ditches/channelization • Impervious surfaces • Permitted point sources • Carp Internal Sources Channel scour • Algal growth and decay
Feedlots with pollution hazards present a low contribution but there are feedlots that have pollution potential. Livestock in the riparian zone is also minimal, but there are pastures that may be contributing to the problem. Ninety-seven percent of the cropland in the watershed is a corn/soybean rotation. The use of drainage through ditches and channelization can lead to increased water movement through waterways resulting in bank erosion and ditch cleanouts contributing to turbidity. Impervious surfaces can cause turbidity issues from increased runoff similar to ditches and/or channelizations. This was deemed a low contribution source because of the small area of impervious surfaces. Point sources, i.e. wastewater treatment facilities, have specified limits of total suspended solids that can be discharged. Violations of the limits do occur, but for the most part are a minor source. Another point source, stormwater from construction or industrial facilities, is usually short-term and provides minor contribution. Benthic feeders such as carp may have a profound effect on turbidity issues in the water but it is difficult to gage the relative impact. 2.4.3 Excess Nutrients The excess nutrients water quality standard mainly looks at phosphorus, a limiting nutrient in Minnesota. The TMDL Report used water quality data, other information, and simple modeling to estimate in-lake and watershed sources of phosphorus. The delivery of phosphorus to surface waters in the watershed was also determined. The following is a list of potential sources of phosphorus to Heron Lake. Point Sources (NPDES permittees)
• • Wastewater Treatment Facilities • Municipal Stormwater • Construction Stormwater

• Industrial Stormwater • Livestock facilities (greater than 1,000 animal units)
Nonpoint Sources
• • Inadequate Septics • Row Cropland • Feedlots • Atmospheric Deposition • Urban Runoff • Rural runoff • Deicing chemicals • Streambank Erosion
Internal Loading
• • Carp • Wind
There are five wastewater treatment facilities that discharge to Heron Lake. Currently, the Brewster, Worthington Industrial, and Worthington Municipal WWTFs are the only facilities with discharge limits for phosphorus (1 mg/L monthly average maximum). In the watershed, Worthington is the only permitted community for stormwater. Construction and industrial stormwater activities are minimal in this agriculturally-dominated watershed. Construction stormwater without proper runoff controls can contribute sediment and phosphorus but usually is a minor impact. Large feedlots, which require a National Pollutant Discharge Elimination System (NPDES) permit, have a zero discharge permit limit. Manure application from NPDES facilities is addressed in the Section 5. The TMDL Report provided estimates for source contributions from both WWTF and other sources of phosphorus during dry, average, and wet flow conditions. The estimated relative phosphorus contributions, other than WWTFs, were applied during an average year. Cropland and pasture runoff (62.3%) accounted for a significant portion of the phosphorus load. The following are other phosphorus sources ranked from highest to lowest percent contribution: streambank erosion (12.0%), atmospheric deposition (9.0%), urban runoff (5.3%), inadequate septics (3.1%), rural runoff (3.0%), feedlots (2.8%), and deicing chemicals (2.5%). During a dry year, SSTS (5.2%), urban runoff (7.6%), atmospheric deposition (12.5%), and agricultural runoff (67%) become more prominent sources of phosphorus, while streambank erosion (33%) becomes more prominent during a wet year. Other sources of phosphorus loading to Heron Lake include internal sediment phosphorus release, wind resuspension, carp, and other benthic feeders that stir up fine sediments. It is difficult to gage the relative impact of these internal sources, but under current conditions, these sources as a whole represent a larger source of phosphorus than the watershed loading to North Heron Lake and South Heron Lake.

2.5 Measurable Water Quality Goals 2.5.1 Bacteria The water quality standard for Class 2B streams for bacteria is as follows:
organisms not to exceed 200 organisms per 100 milliliters (org/100 mL) as a geometric mean of not less than five samples in any calendar month, nor shall more than ten percent of all samples taken during any calendar month individually exceed 2,000 org/100 mL.
The standard applies only between April 1 and October 31. Recently, the bacteria water quality standard was changed from fecal coliform bacteria to E. coli. The fecal coliform bacteria standard of 200 org/100 mL is roughly equivalent to 126 org/100 mL of E. coli bacteria. Therefore, to adapt the fecal coliform bacteria TMDL allocations based on future E. coli standards, a multiplication factor of 0.63 is needed. Future monitoring will utilize the E. coli water quality standards geometric mean of 126 org/100 mL and 1,260 org/100mL. In order to determine percent reduction needed to meet the water quality standard, a simple equation is used and shown below. Table 6 shows the percent reduction needed by reach where adequate data was available. It is evident that the bacteria issue is watershed wide.
summer geomean-water quality standard
Table 6: Percent Reduction Needed by Impaired Reach
REACH DESCRIPTION ASSESSMENT UNIT ID
PERCENT REDUCTION
NEEDED 1 Beaver Creek CD 20 to Des Moines R 07100001-503 74 2 County Ditch 20 Headwaters to Beaver Cr 07100001-504 * 3 Des Moines River Beaver Cr to Lime Cr 07100001-546 71 4 Des Moines River Lime Cr to Heron Lk Outlet 07100001-533 35 5 Des Moines River Windom Dam to Jackson Dam 07100001-501 10 6 Des Moines River JD 66 to IA border 07100002-501 52 7 Elk Creek Headwaters to Okabena Cr 07100001-507 76 8 Jack Creek JD 26 to Heron Lk 07100001-509 62 9 Lake Shetek Inlet Headwaters to Lk Shetek 07100001-502 * 10 Lime Creek Lime Lk to Des Moines R 07100001-535 63
11 Lower Lake Sarah Outlet Unnamed Cr on Lk Sarah Outlet to Lk Shetek inlet 07100001-508 86
12 Okabena Creek Elk Cr to South Heron Lk 07100001-506 51 13 Unnamed Creek Unnamed Cr to Lk Shetek 07100001-519 86 14 Unnamed Creek Unnamed Cr to Unnamed Cr 07100001-517 84 15 Upper Lake Sarah Outlet Lk Sarah Outlet to first Unnamed Cr 07100001-513 * *No reductions calculated because of the limited dataset. 2.5.2 Turbidity
summer geomean
X 100 = percent reduction

The water quality standard for Class 2B streams for turbidity is 25 nephelometric turbidity units (NTU). Total suspended solids (TSS) and transparency (using a transparency tube) are two surrogates that can also be used. A TSS surrogate was used in the TMDL Report. To determine the TSS equivalent to the turbidity standard for the individual reaches, paired turbidity and TSS samples were compiled. Table 7 presents the surrogate standard for each of the impaired reaches. For a percent reduction, the 90th percentile TSS load for the flow regimes was compared to a loading capacity at the mid-point of each flow regime. Table 7 also shows the range of reductions needed for the specified flow regimes. The data indicate that the greatest reductions in TSS load will need to occur during higher flow periods. Table7 : Turbidity Reductions and TSS Surrogate
REACH DESCRIPTION UNIT ID
TSS-NTU SURROGATE
PERCENT REDUCTIONS
FLOW ZONES
1 Beaver Creek
CD 20 to Des Moines R 503 71 65-95 High to Mid-
range
2 Des Moines River
Beaver Cr to Lime Cr 546 73 60-75 High flows-Dry
conditions
3 Des Moines River
Lime Cr to Heron Lk Outlet 533 58 5-75 High flows-Dry
conditions
4 Des Moines River
Windom Dam to Jackson Dam 501 66 40-60 High flows-Dry
conditions
5 Des Moines River
Jackson Dam to JD 66 541 50 40-90 High flows-Dry
conditions
6 Des Moines River JD 66 to IA border 501 50 40-80 High flows-Dry
conditions
7 Des Moines River
Heron Lk Outlet to Windom Dam 524 54 30-55 High flows-Dry
conditions
8 Des Moines River
Lk Shetek to Beaver Cr 545 60 30-80 High to Mid-
range
9 Division Creek
Heron Lk to Okabena Cr 529 62 20-75 High flows-Low
conditions
10 Elk Creek Headwaters to Okabena Cr 507 62 50-75 Moist-Low
conditions
11 Heron Lake Outlet
Heron Lk (32-0057-01) to Des Moines 527 59 60-95 Moist-Low
conditions
12 Jack Creek JD 26 to Heron Lk 509 59 40-90 High flows-Low conditions
13 Jack Creek, N. Branch
Headwaters to Jack Cr 505 57 20-30 High flows-Dry
conditions
14 Lime Creek Lime Lk to Des Moines R 535 54 80-85 High flows-Low
conditions
15 Okabena Creek
Elk Cr to South Heron Lk 506 62 25-90 High flows-Low
conditions 2.5.3 Excess Nutrients Excessive phosphorus causes increased algae blooms and reduced transparency, which may significantly impair or prohibit the use of lakes for ecological and recreational use. The excessive nutrient water quality standard was recently changed to account for lake and regional differences. The new standard for a shallow lake system in the Western Corn Belt Plains

Ecoregion, is a total phosphorus concentration less than or equal to 90 µg/L, chlorophyll-a concentration less than or equal to 30 µg/L, and Secchi disc transparency greater than or equal to 0.7 meters (2.3 feet). Both North Heron Lake and South Heron Lake are shallow lakes in the Western Corn Belt Plains Ecoregion. North Heron Lake is less than five feet deep, while South Heron Lake does not exceed 12 feet deep. Based on 2006 data, a 79 percent phosphorus reduction is needed to meet the water quality standard (Table 8). Table 8: Current Phosphorus Loading and Percent Reduction Needed
Heron Lake Phosphorus Loading Summary May-September, 2006 Conditions
Source Category Current/Observed (pounds) Wastewater Treatment Facilities 4,075 Nonpoint Sources/Stormwater Runoff 37,182 Internal Loading 153,286 Total 194,543 Target Load 25,421 Percent Reduction Needed 79%
2.6 Wasteload and Load Allocations The allocation tables are not presented here to conserve space but can be viewed in the TMDL Report. It should be noted that through data analysis and modeling, the cities of Worthington, Okabena, Lakefield, and Brewster and Swift Brands, Inc. that have WWTF discharge to Heron Lake will have new phosphorus discharge limits. For the period from February through September, all five facilities will meet a total phosphorus load limit consistent with an average effluent concentration of 0.4 mg/L. Between October and January, a 1 mg/L phosphorus permit effluent limit will be in effect. The WWTFs have several years (2-3 permit cycles) to meet the new effluent limits.

3.0 Priority Management Areas It is apparent from the current data that the bacteria and turbidity impairments are watershed wide. Given that these impairments are inherent throughout the watershed, the focus for implementation and education will be done on a watershed basis. Many of the actions selected for addressing bacteria and turbidity will also address the upland component of the excess nutrients impairment on Heron Lake. Depending on funding sources, requirements, and availability, projects on a subwatershed basis may be needed. This will be determined as opportunities are presented. Committee members stressed the importance of making wetland restorations and flood storage projects a high priority. They also indicated that it would be important to ensure that projects are at least 45 years or perpetual in length. These suggestions will be taken into account when funding is sought.
4.0 Stakeholder Input Process

Local project staff gathered information and ideas from other groups across Minnesota currently working with stakeholders. Cottonwood County and HLWD developed a plan for including stakeholders in the WFDMR TMDL Study process in 2004. The strategy, accepted by MPCA, included developing an advisory committee to obtain input, educate members, and publicize the project. With this committee, HLWD and Cottonwood County wanted to get a wide cross section of all the potential stakeholders that may be affected by the TMDL. Considerable time and effort was spent determining the best way to fairly select advisory committee members. The strategy enlisted assistance from local government entities. The seven counties and seven SWCDs in the WFDMR watershed were contacted to nominate members. It was determined that representation from cities, agriculture, industries, environment, and government would all be needed on the Advisory Committee for balanced representation. There was some difficulty in getting nominations from the counties and SWCDs within the smaller portions of the watershed. Cottonwood County and HLWD then chose the members based on location and entity represented. Cottonwood County contacted the selected individuals. Since the project began, there have been changes in the Advisory Committee membership related to lack of interest, political changes, and nominating confusion. The current Advisory Committee members include representatives from Taylor Co-op, the City of Currie, City of Brewster, DNR, Pheasants Forever, Minnesota Soybean Growers, Martin SWCD, and Cottonwood County. Contact information can be found in Appendix 1. The varied interests of members has proven successful in providing discussion, ideas, and input to the TMDL process. In addition, this structure and committee development provided an opportunity for relationship building and educational opportunities with new partners. Once the TMDL Report was finalized, Cottonwood County, HLWD, and the MPCA met to establish the process for developing an implementation plan. It was determined that HLWD would lead the process and be responsible for writing the plan. Input would be gathered from the existing advisory committee. In addition, it was also decided that the technical conservation agencies in the watershed should be included in implementation plan development. It was tentatively decided that meetings would be held early in 2009 with the goal for implementation plan approval by fall of 2009. The Cottonwood, Nobles, Jackson, and Murray counties environmental officers convened to provide input to the proposed process. In early 2009, HLWD requested assistance and participation from the technical conservation agencies. Technical Committee members include a representative from each of the SWCDs, Natural Resources Conservation Service (NRCS), and County Water Plan Coordinators in the seven counties of the watershed. In addition, there are representatives from the cities of Lakefield, Jackson, Windom, Worthington, and Okabena; DNR in Windom, Talcot Lake, Marshall, Slayton, and Mankato; Swift and Company; Board of Water and Soil Resources (BWSR); US Fish and Wildlife Service (USFWS); and the Silver Lake Watershed in Iowa. Contact information can be found in Appendix 1. On February 12, 2009, the Advisory Committee met in the morning and the Technical Committee met in the afternoon. The purpose of the meetings was to update members on the TMDL Study process, lay the groundwork for implementation planning, and review the TMDL Report. A binder with the TMDL report, information regarding common conservation practices, research, and other resources was provided to each committee member. Meeting handouts, presentations, and minutes can be found in Appendix 2.

On March 5, 2009, the committees met to review the bacteria portion of the TMDL Report, and receive presentations regarding septic systems, conservation programs, and feedlot rules. The committees were split into five-member groups and asked to develop a list of measures and actions that address bacteria. The measures and actions were presented to the entire group and each member voted on the top two measures and actions that they felt would address the bacteria impairment. In reviewing the votes, it was difficult for HLWD to quantify actions to address the identified measures. In addition, there were 102 votes submitted; based on the members present, there should have only been 44 votes. An evaluation of the original process yielded a change to the voting that took place. This change in the process was implemented throughout the remaining meetings. The local project staff realized more detailed actions were needed before it was possible to begin writing the plan. To gather more information, the measures and actions were compiled and a request was sent to meeting participants for further information about each action. That information was returned to the HLWD office by Friday, March 13, 2009. The information that was returned was redistributed to each meeting participant. The participants were then asked to re-vote for their top two measures and actions. Votes were returned to the HLWD office by March 19, 2009. Meeting handouts, presentations, and minutes can be found in Appendix 3. See Section 5.2.2 for the selected actions. On March 26, 2009, the committees met to review the actions selected to address bacteria, receive information on the turbidity impairment, and determine actions that would address turbidity. Presentations were given about the turbidity portion of the TMDL Report and agricultural best management practices from the perspective of agency staff and a crop consultant. The committees were split into five-member groups and asked to develop a list of actions that address turbidity. The identified actions by the groups were more detailed than those received at the previous meeting, but some clarification was needed. That clarification was sought through email correspondence to the respective group. The actions were then compiled and distributed via email to each member present at the March 26, 2009 meeting. Members were asked to vote on two actions that they thought would have the greatest impact on turbidity. Votes were returned to the HLWD office by April 6, 2009. Meeting handouts, presentations, and minutes can be found in Appendix 4. See Section 5.3.2 for the selected actions. On April 7, 2009, a meeting was held at the Heron Lake Community Center to provide Heron Lake and North Marsh landowners with first-hand information regarding the TMDL Report, phosphorus, and shallow lake management. Presentations were given to address the phosphorus problems identified in the Heron Lake watershed and shallow lake management options and examples from other Minnesota lakes. Following the presentations, participants had the opportunity to ask questions. They also completed an input form, which allowed them to rank in-lake actions and voice their opinions regarding possible watershed actions. Copies of the presentations and the input form were distributed by mail to those unable to attend. The results of the landowner input forms were compiled and presented to the Advisory and Technical Committees at the April 16, 2009 meeting. Meeting handouts, presentations, and minutes can be found in Appendix 5.

On April 16, 2009, the committees met to review the actions selected to address turbidity and receive presentations regarding the phosphorus portion of the TMDL Report, WWTF implications, and possible inlake and watershed pollution reduction activities. The committees were split into five-member groups and asked to develop a list of measures and actions that address phosphorus. The identified actions by the groups were more detailed than the previous meetings, but some clarification was needed. That clarification was sought through email correspondence to the respective group. The measures and actions were then compiled and distributed via email to each member present at the April 16, 2009 meeting. Members were asked to vote on two actions that they thought would have the greatest impact on phosphorus. Votes were returned to the HLWD office by April 27, 2009. Meeting handouts, presentations, and minutes can be found in Appendix 7. See Section 5.4.2 for selected actions. On April 27, 2009, water plan coordinators and SWCD staff from the seven counties were invited to a meeting to discuss project staffing and review the selected implementation actions. Extensive discussion led to the conclusion that additional staff would be needed to ensure a successful project. The group agreed upon the need for a watershed coordinator, engineering technician, and two watershed technicians. Discussion was also held regarding the chosen actions and clarification necessary to provide the public with acceptable actions they would be willing to adopt for water quality improvement. Meeting handouts and minutes can be found in Appendix 7. On May 21, 2009, the committees met together to review the draft TMDL Implementation Plan. Extensive time was spent reviewing each action and making suggestions for improvement or removal. Additional education and implementation actions were included and the discussed changes can be found in Appendix 8.
5.0 Nonpoint Source Management Actions and Analysis This section provides a description of the process to gather input from two committees, the measures considered, and the actions selected to be included in this plan. The implementation actions are targeted toward reduction of bacteria, turbidity, and excess nutrients and many of the actions listed could address more than one of the impairments.
5.1.1 Evaluation of Management Actions for Bacteria The numbered actions below were identified and discussed at the March 5, 2009 meeting of the Advisory and Technical Committees as potential activities to be included in the implementation plan. This section of the Implementation Plan describes those actions and provides a detailed explanation of each. Appendix 9 displays the data and calculations to determine an estimate of the practices and associated costs for implementing the chosen actions discussed in Section 5.2.2, Section 5.3.2, Section 5.4.2, and Section 5.5.2. Feedlots and Manure Management The TMDL Report stated that livestock in the WFDMR are contributing bacteria to surface waters. The committees discussed improving feedlots, installing buffer strips, educating producers, and implementing a variety of additional BMPs.
Actions that address these issues are detailed below. 1. Obtain a feedlot inventory by conducting Level III Feedlot Inspections.
o A Level III Feedlot Inspection consists of the inventorying of all animals, size of buildings, watershed size going to the feedlot, distance to discharge point (stream or tile), buffers, and slopes of the yards. There are 712 feedlots in the watershed, which have varying degrees of pollution potential. Each county is required to inspect seven percent of their feedlots each year. Completing this inventory provides information on how to minimize the pollution potential of the feedlot. Conducting more than the required amount of inspections would allow issues to be addressed sooner.
2. Provide 75 percent cost-share for feedlots to address runoff problems. o Through the Level III Feedlot Inspection, an inventory of all the inspected
feedlots would be ranked according to pollution potential. A cost-share program would provide up to 75 percent with a maximum cost of $100,000 per feedlot to fix polluting feedlots. Feedlot officers estimated that ten percent of the feedlots have pollution issues that need to be addressed. See Appendix 9 for detailed information.
3. Permits must contain the requirements outlined in Chapter 7020 of the MPCA feedlot program. o Permits are required dependant on facility size. This action would ensure feedlots
are permitted and meeting the requirements as specified in Chapter 7020. 4. Provide standardized reporting forms to be completed and submitted annually.
o Chapter 7020.0250, Submittals and Records describes the required records for feedlots and manure management, as well as submittal and records retention requirements. While a standardized reporting form may assist landowners, it does not appear that this would be an action that would improve water quality within the watershed.
5. Require 13-month storage capabilities for any new barn in the watershed. o Chapter 7020.2100, Liquid Manure Storage Areas and Chapter 7020.215, Manure
Stockpiling Sites, specifically describe the requirements set forth for manure storage. Since these requirements are already set forth in Minnesota rules, it does not appear that any change is needed. Also, it would be cost-prohibitive to implement this practice.
6. Add small grain or hay in rotation to reduce soil loss. o Cover crops include cereal rye, oats, clover, hairy vetch, and winter wheat that are
planted to temporarily protect the ground from wind and water erosion during times when cropland isn’t adequately protected against soil erosion1.
7. Implement a larger window for application on wheat stubble planted to corn the following spring. o Crops including small grain or alfalfa are often planted to allow for manure
application after it has been harvested. This is extremely advantageous to those feedlot producers who have limited storage capacity. This action suggested allowing a longer application time frame to encourage summer manure application.
Education
1 USDA/NRCS Iowa. Core4 Conservation Choices - Cover Crop. http://www2.ctic.purdue.edu/Core4/CT/Choices/Choices.html (accessed 5/09)
In order for producers to meet the requirements for animal feedlots, they must be aware of the rules and their responsibilities. Education is a key factor in ensuring producers’ ability to meet their responsibilities. Suggested actions from the Advisory and Technical Committees’ discussion to provide improved educational opportunities are detailed below.
8. Offer manure management workshops. o Nobles, Jackson, Murray, and Cottonwood Counties would provide an annual
workshop for feedlot operators that address manure management topics such as proper timing, rate, and method of application.
9. Using radio, newspapers, and newsletters, watershed residents would be provided with quick facts about manure application and contact information for local, state, and federal agencies that could be of assistance. o A plan could be established whereby each county, SWCD, NRCS, and HLWD
would submit an article on a monthly basis to watershed radio stations and newspapers about proper manure application. Articles could also be included in local agency newsletters. Providing information through various forms of media tends to be more effective at reaching the intended audience.
10. Conduct a watershed-wide mailing to producers regarding manure management issues. o Through the use of newsletters, residents throughout the watershed could be
provided information about manure management issues. 11. Use an on-site demonstration to provide producers with first-hand information about
storage/handling benefits, improved agronomics, and improved water quality. o Through the use of existing staff or new staff, on-site demonstrations could be
held to illustrate the benefits of a particular practice, with the intent of informing the audience and stimulating change.
12. Conduct a survey of agricultural lands within the WFDMR watershed to gather tile intake locations and slopes through use of GPS/GIS. o Through the use of existing staff, new staff, or summer interns, a survey of
agricultural lands could be completed to accurately identify open tile intake locations and field topography as a means to target implementation efforts. Focusing directly on specific areas for improvement and monitoring water quality changes could lead to obtaining a more objective inventory for applying for grant funds.
13. Provide producers with maps showing buffers and setback requirements for stockpiling. o Through the use of existing staff, new staff, or summer interns, GIS maps could
be created to accurately identify existing buffers, locations where buffers are needed, and where setbacks apply for feedlots and manure application. Often, producers state they did not know the rules. This action would give them the information to properly apply manure.
14. Teach existing regulations and provide a mandatory two-year refresher course with 75 percent cost-share. o Minnesota Chapter 7020 provides detailed information about feedlot permits.
While a course may prove useful, the method of enforcement may be difficult. Providing voluntary workshops and individual site visits would more beneficial.
15. Conduct side-by-side trials. o Side-by-side trials are a proven method to show producers advantages and
disadvantages of conservation methods. This has been an effective education method used across the WFDMR watershed.
16. Use resources provided by the University of Minnesota Extension Service.

o Counties, SWCDs, NRCS, and the HLWD do their utmost to provide watershed residents with University of Minnesota Extension Service resources through the distribution of information at their offices and through newsletters and newspaper articles. Often, the U of M Extension staff is utilized as presenters and speakers for educational events in the WFDMR watershed.
17. Give rewards for the best-managed sites, such as a free trip to agricultural functions such as the state fair or Farm Bureau events. o Positive reinforcement for producers through the use of free admittance to
agriculture-related events could prove to be a good incentive. 18. Provide one alternative tile intake demonstration site per township road ditch.
o Open tile intakes allow movement of runoff water into underground tile drains and directly discharge to surface waters. Rock inlets significantly reduce the amount of total suspended solids and total phosphorus into the subsurface drainage tile systems2. In order for producers to be informed about this alternative for their farming practices, education is imperative. Field scale demonstration sites and tours are an effective means to provide first-hand, accurate information about conservation practices and the importance of implementation.
19. Conduct a site tour showing different methods or stages of construction of alternative tile intakes and identifying benefits and functions.
o See alternative tile intake information above. Enforcement/Compliance Typically enforcement and compliance are addressed by the respective county or state authority. Committee members stressed the importance of ensuring that enforcement and compliance are consistently enforced throughout the WFDMR watershed.
20. Enforce the 16.5 foot buffer required along drainage ditches. o Under Minnesota Statutes 103E.067, Ditch Buffer Strip Annual Reporting, each
drainage authority is required to report the number of miles of buffer strips established according to section 103E.021; the number of drainage system inspections conducted; and the number of violations of section 103E.021 identified and enforcement actions taken. The TMDL Implementation Plan can encourage drainage authorities to ensure proper enforcement measures are undertaken. In 2006, BWSR conducted a survey of public drainage ditches in Minnesota. It is estimated 58 percent of the ditches have inadequate buffers3.
21. Conduct annual checks to verify that required and/or incentive installed buffers are in place and maintained.
o This action is already being implemented by local governmental units on an annual basis.
22. Police current mandates and give fines when they are not met. o The Delegated County Program for Animal Feedlots is contained in Chapter
7020.1500 through 7020.1900. All seven counties in the watershed are currently delegated. This section describes the actions required by each
2 Gieske, Tim. A Comparison of Sediment and Phosphorus Losses from Rock Inlets and Open Inlets in the Lower Minnesota River Basin http://www.co.carver.mn.us/departments/LWS/docs/tispowpo2.pdf (accessed 5/09) 3 Board of Water and Soil Resources, 2006. Public Drainage Ditch Survey. http://www.bwsr.state.mn.us/aboutbwsr/publications/bufferstudyweb.pdf (accessed 5/09)

delegated county. Since a county is already required to enforce the rules, it does not appear that this would be an action that would improve water quality within the watershed.
Financial Incentives A producers’ financial bottom-line is likely the most crucial element in decision-making. In order to meet water quality goals, there must be a landowners’ willingness to participate. Providing financial incentives to elicit participation in BMP programs is invaluable. Suggested actions from the Advisory and Technical Committees’ discussion are listed below.
23. Use the BMP Challenge to provide possible producer income protection. o The Nutrient BMP Challenge allows corn producers to try university-
recommended fertilizer rates without risk to income. Producers already working at BMP rates can experiment with below-BMP nutrient applications. The Reduced Tillage BMP Challenge provides a risk-free opportunity for corn farmers to reduce tillage - cutting fuel, time and equipment costs and protecting soil from erosion. No till, strip till, ridge till and other reduced tillage approaches are eligible4.
24. Provide a $30 per acre incentive for not applying manure in the winter on shoreland areas or fields with open tile intakes. o Applying manure to frozen soils increases the potential for water quality
degradation. Winter application of manure is not recommended. 25. Provide a $100 per producer incentive for developing a Manure Management Plan
(MMP) for 100+ animal unit facilities with a maximum of 100 producers. o Minnesota Chapter 7020.2225 Land Application of Manure provides detailed
information regarding manure management plans and producer requirements. MMPs are required by rule for feedlots containing 300 or more animal units. A financial incentive for smaller facilities to develop MMPs may be beneficial. The long-term commitment is difficult unless required by rule or law.
26. Provide a $100 per producer incentive for developing a MMP with a maximum of 100 producers. o See MMP information above.
27. Provide a $200 per operation per year incentive for accurate soil sampling using proper methods. o Soil tests measure the nutrient status of soils and are used as a basis for profitable
and environmentally responsible fertilizer and manure application. A soil sample which does not represent the area being sampled will be misleading and result in over or under-application of fertilizer5.
28. Provide a $0.10 per acre incentive for sampling kits for soil and manure. o See soil test information above.
29. Provide a $100 per applicator incentive for manure applicator calibration with a maximum of 100 applicators. o Manure application is a critical component of any livestock production system.
Proper use of manure nutrients can reduce fertilizer costs, improve soil health, and minimize the risk of pollution to ground and surface water. Applicator calibration can help determine not only manure nutrient application rate, but uniformity as
4 Nutrient BMP Challenge http://www.bmpchallenge.org/Nutrient_BMP_challenge.htm (accessed 5/09) 5 Franzen, Cihacek, Soil Sampling as a Basis for Fertilizer Application

well. Applicators apply manure at varying rates and patterns, depending on speed and/or power take-off speed, gearbox settings, gate openings, etc6.
30. Provide an incentive to producers to help defray engineering costs. o While assistance to producers in paying engineering costs could prove beneficial,
not enough information was provided to use this as an action in the implementation plan.
31. Provide incentives for manure application on small grain and hay fields. o Eligible landowners would receive a one-time incentive payment of $400 per acre
for manure application on small grain and hay fields. Applying manure to alfalfa has several potential environmental, agronomic, and management advantages. Alfalfa provides a significant amount of available cropland for spreading manure throughout the summer months. Agronomically, alfalfa removes/requires relatively high rates of nutrients and can benefit from the secondary and micronutrients as well as the macronutrients in manure7.
32. Provide a $500 per acre incentive for feedlot buffer strips. o County feedlot officers estimated that 75 percent of feedlots need a buffer. This
equates to 534 acres. See Appendix 9 for detailed information. Vegetated buffer strips can be a very efficient method to filter runoff from fields with manure application. One study has shown that grass buffer strips can remove 75 percent to 91 percent of fecal coliform bacteria8. The permanent grass vegetation will trap nutrient-laden sediment and fecal material while simultaneously utilizing nutrients.
33. Provide a $500 per acre incentive for 15-year buffer strips. o It is estimated that there are 1,066.62 miles of buffer strips needed throughout the
watershed. See Appendix 9 for detailed information. Buffer strips are used along watercourses to protect streambanks, trap sediment and nutrients, and provide wildlife habitat.
34. Provide a $1,000 per acre incentive for perpetual buffer strips. o See buffer strip information above.
35. Provide a $100 per acre incentive for feedlot and field buffers with a $2,000 per acre maximum. o See buffer strip information above.
36. Provide a $160 per acre incentive for feedlot and field buffers. o See buffer strip information above.
37. Provide a $10 per acre incentive if buffer strip width exceeds 1.5 times the base requirement. o See buffer strip information above.
38. Provide a $2 per acre for meeting required manure application regulations. o Minnesota Chapter 7020.2225 Land Application of Manure provides detailed
information regarding manure application and producer requirements. Since this is required by rule, a financial incentive for compliance is not necessary.
39. Offer current Conservation Reserve Program (CRP) rental rates and incentives for additional acres that wouldn’t qualify for CRP and extend project area to 150 feet.
6 Ess, Hawkins, Gould, Jacobs. Manure Applicator Calibration 7 Considerations When Applying Manure to Alfalfa, 2002. http://uwex.edu/ces/forage/wfc/proceedings2002/manure_application.htm (accessed 5/09) 8 Spiehs, Mindy and Goyal, Sagar, 2007. Best Management Practices for Pathogen Control in Manure Management Systems

o CRP is a voluntary program for agricultural landowners. Through CRP, annual rental payments and cost-share assistance are provided to establish long-term, resource-conserving cover on eligible farmland. The Commodity Credit Corporation makes annual rental payments based on the agricultural rental value of the land and provides cost-share assistance for up to 50 percent of the participant’s costs in established approved conservation practices. Participants enroll in CRP contracts for 10 to 15 years9. Providing incentives and additional acres to square a field and allow for increased landowner participation could prove beneficial for water quality.
40. Provide $3,000 per acre for permanent easements. o Conservation easements are a useful legal tool to preserve farmland by limiting
land uses. They are used to prevent development or to preserve scenic, natural, or other values the land may have. Governments often fund easement purchases by various means to meet local community objectives such as watershed protection or historic preservation.10
41. Provide 75 percent cost-share using multiple programs and partners. o Providing cost-share for conservation practices through partnerships and use of
new or existing programs is a necessary means for successful implementation. This action is commonly implemented in the watershed.
42. Provide low interest loans for storage or feedlot repairs. o Low interest loans are a popular means to provide producers with a cost-effective
means to address manure storage and feedlot problems. 43. Provide a $5 per foot incentive for new fencing to prevent livestock from entering
waterbodies. o Fencing livestock away from open water is an effective method of improving
water quality. Keeping animals away from open water will prevent urination and defecation in the stream, which can lead to bacterial pollution11.
44. Provide a $20 per acre per year incentive for a 10-year intensive rotational grazing plan. o A planned grazing system consists of a pasture being divided into two or more
pastures or paddocks with fencing. Cattle are moved from paddock to paddock on a pre-arranged schedule based on forage availability and livestock nutrition needs. Rotational grazing improves vegetative cover, reducing erosion and improving water quality12.
45. Provide a $1.50 per foot incentive for installing a four-strand wire fence. o Fencing costs can be a major deterrent for producers considering a paddock
system. Current funding allows for partial fencing costs. This action would ensure the producer receives ample cost-share to complete the rotational grazing BMP.
46. Provide a one-time $80 per acre incentive for interseeding degraded pasture lands. o Interseeding pasture lands to grass and legumes reduces soil erosion and improves
grass production13. 9 Conservation Reserve Program, USDA/FSA http://www.fsa.usda.gov/FSA/webapp?area=home&subject=copr&topic=crp (accessed 5/09) 10 Sullivan, Preston, 2003. Conservation Easements, 2003. 11 Spiehs, 2007. 12 USDA/NRCS Iowa. Core4 Conservation Practices – Planned Grazing System. http://www2.ctic.purdue.edu/Core4/CT/Choices/Choices.html (accessed 5/09) 13 USDA/NRCS Iowa. Core4 Conservation Practices – Pasture Planting. http://www2.ctic.purdue.edu/Core4/CT/Choices/Choices.html (accessed 5/09)

47. Replace open tile intakes with alternative tile intakes by providing up to 75 percent cost share. o There are an estimated 18,342 open tile intakes within the watershed. See
Appendix 9 for detailed information. A rock inlet can reduce runoff, sediment, and associated contaminants by 20 percent to 28 percent.14
48. Provide 50 percent cost-share for alternative tile intakes with a maximum of $500 per intake. o See alternative tile intake information above.
5.2.2 Selection of Bacteria Actions The TMDL Report stated that the primary contributing sources of bacteria in the WFDMR watershed were found to be livestock on overgrazed riparian pasture, surface-applied manure on cropland, feedlots lacking adequate runoff controls, and inadequate septic systems. Committee members felt that direct actions regarding enforcement, education, and on-the-ground BMPs would be the best avenues for addressing these problems. The following actions were chosen by the Advisory and Technical Committees to address bacteria. Section 5.2.1 contains the rationale and justification for each of the actions selected.
• Action 1: Obtain feedlot inventory by conducting Level III Feedlot Inspections • Action 2: Provide 75 percent cost-share for feedlots to address runoff problems • Action 8: Offer manure management workshops • Action 32: Provide a $500 per acre incentive for feedlot buffer strips • Action 33: Provide a $500 per acre incentive for 15-year buffer strips • Action 34: Provide a $1,000 per acre incentive for perpetual buffer strips • Action 47: Replace open tile intakes with alternative tile intakes by providing up to 75
percent cost share
5.3.1 Evaluation of Management Actions for Turbidity The following actions that address turbidity were identified and discussed at the March 26, 2009 meeting of the Advisory and Technical Committees as potential activities to be included in the implementation plan. This section of the Implementation Plan describes those actions and provides a detailed explanation of each. Financial Incentives A producers’ financial bottom-line is likely the most crucial element in decision-making. In order to meet water quality goals, there must be a willingness to participate. Providing financial incentives to elicit participation in BMP programs is invaluable. Suggested actions from the Advisory and Technical Committees’ discussion are listed below.
1. Provide a $30 per acre incentive for strip till, no till, and ridge till conservation tillage methods with greater than 30 percent cover on soybean stubble and greater than 50 percent cover on corn stubble, with a maximum of 500 acres and a 5-year contract. o Conservation tillage utilizes crop residue on the surface before and during
planting operations to provide cover for the soil at a critical time of the year. The residue is left on the surface by reducing tillage operations and turning the soil
14 Moncrief, John; Ranaivoson, Andry; Hansen, Neil; Sands, Gary; Dorsey, Edward; 2003. Managing Surface Inlets Rock Filter As An Alternative

less. Pieces of crop residue shield soil particles from rain and wind until plants can produce a protective canopy15.
2. Provide a $20 per acre incentive for conservation tillage greater than 30 percent cover on soybean stubble and greater than 50 percent cover on corn stubble. o See conservation tillage information above.
3. Provide low interest loans for 100 percent of the cost of strip till equipment, with a $7,500 per year reduction in principal for a maximum of 10 years, resulting in a total producer benefit of $75,000. o See conservation tillage information above.
4. Provide 50 percent cost-share, up to $250 per acre, for installing a controlled drainage system (tiling and structure) and require a signed 10-year management plan. o Water control structures installed in the drainage outlet allow the water in the
drainage outlet to be raised or lowered as needed. This water management practice is known as controlled drainage. Managing the field water through the use of controlled drainage allows timely drainage but also maximum storage of water within the field for crop utilization. The combined effect of reduced flow and reduced nitrate concentration results in the overall 45 percent reduction in nitrogen mass transport at the field edge. Controlled drainage has also been documented to reduce phosphorus transport by roughly 35 percent16.
5. Provide 100 percent cost-share for installing a controlled drainage structure with no payment for tiling costs. o See above information regarding controlled drainage.
6. Provide 50 percent cost-share for controlled drainage structure. o See above information regarding controlled drainage.
7. Provide a $15 per acre incentive for variable rate fertilizer application. o There are an estimated 733,683 acres available for implementation of this action.
See Appendix 9 for detailed information. Farmers use the global positioning system (GPS) coupled with other technologies to refine their crop fertility practices. Instead of applying a uniform fertilizer rate throughout a field, with the use of GPS and variable rate equipment, farmers are experimenting with spatial management practices, varying crop yield goals with fields17.
8. Provide a $10 per acre incentive for banding phosphorus fertilizer. o Banding is the application of fertilizer in a concentrated area. Total phosphorus
application rates can be decreased by one-third when compared to broadcast, which is the even application of fertilizer across an area18.
9. Provide an incentive for the cost difference between variable rate application and broadcast application (e.g. variable rate at $12 per acre less the broadcast rate $8 per acre = $4 per acre incentive). o See banding and broadcast fertilizer application information above.
10. Provide a $150 per year incentive for 10 years for converting cropland to perennial cover (i.e. native grasses and forage mix), with grazing allowed.
15 USDA/NRCS Iowa. Core4 – Crop Residue Management. http://www2.ctic.purdue.edu/Core4/CT/Choices/Choices.html (accessed 5/09) 16 Controlled Drainage: What Is It and How Does It Work? <http://www.soil.ncsu,edu/publications/BMPs/drainage.html> 17 Nowatzki, John, Learning About Variable Rate Fertilizer Application 18 Banding Phosphorus Fertilizer Increases Production. http://www.noble.org/Press_Release/Ag/BandingFertilizer/PrintLayout_1_13415_13415.html (accessed 5/09)

o Native grass can provide environmental benefits including filtering sediments and chemicals from runoff, dispersing water flow, and reducing erosion. Most native grass species develop a strong root system that contributes to an increase in soil fertility, recycling nutrients while alive and returning vital nutrients to the soil as the roots decompose. Because many native grasses are adapted to survive in almost any soil conditions, they require no fertilizer or irrigation after planting19.
11. Fully fund perpetual easement program for wetlands. o Through the USFWS Restorable Wetlands Inventory, the WFDMR watershed
contains 8,720 wetlands in need of restoration. See Appendix 9 for detailed information. Wetlands can provide natural pollution control. They filter and collect sediment from runoff water. Because wetlands slow overland flow and restore runoff water, they reduce both soil erosion and flooding downstream20. Basins improve water quality by trapping sediment on uplands and preventing it from reaching water bodies21.
12. Provide 100 percent cost-share plus a one-time payment of $5,000 per acre incentive for permanent easements on wetland restorations or $2,000 per acre incentive for a 25-year easement in a targeted watershed of 500 acres. o See wetland information above.
13. Provide 50 percent cost-share for wetland restorations adjacent to ditches. o See wetland information above.
14. Provide 75 percent cost-share with a maximum of $6,500 for 10 sediment basins per year. o See wetland/sediment basin information above.
15. Cost-share and incentive program for harvested buffers. o There are an estimated 1,066.62 miles of un-buffered streams in the WFDMR
watershed. See Appendix 9 for detailed information. Buffers are strips of grass, trees, and/or shrubs that slow water flow and cause contaminants such as sediment, pesticides, and fertilizers to collect in vegetation. The vegetation uses collected nutrients, preventing them from entering water supplies. Native vegetation often has a deeper root structure, which can be effective at stabilizing banks against erosion. Filtered water then enters water bodies.
16. Provide a $20 per acre incentive for alfalfa buffer strips along streams, with a minimum width of 66’ and a maximum width of 300’. No fertilizer would be allowed. o See buffer strip information above.
17. Provide a $275 per acre for 10 years for maintaining engineered practices (terraces, waterways, etc.) after NRCS contract ends. o Terraces break long slopes into shorter ones. They usually follow the contour of
the land. As water makes its way down a hill, terraces serve as small dams to intercept water and guide it to an outlet. There are two basic types of terraces – storage terraces and gradient terraces. Storage terraces collect water and store it until it can infiltrate into the ground or be released through a stable outlet.
19 Salk, Martha, 2006. Restoring Native Grass Communities on the Oak Ridge Reservation 20 USDA/NRCS Iowa. Core4 Conservation Practices – Wetland. http://www2.ctic.purdue.edu/Core4/CT/Choices/Choices.html (accessed 5/09) 21 USDA/NRCS Iowa. Core4Conservation Practices - Water and Sediment Control Basin. http://www2.ctic.purdue.edu/Core4/CT/Choices/Choices.html (accessed 5/09)

Gradient terraces are designed as a channel to slow runoff water and carry it to a stable outlet like a grassed waterway22.
o A grassed waterway is formed by grading a natural drainageway and shaping it to form a smooth, bowl-shaped channel. This area is seeded to sod-forming grasses. Runoff water that flows down the drainageway flows across the grass rather than tearing away soil and forming a larger gully. An outlet is often installed at the base of the drainageway to stabilize the waterway and prevent a new gully from forming23.
o Typical BMPs contract lengths are 10 years. This BMP would encourage producers to continue the practice for an additional ten years by providing $275 per acre for usual maintenance that is required after ten years of implementation.
18. Provide up to 75 percent cost-share with EQIP for an approved grazing system in riparian areas and 75 percent cost-share for practices not covered by EQIP (e.g. perimeter fence on existing pasture). o An approved grazing system provides for planting forage and using grazing
rotations to maximize production and reduce sediment and nutrient runoff. 19. Provide 75 percent cost-share for urban BMPs such as trees, rain gardens, stormwater
control, and permeable pavers. o Trees are used as windbreaks in a rural landscape, which are rows of trees and
shrubs that protect areas from wind24. Trees in an urban landscape can be used for the same purpose.
o It was estimated that there are 8,828 households in the WFDMR watershed that could install a rain garden. See Appendix 9 for detailed information. A rain garden is a planted depression that allows rainwater runoff from impervious urban areas like roofs, driveways, walkways, and compacted lawn areas the opportunity to be absorbed. This reduces rain runoff by allowing stormwater to soak into the ground (as opposed to flowing into storm drains and surface waters which causes erosion, water pollution, flooding, and diminished groundwater. Rain gardens can cut down on the amount of pollution reaching creeks and streams by up to 30 percent25.
o Urban stormwater control measures include new developments that have fewer hard surfaces; the disconnection of downspouts from hard surfaces to connect with porous surfaces; the conservation of natural areas; improved water and land use planning; rainwater harvesting systems that capture runoff from roofs in rain barrels, tanks, or cisterns; the use of permeable pavement; the creation of infiltration trenches into which stormwater can seep or is piped; the planting of rain gardens on both public and private lands; and the planting of swales along the roadside that capture and treat stormwater.
o "Permeable" is a term used to describe paving methods for roads, parking lots and walkways that allow the movement of water and air around the paving material. Although some porous paving materials appear nearly indistinguishable from
22 USDA/NRCS Iowa. Core4 Conservation Practices – Terrace. http://www2.ctic.purdue.edu/Core4/CT/Choices/Choices.html (accessed 5/09) 23 USDA/NRCS Iowa. Core4 Conservation Practices – Grassed Waterway. http://www2.ctic.purdue.edu/Core4/CT/Choices/Choices.html (accessed 5/09) 24 USDA/NRCS Iowa. Core4 Conservation Practices – Windbreak. http://www2.ctic.purdue.edu/Core4/CT/Choices/Choices.html (accessed 5/09) 25 Rain garden. http://en.wikipedia.org/wiki/Rain_garden (accessed 5/09)

nonporous materials, their environmental effects are qualitatively different. Whether porous asphalt, concrete, paving stones or bricks, all these pervious materials allow precipitation to percolate through areas that would traditionally be impervious and instead infiltrates the stormwater through to the soil below. The infiltration capacity of the native soil is a key design consideration for determining the depth of base rock for stormwater storage or for whether an underdrain system is needed26.
Education 20. Urban BMP education targeting master gardeners, rain garden projects, and installing
porous pavers. o Provide watershed residents with educational opportunities to explain the
importance of urban BMPs. Education is a key component to stimulating change in residents’ behaviors.
21. Provide watershed residents with educational opportunities about the importance of urban BMPs. o See urban BMP information above.
Inventory 22. Targeted wetland inventory to find optimum locations, possible intern project.
o Using interns, conduct a wetland inventory of the watershed to determine the best locations for targeted restoration activities. Targeted conservation is a new buzz word where time, effort, and money are focused in areas where the best expenditures of resources can occur.
23. Fund a LIDAR flight and data for WFDMR watershed to provide two-foot contour topographic lines. o Light Detection and Ranging (LIDAR) is a remote sensing system used to collect
topographic data. This technology is being used by the National Oceanic and Atmospheric Administration (NOAA) and NASA scientists to document topographic changes along shorelines. These data are collected with aircraft-mounted lasers capable of recording elevation measurements at a rate of 2,000 to 5,000 pulses per second and have a vertical precision of 15 centimeters (6 inches). After a baseline data set has been created, follow-up flights can be used to detect topographic changes27. Because LIDAR data would aid in delineation of engineered BMPs, essentially less time would be needed in the field to design BMPs. This technology is expensive and not often feasible. State agencies are looking at a cooperative effort to fund this practice state-wide.
Other 24. Hire commercial fishermen for carp removal.
o Hire commercial fisherman to net carp from lakes annually and truck them to the eastern US, where the carp can be sold as a delicacy. Annual harvesting would reduce the number of carp and improve the sediment and phosphorus pollutants.
25. Downsize 10 ditch outlets and riprap per year where needed. o Reduce the size of a ditch outlet in order to reduce water flow, thereby decreasing
the amount of runoff and increasing flood control. Riprap would be used on the areas above the ditch where the water would naturally overflow in order to control soil loss and erosion.
26 Permeable paving. http://en.wikipedia.org/wiki/Permeable_paving (accessed 5/09) 27 About LIDAR Data. http://www.csc.noaa.gov/products/sccoasts/html.tutlid.htm (accessed 5/09)

5.3.2 Selection of Turbidity Actions The TMDL Report stated that the primary contributing sources to turbidity impairments were found to be streambank/bed erosion, row cropland, algae, and to a lesser extent, benthic feeders (e.g. carp), overgrazed pasture, and inadequate buffers near streams and waterways. Committee members felt that direct actions regarding on-the-ground BMPs and education were the best avenues for addressing these problems. The following actions were chosen by the Advisory and Technical Committees to address turbidity. Section 5.3.1 contains the rationale and justification for each of the actions selected. • Action 7: Provide a $15 per acre incentive for variable rate fertilizer application • Action 11: Fully fund perpetual easement program for wetlands • Action 15: Implement a cost-share and incentive program for harvested buffer program
5.4.1 Evaluation of Management Actions for Excess Nutrients The following actions that address phosphorus in Heron Lake were identified and discussed as potential activities to be included in the implementation plan at the April 16, 2009 meeting of the Advisory and Technical Committees. This section of the Implementation Plan describes those actions and provides a detailed explanation of each. Inlake Actions
1. Provide a $500 per ton incentive for commercial fishermen to conduct annual carp removal. o Through annual harvesting of carp, the amount of sediment and resulting
phosphorus that is disturbed and released into the water column would be reduced. The DNR stated that this is an extremely intensive measure with limited results. This measure would need to be used in addition to other management measures for the best results.
2. Reduce rough fish population via commercial fishermen. o See information above.
3. Facilitate awareness, education, and removal through a festive carp tournament. o Drawing the public’s attention to the carp issue through a creative venue such as a
fishing tournament would promote the project, remove fish from the lake, and bring people and money to the local communities.
4. Harvest the lake on a bi-annual basis for removal of emergent plants and rough fish and incorporate the use of pheromones to increase the efficiency of seining. o Harvesting plant biomass removes nutrients by eliminating algae and plants.
Harvesting fish would decrease the amount of sediment and phosphorus that is disturbed. Research is currently being conducted by the University of Minnesota in an effort to determine if pheromones (chemical signaling systems) can be used to manage “nuisance” species such as the common carp28.
5. Create inlake barriers to prevent wave agitation to limit turbidity and resuspension of phosphorus o Water/dredge-filled tubes are commercially available and can be purchased or
rented in a variety of lengths and sizes. Their purpose is to retard the scouring action of water currents to protect shorelines and to restore aquatic vegetation.
28 Sorensen, Peter, 2004. Fish: Control via Pheromones 2004, University of Minnesota

The tubes can also be used to slow wave action resulting in a reduction of resuspended bottom sediments in a shallow basin such as Heron Lake.
6. Improve water level management capabilities through the use of structures and by-pass channels. o Install water control structures to improve water level management during wet to
completely dry stages. Bypass channels could be constructed around Heron Lake to keep water out of the lake system and move it downstream faster. This action would be an expensive action to implement and unfeasible through the permitting authorities.
7. Provide education on the importance of drawdowns with the goal of conducting a drawdown. o Drawdowns lower the water level and can sometimes control weeds by exposing
them to drying or freezing. Exposing the littoral zone may also result in shrinkage of soft muck, thus deepening the lake without expensive dredging29. Providing education to landowners and the public can increase the awareness and support for conducting a drawdown. In recent years, Heron Lake has been managed with the goal of a drawdown. According to the DNR, the shear size of the watershed makes drawdowns on Heron Lake difficult, attesting to the need for more storage in the watershed.
8. Continue aggressive drawdown management. o See drawdown information above.
9. Pump drawdown water into fields through irrigation. o Using water to irrigate and fertilize field crops removes nutrients from the water
before it drains back into the lake. Most of the land adjacent to Heron Lake is fertile, rich soil with strong soil composition for which irrigation potential is low.
10. Work with stakeholders to address internal loading in Heron Lake. Conduct a three-year drawdown with an annual fall or winter rotenone application, followed by fish stocking in the fourth year. o See drawdown information above. The DNR estimated the cost for this action to
be $2,259,000.00. See Appendix 9 for detailed information. Use of pesticides such as rotenone that are toxic to fish can be used by the DNR when a lake has become dominated by undesirable fish. Restocking with game fish generally follows. Rotenone application could only be done under low conditions with no water leaving the lake. Without treating areas adjacent to the lake, fish would still be able to enter the lake system.
11. Control rough fish with more efficient containment of upstream sources (e.g. in areas with continuous flow converging into a ditch or stream). o See pesticide information above.
12. Implement aggressive stocking of game fish on a yearly basis. o Following a successful drawdown and rotenone application, introduce predator
fish such as northern pike, walleye, crappie, yellow perch, and bluegill. This can be beneficial in controlling the carp population, but can become quite expensive. In addition, the receiving water needs to be able to handle the stocked fish.
13. Install upstream fish barriers on Jack Creek and Okabena Creek.
29 Freshwater Society and Minnesota Pollution Control Agency, 2004. Guide to Lake Protection and Management

o The electrical fish barrier can be thought of as an impassible barricade, and the fish guidance system as a repelling zone. Both consist of electrical current passing through water. The electrical circuit is made up of two or more metal electrodes submersed in water with a voltage applied between them. Electric current passing between the electrodes, via the water medium, produces an electric field. When fish are within the field, they become part of the electrical circuit with some of the current flowing through their body. The electric current passing through fish can evoke reactions ranging from a slight twitch to full paralysis, depending on the current level and shock duration they receive30.
14. Provide an easement for shoreline buffers with trees to reduce wind and wave action. o A buffer of natural vegetation protects the shoreline from bank erosion and helps
prevent sediment and nutrients (especially nitrogen and phosphorus) from washing into the lake31.
15. Implement lake reclamation (dredging) to remove sediments and nutrients while providing deeper water to prevent predator winterkill. o Dredging removes sediment, which can be a major source of phosphorus in the
water and can hinder recreational use of the lake. Sediment removal, however, is costly. Disposal of the dredged sediment is often a problem32.
Watershed Actions 16. Provide a $2,500 per acre incentive for restoring wetlands through the Wetlands
Reserve Program. o The Wetlands Reserve Program is a voluntary program offering landowners the
opportunity to protect, restore, and enhance wetlands on their property33. The USDA NRCS provides technical and financial support to help landowners with their wetland restoration efforts. The NRCS goal is to achieve the greatest wetland functions and values, along with optimum wildlife habitat, on every acre enrolled in the program. This program offers landowners an opportunity to establish long-term conservation and wildlife practices and protection. This program is dependant on annual federal funding allocations and is typically a well-received program in the watershed.
17. Provide up to 75 percent cost-share for flood storage projects. o Based on a flood storage inventory in the HLWD, there is potential for 56 flood
storage projects in the WFDMR watershed. See Appendix 9 for detailed information. Wetland creation refers to installing a wetland in an area where it did not previously exist. Wetlands can provide natural pollution control. They filter and collect sediment from runoff water. Because wetlands slow overland flow and restore runoff water, they reduce both soil erosion and flooding downstream34. Basins improve water quality by trapping sediment on uplands and preventing it from reaching water bodies35. Often times, these practices are
30 Electric Barrier and Guidance Systems. http://smith-root.com/products/barriers/ (accessed 5/09) 31 Natural Shoreland Landscaping, University of Minnesota Extension. http://www.extension.umn.edu/distribution/naturalresources/components/7357_01.html (accessed 5/09) 32 Freshwater Society and Minnesota Pollution Control Agency, 2004. 33 Wetlands Reserve Program, Natural Resources Conservation Service. http://www.nrcs.usda.gov/programs/wrp/ (accessed 5/09) 34 USDA/NRCS Iowa. Core4Conservation Practices – Wetland. (accessed 5/09) 35 USDA/NRCS Iowa. Core4Conservation Practices – Water and Sediment Control Basin. http://www2.ctic.purdue.edu/Core4/CT/Choices/Choices.html (accessed 5/09)

expensive and hard to fund with traditional cost-share and are more difficult to engage landowner participation.
18. Install artificial impoundments. o See information above and Section 5.3.1 for more information.
19. Install stormwater and sedimentation basins for hydraulic retention. o See information above and Section 5.3.1 for more information.
20. Provide a 100 percent restoration costs plus an annual payment of 1.5 times the net profit per acre for wetland restorations for 10 years. The net profit would be determined by averaging the net profit for the current farm year. o See information above.
21. Provide 75 percent cost-share for grassed waterways. o A grassed waterway is formed by grading a natural drainageway and shaping it to
form a smooth, bowl-shaped channel. This area is seeded to sod-forming grasses. Runoff water that flows down the drainageway flows across the grass rather than tearing away soil and forming a larger gully. An outlet is often installed at the base of the drainageway to stabilize the waterway and prevent a new gully from forming36.
22. Provide 75 percent cost-share for controlled drainage, including a 15 year management agreement. o Water control structures installed in the drainage outlet allow the water in the
drainage outlet to be raised or lowered as needed. This water management practice has become known as controlled drainage. Managing the field water through the use of controlled drainage allows timely drainage but also maximum storage of water within the field for crop utilization. The combined effect of reduced flow and reduced nitrate concentration results in the overall 45 percent reduction in nitrogen mass transport at the field edge. Controlled drainage has also been documented to reduce phosphorus transport by roughly 35 percent37.
23. Pay for controlled drainage system with land leases for 5-, 10-, or 15-year periods with variable rates. o See controlled drainage information above.
24. Explore options for creating a new program to reduce the amount of water that drains to the lake. o Provide opportunities for increased water retention in the watershed, such as
designing ditches with floodplains large enough to fully hold flood flows, creating wetlands off channel to take flood flows, and possible water control options in farm fields.
25. Explore options for point to nonpoint trading. o Water quality trading is an innovative approach to achieve water quality goals
more efficiently. Trading is based on the fact that sources in a watershed can face very different costs to control the same pollutant. Trading programs allow facilities facing higher pollution control costs to meet their regulatory obligations by purchasing environmentally equivalent (or superior) pollution reductions from another source at lower cost, thus achieving the same water quality improvement at lower overall cost38.
36 USDA/NRCS Iowa. Core4Conservation Practices – Grassed Waterway. (accessed 5/09) 37 Controlled Drainage: What Is It and How Does It Work? (accessed 5/09) 38 US Environmental Protection Agency , What is water quality trading? http://www.ourwater.org/econnection/connection26/trading.pf.html (accessed 5/09)

26. Provide an annual $300 per acre incentive for planting a third crop. o A third crop can provide environmental benefits including filtering sediments and
chemicals from runoff, dispersing water flow, and reducing erosion. A third crop is often a combination of a variety of crops used in combination with the traditional corn/soybean rotation. Native grasses can be a third crop and would benefit water quality for several reasons. Most native grass species develop a strong root system that contributes to an increase in soil fertility, recycling nutrients while alive and returning vital nutrients to the soil as the roots decompose. Because many native grasses are adapted to survive in almost any soil conditions, they require no fertilizer or irrigation after planting39. Appendix 9 shows that increasing the percentage of third crops from two to four percent in the watershed would be 41,000 acres.
27. Provide a $150 per acre incentive for bi-annual planting of winter wheat or rye as a cover crop. o Cover crops include cereal rye, oats, clover, hairy vetch, and winter wheat that are
planted to temporarily protect the ground from wind and water erosion during times when cropland is not adequately protected against soil erosion40.
28. Provide a $150 per acre or the average CRP rental payment per acre for installing small rain gardens in the upper watershed for water retention on farm ground. o A rain garden is a planted depression that allows rainwater runoff from
impervious urban areas like roofs, driveways, walkways, and compacted lawn areas the opportunity to be absorbed. This reduces rain runoff by allowing stormwater to soak into the ground (as opposed to flowing into storm drains and surface waters which causes erosion, water pollution, flooding, and diminished groundwater. Rain gardens can cut down on the amount of pollution reaching creeks and streams by up to 30 percent41.
29. Employ a full-time person ($15-$20 per hour) to manage rain gardens, sedimentation basins, and created wetlands. o Additional staff is needed to employ projects and programs described in this
implementation plan.
5.4.2 Selection of Excess Nutrients Actions The TMDL Report stated that the primary contributing sources to excess phosphorus in North and South Heron Lake were found to be divided between point sources, primarily WWTF, and nonpoint sources, including cropland/pasture runoff and streambank erosion. Under current conditions, internal phosphorus loading to North and South Heron Lake from sediment release, wind resuspension, and benthic fish represent a larger source of phosphorus than the watershed loading to the lakes (about 79 percent). Committee members recognized the internal loading issue but felt that direct actions with on-the-ground BMPs were the best avenues for addressing these problems. Decreasing the phosphorus load into the lake would be a valuable first step. The following actions were chosen by the Advisory and Technical Committees to address phosphorus. Section 5.4.1 contains the rationale and justification for each of the actions selected. • Action 10: Work with stakeholders to address internal loading in Heron Lake
39 Salk, Martha, 2006. 40 USDA/NRCS Iowa. Core4 Conservation Choices - Cover Crop. (accessed 5/09) 41 Rain garden. (accessed 5/09)

• Action 16: Provide a $2,500 per acre incentive for restoring wetlands through the Wetlands Reserve Program
• Action 17: Provide up to 75 percent cost-share for flood storage projects • Action 26: Provide an annual $300 per acre incentive for planting a third crop
5.5.1 Evaluation of Additional Management Actions The following actions were suggested to be included in the implementation plan at the May 21, 2009 meeting of the Advisory and Technical Committees. This section of the Implementation Plan describes those actions and provides a detailed explanation of each.
1. Provide 75 percent cost-share for rain garden projects. o It was estimated that there are 8,828 households in the WFDMR watershed that
could install a rain garden. See Appendix 9 for detailed information. A rain garden is a planted depression that allows rainwater runoff from impervious urban areas like roofs, driveways, walkways, and compacted lawn areas the opportunity to be absorbed. This reduces rain runoff by allowing stormwater to soak into the ground (as opposed to flowing into storm drains and surface waters which causes erosion, water pollution, flooding, and diminished groundwater. Rain gardens can cut down on the amount of pollution reaching creeks and streams by up to 30 percent42.
2. Provide urban BMP workshops. o Urban stormwater control measures include new developments that have fewer
hard surfaces; the disconnection of downspouts from hard surfaces to connect with porous surfaces; the conservation of natural areas; improved water and land use planning; rainwater harvesting systems that capture runoff from roofs in rain barrels, tanks, or cisterns; the use of permeable pavement, the creation of infiltration trenches into which stormwater can seep or is piped; the planting of rain gardens on both public and private lands; and the planting of swales along the roadside that capture and treat stormwater. Urban BMP education targeting master gardeners, rain garden projects, and installing porous pavers.
3. Provide permeable paver demonstration. o "Permeable" is a term used to describe paving methods for roads, parking lots and
walkways that allow the movement of water and air around the paving material. Although some porous paving materials appear nearly indistinguishable from nonporous materials, their environmental effects are qualitatively different. Whether porous asphalt, concrete, paving stones or bricks, all these pervious materials allow precipitation to percolate through areas that would traditionally be impervious and instead infiltrates the stormwater through to the soil below. The infiltration capacity of the native soil is a key design consideration for determining the depth of base rock for stormwater storage or for whether an under drain system is needed43.
4. Conduct an urban tree survey. o Most urban tree plans were last updated when the Dutch Elm disease came
through in the 1960s. With the arrival of the Emerald Ash Borer, it is estimated that 60 percent of the urban ash trees will be destroyed.44 It is critical to
42 Rain garden.(accessed 5/09) 43 Permeable paving (accessed 5/09) 44 Coder, Dr. Kim D., 1996. Identified Benefits of Community Trees and Forests

determine an inventory of tree types and conditions within the public right-of-way. It was estimated that there are 213 miles of urban right-of-way that would need to be surveyed. See Appendix 9 for detailed information.
5. Implement urban tree replacement program to reduce stormwater runoff. o By working with communities to increase tree diversity in boulevards, stormwater
runoff can be addressed. For every five percent of tree cover area added to a community, runoff is reduced by approximately two percent. The 10-20-30 rule provides a formula for diversity: no more than 10 percent of any one species of tree, no more than 20 percent of any one genus, and no more than 30 percent of any one family of trees. This formula would be used when creating tree plans and replacing trees within cities. It is estimated that there is an average of 15 trees per city block in an average community, which equates to 38,340 trees needed. See Appendix 9 for detailed information.
6. Develop a website. o A website would be created to provide residents and other interested parties with
current information regarding project activities, meeting minutes, and scheduled events. The website will be linked from each county’s website, as well as the HLWD and MPCA.
7. Develop and distribute an annual newsletter. o An annual newsletter would be mailed to each household in the watershed
informing residents about programs and activities undertaken. 8. Facilitate Advisory and Technical Committee meetings.
o Conduct annual meetings with the Advisory and Technical Committee members to provide project updates and obtain input and direction.
9. Provide quarterly project updates to watershed groups. o There are several existing watershed groups that have stemmed from original
Clean Water Partnership Projects in the watershed. This action would bring together all of those groups and members of the general public to learn about the project at quarterly meetings.
10. Create project brochure. o Develop a color brochure promoting project and educating residents about the
importance of water quality improvement efforts. 11. Promote Des Moines River enhancement through community events.
o Coordinate with communities along the river to provide the public with educational and recreational opportunities such as a booth at community events, canoe trips, and water quality education activities.
5.5.2 Selection of Additional Actions The following actions were chosen by the Advisory and Technical Committees to address phosphorus. Section 5.5.1 contains the rationale and justification for each of the actions selected. • Action 1: Provide 75 percent cost-share for rain garden projects. • Action 2: Provide urban BMP workshops. • Action 3: Provide permeable paver demonstration. • Action 4: Conduct an urban tree survey. • Action 5: Implement urban tree replacement program to reduce stormwater runoff. • Action 6: Develop a website. • Action 7: Develop and distribute an annual newsletter.

• Action 8: Facilitate Advisory and Technical Committee meetings. • Action 9: Provide quarterly project updates to watershed groups. • Action 10: Create project brochure. • Action 11: Promote Des Moines River enhancement through community events.

6.0 Point Source Management Actions and Analysis Although the WFDMR is mainly an agricultural watershed, point sources do exist in the watershed. Section 6.1 briefly summarizes the process to gather input from the Advisory Committee and Technical Committee. Sections 6.2 through 6.4 explain the actions, opportunities, and implications for SSTS and unsewered communities, MS4, and WWTF, respectively. Section 6.5 summarizes the actions that will be implemented through this implementation plan.
6.1 Stakeholder Input Process An Advisory Committee was formed during the development of the TMDL Study. When the Implementation Plan process began, a Technical Committee was also formed. Section 4 provides detailed information regarding the formation of these committees. The Advisory and Technical Committees spent the majority of their time addressing nonpoint source pollution. Through the process described in Section 4, SSTS was the only point source addressed. The HLWD, MPCA and City of Worthington worked together to meet the MS4 requirements. At the time of approval, the MPCA, HLWD and the cities of Worthington, Brewster, Okabena, and Lakefield, together with Swift Brands, Inc. are developing a plan to meet the limits specified in the TMDL Report. The cities of Worthington, Brewster, Okabena, and Lakefield, together with Swift Brands, Inc. will address the remaining point source issues.
6.2 SSTS/Unsewered Communities The numbered actions below were identified and discussed at the March 5, 2009 meeting of the Advisory and Technical Committees as potential activities to be included in the implementation plan. This section of the Implementation Plan describes those actions and provides a detailed explanation of each. A septic system is defined as a private waste removal system for homes that are not connected to a community sewer. A conventional septic system consists of three main parts: a septic tank, a drain field, and the soil beneath the drain field. Waste is filtered to the soil, where components in the soil neutralize bacteria and chemicals before they reach groundwater or nearby rivers and lakes. A functioning system can remove up to 99 percent of bacteria45. A community sewer system is defined as an on-site sewage disposal system that services more than one property. Non-compliant systems, along with unsewered communities, contribute to the water quality impairments within the watershed. The following actions were suggested by the committees for addressing the bacteria impairment.
1. Have a standardized reporting form to be completed and submitted annually by a licensed professional. o Minnesota Rules Chapter 7080 provides detailed information regarding standards
for septic systems. There is no requirement for a SSTS to be pumped every three years. It was suggested that notices sent on a three-year rotation could help to improve water quality. It could not be determined that a standardized reporting form completed by a licensed professional would provide a means to improve water quality.
2. Provide information by mailings to watershed residents. 45 EPA, 2002. Onsite Wastewater Treatment Manual

o In order for residents to meet the requirements for septic systems, they must be aware of the rules and their responsibilities. Education is a key factor in ensuring their ability to meet their responsibilities. This task is accomplished through existing county and HLWD newsletters.
3. Explore design options for clustered systems. o Over the last decade, the use of cluster systems has become increasingly popular
in Minnesota. With cluster systems, sewage collection and treatment for a group of homes occurs at a single facility, as opposed to each dwelling46. Exploring options for clustered systems design and installation with the watershed may result in improved water quality.
4. Explore options for grant and loan opportunities offered by the USDA to install community sewer systems. o Low interest loans could prove beneficial in assisting residents to install
community sewer systems. There are five unsewered communities in the watershed that may be interested in this program.
5. Provide low-interest loans for 100 percent of project cost for SSTS replacement. o County Water Plan Coordinators estimate that there are 3,818 septic systems in
need of upgrading in the WFDMR watershed. See Appendix 9 for detailed information. The cost for upgrading a septic system varies from $9,000 to $11,000 depending on soil conditions and location. Providing a low interest loan program has been successful in many parts of the watershed. It allows homeowners to place the cost of the septic system upgrade on their property taxes over several years. This makes the project more feasible.
6. Provide a $500 incentive per SSTS. o Providing residents with a cash incentive has been a successful impetus for
upgrading septic systems in the Heron Lake watershed. 7. Provide a $1,000 incentive per SSTS.
o See information above. 8. Provide a $2,000 incentive per SSTS.
o See information above. 9. Provide 75% cost-share with a maximum of $2,500 per SSTS for 300 SSTS.
o County Water Plan Coordinators estimate that there are 3,818 septic systems in need of upgrading in the WFDMR watershed. See Appendix 9 for detailed information. Providing residents with cost-share funds to assist in septic system upgrading could prove to be successful.
10. Provide 50 percent cost-share up to $2,000 for SSTS replacement. o See information above.
6.3 Municipal Separate Storm Sewer System (MS4) The city of Worthington, located in Nobles County, is the only permitted MS4 in the watershed. The city is located on the watershed boundary with a portion located in the WFDMR watershed and the remaining portion located in the Okabena-Ocheda watershed. The population of Worthington is 11,283. Stormwater from the city discharges to Okabena Creek and Elk Creek (which drains to Okabena Creek). Approximately 245 acres from Worthington drains to Elk Creek while 2,315 acres drains to Okabena Creek. The city land area falling in the WFDMR 46 Christopherson, Sara and Gustafson, Dave, 2006. Preliminary Evaluation of Cluster System Septic Tank Performance

watershed is four square miles, which equates to 0.3 percent of the area in the watershed. Figure 1 is a map of Worthington showing the drainage area. Figure 1: Worthington’s Stormwater Drainage Map Permit requirements state that permitted MS4s must demonstrate that their Stormwater Pollution Prevention Program (SWPPP) is meeting the wasteload allocation (WLA) defined in the TMDL Report. If the SWPPP is not meeting the WLA, the MS4 must modify the SWPPP to demonstrate compliance with the WLA. The data analysis and modeling were extremely limited and the lack of information makes it difficult to link the SWPPP and the WLA. In addition, the city of Worthington makes up 0.3 percent of the entire WFDMR watershed, resulting in an overall minor impact on the impaired waters. Finally, the major sources for the impairments are mostly non-regulated, unlike the city of Worthington. The MPCA, therefore, recommends a phased, performance-based approach to implementation. The approach is described below.
6.3.1 Stormwater Management Strategy A performance-based approach is one in which the MS4 implements BMPs which are described in the TMDL Implementation Plan. When these BMPs are included in a SWPPP and implemented properly, the MS4 will be considered to be in compliance with the WLA. Currently, the MPCA is developing guidance that will include a list of BMPs for different impairments. The guidance will include information on expected pollutant reductions as well as information on design and maintenance for different BMPs. Once the guidance is available, which is expected in late 2009, this section of the implementation plan will be defined more clearly with specific BMPs and anticipated reductions. Adaptive Management and Timeline

The performance-based approach will be implemented in three phases. Phase 1, called the primary treatment phase, will last approximately two permit cycles. BMPs for this phase will achieve an approximate 25 percent reduction in pollutant loading from a no-BMP baseline. Thus, BMPs in place will receive credit if it can be demonstrated that they are properly designed and maintained. At the end of the Phase 1, all sectors (nonpoint and point) will be evaluated to determine if the pollution reduction targets have been met. Phase 2, or the secondary treatment phase, will not begin until all sectors have achieved the pollution reduction targets defined in Phase 1. The Phase 2 target is an additional approximate 25 percent reduction in loading using BMPs selected from the guidance. The BMPs slated for this phase are more aggressive than Phase 1. Phase 2 will take additional permit cycles. Again, all sectors (nonpoint and point) will be evaluated to determine if the pollution reduction targets have been met. Phase 3, or the tertiary treatment phase, will occur when all sectors have made significant progress toward the pollution reduction targets defined in Phase 2. Phase 3 BMPs are very aggressive and include treatment trains. Implementation of these BMPs will take many permit cycles. BMPs addressing impairments This section will be developed more thoroughly once BMP reductions have been identified. Below is a list of common actions that may be implemented. Bacteria:
• Identify sources: o Illicit discharges o Permitted industrial and commercial stormwater discharges to your conveyance
system o Wildlife population centers, especially those using the storm sewer system
• Develop actions to address sources • Determine the importance of wastewater bypasses • Evaluate existing ordinances and public education efforts for management of pet waste • Implement effective structural BMPs • Maintenance and cleaning of storm sewers to minimize bacteria growth • Evaluate potential contributions from detention ponds
Turbidity: • Identify sources • Decrease impervious surfaces by:
o Using porous materials for roadways, parking lots and alleys o Reducing soil compaction during development o Increasing green space in new developments o Applying horticultural concepts that improve infiltration, such as planting
perennial plants o Designing narrower roads, sidewalks and alleys
• “Disconnect” impervious surfaces by: o Establishing grassy buffers along waterways o Installing structural BMPs, such as detention basins, rain gardens, infiltration
trenches, vegetated media strips, constructed wetlands, and vegetated swales. o Employing properly-maintained proprietary devices to remove sediment under
low-flow conditions

o Better manage stormwater on private property (e.g. downspout disconnection, rain barrels, etc)
Phosphorus: • Identify sources:
o Phosphorus fertilizer application o Lawn and yard waste o Animal waste o Phosphorus storage
• Implement actions to address sources • Reduce illicit discharge connections • Reduce runoff through a combination of:
o Site design principles, like increased green space and protection of sensitive wetlands
o Structural BMPs, like green roofs and pervious pavement, and o Regulatory requirements, including ordinances that require increased infiltration
• Treat runoff o Install BMPs that reduce phosphorus concentrations by sedimentation or by
infiltration. Existing Stormwater Management Strategies The city of Worthington’s current SWPPP was developed in February 2007, when the MS4 applied for the General Stormwater Permit (MN R 040000). The following is a list of actions that are being implemented to meet the requirements of the permit. Public Education & Outreach
• Distribute Educational Materials • Implement an Education Program
o Public Education and Outreach o Public Participation o Illicit Discharge Detection and Elimination o Construction Site Run-off Control o Post-Construction Stormwater Management in New Development and
Redevelopment o Pollution Prevention/Good Housekeeping for Municipal Operations
• Coordination of Education Program • Annual Public Meeting • Stormwater Utility Fund
Public Involvement and Participation • Comply with Public Notice Requirements • Solicit Public Input and opinion on the Adequacy of the SWPPP • Consider Public Input
Illicit Discharge Detection and Elimination • Storm Sewer System Map • Regulatory Control Program • Illicit Discharge Detection and Elimination Plan • Public and Employee Illicit Discharge Information Program • Identification of Non Stormwater Discharges and Flows

Construction Site Stormwater Controls • Ordinance or other Regulatory Mechanism • Construction Site Implementation of Erosion and Sediment Control BMPs • Waste Controls for Construction Site Operators Procedure for Site Plan Review • Establishment of Procedures for the Receipt and Consideration of Reports of Stormwater
Noncompliance • Establishment of Procedures for Site Inspections and Enforcement
Post Construction Stormwater Management for New Development and Redevelopment • Development and Implementation of Structural and/or Nonstructural BMPs • Regulatory Mechanism to Address Post Construction Runoff from New Development
and Redevelopment • Long-term Operation and Maintenance of BMPs
Pollution Prevention/Good Housekeeping for Municipal Operations • Municipal Operations and Maintenance Program • Street Sweeping • Annual Inspection of All Structural Pollution Control Devices • Inspection of a Minimum of 20 percent of the MS4 Outfalls, Sediment Basins and Ponds
Each Year on a Rotating Basis • Annual Inspection of All Exposed Stockpile, Storage and Material Handling • Inspection Follow-up Including the Determination of Whether Repair, Replacement, or
Maintenance Measures are Necessary and the Implementation of the Corrective Measures • Record Reporting and Retention of all Inspections and Responses to the Inspections • Evaluation of Inspection Frequency
Funding Needs and Mechanisms Again, this will be developed more fully once the BMPs are selected. Funding is a crucial component that needs to be addressed. The HLWD has experience in seeking outside funding and has successfully attained funding for education and implementation storm-water-related activities. It is hoped that the HLWD and the city of Worthington would collaborate on seeking and implementing stormwater education and BMPs.
6.3.2 Tracking and Verification Monitoring Monitoring is a key component needed for the phased performance based approach to be successful. The tracking will mostly be done through annual planning activities and meetings. Each year, the city of Worthington will meet with MPCA and HLWD to report on activities and discuss funding opportunities for potential education, implementation, and demonstration projects. Through the permit, the MS4 is also required to submit an annual report on progress to MPCA.
6.3.3 General Compliance Schedule Using the phased, performance-based approach, the timeline would largely be dependent on reductions occurring in each phase and all sectors reducing pollutant loads. Generally, it is anticipated that Phase 1 will be completed in 10 to 15 years and Phase 2 will be completed in 10 years. Phase 3 includes more structural BMPs and it is difficult to estimate the time needed. This timeline will go into effect once a detailed MS4 implementation plan is developed, which is anticipated to occur within a year of the approval of this plan.

6.4 WWTFs As of July 2009, the MPCA was developing a proposal for consideration by the five WWTFs and EPA that would address required phosphorus reductions. A basin permit that would address all five facilities together is under consideration. In addition, the possibility for some form of pollutant trading among the facilities, or with non-point sources is being discussed. Upon completion and approval by the five WWTF and EPA, this proposal will be included in the implementation plan. In order for the lines of communication to remain open, there will be an annual progress meeting with the MPCA, the HLWD, the cities of Worthington, Brewster, Lakefield, Okabena, and Swift Brand, Inc. to provide updates from the WWTF and the nonpoint sector to discus progress.
6.5 Selection of Point Source Actions The TMDL Report stated that the point sources discussed in this section of the implementation plan (SSTS, MS4, WWTF) provide an overall minor impact to the loading of the watershed. Regardless, these sources are permitted and have requirements to meet the TMDL. The Advisory and Technical Committees, the MPCA, the HLWD, and point sources have collaboratively developed the following actions to meet permit requirements and the TMDL.
• Provide low-interest loans for SSTS upgrades • Provide cost-share for SSTS upgrades • Conduct annual meetings with the MPCA, the city of Worthington, HLWD • Conduct annual meetings with the MPCA, the HLWD, the cities of Worthington,
Brewster, Lakefield, Okabena and Swift Brands, Inc.
7.0 Identification and Summary of Implementation Objectives and Action Items Below is a list of the actions selected by the Advisory and Technical Committees as described in Section 5.0 and Section 6.0.
Objective 1. Protect banks from erosion and runoff through buffer programs Action A. Provide a $500 per acre incentive for 15-year buffer strips. • Eligible landowners would receive a one-time cash incentive of $500 per acre for installing a
buffer strip for 15 years. The buffer strip would need to meet the CRP and NRCS technical requirements of the practice. The 1,500-acre goal is based on implementation of BMPs through HLWD’s Clean Water Partnership program over ten years. According to eLINK pollutant reductions, this action could reduce 2,034 tons of sediment and 3,333 pounds of phosphorus per year. Staff time from the seven-county SWCD and NRCS offices, HLWD, and BWSR would be allocated as inkind at a rate of $35 per hour. Assuming each contract would be eligible for state and/or federal cost-share at a maximum of 75 percent the project cost, the landowner’s 25 percent contribution would also be allocated toward inkind.
• Timeframe: Years 1-10 • Person(s) responsible: Seven-county SWCD and NRCS offices, landowner, HLWD, and
BWSR • Total costs: $1,005,000.00
• Cash: $750,000.00 o 1,500 acres x $500/acre incentive = $750,000.00

• Inkind: $255,000.00 o Staff time: 150 contracts x 20 hrs/contract x $35/hr = $105,000.00 o Landowner: 150 contracts x $4,000/contract x 25%= $150,000.00
Action B. Provide a $1,000 per acre incentive for perpetual buffer strips. • Eligible landowners would receive a one-time cash incentive of $1,000 per acre for a
perpetual easement. This incentive would be for perpetual buffers and would operate under the technical requirements of the Reinvest In Minnesota (RIM) program. Local staff believes that the Minnesota Legislature will fund RIM in the near future. The 1,500-acre goal is based on implementation of BMPs through HLWD’s CWP program over ten years. According to eLINK pollutant reductions, this action could reduce 20,336 tons of sediment and 33,327 pounds of phosphorus per year. Staff time from the seven-county SWCD and NRCS offices, HLWD, and BWSR would be allocated as inkind at a rate of $35 per hour.
• Timeframe: Years 1-10 • Person(s) responsible: Seven-county SWCD and NRCS offices, HLWD, and BWSR • Total costs: $1,605,000.00
• Cash: $1,500,000.00 o 1,500 acres x $1,000/acre incentive = $1,500,000.00
• Inkind: $105,000.00 o 150 contracts x 20 hrs/contract x $35/hr = $105,000.00
Action C. Cost-share and incentive program for harvested buffers. • Eligible landowners would receive 100 percent cost-share plus a one-time $200 per acre
incentive for a harvested native grass buffer. Only areas without an existing buffer will qualify for this program. The width requirements would be a minimum of 100 feet and a maximum of 200 feet. The closest 50 feet to the watercourse cannot be harvested and the remaining acres could be harvested each year. The 1,500-acre goal is based on implementation of BMPs through HLWD’s CWP program over ten years. According to eLINK pollutant reductions, this action could reduce 20,336 tons of sediment and 33,327 pounds of phosphorus per year. Staff time from the seven-county Environmental offices, SWCD and NRCS offices, and HLWD would be allocated as inkind at a rate of $35 per hour.
• Timeframe: Years 1-10 • Person(s) responsible: Seven-county Environmental offices, SWCD and NRCS offices, and
HLWD • Total costs: $705,000.00
• Cash: $600,000.00 o 1,500 acres x $200/acre incentive = $300,000.00 o 1,500 acres x $200/acre for establishment cost = $300,000.00
• Inkind: $105,000.00 o Staff time: 150 contracts x 20 hrs/contract x $35/hr = $105,000.00
Objective 2. Address Nonpoint Source Pollution through cropland changes Action A. Replace open tile intakes with alternative tile intakes by providing 75 percent cost share. • Eligible landowners would receive a one-time cost-share payment of 75 percent with a
maximum of $450 per intake to replace open tile intakes with alternative tile intakes. There are an estimated 18,342 open tile inlets in the watershed that would be eligible for this program. Based upon the HLWD’s Alternative Tile Intake Program, the goal is to install 350 intakes. According to eLINK pollutant reductions, this action could reduce 140,000 tons of

sediment and 175 pounds of phosphorus per year. Staff time from the seven-county SWCD and NRCS offices, and HLWD would be allocated as inkind at a rate of $35 per hour. The landowner contribution would be the remaining 25 percent of the cost.
• Timeframe: Years 1-10 • Person(s) responsible: Seven-county SWCD and NRCS Offices and HLWD • Total Costs: $259,000.00
• Cash: $157,500.00 o 350 intakes x $450 max cost-share/intake = $157,500.00
• Inkind: $101,500.00 o Staff time: 350 intakes x 4 hrs/intake x $35/hr = $49,000.00 o Landowners: 350 intakes x $600/intake x 25% = $52,500.00
Action B. Provide a $15 per acre incentive for variable rate fertilizer application. • Eligible landowners using broadcast fertilizer application would receive an incentive of $5
per acre per year for three years for changing to variable rate commercial fertilizer application on a maximum of 500 acres per producer, providing signing a three-year agreement. The fertilizer would need to be incorporated, applied in the spring, and use University of Minnesota Extension fertilizer recommendations. The acreage goal is based on 100 producers implementing the maximum acres over a ten-year period. Staff time from the seven-county environmental offices, SWCD and NRCS offices, HLWD and crop consultants would be allocated as inkind at a rate of $35 per hour.
• Timeframe: Years 1-10 • Person(s) responsible: Seven-county Environmental offices, SWCD and NRCS offices,
HLWD and crop consultants • Total costs: $757,000.00
• Cash: $750,000.00 o 50,000 acres x $15/acre = $750,000.00
• Inkind: $7,000.00 o Staff time: 100 contracts x 2 hrs/contract x $35/hr = $7,000.00
Action C. Provide an annual $300 per acre incentive for planting a third crop. • Eligible landowners would receive an annual payment of $300 per acre for converting
cropland to a third crop such as native grasses for 10 years or the length of the grant. Contracts can be a maximum of 40 acres and the third crop can be harvested annually. Acreage goal is based on implementing 10,000 acres. Staff time from the seven-county environmental offices, SWCD and NRCS offices, HLWD, and crop consultants would be allocated as inkind at a rate of $35 per hour.
• Timeframe: Years 1-10 • Person(s) responsible: Seven-county Environmental offices, SWCD and NRCS offices,
HLWD and crop consultants • Total costs: $3,017,500.00
• Cash: $3,000,000.00 o 10,000 acres x $300/acre incentive = $3,000,000.00
• Inkind: $17,500.00 o 250 contracts x 2 hrs/contract x $35/hr = $17,500.00

Objective 3. Provide flood storage opportunities Action A. Fully fund perpetual easement program for wetlands. • Eligible landowners would receive a $6,500 per acre payment for a perpetual easement for
restoring wetland and upland acres. The cost of restoration would also be paid. A minimum of one upland acre per basin acre would be required. The acreage goal is based on wetland restorations through the HLWD’s CWP program. The difference in incentives through the TMDL Implementation Plan should result in greater participation and the acreage goal reflects this. According to eLINK pollutant reductions, this action could reduce 17,000 tons of sediment and 23,618 pounds of phosphorus per year. The BWSR will assist with easement and contractual requirements at an estimated cost of $750 per easement. Staff time from the seven-county environmental offices, SWCD and NRCS offices, BWSR, and HLWD would be allocated as inkind at a rate of $35 per hour.
• Timeframe: Years 1-10 • Person(s) responsible: Seven-county Environmental offices, SWCD and NRCS offices,
BWSR, and HLWD • Total costs: $2,116,125.00
• Cash: $2,105,625.00 o 300 acres x $6,500/acre payment = $1,950,000.00 o 300 acres x $500/acre for restoration costs = $150,000.00 o $750/easement x 7.5 easements = $5,625.00
• Inkind: $10,500.00 o Staff time: 7.5 easements x 40 hrs/easement x $35/hr = $10,500.00
Action B. Provide a $2,500 per acre incentive for restoring wetlands through the Wetland Reserve Program (WRP). • Eligible landowners would receive a $2,500 per acre incentive for restoring wetlands through
the Wetland Reserve Program. The acreage goal is based on wetland restorations through the HLWD’s CWP program. The difference in incentives through the TMDL Implementation Plan should result in greater participation and the acreage goal reflects this. According to eLINK pollutant reductions, this action could reduce 17,000 tons of sediment and 23,618 pounds of phosphorus per year. Staff time from the seven-county environmental offices, SWCD and NRCS offices, and HLWD would be allocated as inkind at a rate of $35 per hour.
• Timeframe: Years 1-10 • Person(s) responsible: Seven-county Environmental offices, SWCD and NRCS offices, and
HLWD • Total costs:$753,500.00
• Cash: $750,000.00 o 300 acres x $2,500/acre incentive = $750,000.00
• Inkind: $3,500.00 o Staff time: 5 contracts x 20 hrs/contract x $35/hr = $3,500.00
Action C. Provide 75 percent cost-share for flood storage projects. • Eligible landowners would receive 75 percent cost-share up to $30,000 for flood storage
projects. The projects include excavated ponds, created wetlands, and embankments installed according to NRCS specifications. The acreage goal is based on wildlife ponds installed through the HLWD’s CWP program. Staff time from the SWCD and NRCS offices, and HLWD would be allocated as inkind at a rate of $35 per hour. The landowner contribution of 25 percent would be also used as inkind.

• Timeframe: Years 1-10 • Person(s) responsible: Seven-county Environmental offices, SWCD and NRCS offices, and
HLWD • Total costs: $162,800.00
• Cash: $120,000.00 o 4 contracts x $30,000/contract = $120,000.00
• Inkind: $42,800.00 o Staff time: 20 hrs x 4 contracts x $35/hr = $2,800.00 o Landowner cost: 4 contracts x $40,000/contract x 25% = $40,000.00
Objective 4. Feedlot Management Action A. Obtain feedlot inventory by conducting Level III Feedlot Inspections. • A targeted, Level III feedlot inspection would include an inventory of all animals, size of
buildings, feedlot drainage area, distance to discharge point (stream or tile), buffers, and topography. Current feedlot rules require that a minimum of seven percent of the feedlots be inspected each year. This implementation plan would require an expedited completion of the Level III inventory. There are 712 feedlots in the watershed. A Level III inventory would be completed for each of these feedlots within the first five years of the project. Staff time from the seven-county environmental offices would be allocated as inkind at a rate of $35 per hour.
• Timeframe: Years 1-5 • Person(s) responsible: Seven-County Environmental Offices • Total Costs: $124,600.00
• Cash: $0.00 • Inkind: $124,600.00
o Staff time: 5 hrs/site x $35/hr x 712 feedlots = $124,600.00 Action B. Provide 75 percent cost-share for feedlots to address runoff problems. • Through the inventory, all 712 feedlots would be inspected and ranked by pollution potential.
The project would provide 75 percent cost-share with a maximum cost of $100,000 per feedlot to fix polluting sites. Staff time from the seven-county environmental offices, SWCDs, and NRCS would be allocated as inkind at a rate of $35 per hour. The 25 percent remaining cost would be to the landowner, which would also be used as inkind.
• Timeframe: Years 2-10 • Person(s) responsible: Seven-County Environmental Offices, SWCDs, and NRCS and
landowners • Total Costs: $7,139,760.00
• Cash: $5,325,000.00 o 71 feedlots x $75,000/max cost/feedlot = $5,325,000.00
• Inkind: $1,814,760.00 o Staff time: 71 feedlots x 16 hrs/project x $35/hr = $39,760.00 o Landowner: 71 feedlots x $100,000/feedlot x 25% = $1,775,000.00
Action C. Provide a $500 per acre incentive for feedlot buffer strips. • Eligible landowners would receive a one-time cash incentive of $500 per acre for installing
buffer strips around feedlots to control runoff. The buffer strip would need to meet the NRCS technical requirements of the practice and be 10 years in length. It is estimated that

75 percent of the feedlots in the watershed are in need of this practice. Based on the goals for the other buffer programs identified in this plan, the goal is 150 contracts. Staff time from the seven-county environmental offices, SWCD and NRCS offices, HLWD, and BWSR would be allocated as inkind at a rate of $35 per hour. Assuming each contract would be eligible for state and/or federal cost-share at a maximum of 75 percent the project cost, the landowner portion would also be allocated towards inkind.
• Timeframe: Years 1-10 • Person(s) responsible: Seven-county Environmental offices, SWCD and NRCS offices, and
HLWD • Total costs: $114,000.00
• Cash: $75,000.00 o 150 acres x $500/acre incentive = $75,000.00
• Inkind: $39,000.00 o 150 contracts x 6 hrs/contract x $35/hour = $31,500.00 o Landowner contribution: $50/acre x 150 acres = $7,500.00
Objective 5. Initiate Urban BMP Programs Action A. Provide 75 percent cost-share for rain garden projects. • Eligible landowners would receive 75 percent cost-share up to $3,000 for installing a rain
garden to reduce rainfall runoff through infiltration. Contracts would be 10 years in length. Residential and commercial projects must be designed according to RAIN GARDENS: A how-to manual for homeowners. The goal is to install 14 per year over a 10-year period based on the HLWD’s rain garden cost-share program. Staff time from the seven-county environmental offices, SWCD, and HLWD would be allocated as inkind at a rate of $35 per hour.
• Timeframe: Years 1-10 • Person(s) responsible: Seven-county Environmental offices, SWCD, and HLWD • Total costs: $609,000.00
• Cash: $420,000.00 o 140 rain gardens x $3,000/project = $420,000.00
• Inkind: $189,000.00 o 10 hrs x $35/hour x 140 projects = $49,000.00 o Landowner: 140 projects x $4,000/project x 25% = $140,000.00
Action B. Conduct an urban tree survey. • Work with local communities to develop an inventory of tree types and conditions in public
right-of-way. Staff time from the cities would be allocated as inkind at a rate of $35 per hour.
• Timeframe: Years 1-2 • Person(s) responsible: Seven-county Environmental offices, cities, and HLWD • Total costs: $29,820.00
• Cash: $0.00 • Inkind: $29,820.00
o 852 hrs x $35/hr = $29,820.00
Action C. Improve community tree diversity.

• Work with local communities to install and/or replace trees. Trees would be planted using the 10-20-30 rule to ensure diversity. The goal is to replace trees on 252 blocks in a 10-year period. Staff time from the cities would be allocated as inkind at a rate of $35 per hour.
• Timeframe: Years 3 - 10 • Person(s) responsible: Seven-county Environmental offices, cities, and HLWD • Total costs: $259,560.00
• Cash: $189,000.00 o 252 blks x 15 trees/blk x $50/tree and materials = $189,000.00
• Inkind: $70,560.00 • 8 hrs/blk x 252 blks x $35/hr = $70,560.00
Objective 6. Address In-lake Phosphorus Loading in Heron Lake Action A. Work with stakeholders to address internal loading in Heron Lake. • Input gathered through the planning process showed support for continuing drawdowns on
Heron Lake. In addition, input gathered indicated support for conducting an a three-year annual fish kill using rotenone and game fish stocking in the fourth year. It is estimated that the project cost would be $2.3 million. Project partners would work with landowners, DNR, HLWD, and other stakeholders to determine feasibility of this project. Staff time from the DNR and HLWD would be allocated as inkind at a rate of $35 per hour.
• Timeframe: Years 1-10 • Person(s) responsible: DNR, landowners, and HLWD • Total costs: $7,000.00
• Cash: $0.00 • Inkind: $7,000.00
o Staff time: 200 hrs x $35/hr = $7,000.00
Objective 7. Address Point Source Pollution Action A: Provide cost-share for SSTS upgrades. • Eligible landowners would qualify for 25 percent cost-share, maximum of $2,500, to upgrade
a SSTS. It is estimated that there are 3,818 systems in the watershed that are noncompliant. The goal is to install 1,600 systems in a 10-year period, based upon 40 per county per year. Staff time from the seven-county environmental offices and HLWD would be allocated as inkind at a rate of $35 per hour.
• Timeframe: Years 1-10 • Person(s) responsible: Seven-County Environmental Offices and HLWD • Total Costs: $4,224,000.00
• Cash: $4,000,000.00 o 1,600 SSTS x $2,500.00/SSTS cost-share = $4,000,000.00
• Inkind: $224,000.00 o Staff time: 4 hrs/SSTS x 1,600 SSTS x $35/hr = $224,000.00
Action B: Provide low interest loans for SSTS upgrades. • Eligible landowners would qualify for a low interest loan for 100 percent of the cost to
upgrade a SSTS. If a landowner receives the 25% cost-share identified in Objective 7, Action A, then only 75 percent of the project cost would be eligible for the loan. For simplicity, this action is calculated figuring a loan of 100 percent of the cost. It is estimated that there are 3,818 systems in the watershed that are noncompliant. The average cost of an

upgrade is $11,000. The goal is to install 1,600 systems in a 10-year period, based upon 40 per county per year. Staff time from the seven-county environmental offices and HLWD would be allocated as inkind at a rate of $35 per hour.
• Timeframe: Years 1-10 • Total Costs: $36,320,000.00
• Cash: $0.00 • Loan: $17,600,000.00
o 1,600 SSTS x $11,000.00/system = $17,600,000.00 • Inkind: $18,720,000.00
o Staff time: 20 hrs/SSTS x 1,600 SSTS x $35/hr = $1,120,000.00 o Landowner cost: 1,600 SSTS x $11,000.00/system = $17.600,000.00
Action C: Conduct annual MS4 meetings. • An annual meeting with the city of Worthington, HLWD, and the MPCA would be held for
the city of Worthington and HLWD to provide an update on activities completed in the previous year. It would also be an opportunity to review and discuss the implementation of the MS4 SWPPP. Adaptive management principles could also be applied in the meetings. Staff time preparing and attending the meetings would be allocated as inkind at a rate of $35 per hour.
• Timeframe: Years 1-10 • Total Costs: $8,400.00
• Cash: $0.00 • Inkind: $8,400.00
o Staff time: 4 hrs/mtg x 6 attendees x $35/hr x 10 yrs = $8,400.00 Action D: Conduct annual WWTF meetings. • An annual meeting with five WWTF, HLWD, and the MPCA would be held for those in
attendance to provide an update on activities completed in the previous year and WWTF changes. Staff time preparing and attending the meetings would be allocated as inkind at a rate of $35 per hour.
• Timeframe: Years 1-10 • Total Costs: $12,600.00
• Cash: $0.00 • Inkind: $12,600.00
o Staff time: 4 hrs/mtg x 9 attendees x $35/hr x 10 yrs = $12,600.00
Objective 8. Provide Educational Opportunities Action A. Offer manure management workshops. • Annual workshops in Nobles, Jackson, Murray, and Cottonwood Counties would be offered
to address manure management topics such as proper timing, rate, method of application, existing regulations, setback/winter application requirements, and nutrient management. Workshops would be conducted by county, SWCD, NRCS, HLWD and University of Minnesota Extension, and MPCA staff. Locations would be rotated throughout the watershed during the ten-year grant period. Staff time would be allocated as inkind at a rate of $35 per hour.
• Timeframe: Years 1-10

• Person(s) responsible: Nobles, Jackson, Murray, and Cottonwood County Environmental Offices, SWCD and NRCS Offices, U of M Extension, and MPCA
• Total Costs: $119,600.00 • Cash: $100,000.00
o $2,500/workshop x 4 co/yr x 10 yrs = $100,000.00 • Inkind: $19,600.00
o Staff prep time: 4 hrs/co x 4 co x $35/hr x 10 yr = $5,600.00 o Staff speaker time: 10 hrs/speaker x 4 co x $35/hr x 10 yr = $14,000.00
Action B. Provide urban BMP workshops. • Annual workshops in Nobles, Jackson, Murray, and Cottonwood Counties would be offered
to inform homeowners and city staff about urban stormwater control measures. Workshops would be conducted by county, SWCD, HLWD, University of Minnesota Extension, and MPCA staff. Locations would be rotated throughout the watershed during the ten-year grant period. Staff time would be allocated as inkind at a rate of $35 per hour.
• Timeframe: Years 1-10 • Person(s) responsible: Nobles, Jackson, Murray, and Cottonwood County Environmental
Offices, SWCD Offices, HLWD, U of M Extension, and MPCA • Total Costs: $119,600.00
• Cash: $100,000.00 o $2,500/workshop x 4 co/yr x 10 yrs = $100,000.00
• Inkind: $19,600.00 o Staff prep time: 4 hrs/co x 4 co x $35/hr x 10 yr = $5,600.00 o Staff speaker time: 10 hrs/speaker x 4 co x $35/hr x 10 yr = $14,000.00
Action C. Provide permeable paver demonstration sites. • Develop a 10-year agreement with homeowners and/or business owners to provide a
permeable paver demonstration site in each of the four core counties. Agreements will specify conditions for one education event at each site and maintenance. Education events would be conducted by county, SWCD, HLWD, and University of Minnesota Extension, and MPCA staff. Staff time would be allocated as inkind at a rate of $35 per hour.
• Timeframe: Years 1-10 • Person(s) responsible: Seven-County Environmental Offices, SWCD Offices, HLWD, U of
M Extension, and MPCA • Total Costs: $60,680.00
• Cash: $59,000.00 o Paver purchase/installation: 1,225 sq ft x $10/sq ft x 4 sites = $49,000.00 o $2,500/event x 4 events = $10,000.00
• Inkind: $1,680.00 o Staff time for paver installation: 8 hrs on-site x $35/hour x 4 sites = $1,120.00 o Staff prep time: 4 hrs/event x 4 co x $35/hour = $560.00
Action D. Develop a website. • Develop a website for the project, which will be linked to each county’s, as well as to the
HLWD and MPCA websites. This website would contain water quality information, project updates, and program availability. The website would be maintained by project staff.
• Timeframe: Years 1-10

• Person(s) responsible: Seven-County Environmental Offices, HLWD, and MPCA • Total Costs: $4,700.00
• Cash: $1,200.00 o $120/year for website hosting x 10 years = $1,200.00
• Inkind: $3,500.00 o Staff time: 10 hrs/year x $35/hr x 10 years = $3,500.00
Action E. Develop and distribute an annual newsletter. • An annual newsletter would be mailed to each household in the watershed informing
residents about programs and activities undertaken in the project. • Timeframe: Years 1-10 • Person(s) responsible: Watershed Coordinator and/or Technicians • Total Costs: $41,000.00
• Cash: $41,000.00 o Postage: $1,500/distribution x 10 years = $15,000.00 o Publication: $2,600/distribution x 10 years = $26,000.00
Action F. Facilitate Advisory and Technical Committee meetings. • Conduct annual meetings with Advisory and Technical Committee members to provide
project updates and obtain input and direction. Inkind would be contributed by Advisory Committee members at $15 per hour and Technical Committee members at $35 per hour.
• Timeframe: Years 1-10 • Person(s) responsible: Advisory and Technical Committee members • Total Costs: $28,600.00
• Cash: $300.00 o $30/meeting for refreshments x 10 years = $300.00
• Inkind: $28,300.00 o Advisory: 2 hrs/mtg/member x $15/hr x 8 members x 10 yrs = $2,400.00 o Technical: 2 hrs/mtg/member x $35/hr x 37 members x 10 yrs = $25,900.00
Action G. Provide quarterly project updates to watershed groups. • Conduct quarterly meetings with members of existing watershed groups and others to
provide project updates. The intent would be to consolidate several existing watershed groups and host one meeting in each county four times per year. Inkind would be contributed by attendees at $15 per hour.
• Timeframe: Years 1-10 • Person(s) responsible: Watershed Coordinator • Total Costs: $28,800.00
• Cash: $4,800.00 o $30/meeting for refreshments and mailing x 4 mtgs/yr x 4 counties x 10 years =
$4,800.00 • Inkind: $24,000.00
o 2 hrs/meeting/attendee x $15/hr x 20 members x 4 counties x 10 years = $24,000.00
Action H. Create project brochure.

• Develop a color brochure promoting the project and educating residents about the importance of water quality improvement efforts. The brochure would be distributed at events and displayed at project partners offices.
• Timeframe: Year 1 • Person(s) responsible: Watershed Coordinator • Total Costs: $900.00
• Cash: $900.00 o $0.45/brochure x 2,000 brochures = $900.00
• Inkind: $0.00 Action I. Promote Des Moines River enhancement through community events. • Coordinate with communities along the river to provide the public with educational and
recreational opportunities such as a booth at community events, canoe trips, and water quality education activities.
• Timeframe: Years 1 - 10 • Person(s) responsible: Watershed Coordinator • Total Costs: $5,000.00
• Cash: $5,000.00 o $500/year for promotion x 10 years = $5,000.00
• Inkind: $0.00
Objective 9. Effectiveness Monitoring Action A. Sample 15 stream sites for E. coli bacteria in WFDMR watershed. • Collect five E. coli samples per month at the 15 sites impaired for bacteria in Year 5 and
Year 10 of the project to determine implementation effectiveness. Monitoring of all 15 sites will be dependant on implementation practices installed during the project timeline. Samples should be collected from April 1-October 31 by Watershed Technicians and/or Coordinator. Shipping, ice and supplies will be additional costs. Field measurements of transparency, pH, dissolved oxygen, temperature and conductivity and visual observations will also be collected at each sampling occasion.
• Timeframe: Year 5 and 10 • Person(s) responsible: Watershed Technicians and/or Coordinator • Total Costs: $22,700.00
• Cash: $22,700.00 o Sample analysis: 5 sampling occasions/site x $20.00/sample x 15 sites/month x 7
months x 2 yrs=$21,000.00 o Ice: $5.00/occasion x 5 occasions/mo x 7 mo x 2 yrs = $350.00 o Shipping: $15.00/occasion x 5 occasions/mo x 7 mo x 2 yrs = $1,050.00 o Miscellaneous Supplies: $300.00
• Inkind: $0.00 Action B. Sample 15 stream sites for turbidity in WFDMR watershed. • Collect twenty-five turbidity, total suspended solids, total suspended volatile solids, and
chlorophyll-a samples per year at the 15 sites impaired for turbidity in Year 5 and Year 10 of the project to determine implementation effectiveness. Monitoring of all 15 sites will be dependant on implementation practices installed during the project timeline. Samples should be collected from ice-out through September by Watershed Technicians and/or Coordinator.

Often, this sampling will be conducted at the same time as the E. coli sampling so ice and shipping costs reflect the occasions when the sampling can not occur simultaneously. Field measurements of transparency, pH, dissolved oxygen, temperature and conductivity and visual observations will also be collected at each sampling occasion.
• Timeframe: Year 5 and 10 • Person(s) responsible: Watershed Technicians and/or Coordinator • Total Costs: $56,450.00
• Cash: $56,450.00 o Sample analysis: 25 samples/yr x $75.00/sample x 15 sites/yr x 2 years =
$56,250.00 o Ice: $5.00/occasion x 5 samples/yr not included in Action A x 2 yrs = $50.00 o Shipping: $15.00/occasion x 5 samples/yr not included in Action A x 2 yrs =
$150.00 • Inkind: $0.00
Action C. E. coli and turbidity synoptic surveys in WFDMR watershed. • Conduct a synoptic survey along six of the major tributaries into the WFDMR in Year 1.
This information will be useful in focusing future implementation dollars and provide a current baseline. Depending on funding timeline, this sampling could be repeated in the final year of the grant (if prior to Year 5). Collect at least 10 samples/subwatershed for analysis of turbidity and E. coli. Samples should be collected on three flow regimes (high, moderate and low) by Watershed Technicians and/or Coordinator. Field measurements of transparency, pH, dissolved oxygen, temperature, conductivity, and visual observations will also be collected at each sampling occasion.
• Timeframe: Year 1 • Person(s) responsible: Watershed Technicians and/or Coordinator • Total Costs: $8,200.00
• Cash: $8,200.00 o Dissolved oxygen, pH, temperature and conductivity field meter: $2,200.00 o Sample analysis: 6 subwatersheds x 10 sites/subwatershed x 3 samples/yrs x
$33.00/sample = $5,940.00 o Ice: $5.00/occasion x 3 occasions = $15.00 o Shipping: $15.00/occasion x 3 occasions = $45.00
• Inkind: $0.00 Action D. Monitor Heron Lake tributaries. • Continue current sampling regime of collecting thirty turbidity, total suspended solids, total
suspended volatile solids, total phosphorus, and ortho phosphorus samples per year at Okabena Creek, Jack Creek and the Heron Lake Outlet in Years 1-3. These sites also have continuous stage tracking equipment. Flow measurements are collected by the DNR. Samples should be collected from ice-out through September by HLWD staff, Watershed Technicians and/or Coordinator. Field measurements of transparency, pH, dissolved oxygen, temperature and conductivity and visual observations will also be collected at each sampling occasion.
• Timeframe: Years 1 - 3 • Person(s) responsible: HLWD staff, Watershed Technicians and/or Coordinator • Total Costs: $90,900.00
• Cash: $65,700.00

o Sample analysis: 30 samples/yr x $105.00/sample x 3 sites x 3 yrs = $28,350.00 o Ice: $5.00/occasion x 30 occasions x 3 yrs = $450.00 o Shipping: $10.00/occasion x 30 occasions x 3 yrs = $900.00 o DNR flow contract: $4,000.00/site/yr x 3 sites x 3 yrs = $36,000.00
• Inkind: $25,200.00 o Staff: 30 occasions x 8 hrs/occasion x $35/hr x 3 yrs = $25,200.00
Action E. Monitor North and South Heron Lake. • Collect 12 samples per year in Years 1-3 on North Heron Lake and South Heron Lake from
April through September. In addition, monthly samples will be collected from October through March for one year. Lab analysis of turbidity, total suspended solids, total suspended volatile solids, chlorophyll A, total phosphorus, and ortho phosphorus water column samples and total phosphorus and ortho phosphorus analysis of near bottom water samples. Samples would be collected by HLWD staff. Field measurements of Secchi disk readings, pH, dissolved oxygen, temperature and conductivity and visual observations will also be collected at each sampling occasion.
• Timeframe: Years 1-3 • Person(s) responsible: HLWD staff, Watershed Technicians and/or Coordinator • Total Costs: $23,730.00
• Cash: $11,970.00 o Summer sample analysis: 12 samples/yr x $135.00/sample x 2 sites x 3 yrs =
$9,720.00 o Winter sample analysis: 6 samples/yr x $135/sample x 2 sites x 1 yr = $1,620.00 o Summer Ice: $5.00/occasion x 12 occasions x 3 yrs = $180.00 o Winter Ice: $5.00/occasion x 6 occasions x 1 yr = $30.00 o Summer Shipping: $10.00/occasion x 12 occasions x 3 yrs = $360.00 o Winter Shipping: $10.00/occasion x 6 occasions x 1 yrs = $60.00
• Inkind: $11,760.00 o Staff-Summer sampling: 12 occasions/yr x 8 hrs/occasion x $35/hr x 3 yrs =
$10,080.00 o Staff-Winter sampling: 6 occasions/yr x 8 hrs/occasion x $35/hr x 1 yr =
$1,680.00 Action F. Conduct macrophyte, phytoplankton, zooplankton, and fisheries survey. • Utilize DNR Shallow Lakes and Fisheries units to conduct thorough macrophyte,
phytoplankton, zooplankton and fishery survey in Year 2. This would be done using protocol defined by DNR. Local staff would be available for assistance as needed.
• Timeframe: Year 2 • Person(s) responsible: HLWD staff, Watershed Technicians and/or Coordinator, and DNR • Total Costs: $11,777.50
• Cash: $0.00 • Inkind: $11,777.50
o Fisheries survey staff: 2 staff x 80 hrs x $35/hr = $5,600.00 o Fisheries survey mileage: 300 miles x $0.55/mile = $165.00 o Shallow Lakes survey: 2 staff x 80 hrs x $35/hr = $5,600.00 o Shallow Lakes survey mileage: 750 miles x $0.55/mile = $412.50

Objective 10. Project Administration Action A. Hire and House a Watershed Coordinator. • Hire a watershed coordinator to direct project activities and seek funding. Funds would also
be needed for a computer, telephone costs, and travel. This position would be housed in the HLWD office. HLWD would provide office space and supplies needed to support the position. The HLWD has the most experience with grant administration and implementation and would be able to provide first-hand assistance to the watershed coordinator.
• Timeframe: Years 1-10 • Person(s) responsible: HLWD • Total Costs: $1,018,700.00
• Cash: $979,700.00 o Salary and Benefits: $44/hr x 2080 hr/yr x 10 yrs = $915,200.00 o Equipment: 1 computer x $2,500.00/computer = $2,500.00 o Travel: 8000 mi/yr x $0.55/mi x 10 yrs = $44,000.00 o Telephone: $1,800.00/year x 10 yrs = $18,000.00
• Inkind: $39,000.00 o Office Space and Office Supplies: $3,900/yr x 10 yr = $39,000.00
Action B. Hire and House an Engineering Technician. • Hire an engineering technician to provide technical information for projects within the
watershed. Office and field equipment needed to support the position would also be purchased. This position would be housed in the Murray SWCD office. Housing a technician in an SWCD office provides optimum opportunities for direct contact with landowners.
• Timeframe: Years 1-10 • Person(s) responsible: Murray SWCD • Total Costs: $1,073,200.00
• Cash: $1,034,200.00 o Salary and Benefits: $44/hr x 2080 hr/yr x 10 yrs = $915,200.00 o Equipment: $75,000.00 o Travel: 8000 mi/yr x $0.55/mi x 10 yrs = $44,000.00
• Inkind: $39,000.00 o Office Space and Office Supplies: $3,900/yr x 10 yrs = $39,000.00
Action C. Hire and House Two Watershed Technicians. • Hire two watershed technicians to promote and enroll projects within the watershed. The
project would also provide the office and field equipment needed to support the positions. One position would be shared between the Jackson SWCD and Cottonwood SWCD office and the other technician would be shared between Nobles and Murray Counties. Housing will be provided by the respective county and/or SWCD offices. Housing a technician in an SWCD office provides optimum opportunities for direct contact with landowners.
• Timeframe: Years 1-10 • Person(s) responsible: Jackson SWCD, Cottonwood SWCD, Nobles and Murray counties • Total Costs: $1,252,600.00
• Cash: $1,174,600.00 o $26/hr x 2080 hr/yr x 2 technicians x 10 yrs = $1,081,600.00

o Equipment: 2 computers x $2,500.00/computer = $5,000.00 o Travel: 16,000 mi/yr x $0.55/mi x 10 yrs = $88,000.00
• Inkind: $78,000.00 o Office Space and Supplies: $3,900/yr x 2 technicians x 10 yrs = $78,000.00

8.0 Roles and Responsibilities of Project Partners MINNESOTA POLLUTION CONTROL AGENCY: The MPCA will support project partners’ efforts to execute implementation activities by providing implementation-funding opportunities, assistance with water quality monitoring plans, and TMDL project oversight. HERON LAKE WATERSHED DISTRICT: The HLWD will support and administer the activities assigned to them through the TMDL Implementation Plan as a means to improve water quality within the Heron Lake watershed and WFDMR watershed. The HLWD will provide office space and office supplies for the Watershed Coordinator. The HLWD will also provide technical assistance as needed. COUNTIES: Nobles, Jackson, Murray, Cottonwood, Pipestone, Lyon, and Martin Counties will support and administer the activities assigned to them through the TMDL Implementation Plan as a means to improve water quality within the Heron Lake watershed and WFDMR watershed. Each county will provide technical assistance as needed. Nobles County and Murray County will provide office space and office supplies for a watershed technician. SWCDs: The SWCDs in Nobles, Jackson, Murray, Cottonwood, Pipestone, Lyon, and Martin Counties support the WFDMR and Heron Lake TMDL Implementation Plan as a means to improve and protect water quality and quantity. Each individual SWCD will assist in all aspects of the objectives for this project. Jackson SWCD and Cottonwood SWCD will provide office space and office supplies for a watershed technician. Murray SWCD will provide office space and office supplies for an engineering technician. NRCS: The NRCS offices in Nobles, Jackson, Murray, Cottonwood, Pipestone, Lyon, and Martin Counties support the WFDMR and Heron Lake TMDL Implementation Plan as a means to improve and protect water quality and quantity. Each individual NRCS office will assist in all aspects of the objectives for this project. USFWS: The USFWS fully supports the WFDMR and Heron Lake TMDL Implementation Plan. The projects implemented through this effort will protect and restore key wetland and upland areas, which will provide multiple benefits including water quality improvement, water retention, and wildlife habitat. The USFWS will provide technical support for this effort. DNR: The DNR fully supports the WFDMR and Heron Lake TMDL Implementation Plan. The projects implemented will promote environmental educational efforts and application of those practices within the watershed, as well as monitor the effects upon Heron Lake and the Des Moines River. The DNR will provide technical support for this effort. BWSR: The BWSR supports the WFDMR and Heron Lake TMDL Implementation Plan as a means to improve and protect water quality and quantity. The BWSR will provide technical assistance for this project. WORTHINGTON, BREWSTER, OKABENA, LAKEFIELD, AND SWIFT BRANDS INC.: The Cities of Worthington, Brewster, Okabena, and Lakefield, as well as Swift Brands, Inc. support the WFDMR and Heron Lake TMDL Implementation Plan. The cities and industry will work with MPCA and project staff to meet the requirements for each respective NPDES permit.

SILVER LAKE WATERSHED: As a representative of the State of Iowa, the Silver Lake Watershed appreciates the opportunity to assist in Implementation Plan development and will provide technical assistance if needed. Interstate coordination is valuable to the project and may present opportunities in future funding endeavors. UNIVERSITY OF MINNESOTA EXTENSION: The U of M Extension supports the WFDMR and Heron Lake TMDL Implementation Plan as a means to provide educational opportunities for watershed residents. U of M Extension will provide technical assistance for the project. CROP CONSULTANTS: Crop consultants support the WFDMR and Heron Lake TMDL Implementation Plan as a means to improve and protect water quality and quantity. Crop consultants will assist with BMP promotion. LANDOWNERS: Landowners within the WFDMR will attend workshops and implement projects that will protect banks from erosion and runoff, address nonpoint source pollution through cropland changes, offer flood storage, and provide feedlot management.
9.0 Timeline Y 1 2 3 4Objective 1. Protect banks from erosion and runoff through buffer programs Action A. Provide a $500 per acre incentive for 15-year buffer strips x x x xAction B. Provide a $1,000 per acre incentive for perpetual buffer strips x x x xAction C. Cost-share and incentive program for harvested buffer program x x x xObjective 2. Address Nonpoint Source Pollution through cropland changes Action A. Replace open tile intakes with alternative tile intakes by providing up to 75% cost-share x x x x
Action B. Provide a $15 per acre incentive for variable rate fertilizer application x x x xAction C. Provide a annual $300 per acre incentive for planting a third crop x x x xObjective 3. Provide flood storage opportunities
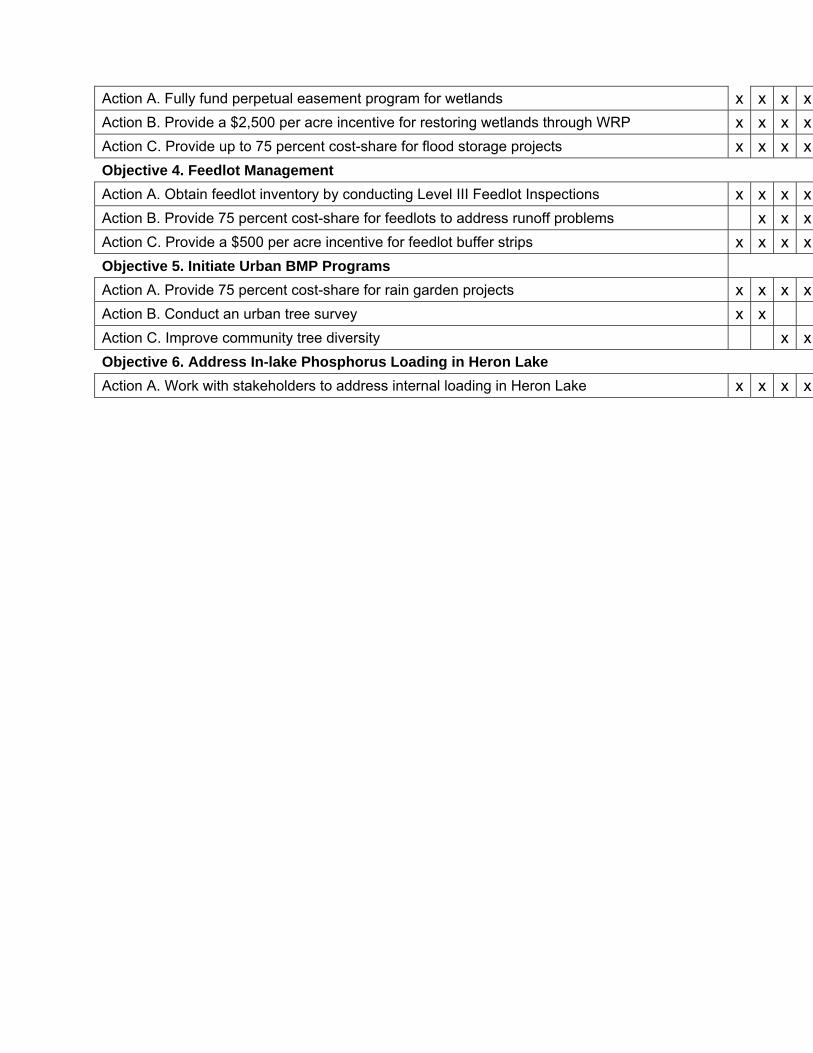
Action A. Fully fund perpetual easement program for wetlands x x x xAction B. Provide a $2,500 per acre incentive for restoring wetlands through WRP x x x xAction C. Provide up to 75 percent cost-share for flood storage projects x x x xObjective 4. Feedlot Management Action A. Obtain feedlot inventory by conducting Level III Feedlot Inspections x x x xAction B. Provide 75 percent cost-share for feedlots to address runoff problems x x xAction C. Provide a $500 per acre incentive for feedlot buffer strips x x x xObjective 5. Initiate Urban BMP Programs Action A. Provide 75 percent cost-share for rain garden projects x x x xAction B. Conduct an urban tree survey x x Action C. Improve community tree diversity x xObjective 6. Address In-lake Phosphorus Loading in Heron Lake Action A. Work with stakeholders to address internal loading in Heron Lake x x x x

Y 1 2 3 4Objective 7. Address Point Source Pollution Action A. Provide cost-share for SSTS upgrades x x x xAction B. Provide low interest loans for SSTS upgrades x x x xAction C. Conduct Annual MS4 meetings x x x xAction D. Conduct Annual WWTF meetings x x x xObjective 8. Provide Educational Opportunities Action A. Offer manure management workshops x x x xAction B. Provide urban BMP workshops x x x xAction C. Provide permeable paver demonstration sites x x x xAction D. Develop a website x x x xAction E. Develop and distribute an annual newsletter x x x xAction F. Facilitate Advisory and Technical Committee meetings x x x xAction G. Provide quarterly project updates to watershed groups x x x xAction H. Create project brochure x Action I. Promote Des Moines River enhancement through community events x x x xObjective 9. Effectiveness Monitoring Action A. Sample 15 stream sites for E. coli bacteria in WFDMR watershed Action B. Sample 15 stream sites for turbidity in the WFDMR watershed Action C. Conduct E. coli and turbidity synoptic surveys in WFDMR watershed x Action D. Monitor Heron Lake tributaries x x xAction E. Monitor North and South Heron Lake x x xAction F. Conduct macrophyte, phytoplankton, zooplankton, and fisheries survey x Objective 10. Project Administration Action A. Hire and house a watershed coordinator x x x xAction B. Hire and house an engineering technician x x x xAction C. Hire and house two watershed technicians x x x x
10.0 Adaptive Management Process The actions outlined in this implementation plan will decrease the pollutant loading to the WFDMR and Heron Lake. Funding opportunities are unclear; therefore, the changes expected are unknown. The cumulative effect on water quality is also unknown. A continual process of stream and lake water quality evaluation must be implemented to tailor implementation to the findings.

As implementation takes place, water quality monitoring will also occur to evaluate the impact collective practices have on watershed impairments. If the water quality improves, that is an indication that the approach is working and the course will be followed. If water quality does not improve, that indicates the approach is not sufficient or is targeted to the wrong sources. In this case, the approach would be evaluated and adjusted so that water quality improvements can be realized. This process is referred to as adaptive management. In order to be successful, this implementation plan must be adaptable to current and future research data. Practices or programs that are proven successful in reducing bacteria, turbidity, and/or excess nutrients in other watersheds may need to be incorporated into this plan. There may be programs that are not yet in the planning stages that would need to be analyzed and possibly incorporated. The best analysis of effects, public perception, and the success of each current or future objective would come with the participation of the Technical and Advisory Committees. As funding is secured and objectives are accomplished, the committees would continue to meet to analyze the successes and future steps needed to meet the goals of the TMDL Report. 11.0 Budget

Cash In-Kind Loan
Action A. Provide a $500 per acre incentive for 15-year buffer strips 750,000.00$ 255,000.00$ $
Action B. Provide a $1,000 per acre incentive for perpetual buffer strips 1,500,000.00$ 105,000.00$ $ Action C. Cost-share and incentive program for harvested buffers 600,000.00$ 105,000.00$ $
Subtotal 2,850,000.00$ 465,000.00$ $
Action A. Replace open tile intakes with alternative tile intakes by providing up to 75%
-
--
-
c 157,500.00$ 101,500.00$ $
Action B. Provide a $15 per acre incentive for variable rate fertilizer application 750,000.00$ 7,000.00$ $ Action C. Provide an annual $300 per acre incentive for planting a third crop 3,000,000.00$ 17,500.00$ $
Subtotal 3,907,500.00$ 126,000.00$ $
Action A. Fully fund perpetual easement program for wetlands 2,105,625.00$ 10,500.00$ $
Action B. Provide a $2,500 per acre incentive for restoring wetlands through WRP 750,000.00$ 3,500.00$ $ Action C. Provide up to 75 percent cost-share for flood storage projects 120,000.00$ 42,800.00$ $
Subtotal 2,975,625.00$ 56,800.00$ $
Action A. Obtain feedlot inventory by conducting Level III Feedlot Inspections -$ 124,600.00$ $
Action B. Provide 75 percent cost-share for feedlots to address runoff problems 5,325,000.00$ 1,814,760.00$ $ Action C. Provide a $500 per acre incentive for feedlot buffer strips 75,000.00$ 39,000.00$ $
Subtotal 5,400,000.00$ 1,978,360.00$ $
Action A. Provide 75 percent cost-share for rain garden projects 420,000.00$ 189,000.00$ $
Action B. Conduct an urban tree survey -$ 29,820.00$ $ Action C. Improve community tree diversity 189,000.00$ 70,560.00$ $
Subtotal 609,000.00$ 289,380.00$ $
Action A. Work with stakeholders to address internal loading in Heron Lake -$ 7,000.00$ $
Subtotal -$ 7,000.00$ $
Objective 4. Feedlot Management
Funding Sources
Objective 1. Protect banks from erosion and runoff through buffer programs
Objective 2. Address nonpoint source pollution through cropland changes
Objective 3. Provide flood storage opportunities
Objective 6. Address In-lake Phosphorus Loading in Heron Lake
Objective 5. Initiate Urban BMP Programs
-
--
-
-
--
-
-
--
-
-
--
-
-
-

Cash In-Kind Loan
hare for SSTS upgrades 4,000,000.00$ 224,000.00$ -$
terest loans for SSTS upgrades -$ 18,720,000.00$ 17,600,000.00$
al MS4 meetings -$ 8,400.00$ -$ al WWTF meetings -$ 12,600.00$ -$
4,000,000.00$ 18,965,000.00$ 17,600,000.00$
management workshops 100,000.00$ 19,600.00$ -$
n BMP workshops 100,000.00$ 19,600.00$ -$
eable paver demonstration sites 59,000.00$ 1,680.00$ -$
bsite 1,200.00$ 3,500.00$
istribute an annual newsletter 41,000.00$ -$ -$
isory and Technical Committee meetings 300.00$ 28,300.00$ -$
erly project updates to watershed groups 4,800.00$ 24,000.00$ -$
t brochure 900.00$ -$ -$ oines River enhancement through community events 5,000.00$ -$ -$
312,200.00$ 96,680.00$ -$
ream sites for E. coli bacteria in WFDMR watershed 22,700.00$ -$ -$
ream sites for turbidity in the WFDMR watershed 56,450.00$ -$ -$
li and turbidity synoptic surveys in WFDMR watershed 8,200.00$ -$ -$
n Lake tributaries 65,700.00$ 25,200.00$ -$
and South Heron Lake 11,970.00$ 11,760.00$ -$ ophyte, phytoplankton, zooplankton, and fisheries survey -$ 11,777.50$ -$
165,020.00$ 48,737.50$ -$
e a watershed coordinator 979,700.00$ 39,000.00$ -$
e an engineering technician 1,034,200.00$ 39,000.00$ -$ e two watershed technicians 1,174,600.00$ 78,000.00$ -$
3,188,500.00$ 156,000.00$ -$
Total of all Objectives 23,407,845.00$ 22,188,957.50$ 17,600,000.00$
Objective 10. Project Administration
Objective 9. Effectiveness Monitoring
Objective 8. Provide Educational Opportunities
Objective 7. Address Point Source Pollution
Funding Sources
Action A. Provide cost-s
Action B. Provide low in
Action C. Conduct annuAction D. Conduct annu
Subtotal
Action A. Offer manure
Action B. Provide urba
Action C. Provide perm
Action D. Develop a we
Action E. Develop and d
Action F. Facilitate Adv
Action G. Provide quart
Action H. Create projecAction I. Promote Des M
Subtotal
Action A. Sample 15 st
Action B. Sample 15 st
Action C. Conduct E. co
Action D. Monitor Hero
Action E. Monitor NorthAction F. Conduct macr
Subtotal
Action A. Hire and hous
Action B. Hire and housAction C. Hire and hous
Subtotal
Appendices Appendix 1: Committee Members Exhibit A: Advisory and Technical Committee Member Contact Information Appendix 2: TMDL Implementation Plan Kickoff Meeting – February 12, 2009 Exhibit A: Invite – Advisory Committee Exhibit B: Invite – Technical Committee

Exhibit C: Highlights of the WFDMR TMDL Report Exhibit D: Handouts Exhibit E: PowerPoint presentation – Process Overview Exhibit F: Minutes of the February 12, 2009 meeting Appendix 3: Bacteria Meeting – March 5, 2009 Exhibit A: PowerPoint presentation – TMDL Report Exhibit B: Handout – TMDL Report worksheet Exhibit C: PowerPoint presentation – USDA Programs Exhibit D: PowerPoint presentation – Feedlot and Manure Management Regulation Exhibit E: PowerPoint presentation – Operation and Maintenance of Septic Systems Exhibit F: PowerPoint presentation – Roundtable instructions Exhibit G: Handout – Discussion Questions Exhibit H: Memo to those not in attendance Exhibit I: Minutes of March 5, 2009 meeting Exhibit J: Memo with revised voting process Exhibit K: Voting results Appendix 4: Turbidity Meeting – March 26, 2009 Exhibit A: Agenda Exhibit B: PowerPoint presentation – Bacteria voting summary Exhibit C: Handout - Results Exhibit D: PowerPoint presentation – TMDL Report Exhibit E: Handout – TMDL Report worksheet Exhibit F: PowerPoint presentation – Turbidity BMPs Exhibit G: PowerPoint presentation – Crop Consultant view Exhibit H: PowerPoint presentation – Roundtable instructions Exhibit I: Handout – Roundtable questions Exhibit J: Memo to those not in attendance Exhibit K: Minutes of March 26, 2009 meeting Exhibit L: Roundtable summary Exhibit M: Voting Results Appendix 5: Landowner Meeting Exhibit A: Meeting notice Exhibit B: Agenda Exhibit C: PowerPoint presentation – Welcome Exhibit D: PowerPoint presentation – TMDL Report Exhibit E: PowerPoint presentation – Shallow Lake Management Exhibit F: Landowner Input Form Exhibit G: Landowner Input Form results Exhibit H: Landowner follow-up letter Exhibit I: Minutes of the April 7, 2009 meeting

Appendix 6: Excess Nutrients meeting – April 16, 2009 Exhibit A: Agenda Exhibit B: PowerPoint presentation – Turbidity voting summary Exhibit C: Handout - Turbidity Results Exhibit D: PowerPoint presentation – TMDL Report Exhibit E: Handout – TMDL Report worksheet Exhibit F: PowerPoint presentation – NPDES permitted facilities Exhibit G: PowerPoint presentation – Shallow Lake Management Exhibit H: PowerPoint presentation – Roundtable instructions Exhibit I: Handout - Roundtable discussion questions Exhibit J: Memo to those not in attendance Exhibit K: Roundtable Summary Exhibit L: Voting Results Exhibit M: Minutes of the April 16, 2009 meeting Appendix 7: Water Plan Coordinator and SWCD meeting – April 27, 2009 Exhibit A: Memo to water plan coordinators and SWCD staff Exhibit B: Questionnaire Exhibit C: draft implementation plan actions Exhibit D: Watershed county percentage Exhibit E: Minutes of the April 27, 2009 meeting Appendix 8: Draft Plan Review – May 21, 2009 Exhibit A: Memo to Advisory and Technical Committee members Exhibit B: Minutes of the May 21, 2009 meeting Appendix 9: Details Exhibit A: Calculation and documentation for each Action

Appendix 3-Exhibit G
Advisory Committee
Michael Hanson Cottonwood County 235 9th St. Windom, MN 56101 507-831-2060 [email protected]
Karen Johansen City of Currie 130 Everett St. Currie, MN 56123 507-395-2131, 507-360-1615 cell [email protected]
Tom Kresko MDNR 175 County Road 26 Windom, MN 56101 507-831-2900 [email protected]
Jeff Like Taylor Co-op 3230 Tamarack Ave. Slayton, MN 56172 507-836-6236 [email protected]
Clark Lingbeek Pheasants Forever 26992 570th Ave. Comfrey, MN 56019 507-920-9884 [email protected]
Don Louwagie MN Soybean Growers 2894 310th St. Marshall, MN 56258 507-532-6081 [email protected]
Rich Perrine Martin Co. SWCD 923 N. State St. #110 Fairmont, MN 56031 507-235-6680 [email protected]
Randy Schmitz City of Brewster 19984 Wass Ave. Brewster, MN 56119 507-842-5491 [email protected]
Technical Committee
Mark Vaniman USFWS 49663 Co. Rd. 17 Windom, MN 56101 507-831-2220 [email protected]
Wayne Smith Nobles County 315 10th St. Worthington, MN 56187 507-295-5322 [email protected]
Gordy Olson Jackson County 405 4th St. Jackson, MN 56143 507-847-2763 [email protected]
Chris Hansen Murray County PO Box 57 Slayton, MN 56172 507-836-6148 [email protected]
Pam Flitter Martin County 201 Lake Ave., Rm 104 Fairmont, MN 56031 507-238-3242 [email protected]
Roger Schroeder Lyon County 607 W. Main St. Marshall, MN 56258 507-532-8210 [email protected]
Kyle Krier Pipestone SWCD 119 2nd Ave. SW #13 Pipestone, MN 56164 507-825-6765 [email protected]
Ed Lenz Nobles SWCD 1567 McMillan St. #3 Worthington, MN 56187 507-376-9150 [email protected]
Brian Nyborg Jackson SWCD 603 S. Hwy. 86 Lakefield, MN 56150 507-662-6682 [email protected]
Howard Konkol Murray SWCD 2740 22nd St. #3 Slayton, MN 56172 507-836-6690 [email protected]
Kay Clark Cottonwood SWCD 339 9th St. Windom, MN 56101 507-831-1153 [email protected]
Rose Anderson Lyon SWCD 1424 E. Collge Dr. #600 Marshall, MN 56258 507-537-0396 [email protected]
Kathy Smith Martin SWCD 923 N. State St. #170 Fairmont, MN 56031 507-235-6680 [email protected]
Steve Beckel City of Jackson 80 W. Ashley St. Jackson, MN 56143 507-847-2723 No email - fax # 507-847-5586
Mike Haugen City of Windom PO Box 38 Windom, MN 56101 507-831-6138 [email protected]

Appendix 3-Exhibit G
Kevin Nelson City of Okabena PO Box 8 Okabena, MN 56161 507-853-4500 [email protected]
Dwayne Haffield City of Worthington PO Box 279 Worthington, MN 56187 507-372-8641 [email protected]
Jason Rossow City of Lakefield PO Box 900 Lakefield, MN 56150 507-662-5920 [email protected]

Appendix 3-Exhibit G
Randy Markl DNR - Windom 175 Co. Rd. 26 Windom, MN 56101 507-831-2900 [email protected]
Judy Markl Talcot Lake WMA 40249 Co. Rd. 7 Dundee, MN 56131 507-468-2248 [email protected]
Todd Kolander DNR - Mankato 1160 S. Victory Dr. Mankato, MN 56001 507-389-6712 [email protected]
Wendy Krueger DNR - Slayton 2611 Broadway Ave. Slayton, MN 56172 507-836-6919 [email protected]
Lucas Youngsma DNR - Marshall PO Box 111 Marshall, MN 56258 507-537-7258 [email protected]
Stephanie McLain Nobles NRCS 1567 McMillan St. #3 Worthington, MN 56187 507-376-9150 [email protected]
Joel Poppe Jackson NRCS 603 S. Hwy. 86 Lakefield, MN 56150 507-662-6682 [email protected]
Brian Christiansen Murray NRCS 2740 22nd St. #3 Slayton, MN 56172 507-836-6690 [email protected]
April Sullivan Cottonwood NRCS 339 9th St. Windom, MN 56101 507-831-1153 [email protected]
Carissa Spencer Martin NRCS 923 N. State St. #110 Fairmont, MN 56031 507-235-6670 [email protected]
Jerry Purdin Pipestone NRCS 119 2nd Ave. SW #13 Pipestone, MN 56164 507-825-5478 [email protected]
Jamie Thomazin Lyon NRCS 1424 E. Collge Dr. #600 Marshall, MN 56258 507-537-1401 [email protected]
Don Hagen Silver Lake Watershed 3302 Main Street Emmetsburg, IA 50536 712-852-3386 [email protected]
Ross Behrends HLWD 1567 McMillan St. #3 Worthington, MN 56187 507-376-9150 [email protected]
Melanie Luinenburg HLWD PO Box 345 Heron Lake, MN 56137 507-793-2462 [email protected]
Bob Krebs Swift 1700 NE Hwy. 60 Worthington, MN 56187 507-372-2121 [email protected]
Matt Drewitz BWSR 261 Highway 15 S. New Ulm, MN 56073 507-766-5020 [email protected]
Contacts
Jan Voit HLWD PO Box 345 Heron Lake, MN 56137 507-793-2462 [email protected]
Kelli Daberkow MPCA 1420 E. College Drive, Suite 900 Marshall, MN 507-476-4251 [email protected]
Heron Lake Watershed District PO Box 345, Heron Lake, MN 56137
507-793-2462 ~ FAX 507-793-2253 Toll free: 888-878-4345
Email: [email protected] Web: www.hlwdonline.org

Appendix 3-Exhibit G
TO: TMDL Study Advisory Committee FROM : Jan Voit, District Administrator SUBJECT: Implementation Plan Kickoff Meeting DATE: February 9, 2009
After all those months of waiting and wondering, the West Fork Des Moines River and Heron Lake TMDL Study was approved on December 18, 2008! You can view the report online at the website listed below. Each committee member will receive a hard copy of the report at the kickoff meeting.
What did the study entail?
• Addressing 32 impairments, making us the first in Minnesota to do a TMDL Implementation Plan of this magnitude
• First in Minnesota to address TMDLs on a basin-wide scale • First in Minnesota to tackle excess nutrients, turbidity, and fecal in TMDL study
and implementation plan What’s next? It’s time to roll up our sleeves and get to work on the Implementation Plan. This plan has to be written by local entities and approved by MPCA before we can apply for implementation funds! We would like to apply for funds this fall, which puts us on an aggressive schedule. With your help, HLWD staff will draft the plan. A technical committee will also be available to assist with learning more about the impairments and clean up measures. Kelli Daberkow, MPCA, will be our local contact. Let’s get together and get started!
• When: Thursday, February 12 • Where: Heron Lake Watershed District office, Heron Lake • Time: 10:00 a.m. – 12:00 p.m. • Agenda: TMDL report review, Advisory Committee role and expectations, and
education Thanks for hanging in there through this process. We’re looking forward to working with you to write the implementation plan. If you cannot make the meeting, it is very important that you let me know. Either send an email to me at [email protected] or call 507-793-2462. Should you have any questions, please do not hesitate to contact me. Attached is a list of committee members. Please review and carpool with others if possible!
Heron Lake Watershed District PO Box 345, Heron Lake, MN 56137

Appendix 3-Exhibit G
507-793-2462 ~ FAX 507-793-2253 Toll free: 888-878-4345
Email: [email protected] Web: www.hlwdonline.org
TO: TMDL Study Technical Committee FROM : Jan Voit, District Administrator SUBJECT: Implementation Plan Kickoff Meeting DATE: February 9, 2009
After all those months of waiting and wondering, the West Fork Des Moines River and Heron Lake TMDL Study was approved on December 18, 2008! You can view the report online at the website listed below. Each committee member will receive a hard copy of the report at the kickoff meeting.
What did the study entail?
• Addressing 32 impairments, making us the first in Minnesota to do a TMDL Implementation Plan of this magnitude
• First in Minnesota to address TMDLs on a basin-wide scale • First in Minnesota to tackle excess nutrients, turbidity, and fecal in TMDL study and
implementation plan
What role do you play?
As you may know, an advisory committee was developed early in the TMDL Study and recommended by many of you. The Advisory Committee represents various interests throughout the watershed including a technical component. This committee is still in existence and will be helping with the Implementation Plan.
But, the Implementation Plan can’t be written without your technical expertise. Your experience working with point and nonpoint source pollution on a daily basis is invaluable to this effort. We’re counting on you to help us, too!
What’s next?
It’s time to roll up our sleeves and get to work on the Implementation Plan. This plan has to be written by local entities and approved by MPCA before we can apply for implementation funds! We would like to apply for funds this fall, which puts us on an aggressive schedule. With your help, HLWD staff will draft the plan. Kelli Daberkow, MPCA, will be our local contact.
Let’s get together and get started!
• When: Thursday, February 12 • Where: Heron Lake Watershed District office, Heron Lake • Time: 1:00 p.m. – 3:00 p.m. • Agenda: TMDL report review, Technical Committee role and expectations, and
education
We’re looking forward to working together to write the implementation plan!
If you cannot make the meeting, if you are not interested in serving, or would feel more comfortable having another person from your office serve on the committee, it is very important that you let me know. Either send an email to me at

Appendix 3-Exhibit G
[email protected] or call 507-793-2462. Should you have any questions, please do not hesitate to contact me. Attached is a list of committee members. Please review and carpool with others if possible! WFDMR TMDL Report
Pages to review
Page 4: Impairments addressed in the report Page 5: TMDL Map Page 9-11: Section 2.2 Watershed Characteristics
Fecal Coliform Bacteria
Page 13: Table 3.1 Page 14: Figure 3.1 Page 14: Conclusions Page 18-21: Sources Page 61: Section 3.5 Critical Conditions
Turbidity
Page 66-70: Section 4.2 Turbidity Sources and Current Contributions Page 67: Figure 4.1
Page 107-109: Section 4.5 Conclusions Excess Nutrients
Page 114-117: Section 5.2 Sources and Current Contributions Page 115: Figure 5.4
Page 127-129: Section 7.0 Implementation Page 162-165: Appendix E: Agroregion BMP matrix Handouts provided to Committee Members
Protecting Water Quality from Agricultural Runoff This is a fact sheet about how agricultural runoff affects water quality (March 2005, EPA 841-F-05-001). http://www.epa.gov/owow/nps/Ag_Runoff_Fact_Sheet.pdf Conservation Buffer Facts http://www.conservationinformation.org/?action=learningcenter_core4_conservationbuffer Facts about individual sewage-treatment systems--Sewage treatment in a soil system http://www.pca.state.mn.us/publications/wq-wwists1-11.pdf Low-Cost Conservation Practices http://wrc.umn.edu/publications/lowcost.pdf MPCA’s Why treat sewage? factsheet http://www.pca.state.mn.us/publications/wq-wwists1-10.pdf MPCA’s Bacteria: Sources, Types and Impacts on Water Quality http://www.pca.state.mn.us/publications/wq-iw3-20.pdf Conservation Buffer Facts http://www.conservationinformation.org/?action=learningcenter_core4_conservationbuffer Runoff Water Quality and Crop Responses To Variable Manure Application Rates By: Neil C. Hansen http://wrc.umn.edu/research/competitivegrants/archives/reports/2001hansen.pdf

Appendix 3-Exhibit G
Best Management Practices for Pathogen Control in Manure Management Systems (http://www.extension.umn.edu/distribution/livestocksystems/components/8544.pdf) Nutrient Management (http://www2.ctic.purdue.edu/Core4/CT/Choices/Choice1.html) Manure Testing (http://www2.ctic.purdue.edu/Core4/CT/Choices/Choice4.html) Planned Grazing System (http://www2.ctic.purdue.edu/Core4/CT/Choices/Choice9.html) Manure Storage (http://www2.ctic.purdue.edu/Core4/CT/Choices/Choice24.html) Low-Cost Conservation Practices (http://wrc.umn.edu/publications/lowcost.pdf) Conservation Buffer Facts (http://www.conservationinformation.org/?action=learningcenter_core4_conservationbuffer Pest Management (http://www2.ctic.purdue.edu/Core4/CT/Choices/Choice2.html) Crop Residue Management (http://www2.ctic.purdue.edu/Core4/CT/Choices/Choice5.html) Crop Rotation (http://www2.ctic.purdue.edu/Core4/CT/Choices/Choice6.html) Filter Strip (http://www2.ctic.purdue.edu/Core4/CT/Choices/Choice7.html) Wildlife Upland Habitat (http://www2.ctic.purdue.edu/Core4/CT/Choices/Choice10.html) Critical Area Planting (http://www2.ctic.purdue.edu/Core4/CT/Choices/Choice12.html) Contour Strip-cropping (http://www2.ctic.purdue.edu/Core4/CT/Choices/Choice13.html) Contour Buffer Strip (http://www2.ctic.purdue.edu/Core4/CT/Choices/Choice14.html) Contour Farming (http://www2.ctic.purdue.edu/Core4/CT/Choices/Choice15.html) Field Border (http://www2.ctic.purdue.edu/Core4/CT/Choices/Choice16.html) Windbreak (http://www2.ctic.purdue.edu/Core4/CT/Choices/Choice17.html) Pasture Planting (http://www2.ctic.purdue.edu/Core4/CT/Choices/Choice18.html) Tree Planting (http://www2.ctic.purdue.edu/Core4/CT/Choices/Choice19.html) Cover Crop (http://www2.ctic.purdue.edu/Core4/CT/Choices/Choice20.html) Terrace (http://www2.ctic.purdue.edu/Core4/CT/Choices/Choice21.html) Water and Sediment Control Basin (http://www2.ctic.purdue.edu/Core4/CT/Choices/Choice22.html) Farm Pond (http://www2.ctic.purdue.edu/Core4/CT/Choices/Choice23.html) Grade Control Structure (http://www2.ctic.purdue.edu/Core4/CT/Choices/Choice25.html) Diversion (http://www2.ctic.purdue.edu/Core4/CT/Choices/Choice26.html) Grassed Waterway (http://www2.ctic.purdue.edu/Core4/CT/Choices/Choice27.html) Stream Protection (http://www2.ctic.purdue.edu/Core4/CT/Choices/Choice28.html) Wetland Enhancement (http://www2.ctic.purdue.edu/Core4/CT/Choices/Choice29.html)

Appendix 3-Exhibit G
Wetland (http://www2.ctic.purdue.edu/Core4/CT/Choices/Choice30.html)

Appendix 3-Exhibit G

Appendix 3-Exhibit G
TMDL Implementation Plan Development Meeting February 12, 2009, 10 am and 1 pm Heron Lake Community Center, Heron Lake, MN
Attendance
The Advisory Committee met at 10 am. Attendees: Randy Schmitz, Clark Lingbeek, Don Louwagie, Tom Kresko, Ross Behrends, Rich Perrine, Marlene Smith, Kelli Daberkow, Jan Voit, and Melanie Luinenburg. The Technical Committee met at 1 pm. Attendees: Chuck Tennessen, Todd Kolander, Jason Rossow, Ed Lenz, Wayne Smith, Don Hagen, Jerry Purdin, Joel Poppe, Randy Markl, Brian

Appendix 3-Exhibit G
Nyborg, April Sullivan, Kay Clark, Dave Bucklin, Mark Hiles, Gordy Olson, Ross Behrends, Kelli Daberkow, Jan Voit, and Melanie Luinenburg
Minutes The format for both meetings was similar and summarized below. + Jan Voit welcomed everyone and provided background information for the Technical
Committee. + Kelli Daberkow explained the implementation plan process. The goal is to have a draft
implementation plan to MPCA by August 1, 2009. + Jan Voit explained upcoming meetings. The Advisory Committee decided the best time to
meet was 1:00 p.m. There will be four meeting held in Heron Lake. The dates are February 26, March 12, March 26 and April 16. Each meeting will focus on one of the impairments and the last meeting will be spent reviewing the draft report. A meeting schedule was handed out.
+ Kelli Daberkow went through the TMDL report highlights. Committee members were encouraged to read the highlighted portions of the report. A binder was provided with the TMDL report and BMP information.
+ Jan reviewed the binder contents. + Kelli wrapped up with final thoughts and homework assignments.
Discussion Advisory Committee:
+ A question was raised about the DNA sampling/fingerprinting progress. + A question was raised on involving the rural population and communicating this project’s
progress. It was noted that there are several publicizing efforts through the MPCA and HLWD to promote this process, but there is no money for direct targeting of the rural population. The committee was reminded that they are representing a portion of the rural population.
+ It was suggested that crop consultants be involved due to their interaction with agricultural producers. It may be valuable to have a crop consultant conduct a presentation.
+ Discussion was held about the CSP program constraints. Technical Committee:
+ Tom Riordin is no longer mayor. Kay Clark will contact the new mayor, Kirby Kruse, to see who can participate from the city of Windom.
+ Jan and Kelli will go through this presentation with those that couldn’t make it today. + Discussion was held about the funding availability and shortages.
+ A question was raised about the staffing possibilities. It was noted that for a successful project, staff is needed.

Appendix 3-Exhibit G
+

Appendix 3-Exhibit G

Appendix 3-Exhibit G

Appendix 3-Exhibit G
Fecal Coliform Bacteria TMDL Report Worksheet Thursday, March 5, 2009
1. There are ______ reaches in the WFDMR watershed with fecal coliform
bacteria impairments. 2. Areas on the map that do not show impairments mean:
a. No problem b. Have not been sampled
3. The bacteria issue should be viewed:
a. By impairment b. Watershed wide
4. Monitoring shows bacteria is worst in the _____________ after rain events
and in the _______________ during dry and wet conditions.
5. ______________, _________________, _______________, and
_________________ are the four sources of bacteria.
6. List the problems and conditions with livestock-related issues:
a. _______________________________________
b. _______________________________________
c. _______________________________________
7. List the problems and conditions with human-related issues:
a. _______________________________________
b. _______________________________________
8. List the problem and condition with wildlife-related issues:
a. _______________________________________
9. List the problem and condition with pet-related issues:
a. _______________________________________
10. For implementation to address bacteria, the TMDL report suggests: a. ___________________________________________
b. ___________________________________________

Appendix 3-Exhibit G
c. ___________________________________________
d. ___________________________________________
e. ______________________________________
One minute brainstorm • Bad after it rains from Spring through Summer
What activities occur from April to October that runoff is carrying bacteria to the
river?
• Bad in dry conditions in Summer
What activities are occurring from May-October that causes the impairment?

Appendix 3-Exhibit G Appendix 3-Exhibit G

Appendix 3-Exhibit G

Appendix 3-Exhibit G

Appendix 3-Exhibit G

Appendix 3-Exhibit G

Appendix 3-Exhibit G

Appendix 3-Exhibit G

Appendix 3-Exhibit G

Appendix 3-Exhibit G

Appendix 3-Exhibit G

Appendix 3-Exhibit G

Appendix 3-Exhibit G

Appendix 3-Exhibit G

Appendix 3-Exhibit G
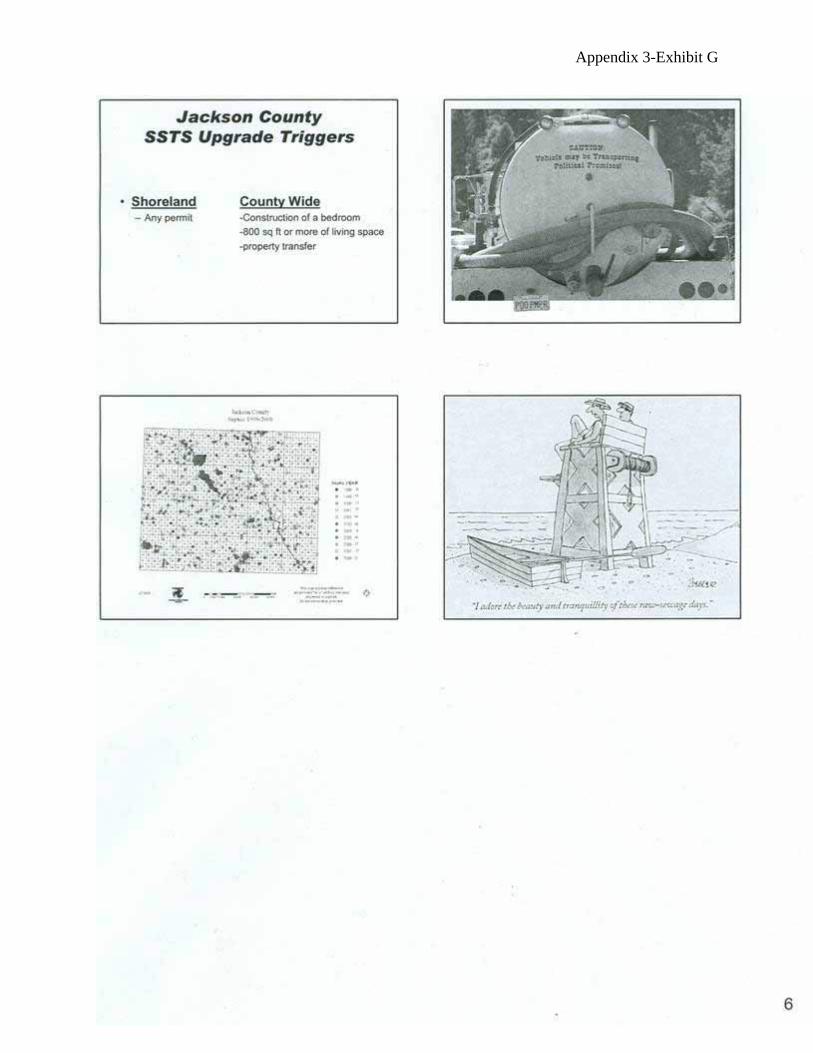
Appendix 3-Exhibit G

Appendix 3-Exhibit G

Appendix 3-Exhibit G
Fecal Coliform Bacteria Roundtable Discussion Questions
Thursday, March 5, 2009
1. List at least five measures* could be used to reduce fecal coliform bacteria
in the WFDMR watershed. How does that relate to the TMDL report? 1. _______________________________________________
2. _______________________________________________
3. _______________________________________________
4. _______________________________________________
5. _______________________________________________
2. What assistance or actions* are needed to implement the measures listed
above? (Monetary, regulatory control, bribes, treats, or ridicule if not implemented)
1. _______________________________________________
2. _______________________________________________
3. _______________________________________________
4. _______________________________________________
5. _______________________________________________
3. Should fecal coliform bacteria efforts be focused in a subwatershed (if so,
which one) or implemented on a willing landowner basis, regardless of location?
*Examples: Measures: Livestock exclusion Manure Application Assistance/Actions: $1.00/ft fencing incentive TIMP-Turn In Manure Polluters program

Appendix 4-Exhibit I
DEPARTMENT: POLLUTION CONTROL AGENCY SF-00006-05 (4/86)
STATE OF MINNESOTA
DATE: March 9, 2009 Office Memorandum
TO: Kevin Nelson
FROM: Kelli Daberkow Hydrologist Watershed Section Regional Division
PHONE: 507-476-4251
SUBJECT: West Fork Des Moines River Implementation Plan Development Meeting
Hi there! I am sorry that you missed our second West Fork Des Moines River TMDL Implementation Plan meeting. We focused on addressing the fecal coliform bacteria portion of the TMDL report. There were four presentations given; the presentation slides are enclosed. Roundtable discussions were held and the committee listed several activities that could be accomplished to address bacteria in the watershed. The final portion of the meeting was for each committee member to vote on two activities that they believe would address bacteria the most. Jan Voit, Heron Lake Watershed District Administrator or I will be in contact with you to review the following meeting materials. Enclosures: 1. February 12, 2009 meeting minutes 2. Whoa, Bacteria! presentation Kelli Daberkow, MPCA 3. Septic Systems and TMDLs presentation Ben Crowell, Jackson County Environmental Office 4. USDA Programs presentation Brian Christianson, Murray NRCS 5. Feedlot and Manure Management Regulation presentation Ben Crowell, Jackson County Environmental Office 6. TMDL worksheet and 1 minute brainstorm (corresponds with Whoa, Bacteria! presentation) 7. Round table discussions handout Due to scheduling conflicts, the March 12 turbidity meeting has been postponed to March 26. The meeting will be at 1:00 pm at the Heron Lake Community Center. Please let Jan Voit know if you will not be able to attend.
TMDL Implementation Plan Development Meeting
Thursday, March 5, 2009 at 1:00 p.m. Senior Citizens Room, Heron Lake Community Center, Heron Lake, MN

Appendix 4-Exhibit I
Attendance
Randy Schmitz, Clark Lingbeek, Don Louwagie, Ross Behrends, Rich Perrine, Mike Hanson, Kelli Daberkow, Jan Voit, Melanie Luinenburg, Ed Lenz, Wayne Smith, Don Hagen, Joel Poppe, Randy Markl, April Sullivan, Dave Bucklin, Brad Harberts, Roger Schroeder, Ben Crowell, Steve Beckel, Mike Haugen, Brian Christiansen, Dwayne Haffield, Chris Hansen, Howard Konkol, and Matt Drewitz
Minutes
Jan Voit welcomed everyone, asked all to introduce themselves, and reminded the committee of the importance of their decisions. The task of the day was to determine implementation measures and actions that will address the impairment and will be accepted by the general public.
Jan presented the agenda for the meeting and distributed discussion questions. Kelli Daberkow provided a summary of the fecal coliform bacteria portion of the TMDL Study. A
worksheet was distributed to go along with Kelli’s presentation. Participants were asked to complete the worksheet as the presentation was given, as a means to help reinforce the information presented.
Ben Crowell, Jackson County Environmental Services, gave a presentation about sewage, septic system design and components and options for reducing bacteria in surface water.
The group took a 10-minute break. Brian Christiansen, Murray NRCS, presented information about USDA programs such as EQIP and WHIP,
Land Rental Programs such as CRP, CCRP, and GRP, and easement programs such as WRP. Brian also presented information on a new program called CSTP, which is a new version of CSP.
Ben Crowell, Jackson County Environmental Services, presented information about feedlot and manure management regulations. Ben also provided information on activities that would address bacteria.
Kelli Daberkow explained the procedure for the round table discussions. Jan Voit and Melanie Luinenburg assigned participants to five tables.
Each table discussed the following questions: - List at least five measures that could be used to reduce fecal coliform bacteria in the WFDMR
watershed. How does that relate to the TMDL report? - What assistance or actions are needed to implement the measures listed above? (monetary,
regulatory control, bribes, treats, or ridicule if not implemented). - Should fecal coliform bacteria efforts be focused in a subwatershed (if so, which one) or
implemented on a willing landowner basis, regardless of location? Each table reported on their discussion. Jan recorded the ideas on a PowerPoint slide. Kelli reported that the turbidity meeting for March 12, 2009 has been postponed until March 26, 2009. Participants voted on their two top measures and actions. The votes were tallied by Jan and Kelli. Voting results were presented.
Discussion Question: Do counties have to report septic compliance inspections to MPCA? A: No. Question: If the county sends out a reminder sheet every three years to have the septic system pumped out,
couldn’t the pumper send the sheet in to MPCA? A: That’s a good idea. However, not all counties send out reminder sheets.
Discussion was held about CSTP and funding. Question: What are some of the popular implementation practices in Murray County and why are they so
popular? A: In Murray County, nutrient and pest management is doing the best, affecting field runoff and feedlots. Many people are also switching to strip-till and no-till.
A request was made to inform the agricultural producer groups regarding these meetings.
Heron Lake Watershed District PO Box 345, Heron Lake, MN 56137

Appendix 4-Exhibit I
507-793-2462 ~ FAX 507-793-2253 Toll free: 888-878-4345
Email: [email protected] Web: www.hlwdonline.org
TO: TMDL Implementation Plan Advisory and Technical Committee Members FROM: Jan Voit, District Administrator DATE: March 10, 2009 SUBJECT: Roundtable Discussion and Voting Process from March 5 meeting The interaction at the March 5 meeting was great. It is apparent that there are lots of good ideas about the many possibilities that could be used to address the fecal coliform bacteria problems in the watershed. In reviewing the votes it was difficult to quantify actions to address the identified measures. In order to make this plan effective, we need to have specific actions to address the measures that were identified. Here’s an example from last week’s meeting: Measure Action Manure application nutrient management education While the measure is definitive, the action could take several different courses. A better action example might be: Measure Action Manure application workshops for landowners to provide information
about proper application techniques (1 workshop per county per year)
More detailed actions are needed before I can begin writing the plan. Below are the measures and actions summarized by your group. I would appreciate each of you providing further information for each action. If you could return your individual ideas for each action to me as soon as possible, but no later than Friday, March 13, I would appreciate it immensely. The results will be compiled on Monday, March 16 and redistributed to each of you. Then, you will again be asked to vote for your top two measures and actions. The votes must be cast no later than Thursday, March 19. The results will be presented at the meeting on March 26. If you have any questions or need clarification about any of this, please do not hesitate to contact Kelli Daberkow, [email protected] or 507-476-4251 or me at the above email or telephone.
Bacteria Voting Results
Measure Action Manure Management - targeted, Level III feedlot inspections/site visits by staff (new, existing or
interns) III - annual workshops/short class by new and/or existing county staff (various
topics such as: proper timing, rate, and method of application) II

Appendix 4-Exhibit I
- permit that spells out guidelines for manure application I - media blitz conducted throughout the watershed using radio, newspapers, and
newsletters to give quick facts about manure application, and info on where to get more information
- mailings/materials to watershed wide producers regarding manure management issues
- workshop at an installed system – explain storage/handling benefits, improved agronomics, and reductions in water quality I
- provide on-site survey to gather tile intake locations and slopes through GPS/GIS
- provide landowner/operator with a map showing buffers and setbacks for stockpiling
- teach existing regulations and have a mandatory two-year refresher course with 75% cost-share II
- education and side-by-side trials - provide education through university extension services - use BMP Challenge to provide possible producer income protection - $30/acre incentive for no winter application in areas within shoreland or fields
with open tile intakes - $100/producer incentive for developing a Manure Management Plan for 100+
animal unit facility, maximum100 producers - $100/producer incentive for developing Manure Management Plan, maximum
100 producers I - $200/operation/year incentive for soil sampling I - $0.10/acre incentive for sampling kits for soil and manure I - standardized reporting forms to be filled out and reported yearly I - $100/applicator incentive for manure applicator calibration, maximum 100
applicators - incentives to cover engineering costs - incentives for small grains and hay fields for manure application II - $300/acre incentive for feedlot and field buffer strips, only eligible for buffers
that are greater than 66’ wide and a 15-year contract IIII - incentive of $2/acre for manure application requirements that are established
are met - Offer current CRP rental rates and incentives for additional acres that
wouldn’t qualify for CRP (extend to 150’?) - $100/acre incentive for feedlot and field buffers, $2,000 acre maximum II - $160 per acre incentive for feedlot and field buffers I - $3000/acre incentive for permanent easement - $10/acre incentive if buffer strip width exceeds 1.5 times the base requirement - cost-share for small grains and hay fields for manure application - 75% cost-share using multiple programs/partners I - low interest loans for storage or feedlot fixes I - require 13 month storage capabilities to any new barn in watershed - be sure current mandates are policed and fines are given when they are not I - enforce the 16.5’ required buffer along drainage ditches I - rewards for the best managed sites, free trips to ag events (state fair, farm
bureau, etc) - add small grain or hay in rotation to reduce soil loss

Appendix 4-Exhibit I
- Once a year check to see that required and/or incentive installed buffers are in place and maintained
- larger window for application on wheat stubble planted to corn Grazing - $5/foot incentive for new fencing for livestock exclusion I
- $20/acre/year for 10-year intensive rotational grazing plan I - One-time $80 per acre incentive for interseeding degraded pasture lands - $1.50 per foot based on 4 strand wire fence
Open Tile Intakes - 75% cost-share for rock inlets, maximum $300/intake
- 50% cost-share for rock inlets maximum $500/intake II - demonstration sites – one per township in road ditches - site tour showing different method or stages of construction and identifying
benefits and function I Septic Systems/ - low interest loans for 100% of project cost IIIII Unsewered Communities - $500 per SSTS incentive
- $1000 per SSTS incentive - $2,000 per system incentive III - 75% cost-share, maximum of $2,500 per system 300 systems IIII - 50% cost-share up to $2,000 - Have a standardized reporting form to be filled out by a licensed professional
and to be submitted yearly - Mailings - explore design options for clustered systems - research grant and loan opportunities offered by the USDA to install
community sewer systems I
Heron Lake Watershed District PO Box 345, Heron Lake, MN 56137
507-793-2462 ~ FAX 507-793-2253 Toll free: 888-878-4345
Email: [email protected] Web: www.hlwdonline.org
TO: TMDL Advisory Committee and Technical Committee Members FROM : Jan Voit, District Administrator SUBJECT: TMDL Implementation Plan Meeting - Turbidity DATE: March 24, 2009 Our next scheduled meeting to work on the West Fork Des Moines River and Heron Lake TMDL Implementation Plan is scheduled for Thursday, March 26 at 1:00 p.m. at the Heron Lake Community Center. An agenda for the meeting is included below.
Hello Turbidity! Meeting Agenda
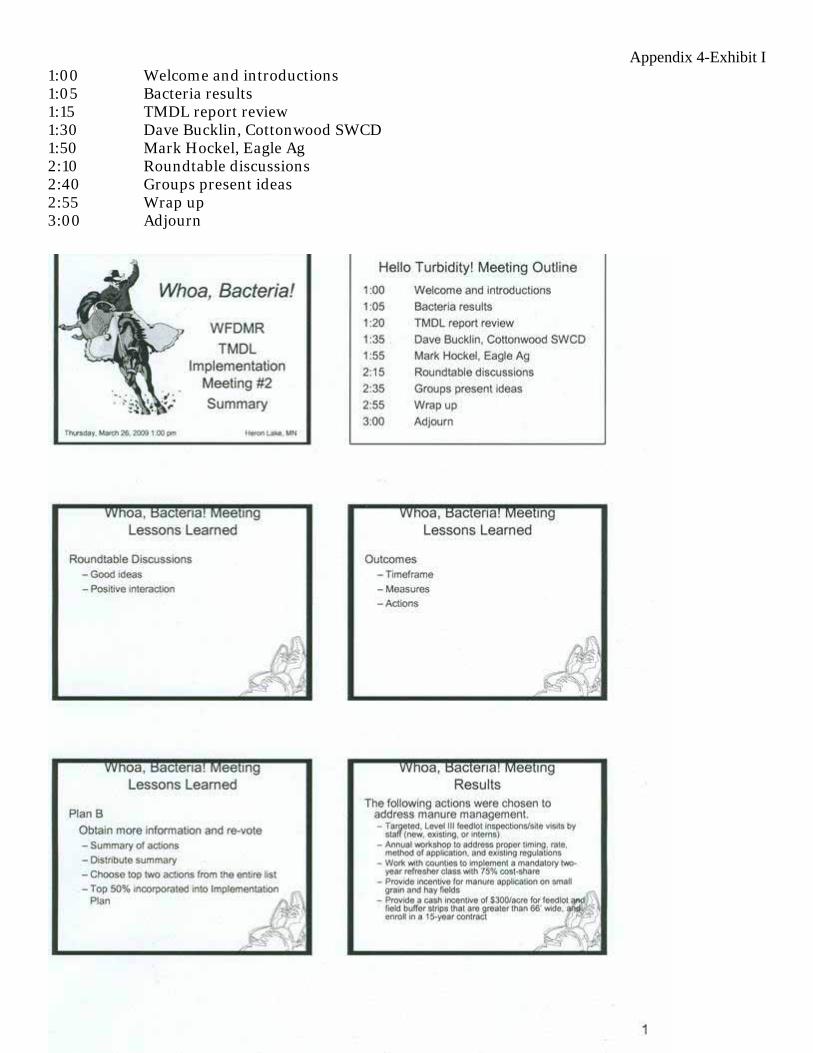
Appendix 4-Exhibit I 1:00 Welcome and introductions 1:05 Bacteria results 1:15 TMDL report review 1:30 Dave Bucklin, Cottonwood SWCD 1:50 Mark Hockel, Eagle Ag 2:10 Roundtable discussions 2:40 Groups present ideas 2:55 Wrap up 3:00 Adjourn

Appendix 4-Exhibit I
S
6.0 Identification and Summary of Implementation Objectives and Action Items Objective 1. Address Nonpoint Source Pollution Task A. Provide a $300 per acre incentive for buffer strips
• Eligible landowners would receive a one-time cash incentive of $300 per acre for installing a field or feedlot buffer strip for 15 years. The
buffer strip would need to exceed the traditional 66’ width in order to qualify. It is estimated that thereare ______ stream miles in the watershed without adequate buffers. The practice would follow NRC

Appendix 4-Exhibit I
specifications. Staff time from the seven-county environmental offices, SWCD and NRCS offices, HLWD, and BWSR would be allocated as inkind.
• Timeframe: Years 1-10 • Person(s) responsible: Seven-county Environmental offices, SWCD and NRCS offices, HLWD, and
BWSR • Total costs:
o Cash o Inkind
Information needed to complete this task: • Number of stream miles in the watershed without adequate buffers – Jan & Kelli • Cost/hour of staff time for each organization - $35/hour reasonable?
Task B: Provide a maximum of $500 per intake cost-share for replacing open tile intakes with rock inlets • Eligible landowners would receive a one-time cost-share payment of 75% with a maximum of $500 to
replace open tile intakes with rock inlets. It is estimated that there are _________ open tile intakes in the watershed. Staff time from the seven-county environmental offices, SWCD and NRCS offices, and HLWD would be allocated as inkind.
• Timeframe: Years 1-10 • Person(s) responsible: Seven-county Environmental Offices, SWCD and NRCS Offices, and HLWD • Total Costs:
o Cash: o Inkind:
Information needed to complete this task: • Number of open tile intakes in the watershed – Jan & Kelli • Cost/hour of staff time for each organization – $35/hour reasonable?
Task C: Provide a ________ per acre incentive for manure application • Eligible landowners would receive a one-time incentive payment of _______ per acre for manure
application on small grain and hay fields. It is estimated that there are __________ acres that would be eligible for this practice. Staff time from the seven-county environmental offices, SWCD and NRCS offices, and HLWD would be allocated as inkind
• Timeframe: Years 1-10 • Person(s) responsible: Seven-county Environmental Offices, SWCD and NRCS Offices, and HLWD • Total Costs:
o Cash: o Inkind:
Information needed to complete this task: • Work with SWCDs on this task
Objective 2. Feedlot Management Task A. Targeted, Level III Feedlot Inspections/Site Visits by Staff (New, Existing, or Interns)
• A targeted, Level III Feedlot Inspection would include an inventory of all animals, size of buildings, watershed size going to the feedlot, distance to discharge point (stream or tile), buffers, and slopes of the yards. Current feedlot rules require that a minimum of seven percent of the feedlots be inspected each year. This plan would require an expedited completion of the Level III inventory. There are 712 feedlots in the watershed. A Level III inventory would be completed for each of these feedlots over the 10-year period of the grant. Staff time from the seven-county environmental offices would be allocated as inkind.
• Timeframe: Years 1-10

Appendix 4-Exhibit I
• Person(s) responsible: Seven-County Environmental Offices • Total Costs: $124,600.00
o Cash: $0.00 o Inkind: $124,600.00
o 5 hours/site x $35.00/hour x 712 feedlots Objective 3. Address Point Source Pollution Task A: Provide low interest loans
• Eligible landowners would qualify for a low interest loan for 100% of the cost to upgrade a septic system. It is estimated that there are 3,818 systems in the watershed that are noncompliant. Staff time from the seven-county environmental offices and HLWD would be allocated as inkind.
• Timeframe: Years 1-10 • Total Costs:
o Cash: $41,998,000.00 • 3,818 systems x $11,000.00
o Inkind: Information needed to complete this task:
• Cost/hour of staff time for each organization - $35/hour reasonable? Task B: Provide cost-share
• Eligible landowners would qualify for 25% cost-share, maximum of $2,500, to upgrade a septic system. It is estimated that there are 3,818 systems in the watershed that are noncompliant. Staff time from the seven-county environmental offices and HLWD would be allocated as inkind.
• Timeframe: Years 1-10 • Person(s) responsible: Seven-County Environmental Offices and HLWD • Total Costs:
o Cash: $9,545,000.00 • 3,818 systems x $2,500.00
o Inkind: Information needed to complete this task:
• Cost/hour of staff time for each organization • Estimated number of hours needed to complete task
Objective 4. Provide Educational Opportunities Task A. Offer workshops
• Annual workshops would be offered to address proper timing, rate, method of application, existing regulations, setback/winter application requirements, and nutrient management. Workshops would be conducted by county, SWCD, NRCS, and HLWD staff. Locations would be rotated throughout the watershed during the ten-year grant period. Staff time would be allocated as inkind.
• Timeframe: Years 1-10 • Person(s) responsible: Seven-County Environmental Offices, SWCD and NRCS Offices, U of M
Extension, and HLWD • Total Costs:
o Cash: o Inkind:
Task B. Require refresher course

Appendix 4-Exhibit I
unt
t
will work
• Every two years producers with feedlot permits would be required to take a mandatory refresher course. Seventy-five percent cost-share would be provided for these courses. Workshops would be conducted by county, SWCD, NRCS, and HLWD staff. Their time would be allocated as inkind.
• Timeframe: Years 1-10 • Person(s) responsible: Seven-County Environmental Offices, SWCD and NRCS Offices, U of M
Extension, and HLWD • Total Costs:
o Cash: o Inkind:
Information needed to complete this task: • Wor
k with coy waterplan coordinaors to better identify what

Appendix 4-Exhibit I

Appendix 4-Exhibit I

Appendix 4-Exhibit I
Turbidity TMDL Report Worksheet Thursday, March 26, 2009
1. Turbidity is the cloudiness of water often caused by ____________, ________________, ___________.
2. There are___ reaches in the WFDMR watershed
with turbidity impairments.
3. Monitoring shows turbidity is worst during _______________but exceedences at all flows.
4. List the 7 external sources: 1. __________________________ 2. ___________________________
3. __________________________ 4. _______________________ 5. __________________________

Appendix 4-Exhibit I
6. __________________________ 7. ____________________________
5. List the internal sources: 1. __________________________ 2. __________________________
Brainstorm: 6. Feedlots: What practices can be done to address runoff of sediment and phosphorus?
____________________________________________________________________________________
7. Livestock: What practices can be done to address runoff of sediment and phosphorus? ____________________________________________________________________________________
8. Livestock: What practices can be done to address resuspended sediments? ____________________________________________________________________________________
9. Livestock: What practices can be done to address bank erosion? ____________________________________________________________________________________
10. Row Cropland: What practices can be done to address runoff of sediment and phosphorus overland? ____________________________________________________________________________________
11. Row Cropland: What practices can address runoff of sediment & phosphorus through tile intakes? ____________________________________________________________________________________
12. Row Cropland: What practices can be done to address wind erosion? ____________________________________________________________________________________
13. Row Cropland: What practices can be done to address bank destabilization for lack of buffers? ____________________________________________________________________________________
14. Row Cropland: What practices can be done to address bank erosion? ____________________________________________________________________________________
15. Ditches/Channelization: What practices can be done to address bank erosion? ____________________________________________________________________________________
16. Impervious Surfaces: What practices can be done to address direct discharge? ____________________________________________________________________________________
17. Impervious Surfaces: What practices can be done to address bank erosion? ____________________________________________________________________________________
18. Carp: What practices can be done to address the resuspended sediments from benthic feeders? ____________________________________________________________________________________
19. Rank the severity of contributor (1 being most severe, 7 being least severe). ______ Feedlots ______ Livestock ______ Row cropland ______ Ditches ______ Impervious surfaces ______ Permitted point sources ______ Carp

Appendix 4-Exhibit I

Appendix 4-Exhibit I

Appendix 4-Exhibit I

Appendix 4-Exhibit I

Appendix 4-Exhibit I

Appendix 4-Exhibit I

Appendix 4-Exhibit I

Appendix 4-Exhibit I

Appendix 4-Exhibit I

Appendix 4-Exhibit I

Appendix 4-Exhibit I

Appendix 4-Exhibit I
Turbidity Roundtable Discussion Questions Thursday, March 26, 2009
4. Discuss in your group the seven turbidity sources. (Feedlots, grazing livestock, row
cropland, ditches, impervious surfaces, permitted point sources, and carp.)
a. Focusing on which sources will provide the most improvement of water quality?
b. Focusing on which sources will be the easily implemented? 5. List at least five specific actions could be used to reduce turbidity in the WFDMR
watershed. How does that relate to the TMDL report?
1. _______________________________________________________ How does this relate to the TMDL report? _______________________________________________
2. _______________________________________________________ How does this relate to the TMDL report? _______________________________________________
3. _______________________________________________________ How does this relate to the TMDL report? _______________________________________________
4. _______________________________________________________ How does this relate to the TMDL report? _______________________________________________
5. _______________________________________________________
How does this relate to the TMDL report? _______________________________________________ 6. Should turbidity efforts be focused in a subwatershed (if so, which one) or
implemented on a willing landowner basis, regardless of location?
*Examples: → Specific Action: 75% cost-share, maximum $6,500.00 for 100 sediment basins
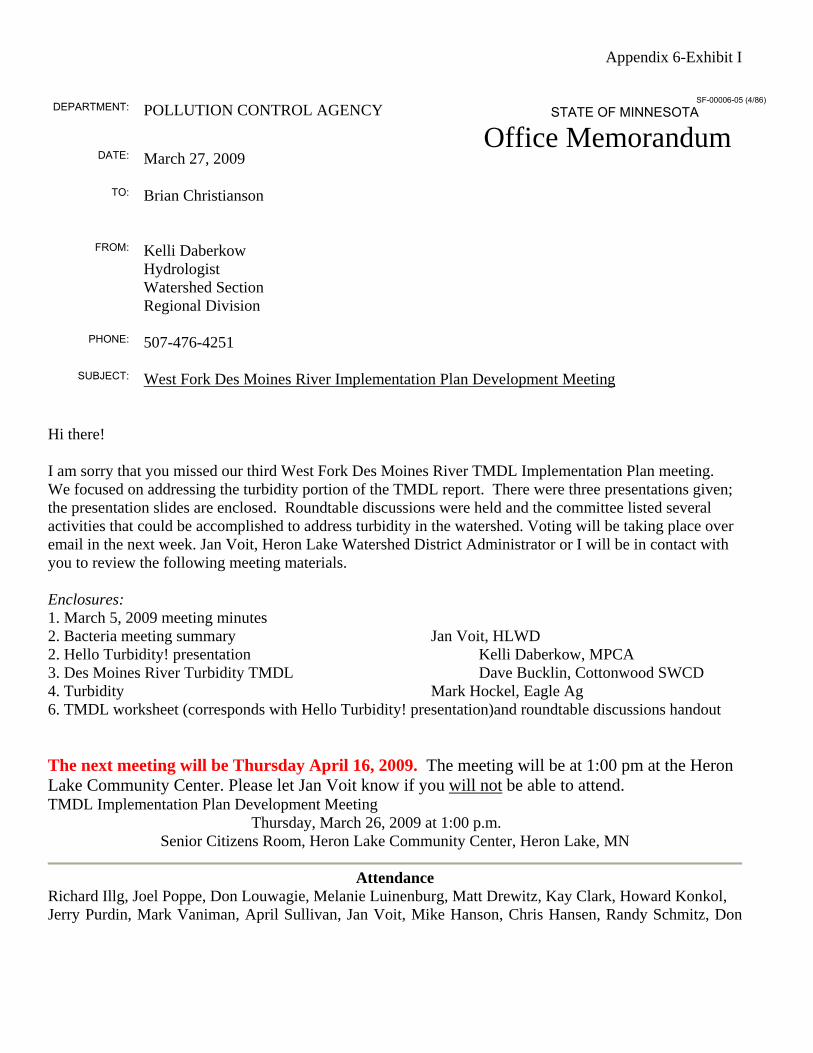
Appendix 6-Exhibit I
DEPARTMENT: POLLUTION CONTROL AGENCY SF-00006-05 (4/86)
STATE OF MINNESOTA
DATE: March 27, 2009 Office Memorandum
TO: Brian Christianson
FROM: Kelli Daberkow Hydrologist Watershed Section Regional Division
PHONE: 507-476-4251
SUBJECT: West Fork Des Moines River Implementation Plan Development Meeting
Hi there! I am sorry that you missed our third West Fork Des Moines River TMDL Implementation Plan meeting. We focused on addressing the turbidity portion of the TMDL report. There were three presentations given; the presentation slides are enclosed. Roundtable discussions were held and the committee listed several activities that could be accomplished to address turbidity in the watershed. Voting will be taking place over email in the next week. Jan Voit, Heron Lake Watershed District Administrator or I will be in contact with you to review the following meeting materials. Enclosures: 1. March 5, 2009 meeting minutes 2. Bacteria meeting summary Jan Voit, HLWD 2. Hello Turbidity! presentation Kelli Daberkow, MPCA 3. Des Moines River Turbidity TMDL Dave Bucklin, Cottonwood SWCD 4. Turbidity Mark Hockel, Eagle Ag 6. TMDL worksheet (corresponds with Hello Turbidity! presentation)and roundtable discussions handout The next meeting will be Thursday April 16, 2009. The meeting will be at 1:00 pm at the Heron Lake Community Center. Please let Jan Voit know if you will not be able to attend. TMDL Implementation Plan Development Meeting
Thursday, March 26, 2009 at 1:00 p.m. Senior Citizens Room, Heron Lake Community Center, Heron Lake, MN
Attendance
Richard Illg, Joel Poppe, Don Louwagie, Melanie Luinenburg, Matt Drewitz, Kay Clark, Howard Konkol, Jerry Purdin, Mark Vaniman, April Sullivan, Jan Voit, Mike Hanson, Chris Hansen, Randy Schmitz, Don

Appendix 6-Exhibit I
Hagen, Dave Bucklin, Stephanie McLain, Mark Hockel, Kevin Nelson, Ed Lenz, Gordy Olson, Steve Beckel, Tom Kresko, Brian Nyborg, Clark Lingbeek, Ross Behrends, Wayne Smith, Randy Markl
Minutes • Jan Voit welcomed everyone and presented the agenda for the meeting. The task for the day was to
determine implementation measures and actions that will address the turbidity impairment as well as be accepted by the general public.
• Jan explained which endeavors worked at the last meeting and which ones needed improvement. The round table discussions worked but the actions were not clearly stated. There were 102 votes recorded when there should have been 50 total votes. Jan worked with those present to clarify the actions and then the members were asked to re-vote via email. The bacteria portion of the plan was written based on the top 50% of the votes. This new procedure will be implemented for the turbidity and excess nutrients meetings.
• The following actions were chosen to address bacteria. o Targeted, Level III feedlot inspections/site visits by staff (new, existing, or interns) o Annual workshop to address proper timing, rate, method of application, and existing regulations o Work with counties to implement a mandatory two-year refresher class with 75% cost-share o Provide incentive for manure application on small grain and hay fields o Provide a cash incentive of $300/acre for feedlot and field buffer strips that are greater than 66’
wide, and enroll in a 15-year contract o Provide 50% cost-share with a maximum of $500 per rock inlet. o Provide low interest loans for 100% of project cost o Provide 25% cost-share, maximum of $2,500 per system, 300 systems
• Kelli Daberkow provided a summary of the turbidity portion of the TMDL Study. A worksheet was distributed to go along with the presentation.
• Dave Bucklin, Cottonwood SWCD, gave a presentation about sediment sources, erosion facts, and implementation options for turbidity.
• Mark Hockel, Eagle Ag Consulting, gave a presentation on soil runoff, nutrient management, and tillage options.
• The group took a 10-minute break. • Jan Voit and Melanie Luinenburg assigned participants to five tables. Jan explained the procedure for
the round table discussions and stressed the importance of providing specific examples, dollar amounts, and time limits.
• Each table addressed the following questions: o Discuss in your group the seven turbidity sources.
Focusing on which sources will provide the most improvement of water quality? Focusing on which sources will be easily implemented?
o List at least five specific actions that could be used to reduce turbidity in the WFDMR watershed. How does that relate to the TMDL report?
• Each table reported on their discussion. • The attendees were reminded that voting will occur via email. The actions presented by the each of the
roundtables will be summarized and distributed. Each member will be able to vote from March 31 through April 6. The next meeting will be held on Thursday, April 16, at 1:00 p.m. at the Heron Lake Senior Citizen’s Center.
• The meeting was adjourned. • Turbidity Roundtable Discussion Summary
March 26, 2009 Conservation Tillage

Appendix 6-Exhibit I
• $30 per acre incentive for conservation tillage methods: strip till, no till, and ridge till on > 30% cover on soybean stubble and > 50% cover on corn stubble, maximum of 500 acres and a 5-year contract
• $20 per acre incentive for conservation tillage on > 30% cover on soybean stubble, > 50% cover on corn stubble
• Low interest loans for 100% of the cost of strip till equipment, with $7,500 per year reduction in principal for each year used up to 10 years - Total producer benefit $75,000
Conservation Drainage • 50% cost-share, up to $250 per acre, for installing a controlled drainage system (tiling and structure),
signed 10-year management plan required • 100% cost-share for installing controlled drainage structure, no payment for tiling costs • 50% cost-share for controlled drainage structure Fertilizer Application • $15 per acre incentive for variable rate fertilizer application, maximum of 500 acres per producer • $10 per acre incentive for banding phosphorus fertilizer Perennial Cover • $150 per year incentive over 10 years for converting cropland to perennial cover (native grasses/forage
mix), grazing allowed Water Storage • $5,000 per acre incentive, plus restoration costs, for perpetual easement for water/flood storage
(wetlands, sediment basins, etc.) • 100% cost-share plus a one-time payment of $5,000 per acre incentive for permanent easement on
wetland restoration or $2,000 per acre incentive for a 25 year easement, targeted watershed with a minimum size of 500 acres
• 50% cost-share for wetland restorations adjacent to ditches • 75% cost-share, maximum of $6,500, for sediment basins, 10 per year Buffers • 100% cost-share plus a $200 per acre incentive for 15 years for harvestable native grass buffer,
minimum 100’, maximum 200’, first 50’ un-harvestable, 50% of the remaining acres can be harvested each year
• $20 per acre incentive for alfalfa buffer strips along streams, minimum 66’, maximum 300’, no fertilizer Terraces/Waterways • $275 per acre for 10 years for maintaining engineered practices (terraces, waterways, etc.) after NRCS
contract ends Grazing • Up to 75% cost-share (with EQIP) for approved grazing system in riparian areas and 75% cost-share for
practices not covered by EQIP (e.g. perimeter fence on existing grass) Urban BMPs • 75% cost-share for urban BMPs: trees, rain gardens, stormwater control, permeable pavers • Urban BMP education targeting master gardeners, rain gardens, porous pavers • Incentive for cost difference between variable rate application and broadcast application (variable rate
$12/acre less broadcast rate $8/acre = $4/acre incentive) Inventory • Targeted wetland inventory to find optimum locations, intern project • Fund LIDAR flight and data for WFDMR watershed to provide 2’ contour topographic lines – aid in
delineation of engineered BMPs Other • Hire commercial fishermen for carp removal

Appendix 6-Exhibit I
• Downsize ditch outlets and riprap where needed, 10 per year •
Turbidity Roundtable Voting Results
March 26, 2009 Conservation Tillage • $30 per acre incentive for conservation tillage methods: strip till, no till, and ridge till on > 30% cover
on soybean stubble and > 50% cover on corn stubble, maximum of 500 acres and a 5-year contract xxx • $20 per acre incentive for conservation tillage on > 30% cover on soybean stubble, > 50% cover on corn
stubble xx • Low interest loans for 100% of the cost of strip till equipment, with $7,500 per year reduction in
principal for each year used up to 10 years - Total producer benefit $75,000 x Conservation Drainage • 50% cost-share, up to $250 per acre, for installing a controlled drainage system (tiling and structure),
signed 10-year management plan required x • 100% cost-share for installing controlled drainage structure, no payment for tiling costs xx Fertilizer Application • $15 per acre incentive for variable rate fertilizer application, maximum of 500 acres per producer
xxxxxx • Incentive for cost difference between variable rate application and broadcast application (variable rate
$12/acre less broadcast rate $8/acre = $4/acre incentive) x Perennial Cover • $150 per year incentive over 10 years for converting cropland to perennial cover (native grasses/forage
mix), grazing allowed xxx Water Storage • $5,000 per acre incentive, plus restoration costs, for perpetual easement for water/flood storage
(wetlands, sediment basins, etc.) xxxxxxx • 100% cost-share plus a one-time payment of $5,000 per acre incentive for permanent easement on
wetland restoration or $2,000 per acre incentive for a 25 year easement, targeted watershed with a minimum size of 500 acres xxx
• 50% cost-share for wetland restorations adjacent to ditches x Buffers • 100% cost-share plus a $200 per acre incentive for 15 years for harvestable native grass buffer,
minimum 100’, maximum 200’, first 50’ un-harvestable, 50% of the remaining acres can be harvested each year xxxxxxxxx
• $20 per acre incentive for alfalfa buffer strips along streams, minimum 66’, maximum 300’, no fertilizer x
Grazing • Up to 75% cost-share (with EQIP) for approved grazing system in riparian areas and 75% cost-share for
practices not covered by EQIP (e.g. perimeter fence on existing grass) xx
Heron Lake Watershed District PO Box 345, Heron Lake, MN 56137
507-793-2462 ~ FAX 507-793-2253 Toll free: 888-878-4345
Email: [email protected]

Appendix 6-Exhibit I
Web: www.hlwdonline.org
TO: Heron Lake and North Marsh Landowners* FROM : Jan Voit, District Administrator SUBJECT: TMDL Implementation Plan Informational Meeting DATE: March 24, 2009
Over the past few years, the words Total Maximum Daily Load (TMDL) or impaired waters have been heard in the media. Some of you may be aware that a TMDL Study was conducted in the West Fork Des Moines River and Heron Lake watersheds. The TMDL Study was approved on December 18, 2008. You can view the report online at the website listed below.
What did the study entail?
• Addressing 32 impairments, making us the first in Minnesota to do a TMDL Implementation Plan of this magnitude
• First in Minnesota to address TMDLs on a basin-wide scale • First in Minnesota to tackle excess nutrients, turbidity, and bacteria in TMDL study and
implementation plan What’s next? The TMDL Advisory and Technical Committees have begun the process of writing an implementation plan to address the water quality problems in the watershed. In order to make this plan a working document that will contain implementation efforts that watershed residents are likely to employ, we’d like your help! Let’s get together!
• When: Tuesday, April 7 • Where: Heron Lake Community Center, Heron Lake • Time: 7:00 p.m. • Agenda:
o The MPCA will provide an overview of the TMDL report. o The DNR-Shallow Lakes Division will provide information regarding shallow lake
management. o Landowners will be asked to provide input as to future management actions on
North and South Heron Lake. Please contact me by phone (507-793-2462) or email ([email protected]) if you are unable to attend.
*If you are not an adjacent landowner to North Heron Lake, South Heron Lake, or North Marsh, please disregard.

Appendix 6-Exhibit I
Heron Lake Landowner Meeting Shallow Lake Management
April 7, 2009
Agenda
• Welcome • What brings us here tonight and the expectations • TMDL report overview • Questions • Shallow Lake Management Strategies • Questions • Gather input • Wrap up • Adjourn
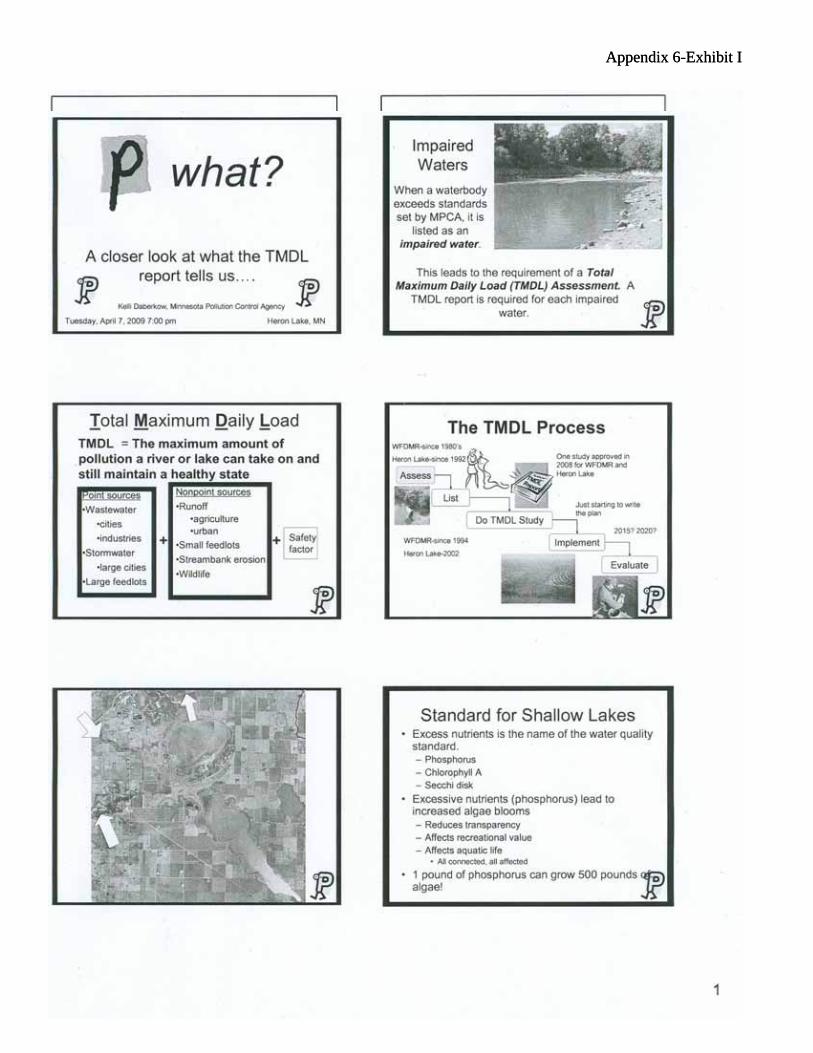
Appendix 6-Exhibit I
Appendix 6-Exhibit I

Appendix 6-Exhibit I

Appendix 6-Exhibit I

Appendix 6-Exhibit I
Appendix 6-Exhibit I

Appendix 6-Exhibit I

Appendix 6-Exhibit I

Appendix 6-Exhibit I

Appendix 6-Exhibit I
Appendix 6-Exhibit I

Appendix 6-Exhibit I
Landowner Input Form Name: ________________________________________________ Rank the following actions based on willingness to implement (1 being most likely and 5 being least likely) Fish barriers 1 2 3 4 5 Fish stocking 1 2 3 4 5 Aeration 1 2 3 4 5 Water level management - drawdowns 1 2 3 4 5 Chemical treatment - rotenone 1 2 3 4 5 Other _____________________________ 1 2 3 4 5 _____________________________ 1 2 3 4 5 Question In your opinion, what practices on the land would make a big improvement in keeping phosphorus and sediment out of our lakes and streams? _________________________________________________________________________________________________________________________________________________________________________________________________________________________________________________________________________
Landowner Input Form Results
Addressing Phosphorus in Heron Lake – April 7, 2009 meeting Actions ranked based on willingness to implement: 1. Fish stocking 2. Water level management - drawdowns 3. Fish barriers 4. Aeration 5. Chemical treatment - rotenone Other ideas that were suggested:
a. Feasibility study for fish barriers on incoming water b. Increase wildlife

Appendix 6-Exhibit I
c. Decrease pounds of bank erosion d. Higher water levels e. Winter netting of rough fish f. Further programs for control of ag runoff-more cost-share for buffer strips, etc. g. Drain the lake completely if at all possible h. CRP (enhanced) i. Removal of nutrients from municipal sewers
In your opinion, what practices on the land would make a big improvement in keeping phosphorus and sediment out of our lakes and streams? 1. Continue to work on slowing the flow of water, removing energy from the flow, improve conservation
tillage practices
2. More enforcement with filter strips or mandatory strips
3. Sediment ponds, water retention areas
4. Anything that can be done to slow the water flow into the lake to control the bounce would establish more plant growth in the lake bed
5. Stop or control the flow down the drainage ditches, grass barriers around and along ditches
6. Buffer strips around running water, rock intakes work good. Pelicans can eat a lot of fish when water is low. This spring, there are a lot more bullheads and carp in the minnow traps
7. I think we are doing our part on the management already. Damage has already been done.
8. Educating the public is always great, I think! The more information you can get out the better. I know I don't know much about it at all.
9. Fines for farmers and business for not policing their runoff. I feel they are the main culprit in the demise of the watershed.
10. I fear the biggest part is this problem are Heron Lake's eutrophic nature and possibly excessive erosion from "the old days". It would be silly to try to defy these geologic problems. The best practices will be undertaken outside of the immediate basin with CRP and the REMOVAL of nutrients from wastewater. If anything is attempted in the basin, it should be to remove nutrients (i.e. carp removal, careful irrigation, etc.). Please beware of unintended consequences.
11. General stewardship and better land management on low lines. Watch water levels more closely and hopefully keep water in marsh and both lakes all year instead of opening dam.
Heron Lake Watershed District
PO Box 345, Heron Lake, MN 56137 507-793-2462 ~ FAX 507-793-2253
Toll free: 888-878-4345 Email: [email protected] Web: www.hlwdonline.org
TO: Heron Lake and North Marsh Landowners* FROM : Jan Voit, District Administrator SUBJECT: Follow-up Correspondence

Appendix 6-Exhibit I
DATE: April 8, 2009
We missed you! On April 7, a meeting was held at the Heron Lake Community Center to provide Heron Lake and North Marsh landowners with first-hand information regarding the Total Maximum Daily Load (TMDL) Study, phosphorus, and shallow lake management. There were 12 people in attendance. Kelli Daberkow, Minnesota Pollution Control Agency, explained the TMDL Study and the phosphorus problems identified in the Heron Lake watershed. Steve Kittelson, Minnesota Department of Natural Resources, talked about shallow lake management options and examples from other Minnesota lakes. Since you were unable to attend, I’ve enclosed the following items for you to review:
• Summary slides from Kelli Daberkow’s presentation. • Summary slides from Steve Kittelson’s presentation. • Landowner input form.
We need your input! Those in attendance were also asked to provide input about inlake actions they would support and suggested watershed treatment activities that could help reduce phosphorus loading in the watershed. In addition to the five options listed on the input form, discussion was also held about other inlake treatment options including seining, harvesting the nutrients, algal toxins, and alum treatment. We are looking at all possible options, so if you have any other suggestions for inlake actions, please put those in the other category on the form. Your time in reviewing the enclosed documents and completing the landowner input form would be greatly appreciated. The information gathered from the forms will be brought to the advisory and technical committees next week to guide their decision-making for choosing actions that will help reduce the phosphorus problem in Heron Lake. After completing the form, your responses can be mailed to the HLWD at the above address, emailed to [email protected], or faxed to 507-793-2253. Your responses are needed no later than Wednesday, April 15. Should you have any questions, please feel free to contact me at 507-793-2462 or by email. *If you are not an adjacent landowner to North Heron Lake, South Heron Lake, or North Marsh, please disregard. TMDL Implementation Plan Landowner Meeting
Tuesday, April 7, 2009 at 7:00 p.m. Heron Lake Community Center, Heron Lake, MN
Attendance Albert Burmeister, Marianne Burmeister, Rodney Dicks, Glenn Dicks, Joel Hovland, Kristin Hovland, Jon Thaemlitz, Victor Pohlman, Adam Schumacher, Jean Hovland, Paul Hovland, Tony Thompson
Minutes

Appendix 6-Exhibit I
Jan Voit welcomed everyone and explained the TMDL process, need for implementation plan, and the implementation planning process.
Kelli Daberkow presented information on phosphorus and explained the findings of the TMDL Study report. A discussion about carp followed.
Steve Kittelson, DNR-Mankato, presented information on nutrient and shallow lake management from the DNR’s perspective.
Kelli thanked everyone for coming. The landowner input form was distributed. She explained the process being used by the TMDL committee to develop the implementation plan. Kelli then explained that the responses from landowner input form were going to be summarized and brought to the TMDL committee to help them make their decisions at the next meeting.
Meeting adjourned.
Questions and Comments + How soon can game fish be restocked after rotenone?
o A: As soon as possible. + Are carp or fathead minnows a bigger problem?
A: It depends on how big they are. + Why not seine Heron Lake?
o A: Part of the reason is that the commercial market is not there, plus the control method is not effective enough.
+ If they took 300,000 pounds out like they did last time, wouldn’t that make a difference? o A: We don’t know.
+ Is there any idea of the carp concentration of Heron Lake? o A: No, they lay so many eggs that they repopulate too fast.
+ What is the goal when treating the lake? o A: 100% but it’s hard. o Audience comment: The goal doesn’t fit Heron Lake because there are too many places for fish
to go. + When seining, are game fish put back in?
o A: If possible, yes. + The predator base needs to be done as well?
o A: Yes. + Would it be more effective to use big predators rather than small ones?
o A: No, no predators are capable of getting enough carp. + The rushes are very thick – is that positive?
o A: It’s site specific. There are more cattails around here and they are less dense and rooted in the bottom.
+ Are lower lake levels more beneficial? o A: If you can control the bounce. Drawdowns help plants take root, which keeps sediments
from resuspending and protects the bottom. + There is a fish barrier on the outlet. Is there anything on the inlets?
o A: No, and that’s part of the problem. The watershed is so large. + The TMDL study says we need to export five times as much phosphorus as we import. How long do we
have to export extra phosphorus for the lake to show improvements? o A: There is nothing in the report that addresses that so I don’t know. It’s unknown due to the
intense internal loading. + How do we get rid of internal loading then?

Appendix 6-Exhibit I
o A: Phosphorus is used by plants, settles, or goes to the Des Moines River. When it gets tied up, algae uses it, then it goes to the Des Moines River. It’s a nasty cycle with a tricky balance.
o Audience comment: Rooted plants stay alive during the winter and hold on to phosphorus. Probes also bring up plants with elevated oxygen levels, even through the ice. Being alive helps with phosphorus and would help game fish survive.
+ So the whole problem is the lake? Not what’s going into the lake? o A: We need to look at both. o Audience comment: They’re all related to each other.
+ Does aeration work in a shallow lake? o A: It’s hard here because North Heron Lake is shallow, but South Heron Lake is deep.
Heron Lake Watershed District PO Box 345, Heron Lake, MN 56137
507-793-2462 ~ FAX 507-793-2253 Toll free: 888-878-4345
Email: [email protected] Web: www.hlwdonline.org
TO: TMDL Advisory Committee and Technical Committee Members FROM : Jan Voit, District Administrator SUBJECT: TMDL Implementation Plan Meeting - Phosphorus DATE: April 15, 2009 Our next scheduled meeting to work on the West Fork Des Moines River and Heron Lake TMDL Implementation Plan is scheduled for Thursday, April 16 at 1:00 p.m. at the Heron Lake Community Center. An agenda for the meeting is included below.
P What? Meeting Agenda 1:00 Welcome and introductions 1:05 Turbidity voting results Jan Voit, HLWD 1:15 TMDL report review-Excess Nutrients Kelli Daberkow, MPCA 1:45 Point Source Implementation Options Marco Graziani, MPCA 2:05 Break 2:10 Shallow Lake Management Todd Kolander, MDNR

Appendix 6-Exhibit I
2:30 Heron Lake Landowner meeting results 2:40 Roundtable discussions 3:05 Groups present ideas 3:25 Next Steps 3:30 Adjourn

Appendix 6-Exhibit I
Appendix 6-Exhibit I

Appendix 6-Exhibit I
6.0 Identification and Summary of Implementation Objectives and Action Items Objective 1. Address Nonpoint Source Pollution Task A. Provide a $300 per acre incentive for buffer strips
• Eligible landowners would receive a one-time cash incentive of $300 per acre for installing a field or feedlot buffer strip for 15 years. The buffer strip would need to exceed the traditional 66’ width in order to qualify. It is estimated that there are 1,839 stream miles in the watershed and that 58% are without adequate buffers. The practice would follow NRCS specifications. Staff time from the seven-county environmental offices, SWCD and NRCS offices, HLWD, and BWSR would be allocated as inkind.
• Timeframe: Years 1-10 • Person(s) responsible: Seven-county Environmental offices, SWCD and NRCS offices, HLWD, and
BWSR • Total costs:
o Cash • 8,528 acres x $300 = $2,558,400.00
o Inkind Information needed to complete this task:
• What width would qualify? • Estimated staff time to complete contract
Task B: Provide a maximum of $500 per intake cost-share for replacing open tile intakes with rock inlets • Eligible landowners would receive a one-time cost-share payment of 75% with a maximum of $500
to replace open tile intakes with rock inlets. It is estimated that there are 10,664 eighty acre parcels containing an average of two open tile intakes. Staff time from the seven-county environmental offices, SWCD and NRCS offices, and HLWD would be allocated as inkind.
• Timeframe: Years 1-10 • Person(s) responsible: Seven-county Environmental Offices, SWCD and NRCS Offices, and HLWD • Total Costs:
o Cash: • 10,664 parcels x 2 = 21,328 x $500 = $10,664,000.00
o Inkind: Information needed to complete this task:
• Estimated staff time to complete contract
Task C: Provide a ________ per acre incentive for manure application • Eligible landowners would receive a one-time incentive payment of _______ per acre for manure
application on small grain and hay fields. It is estimated that there are __________ acres that would be eligible for this practice. Staff time from the seven-county environmental offices, SWCD and NRCS offices, and HLWD would be allocated as inkind
• Timeframe: Years 1-10 • Person(s) responsible: Seven-county Environmental Offices, SWCD and NRCS Offices, and HLWD • Total Costs:
o Cash: o Inkind:

Appendix 6-Exhibit I
Information needed to complete this task: • Work with SWCDs on this task
Task D. Provide $15 per acre incentive for variable rate fertilizer application
• Eligible landowners would receive an annual? incentive of $15 per acre for variable rate fertilizer application on a maximum of 500 acres per producer. Staff time from the seven-county environmental offices, SWCD and NRCS offices, and HLWD would be allocated as inkind.
• Timeframe: Years 1-10 • Person(s) responsible: Seven-county Environmental offices, SWCD and NRCS offices, and HLWD • Total costs:
o Cash o Inkind
Information needed to complete this task: • Number of acres in the watershed eligible – Jan & Kelli
Task E. Provide incentive and restoration costs for perpetual easement program
• Eligible landowners would receive a $5,000 per acre incentive, plus restoration costs, for perpetual easement for water/flood storage (wetlands, sediment basins, etc.) A restorable wetland inventory has not completed for the entire watershed. A rough estimate indicates 8,720 acres in need of restoration. Staff time from the seven-county environmental offices, SWCD and NRCS offices, BWSR, and HLWD would be allocated as inkind.
• Timeframe: Years 1-10 • Person(s) responsible: Seven-county Environmental offices, SWCD and NRCS offices, BWSR, and
HLWD • Total costs:
o Cash • 8,720 acres x $5,000 = $43,600,000.00
o Inkind Information needed to complete this task:
• Per acre cost for restoration Task F. Cost-share and incentive program for harvestable buffer program
• Eligible landowners would receive 100% cost-share plus a $200 per acre incentive for 15 years for harvestable native grass buffer, minimum 100’, maximum 200’, first 50’ un-harvestable, 50% of the remaining acres can be harvested each year. It is estimated that there are 1,839 stream miles in the watershed and that 58% are without adequate buffers. Staff time from the seven-county environmental offices, SWCD and NRCS offices, and HLWD would be allocated as inkind.
• Timeframe: Years 1-10 • Person(s) responsible: Seven-county Environmental offices, SWCD and NRCS offices, and HLWD • Total costs:
o Cash • 25,842 acres x $200 = $5,168,400.00
o Inkind Information needed to complete this task:
• Estimated cost-share per acre Objective 2. Feedlot Management

Appendix 6-Exhibit I
Task A. Targeted, Level III Feedlot Inspections/Site Visits by Staff (New, Existing, or Interns) • A targeted, Level III Feedlot Inspection would include an inventory of all animals, size of buildings,
watershed size going to the feedlot, distance to discharge point (stream or tile), buffers, and slopes of the yards. Current feedlot rules require that a minimum of seven percent of the feedlots be inspected each year. This plan would require an expedited completion of the Level III inventory. There are 712 feedlots in the watershed. A Level III inventory would be completed for each of these feedlots over the 10-year period of the grant. Staff time from the seven-county environmental offices would be allocated as inkind.
• Timeframe: Years 1-10 • Person(s) responsible: Seven-County Environmental Offices • Total Costs: $124,600.00
o Cash: $0.00 o Inkind: $124,600.00
o 5 hours/site x $35.00/hour x 712 feedlots Objective 3. Address Point Source Pollution Task A: Provide low interest loans
• Eligible landowners would qualify for a low interest loan for 100% of the cost to upgrade a septic system. It is estimated that there are 3,818 systems in the watershed that are noncompliant. Staff time from the seven-county environmental offices and HLWD would be allocated as inkind.
• Timeframe: Years 1-10 • Total Costs:
o Cash: $41,998,000.00 • 3,818 systems x $11,000.00
o Inkind: Information needed to complete this task:
• Number of staff hours per system Task B: Provide cost-share
• Eligible landowners would qualify for 25% cost-share, maximum of $2,500, to upgrade a septic system. It is estimated that there are 3,818 systems in the watershed that are noncompliant. Staff time from the seven-county environmental offices and HLWD would be allocated as inkind.
• Timeframe: Years 1-10 • Person(s) responsible: Seven-County Environmental Offices and HLWD • Total Costs:
o Cash: $9,545,000.00 • 3,818 systems x $2,500.00
o Inkind: Information needed to complete this task:
• Estimated number of hours needed to complete task Objective 4. Provide Educational Opportunities Task A. Offer workshops
• Annual workshops would be offered to address proper timing, rate, method of application, existing regulations, setback/winter application requirements, and nutrient management. Workshops would be conducted by county, SWCD, NRCS, and HLWD staff. Locations would be rotated throughout the watershed during the ten-year grant period. Staff time would be allocated as inkind.

Appendix 6-Exhibit I
• Timeframe: Years 1-10 • Person(s) responsible: Seven-County Environmental Offices, SWCD and NRCS Offices, U of M
Extension, and HLWD • Total Costs:
o Cash: o Inkind:
Task B. Require refresher course
• Every two years producers with feedlot permits would be required to take a mandatory refresher course. Seventy-five percent cost-share would be provided for these courses. Workshops would be conducted by county, SWCD, NRCS, and HLWD staff. Their time would be allocated as inkind.
• Timeframe: Years 1-10 • Person(s) responsible: Seven-County Environmental Offices, SWCD and NRCS Offices, U of M
Extension, and HLWD • Total Costs:
o Cash: o Inkind:
Information needed to complete this task: • Work with county water plan coordinators to better identify what will work

Appendix 6-Exhibit I

Appendix 6-Exhibit I

Appendix 6-Exhibit I

Appendix 6-Exhibit I
Excess Nutrients TMDL Report Worksheet
Appendix 6-Exhibit I
Thursday, April 16, 2009
20. Excess nutrients is the water quality standard for lake and streams, only streams, or only lakes?
21. Name the three water quality parameters used to determine excess nutrient impairments.
1. ________________________ 2. ____________________ 3. _______________________
22. Name the two inlets to Heron Lake. 1._______________________ 2.________________________
23. List the three main categories for phosphorus sources.
1. ________________________ 2. ____________________ 3. _______________________
24. List the top three nonpoint sources based on Barr Engineering’s Phosphorus report.
1. ________________________ 2. ____________________ 3. _______________________
25. Rank these three sources based on 2006 loading estimates. (highest being 1)
WWTFs ____ Nonpoint ____ Internal Loading ____
26. What percentage reduction is needed by WWTFs to meet the water quality standard? ____
27. What percentage reduction is needed by nonpoint sources to meet the water quality standard? ____
28. Brainstorm: What are some actions that could be done to address phosphorus (in-lake & watershed)?
____________________________________________________________________________________
____________________________________________________________________________________
____________________________________________________________________________________
29. What are three actions that the TMDL report suggests for addressing phosphorus?
1. ________________________ 2. ____________________ 3. _______________________
30. What are the top three actions the landowners voted on for in-lake management?
1. ________________________ 2. ____________________ 3. _______________________

Appendix 6-Exhibit I

Appendix 6-Exhibit I
Appendix 6-Exhibit I

Appendix 6-Exhibit I

Appendix 6-Exhibit I

Appendix 6-Exhibit I

Appendix 6-Exhibit I

Appendix 6-Exhibit I

Appendix 6-Exhibit I
Excess Nutrients Roundtable Discussion Questions Thursday, April 16, 2009
7. List at least five specific in-lake actions that could be used to reduce phosphorus in Heron
Lake.
5. _______________________________________________________
_______________________________________________________
6. _______________________________________________________
_______________________________________________________
7. _______________________________________________________
_______________________________________________________
8. _______________________________________________________
_______________________________________________________
5. _______________________________________________________
_______________________________________________________
8. List at least five specific watershed actions that could be used to reduce phosphorus in
Heron Lake.
1. _______________________________________________________
_______________________________________________________
2. _______________________________________________________
_______________________________________________________
3. _______________________________________________________
_______________________________________________________
4. _______________________________________________________
_______________________________________________________
5. _______________________________________________________
_______________________________________________________

Appendix 9-Exhibit A
DEPARTMENT: POLLUTION CONTROL AGENCY SF-00006-05 (4/86)
STATE OF MINNESOTA
DATE: April 17, 2009 Office Memorandum
TO: Jerry Purdin
FROM: Kelli Daberkow
Hydrologist Watershed Section Regional Division
PHONE: 507-476-4251
SUBJECT: West Fork Des Moines River Implementation Plan Development Meeting
Hi there! I am sorry that you missed our fourth West Fork Des Moines River TMDL Implementation Plan meeting. We focused on addressing the excess nutrients portion of the TMDL report. There were three presentations given; the presentation slides are enclosed. Roundtable discussions were held and the committee listed several activities that could be accomplished to address phosphorus in Heron Lake. Voting will be taking place over email in the next week. In addition, a meeting with the adjacent Heron Lake landowners was held on April 7. The intent was to gather input regarding in-lake measures the landowners would be interested pursuing. The minutes and a summary of the input received are also enclosed. Jan Voit, Heron Lake Watershed District Administrator or I will be in contact with you to review the following meeting materials. Enclosures: 1. March 26, 2009 meeting minutes 2. Turbidity meeting summary and handout Jan Voit, HLWD 3. P What? Presentation Kelli Daberkow, MPCA 4. WWTP Implementation Options Lisa McCormick, MPCA 5. Shallow Lake Management Todd Kolander, MDNR 6. TMDL worksheet (corresponds with P What? presentation) and roundtable discussion handout 7. Heron Lake Landowner April 7, 2009 Meeting Minutes and Input Summary Form 8. Guide to Lake Protection and Management handout The last three meetings have been focused on gathering information and ideas to include in the implementation plan. The next steps include the HLWD incorporating the information into the implementation plan. The HLWD will also be scheduling meetings with the water plan coordinators and SWCD staff, the City of Worthington and the five wastewater treatment facilities that discharge to Heron Lake.

Appendix 9-Exhibit A
A draft plan will be sent to all committee members mid-May for your review. Please be prepared to review this document. A meeting is planned for Thursday, May 21, 2009 at 1 pm at the Heron Lake Community Center to discuss changes, additions, and comments.
Phosphorus Roundtable Discussion Summary April 16, 2009
Inlake Actions
1. $500 per ton incentive for commercial fisherman to conduct annual carp removal 2. Rough fish control with better control of upstream carp sources (i.e. in areas with continuous
flow converging into a ditch or stream) 3. Reduce rough fish population via commercial fishermen 4. Harvesting the lake on a bi-annual basis for emergent plants and rough fish and use pheromones
to increase the efficiency of seining 5. Awareness, education and removal through a festive carp tournament 6. Aggressive stocking of gamefish on a yearly basis 7. Upstream fish barriers on Jack Creek and Okabena Creek 8. Create inlake barriers to prevent wave agitation to limit turbidity and resuspension of phosphorus 9. Improve water level management capabilities through the use of structures and by-pass channels 10. Drawdown water pumped into fields through irrigation 11. Three-year drawdown with annual fall/winter rotenone application followed by fish stocking the
fourth year 12. Continue aggressive drawdown management 13. Education on the importance of drawdowns with the goal of conducting a drawdown 14. Easement for shoreline buffers with trees to reduce wind/wave action 15. Lake reclamation (dredging) to remove sediments and nutrients and provide deeper water to
prevent predator winterkill Watershed Actions
16. $2,500 per acre incentive for Wetland Reserve Program perpetual wetland restorations 17. 75% cost-share up to $30,000 for flood storage projects (excavated ponds, wetland creation) 18. 75% cost-share for grassed waterways 19. 100% restoration costs plus an annual payment of 1.5 times the net profit per acre for wetland
restorations for 10 years. Net profit determined by averaging net profit for current farm year. 20. Artificial impoundments 21. Stormwater and sedimentation basins for hydraulic retention 22. 75% cost-share with 15 year management agreement for controlled drainage 23. Pay for controlled drainage system with land lease for 5, 10, or 15 year period with variable rates 24. Explore details to create a new program to control water that comes into the lake 25. Explore options for point to nonpoint trading 26. $300 per acre incentive for planting perennial crop for 10 years 27. $150 per acre incentive for bi-annual planting of winter wheat/rye as a cover crop 28. Small rain gardens to create water retention on farm ground in the upper watershed at $150 per
acre or the average CRP rental payment per acre

Appendix 9-Exhibit A
29. Full-time person ($15-20/hr) to manage the rain gardens, sedimentation basins, and created wetlands
30. Urban education about stormwater management
Phosphorus Roundtable Votes April 27, 2009
Inlake Actions
31. $500 per ton incentive for commercial fisherman to conduct annual carp removal x 32. Reduce rough fish population via commercial fishermen x 33. Harvesting the lake on a bi-annual basis for emergent plants and rough fish and use pheromones
to increase the efficiency of seining xx 34. Aggressive stocking of gamefish on a yearly basis xx 35. Three-year drawdown with annual fall/winter rotenone application followed by fish stocking the
fourth year xxxx 36. Continue aggressive drawdown management xx 37. Education on the importance of drawdowns with the goal of conducting a drawdown x 38. Lake reclamation (dredging) to remove sediments and nutrients and provide deeper water to
prevent predator winterkill xx Watershed Actions
39. $2,500 per acre incentive for Wetland Reserve Program perpetual wetland restorations xxx 40. 75% cost-share up to $30,000 for flood storage projects (excavated ponds, wetland creation)
xxxx 41. 100% restoration costs plus an annual payment of 1.5 times the net profit per acre for wetland
restorations for 10 years. Net profit determined by averaging net profit for current farm year. x 42. Artificial impoundments x 43. 75% cost-share with 15 year management agreement for controlled drainage x 44. Pay for controlled drainage system with land lease for 5, 10, or 15 year period with variable rates
x 45. $300 per acre incentive for planting perennial crop for 10 years xxx 46. Full-time person ($15-20/hr) to manage the rain gardens, sedimentation basins, and created
wetlands x
TMDL Implementation Plan Development Meeting Thursday, April 16, 2009 at 1:00 p.m.
Heron Lake Community Center, Heron Lake, MN
Attendance

Appendix 9-Exhibit A
Dwayne Haffield, Kay Clark, Mark Vaniman, Clark Lingbeek, Ashley Kleven, Steve Beckel, Randy Markl, Mark Koster, Rich Perrine, Lisa McCormick, Don Louwagie, Todd Kolander, Mike Haugen, Jan Voit, Matt Drewitz, Don Hagen, Ross Behrends, Ben Crowell
Minutes
+ Jan Voit welcomed everyone. Introductions were given. The agenda for the meeting was presented. The task for the day was to review the results of the turbidity meeting and determine implementation measures and actions that will address the excess nutrient impairment as well as be accepted by the general public.
o The revised process for obtaining input through roundtable discussions and voting via email proved successful.
o The following actions were chosen to address turbidity: $15 per acre incentive for variable rate fertilizer application, maximum of 500
acres per producer $5,000 per acre incentive, plus restoration costs, for perpetual easement for
water/flood storage (wetlands, sediment basins, etc.) 100% cost-share plus a $200 per acre incentive for 15 years for harvestable native
grass buffer, minimum 100’, maximum 200’, first 50’ un-harvestable, 50% of the remaining acres can be harvested each year.
o Section six of the implementation plan was distributed. Items with which assistance is needed were noted in red text. A meeting will be held with the seven county water plan coordinators and SWCDs to address these issues.
Kelli Daberkow provided a summary of the phosphorus portion of the TMDL Study. A worksheet was distributed to go along with the presentation.
• Lisa McCormick, MPCA, gave a presentation about TMDL point source implementation options. • The group took a 10-minute break. • Todd Kolander, DNR, gave a presentation on shallow lake management. Randy Markl and Kelli
Daberkow commented on the challenge of the hydrology of the Heron Lake watershed. • Jan Voit and Melanie Luinenburg assigned participants to five tables. • Kelli Daberkow reviewed several handouts including minutes and input from a recent meeting held
with Heron Lake landowners. A booklet describing various in-lake and watershed BMPs was also provided. These handouts were to be used in determining actions.
• Jan Voit explained the round table discussion process in that a reporter and recorder should be chosen by each table and duplication of action items voted into place at previous meetings should be avoided.
• Each table addressed the following questions: o List at least five specific inlake actions that could be used to reduce phosphorus in Heron
Lake. o List at least five specific watershed actions that could be used to reduce phosphorus in
Heron Lake. • Each table reported on their discussion. • The attendees were reminded that voting would occur via email. The actions presented by the each of
the roundtables will be summarized and distributed. Each member will be able to vote from April 20 through April 27. The next meeting will be held on Thursday, May 21, at 1:00 p.m. at the Heron Lake Senior Citizen’s Center.
The meeting was adjourned. Heron Lake Watershed District

Appendix 9-Exhibit A
PO Box 345, Heron Lake, MN 56137 507-793-2462 ~ FAX 507-793-2253
Toll free: 888-878-4345 Email: [email protected] Web: www.hlwdonline.org
TO: Water Plan Coordinators and SWCD Staff FROM : Jan Voit, District Administrator SUBJECT: Staffing and Actions for WFDMR TMDL Project meeting DATE: April 22, 2009
Your assistance with the implementation plan has been wonderful. I appreciate the time and effort that you’ve expended on this effort!
The time has come to sit down and take a good, hard look at the implementation actions and make sure that we are moving in the right direction. Discussion also needs to take place regarding staffing as it relates to implementation efforts. As you know, a project of this size cannot be completed successfully without dedicated staff. We are interested in knowing the level of involvement your office can provide to the project and your ideas about staff needed to make this happen. The difficult part is not knowing the funding mechanisms at this time. Regardless, staff costs should still be included in the plan and since your organization is an integral part of this project, your input is important.
I would like to meet with the seven-county environmental offices and SWCDs to discuss these items. The meeting will be held on Monday, April 27, 2009 at 1:00 pm at the Heron Lake Community Center. Attached is a questionnaire to guide the staffing discussion. Please take the time to complete this document and bring it to the meeting on Monday.
Also included is the list of action items for bacteria and turbidity that have been chosen for inclusion in the plan. I would like to take the time to review each of these items to ensure that you and your office are willing and able to “adopt” these actions if funded. There are also some items that require information from you. Please come to the meeting prepared to provide input on the required information.
At the next meeting of the Advisory and Technical committees scheduled for May 21, the entire draft implementation plan will be reviewed. If there are actions missing or an action is not viable, a case can be made for keeping the action, removing the action, or adding additional actions. But, in order for that to be presented to the committee on May 21, a good argument will need to be made. So, please take the time to review each of these actions before Monday so we can discuss them and be prepared for the May 21 meeting.
Agenda When: Monday, April 27 at 1:00 pm Location: Heron Lake Community Center Discussion Items:
• Staffing questionnaire • Clarification of actions

Appendix 9-Exhibit A
We cannot do this without you. Your attendance at this meeting is extremely important! I look forward to meeting with you on Monday. If you can not attend, please contact me so that your input is still included in this meeting.
Should you have any questions, please do not hesitate to contact me. Discussion questions
1. Do we need additional staff to assist with actions identified in the implementation plan?
2. In the past, a WFDMR watershed coordinator has been funded through grants, should this continue?
3. Or do we pursue funding of a coordinator through other longer-term mechanisms? (joint powers association, watershed district development, 7 county commitment and HLWD, other?)
4. Would your organization be able to contribute dollars to fund a coordinator?
5. What other positions are needed to complete the implementation plan actions? (i.e. technician, education, GIS, feedlot specialist, enforcement person, SSTS person, other?)
6. Could this be done with existing staff? Or new? What is needed?
7. Is there an opportunity for your organization to fund a full-time position?
8. Is there an opportunity for your organization to fund a part-time position?
9. Is there an opportunity for your organization to provide office space?
10. Is there an opportunity for your organization to provide office equipment and supplies?
11. Is there an opportunity for your organization to provide a vehicle?
12. If your organization is able to provide funds, space, equipment, vehicle, etc, when and for how long could this agreement occur?
13. Other ideas and options?

Appendix 9-Exhibit A
6.0 Identification and Summary of Implementation Objectives and Action Items **Changes in blue text, red text indicates questions/comments Objective 1. Address Nonpoint Source Pollution Task A. Provide a $500 or $1,000 per acre incentive for riparian buffer strips
• Eligible landowners would receive a one-time cash incentive of $500 per acre for installing a riparian buffer strip for 15 years or a one-time cash incentive of $1,000 per acre for a perpetual easement. The buffer strip would need to meet the technical requirements of the practice. It is estimated that there are 1,839 stream miles in the watershed and that 58% are without adequate buffers. The practice would follow NRCS specifications. Staff time from the seven-county environmental offices, SWCD and NRCS offices, HLWD, and BWSR would be allocated as inkind.
• Timeframe: Years 1-10 • Person(s) responsible: Seven-county Environmental offices, SWCD and NRCS offices, HLWD,
and BWSR • Total costs: $6,989,400.00
o Cash: $6,396,000.00 • 4,264 acres x $500 = $2,132,000.00 • 4,264 acres x $1,000 = $4,264,000.00
o I wasn’t sure what to do with this, so I just split the acres 50/50 o Inkind: $596,400.00
• 852 contracts @ 20 hrs x $35 = $596,400.00 Task B. Provide a $500 per acre incentive for feedlot buffer strips
• Eligible landowners would receive a one-time cash incentive of $500 per acre for installing a feedlot buffer strip. The buffer strip would need to meet the technical requirements of the practice. The practice would follow NRCS specifications. Staff time from the seven-county environmental offices, SWCD and NRCS offices, HLWD, and BWSR would be allocated as inkind.
• Timeframe: Years 1-10 • Person(s) responsible: Seven-county Environmental offices, SWCD and NRCS offices, and
HLWD • Total costs: $379,140.00
o Cash: $267,000.00 • (75% of the feedlots) 534 acres x $500 = $267,000.00
o Inkind: $112,140.00 • 534 contracts x 6 hrs x $35 = $112,140.00
Task C. Provide a maximum of $500 per intake cost-share for replacing open tile intakes with alternative tile intakes
• Eligible landowners would receive a one-time cost-share payment of 75% with a maximum of $500 to replace open tile intakes with alternative tile intakes. It is estimated that there are 10,664 eighty acre parcels containing an average of two open tile intakes. Staff time from the seven-county environmental offices, SWCD and NRCS offices, and HLWD would be allocated as inkind.
• Timeframe: Years 1-10

Appendix 9-Exhibit A
• Person(s) responsible: Seven-county Environmental Offices, SWCD and NRCS Offices, and HLWD
• Total Costs: $13,649,920.00 o Cash: $10,664,000.00
• 10,664 parcels x 2 = 21,328 x $500 = $10,664,000.00 o Inkind: $2,985,920.00
• 21,328 intakes @ 4 hrs x $35 = $2,985,920.00
Task D. Provide a $300 per acre incentive for manure application • Eligible landowners with an approved manure management plan would receive a one-time
incentive payment of $300 per acre for manure application on small grain and hay fields. It is estimated that there are 56,960.00 acres that would be eligible for this practice. Staff time from the seven-county environmental offices, SWCD and NRCS offices, and HLWD would be allocated as inkind.
• Timeframe: Years 1-10 • Person(s) responsible: Seven-county Environmental Offices, SWCD and NRCS Offices, and
HLWD • Total Costs: $17,187,680.00
o Cash: $17,088,000.00 • 80 acres/feedlot x 712 = 56,960 x 300 = $17,088,000.00
o Inkind: $99,680.00 • 4 hrs/feedlot x 712 x $35 = $99,680.00
Task E. Provide $15 per acre incentive for variable rate fertilizer application
• Eligible landowners would receive a one-time incentive of $15 per acre for variable rate commercial fertilizer application on a maximum of 500 acres per producer. Staff time from the seven-county environmental offices, SWCD and NRCS offices, and HLWD would be allocated as inkind.
• Timeframe: Years 1-10 • Person(s) responsible: Seven-county Environmental offices, SWCD and NRCS offices, and
HLWD • Total costs: $11,107,935.00
o Cash: $11,005,245.00 • 733,683 acres x $15 = $11,005,245.00
o Inkind: $102,690.00 • 1,467 contracts @ 2 hrs x $35 = $102,690.00
Task F. Provide incentive and restoration costs for perpetual easement program
• Eligible landowners would receive a $5,000 per acre incentive, plus restoration costs, for perpetual easement for water/flood storage (wetlands, sediment basins, etc.) A maximum of 4 upland acres per basin acre would be allowed. The easement would require that maintenance be the responsibility of the landowner. A restorable wetland inventory has not completed for the entire watershed. A rough estimate indicates 8,720 acres in need of restoration. Staff time from the seven-county environmental offices, SWCD and NRCS offices, BWSR, and HLWD would be allocated as inkind.
• Timeframe: Years 1-10

Appendix 9-Exhibit A
• Person(s) responsible: Seven-county Environmental offices, SWCD and NRCS offices, BWSR, and HLWD
• Total costs: $48,428,700.00 o Cash: $48,123,500.00
• 8,720 acres x $5,000 = $43,600,000.00 • 8,720 acres x $500 = $4,360,000.00 • $750 x 218 easements = $163,500.00
o Inkind: $305,200.00 • 218 easements x 40 hrs x $35 = $305,200.00
Task G. Cost-share and incentive program for harvestable buffer program
• Eligible landowners would receive 100% cost-share plus a $200 per acre incentive per year for 15 years for harvestable native grass buffer, minimum 100’, maximum 200’, first 50’ un-harvestable, 50% of the remaining acres can be harvested each year. It is estimated that there are 1,839 stream miles in the watershed and that 58% are without adequate buffers. Staff time from the seven-county environmental offices, SWCD and NRCS offices, and HLWD would be allocated as inkind.
• Timeframe: Years 1-10 • Person(s) responsible: Seven-county Environmental offices, SWCD and NRCS offices, and
HLWD • Total costs:
o Cash: • 25,842 acres x $200 = $5,168,400.00 • 25,842 acres x $200 = $5,168,400.00
o Inkind: • 2,584 contracts x 20 x $35 = $1,808,800.00
Should the buffer programs be together in this section? How do I address the acres in each action item? I can’t really think that all of the acres can be enrolled completely in each program . . . . Task H. $2,500 per acre incentive for Wetland Reserve Program perpetual wetland restorations
• Eligible landowners would receive a $2,500 per acre incentive for enrolling in the Wetland Reserve Program perpetual wetland restoration. A restorable wetland inventory has not completed for the entire watershed. A rough estimate indicates 8,720 acres in need of restoration. Staff time from the seven-county environmental offices, SWCD and NRCS offices, and HLWD would be allocated as inkind.
• Timeframe: Years 1-10 • Person(s) responsible: Seven-county Environmental offices, SWCD and NRCS offices, and
HLWD • Total costs:
o Cash: $21,800,000.00 • 8,720 acres x $2,500 = $21,800,000.00
o Inkind: $101,500.00 • 145 contracts x 20 x $35 = $101,500.00
Should the wetland/basin programs be together in this section? How do I address the acres in each action item? I can’t really think that all of the acres can be enrolled completely in each program . . . . Task I. 75% cost-share up to $30,000 for flood storage projects (excavated ponds, wetland creation)

Appendix 9-Exhibit A
• Eligible landowners would receive 75% cost-share up to $30,000 for flood storage projects. Staff time from the seven-county environmental offices, SWCD and NRCS offices, and HLWD would be allocated as inkind.
• Timeframe: Years 1-10 • Person(s) responsible: Seven-county Environmental offices, SWCD and NRCS offices, and
HLWD • Total costs: $1,719,200.00
o Cash: $1,680,000.00 • 56 sites x $30,000 = $1,680,000.00
o Inkind: $39,200.00 • 20 hrs x 56 x $35 = $39,200.00
Task J. $300 per acre incentive for planting perennial crop for 10 years
• Eligible landowners would receive a $300 per acre incentive for planting a perennial crop for 10 years. Staff time from the seven-county environmental offices, SWCD and NRCS offices, and HLWD would be allocated as inkind.
• Timeframe: Years 1-10 • Person(s) responsible: Seven-county Environmental offices, SWCD and NRCS offices, and
HLWD • Total costs:
o Cash •
o Inkind Information needed to complete this task:
• Estimated acres • Estimated acres per contract • Estimated staff time
I have absolutely no idea how to proceed with this one. Objective 2. Feedlot Management Task A. Targeted, Level III Feedlot Inspections/Site Visits by Staff (New, Existing, or Interns) and 75% Cost-Share for Polluting Sites
• A targeted, Level III Feedlot Inspection would include an inventory of all animals, size of buildings, watershed size going to the feedlot, distance to discharge point (stream or tile), buffers, and slopes of the yards. Current feedlot rules require that a minimum of seven percent of the feedlots be inspected each year. This plan would require an expedited completion of the Level III inventory. There are 712 feedlots in the watershed. A Level III inventory would be completed for each of these feedlots over the 10-year period of the grant. 75% cost-share up to $100,000 would be provided to fix polluting sites as determined by the Level III inventory. Staff time from the seven-county environmental offices would be allocated as inkind.
• Timeframe: Years 1-10 • Person(s) responsible: Seven-County Environmental Offices • Total Costs: $7,224,600.00
o Cash: $7,100,000.00 o 71 (10% of the feedlots) x $100,000 = $7,100,000.00
o Inkind: $124,600.00 o 5 hours/site x $35.00/hour x 712 feedlots = $124,600.00

Appendix 9-Exhibit A
Objective 3. Address Inlake Phosphorus Loading Task A. Three-year drawdown with annual fall/winter rotenone application followed by fish stocking the fourth year Aggressive drawdown management would continue to be employed. In addition, project partners would work with DNR staff to conduct a rotenone application on an annual basis for three years, if weather conditions allow. In the fourth year, gamefish stocking would be done. Staff time from the seven-county environmental offices, SWCD and NRCS offices, DNR, and HLWD would be allocated as inkind.
• Timeframe: Years 1-4 • Person(s) responsible: Seven-county Environmental offices, SWCD and NRCS offices, DNR,
and HLWD • Total costs: $2,371,750.00
o Cash: $2,259,000.00 • $35/acre foot x 20,000 acre feet x 3 = $2,100,000.00 • $11.50 per thousand x 6,000 acres (walleye) = $69,000.00 • $15/pound x 6,000 acres (northern) = $90,000.00
o Inkind: $112,750.00 • 1,000 hrs x $35 x 3 (rotenone) = $105,000.00 • $250/hr x 8 x 3 (helicopter rental) = $6,000.00 • 50 hrs x $35 (fish stocking) = $1,750.00
Objective 4. Address Point Source Pollution Task A: Provide low interest loans
• Eligible landowners would qualify for a low interest loan for 100% of the cost to upgrade a septic system. It is estimated that there are 3,818 systems in the watershed that are noncompliant. Staff time from the seven-county environmental offices and HLWD would be allocated as inkind.
• Timeframe: Years 1-10 • Total Costs: $44,670,600.00
o Cash: $41,998,000.00 • 3,818 systems x $11,000.00 = $41,998,000.00
o Inkind: $2,672,600.00 • 20 hours x 3,818 x $35 = $2,672,600.00
Task B: Provide cost-share
• Eligible landowners would qualify for 25% cost-share, maximum of $2,500, to upgrade a septic system. It is estimated that there are 3,818 systems in the watershed that are noncompliant. Staff time from the seven-county environmental offices and HLWD would be allocated as inkind.
• Timeframe: Years 1-10 • Person(s) responsible: Seven-County Environmental Offices and HLWD • Total Costs: $10,079,520.00
o Cash: $9,545,000.00 • 3,818 systems x $2,500.00 = $9,545,000.00
o Inkind: $534,520.00 • 4 hrs x 3,818 x $35 = $534,520.00

Appendix 9-Exhibit A
Objective 5. Provide Educational Opportunities Task A. Offer manure management workshops
• Annual workshops in the four core counties would be offered to address proper timing, rate, method of application, existing regulations, setback/winter application requirements, and nutrient management. Workshops would be conducted by county, SWCD, NRCS, and HLWD staff. Locations would be rotated throughout the watershed during the ten-year grant period. Staff time would be allocated as inkind.
• Timeframe: Years 1-10 • Person(s) responsible: Seven-County Environmental Offices, SWCD and NRCS Offices, U of M
Extension, and HLWD • Total Costs: $119,600.00
o Cash: $100,000.00 • $2,500/workshop x 4 x 10 = $100,000.00
o Inkind: $19,600.00 • 4 hrs/county x 4 x $35 x 10 = $5,600.00 • 10 hrs/speaker x 4 x $35 x 10 = $14,000.00
Task B. Require refresher course
• Every two years producers with feedlot permits would be required to take a mandatory refresher course. Seventy-five percent cost-share would be provided for these courses. Workshops would be conducted by county, SWCD, NRCS, and HLWD staff. Their time would be allocated as inkind.
Water Plan Coordinators and SWCD staff believe this action should be removed because: • It is already being addressed in Task A, • there is no possible way to mandate the action, • there is no initial course to which a refresher would follow, • it is not required according to the Minnesota 7020 rule, and • it would not reduce bacteria.
Objective 6. Project Administration Task A. Watershed Coordinator
• Hire a watershed coordinator to direct project activities and seek funding and provide the office and equipment needed to support the position. This position would be housed in the HLWD office.
• Timeframe: Years 1-10 • Person(s) responsible: HLWD • Total Costs: $1,118,700.00
o Cash: $1,088,700.00 • $50 per hour x 2080 x 10 = $1,040,000.00 • Equipment:
• Computer = $2,500.00 • Travel:
• 8,400 miles x $.55 x 10 = $46,200.00 o Inkind: $30,000.00
• Office Space and Office Supplies • $3,000 x 10 = $30,000.00

Appendix 9-Exhibit A
Task B. Engineering Technician
• Hire an engineering technician to provide technical information for projects within the watershed and provide the office and field equipment needed to support the position. This position would be housed in the Murray SWCD office.
• Timeframe: Years 1-10 • Person(s) responsible: Murray SWCD • Total Costs: $1,191,200.00
o Cash: $1,161,200.00 • $50 per hour x 2080 x 10 = $1,040,000.00 • Equipment: $75,000.00
• Trimble Robotic Total Station = $35,000.00 • Trimble GPS Rover = $30,000.00 • AutoCad Civil 3D Software for design = $5,500.00 • Computer = $2,500.00 • Miscellaneous Survey Equipment (survey book, flags, lath, etc.) =
$2,000.00 • Travel: $46,200.00
• 8,400 miles x $.55 x 10 = $46,200.00 o Inkind: $30,000.00
• Office Space and Office Supplies • $3,000 x 10 = $30,000.00
Task C. Watershed Technicians
• Hire two watershed technicians to promote and enroll projects within the watershed and provide the office and field equipment needed to support the positions. These positions would be shared between Jackson/Cottonwood and Nobles/Murray Counties. Housing will be provided by the respective county and/or SWCD offices.
• Timeframe: Years 1-10 • Person(s) responsible: 4 county environmental offices • Total Costs: $1,610,900.00
o Cash: $1,550,900.00 • $35 per hour x 2080 x 2 x 10 = $1,456,000.00 • Equipment: $2,500.00
• Computer = $2,500.00 • Travel: $92,400.00
• 16,800 miles x $.55 x 10 = $92,400.00 o Inkind: $60,000.00
• Office Space and Office Supplies • $6,000 x 10 = $60,000.00

Appendix 9-Exhibit A
WATERSHED SQ METER SQ MILE ACRE PERCENT
SHETEK 57,646,829.00 22.26 14,244.82 2%TOTAL: 57,646,829.00 22.26 14,244.82 2%
BEAVER 21,676,353.00 8.37 5,356.34 1%TOTAL: 21,676,353.00 8.37 5,356.34 1%
SHETEK 274,396,254.87 105.94 67,804.69 8%BEAVER 438,755,374.92 169.40 108,418.65 13%HERON LAKE 126,534,209.09 48.86 31,267.24 4%WFDMR 499,897,921.68 193.01 123,527.28 14%
TOTAL: 1,339,583,760.56 517.22 331,017.85 39%
WFDMR 38,346,856.92 14.81 9,475.70 1%TOTAL: 38,346,856.92 14.81 9,475.70 1%
WFDMR 495,252,423.97 191.22 122,379.35 14%HERON LAKE 477,257,531.56 184.27 117,932.72 14%
TOTAL: 972,509,955.52 375.49 240,312.07 28%
WFDMR 404,158,062.46 156.05 99,869.48 12%HERON LAKE 22,240,828.00 8.59 5,495.82 1%
TOTAL: 426,398,890.46 164.63 105,365.30 12%
WFDMR 13,671,922.54 5.28 3,378.40 0.4%HERON LAKE 584,664,928.89 225.74 144,473.63 17%
TOTAL: 598,336,851.42 231.02 147,852.03 17%WATERSHED TOTAL 1,333.79 853,624.10 100%
JACKSON
COTTONWOOD
NOBLES
LYON
PIPESTONE
MURRAY
MARTIN
TMDL Implementation Plan Meeting – Water Plan
Coordinators and SWCD Staff Monday, April
27, 2009 at 1:00 p.m.
Center, Heron Lake, MN
Heron Lake Community
Attenda
B
Konkol, Rich
Mike Hanson,
Jan Voit,
Gordy Olson,
ie Luinenburg
Jan Voit
s
nce Ross
ehrends, Howard
Perrine, Wayne Smith,
Kelli Daberkow,
Brian Nyborg,
Rose Anderson,
Chris Hansen, Dave Bucklin, Jane Steffl, Kyle Krier, and Melan
Minutes
welcomed everyone.
Introductionwere given.

Appendix 9-Exhibit A
Jan outlined the tasks for the meeting and began the meeting by referring to a staffing questionnaire that was emailed to meeting attendees prior to the meeting. The following questions were addressed and
oint powers D, other?)
ions? (i.e. technician, on, other?)
n?
ment and supplies?
provide funds, space, equipment, vehicle, etc, when and for how long could this agreement occur?
as inkind contributions. Grant nds would be needed for computers, equipment, and vehicle expenses.
ument was used to aid in discussion. The following is a mmary of the changes and recommendations.
e for
rage inkind is 4 hours/intake. There
anure to 80 acres (712 feedlots x 80 acres=56,000 acres). The average inkind is 4
is should be a one-time incentive for commercial fertilizer.
discussed. Do we need additional staff to assist with actions identified in the implementation plan? In the past, a WFDMR watershed coordinator has been funded through grants, should this continue? Or do we pursue funding of a coordinator through other longer-term mechanisms? (j
association, watershed district development, 7 county commitment and HLW Would your organization be able to contribute dollars to fund a coordinator? What other positions are needed to complete the implementation plan act
education, GIS, feedlot specialist, enforcement person, SSTS pers Could this be done with existing staff? Or new? What is needed? Is there an opportunity for your organization to fund a full-time position? Is there an opportunity for your organization to fund a part-time positio Is there an opportunity for your organization to provide office space? Is there an opportunity for your organization to provide office equip Is there an opportunity for your organization to provide a vehicle? If your organization is able to
It was decided that additional staff is needed in order to have a successful project. After much discussion, it was determined a watershed coordinator could be housed in the HLWD office and an engineering technician could be housed in Murray SWCD. In addition, a watershed technician with a shared office could be housed in Murray and Nobles counties and a watershed technician with a shared office could be housed in Cottonwood and Jackson SWCDs. During discussion it was determined that these positions would need to be grant funded with office space countingfu The second task of the meeting was to review the actions that have been voted on and selected by the technical and advisory committees. A handout entitled Bacteria and Turbidity Results was emailed to meeting attendees prior to the meeting. This docsu Buffer strips: Need to have a program for feedlot buffer strips with an average width of 200 feet and
a program for riparian buffers strips with an average width of 120 feet. The riparian buffer incentive would be two-fold. A 15-year contract would be eligible for a $500/acre incentive for acres enrolling in CRP. A perpetual easement would be would be eligible for a $1,000/acre incentivacres enrolling in RIM. The average inkind spent on a buffer strip project is 20 hours/contract.
Rock Inlets: Need to change the language from “rock inlet” to “alternative intake”. This allows for more opportunities for replacing open tile intakes. The avewould not be a limit of the number a landowner could replace.
Small Grain/Hay fields Manure application: Need to have an approved manure management plan in order to qualify for the incentive. The incentive should be $300/acre on 56,000 acres. The average feedlot applies mhours/contract.
Variable Rate Fertilizer Application: ThThe average inkind is 2 hours/contract.

Appendix 9-Exhibit A
Perpetual easement program for flood storage: This will be a new stand-alone program. Average easement costs are $750 done by BWSR. The average cost for restoration costs is $500/acre. The
entory completed without following
average cost is $100,000. It
ussion was held that centered around providing more details needed for this
eld, there would have to be an initial class to which follow up is needed. The initial class is not currently being held. The group
Jan Voit thanked the attendees for their input and time. The attendees were reminded of the upcomingmeeting in May 21, 2009 and to watch for a draft implemenadjourned at 3:30 p.m.
Heron Lake WPO Box 34
507-793-Toll free: 888-878-4345
Email: [email protected]: www.hlwdonline.org
average inkind is 40 hours/contract. Harvestable Buffer Program: The average cost for establishment is $200/acre and average inkind
time is 20 hours/contract. Feedlot inventory: It did not seem reasonable to have an inv
through with a cost-share program to do feedlot fixes. Discussion resulted in adding a new action where the project would provide up to 75% cost-share for fixes. Thewas estimated that 10 percent of the feedlots would need fixes.
SSTS low interest loans and incentive: The average inkind is 3 hours/loan for completing loan paperwork. The average inkind for installation is 20-25 hours/system.
Feedlot Workshops: Disctask. It was decided that hosting one workshop in each of the four counties annually would be the best. It was estimated that each workshop would cost $2,500 and inkind would be 4 hours/county/workshop.
Refresher Course: Through discussion it was determined that this action would be extremely hard to implement at the local level. Before a refresher course could be h
felt that the information presented at the feedlot workshops would be similar to the intent of this action. It was recommended by the attendees to remove this action.
tation plan in the beginning of May. Meeting
atershed District
5, Heron Lake, MN 56137 2462 ~ FAX 507-793-2253
Technical Committee members
the implementation plan to make
the
or the small grain and hay field application incentive. (Page 40)
TO: Advisory and FROM : Jan Voit, District Administrator SUBJECT: Draft Plan Review DATE: May 7, 2009
The time has come to sit down and take a good, hard look at sure it encompasses the discussions held at the past meetings and review the actions to ensure both the urban and rural nonpoint components to address bacteria, turbidity, and phosphorus have been included. A draft plan is enclosed for your review.
In developing the plan, some fine details and assumptions were made. They include: o Objective 1, Task C: Only areas without an existing buffer would be eligible for
harvestable buffer program. (Page 40) o Objective 2, Task B: A producer must have an approved manure management plan in
order to qualify f

Appendix 9-Exhibit A
o Objective 2, Task C: In order to qualify for the variable rate fertilizer incentive, the producer must make a commitment to employ the practice for a minimum of three years. (Page 41)
o Objective 4, Task A: The Level III Feedlot Inspections would take place during years one through five. An action was added to correct problem sites. This action would occur during years six through ten. (Page 43)
o Objective 7, Task B: Require a refresher course for feedlots owners was a difficult
ity
as assumed that the education be done in years one through five,
tion actions are scheduled for years
or an action is not viable, a case de at the meeting for keeping the action, removing the action, or adding additional
extremely important! I look forward to getting together on May 21. If n not attend, please contact me so that your input is included atShould you have any questions e.
TMDL Implementation Plan Development Meeting Thursday, May 21, 2009 at 1:00 p.m.
Heron Lake Comm Heron Lake, MN
task to develop and county feedlot officers agreed that this would be almost impossible to pursue. At this time, it has been suggested to remove this action from the plan. (Page 46)
o To address inlake phosphorus loading, committee members believe drawdown and rotenone application are necessary. These actions are supported by Heron Lake landowners. The action was formulated under the premise of determining feasibiland continued education with the ultimate goal of drawdown and rotenone application. It wwith the goal of drawdown and rotenone application during years six through ten.
o All of the remaining education and implementaone through ten.
If you do not agree with these assumptions, please bring your concerns to the next meeting scheduled for May, 21, 2009. See below for more details.
A meeting to review the draft plan will be held on Thursday, May 21 at 1:00 pm at the Heron Lake Community Center. If there are actions missingcan be maactions. But, in order for that to happen, a good argument must be made. So, please take the time to review each of these actions so we can discuss them.
We cannot do this without you. Your attendance at this meeting is you ca
the meeting. , please do not hesitate to contact m
unity Center,
Attendance
Chris Hansen, Brian Christiansen, Howard Konkol, Gordy Olson, Todd Kolander, Ed Lenz, Randy Markl, Don Louwagie, Clark Lingbeek, Kay C oit, Kelli Daberkow, Melanie Raine, Dwayne
lark, Jan V
Haffield, Steve Beckel, and Mike Haugen
Minutes Jan Voit called the meeting to order. The minutes of the April 16 and April 27 meetings were distributed and reviewed. Jan explained the
changes that were made to the plan based on the April 27 meeting where the county water planners and SWCD staff from the seven counties met to discuss project staff needs and review the actions chosen thus far. The results of that meeting indicate a need for a watershed coordinator, an engineering technician, and two field technicians to efficiently and effectively coordinate the project.

Appendix 9-Exhibit A
A question was raised regarding how point source pollution would be addressed in the implementation plan. Septic systems are addressed in the point source section of the plan. Feedlots are addressed in the nonpoint source portion. In addition, the City of Worthington’s stormwater and
plementation Plan, which was developed based on idance and other approved plans. The group then discussed each item in Section 6.0
ction Items in more detail. Several
bout whether or not to include a timeframe when
tile intakes. Refigure
: Add “Fertilizer must be incorporated into the soil using U of M rates
etual easement program for restoring wetlands”. Discussion
of 1:1 minimum. This was stressed
4-Task B: Inkind staff time should be changed to 16 hours/project rather than 5
dd a task for putting in structures to reduce wind effects. It
be
n making it mandatory. The
ld be changed to Objective 8.
Committee and Technical Committee
the wastewater treatment facilities for the cities of Worthington, Brewster, Okabena, and Lakefield and Swift, Inc. will be addressed in the point source section. MPCA and HLWD intend to meet with those entities to develop those sections of the plan.
Jan Voit reviewed the format of the TMDL ImMPCA guIdentification and Summary of Implementation Objectives and Achanges were made and are summarized below. Changes:
o Objective 1-Task A and B: Remove the word “riparian”. o Objective 1-Task C: Remove “50 percent of the remaining acres”. This would be hard to
enforce otherwise. Discussion held amowing could occur. It was decided not to include a timeframe.
o Objective 2-Task A: Change 21,238 open tile intakes to 18,342 opencost share; total cost should be $450.
o Objective 2-Task B: Remove this task because of uncertainty as to how it would impact water quality and also operators are already implementing this action.
o Objective 2-Task Cand must be applied in the spring”. Other details discussed: Incentive would be paid $5/yr/acre over three years, may be better to conduct at subwatershed or township level and proof of eligibility.
o Objective 2-Task D: Change “perennial crop such as native grasses” to “third crop”. An annual payment would be made each year for the length of the grant. Other details discussed and agreed on: 40-acre maximum per contract and the crop may be harvested.
o Objective 3-Task A: Delete the words “and provide incentive for” and change the task heading to “Fully fund a perpabout payment rate and acres; the payment would be changed to $6,500 per acre and implemented in targeted areas with a basin to upland acreas an important task to pursue.
o Objectivehrs. Refigure cost share; total cost should be $100,000.
o Objective 4-Task C: The incentive would be for eligible landowners signing a ten-year contract.
o Objective 5-Task B: Discussion about pursuing the inlake management task within the ten years. It was also suggested to awas decided that natural barriers would be better.
o Objective 6-Task A and B: Discussion about calculating the in-kind. This will need to addressed in the budget as well.
o Objective 7-Task B: Remove this task because of difficulty iinformation that would be presented would already be covered under Objective 7-Task A.
o Objective 7-on page 46 shouo Objective 9-Task B: Change $30,000 under inkind to $39,000.
Jan asked the group to provide suggestions for new actions that were not included to this point. It was proposed to add the following:
o Annual meetings of the Advisory

Appendix 9-Exhibit A
o Project promotion items (newsletters, website, booths during local celebrations, and guided canoe trips)
o Rain garden cost-share program o Urban BMP Education Program with permeable pavers, vegetative swales, rain barrels, and
boulevard tree plantings o Replacement of ash trees in boulevards
ressing failing dams. No specific actions
ents, or
the suggested updates/changes, allow for committee review again, meet with five communities, and then submit the implementation plan for MPCA approval.
A reminder was given that a public meeting will be held in August. Meeting adjourned at 4:00 p.m.
he following information is detailed information in calculating the actions that were chosen for the .0 is an estimate of
g adequate funding is available.
Object from erosion and runoff through buffer programs Action 00 per acre incentive for 15-year buffer strips. 1. Buff :
o Also mentioned were sewer line extensions/SSTS upgrades in un-annexed areas near towns, better management of urban snow piles, and addwere suggested.
Jan Voit thanked all attendees for their input and asked for additional thoughts, commtypographical errors to be submitted as soon as possible.
The next steps will be to make
Timplementation plan. This information shows the need for the watershed; Section 6what can be accomplished in the ten years of implementation, providin
ive 1. Protect banks A. Provide a $5er strip acreage goal120 foot wide buffer x 5,280 ft/mile 633,600 sq ft/mile x 2 buffers on both sides
ffered streams* 1,267,200 sq ft/mile x 355.54 miles on unbu 450,540,288 sq ft x 0.000022956841139 sq ft/acre 10,343 acres available *Based on BWSR ditch survey, 2006 and GIS: 1,839 miles of streams in the WFDMR watershed 42% of ditches buffered in the 7 county area. 58% not buffered based on 7 county averages
uffered rams = 355.54 miles unbuffered streams
/hr Average technician salary its
1839 miles x 58%=1066.62 miles not b1066.62 miles not buffered/3 buffer prog
2. Staff time rate/hour: $14.00
+$12.00/hr Average technician benef
r Av rage manager benefits
$26.00/hr time
$25.00/hr Average manager salary +$19.00/h e
e r $44.00/hr tim
Average time of managers and technicians: $35/h

Appendix 9-Exhibit A
3. Contract goal: 10,343 ac Total available in program
ct size ÷10 ac Average buffer strip proje Number of contracts
4. Cost 4,000.00 Average cost of a project
1,034 -share percentage: $
x 25% $1,000.00 Landowner contribution
$4,000.00 Average cost of a project
x 75%
$3,000.00 Other funding/cost-share
000 per acre incentive for perpetual buffer strips.
es available (See Objective 1. Action A. 1.)
$35/hour (See Objective 1. Action A.2.)
1. Action A. 3.)
d incentive program for harvested buffers.
es available (See Objective 1. Action A. 1.)
$35/hour (See Objective 1. Action A.2.)
Object oint Source Pollution through cropland changes Action A. Replace open tile intakes with alternative tile intakes by providing up to 75 percent cost share.
1. e Intake goal:
mi
Action B. Provide a $1,1. Buffer strip acreage goal:
10,343 acr2. Staff time rate/hour: 3. Contract goal: 1,034 (See Objective
Action C. Cost-share an1. Buffer strip acreage goal:
10,343 acr2. Staff time rate/hour: 3. Contract goal: 1,034 (See Objective 1. Action A. 3.)
ive 2. Address Nonp
Alternative Til1,333 square miles x 640 acres/sq
ural landuse853,120 acres x 86% agricult 733,683 acres ÷ 80 acre parcels 9,171 parcels Average of 2 intakes/80 ac*
ers within the WFDMR watershed *Based on survey of 5 farm9,171 parcels x 2 intakes/80 ac 18,342 intake replacement
2. 600.00 Average cost of a project
Cost-share percentage: $
x 25% $150.00 Landowner contribution

Appendix 9-Exhibit A
$600.00 Average cost of a project x 75%
$450.00 Other funding/cost-share
bjective 1. Action A.2.) Action er acre incentive for variable rate fertilizer application.
1.
mi
3. Staff time rate/hour: $35/hour (See O
B. Provide a $15 pAcreage goal: 1,333 square miles x 640 acres/sq
53,120 acres ral landuse
8x 86% agricultu
2. C
733,683 acres ontracts goal: 733,683 acres ÷ 500 acres (maximum/producer) 1,467 contracts available
bjective 1. Action A.2.) Action C. Provide a $300 per acre incentive for planting a third crop.
1. e 1,798,590 acres in the 4 counties were planted to perennial crops in
se that to 4 percent which would be 41,000 acres. 2. /hour:
3.
41,000 acres
3. Staff time rate/hour: $35/hour (See O
Acreage goal: About 2 percent of th2007/2008. Goal is to increaStaff time rate$35/hour (See Objective 1. Action A.2.) Contracts goal:
÷ 40 acres (average size of small grain field)
ObAct etual easement program for wetlands.
nd inventory has not completed for the entire watershed. A rough estimate indicates 8,720 acres in need of restoration. Acres divided between Objective 3. Action A and Obj2.
1,025 contracts
jective 3. Provide flood storage opportunities ion A. Fully fund a perp1. A restorable wetla
ective 3. Action B. Contract goal: 4,360 acres ÷ 40 acres/wetland 109 easements
3. S ur: $35/hour (See Objective 1. Action A.2.)
ent
taff time rate/ho
4. BWSR estimated easement cost: $750/easem

Appendix 9-Exhibit A
ActPro
nd inventory has not completed for the entire watershed. A rough estimate indicates 8,720 acres in need of restoration. 2.
ion B. Provide a $2,500 per acre incentive for restoring wetlands through the Wetland Reserve gram (WRP). 1. A restorable wetla
Contract goal: 4,360 acres ÷ 60 acres/wetland 73 easements
3. Staff time rate/hour:
Action 1.
hrends estimated that each site would be 1 acre in size.
miles, 2.8 times the size of the HLWD (472 square
WD
$35/hour (See Objective 1. Action A.2.)
C. Provide up to 75 percent cost-share for flood storage projects. Contract goal: HDR Engineering identified 20 sites throughout the HLWD suitable for flood water storage. Ross BeThe WFDMR watershed is 1,333 squaremiles). 20 Sites within HL
x 2.8 WFDMR watershed size comparison
centage: 25%
56 Contracts 2. Cost-share per
$40,000.00 Average cost of a project x
$10,000.00 Landowner contribution $40,000.00 Average cost of a project
x 75% $30,000.00 Other funding/cost-share
3. Staff time rate/hour: tion A.2.)
Ob agement Action Level III Feedlot Inspections.
1. Staff time rate/hour
Action B. Provide 75 percent cost-share for feedlots to address runoff problems.
1.
(an estimate from county representatives)
$35/hour (See Objective 1. Ac
jective 4. Feedlot ManA. Obtain feedlot inventory by conducting
$35/hour (See Objective 1. Action A.2.)
Project goal: 712 feedlots x 10% of the feedlots
ur:
: 25%
71 feedlots 2. Staff time rate/ho
$35/hour (See Objective 1. Action A.2.) 3. Cost per project
$100,000.00 Average cost of a project x $25,000.00 Landowner contribution

Appendix 9-Exhibit A
x 75% $100,000.00 Average cost of a project
Action C. entive for feedlot buffer strips. 1. Buf
county estimates)
$75,000.00 Other funding/cost-share
Provide a $500 per acre incfer strip acreage goal: 712 feedlots in watershed x 75% feedlots needing buffers (
buffers e buffer size
534 feedlots needingx 1 acre for averag
(See centage:
project 25%
534 acres of buffers 2. Staff time rate/hour:
$35/hour Objective 1. Action A.2.) 3. Cost-share per
$200.00 Average cost of a x
x 75%
$50.00 Landowner contribution $200.00 Average cost of a project
Urban BMP Programs Action
1.
$150.00 Other funding/cost-share Objective 5. Initiate
A. Provide 75 percent cost-share for rain garden projects. Project goal: 22,069 watershed residents ÷ 2.5 persons/home 8,828 home r installing rain gardens s fo
centage:
25%
2. Cost-share per$4,000.00 Average cost of a project x
$1,000.00 Landowner contribution $4,000.00 Average cost of a project
x 75% $3,000.00 Other funding/cost-share
3. Staff time rate/hour: A.2.)
Action 1.
ated through GIS that there are 213 miles of city streets in the watershed. It is would take 4 hours/mile to conduct an inventory.
$35/hour (See Objective 1. Action
B. Conduct an urban tree survey. Project goal: It was estimestimated that it213 miles x 4 hours/mile 852 hours to conduct the survey
2. Staff time rate/hour: .) $35/hour (See Objective 1. Action A.2

Appendix 9-Exhibit A
Action community tree diversity.
1. C. ImproveProject goal: 213 miles ÷ 12 blocks/mile 2,556 blocks x 15 trees/block (estimate taken from http://www.knoxparks.org/trees.html)
ded terials
38,340 trees neeX $50.00/tree and ma
. Staff time rate/hour: $35/hour (See Objective 1. Action A.2.)
s,
cies, this Action will be pursued in the manner of bility. It was suggested to obtain cost estimates for the proposed action.
Inform MDNR. Rot no
oot
$1,917,000.00 2
Objective 6. Address Inlake Phosphorus Loading Action A. Work with stakeholders to address internal loading in Heron Lake.
1. These are estimated costs for conducting the chosen Action (3 yr drawdown, annual fish killand gamefish stocking). Due to the complexity of the Heron Lake system, varied interestsamong landowners, public and local agendetermining feasi
ation was gathered frome ne costs: $35/acre f x 20,000 acre feet x 3 years $2,100,000.00
Fish stoand for walleyes
cking costs: $11.50 per thous
x 6,000 acres
erns acres
$69,000.00 $15/pound for north x 6,000
cobjective 1. Action A.2.)
or rotenone application
$90,000.00 Staff sts:
$35/hour (See O 1,000 hrs f x $35/hr x 3 years $105,000.00 $250/hr for helicopter rental x 8 hr/application x 3 years $6,000.00
king x $35/hr 50 hrs for fish stoc
$1,750.00

Appendix 9-Exhibit A
Objective 7. Address Point Source Pollution Action cos grades.
1. needed obtained from each of the four core counties):
ood County
A: Provide t-share for SSTS upProject goal (Estimates of SSTS1,950 Jackson County +468 Nobles County +700 Cottonw +700 Murray County
2. Staff time rate/hour:
Action
tion A.1.) /hour:
e
100%
3,818 Total
$35/hour (See Objective 1. Action A.2.)
B: Provide low-interest loans for SSTS upgrades. 1. Project goal:
3,818 septic systems (See Objective 6. Ac2. Staff time rate
$35/hour (Se Objective 1. Action A.2.) 3. Project cost:
$11,000.00 Average cost of a project x
tion through low interest loan
Action 1. Staff time rate/hour:
.)
Action 1. taff time rate/hour:
ucational Opportunities Action
age - $2,500/workshop 2. Staff time rate/hour:
.2.)
Action
age - $2,500/workshop 2. Staff time rate/hour:
Action sites. 1. and installation: $10.00 per square foot
uare feet (35 foot x 35 foot area)
$11,000.00 Landowner contribu C. Conduct annual MS4 meetings.
$35/hour (See Objective 8. Action A.2
D. Conduct annual WWTF meetings. S$35/hour (See Objective 8. Action A.2.)
Objective 8. Provide EdA. Offer manure management workshops.
1. Workshop costs: Room rental, advertising, newsletter, post
$35/hour (See Objective 1. Action A
B. Provide urban BMP workshops. 1. Workshop costs:
Room rental, advertising, newsletter, post
$35/hour (See Objective 1. Action A.2.)
C. Provide permeable paver demonstration Paver purchase1,225 sqx $10.00/sq ft $12,250
2. event Advertising, newsletter, postage - $2,500/

Appendix 9-Exhibit A
3. Staff time rate/hour: e 1. Action A.2.)
Action
2. Staff time rate/hour:
Action ual newsletter. 1.
$1,500/distribution for postage $2,600/distribution for publication
Action nical Committee meetings.
2. Advisory Committee: $15/hour for volunteer time
.2.)
Action dates to watershed groups.
2. Staff time rate/hour: ction F.2.)
Action H. Create project brochure. 1. Brochure costs:
Action I. Promote Des Moines River enhancement through community events. 1. Promotion funds allocated:
Ob ss Monitoring Action A. S 5 s eria in WFDMR watershed.
1. Sample analysis:
Action B. S s eam s idity in WFDMR watershed.
1. Samy
+$31.00 Chlorophyll A
$35/hour (See Objectiv
D. Develop a website. 1. Website costs:
$120/year for website hosting
$35/hour (See Objective 1. Action A.2.)
E. Develop and distribute an annNewsletter costs:
F. Facilitate Advisory and Tech1. Meeting costs:
$30/meeting for refreshments Staff time rate/hour:
Technical Committee: $35/hour (See Objective 1. Action A
G. Provide quarterly project up1. Meeting costs:
$30/meeting for refreshments
$15/hour (See Objective 8. A
$0.45/brochure
$500/yr
jective 9. Effectiveneample 1 tream sites for E.coli bact
$20.00 Cost for 1 E.coli sample
ample 15 tr ites for turbple analysis: $13.00 Turbidit+$13.00 TSS +$18.00 SVS
$75.00 Cost for sample

Appendix 9-Exhibit A
Action C. E t rbidity urveys in WFDMR watershed.
1. Sam
+$20.00 E.coli
. coli and u synoptic sple analysis: $13.00 Turbidity
e
Action D. M e n Lake tributaries.
1. Sam
y
+$31.00 Chlorophyll A
$33.00 Cost for sampl
onitor H rople analysis: $15.00 TP +$15.00 OP +$13.00 Turbidit+$13.00 TSS +$18.00 SVS
Action E. Monitor North and South Heron Lake.
1. Sam
tom) y
+$31.00 Chlorophyll A
$105.00 Cost for sample
ple analysis: $15.00 TP +$15.00 OP +$15.00 TP (bottom) +$15.00 OP (bot+$13.00 Turbidit+$13.00 TSS +$18.00 SVS
Action ooplankton, and fisheries survey. 1. taff time rate/hour:
n A.2.)
Ob nistration Action A. Hire and House a Watershed Coordinator.
1. ager salary
$135.00 Cost for sample
F. Conduct macrophyte, phytoplankton, zS$35/hour (See Objective 1. Actio
jective 10. Project Admi
Staff time rate/hour: $25.00/hr average man$19.00/hr average manager benefits
time $44.00/hr 2. timates obtained from the SWCD and environmental offices in the four core counties
Murray County 000
Travel (esand averaged): 15,000 Nobles SWCD +12,500 Jackson County +6,000 Murray SWCD +5,000 Jackson SWCD +5,000 +4, Cottonwood SWCD 47,000

Appendix 9-Exhibit A
÷3 7,916.667 Rounded to 8,000 miles/year
4. mat D): onth
Phone (esti e from HLW$150 mx 12 months $1,800 per year
5. ace an ates obtained from the SWCD and Environmental Offices in the
Nobles County ,500
Office sp d supplies (estimfour core counties and averaged): $4,500 Murray SWCD +$3,600 +$3 Murray County
÷3$11,600
Action B. Hire and House an Engineering Technician.
1. ager salary
$3,866.667 Rounded to 3,900 miles/year
Staff time rate/hour: $25.00/hr average man$19.00/hr average manager benefits
2. urray SWCD):
30,000.00
r = $2,500.00 lags, lath, etc.) = $2,000.00
.2.) 5. Office space and supplies:
Action C. Hire and House Two Watershed Technicians.
1. hnician salary
r average technician benefits
$44.00/hr time Equipment (costs estimates from MTrimble Robotic Total Station = $35,000.00 Trimble GPS Rover = $AutoCad Civil 3D Software for design = $5,500.00 ComputeMiscellaneous Survey Equipment (survey book, f
4. Travel: 8,000 miles/year (See Objective 9. Action A
$3,900/year (See Objective 9. Action A.4.)
Staff time rate/hour: $14.00/hr average tec+$12.00/h
.2.) 3. Office space and supplies
$3,900/year (See Objective 9. Action A.4.)
$26.00/hr time 2. Travel:
8,000 miles/year (See Objective 9. Action A