west coast regional council annual plan 2017-2018s, annual plans and annual rep… · the west...
TRANSCRIPT

West Coast Regional Council
Annual Plan 2017-2018

Table of Contents
Chairperson’s Foreword 1Introduction to the Annual Plan 2017/18 2The West Coast Regional Council 3Groups of Activities 6Governance 7Resource Management Activities 9Regional Transport Planning 13Hydrology and Flood Warning Services 14Civil Defence Emergency Management 15River, Drainage, and Coastal Protection Work 16Vector Control Services Business Unit 24Statement of Accounting Policies 25Prospective Statement of Comprehensive Income 32Prospective Statement of Movements in Equity 33Prospective Statement of Financial Position 34Prospective Statement of Cash Flows 36Projected Capital Expenditure 37Reserves Funds 38Comparison with Long Term Plan Financial Prudence Caps 40Reconciliation of Funding Impact Statement to Statement of Comprehensive Income 41Funding Impact Statements in accordance with the Local Government (Financial Reporting and Prudence) Regulations 2014 42Additional disclosures required pursuant to Local Government Act 2002, Schedule 10, Clauses 20, 20A and 21 43Rates Information 47Rating Impact Ready Reckoner 53Schedule of Council Charges 54
1 West Coast Regional Council Annual Plan July 1, 2017 to June 30, 2018
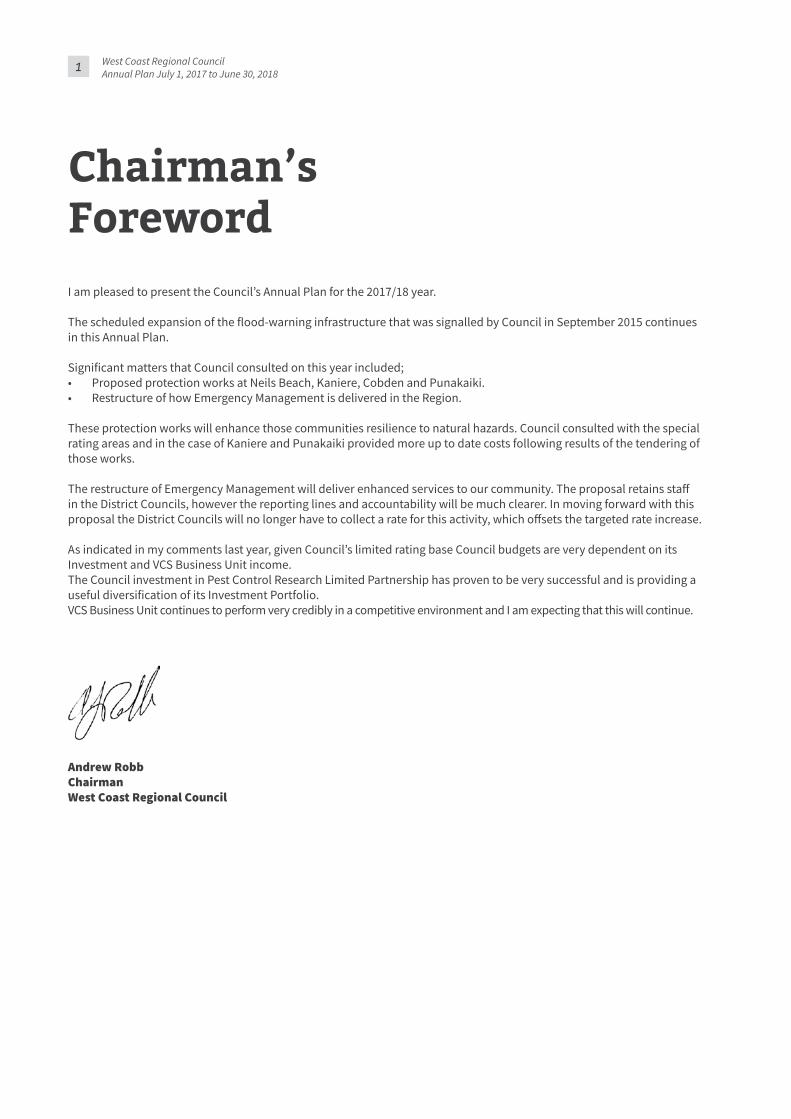
Chairman’s ForewordI am pleased to present the Council’s Annual Plan for the 2017/18 year.
The scheduled expansion of the flood-warning infrastructure that was signalled by Council in September 2015 continues in this Annual Plan.
Significant matters that Council consulted on this year included;• Proposed protection works at Neils Beach, Kaniere, Cobden and Punakaiki.• Restructure of how Emergency Management is delivered in the Region.
These protection works will enhance those communities resilience to natural hazards. Council consulted with the special rating areas and in the case of Kaniere and Punakaiki provided more up to date costs following results of the tendering of those works.
The restructure of Emergency Management will deliver enhanced services to our community. The proposal retains staff in the District Councils, however the reporting lines and accountability will be much clearer. In moving forward with this proposal the District Councils will no longer have to collect a rate for this activity, which offsets the targeted rate increase.
As indicated in my comments last year, given Council’s limited rating base Council budgets are very dependent on its Investment and VCS Business Unit income.The Council investment in Pest Control Research Limited Partnership has proven to be very successful and is providing a useful diversification of its Investment Portfolio.VCS Business Unit continues to perform very credibly in a competitive environment and I am expecting that this will continue.
Andrew RobbChairmanWest Coast Regional Council

2West Coast Regional Council Annual Plan July 1, 2017 to June 30, 2018
Introduction to the Annual Plan 2017/18Under the Local Government Act 2002, the Council is required to produce a long-term plan every third year, covering a 10-year period. The Council is also required to prepare an annual plan for each financial year it does not prepare a long-term plan. The annual plans contain budget, funding and financial statements for the coming year, which should reflect or largely reflect those in the preceding long-term plan.
This Annual Plan reflects year 3 of the Long Term Plan 2015-25 which was adopted in 2015. There are several variations from the Long Term Plan. These are listed under each activity area.
The purpose of the Annual Plan is to:• Provide details of the annual budgets broken down into the various activity areas, and how that expenditure is to
be funded.• Identify any variation from the financial statements and funding impact statement included in the current Long Term
Plan 2015-25.• Provide integrated decision making and co-ordination of the resources of the Council.• Contribute to the accountability of the Council to the regional community.• Extend opportunities for participation by the public in decision-making processes relating to costs and funding
undertaken by the Council.

3 West Coast Regional Council Annual Plan July 1, 2017 to June 30, 2018
The West Coast Regional Council
Left to Right: Terry Archer, Neal Clementson, Stuart Challenger, Andrew Robb, Peter McDonnell, Allan Birchfield, Peter Ewen
The Council has seven Councillors, representing the following constituencies:
Buller ConstituencyNeal Clementson – Council Deputy Chairman Terry Archer (MBE)
Grey ConstituencyPeter Ewen Andrew Robb – Council ChairmanAllan Birchfield
Westland ConstituencyPeter McDonnellStuart Challenger

4West Coast Regional Council Annual Plan July 1, 2017 to June 30, 2018
West Coast Regional Council Mission Statement“To work with the people of the West Coast to sustainably manage the environment for the social, cultural and economic well being of present and future generations.”
Regional Council Functions and ResponsibilitiesThe West Coast Regional Council is an organisation complementary to the District Councils within the West Coast. It does not compete with or duplicate the functions of these Councils.
Regional CouncilsRegional Councils promote the sustainable management of our natural and physical resources for the benefit of present and future generations. Regional Councils monitor our environment and where appropriate, limits or controls the use of our resources. We liaise with our community to develop resource management & pest management plans, construct and maintain sea and flood protection works, and deliver flood warning and pollution mitigation as well as co-ordinating transport, economic development and civil defence regionally.
District CouncilsDistrict Councils manage local roads, local civil defence, provide reticulated water and public amenities, manage waste and sewerage, control land use and subdivisions and building development. District Councils also provide community facilities such as libraries, and recreation/sports grounds.
Collaboration between regional and district councils on the West CoastThe four councils on the West Coast have been focussing increasingly on collaborative approaches to serving our communities. The Mayors and Chairs forum meets quarterly and oversees collaborative projects. There are many areas where the councils work together already and new ones are being developed every year.
West Coast Regional Council Core ActivitiesResource Management PolicymakingEstablishing and implementing objectives, policies and methods to achieve the integrated management of the natural and physical resources of the West Coast, under the Resource Management Act 1991.
Water Quality ManagementManaging and preserving our water by monitoring discharges and other activities where they might affect water quality in streams, rivers, lakes, groundwater and the coastal marine area.
Pollution ControlOperating a 24-hour pollution hotline throughout the entire West Coast region to respond to any illegal or accidental discharges of contaminants to our land, air and water.
Air Quality ManagementMonitoring ambient air quality, in Reefton, with the aim of enhancing winter air quality.
Floodwarning services and maintaining Flood Protection WorksMinimising the damage due to flooding by maintaining our rating district works, where communities request our assistance; and managing a responsive flood-warning system for our five key rivers.
Pest ManagementImplementing and reviewing the West Coast Pest Plant Management Strategy.
Regional Land TransportCo-ordinating safe, efficient, responsive and sustainable transport systems through the Regional Land Transport Strategy.
Civil Defence and Emergency ManagementAdministering the West Coast Civil Defence Emergency Management Group, providing regional co-ordination during civil defence emergencies and exercises and periodically reviewing the Group Plan.

5 West Coast Regional Council Annual Plan July 1, 2017 to June 30, 2018
Council and Committee StructureThe West Coast Regional Council sets overall policy direction and oversees the financial policy and performance of the Council. The full Council also considers any matters that fall outside the day-to-day activities, which require policy development or specific resolution. All matters relating to the development of the LTP and Annual Plan, Finances and Assets, Funding Policy and Investment Strategy, are managed by the Full Council. It manages through policy direction, the council’s operations, river, drainage, and coastal protection works; and management of Council quarries. The Council has established a Committee structure to assist with the effective functioning of the Council. The Resource Management Committee is a standing Committee of Council that meets monthly. Its functions are set out below:
Resource Management CommitteeAll Councillors are members of this Committee plus two Tangata Whenua representatives, one representing Te Runanga o Ngati Waewae and one representing Te Runanga o Makaawhio.
The Committee analyses, develops and facilitates consultation on all policies, plans and strategies on resource management, biosecurity and transport matters. The Committee oversees and directs the Council’s flood warning, and state of the environment monitoring functions. The Committee also oversees and directs the Council’s consents and compliance monitoring functions.
Regional Transport CommitteeThe Regional Transport Committee oversees the development, implementation and review of the Regional Land Transport Plan. This Committee has two appointees from the Council, plus representatives appointed from District Councils and other agencies involved with land transport as required by transport legislation.
Greymouth Floodwalls and Hokitika Seawall Joint CommitteesCouncil also has three elected members appointed to each of the Joint Greymouth Floodwalls Committee and the Hokitika Seawall Joint Committee, together with three members of the relevant District Council. These are joint committees of both councils with mandate to jointly manage the relevant protection works.
West Coast Civil Defence Emergency Management GroupCouncil’s chairman is member of the West Coast Civil Defence Emergency Management Group, together with the Mayors of each of the three district councils. This Group is a requirement of the Civil Defence Emergency Management Act. The 4 councils have a MOU that sets out an integrated CDEM structure.
Council Management Structure
Division Manager Functions
CEO’s Office Michael Meehan Civil Defence Emergency ManagementTransport Planning
Planning & Science Vacant Planning & State of Environment MonitoringFlood Warning & Natural Hazards
Operations Randal BealQuarries & Rating District ManagementVCS Business UnitQuarry & Rating District Management
Corporate Services Robert Mallinson Accounting and Corporate PlanningRating Administration
Consents & Compliance Gerard McCormackResource Consent ProcessingCompliance Monitoring & EnforcementEnvironment Complaints & Pollution Response
Strategy & Communications Nichola Costley Strategy & Communications
Information Services Les Gibbs Information TechnologyCommunications Technology

6West Coast Regional Council Annual Plan July 1 2016 to June 30 2017
Groups of Activities
Council has arranged its business into groups of activities as follows:
• Governance• Resource Management• Regional Transport Planning• Hydrology and Flood Warning Services• Civil Defence Emergency Management• River, Drainage and Coastal Protection Work• Vector Control Services Business Unit

7 West Coast Regional Council Annual Plan July 1, 2017 to June 30, 2018
Governance
Activities within this groupGovernance covers the costs of operating the democratic function of the Council. Elected Councillors determine policies, and monitor the achievement of these. Council operates in an open, public manner and ensures all relevant information is available to interested members of the public via regular newsletters; and reports and documents posted on the Council’s web site.
Rationale for Governance ActivitiesGovernance activities of the Council are carried out under the Local Government Act 2002, the Resource Management Act, Biosecurity and Civil Defence legislation, and the Land Transport Act, among others. The Council conducts eleven monthly meetings of the Council and the Resource Management Committee, and convenes other meetings and workshops as appropriate.
Individual Councilors attend other Committee and working group meetings as representatives of the whole Council, such as the Land Transport Committee, the Civil Defence Emergency Management Group, and the Regional Animal Health Committee. Councillors also act as commissioners from time to time on resource consent and Strategy and Plan hearings.
Under the Local Government Act the Council must consider ways in which it may foster the development of Maori capacity to contribute to the decision-making processes of the Council. Council has invited appointment of a member of each of the two local Runanga to attend the Resource Management Committee. The two Runanga have also assisted with developing Iwi sections of some regional plans, and have also participated in making submissions on consent applications and proposed plans. Council sends resource consent application information to the Runanga regularly, and has assisted both Runanga in developing Iwi management plans.
The consultation process of this Annual Plan is one way that other Maori not affiliated to the Ngati Waewae or Makaawhio Runanga can communicate their views to the Council.
Key Changes from 2015-25 Long Term Plan: Nil

8West Coast Regional Council Annual Plan July 1, 2017 to June 30, 2018
Governance Performance Targets
Levels of Service Measure Performance Target
Maintain a Council of elected representatives in accordance with statutory requirements and in a manner that promotes effective decision-making, transparency, and accountability to the West Coast regional community.
Number of public meetings held and individual Councillor attendance.
Conduct eleven monthly meetings of Council and the Resource Management Committee, plus other scheduled meetings and scheduled workshops during the year with at least 80% attendance by all Councillors.
Compliance with statutory timeframes.
Prepare and notify the Council’s Annual Plan Statement of Proposal by 31 May each year, and the Annual Report by 31 October, in accordance with the procedures outlined in the Local Government Act 2002.
Timing and number of newsletters, and internet website based information related to public consultation processes.
Publish an informative Council newsletter twice a year to be circulated to all ratepayers, with their rate demand, in March and September and ensure required information is posted on the Council website when Council invites submissions on a new or revised policy document.
Continue to support the contribution our two West Coast Runanga make to Council’s decision-making processes; and continue to seek contributions from other Maori.
Attendance of Iwi appointees at Resource Management Committee meetings.
Continue to invite attendance of Makaawhio and Ngati Waewae representatives as appointees to the Council’s resource management committee, to enable Maori participation in resource management decision-making.

9 West Coast Regional Council Annual Plan July 1, 2017 to June 30, 2018
Resource Management ActivitiesActivities within this group• Planning, Policies and Strategies.• Monitoring the State of the Environment• Resource Consent Enquiries and Processing• Compliance Monitoring and Enforcement• Hazardous Substance Spill Response
Rationale for Resource ManagementThe Resource Management Act 1991 (RMA) enables regional councils to have certain RMA Plans to provide certainty to resource users on when consents are required.
The plans enable activities with no more than minor adverse effects to be carried out without needing resource consent, and also provide policy guidance on assessing activities with greater potential effects. The Council also has a Pest Plant Strategy to take a strategic and prioritised approach to managing pest plants in the region. All Plans are required to be reviewed within the ten year period by law, by inviting public submissions.
The Council also makes submissions and responds to other resource management documents or proposed government policies or standards where these may affect the West Coast. This is in order to advocate for the interest of the West Coast communities.
Council monitors the state of our environment to detect trends in environmental quality and to detect emerging issues. This information is fundamental for assessing the effectiveness of resource management policies and plans. It assists Council to make decisions based on sound factual and up to date information.
Resource consents allow activities that are otherwise restricted by the RMA. Our Consents team used to process around 500 individual resource consents each year, on average. This level of demand has declined recently and this year the number is likely to be around half of the previous amount.
Compliance monitoring and enforcement involves monitoring the exercise of resource consents, permitted activity dairy farms and mining permits. Where non-compliance is detected the Council’s Enforcement Policy guides decisions around enforcement actions. This is a critical element of resource management that underpins the integrity of the regional plans and consents issued under them.
Under the Maritime Transport Act 1994 the Regional Council is responsible for responding to marine oil spills within the territorial waters of the West Coast.
RMA Staff are also trained to respond to terrestrial hazardous substance spills, assisting the responsible party to clean up spills in order to minimise environmental impacts.
Key Changes from 2015-25 Long Term Plan: Nil

10West Coast Regional Council Annual Plan July 1, 2017 to June 30, 2018
Reso
urce
Man
agem
ent P
erfo
rman
ce T
arge
ts
Leve
ls o
f Ser
vice
Mea
sure
Perf
orm
ance
Tar
get
To m
aint
ain
or e
nhan
ce w
ater
qu
ality
in th
e W
est C
oast
’s riv
ers.
Stat
e of
the
Envi
ronm
ent M
onito
ring:
Am
mon
iaca
l nitr
ogen
, per
iphy
ton,
cla
rity,
turb
idity
and
faec
al co
lifor
ms
are
mea
sure
d qu
arte
rly a
t 38
river
site
s. T
hese
par
amet
ers c
hara
cter
ise
the
wat
er q
ualit
y of
Wes
t Coa
st ri
vers
and
hav
e be
en m
easu
red
sinc
e 19
96.
Impr
ovem
ent o
f the
se p
aram
eter
s, w
hen
com
pare
d w
ith a
ba
selin
e of
199
6 da
ta o
n w
ater
qua
lity.
Com
plia
nce
Mon
itorin
g fo
r Dis
char
ges:
Th
e nu
mbe
r of c
ompl
iant
or n
on-c
ompl
iant
poi
nt so
urce
dis
char
ges t
o w
ater
, or d
isch
arge
s lik
ely
to e
nter
wat
er; a
nd c
ounc
il’s r
espo
nse
to a
ny
non-
com
plia
nce.
All s
igni
fican
t con
sent
ed d
isch
arge
s1 are
mon
itore
d at
leas
t an
nual
ly, a
nd a
ll da
iry sh
eds a
t lea
st e
very
seco
nd y
ear
depe
ndin
g on
indi
vidu
al co
mpl
ianc
e re
cord
. All
non-
com
plia
nces
pu
blic
ly re
port
ed to
the
Reso
urce
Man
agem
ent C
omm
ittee
and
re
spon
ded
to u
sing
Cou
ncil’
s Enf
orce
men
t Pol
icy.
To m
aint
ain
or e
nhan
ce th
e w
ater
qu
ality
in L
ake
Brun
ner.
The
trop
hic
stat
e of
Lak
e Br
unne
r is m
easu
red
by th
e Tr
ophi
c Le
vel I
ndex
(T
LI) w
hich
com
bine
s cla
rity,
nut
rient
and
alg
al m
easu
res.
The
rolli
ng
5-ye
ar m
ean
is c
ompa
red
with
a 2
002-
2006
bas
elin
e m
ean.
The
annu
al (r
ollin
g 5-
year
mea
n) T
LI o
f Lak
e Br
unne
r is l
ess
than
the
2002
-200
6 TL
I bas
elin
e m
ean
of 2
.79.
Com
plet
e cu
rren
t reg
iona
l pla
ns
to o
pera
tive
stag
e, a
nd re
view
th
em to
mai
ntai
n th
eir c
omm
unity
ac
cept
abili
ty.
Stat
utor
y re
quire
men
ts fo
r rev
iew
.Co
mpl
ianc
e w
ith st
atut
ory
requ
irem
ents
for t
he re
view
of
Coun
cil’s
pla
ns a
nd st
rate
gies
.
Advo
cate
for t
he W
est C
oast
in
tere
sts w
hen
exte
rnal
en
viro
nmen
tal p
olic
ymak
ing
may
aff
ect t
he W
est C
oast
.
Num
ber o
f sub
mis
sion
s mad
e an
d nu
mbe
r of s
ucce
ssfu
l adv
ocac
y ou
tcom
es.
Subm
it on
all
cent
ral o
r loc
al g
over
nmen
t dis
cuss
ion
docu
men
ts, d
raft
stra
tegi
es, p
olic
ies o
r Bill
s tha
t may
impa
ct o
n W
est C
oast
inte
rest
s, w
ithin
requ
ired
timef
ram
es.
1 Sig
nific
ant C
onse
nted
Dis
char
ge in
clud
es: a
ny co
nsen
ted
disc
harg
e fro
m a
mun
icip
al se
wag
e sc
hem
e or
land
fill,
any
cons
ente
d di
scha
rge
from
a w
orki
ng m
ine
site
, any
cons
ente
d di
scha
rge
of d
airy
effl
uent
to w
ater
, and
any
larg
e sc
ale
indu
stria
l dis
char
ge (W
MP,
Kok
iri).

11 West Coast Regional Council Annual Plan July 1, 2017 to June 30, 2018
Leve
ls o
f Ser
vice
Mea
sure
Perf
orm
ance
Tar
get
To m
aint
ain
or e
nhan
ce th
e lif
e su
ppor
ting
capa
city
and
am
enity
va
lue
of th
e W
est C
oast
’s riv
ers.
Stre
am e
cosy
stem
hea
lth:
Inst
ream
mac
roin
vert
ebra
te c
omm
unity
hea
lth (S
QM
CI) s
core
s are
m
easu
red
at 2
9 riv
er si
tes.
The
val
ues f
or e
ach
site
are
cal
cula
ted
usin
g fiv
e ye
ar ro
lling
mea
ns a
nd c
ompa
ring
them
to b
asel
ine
mea
ns
calc
ulat
ed fr
om d
ata
from
200
5-20
09.
Mac
roin
vert
ebra
te h
ealth
inde
x2 (SQ
MCI
) mea
n is
hig
her,
or n
o m
ore
than
20%
low
er, t
han
the
base
line
mea
n.
Bath
ing
beac
h sa
mpl
ing:
16 sw
imm
ing
site
s are
sam
pled
, ten
tim
es p
er su
mm
er se
ason
(fo
rtni
ghtly
) for
E c
oli (
mod
erat
e-hi
gh ri
sk >
550
) or E
nter
ococ
ci
(mod
erat
e-hi
gh ri
sk >
280
).
Sche
dule
d sw
imm
ing
site
s do
not e
xcee
d th
e m
oder
ate-
high
ris
k th
resh
old
on m
ore
than
10%
of s
ampl
ing
occa
sion
s.
To p
rote
ct h
uman
hea
lth
from
adv
erse
impa
cts o
f poo
r gr
ound
wat
er q
ualit
y.
28 W
ells
are
mon
itore
d at
leas
t tw
ice
annu
ally
, 24
of w
hich
are
use
d fo
r hu
man
con
sum
ptio
n.
The
guid
elin
e of
11.
3mg/
L of
nitr
ate
is u
sed
to p
rote
ct h
uman
hea
lth,
part
icul
arly
for b
abie
s. T
he d
ata
from
the
year
is a
vera
ged
befo
re
com
parin
g ag
ains
t the
11.
3mg
guid
elin
e.
In w
ells
use
d fo
r hum
an c
onsu
mpt
ion,
nitr
ate
leve
ls re
mai
n be
low
the
heal
th g
uide
line
of 1
1.3
mg/
L.
To p
rote
ct h
uman
hea
lth fr
om a
ny
adve
rse
impa
cts o
f poo
r air
qual
ity
in R
eefto
n.
Reeft
on’s
air i
s mon
itore
d in
acc
orda
nce
with
the
Nat
iona
l Env
ironm
enta
l St
anda
rd (N
ES) f
or a
ir qu
ality
by
mea
surin
g PM
10 (a
irbor
ne p
artic
les
smal
ler t
han
ten
mic
rom
eter
s, w
hich
affe
ct h
uman
resp
iratio
n).
The
thre
shol
d is
a 2
4hr m
ean
PM10
of 5
0 m
icro
gram
s/m
3.
NES
Req
uire
men
t: 24
hr P
M10
val
ues d
o no
t exc
eed
the
NES
th
resh
old
mor
e th
an th
ree
times
in o
ne y
ear,
betw
een
2016
&
2020
; whe
reas
afte
r 202
0 on
ly 1
exc
eeda
nce
per y
ear i
s allo
wed
.
Resp
ond
to a
ll ge
nuin
e in
cide
nt
com
plai
nts r
ecei
ved
by th
e Co
unci
l an
d ta
ke e
nfor
cem
ent a
ctio
n
whe
re n
eede
d.
Num
ber o
f com
plai
nts r
ecei
ved
and
num
ber o
f enf
orce
men
t act
ions
re
sulti
ng fr
om th
ese.
Ope
rate
a 2
4-ho
ur c
ompl
aint
s ser
vice
, ass
ess a
nd re
spon
d to
all
genu
ine
com
plai
nts w
ithin
24
hour
s whe
re n
eces
sary
.
2 Thi
s mac
roin
vert
ebra
te in
dex u
ses c
ompa
rativ
e sa
mpl
es o
f aqu
atic
inve
rteb
rate
s to
eval
uate
wat
er q
ualit
y, b
ased
on
the
type
and
tole
ranc
es o
f inv
erte
brat
es (b
ugs)
foun
d at
that
site
and
how
thos
e co
mm
uniti
es o
f inv
erte
brat
es m
ay c
hang
e ov
er ti
me.
Som
e bu
g sp
ecie
s are
pol
lutio
n to
lera
nt w
hile
oth
ers a
re p
ollu
tion
sens
itive
, so
the
mix
of s
peci
es te
lls u
s a lo
t abo
ut th
e w
ater
qua
lity
at th
e si
te.

12West Coast Regional Council Annual Plan July 1, 2017 to June 30, 2018
Leve
ls o
f Ser
vice
Mea
sure
Perf
orm
ance
Tar
get
Com
plia
nce
with
the
cons
ent
proc
essi
ng ti
mef
ram
es in
the
RMA
and
min
ing
legi
slat
ion.
Com
plia
nce
with
dis
coun
ting
regu
latio
ns a
nd m
inin
g tim
efra
mes
.
Proc
ess a
ll re
sour
ce c
onse
nt a
pplic
atio
ns w
ithou
t inc
urrin
g an
y co
st to
Cou
ncil
due
to th
e RM
A di
scou
ntin
g re
gula
tions
; and
pr
oces
s at l
east
95%
of m
inin
g w
ork
prog
ram
mes
3 with
in 2
0 w
orki
ng d
ays o
f rec
eipt
.
Resp
ond
to m
arin
e oi
l spi
lls in
coas
tal
wat
ers i
n ac
cord
ance
with
the
Tier
2
Oil
Spill
Res
pons
e Pl
an a
nd m
aint
ain
read
ines
s for
spill
resp
onse
.
Tim
ing
of re
spon
ses &
num
ber o
f tra
ined
staff
.Re
spon
d w
ithin
4 h
ours
to a
ll sp
ills,
usi
ng C
ounc
il or
MN
Z sp
ill
equi
pmen
t to
cont
ain
spill
s; p
lus e
nsur
e at
leas
t 25
staff
are
tr
aine
d re
spon
ders
.
Oth
er R
esou
rce
Man
agem
ent T
arge
ts
1.
Hol
d he
arin
gs a
nd m
ake
and
rele
ase
deci
sion
s on
subm
issi
ons o
n th
e pr
opos
ed R
PS a
nd th
e pr
opos
ed R
egio
nal C
oast
al P
lan.
2.
Hol
d he
arin
gs a
nd m
ake
and
rele
ase
deci
sion
s on
subm
issi
ons o
n th
e Pl
an C
hang
e to
the
Land
and
Wat
er P
lan.
3.
Rele
ase
a ne
w p
ropo
sed
Pest
Man
agem
ent P
lan
for p
ublic
subm
issi
ons.
4.
As
sess
farm
com
plia
nce
in th
e La
ke B
runn
er c
atch
men
t at l
east
ann
ually
, to
ensu
re fu
ll co
mpl
ianc
e in
this
sens
itive
cat
chm
ent.
5.
Insp
ect n
ew c
onse
nts t
hat i
nvol
ve m
ajor
con
stru
ctio
n w
orks
; and
mon
itor a
ny o
ther
maj
or c
onse
nted
act
ivity
, whe
n ne
cess
ary,
bas
ed o
n th
eir e
nviro
nmen
tal r
isk.
6.
En
sure
S42
A re
port
s for
not
ified
app
licat
ions
are
with
the
appl
ican
t with
in te
n w
orki
ng d
ays o
f rec
eipt
of a
ll re
quire
d in
form
atio
n.7.
Re
leas
e al
l bon
ds w
ithin
4 m
onth
s of t
he su
rren
der,
forfe
iture
or e
xpiry
of t
he m
inin
g lic
ence
or p
erm
it, p
rovi
ded
reha
bilit
atio
n is
com
plet
e.8.
In
spec
t all
cons
ents
for w
hite
bait
stan
ds o
n th
e Li
ttle
Wan
ganu
i, Ta
ram
akau
, Hok
itika
, Wan
ganu
i, Pa
ringa
, and
Wai
atot
o Ri
vers
ann
ually
and
on
othe
r riv
ers a
t lea
st e
very
th
ird y
ear.
9.
Com
plet
e th
e La
ke B
runn
er a
nnua
l mon
itorin
g pr
ogra
mm
e an
d re
port
the
cum
ulat
ive
resu
lts o
n th
e Co
unci
l web
site
by
Dece
mbe
r eac
h ye
ar.
10.
Repo
rt th
e m
onth
ly c
onta
ct re
crea
tion
sam
plin
g re
sults
from
swim
min
g riv
ers t
o th
e m
edia
, and
com
plet
e fo
llow
up
stud
ies o
f inc
ongr
uous
resu
lts.
11.
Prep
are
stat
e of
the
envi
ronm
ent r
epor
ts fo
r sur
face
wat
er q
ualit
y an
d gr
ound
wat
er, e
very
third
yea
r.12
. Pr
ovid
e m
onth
ly re
port
s dur
ing
win
tert
ime
on R
eefto
n PM
10 m
onito
ring,
com
plia
nt w
ith th
e Ai
r Qua
lity
NES
& p
oste
d on
Cou
ncil’
s web
site
.
3 Thi
s tar
get a
ssum
es th
e w
ork
prog
ram
me
is su
bmitt
ed w
ith a
ll ne
cess
ary
info
rmat
ion
prov
ided
.

13 West Coast Regional Council Annual Plan July 1, 2017 to June 30, 2018
Regional Transport PlanningRationale for Regional Transport PlanningThe Council primarily has a co-ordinator and administrator role in relation to transport issues so that funding can be effectively accessed from the New Zealand Transport Agency. In order to obtain that funding the Council must adhere to the Land Transport Act 1998 and the Land Transport Management Act 2003. Council must appoint a Regional Transport Committee, with membership to include local authorities, and other funding agencies who then prepare a Regional Land Transport Plan. The Committee also prepare a Passenger Transport Plan.
Section 35 of the Land Transport Management Act 2003 requires that the needs of persons who are transport disadvantaged be considered in land transport programmes. To implement this function, Council administers subsidies for transport for those with limited mobility through the Total Mobility Programme. The Regional Council also participates on the regional Road Safety Committee as an organisation with transport interests and oversees the Road Safety Co-ordinator.
Key Changes from 2015-25 Long Term Plan: Nil
Performance Targets
Level of Service Measure Performance Target
Maintain a Regional Land Transport Plan in compliance with relevant legislation and acceptable to our West Coast community.
An Operative Regional Land Transport Plan.
Compliance with statutory requirements for the preparation, review and implementation of the Regional Transport Plan and Passenger Transport Plan.

14West Coast Regional Council Annual Plan July 1, 2017 to June 30, 2018
Hydrology and Flood Warning ServicesRationale for Hydrology and Flood warningSection 35 of the RMA requires councils to monitor the state of the environment. Hydrology monitoring records trends in water levels in key rivers and can also detect emerging issues. This information assists Council to make decisions based on sound factual and up to date information.
Flood warning provides information to civil defence, police and local communities that enables them to assess risk of flood events, so appropriate action can be taken.
How Council manages changes in demandThere is sometimes demand for new rivers to be added to our flood warning service, and our ability to meet demand such depends on the resources available balanced against the river’s proximity to a major population centre and the risk profile. Any decision to invest in new assets would take into account factors such as need (risk), cost, accessibility, and whether there are clear communications to the site.
Key Changes from 2015-25 Long Term PlanThis Annual Plan continues to build upon the strengthening of the flood warning capability of the council’s flood warning networks set out in the report adopted at Council’s September 2015 meeting.
Performance Targets
Level of Service Measure Performance Targets
Continue to provide flood warning to assist communities to assess risk of impending floods, for the six rivers (Karamea, Mokihinui, Buller, Grey, Hokitika, and Waiho).
Availability of information about high flow events and the staff response to those.
Provide a continuous flood monitoring service for the six rivers monitored and respond in accordance with the flood-warning manual, ensuring data on river levels is available on the Council website (updated 12 hourly; or 3 hourly during floods).
Installation and operation of new recorder sites.
Install a new flood warning and low flow sites as per the approved and funded plans.

15 West Coast Regional Council Annual Plan July 1, 2017 to June 30, 2018
Civil Defence Emergency ManagementRationale for Emergency ManagementThe Council is part of the Civil Defence Emergency Management (CDEM) Group, along with the region’s District Councils. The Group is made up of the Council Mayors and Regional Council Chair; while the Coordinating Executive Group (CEG) is the main working group of civil defence in the region. CEG is made up of the CEOs of the Councils plus emergency services and health representatives.
The functions of the CDEM Group include the co-ordination of civil defence emergency management planning, delivering CDEM programmes and CDEM activities across the region, and carrying out risk management. The Regional Council is the administering authority for the West Coast CDEM Group. The West Coast CDEM Group Plan was prepared in 2005, was reviewed in 2010, and is due for another review in 2015.
The LTP levels of service and performance targets reflect only this Council’s role in the CDEM work. District Council Annual Plans will have CDEM commitments providing a half time civil defence officer and ensuring a staffed emergency operations centre is available in the event of a local emergency.
Key Changes from 2015-25 Long Term Plan: The 2017/18 Annual Plan provides for a reorganization of Emergency Management in the West Coast Region, with provision for a new Hazard Analyst and direct employment of the three Emergency Management Officers by the West Coast Regional Council.
Levels of Service Measure Performance Targets
Maintain a Civil Defence Plan that delivers efficient and effective management of the region’s civil defence functions in compliance with the legislation and is acceptable to West Coast community desires.
Civil Defence Plan always operative.
Compliance with statutory requirements for the preparation, review and implementation of the Group CDEM Plan.
Number of trained staff.
Ensure at least 30 Council staff are trained as Emergency Coordination Centre (ECC) personnel so that we have three shifts of ECC staff trained and exercised in case of a regional emergency.
Other Civil Defence Activities:1. Maintain the Emergency Operations Centre in a ready state for possible emergency events, in accord with the Group Plan.2. Ensure all new hazards research is communicated to the Lifelines and CEG meetings to assist with risk avoidance and
other preparedness.3. Co-ordinate on training exercise per year to ensure EOC and ECC staff are familiar with each other and with each
other’s roles in an emergency event.

16West Coast Regional Council Annual Plan July 1, 2017 to June 30, 2018
River, Drainage, and Coastal Protection Work River, Drainage and Coastal protection activities include:• Managing Council’s flood protection assets• Administering the Special Rating Districts• Greymouth Floodwall structural maintenance• Quarry management and administration
Communities need to be aware that Council’s flood protection works cannot guarantee absolute protection,particularly from very large flood events, which tend to occur very infrequently.
Rationale for Rating DistrictsThe Soil Conservation and Rivers Control Act 1941 requires the Regional Council to prevent and mitigate soilerosion, and prevent damage by floods. To carry out these functions, the Council manages existing protection works for Rating Districts throughout the Region, participates on the Joint Greymouth Floodwall Committee, and rates for structural maintenance of the Greymouth Floodwall.
The Council Rating Districts have different levels of flood protection according to the history of the works and the affordability for the funding community.
Assets Administered by CouncilThe Regional Council presently owns and/or administers, 24 special rating districts at the following locations:Karamea, Kongahu (drainage scheme), Mokihinui, Punakaiki, Red Jacks, Nelson Creek, Coal Creek, Greymouth4, New River/Saltwater Creek, Taramakau, Inchbonnie, Hokitika, Kaniere, Southside Hokitika, Raft Creek (drainage scheme), Kowhitirangi, Vine Creek, Wanganui, Whataroa, Matainui, Waitangitaona, Franz Josef, Lower Waiho and Okuru.
Rock QuarriesThe Regional Council also currently administers rock quarries at the following locations: Miedema Rock Deposit (Karamea)5, Oparara (in abeyance), Blackball, Cobden (being rehabilitated), Kiwi Point (land owned by Grey District Council), Inchbonnie, Camelback, Taramakau (in abeyance), Whataroa, and Okuru.
The primary reason for Council owning these quarries is to supply the rating districts with rock for maintaining river and coastal protection works. Council also supplies rock to individual customers.
The demand for rock from quarries is driven by the need to maintain works or build new protection works, plus private sales. Council’s aim is to run quarries on a cost-neutral basis as a long term average.
Will more rating districts or quarries be established?Rating Districts will be established upon request if there is sufficient support from the affected ratepayers that respond when an opinion survey is circulated.
Who pays for the works?Protection infrastructure is financed by each of the individual communities by way of targeted rates set on properties within defined geographical areas (rating districts). The maps of these targeted rating areas are all on Council’s website. Council’s tenders for contracts for maintenance works and new capital works as required. Works reports are discussed with each rating district annually.
4 The Regional Council does not own the Greymouth Flood Wall but rates for its structural maintenance.5 Privately owned, but Council has a licence to take rock.

17 West Coast Regional Council Annual Plan July 1, 2017 to June 30, 2018
Quarry Performance Targets
Levels of Service for Quarries
Measure Performance Targets
Ensure efficient and effective management and safe operation of Council’s quarries, delivering rock to any customers within ten working days with priority given to Council rating district customers.
Timing of delivering on rock requests.
Deliver on requests for rock within two weeks, and ensure sufficient stockpiled rock is available where practical.
Number of site inspections to monitor contractor health and safety and performance.
Visit each active quarry site at least twice a year, when contractors are working the quarry (where possible), to ensure Health and Safety standards and other permit requirements are being adhered to.
Rating District Performance Targets
Levels of Service Measure Performance Targets
Meet or exceed the flood protection, drainage or erosion protection levels as described in the levels of service described in the Long Term Plan.
Completion of rating district inspections, works reports and consultation meetings (where material works are proposed).
Complete all asset inspections, works reports, and rating district meetings. Perform all capital and maintenance works as agreed at those meetings.
Proportion of schemes performing to their agreed service level.
Monitor all rating district infrastructural assets to ensure they perform to the service level consistent with the Asset Management Plan of each Rating District, or whatever level the community has decided is an acceptable risk.
Meet timeframes for plan review.Review Rating District Asset Management Plans every third year, or earlier where information indicates a significant change from what is stated in the Plan.
Key Changes from 2015-25 Long Term Plan: 1. Neil’s BeachFollowing Community consultation, Council voted to establish a rating district (Separate rating Area) for the Neil’s Beach community.
In response to worsening erosion, a sacrificial bund was constructed with a total cost of $16,200 including consent and staff costs.
An additional maintenance rate of $5,000 will also be levied in 17/18 No further major works are planned unless the situation changes dramatically.
Council is recovering the costs by a targeted rate during 17/18 on the properties in the area. Total rate for 17/18 would be made up of;
Cost of sacrificial bund $15,000
Resource consent $1,200
Maintenance $5,000
Total $21,200
Following Annual plan submissions and a further consultation with the community, Council agreed to collect the rate on un-differentiated capital value, ie just the one class.
Council advices that if major works are undertaken in the future, then the scheme agreed to for the 17/18 year would also apply to who pays for future major works.

18West Coast Regional Council Annual Plan July 1, 2017 to June 30, 2018
Summary of Capital Values, the rating calculation and the proposed rate per $100,000 of CV that Council will be levying;
Capital Value Rate per $ of Capital Value
Yield (GST inclusive) Rate per $100,000 of capital value (GST inclusive)
$12,386,000 0.0019684 $24,380 $196.84

19 West Coast Regional Council Annual Plan July 1, 2017 to June 30, 2018
2. Cobden Flood ProtectionCouncil is investigating carrying out further flood protection works in the lower Cobden area to protect residents from a 10% “Annual Probability Event”.
It is intended that a stopbank be constructed with an estimated total cost of $160,000.
Funding has been received from Envirolink to investigate further protection options.
No further major works are planned unless the situation changes dramatically or the investigation funded by Envirolink provides recommendations to be implemented.
Council intends to fund these works by raising a loan of $160,000 to be repaid over a 10 year period at an interest rate to be determined (will be at the best available rate when the funds are borrowed, but for the purposes of the impact modelling below an indicative rate of 4% has been used).
There is no rating impact in the 17/18 year as Council has sufficient credit balance in the Greymouth Floodwall Loan account to fund loan charges on $160,000 during 17/18.
A decision on whether to proceed has been deferred pending receipt and evaluation of the Envirolink funded report from NIWA.
Below is a map showing the location of the proposed works.

20West Coast Regional Council Annual Plan July 1, 2017 to June 30, 2018
3. KaniereDue to continuing erosion upstream of the existing groynes, Council proposes remedial works involving 200 metres of continuous heavy rock riprap along the natural bank forming the riverside legal boundaries of the currently unprotected properties.
Existing Rate Land Value Factor Yield (GST inclusive)
Class A $304,900 0.005986 $1,825
Class B $107,000 0.003593 $385
Class C $258,000 0.002396 $618
Class D $1,654,000 0.000898 $1,487
Class E $476,000 0.000599 $285
Total $4,600
These works will cost $159,000.
It is proposed to utilise $70,000 from the existing Kaniere Separate Rating Area credit balance and borrow $89,000 repayable over 20 years to fund the balance.
An indicative interest rate of 4% has been used in the modelling below, however the actual rate will be the best available when the funds are actually borrowed.
A rate would be levied over the rateable properties in the Kaniere Separate Rating Area to fund the loan repayments.
$89,000 over 20 years at an indicative rate of 4% would require repayments of $10,871 GST inclusive per annum.
The impact of this is modelled as follows;
Loan Repayment Rate Land Value Factor Yield (GST inclusive)
Class A $304,900 0.009691 $2,955
Class B $107,000 0.005815 $622
Class C $258,000 0.003876 $1,000
Class D $1,654,000 0.001454 $2,405
Class E $476,000 0.000969 $461
Total $7,443
Annual Maintenance CostsThese new capital works will require an increase in the existing annual maintenance costs from the existing level of $4,600 GST inclusive from and including the 2018/19 rating year.

21 West Coast Regional Council Annual Plan July 1, 2017 to June 30, 2018

22West Coast Regional Council Annual Plan July 1, 2017 to June 30, 2018
4. Punakaiki
Extension of SeawallIt is proposed to extend the existing seawall to give more protection to the Camping Ground and other properties within the Special Rating Area.
The costs will be $420,000.It is proposed that the Camping Ground pay 75% of the capital costs and other property owners within the Special Rating Area 25%;• Camping Ground $315,000• Other properties $105,000
A loan of $350,000 will need to be raised (following contribution of $70,000 regarding Camping Ground), repayable over 10 years at an indicative interest rate of 4% (actual rate will be that applicable when the funds are borrowed). Repayments would amount to $43,152 + GST per annum.
It is also intended to change the benefit classifications within the Special Rating Area from the existing scheme which is;• Class A 100% differential• Class B 60% differential• Class C 20% differential
To a benefit scheme which includes the following;• Class A 100% differential• Class B 65% differential (these properties were previously classified as 60%)• Class C 60% differential• Class D 30% differential (these properties were previously classified as 20%)
Properties will need to be rated to repay the loan of $350,000.
The rating impact on properties in each benefit class is assessed as follows;
Class Rate per $100,000 of Capital Value (GST inclusive) Yield
A (Camping Ground) $4,824.60 GST inclusive $34,737 GST inclusive
A (Other Properties) $162.73 GST inclusive $ 7,494 GST inclusive
B $105.80 GST inclusive $ 2,439 GST inclusive
C $97.64 GST inclusive $ 2,265 GST inclusive
D $48.76 GST inclusive $ 2,689 GST inclusive
$49,624 GST inclusive The maintenance rate of $95,000 + GST per annum will need to continue, but collected as per the amended benefit classes.
The rating impact on properties in each benefit class is assessed as follows;
Class Rate per $100,000 of Capital Value (GST exclusive) Yield
A (Camping Ground) $1,106.99 GST inclusive $7,970 GST inclusive
A (Other Properties) $1,106.99 GST inclusive $50,978 GST inclusive
B $719.54 GST inclusive $ 16,578 GST inclusive
C $664.19 GST inclusive $ 15,409 GST inclusive
D $332.10 GST inclusive $18,315 GST inclusive
$109,250 GST inclusive

23 West Coast Regional Council Annual Plan July 1, 2017 to June 30, 2018

24West Coast Regional Council Annual Plan July 1, 2017 to June 30, 2018
Vector Control Services Business Unit The Council’s business unit exists to provide a suitable return to Council, to ensure there is capacity for delivering Tb possum control work on the West Coast, and to assist with other Council and contracted work as appropriate. Current work areas the business unit is involved in include:• Ground-based and aerial pest control, and bulk storage facilities;• Providing support for biosecurity responses;• Environmental consultancy work in support of primary industry on the West Coast;• Support for Marine Oil Spill and pollution responses.
While pest management is the principal activity of the business unit, the intention is to continue to broaden the scope of services provided, as other suitable opportunities arise where our staff can add value. The Business Unit will tender for work both within and outside the West Coast region.
Why have a VCS Business Unit?The Council has traditionally had a pest control operational unit and it was decided in 2004 to operate that unit using a business model. Operating as a business unit enables Council service delivery functions to be carried out efficiently and effectively in accordance with sound business practices. VCS competes on the open market for possum control work. VCS has the capability to compete for other contract work, as appropriate, to maintain a profitable business and provide a financial return to the Council. The VCS business unit also ensures the Council has suitably trained staff and equipment available at short notice for emergency work.
Key Changes from 2015-25 Long Term Plan: Nil
VCS Performance Targets
Levels of Service Measure Performance Targets
To produce a financial surplus (to offset general rates) by tendering for & delivering on vector control contracts and other contracts.
Achieve or exceed budgeted financial return.
Tender for, and win, sufficient contracts to provide or exceed the annual budgeted return to Council.
To provide marine oil spill and terrestrial hazardous substance spill support, and biosecurity response services for the MNZ, MAF and the Regional Council.
Availability of trained staff.
Have staff available as a response unit for marine and terrestrial pollution spill events as per the MOU dated 11 November 2005.
Availability of trained staff.
Have 4 staff plus a vehicle available for biosecurity emergencies, as per the National Biosecurity Capability Network agreement 2011.

25 West Coast Regional Council Annual Plan July 1, 2017 to June 30, 2018
Statement of Accounting PoliciesReporting Entity WCRC has designated itself as a Tier 2 Public Benefit Entity (PBE) for financial reporting purposes.
These prospective financial statements of WCRC are for the year ended 30 June 2018.
Basis of preparation The prospective financial statements have been prepared on the going concern basis, and the accounting policies have been applied consistently throughout the period.
The prospective financial statements have been prepared in accordance with the requirements of the Local Government Act 2002 (LGA 2002), which include the requirement to comply with generally accepted accounting practice in New Zealand (NZ GAAP).
The prospective financial statements have been prepared in accordance with Tier 2 PBE accounting standards. WCRC qualifies as a Tier 2 entity as its total expenditure is less than $30 million per annum.
These prospective financial statements comply with the PBE standards.
These prospective financial statements are presented in New Zealand dollars.
Investment in associateThe Council’s associate investment is accounted for using the equity method.An associate is an entity over which the Council has significant influence and that is neither a subsidiary nor an interest in a joint venture. The investment in an associate is initially recognised at cost and subsequently equity accounted.
Revenue Revenue is measured at the fair value of consideration received.
Rates revenueRates are set annually by a resolution from Council and relate to a financial year. All ratepayers are invoiced within the financial year to which the rates have been set. Rates revenue is recognised at the start of the year to which the resolution relates.
Other revenue WCRC receives government grants from the New Zealand Transport Agency, which subsidises part of WCRC costs in carrying out its land transport responsibilities. The subsidies are recognised as revenue upon entitlement as conditions pertaining to eligible expenditure have been fulfilled.
Revenue from the rendering of services is recognised by reference to the stage of completion of the transaction at balance date, based on the actual service provided as a percentage of the total services to be provided. Interest income is recognised using the effective interest method. Dividends are recognised when the right to receive payment has been established.
Borrowing costs Borrowing costs are recognised as an expense in the period in which they are incurred.
Finance leases A finance lease is a lease that transfers to the lessee substantially all the risks and rewards incidental to ownership of an asset, whether or not title is eventually transferred. At the commencement of the lease term, WCRC recognises finance leases as assets and liabilities in the statement of financial position at the lower of the fair value of the leased item or the present value of the minimum lease payments. The finance charge is charged to the surplus or deficit over the lease period so as to produce a constant periodic rate of interest on the remaining balance of the liability. The amount

26West Coast Regional Council Annual Plan July 1, 2017 to June 30, 2018
recognised as an asset is depreciated over its useful life. If there is no certainty as to whether WCRC will obtain ownership at the end of the lease term, the asset is fully depreciated over the shorter of the lease term and its useful life.
Operating leases An operating lease is a lease that does not transfer substantially all the risks and rewards incidental to ownership of an asset. Lease payments under an operating lease are recognised as an expense on a straight-line basis over the lease term.
Trade and other receivables Trade and other receivables are initially measured at face value, less any provision for impairment. A provision for impairment of receivables is established when there is objective evidence that WCRC will not be able to collect all amounts due according to the original terms of receivables. The amount of the provision is the difference between the asset’s carrying amount and the present value of estimated future cash flows, discounted using the effective interest method.
Inventories Inventories held for consumption in the provision of services that are not supplied on a commercial basis are measured at cost. The write down from cost to current replacement cost or net realisable value is recognised in the surplus or deficit.
Inventories held for use in the provision of goods and services on a commercial basis are valued at the lower of cost (using the “First in First Out” method) and net realisable value.
Foreign currency transactionsForeign currency transactions are translated into the functional currency using the exchange rates prevailing at the dates of the transactions. Foreign exchange gains and losses resulting from the settlement of such transactions are recognised in the surplus or deficit.
Derivative financial instruments and hedge accountingDerivative financial instruments are used to manage exposure to foreign exchange and interest rate risks arising from financing activities. In accordance with its treasury policy, the Council does not hold or issue derivative financial instruments for trading purposes.
Derivatives are initially recognised at fair value on the date a derivative contract is entered into and are subsequently re-measured at their fair value at each balance date. The method of recognising the resulting gain or loss depends on whether the derivative is designated as a hedging instrument, and, if so, the nature of the item being hedged.
The associated gains or losses of derivatives that are not hedge accounted are recognised in the surplus or deficit. Council has not designated any derivatives as hedging instruments.
The Council designates certain derivatives as either:• Hedges of the fair value of recognised assets or liabilities or a firm commitment (fair value hedge); or• Hedges of highly probable forecast transactions (cash flow hedge).
The Council documents at the inception of the transaction the relationship between hedging instruments and hedged items, as well as its risk management objective and strategy for undertaking various hedge transactions. The Council also documents its assessment, both at hedge inception and on an ongoing basis, of whether the derivatives that are used in hedging transactions are highly effective in offsetting changes in fair values or cash flows of hedged items.
The full fair value of a derivative is classified as non-current if the remaining maturity of the hedged item is more than 12 months, and as current if the remaining maturity of the hedged item is less than 12 months.
Other Financial assets WCRC has two classifications for its financial assets:• Financial assets at fair value through surplus or deficit. • Loans and receivables.
The classification depends on the purpose for which the investments were acquired. Management determines the classification of its investments at initial recognition and re-evaluates this designation at every reporting date.
Financial assets are initially measured at fair value plus transaction costs unless they are carried at fair value through surplus or deficit in which case the transaction costs are recognised in the surplus or deficit. The fair value of financial instruments traded in active markets is based on quoted market prices at the balance sheet date. Council fund manager

27 West Coast Regional Council Annual Plan July 1, 2017 to June 30, 2018
Westpac obtains independent verified market prices from third parties such as trading banks, broking houses and originating companies for all assets/securities. Managed funds are valued at the value date price used as the exit price at month end and can be deemed to be fair value. Westpac valuations use the redemption unit price to value in it trust products. The value of a unit is based on the net value of the relevant fund.
The fair value of financial instruments that are not traded in an active market is determined using valuation techniques. WCRC uses a variety of methods and makes assumptions that are based on market conditions existing at each balance date. Quoted market prices or dealer quotes for similar instruments are used for long-term debt instruments held. Other techniques, such as estimated discounted cash flows, are used to determine fair value for the remaining financial instruments.
The two categories of financial assets that apply to WCRC are:
1) Financial assets at fair value through surplus or deficitThis category has two sub-categories: financial assets held for trading, and those designated at fair value through surplus or deficit at inception. A financial asset is classified in this category if acquired principally for the purpose of selling in the short term or if so designated by management. Derivatives are also categorised as held for trading unless they are designated as hedges. Assets in this category are classified as current assets if they are either held for trading or are expected to be realised within 12 months of the balance sheet date. After initial recognition they are measured at their fair values. Gains or losses on re-measurement are recognised in the surplus or deficit. Financial assets in this category include derivatives and Council’s investment portfolio. WCRC has foreign exchange contracts which are used to manage currency risk for those Investments denominated in foreign currencies. WCRC does not hold or issue derivative financial instruments for trading purposes. WCRC has adopted the provisions for hedge accounting.
2) Loans and receivables These are non-derivative financial assets with fixed or determinable payments that are not quoted in an active market. After initial recognition they are measured at amortised cost using the effective interest method, less impairment. Gains and losses when the asset is impaired or derecognised are recognised in the surplus or deficit. Loans and receivables are classified as “trade and other receivables” in the statement of financial position.
Impairment of financial assets At each balance sheet date WCRC assesses whether there is any objective evidence that a financial asset or group of financial assets is impaired. Any impairment losses are recognised in surplus or deficit.
Non-current assets held for sale Non-current assets held for sale are classified as held for sale if their carrying amount will be recovered principally through a sale transaction, not through continuing use. Non-current assets held for sale are measured at the lower of their carrying amount and fair value less costs to sell. Any impairment losses for write-downs of non-current assets held for sale are recognised in the surplus or deficit. Any increases in fair value (less costs to sell) are recognised up to the level of any impairment losses that have been previously recognised. Non-current assets (including those that are part of a disposal group) are not depreciated or amortised while they are classified as held for sale.
Property, plant and equipment Property, plant and equipment consists of: Operational assets - These include land, buildings, plant and equipment, and motor vehicles. Infrastructure assets - Infrastructure assets are the river, drainage and coastal protection systems owned by WCRC. They include rock protection work and stopbanks.
Property, plant and equipment is shown at cost or valuation, less accumulated depreciation and impairment losses.
Additions The cost of an item of property, plant and equipment is recognised as an asset if, and only if, it is probable that future economic benefits or service potential associated with the item will flow to WCRC and the cost of the item can be measured reliably. In most instances, an item of property, plant and equipment is recognised at its cost. Where an asset is acquired at no cost, or for a nominal cost, it is recognised at fair value as at the date of acquisition.
Disposals Gains and losses on disposals are determined by comparing the proceeds with the carrying amount of the asset. Gains and losses on disposals are included in the surplus or deficit. When revalued assets are sold, the amounts included in asset revaluation reserves in respect of those assets are transferred to retained earnings.

28West Coast Regional Council Annual Plan July 1, 2017 to June 30, 2018
Subsequent costs Costs incurred subsequent to initial acquisition are capitalised only when it is probable that future economic benefits or service potential associated with the item will flow to WCRC and the cost of the item can be measured reliably. The costs of day to day servicing of property, plant and equipment are recognised in the surplus or deficit as they are incurred.
DepreciationDepreciation is provided on a straight-line basis on all property, plant and equipment other than land and river protection systems, at rates that will write off the cost (or valuation) of the assets to their estimated residual values over their useful lives. Due to the nature of the river systems and the structural composition of river protection works, no decline in service potential occurs.
The useful lives and associated depreciation rates of major classes of assets have been estimated as:
Item Estimated life Rate
Buildings (non-component items) 50 – 67 years 1.5% - 2%
Portable buildings 10 years 10%
Building components 6.7 – 20 years 5% - 15%
Plant and Equipment 4 - 6.7 years 15% - 25%
Truck 6.7 years 15%
Motor Vehicle 6 - 7 years 15 %
The residual value and useful life of an asset is reviewed, and adjusted if applicable, at each financial year-end.
RevaluationThose asset classes that are revalued are valued on a three yearly valuation cycle on the basis described below. All other asset classes are carried at depreciated historical cost. The carrying values of revalued items are reviewed at each balance date to ensure that those values are not materially different to fair value.
Operational land:This is revalued on a cyclical 3-year basis at fair value as determined from the most recent market based rating valuations. Valuations are as at 1 September 2015 (Grey District area land), 1 September 2014 (Westland District area land), and 1 September 2016 (Buller District area land).
Infrastructural asset classes: River, Drainage and Coastal Protection AssetsAt fair value determined on a replacement cost basis by a staff member and peer reviewed by an independent engineer. At balance date, WCRC assesses the carrying value of its infrastructural assets to ensure that they do not materially differ from the assets’ fair values.
Accounting for revaluations:WCRC accounts for revaluations of property, plant and equipment on a class of asset basis. The results of revaluing are credited or debited to an asset revaluation reserve for that class of asset and other comprehensive income. Where this results in a debit balance in the asset revaluation reserve, this balance is expensed in the surplus or deficit. Any subsequent increase on revaluation that off-sets a previous decrease in value recognised in the surplus or deficit will be recognised first in the surplus or deficit up to the amount previously expensed, and then credited to the revaluation reserve for that class of asset and other comprehensive income.

29 West Coast Regional Council Annual Plan July 1, 2017 to June 30, 2018
Intangible AssetsSoftware acquisition and developmentAcquired computer software licenses are capitalised on the basis of the costs incurred to acquire and bring to use the specific software. Costs associated with maintaining computer software are recognised as an expense when incurred.
Mining rightsMining rights are recognised at cost on acquisition. Mining rights potentially have an indefinite life and are not amortised, but are instead tested for impairment annually.
AmortisationThe carrying value of an intangible asset with a finite life is amortised on a straight-line basis over its useful life. Amortisation begins when the asset is available for use and ceases at the date that the asset is derecognised. The amortisation charge for each period is recognised in the surplus or deficit.
The useful lives and associated amortisation rates of major classes of intangible assets have been estimated as follows:
Estimated life Rate
Computer Software 3.3 – 10 years 10% - 30%
Impairment of non-financial assetsAssets that have a finite useful life and are measured at cost are reviewed for impairment whenever events or changes in circumstances indicate that the carrying amount may not be recoverable. An impairment loss is recognised for the amount by which the asset’s carrying amount exceeds its recoverable amount. The recoverable amount is the higher of an asset’s fair value less costs to sell and value in use.
Value in use is depreciated replacement cost for an asset where the future economic benefits or service potential of the asset are not primarily dependent on the asset’s ability to generate net cash inflows and where the entity would, if deprived of the asset, replace its remaining future economic benefits or service potential.
The value in use for cash-generating assets is the present value of expected future cash flows. If an asset’s carrying amount exceeds its recoverable amount the asset is impaired and the carrying amount is written down to the recoverable amount. For revalued assets the impairment loss is recognised against the revaluation reserve for that class of asset. Where that results in a debit balance in the revaluation reserve, the balance is recognised in the surplus or deficit.
The total impairment loss is recognised in the surplus or deficit.
Investment propertyProperty leased or intended to be leased to third parties under operating leases are classified as investment property unless the property is held to meet service delivery objectives, rather than to earn rentals or for capital appreciation. Investment property is measured initially at cost, including transaction costs. After initial recognition, all investment property is measured at fair value as determined annually by an independent valuer. Gains or losses arising from a change in the fair value of the investment property are recognised in the surplus or deficit.
Employee benefitsShort-term benefitsEmployee benefits that WCRC expects to be settled within 12 months of balance date are measured at nominal values based on accrued entitlements at current rates of pay. These include salaries and wages accrued up to balance date, annual leave earned to, but not yet taken at balance date, retiring and long service leave entitlements expected to be settled within 12 months.

30West Coast Regional Council Annual Plan July 1, 2017 to June 30, 2018
Long-term benefits:Long service leave Entitlements that are payable beyond 12 months, such as long service leave have been calculated on an actuarial basis. The calculations are based on:• likely future entitlements accruing to staff, based on years of service, years to entitlement, the likelihood that staff
will reach the point of entitlement and contractual entitlements information;
Superannuation schemesDefined contribution schemesObligations for contributions to defined contribution superannuation schemes are recognised as an expense in the surplus or deficit as incurred.
ProvisionsWCRC recognises a provision for future expenditure of uncertain amount or timing when there is a present obligation (either legal or constructive) as a result of a past event. It is probable that expenditures will be required to settle the obligation and a reliable estimate can be made of the amount of the obligation. Provisions are not recognised for future operating losses. Provisions are measured at the present value of the expenditures expected to be required to settle the obligation using a pre-tax discount rate that reflects current market assessments of the time value of money and the risks specific to the obligation. The increase in the provision due to the passage of time is recognised as an interest expense.
BorrowingsBorrowings are initially recognised at their fair value. After initial recognition, all borrowings are measured at amortised cost using the effective interest method.
EquityEquity is the community’s interest in WCRC and is measured as the difference between total assets and total liabilities. Equity is disaggregated and classified into a number of reserves. The components of equity are:• Retained earnings;• Restricted reserves; and • Asset revaluation reserves.
Restricted and Council created reservesRestricted reserves are a component of equity generally representing a particular use to which various parts of equity have been assigned. Reserves may be legally restricted or created by WCRC. Restricted reserves are those subject to specific conditions accepted as binding by WCRC and which may not be revised by WCRC without reference to the Courts or a third party. Transfers from these reserves may be made only for certain specified purposes or when certain specified conditions are met. Also included in restricted reserves are reserves restricted by Council decision. The Council may alter them without references to any third party or the Courts. Transfers to and from these reserves are at the discretion of the Council. Goods and Services Tax (GST)All items in the financial statements are stated exclusive of GST, except for receivables and payables, which are stated on a GST inclusive basis. Where GST is not recoverable as input tax then it is recognised as part of the related asset or expense. The net amount of GST recoverable from, or payable to, the Inland Revenue Department (IRD) is included as part of receivables or payables in the statement of financial position. The net GST paid to, or received from the IRD, including the GST relating to investing and financing activities, is classified as an operating cash flow in the statement of cash flows. Commitments and contingencies are disclosed exclusive of GST.
Budget figuresThe budget figures are those approved by the Council at the beginning of the year in the LTP/Annual Plan. The budget figures have been prepared in accordance with NZ GAAP, using accounting policies that are consistent with those adopted by WCRC for the preparation of the financial statements.

31 West Coast Regional Council Annual Plan July 1, 2017 to June 30, 2018
Cost allocationWCRC has derived the cost of service for each significant activity of WCRC using the cost allocation system outlined below. Direct costs are those costs directly attributable to a significant activity. Indirect costs are those costs, which cannot be identified in an economically feasible manner, with a specific significant activity. Direct costs are charged directly to significant activities. Indirect costs are charged to significant activities using appropriate cost drivers such as actual usage, staff numbers and floor area.
Critical accounting estimates and assumptionsIn preparing these financial statements WCRC has made estimates and assumptions concerning the future. These estimates and assumptions may differ from the subsequent actual results. Estimates and judgements are continually evaluated and are based on historical experience and other factors, including expectations or future events that are believed to be reasonable under the circumstances. There are no estimates and assumptions that have a significant risk of causing a material adjustment to the carrying amounts of assets and liabilities within the next financial year.
Analysis of Forecast Surplus (Annual Plan 2017/18)
Surplus $561,171
Less
Transfer -surplus/deficit relating to Rating Districts -$411,817
Transfer -surplus/deficit relating to Quarries $78,974
Transfer to Revaluation Reserve -$35,526
Loan Principal Repayments -$142,802
Transfer to Catastrophe Fund -$50,000
Transfer Investment Income to Reserves 0
Total Transfers -$561,171

32West Coast Regional Council Annual Plan July 1, 2017 to June 30, 2018
Prospective Statement of Comprehensive Income
AP2016/17
AP2017/18
LTP2017/18
Cost of Services
481,357 Governance 453,771 432,370
2,934,858 Resource Management 3,158,181 3,225,128
300,000 Economic Development 300,000 300,000
167,778 Transport 170,446 174,074
603,072 Hydrology & Flood Warning 621,863 517,143
322,116 Emergency Management 716,152 260,721
1,545,383 River, Drainage & Coastal Protection 1,812,806 1,557,615
2,549,227 VCS Business Unit 2,618,500 2,457,914
75,396 Other 77,138 86,039
109,000 Warm West Coast Scheme 92,000 109,000
9,088,187 Total Expenditure 10,020,857 9,120,004
Revenue
3,731,950 Rates 4,316,574 3,711,563
60,000 Penalties 60,000 63,035
90,613 Subsidies & Grants 82,330 95,117
890,968 Investment Income 1,107,333 1,095,203
4,658,360 User Fees & Charges 4,830,265 4,824,785
150,000 Other 150,000 150,000
34,659 Commercial Property Revaluations 35,526 35,526
9,616,550 Total Revenue 10,582,028 9,975,229
528,363 Surplus / (-Deficit) from Activities 561,171 855,225
0 Revaluation of Assets 0 0
528,363 Total Comprehensive Income 561,171 855,225
Summary of Operating Expenditure by Expenditure Type
294,793 Interest 265,562 279,834
362,990 Depreciation and amortisation 316,337 323,725
3,749,006 Employee benefits 3,911,751 3,542,116
4,681,398 Other operating expenditure 5,527,207 4,974,329
9,088,187 Total Operating Expenditure 10,020,857 9,120,004

33 West Coast Regional Council Annual Plan July 1, 2017 to June 30, 2018
Prospective Statement of Movements in Equity
AP2016/17
AP 2017/18
LTP2017/18
Ratepayers Equity
20,157,595 Opening Balance 20,069,894 21,451,452
528,363 Operating Surplus 561,171 855,225
0 Transfers (Investment Growth) 0 -324,543
-125,963 Transfers (Rating Districts) -110,016 -119,077
-50,000 Transfers (Catastrophe Fund) -50,000 -120,038
14,680 Transfers (Quarry account) 78,974 0
20,524,675 20,550,023 21,743,019
Rating Districts (Targeted Rates Reserves)
2,000,000 Opening Balance 2,500,000 2,450,474
125,963 Net Transfers (Ratepayers Equity) 110,016 119,077
2,125,963 2,610,016 2,569,551
Revaluation Reserve
37,385,333 Opening Balance 38,361,028 38,420,460
0 Other comprehensive revenue & expense 0 0
37,385,333 38,361,028 38,420,460
Investment Growth Reserve
9,752,906 Opening Balance 9,730,000 9,738,072
0 Net transfers (Ratepayers Equity) 0 324,543
9,752,906 9,730,000 10,062,615
Quarry Account
-270,000 Opening Balance 0 0
-14,680 Net transfers (Ratepayers Equity) -78,974 0
-284,680 -78,974 0
Catastrophe Fund
950,000 Opening Balance 1,050,000 1,117,300
50,000 Net Transfers (Ratepayers Equity) 50,000 120,038
1,000,000 1,100,000 1,237,338
70,504,197 Closing Balances 72,272,093 74,032,983

34West Coast Regional Council Annual Plan July 1, 2017 to June 30, 2018
Prospective Statement of Financial Position
AP @ 30/6/17
AP @ 30/6/18
LTP @ 30/6/18
Current Assets
85,693 Cash 43,998 369,639
1,600,000 Receivables 1,600,000 1,600,000
700,000 Inventories 700,000 700,000
69,578 Loan Advances 69,931 84,032
1,500,000 Other Financial Assets 1,500,000 1,500,000
3,955,271 Total Current Assets 3,913,929 4,253,671
Non Current Assets
4,414,475 Property, Plant, Equipment 4,192,598 4,123,439
56,822,958 Infrastructure 58,476,890 57,183,061
212,450 Intangible Assets 145,745 145,745
1,408,473 Investment Property 1,455,526 1,456,560
454,358 Loan Advances 363,670 420,702
1,035,000 Investment in Associates 911,000 902,500
10,375,963 Other Financial Assets 10,775,000 12,369,504
74,723,677 Total Non-Current Assets 76,320,429 76,601,511
78,678,948 Total Assets 80,234,358 80,855,182

35 West Coast Regional Council Annual Plan July 1, 2017 to June 30, 2018
AP@ 30/6/17
AP @ 30/6/18
LTP@ 30/6/18
Current Liabilities
13,666 Borrowings 0 12,451
2,000,000 Payables 2,000,000 2,000,000
300,000 Employee Benefit Liabilities 300,000 300,000
2,313,666 Total Current Liabilities 2,300,000 2,312,451
Non Current Liabilities
0 Employee Benefit Liabilities 0 0
5,791,085 Borrowings 5,592,265 4,439,748
70,000 Quarry Aftercare Provision 70,000 70,000
5,861,085 Total Non-Current Liabilities 5,662,265 4,509,748
Equity
20,524,675 Ratepayers Equity 20,550,023 21,743,019
2,125,963 Rating District equity 2,610,016 2,569,551
1,000,000 Catastrophe Fund 1,100,000 1,237,338
37,385,333 Revaluation Reserve 38,361,028 38,420,460
-284,680 Quarry Account -78,974 0
9,752,906 Investment Growth Reserve 9,730,000 10,062,615
70,504,197 Total Equity 72,272,093 74,032,983
78,678,948 Total Liabilities & Equity 80,234,358 80,855,182

36West Coast Regional Council Annual Plan July 1, 2017 to June 30, 2018
Prospective Statement of Cash Flows
AP2016/17
AP2017/18
LTP2017/18
Cash Flow from Operating Activities0 Investment Income 0
3,731,950 Rates 4,307,714 3,711,563
4,958,973 Other Income 5,477,638 4,982,937
8,690,923 9,785,352 8,694,500
Less Cash Paid for:
294,793 Interest 265,562 279,8348,430,120 Operating Expenditure 9,438,688 8,366,445
8,724,913 9,704,520 8,646,279
-33,990 Net Cash Flow Operations 80,832 48,221
Cash Flow from InvestingCash From:
890,968 Redemption of Investments 1,079,150 1,095,20318,697 Sale of Fixed Assets 20,752 14,449
909,655 1,099,902 1,109,622Cash Paid For:
331,800 Purchase of Fixed Assets 896,800 166,060175,963 Investments Made 375,000 563,658
507,763 1,271,800 729,718
401,902 Net Cash Flow from Investing -171,898 379,904
Cash Flow from Financing Activities0 Loans Raised 439,000 0
0 Loans Advanced 0 0332,219 Loan Principal Repaid 353,936 -264,591
332,219 Net Cash Flow from Financing 85,064 -264,591
35,693 Total Changes in Cash held -6,002 163,53450,000 Opening Cash Balance 50,000 206,105
85,693 Closing Cash Balances 43,998 369,639

37 West Coast Regional Council Annual Plan July 1, 2017 to June 30, 2018
Projected Capital Expenditure
AP2016/17
Type of ExpenditureAP
2017/18LTP
2017/1820,000 IT Equipment Replacement 20,000 15,765
61,500 Hydrology Replacement 61,500 63,060
57,800 Hydrology Improve level of service 57,800 0
Sonde Replacement 20,000 0
Cobden Stop-bank Improved level of service 0 0
Punakaiki – Seawall extension Improved level of service 420,000 0
127,500 WCRC Vehicle Replacements Replacement 127,500 0
45,000 Photocopiers Replacement 0 0
VCS - Truck Replacement 100,000 0
65,000 VCS - Vehicle Replacements Replacement 45,000 87,233
VCS – Building renovation Replacement 45,000 0
376,800 896,800 166,058
331,800 Funded Depreciation 476,800 166,058
45,000 Funded Loans 0
0 Funded Rating District equity / loans 420,000 0
376,800 896,800 166,058

38West Coast Regional Council Annual Plan July 1, 2017 to June 30, 2018
Reserves Funds
Annual Plan 2017/18
Rating District Opening balance 2,500,000Balances Deposits
Transfer from Surplus 411,817Withdrawals for capex -426,000Borrowing 350,000Loan Principal Repayments -225,801Closing balance 2,610,016
Investment Growth Opening balance 9,730,000Reserve Deposits 0
Transfer from Surplus 0Withdrawals 0
9,730,000
Quarry Account Opening balance 0Deposits 0Transfer from Surplus/-Deficit -78,974Withdrawals 0
-78,974
Catastrophe Fund Opening balance 1,050,000Deposits 50,000Transfer from Surplus 0Withdrawals 0
1,100,000
Total Reserves 13,361,042
Funded by:Westpac Main Portfolio 11,175,000Westpac Catastrophe Fund 1,100,000
Other Investments Commercial Property 766,644(Net of debt) PCR LP 326,478
13,368,122
Reserve Funds – PurposesRating District balances (River, Drainage & Coastal Protection Schemes)
PurposeThese reserves reflect the unspent balances of the targeted rates struck to fund the River, Drainage & Coastal protection schemes.
Activities the Reserve Funds relate toRiver, Drainage & Coastal Protections Group of Activities.

39 West Coast Regional Council Annual Plan July 1, 2017 to June 30, 2018
Investment Growth ReservePurposeIn 2003 Council established a separate Equity Reserve Fund called the “Investment Growth Reserve”.The funds relating to this Reserve were originally from the 2000 Crown payment of $7,000,000 to this Council (Council share of the $120 million payment to the West Coast following the cessation of native logging).
The balance of the fund is calculated by identifying the Investment Portfolio balance, less the amount relating to Rating Districts.
Activities the Reserve Fund relates toThis reserve fund generates income, some of which is used to fund general Council activities.The reserve helps fund the following activities.• Governance• Resource Management• Regional Transport Planning• Hydrology & Flood-warning services• Civil Defence Emergency Management• River, Drainage & Coastal Protection Work
Quarry AccountPurposeThis reserve represents the cumulative surplus /-deficit in the Quarry account.
Activities the Reserve fund relates to• River, Drainage & Coastal Protection Work
Catastrophe Fund PurposeThis reserve was established when Council withdrew from the NZ Local Authority Protection Programme (LAPP Fund) following the 2010/11 Canterbury earthquakes.
Council had used LAPP Fund membership to insure its Rating District Infrastructure.
Continued membership in the fund by Council became unaffordable due to a quadrupling of the annual cost of membership.
Council then established a Catastrophe Fund of initially $500,000. All income is retained in the fund and Council deposits $50,000 per annum into the fund.
Activities the Reserve Fund relates to• River, Drainage & Coastal Protections Group of Activities.

40West Coast Regional Council Annual Plan July 1, 2017 to June 30, 2018
Comparison with Long Term Plan Financial Prudence Caps Benchmarks
Rates Affordability / Benchmarks Income and Increases Annual Plan 17/18 Met
General Rate Total Income
1. General rate will not exceed 30% of total income $2,330,000 $10,582,028 22.0% [yes]
15/16 baseline + 2.50% + 2.54%
2. General rate % increase will not exceed BERL "other inflation" cost indexes $2,330,000 $2,251,000 103.5% [no]**
3. Targeted rates not to exceed 25% of total income $1,917,774 $10,582,028 18.1% [yes]
15/16 baseline + 100%
4. Targeted rates not to exceed 100% increase on the 15/16 baseline over 10 years $1,917,774 $3,670,000 52.3% [yes]
Debt Affordability Benchmarks
Estimated @ 30/6/18
1. Term Liabilities / capita will not exceed $500 $5,592,265 $32,500 $ 172.07 [yes]
population
2. Loan interest + principal repayments not to exceed 15% of total revenue
Interest $265,562
Principal $360,335
$625,897 $10,582,028 5.91% [yes]
3. Balanced budget benchmark to be greater than or equal to 100%
Revenue $10,546,502 (excluding revaluation)
Expenditure $10,020,857 105.2% [yes]
4. Debt servicing benchmark not to exceed 10% Interest Revenue
$265,562 $10,546,502 2.5% [yes]
(excluding revaluations)
Additional Comment Essential Services BenchmarkThe regulations require a Council to compare its capital expenditure on network services to the depreciation on its network services.For West Coast Regional Council this relates to flood protection and control works. As there is no depreciation on West Coast Regional Council flood protection and control works the comparison required by the regulations is not possible.
Rates Affordability Benchmark 2 above **The general rate increase in 16/17 of 3.5% in excess of the Long Term Plan cap was consulted on in the 16/17 Consulation Document.

41 West Coast Regional Council Annual Plan July 1, 2017 to June 30, 2018
Reconciliation of Funding Impact Statement to Statement of Comprehensive Income
Long Term Plan 17/18
Annual Plan17/18
Prospective Statement of Comprehensive Income Surplus 855,225 561,171
Plus non cash expenditure
Depreciation & Amortisation 323,725 316,337
Less non cash income
Revaluation of commercial property -35,525 -35,526
WCRC Operating Funding Surplus 1,143,425 841,982

42West Coast Regional Council Annual Plan July 1, 2017 to June 30, 2018
Funding Impact Statements In accordance with the Local Government (Financial Reporting and Prudence) Regulations 2014
Long Term Plan 16/17
Long Term Plan 17/18
Annual Plan 17/18
West Coast Regional Council
Sources of Funding General Rates 2,257,079 2,314,300 2,390,000Targeted Rates 1,436,224 1,460,298 1,917,714Subsidies & Grants 92,765 95,117 82,330Fees & Charges 4,729,555 4,824,785 5,049,125Income from Investments 1,067,923 1,095,203 1,107,333Fines, Infringement Fees & Other Receipts 0 0Total Operating Funding (A) 9,583,546 9,789,703 10,546,502
Applications of Operating Funding Payments to Staff and Suppliers 8,213,390 8,381,444 9,438,958Finance Costs 280,439 264,834 265,562Other Operating Funding ApplicationsTotal Applications Of Operating Funding (B) 8,493,829 8,646,278 9,704,520
Surplus (deficit) of Operating Funding 1,089,717 1,143,425 841,982
(A) - (B)
Sources of Capital Funding
Subsidies and Grants 0Development and Financial Contributions 0Increase (decrease) in debt -347,420 -349,591 18,665Gross Proceeds Sale assets 18,699 14,419 20,752Lump sum contributions 0Total Sources of Capital Funding (C ) -328,721 -335,172 39,417
Applications of Capital Funding Capital Expenditure- Additional Demand 0Capital Expenditure- Improved Levels of Service 0 0 477,800Capital Expenditure- Replace Existing Assets 269,491 166,058 419,000Increase (Decrease) In Investments 467,744 563,658 57,000Increase (Decrease) In Reserves 23,761 78,537 -72,401Total Applications of Capital Funding) (D) 760,996 808,253 881,399Surplus (Deficit) of Capital Funding (C ) - (D) -1,089,717 -1,143,425 -841,982Funding Balance (A - B ) + (C - D) 0 0 0

43 West Coast Regional Council Annual Plan July 1, 2017 to June 30, 2018
Additional disclosures required pursuant to Local Government Act 2002, Schedule 10, Clauses 20, 20A and 21Targeted Rates The following table summarises the types of targeted rate, the group of activities or activity funded by that targeted rate together with matters and factors of the targeted rates.
Notes:• Differential with regard to River, Drainage & Coastal protection activity scheme rates means that there may be several
different classes of land with the Separate Rating Area, eg Classes A, B, C, D etc. These different classes reflect the different degrees of benefit that the different classes of land receive from the protection works.
• Copies of maps setting out the boundaries of the various separate rating areas may be accessed on Council website www.wcrc.govt.nz
• Council does not invite nor will it accept lump sum contributions in lieu of any targeted rate.

44West Coast Regional Council Annual Plan July 1, 2017 to June 30, 2018
Activity Group Types of Rates Types of land Different categories
River, Drainage & Coastal Protection
Scheme maintenance rate
Land within the boundaries of the Vine Creek Separate Rating area Differential Land Value
River, Drainage & Coastal Protection
Scheme maintenance rate
Land within the boundaries of the Wanganui Separate Rating area Differential Land Value
River, Drainage & Coastal Protection
Scheme maintenance rate
Land within the boundaries of the Kaniere Separate Rating area Differential Land Value
River, Drainage & Coastal Protection
Scheme loan repayment rate
Land within the boundaries of the Kaniere Separate Rating area Differential Land Value
River, Drainage & Coastal Protection
Scheme maintenance rate
Land within the boundaries of the Kowhitirangi Separate Rating area Differential Capital Value
River, Drainage & Coastal Protection
Scheme maintenance rate
Land within the boundaries of the Coal Creek Separate Rating area Capital Value
River, Drainage & Coastal Protection
Scheme maintenance rate
Land within the boundaries of the Karamea Separate Rating area Differential Capital Value
River, Drainage & Coastal Protection
Scheme maintenance rate
Land within the boundaries of the Inchbonnie Separate Rating area Differential Capital Value
River, Drainage & Coastal Protection
Scheme maintenance rate
Land within the boundaries of the Greymouth Floodwalls Separate Rating area Capital Value
River, Drainage & Coastal Protection
Scheme loan repayment rate
Land within the boundaries of the Greymouth Floodwalls Separate Rating area Capital Value
River, Drainage & Coastal Protection
Scheme maintenance rate
Land within the boundaries of the Okuru Separate Rating area Capital Value
River, Drainage & Coastal Protection
Scheme maintenance rate
Land within the boundaries of the Red Jacks Separate Rating area Differential Land Area
River, Drainage & Coastal Protection
Scheme maintenance rate
Land within the boundaries of the Raft Creek Separate Rating area Land Area
River, Drainage & Coastal Protection
Scheme maintenance rate
Land within the boundaries of the Nelson Creek Separate Rating area Differential Land Area
River, Drainage & Coastal Protection
Scheme maintenance rate
Land within the boundaries of the Taramakau Separate Rating area Differential Land Area
River, Drainage & Coastal Protection
Scheme maintenance rate
Land within the boundaries of the Kongahu Separate Rating area Differential Land Area
River, Drainage & Coastal Protection
Scheme maintenance rate
Land within the boundaries of the Waitangi-taona Separate Rating area Differential Land Area
River, Drainage & Coastal Protection
Scheme maintenance rate
Land within the boundaries of the Punakaiki Separate Rating area Differential Capital Value
River, Drainage & Coastal Protection
Scheme loan repayment rate
Land within the boundaries of the Punakaiki Separate Rating area Differential Capital Value
River, Drainage & Coastal Protection
Scheme maintenance rate
Land within the boundaries of the Hokitika River South Bank Separate Rating area Differential Capital Value
River, Drainage & Coastal Protection
Scheme loan repayment and maintenance rate
Land within the boundaries of the Hokitika Seawall Separate Rating area
Differential Capital Value
River, Drainage & Coastal Protection
Scheme maintenance rate
Land within the boundaries of the Franz Josef Separate Rating area Capital Value
River, Drainage & Coastal Protection
Scheme maintenance rate
Land within the boundaries of the Lower Waiho 2010 Separate Rating area Capital Value
River, Drainage & Coastal Protection
Scheme maintenance rate
Land within the boundaries of the Matainui Creek Separate Rating area Capital Value

45 West Coast Regional Council Annual Plan July 1, 2017 to June 30, 2018
Activity Group Types of Rates Types of land Different categories
River, Drainage & Coastal Protection
Scheme maintenance rate
Land within the boundaries of the Mokihinui Separate Rating area Per rating unit
River, Drainage & Coastal Protection
Scheme maintenance rate
Land within the boundaries of the Whataroa River Separate Rating area Differential Capital Value
River, Drainage & Coastal Protection
Scheme maintenance rate
Land within the boundaries of the New River/Saltwater Creek catchment Separate Rating area
Differential Capital Value
River, Drainage & Coastal Protection
Scheme capital works and maintenance rate
Land within the boundaries of the Neil’s BeachSeparate Rating area
Capital Value
Regional Emergency Management
Emergency Management All rateable land in the Region Capital Value
Warm West CoastRepayment of insulation / clean heating funding
Levied on properties that have received Council funding to install insulation and/or clean heating appliances.
General Rates and Choice of Rating System for General Rate.Council may make and levy a General Rate either,• Across the Region, or• Within each constituent District within the Region, so that the rate made or levied may vary across the three Districts
(Westland, Buller and Grey) within the Region.
Several years ago (2005) Council implemented a differential general rate which fixed the percentage (%) of the general rate to be collected from each of the three District areas within the region. The differentials were based on the historic allocation of the general rate across the three District areas during a time when the rateable valuation of each District was equalised to ensure a fair apportionment of the general rate to each District. Equalisation was used as there were varying revaluation dates across the three Districts. Following discontinuation of equalisation the fixed differentials now achieve the same fairness objective. The differentials decided were: • Buller District Area 31%• Grey District Area 39%• Westland District Area 30%
Since its creation in 1989, the Council has made and levied its General Rate using the Capital Value system. The nature of the Council’s business has not altered significantly in that time. Council concludes that the system of making and levying its General Rate should continue to use the Capital Value system.General rates are used to fund activities where Council believes there is a general benefit to all ratepayers and it is not possible to identify or charge the cost directly to the beneficiaries.
Targeted RatesCouncil may make and levy targeted rates for the purpose of undertaking specific services or work for the benefit of all or part of the Region. Council will be making and levying targeted rates to fund the following types of expenditure:
Various river, drainage and coastal protection scheme targeted rates. These rates are only made and levied over properties that have a direct beneficiary or cause/effect relationship with the service being provided.
Regional Emergency Management targeted rate will be made and levied across the region to fund Emergency Management responsibilities.
Warm West Coast targeted rate scheme requires homeowners who ‘borrowed’ money from the Council to improve their home heating and insulation, pay this amount back via regional rates.
Uniform Annual General ChargeCouncil does not intend to levy any Uniform Annual General Charge.

46West Coast Regional Council Annual Plan July 1, 2017 to June 30, 2018
Rating Base Information
Projected number of rating units within the Region as at 30 June 2018 22,453
Projected total capital value of rating units within the Region as at 30 June 2018 $7,273,097,000
Projected total land value of rating units within the Region as at 30 June 2018 $3,767,257,000

47 West Coast Regional Council Annual Plan July 1, 2017 to June 30, 2018
Rates Information Funding Impact Statement - Rates for the Year Ending 30 June 2018Note: All amounts are stated inclusive of GST. Rating Instalment InformationRates will be payable by two instalments;First instalment Due date 10 September 2017 Penalty date 20 October 2017Second instalment Due date 10 March 2018 Penalty date 20 April 2018
A penalty for late payment will be applied at the amount allowed by the Local Government Rating Act 2002 of 10% on any part of an instalment that remains unpaid after the due dates of 10 September 2017 and 10 March 2018, on the penalty dates of 20 October 2017 and 20 April 2018. A further 10% penalty will be charged on all accumulated rate arrears as at 30 June 2018, on 1 July 2018.
1. General RateThe General Rate is used to fund activities that are of public benefit and where no other source of revenue is identified to cover the cost of the activities.
The General Rate will be a differential general rate in the dollar set for all rateable land within the region and calculated on the Capital value of each rating unit.
DifferentialRateable Capital Value in the Buller District Council area to yield 31% of the total general rate.Rateable Capital Value in the Grey District Council area to yield 39% of the total general rate.Rateable Capital Value in the Westland District Council area to yield 30% of the total general rate.
Differential Estimated Rateable Capital Value Factor per $ of Capital Value Estimated to Yield GST ExclusiveRateable Value of Land in the Buller District Local authority Area 31% $2,203,389,000 0.00037699 $830,645 $722,300Rateable Value of Land in the Grey District Local authority Area 39% $2,653,994,750 0.00039375 $1,045,005 $908,700Rateable Value of Land in the Westland District Local authority Area 30% $2,415,713,400 0.00033276 $803,850 $699,000
100% $7,273,097,150 $2,679,500 $2,330,000
2. Targeted Rates(a) A targeted rate set differentially in accordance with sections 16, 17, 18 of the Local Government Rating Act 2002 on all rateable land situated in the Vine Creek Separate Rating Area and calculated on the land value of each rating unit, for maintaining the protection works in the scheme.
Vine Creek Rating District Estimated Rateable Land Value Differential Based on Benefits Factor per $ of Land Value Estimated to Yield GST ExclusiveClass A $4,869,100 1.00 0.00271999 $13,245 $11,517Class B $6,031,400 0.70 0.00190399 $11,484 $9,986Class C $8,157,000 0.50 0.00135999 $11,093 $9,646Class D $20,315,300 0.20 0.00054400 $11,051 $9,610Class E $17,932,000 0.10 0.00027200 $4,877 $4,241
$51,750 $45,000
(b) A targeted rate set differentially in accordance with sections 16, 17, 18 of the Local Government Rating Act 2002 on all rateable land situated in the Wanganui River Separate Rating Area and calculated on the land value of each rating unit, for maintaining the protection works in the scheme.
Wanganui River Rating District Estimated Rateable Land Value Differential Based on Benefits Factor per $ of Land Value Estimated to Yield GST ExclusiveClass A $25,100,700 1.00 0.00201171 $50,495 $43,910Class B $22,092,100 0.70 0.00140820 $31,110 $27,052Class C $30,713,400 0.45 0.00090527 $27,804 $24,177Class D $5,247,800 0.10 0.00020117 $1,056 $918Class U1 $3,330,600 0.50 0.00100586 $3,350 $2,913Class U2 $1,178,000 0.50 0.00100586 $1,185 $1,030
$115,000 $100,000
(c ) A targeted rate set differentially in accordance with sections 16, 17, 18 of the Local Government Rating Act 2002 on all rateable land situated in the Kaniere Separate Rating Area and calculated on the land value of each rating unit, for maintaining the protection works in the scheme.
Kaniere Rating District (Maintenance) Estimated Rateable Land Value Differential Based on Benefits Factor per $ of Land Value Estimated to Yield GST ExclusiveClass A $304,900 1.00 0.00598958 $1,826 $1,588Class B $107,000 0.60 0.00359375 $385 $334Class C $258,000 0.40 0.00239583 $618 $538Class D $1,654,000 0.15 0.00089844 $1,486 $1,292Class E $476,000 0.10 0.00059896 $285 $248
$4,600 $4,000

48West Coast Regional Council Annual Plan July 1, 2017 to June 30, 2018
(d )A targeted rate set differentially in accordance with sections 16, 17, 18 of the Local Government Rating Act 2002 on all rateable land situated in the Kaniere Separate Rating Area and calculated on the land value of each rating unit, for maintaining the protection works in the scheme.
Kaniere Rating District ( Loan ) Estimated Rateable Land Value Differential Based on Benefits Factor per $ of Land Value Estimated to Yield GST ExclusiveClass A $304,900 1.00 0.00969095 $2,955 $2,569Class B $107,000 0.60 0.00581457 $622 $541Class C $258,000 0.40 0.00387638 $1,000 $870Class D $1,654,000 0.15 0.00145364 $2,404 $2,091Class E $476,000 0.10 0.00096910 $461 $ 401
$7,443 $6,472
(e) A targeted rate set differentially in accordance with sections 16, 17, 18 of the Local Government Rating Act 2002 on all rateable land situated in the Kowhitirangi Separate Rating Area and calculated on the capital value of each rating unit, for repaying the loan raised in 2017 to extend the protection works.
Kowhitirangi Flood Control Rating District Estimated Rateable Capital Value Differential Based on Benefits Factor per $ of Capital Value Estimated to Yield GST ExclusiveClass A $18,853,600 1.00 0.00017832 $3,362 $2,923Class C $39,993,800 0.50 0.00008916 $3,566 $3,101Class E $38,892,000 0.29 0.00005202 $2,023 $1,759Class F $85,759,700 0.17 0.00002973 $2,549 $2,217
$11,500 $10,000 (f)A targeted rate in accordance with sections 16, 17, 18 of the Local Government Rating Act 2002 on all rateable land situated in the Coal Creek Separate Rating Area and calculated on the capital value of each rating unit, for maintaining the protection works in the scheme.
Coal Creek Rating District Estimated Rateable Capital Value Factor per $ of Capital Value Estimated to Yield GST Exclusive$6,395,300 0.00179820 $11,500 $10,000
$11,500 $10,000 (g) A targeted rate set differentially in accordance with sections 16, 17, 18 of the Local Government Rating Act 2002 on all rateable land situated in the Karamea Riding Separate Rating Area and calculated on the capital value of each rating unit, for maintaining the protection works in the scheme.
Karamea Riding Rating District Estimated Rateable Capital Value Differential Based on Benefits Factor per $ of Capital Value Estimated to Yield GST ExclusiveClass A $2,681,300 1.00 0.00131881 $3,536 $3,075Class B $30,551,150 0.80 0.00105505 $32,233 $28,029Class C $4,538,870 0.60 0.00079129 $3,592 $3,123Class D $114,904,290 0.10 0.00013188 $15,154 $13,177Class E $45,276,690 0.05 0.00006594 $2,986 $2,596
$57,500 $50,000 (h) A targeted rate set differentially in accordance with sections 16, 17, 18 of the Local Government Rating Act 2002 on all rateable land situated in the Inchbonnie Separate Rating Area and calculated on the capital value of each rating unit, for maintaining the protection works in the scheme.
Inchbonnie Rating District Estimated Rateable Capital Value Differential Based on Benefits Factor per $ of Capital Value Estimated to Yield GST ExclusiveClass A $4,139,000 1.00 0.00105709 $4,375 $3,805Class B $17,884,000 0.75 0.00079282 $14,179 $12,329Class C $6,594,000 0.50 0.00052854 $3,485 $3,031Class D $2,470,000 0.30 0.00031713 $783 $681Class F $1,119,000 0.15 0.00015856 $177 $154
$23,000 $20,000 (i) A targeted rate in accordance with sections 16, 17, 18 of the Local Government Rating Act 2002 on all rateable land situated in the Greymouth Floodwall Separate Rating Area and calculated on the capital value of each rating unit, for repayment of a loan raised to fund the 2010 upgrade of the protection works.
Greymouth Floodwall (Loan) Rating District Estimated Rateable Capital Value Factor per $ of Capital Value Estimated to Yield GST Exclusive$710,477,700 0.00029135 $207,000 $180,000
(j) A targeted rate in accordance with sections 16, 17, 18 of the Local Government Rating Act 2002 on all rateable land situated in the Greymouth Floodwall Separate Rating Area and calculated on the capital value of each rating unit, for maintaining the protection works in the scheme.
Greymouth Floodwall (Maintenance) Rating District Estimated Rateable Capital Value Factor per $ of Capital Value Estimated to Yield GST Exclusive$710,477,700 0.00008093 $57,500 $50,000

49 West Coast Regional Council Annual Plan July 1, 2017 to June 30, 2018
(k) A targeted rate in accordance with sections 16, 17, 18 of the Local Government Rating Act 2002 on all rateable land situated in the Okuru Separate Rating Area and calculated on the capital value of each rating unit, for maintaining the protection works in the scheme.
Okuru Rating District (Maintenance) Estimated Rateable Capital Value Factor per $ of Capital Value Estimated to Yield GST Exclusive
$13,391,000 0.00042939 $5,750 $5,000 (l) A targeted rate set in accordance with sections 16, 17, 18 of the Local Government Rating Act 2002 on all rateable land situated in the Red Jacks Separate Rating Area and calculated on the land area of each rating unit, for maintaining the protection works in the scheme.
Red Jacks Rating District Estimated Rateable Land Area (ha.) Differential Based on Benefits Rate per Hectare Estimated to Yield GST Exclusive
Class A 0.10 6.73% 6191.60000 $619 $538Class B 1.06 35.55% 3081.13208 $3,266 $2841Class C 0.11 3.56% 2977.45455 $328 $285Class D 2.28 17.54% 707.75439 $1,614 $1403Class E 1.48 14.23% 884.56757 $1,309 $1138Class F 1.84 4.73% 236.50000 $435 $378Class G 21.97 7.40% 30.98771 $681 $592Class H 49.18 8.60% 16.08784 $791 $688Class I 77.00 1.71% 2.04312 $157 $137
100% $9,200 $8,000 (m) A targeted rate in accordance with sections 16, 17, 18 of the Local Government Rating Act 2002 on all rateable land in the Raft Creek separate rating area calculated on the land area of each rating unit for maintaining the protection works in the scheme.
Raft Creek Estimated Rateable Land Area (ha.) Rate per Hectare Estimated to Yield GST Exclusive
762.24 12.06969 $9,200 $8,000
(n) A targeted rate set differentially in accordance with sections 16, 17, 18 and 146 of the Local Government Rating Act 2002 on all rateable land situated in the Nelson Creek Separate Rating Area and calculated on the land area of each rating unit, for maintaining the protection works in the scheme.
Nelson Creek Rating District Estimated Rateable Land Area (ha.) Differential Based on Benefits Rate per Hectare Estimated to Yield GST Exclusive
Class A 1.14 8.40% 1482.62863 $1,690 $1,470Class B 2.90 13.21% 916.59770 $2,658 $2,311Class C 10.76 9.99% 186.93953 $2,011 $1,749Class D 10.30 9.15% 178.77559 $1,841 $1,601Class E 18.55 13.04% 141.48437 $2,625 $2,282Class F 63.34 28.14% 89.40192 $5,663 $4,924Class G 18.11 8.89% 98.77864 $1,789 $1,556Class H 20.03 9.18% 92.24554 $1,848 $1,607
100% $20,125 $17,500 (o )A targeted rate set differentially in accordance with sections 16, 17, 18 of the Local Government Rating Act 2002 on all rateable land situated in the Taramakau Settlement Separate Rating Area and calculated on the land area of each rating unit, for maintaining the protection works in the scheme.
Taramakau Settlement Rating District Estimated Rateable Land Area (ha.) Differential Based on Benefits Rate per Hectare Estimated to Yield GST Exclusive
Class A 306.25 33.16% 74.71151 $22,879 $19,896Class B 130.00 11.54% 61.25077 $7,963 $6,924Class C 111.98 6.83% 42.08519 $4,713 $4,098Class D 127.13 6.54% 35.49595 $4,513 $3,924Class E 174.42 8.63% 34.14001 $5,955 $5,178Class F 140.29 5.89% 28.96928 $4,064 $3,534Class G 392.73 13.40% 23.54289 $9,246 $8,040Class H 429.48 13.77% 22.12280 $9,501 $8,262Class I 48.66 0.24% 3.40321 $166 $144
100% $69,000 $60,000 (p) A targeted rate set differentially in accordance with sections 16, 17, 18 of the Local Government Rating Act 2002 on all rateable land situated in the Kongahu Separate Rating Area and calculated on the land area of each rating unit, for maintaining the protection works in the scheme.
Kongahu Rating District Estimated Rateable Land Area (ha.) Differential Based on Benefits Rate per Hectare Estimated to Yield GST Exclusive
Class A 733.86 1.00 14.93829 $10,963 $9,533Class B 68.60 0.52 7.83364 $537 $467
$11,500 $10,000

50West Coast Regional Council Annual Plan July 1, 2017 to June 30, 2018
(q) A targeted rate set differentially in accordance with sections 16, 17, 18 of the Local Government Rating Act 2002 on all rateable land situated in the Waitangitaona Separate Rating Area and calculated on the land area of each rating unit, for maintaining the protection works in the scheme.
Waitangitaona Rating District Estimated Rateable Land Area (ha.) Differential Based on Benefits Rate per Hectare Estimated to Yield GST ExclusiveClass A 604.20 25.80% 14.73011 $8,900 $7,740Class B 721.23 23.48% 11.23210 $8,101 $7,044Class C 1705.84 46.84% 9.47256 $16,159 $14,051Class D 708.22 3.88% 1.89235 $1,340 $1,165
100% $34,500 $30,000 (r) A targeted rate set differentially in accordance with sections 16, 17, 18 of the Local Government Rating Act 2002 on all rateable land located between the boundaries of the Pororai river, State Highway 6 and the Tasman sea at Punakaiki calculated on the capital value of each rating unitfor maintenance of the sea wall protection works.
Punakaiki (Maintenance) Rating District Estimated Rateable Capital Value Differential Based on Benefits Factor per $ of Capital Value Calculated Yield GST ExclusiveClass A (Camping Ground) $720,000 1.00 0.011070 $7,970 $6,931Class A (Other) $4,605,000 1.00 0.011070 $50,978 $44,328Class B $2,304,000 0.65 0.007195 $16,578 $14,416Class C $2,320,000 0.60 0.006642 $15,409 $13,399Class D $5,515,000 0.30 0.003321 $18,315 $15,926
$109,250 $95,000
(s) A targeted rate set differentially in accordance with sections 16, 17, 18 of the Local Government Rating Act 2002 on all rateable land located between the boundaries of the Pororai river, State Highway 6 and the Tasman sea at Punakaiki calculated on the capital value of each rating unitfor maintenance of the sea wall protection works.
Punakaiki (Loan) Rating District Estimated Rateable Capital Value Differential Based on Benefits Factor per $ of Capital Value Calculated Yield GST ExclusiveClass A (Camping Ground) $720,000 1.00 0.048246 $34,737 $30,205Class A (Other) $4,605,000 1.00 0.001627 $7,494 $6,517Class B $2,304,000 0.65 0.001058 $2,439 $2,121Class C $2,320,000 0.60 0.000976 $2,265 $1,970Class D $5,515,000 0.30 0.000488 $2,689 $2,338
$49,624 $43,151
(t) A targeted rate set differentially in accordance with sections 16, 17, 18 of the Local Government Rating Act 2002 on properties included in the Hokitika River Southbank separate rating area calculated on the capital value of each rating unit, for repayment of the loan raised in 2017 tofinance the cost of the extension of the seawall.
Hokitika River South Bank Mtce Estimated Rateable Capital Value Differential Based on Benefits Factor per $ of Capital Value Calculated Yield GST ExclusiveArea A $2,614,000 1.00 0.00049 $1,290 $1,121Area B $3,018,700 0.10 0.00005 $149 $129
$1,438 $1,250 (u) A targeted rate in accordance with sections 16, 17, 18 of the Local Government Rating Act 2002 on all rateable land in the Franz Josef separate rating area calculated on the capital value of each rating unit for the maintenance of flood protection works.
Franz Josef Estimated Rateable Capital Value Factor per $ of Capital Value Calculated Yield GST Exclusive$97,683,500 0.00059 $57,500 $50,000
(v) A targeted rate in accordance with sections 16, 17, 18 of the Local Government Rating Act 2002 on all rateable land in the Lower Waiho 2010 separate rating area and calculated on the capital value of each rating unit for the maintenance of flood protection works.
Lower Waiho 2010 Estimated Rateable Capital Value Factor per $ of Capital Value Calculated Yield GST Exclusive$20,176,000 0.00479 $96,600 $84,000
(w) A targeted rate in accordance with sections 16, 17, 18 of the Local Government Rating Act 2002 on all rateable land in the Matainui Creek separate rating area and calculated on the capital value of each rating unit for the maintenance of flood protection works.
Matainui Creek Estimated Rateable Capital Value Factor per $ of Capital Value Calculated Yield GST Exclusive
$8,453,000 0.00068 $5,750 $5,000

51 West Coast Regional Council Annual Plan July 1, 2017 to June 30, 2018
(x) A Targeted rate in accordance with sections 16, 17 and 18 of the Local Government Rating Act 2002The Targeted Rate will be a uniform rate in the dollar set for all rateable land within the region and calculated on the Capital value of each rating unit.The rate will be used to fund Emergency Management activities within the Region.
Regional Emergency Management Estimated Rateable Capital Value Factor per $ of Capital Value Calculated Yield GST ExclusiveRateable Value of Land in the Buller District Local authority Area $2,203,389,000Rateable Value of Land in the Grey District Local authority Area $2,653,994,750Rateable Value of Land in the Westland District Local authority Area $2,415,713,400
$7,273,097,150 0.0001107 805,000 700,000
(y) A targeted rate in accordance with sections 16, 17, 18 of the Local Government Rating Act 2002 on all rateable land in the Mokihinui separate rating area calculated as a fixed charge of $306.67 per rating unit.
Mokihinui Estimated Number of Rating Units Amount per Rating Unit Calculated Yield GST Exclusive42 $306.67 $12,880 $11,200
(z) A targeted rate set differentially in accordance with sections 16, 17, 18 of the Local Government Rating Act 2002 on properties included in the Whataroa River separate rating area calculated on the capital value of each rating unit, for maintenance of the protection works.
Whataroa River Estimated Rateable Capital Value Differential Based on Benefits Factor per $ of Capital Value Calculated Yield GST ExclusiveArea A $8,591,000 1.00 0.00231 $19,817 $17,233Area B $14,098,000 0.40 0.00092 $13,008 $11,312Area C $33,471,000 0.20 0.00046 $15,474 $13,456
$48,300 $42,000
(aa) A targeted rate set differentially in accordance with sections 16, 17, 18 of the Local Government Rating Act 2002 on properties included in the New River /Saltwater Creek catchment separate rating area calculated on the capital value of each rating unit, for management of the river mouth.
New River/Saltwater Creek Catchment Estimated Rateable Capital Value Differential Based on Benefits Factor per $ of Capital Value Calculated Yield GST ExclusiveArea A $19,122,000 25.00 0.0000989 $1,891 $1,644Area B $248,760,500 1.00 0.0000040 $984 $856
$2,875 $2,500
(ab) A targeted rate set in accordance with sections 16, 17, 18 of the Local Government Rating Act 2002 on properties included in the Neil's Beach separate rating area calculated on the capital value of each rating unit, for management of the protection works.
Neil's Beach Estimated Rateable Capital Value Factor per $ of Capital Value Calculated Yield GST Exclusive12,386,000 0.0019684 24,380 21,200
24,380 21,200
(ac) Warm West Coast Targeted Rate A targeted rate in accordance with sections 16, 17 and 18 of the Local Government Rating Act 2002 on properties that have received Council funding to instal insulation and/or clean heating appliances.The rate is calculated as a % of the GST inclusive funding provided by Council to the property.Funding provided by Council includes interest at 5.25%.The rate will be used to repay funding that Council has borrowed to fund this work and will be levied over a 10 year term from 1 July 2013 or 1 July 2014, depending on the year that the funding was approved.
Warm West Coast Funding Received During years to 30 June 2013 and 30 June 2014
Council Funding Provided
Factor as a % of Council Funding Provided
Calculated Yield
GST Exclusive
$708,707 0.14928600 $105,800 $92,000

52West Coast Regional Council Annual Plan July 1, 2017 to June 30, 2018
(ad) Hokitika Seawall (Loan Repayment) A targeted rate set differentially in accordance with sections 16, 17, 18 of the Local Government Rating Act 2002 on all rateable land within the boundaries of the Hokitika Township calculated on the capital value of each rating unit for maintenance of the seawall protection works.
The targeted rate set on Classes A, B, C and D is based on differentiated capital value.
Estimated rateable Capital Value Differential Based on Benefits Factor per $ of Capital Value Calculated Yield GST ExclusiveA $16,128,000 1.00 0.00151 $24,305 $21,134B $47,328,000 0.75 0.00113 $53,492 $46,515C $15,562,000 0.60 0.00090 $14,071 $12,236D $355,726,000 0.10 0.00015 $53,606 $46,615
$145,475 $126,500
(ae) Hokitika Seawall (Maintenance)A targeted rate set differentially in accordance with sections 16, 17, 18 of the Local Government Rating Act 2002 on all rateable land within the boundaries of the Hokitika Township calculated on the capital value of each rating unit for repayment of the loan raised by the Council to construct the seawall protection works. The targeted rate set on Classes A, B, C and D is based on differentiated capital value.
Estimated Rateable Capital Value Differential Based on Benefits Factor per $ of Capital Value Calculated Yield GST ExclusiveA $16,128,000 1.00 0.00036 $5,764 $5,012B $47,328,000 0.75 0.00027 $12,685 $11,030C $15,562,000 0.60 0.00021 $3,337 $2,902D $355,726,000 0.10 0.00004 $12,713 $11,055
$34,500 $30,000Total Rates $4,884,939 $4,247,772

53 West Coast Regional Council Annual Plan July 1, 2017 to June 30, 2018
Rating Impact Ready Reckoner
Rate type Rate per $100,000 of Capital value
General Rate - Buller District Area $37.70
General Rate - Grey District Area $39.38
General Rate - Westland District Area $33.28
Regional Emergency Management Rate $11.07
Additional targeted rates may also apply, depending on whether your property is located within a separate rating area. Separate rating areas include various special rating areas (24) that involve river, sea, drainage or erosion protection works. Maps and asset management plans for these rating districts can be found on council’s website at www.wcrc.govt.nz.

54West Coast Regional Council Annual Plan July 1, 2017 to June 30, 2018
Charges Pursuant to Section 36 of the Resource Management Act Pursuant to section 36(1) of the Resource Management Act 1991 the West Coast Regional Council intends to fix charges from time to time on the basis of the reasonable costs incurred by the Council’s actions to which the charge relates.
The Council has resolved to fix charges based on a formula of an hourly rate fixed for the particular officer or consultant undertaking the function multiplied by the number of hours which are required to undertake the function. In some cases, the hourly rate specified will not be sufficient to recover the Council’s full actual and reasonable costs.
For some specific activities relating to resource consents, a fixed fee applies.
Where the formula is inadequate to enable the Council to recover the actual and reasonable costs incurred by the Council then an additional charge may be imposed under section 36(3) of the Act. Those additional charges will be passed on having regard to the matters contained in section 36(4) of the Act.
Section 36(5) of the Act provides that the Council may in any particular case at it absolute discretion remit the whole or any part of the charge, including fixed and additional charges which would otherwise be payable. It should also be noted that the Council is entitled to withhold the issue of a resource consent until such charges are paid under section 36(7) of the Act. It is also able to request charges to be paid prior to performing any action to which the charge relates (in addition to the deposit fees set in Table 1 above).
An applicant or a resource consent holder may object to any additional charge imposed under s36(3) pursuant to section 357 of the Act to the Council and if further dissatisfied with the Council’s charges may appeal to the Environment Court under section 358 of the Act.
The Council must fix charges from time to time for carrying out of certain functions by resolution and procedures in the Local Government Act. There is no right to object to charges once they are fixed.
Fixed FeesPursuant to section 36(1) the Council has fixed the charges for the following functions based on fixed rates listed below (all amounts shown exclusive of GST).
(A) Receiving, processing and granting of applications for resource consents, certificates of compliance, changes or cancellation of conditions, transferring consents to new locations, review of conditions, surrenders of consent and extensions of lapsing periods of consents.Council officers $120 per hourCouncil senior officers $140 per hourCouncil managers $200 per hourCouncil clerical support staff $90 per hour
Independent consultants at $350 per hour – (not more than)
Note that Council engages consultants for:• Receiving and processing resource consent applications• Providing any report under section 42A or 92 of the Resource Management Act• Peer review of Council employees reports• Providing advice on technical aspects of any application
Council Hearings and/or decisions undertaken by one or more councillors, at hourly rates as determined from time to time by the Remuneration Authority (currently $80 / hour for Councillors and $100 / hour by the Chairperson of a hearing).
Independent Hearing Commissioners at (not more than) $1400 per day/per Commissioner. Legal advice at $350 per hour (not more than).

55 West Coast Regional Council Annual Plan July 1, 2017 to June 30, 2018
In addition:• File establishment fee $50 (excluding applications for changes or cancellation of conditions, surrenders of
consent and extensions of lapsing periods of consents)• Vehicle mileage at 75 cents per kilometre• The actual cost of hire or use of any other mode of transport required during the processing of the application,
e.g. Aircraft and boat hire• Advertising, erecting site notices and telephone tolls at cost• Photographs and Laboratory costs at cost• Venue hire, including any catering required for the hearing at cost• Technical equipment hire and use, (including but not limited to Overhead Projectors, teleconferencing and
audio visual equipment) at cost• Accommodation and meals at cost• Postage & Courier costs at cost• Photocopying at 5c/copy or 20c/colour copy
NB. In the event that the charges fixed under this special order are inadequate to enable the Council to recover its actual and reasonable costs for carrying out its functions the Council will render an additional charge pursuant to section 36 (3) of the Resource Management Act 1991.
The Council reserves the right not to perform any action to which any of the above charges relate until the charge has been paid in full, pursuant to section 36(7) of the Resource Management Act.
(B) Annual Consent holder administration feeOnce a resource consent is granted under A above, an annual consent administration fee is set at $55 per consent file. This covers the on-going cost of compiling and monitoring of accounts, dealing with general enquiries, maintaining consents and compliance databases and other general administration relating to each resource consent file held. This applies to all current consents held.
(C) Notwithstanding (A) above, the following the fees apply for certain consent transfers:• Transfer of consents and permits to another person: $50• Transfer of whitebait consents and permits to another site, or another person: $100
NB: These fees are required to be paid at the time of submitting the transfers.
NB. In the event that the charges fixed under this special order are inadequate to enable the Council to recover its actual and reasonable costs for carrying out its functions the Council will render an additional charge pursuant to section 36(3) of the Resource Management Act 1991.
The Council reserves the right to not perform any action to which any of the above charges relate until the charge has been paid in full, pursuant to section 36(7) of the Resource Management Act.
(D) Supervision and monitoring of resource consents, including the preparation and service of any abatement or enforcement proceedings required to ensure compliance with the terms and conditions of resource consents.Council officers $120 per hourCouncil senior officers $140 per hourCouncil managers $200 per hourCouncil clerical support staff $90 per hour
Independent consultants engaged by the Council: Not more than $350 per hour.
Legal advisers: Not more than $350 per hour.
In addition:• The actual cost of hire or use of any other mode of transport e.g. Aircraft and boat hire• Vehicle mileage at 75 cents per kilometre• Advertising at cost• Laboratory costs at cost• Telephone tolls at cost• Accommodation and meals at cost• Postage & courier costs at cost

56West Coast Regional Council Annual Plan July 1, 2017 to June 30, 2018
• Photographs at cost• Photocopying at 5c/copy and 20c/colour copy
NB. In the event that the charges fixed under this special order are inadequate to enable the Council to recover its actual and reasonable costs for carrying out its functions the Council will render an additional charge pursuant to section 36(3) of the Resource Management Act 1991.
(E) Notwithstanding D above, the following fixed compliance monitoring charge will apply to all holders of whitebait stand resource consents:An annual Consent Monitoring fee of $150 per annum applies to each consent holder.
(F) Notwithstanding D above, the following fixed compliance monitoring charge will apply to all holders of gravel extraction consents as of 1 July 2016:As of 1 July 2016 a new annual charge applied to anyone holding a current consent for gravel extraction, according to the table below. This charge covers compliance inspection visits and any advice needed from in-house river engineers. Charges under D above will also apply if additional staff time needs to be spent dealing with any non-compliance with consent conditions.
Volume of consented take (m3) Annual monitoring fee
Less than 2,000 $150
2,000 – 3,999 $300
4,000 – 7,999 $500
8,000 -15,000 $750
Over 15,000 $1,000
(G) Application for preparation or change of a policy statement or plan.• Preparation of a plan $10,000• Change of policy statement or plan $10,000
The fees are required to be paid at the time of submitting applications.
NB. In the event that the charges fixed under this special order are inadequate to enable the Council to recover its actual and reasonable costs for carrying out its functions the Council will render an additional charge pursuant to section 36(3) of the Resource Management Act 1991.
(H) The provision of information in respect of plans and resource consents payable by persons requesting information, which includes but is not limited to pre and post consent application advice, advice on regional plans, and any enquiries regarding resource consents or plans.Council officers $120 per hourCouncil senior officers $140 per hourCouncil managers $200 per hourCouncil clerical support staff $ 90 per hour
In addition:• Vehicle mileage at 75 cents per kilometre• Tolls at cost• Photographs at cost• Photocopying at 5c/copy or 20c/colour copy
Except that information for general education and public use there will be no charge for the first half hour of Council time or for the first 10 A4 photocopies.

57 West Coast Regional Council Annual Plan July 1, 2017 to June 30, 2018
(I) Charges for the supply of documents are as follows:All Regional Plans and Strategies and the Regional Policy Statement (operative and/or proposed) will be supplied at a price of $35 per volume.
Note that all Regional Plans and Strategies, and State of the Environment Reports are all available on the Council website.
Charges under Sections 12 and 150 Local Government Act 2002(A) Dairy Effluent Inspection
Council charges $300 plus GST for Dairy Shed inspections required under Rule 13 of the Regional Plan for Discharges to Land and Rule 73 of the proposed Land and Water Plan. In the event of an inspection revealing non-compliance with these rules, Council will charge any follow-up action in accordance with the costs specified in (D) below.
(B) Assessment of Onsite Sewage DischargesCouncil charges $125 + GST for assessments as to whether or not proposed onsite sewage discharges meet Rule 6 of the Regional Plan for Discharges to Land where no site inspection is undertaken or $250 + GST where a site inspection is undertaken.
(C) Mining Privileges (All amounts shown exclusive of GST)
The following charges are payable by holders of mining privileges and coal mining privileges issued under the Crown Minerals Act 1991, Mining Act 1971 or the Coal Mines Act 1979 and relate to the monitoring and enforcement of privilege conditions, the approval of privilege surrenders and disbursement of bonds and including operations for expiry or forfeiture of any privilege.
Council officers $120 per hourCouncil senior officers $140 per hourCouncil managers $200 per hourCouncil clerical support staff $90 per hour
Independent consultants and legal advisors at not more than $350 per hour.
In addition:• Vehicle mileage at 75 cents per kilometre• Laboratory charges at cost• Tolls at cost• Photographs at cost• Photocopying at 5c/copy, or 20c/colour copy
(D) Environmental Incidents (Complaints) and Clean Up (All amounts shown exclusive of GST)The following charges are payable by persons found to be in breach of regional rules or the Resource Management Act 1991.
Council officers $120 per hourCouncil senior officers $140 per hourCouncil managers $200 per hourCouncil clerical support staff $90 per hour
Independent consultants and legal advisors at not more than $350 per hour.
In addition:• Vehicle mileage at 75 cents per kilometre• The actual cost of hire or use of any other mode of transport, e.g. aircraft and boat hire• The actual cost of mitigating the effects of and cleaning up or remedying the environmental incident.• Laboratory costs at cost• Purchase, hire and maintenance of equipment specially required for the monitoring of the incident.• Accommodation and meals at cost• Photographs at cost

58West Coast Regional Council Annual Plan July 1, 2017 to June 30, 2018
• Printing (including provision of information in electronic format) at cost.• Photocopying at 5c/copy, or 20c/colour copy
(E) Local Government Official Information Requests (all amounts shown exclusive of GST)The following charges are payable by persons requesting information under the Local Government Official Information and Meetings Act 1987 (first half hour of staff time not charged)
Council officers $120 per hourCouncil senior officers $140 per hourCouncil managers $200 per hourCouncil clerical support staff $90 per hour
• Photographs at cost.• Printing (including provision of information in electronic format) at cost• Photocopying at 5c/copy, or 20c/colour copy
Charges under Section 33(1) of the Building Act 2004(A) Building Consent Applications for Dams.
Building Consent Applications for dams are processed by Otago Regional Council and their charges will be applied.
(B) Project Information Memorandum for a Dam (All amounts shown exclusive of GST)
1. Preliminary fixed charge payable at the time of lodging an application for a Project Information Memorandum for a dam $1000
2. Fixed charge for the issue of a Resource Management Certificate under Section 37, Building Act 2004. $100
Additional costs and expenses:
Staff time will be charged out at the following rates:Council officers $120 per hourCouncil senior officers $140 per hourCouncil managers $200 per hourCouncil clerical support staff $90 per hour
In addition:• Consultants at cost• Legal advice at cost• Vehicle mileage at 75 cents per kilometre • Photocopying at 5c/copy, or 20c/colour copy• Disbursements at cost
The charges are payable when the application is lodged. Applications will not be processed until the Council receives the appropriate amount.
The Council may, in any particular case and at its absolute discretion, remit all or any part of the fees which would otherwise be payable under this section.
Where the charge is inadequate to recover the Council’s reasonable and actual costs, it may also require under Section 33, Building Act 2004 an additional charge to be paid.
Charges for major consent applications may be significantly in excess of the prescribed amounts. Wherever possible, applicants will be informed of extra costs in advance.
Additional charges may consist of any processing costs including staff time, disbursements, legal charges and consultant(s) fees. Before using consultants to process applications staff shall consult with the applicant and advise of the likely cost.

59 West Coast Regional Council Annual Plan July 1, 2017 to June 30, 2018
Other ChargesRegional Pest Plant Management StrategyThe Council’s Regional Pest Plant Management Strategy was made operative in December 2010.
The cost of site inspections in response to complaints can be recovered from the land occupier as set out in section 5.3 of that Strategy (i.e. where a land owner fails to comply with a Notice of Direction).
Malicious or vexatious complaints may also be charged the cost of undertaking inspections, as set out under section 6.7 of the Strategy.
Quarry chargesThe Council operates various quarries to ensure rock availability for river protection works. Council reserves the right to adjust the price per tonne of rock from any particular quarry, at any time, in order to recover the full costs of managing these quarries, including the cost of any development planning, health and safety requirements and remediation works.

388 Main South Road, Paroa, PO Box 66, GreymouthFreephone: 0508 800 118www.wcrc.govt.nz