west atarat reek dam final design report atarat reek dam final design report prepared for: ... or a...
TRANSCRIPT
DAMsel In Distress Engineering 2112 S Huffer Ln
Flagstaff, AZ 86011 (520) 981-9515
WEST CATARACT CREEK DAM FINAL DESIGN REPORT
Prepared for:
Dr. Charles Schlinger Mr. Mark Lamer
TABLE OF CONTENTS
Contents
Acknowledgements ______________________________________________________________________________________ 1
Project Description ______________________________________________________________________________________ 2
Background _______________________________________________________________________________________________ 4
Analysis ___________________________________________________________________________________________________ 6
Conclusion _______________________________________________________________________________________________ 17
Final Recommendations ________________________________________________________________________________ 18
Summary of Project Costs ______________________________________________________________________________ 19
References _______________________________________________________________________________________________ 21
ACKNOWLEDGEMENTS
Page 1
Acknowledgements
Throughout the course of this project, our team would not have been able to progress as
well as we did without the help of several professionals in this field. Firstly we would like
to thank the Arizona Department of Water Resources (ADWR), for giving us vital
documents regarding the dam’s construction, various inspections, blueprints, and
improvements that have occurred from 1946 to 2007. We would also like to thank Craig
Brown, dam safety inspector for ADWR, for his helpfulness. When our team needed the
most recent information, Craig Brown was able to ensure that we gained access to all of
the more recent documents from 2007 to 2013, including ADWR’s 2013 Dam Break
Analysis.
It is also important to acknowledge the help from our technical advisor and capstone
professors, Dr. Charles Schlinger, whose technical guidance pointed our team in the right
direction and aided our analysis. Our team would also like to thank our other capstone
professors, Dr. Wilbert Odem, Mark Lamer, and Dr. Bridget Bero, who gave us
constructive criticism and valuable feedback that helped our team strive to become
better.
PROJECT DESCRIPTION
Page 2
Project Description
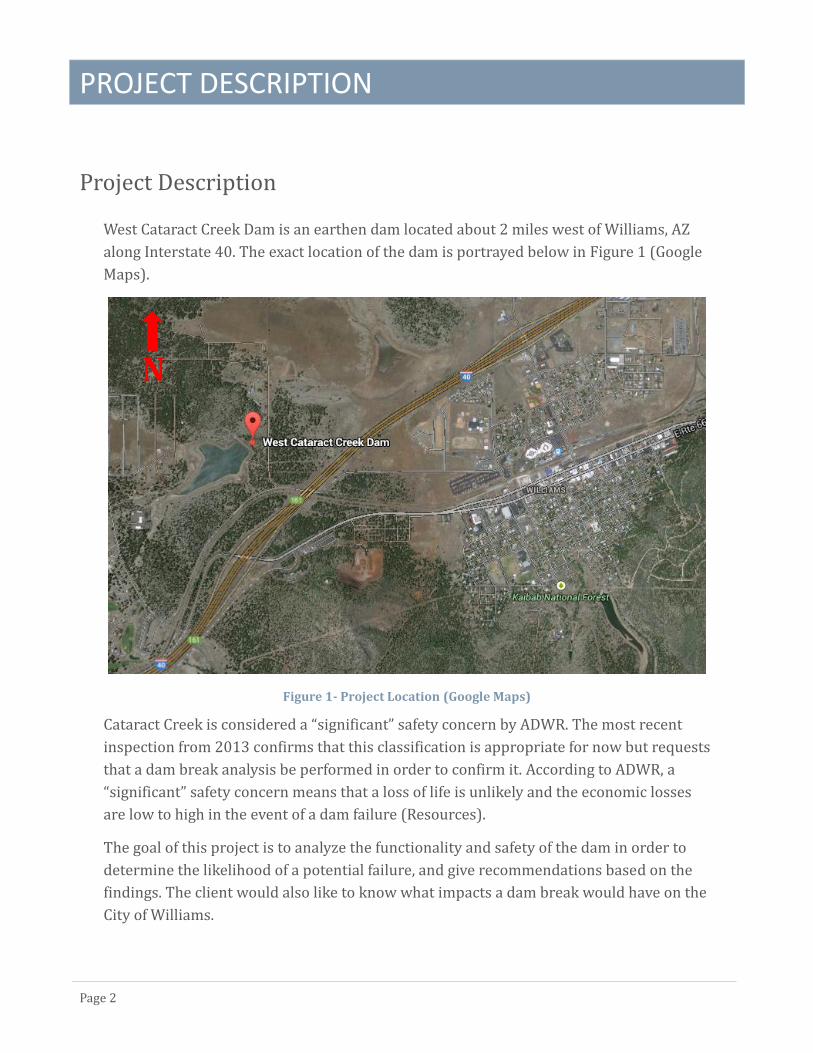
West Cataract Creek Dam is an earthen dam located about 2 miles west of Williams, AZ
along Interstate 40. The exact location of the dam is portrayed below in Figure 1 (Google
Maps).
Figure 1- Project Location (Google Maps)
Cataract Creek is considered a “significant” safety concern by ADWR. The most recent
inspection from 2013 confirms that this classification is appropriate for now but requests
that a dam break analysis be performed in order to confirm it. According to ADWR, a
“significant” safety concern means that a loss of life is unlikely and the economic losses
are low to high in the event of a dam failure (Resources).
The goal of this project is to analyze the functionality and safety of the dam in order to
determine the likelihood of a potential failure, and give recommendations based on the
findings. The client would also like to know what impacts a dam break would have on the
City of Williams.
N
PROJECT DESCRIPTION
Page 3
After a complete background check on the dam’s history, four failure modes were chosen
for the analysis based on the likelihood of their occurrence. These failure modes consist
of: slope stability, overtopping, spillway failure, and internal erosion. All topography,
geometry, geotechnical, and hydrological data necessary to complete these analyses will
be collected by DAMsel in Distress Engineering. The four failure modes are also classified
as either a sunny-day failure, or a rainy day failure.
CURRENT CONDITION
The dam’s geometry has not changed since improvements made in 1968.
Currently there are two issues with the dam facility. The first issue involves the outlet
pipes below the dam. The valves at the end of the pipes are out of service and there is a
lack of an upstream valve which causes water pressurization within the pipes. Second,
there is no Emergency Action Plan (EAP) for the community downstream in the event of
a dam breach.
CONSTRAINTS AND LIMITATIONS
A couple constraints and limitations have occurred throughout this project. One of the
main limitations occurred during surveying. The closest benchmark to the project site
was across Interstate 40 and DAMsel in Distress Engineering did not have the
appropriate equipment to tie into it. Without this benchmark, the true elevations
obtained through surveying are unknown. An alternative method was also unsuccessful;
the closest base station was out of range for a Network GPS Survey. However even with
these constraints, elevations and distances relative to one another were still able to be
accurately recorded.
Another constraint had to do with obtaining documents from the appropriate parties.
Arizona Department of Water Resources only had digital copies of the records through
2007. Documents from 2007 to the present day were obtained from Craig Brown at a
much later during this project’s lifetime.

BACKGROUND
Page 4
Background
The dam was constructed from May 4, 1947 to November 30, 1947 in order to impound
Cataract Lake for water storage and recreational purposes. The analysis that was used to
design the dam included factoring in values for drainage area, discharge, runoff, design
storms, and soils information. In 1967, a design analysis was done to determine the
effectiveness of the dam. From March 1, 1968 to May 1, 1968, a two foot tall concrete
weir was added to the spillway along with a few feet on the crest of the dam. Both designs
(the original and the revision) evaluated the dam to the 100 year storm event.
Figure 2- 1968 As-Built Improvements (ADWR)
Various inspections were performed from 1978 to 2011. In the more recent inspections,
the dam was flagged for having pressurized pipes running through it and for not having
an Emergency Action Plan (EAP) in place.
In 1982, Gonzalez Estate was constructed, and was being used to attenuate any
overtopping flow from the Cataract Creek Dam.
In 2005, the spillway was widened, to a total bottom width of 80 feet. Freeboard was
noted during an inspection to be 8.3 feet.

BACKGROUND
Page 5
In 2013, ADWR performed a dam break analysis detailing the effects on downstream
conditions in case of a dam failure.
A complete summarized chronology of the dam’s history can be found in Appendix A.
ANALYSIS
Page 6
Analysis
SURVEYING
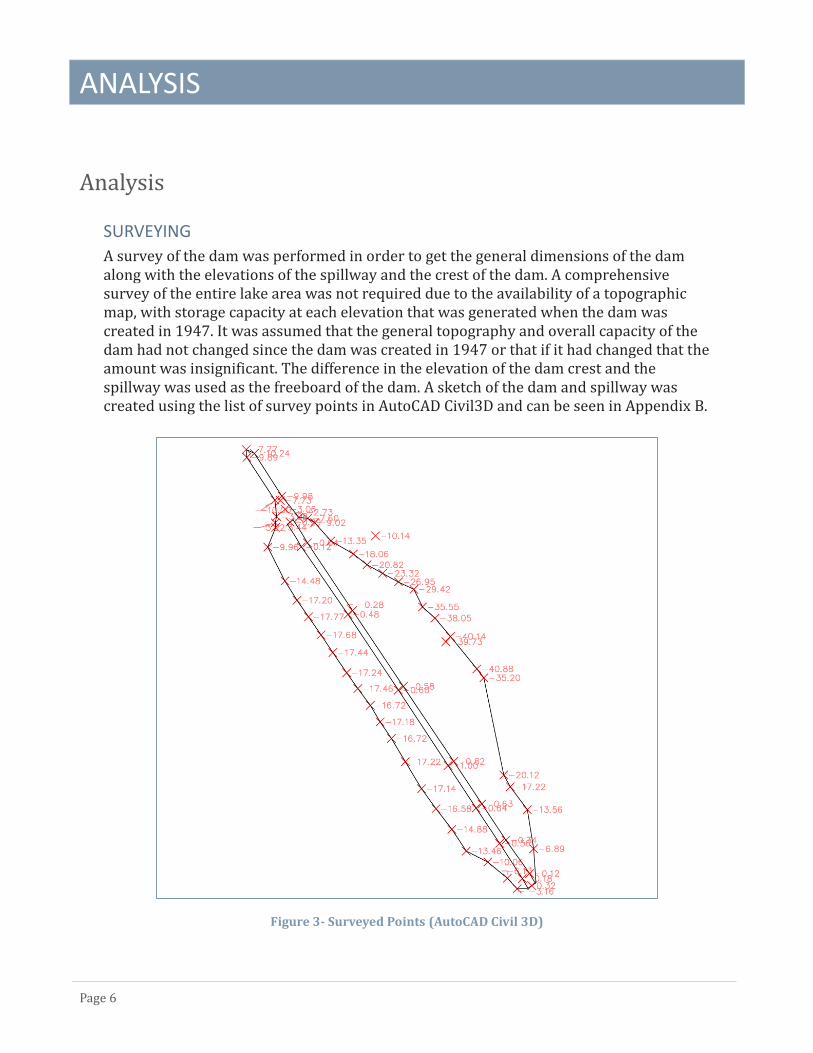
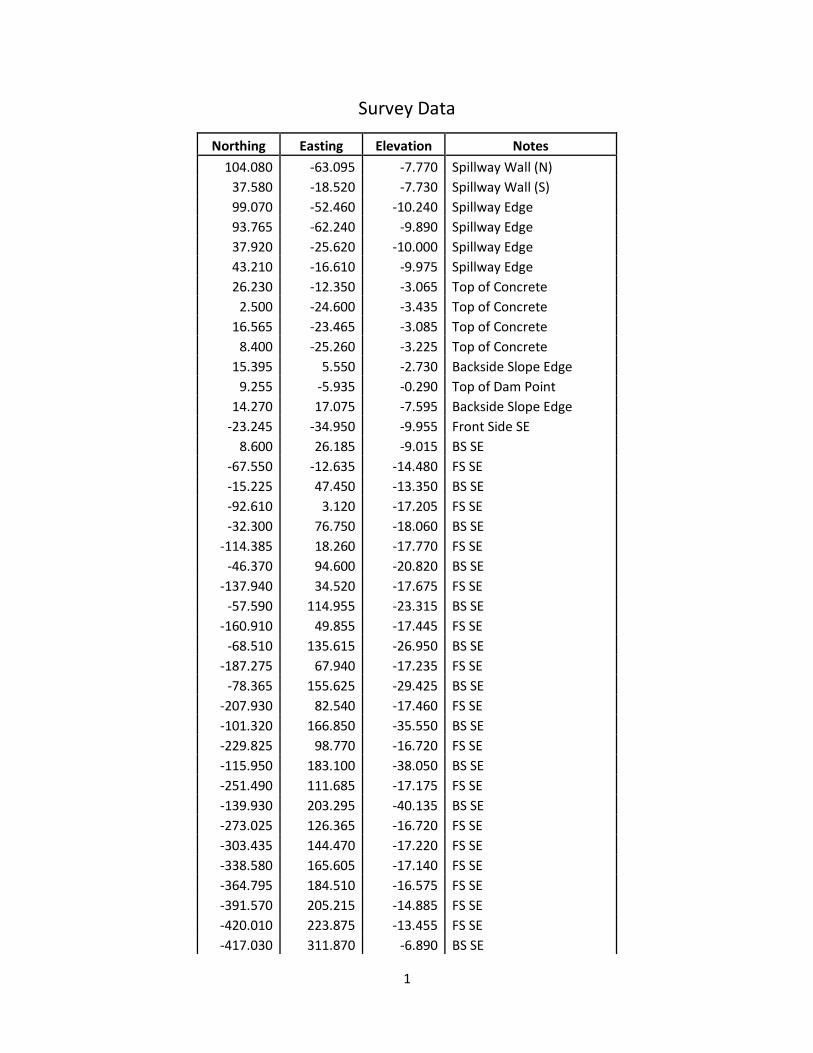
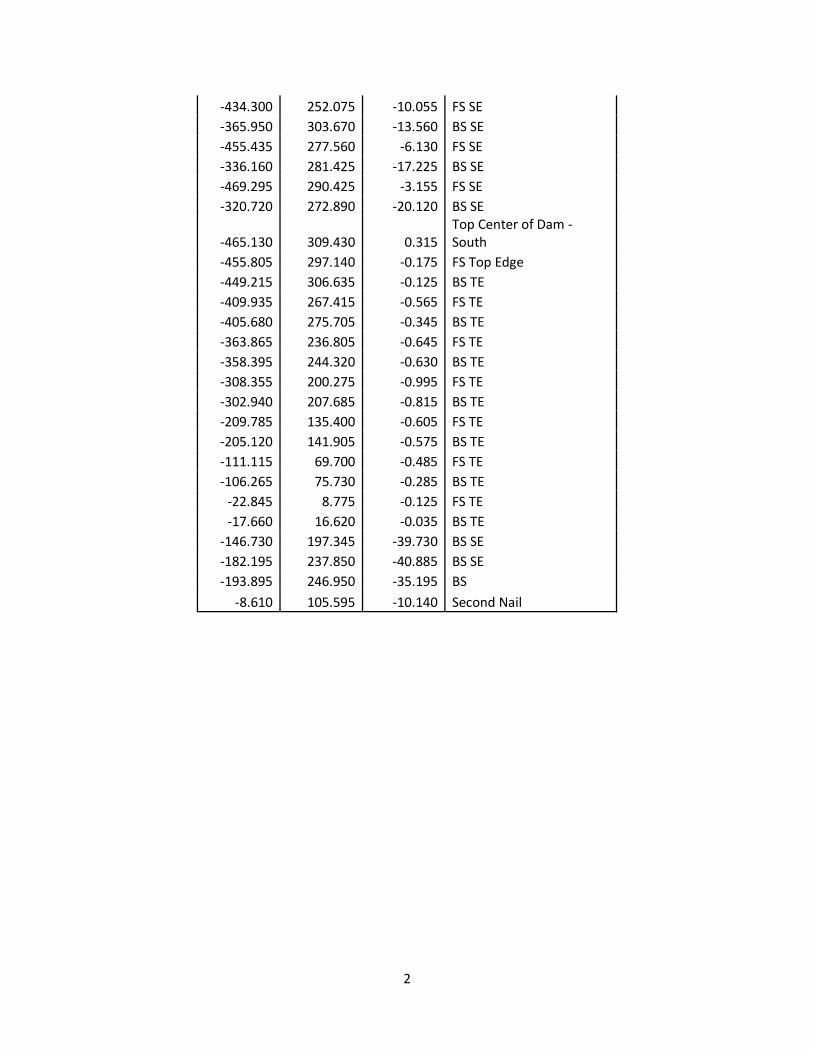
A survey of the dam was performed in order to get the general dimensions of the dam along with the elevations of the spillway and the crest of the dam. A comprehensive survey of the entire lake area was not required due to the availability of a topographic map, with storage capacity at each elevation that was generated when the dam was created in 1947. It was assumed that the general topography and overall capacity of the dam had not changed since the dam was created in 1947 or that if it had changed that the amount was insignificant. The difference in the elevation of the dam crest and the spillway was used as the freeboard of the dam. A sketch of the dam and spillway was created using the list of survey points in AutoCAD Civil3D and can be seen in Appendix B.
Figure 3- Surveyed Points (AutoCAD Civil 3D)
ANALYSIS
Page 7
HYDROLOGY
Hydrology data for the area surrounding West Cataract Lake needed to be found and
analyzed in order to approximate the impact any given flood would have on Williams,
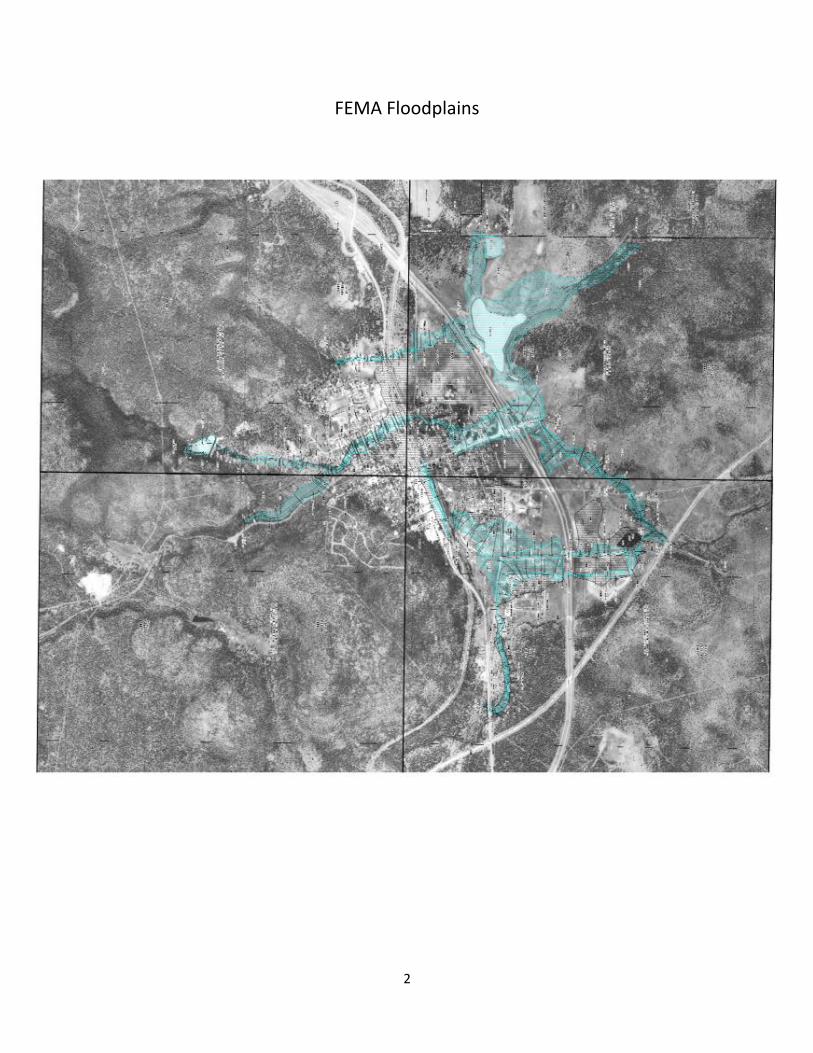
Arizona. The first step taken to find hydrologic data was to access the Federal Emergency
Management Agency’s website. From the FEMA website, four floodplain maps for the City
of Williams were collected and imported together into AutoCAD Civil 3D in a way that
showed the entirety of the floodplains affecting Williams. In this way, it would be a
simpler task to imagine the results of a dam break, since the existing floodplains would
be heavily compounded by the water coming from the dam. These FEMA maps can be
viewed in Appendix C (FEMA).
In addition to analyzing the floodplain maps from FEMA, National Streamflow Statistics
software was used for the dam’s regional area. The NSS software was used to achieve
preliminary rough estimate hydrographs that would give a range of inflows into the
reservoir. The values generated by the NSS software can also be viewed as part of
Appendix C (NSS). Since these inflow hydrographs were very rough estimates and
required minimal input, further analysis had to be completed using real storm data as
well as actual conditions of the project area. This process will be explained further in the
section titled “Overtopping”.
SLOPE STABILITY
A slope stability analysis evaluates a slope for failure using specific soil properties such
as cohesion, friction angle, and soil classification, and is considered a sunny day failure. In
a slope stability failure, a portion of the slope shears off at the weakest plane or slip
surface. This type of failure would significantly reduce the capacity of the dam by
eliminating portions of the cross sectional area. Typically, steeper slopes with weaker soil
are the most susceptible to this type of failure. It is important to consider slope stability
as a major failure mode for West Cataract Creek Dam since it has a relatively steep slope
and because the properties of the soil that makes up the dam are unknown.
One of the most popular programs to evaluate slope stability is Slide by Rocscience. The
methods within Slide used by the team for the slope stability analysis were the simplified
Bishop and Janbu methods. Slide requires the user to input a two dimensional cross
section of the slope in question along with soil properties, and any reservoirs or water
ANALYSIS
Page 8
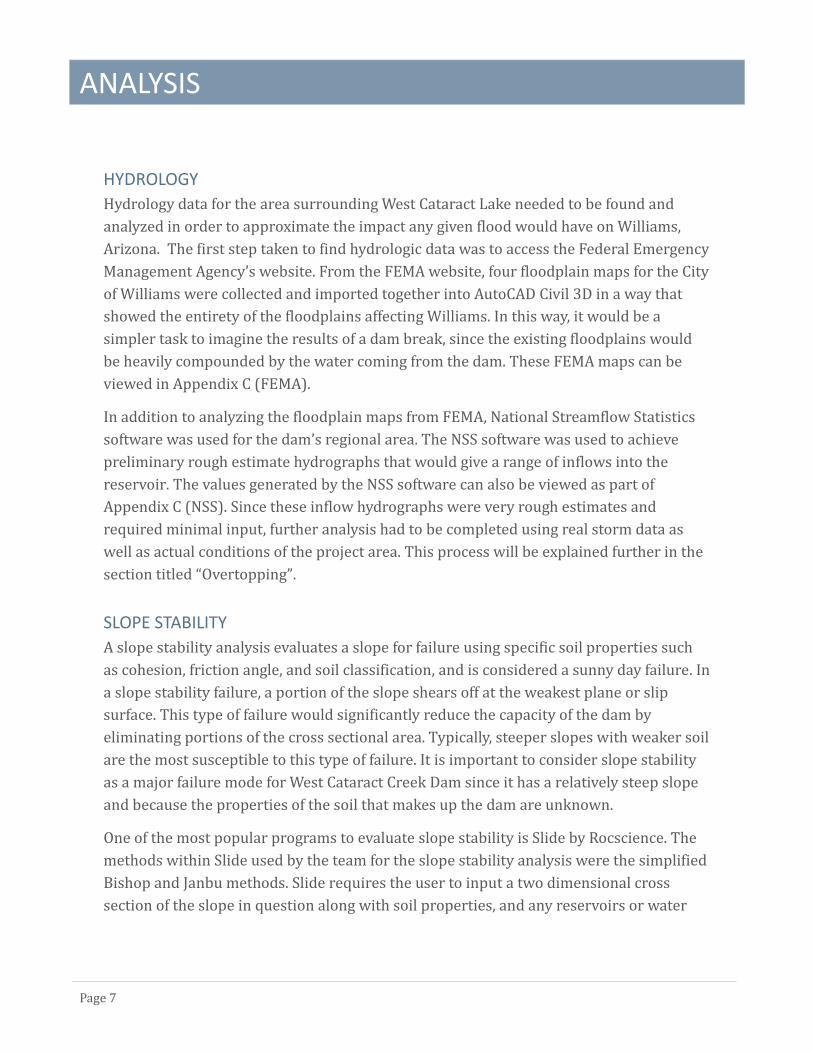
tables relevant. The cross section for West Cataract Creek Dam was created by scaling off
a contour map of the dam from the as-built drawings. This cross section was put into the
software along with the reservoir at full capacity as shown in Figure 4, below.
Figure 4 - Slide Input (RocScience)
Soil properties were assumed since no soils report for the composition of the dam was
provided and soil samples were not taken as a part of the project. Initially, the general
properties of clayey gravel (GC) and clayey sands (SC) were assumed based on a report of
the soil found in the surrounding area of the dam. These properties yielded high factors
of safety so more conservative properties were assumed. The final model in the Slide
software used unconsolidated, undrained soil with a friction angle of zero. Results from
the Slide software display the slip surface factors of safety in a color-coded gradient,
ranging from red to blue for low to high factors of safety, respectively. Outputs from the
software for the front and back slopes can be found in Figures 5 and 6, below.

ANALYSIS
Page 9
Figure 5 - Slide Ouput - Front Slope (RocScience)
Figure 6 - Slide Output - Back Slope (RocScience)
The factors of safety of the worst case slip surfaces throughout the dam from the front
and from the back were 3.6 and 1.6, respectively. Both of these values are above the
required factor of safety of 1.5, resulting in a stable dam. This method of analysis can only
show an estimate of the slope stability since the soil properties were assumed, however,
conservative values were used to increase the confidence in the results.

ANALYSIS
Page 10
OVERTOPPING
Overtopping is a rainy day failure when the spillway capacity of a reservoir is met and
exceeded causing water from the reservoir to start flowing over the crest of the dam.
Bentley PondPack was the main tool used to analyze the reservoir and spillway capacities
for multiple recurrence interval storms under different conditions of the watershed. This
software was chosen for the analysis because an accurate model reflecting the project
area could be created, as well as the software was able to run both Pre-Burn and Post-
Burn scenarios next to each other. The first step to complete this analysis was to access
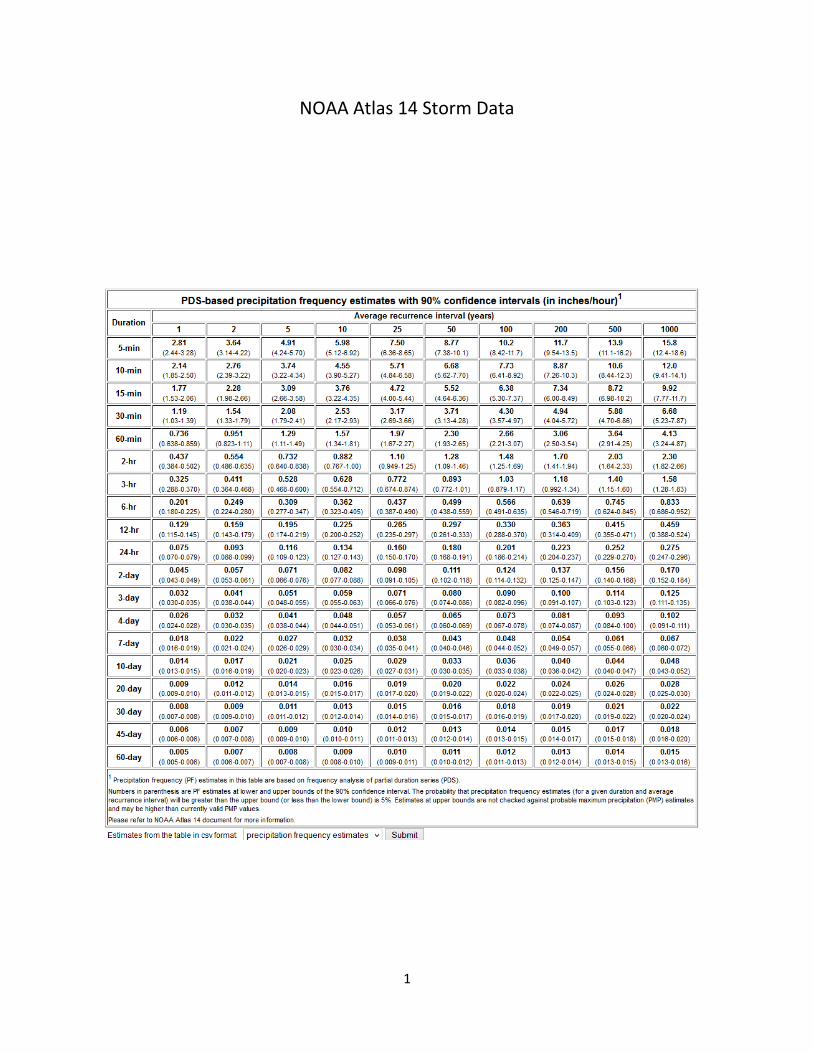
NOAA Atlas 14 in order to get storm data for Williams, Arizona. NOAA Atlas 14 provided
the team with rainfall intensities for many different recurrence interval storms for
multiple storm durations. The storm data table used for this analysis can be found in
Appendix D of this document. Once the storm data was obtained, the next step the team
needed to take was to delineate the watershed that feeds West Cataract Lake and
compare it to the value that was found in the obtained ADWR documents. In order to do
this, a topographic map of the project area was obtained from the ArcGIS website and
imported it into AutoCAD Civil 3D. Once the map was in Civil 3D, the contour lines were
followed in order to find the total area of land that feeds into West Cataract Lake. The
total area of the watershed found by DAMsel in Distress Engineering was 6.02 square
miles which was very close to the area of the watershed found by ADWR. A map of the
delineated watershed can be found in Appendix D of this report. After the total
watershed was found, it was decided to split the watershed into two separate catchment
areas with the Interstate 40 as the dividing line. After this division was completed, the
areas of the two new watersheds were found to be 3.52 square miles for the catchment
south of Interstate 40 and 2.50 square miles for the catchment north of Interstate 40.
Once the watershed was divided into two, the time of concentration needed to be found
for each of the catchments. Time of concentration was found using the Kirpich Equation
(Bains):
𝑇𝑐 = 0.0078𝐿0.77𝑆−0.385
Where Tc is the time of concentration in minutes, L is the maximum length of flow in feet,
and S is the watershed gradient in feet per foot or the difference in elevation between the
most remote point of the watershed and the outlet into the reservoir divided by the
maximum length of flow. The following table shows the input values for each catchment,
as well as the obtained time of concentration used to create the PondPack model.

ANALYSIS
Page 11
Table 1 - Time of Concentration Calculation
Catchment Length of Flow Gradient Time of Concentration
North of I-40 13,709 feet 0.0603 ft./ft. 35.25 minutes
South of I-40 25,344 feet 0.0825 ft./ft. 50 minutes
After getting acquainted with the PondPack software, it was decided to use the SCS Curve
Method in order to predict direct runoff and infiltration from each catchment. The SCS
Curve Method was created by the Soil Conservation Service and is based on the area’s
hydrologic soil group, hydrologic condition and land use. Since the team was asked to
compare pre-burn and post-burn catchment conditions, two SCS Curve Numbers needed
to be found. Using a study completed by the U.S. Forest Service Coronado National Forest
that incorporated the WILDCAT4 model for runoff and infiltration and was used to
estimate peak flow runoff for pre- and post-burn conditions on a fire that occurred in
Arizona, curve numbers of 67.00 and 90.00 were used for pre- and post-burn conditions
respectively (Greenberg and Hawkins). These two values were obtained by knowing that
the hydrologic soil group of the two catchments were classified as a “C” as well as taking
into account a high severity burn, since Northern Arizona is prone to wildfires.
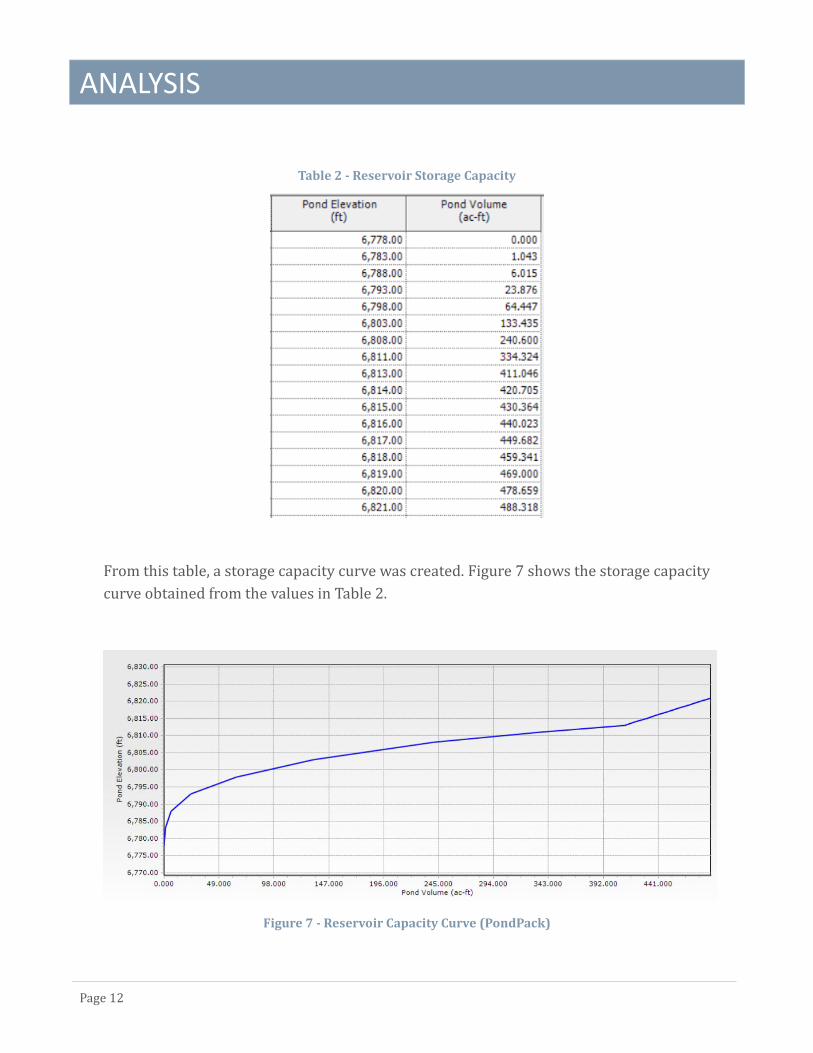
After all the information was found for the catchments, a storage rating curve for the
reservoir of West Cataract Lake needed to be calculated. ADWR simplified this process by
provided storage capacities from the pond invert to the crest of the weir in the spillway,
however linear interpolation needed to be done in order to estimate the capacity of the
reservoir from the crest of the spillway weir to the crest of the dam. The following table
show the values that were obtained for the reservoir storage, in acre-feet, compared to
the water surface elevation.
ANALYSIS
Page 12
Table 2 - Reservoir Storage Capacity
From this table, a storage capacity curve was created. Figure 7 shows the storage capacity
curve obtained from the values in Table 2.
Figure 7 - Reservoir Capacity Curve (PondPack)

ANALYSIS
Page 13
Once the reservoir capacity was found for water surface elevations up to the crest of the
dam, the emergency spillway capacity was calculated in order to find the peak flow the
spillway can pass without causing the headwater to back up and flow over the crest of the
dam. Since a weir was constructed in the spillway to increase the capacity of the
reservoir, the Broad-Crested Weir Equation was used to calculate outflow values that the
spillway can adequately pass. This equation is:
𝑄 = 𝐵 (2
3)
32⁄
(𝑔)12⁄ (𝐻)
32⁄
Where Q is the outflow in cubic feet per second (cfs), B is the width of the weir in feet, g is
gravitational acceleration in feet per square second, and H is the water surface elevation
above the crest of the weir in feet. Using a weir width of 80 feet that was obtained during
the survey process, as well as a gravitational acceleration of 32.2 ft/s2, Table 3 shows the
outflow values obtained using the Broad-Crested Weir Equation.
Table 3 - Outflow Capacity Table
From the table above, it can be seen that the emergency spillway can handle a maximum
outflow capacity of 5592.75 cfs at the water surface elevation equal to the crest of the
dam.

ANALYSIS
Page 14
After the storm data, catchment areas, reservoir capacity and spillway capacity were
entered into the PondPack model, which a layout can be found in Appendix D, models
were run for the 1, 2, 5, 10, 25, 50, 100, 200, 500 and 1000 year recurrence interval
storms for both pre- and post-burn conditions. Table 4 shows the relevant storms and
outputs from PondPack for pre-burn conditions to show that the spillway is adequate to
pass outflows from every recurrence interval storm, including the 1000 year storm.
Table 4 - PondPack Output Table for Pre-Burn Conditions
After the pre-burn model was run, a post-burn model was completed to compare what
would happen when the watershed experienced a severe burn. Table 5 shows the
relevant storms and outputs from PondPack for post-burn conditions to show the
adequacy of the spillway for the post-burn conditions.
Table 5 - PondPack Output Table for Post-Burn Conditions
ANALYSIS
Page 15
It can be seen from the two tables above that the spillway is adequate to pass flows from
any storm under pre-burn conditions, and can pass the flows from all storm events
excluding the 500 and 1000 year event after the watershed experiences a severe burn.
SPILLWAY FAILURE
Spillway Failure is another rainy day failure, defined as a scenario in which the existing
concrete weir is removed during a return event. This was analyzed as a follow up to the
overtopping analysis, because the consequences of a spillway failure would be the most
critical during a large storm. The PondPack model set up for the overtopping analysis was
used again, but starting elevation was defined as the pond invert, as opposed to the
previously used 6811. This is because 6811 was chosen based on the bottom elevation of
the concrete weir, but a spillway failure necessitates the weir being removed. Using both
pre-burn and post-burn situations, it was clear that the removal of the concrete weir
would make a substantial difference, causing much more water to pass by the dam and go
on to potentially damage something downstream. The spillway failure analysis revealed
that a 100 year storm in a pre-burn scenario, or a 5 year storm in a post-burn scenario
would result in flows high enough to produce 2.5 feet of water going through the spillway
unhindered.
INTERNAL EROSION
Evidence of seepage at the dam site has led to concerns of internal erosion, which would
be a sunny day failure. The seepage that was identified on the downstream side of the
dam did not contain visible particles of soil and was insufficient to cause internal erosion.
For this reason internal erosion was omitted from the analyses performed on the dam. A
flow net analysis is a way to estimate seepage velocities through a dam cross-section.
This method requires known soil properties, which the team was not given, making this
method of analysis difficult to perform. If soil properties were assumed the analysis may
be performed, but may not be realistic. Since seepage at the site was minimal and no
particles were apparent and soil properties were unknown, the team decided that a flow
net analysis would not be necessary.
ANALYSIS
Page 16
ADWR DAM BREAK ANALYSIS
In October of 2013, ADWR performed a dam-break analysis in which they looked into the
possibilities of a sunny-day as well as a rainy-day dam break. As one might predict, the
rainy-day failure caused greater depths downstream, affecting more of Williams than the
sunny day failure. In the rainy day failure, the dam was assumed to be at full capacity
when it broke, resulting in all the water flooding downstream. The most affected areas
affected are a hotel and a gas station about 1.5 miles downstream, which are completely
flooded with about nine feet of water. I-40 and a small part of Williams consisting of less
than 30 residential homes are also affected, with an average of a foot of water flooding
into the area. This dam break analysis was a static dam break analysis, meaning that only
the depth of water was included, and not the velocities. ADWR’s static dam break analysis
is included in Appendix E.

CONCLUSION
Page 17
Conclusion
Based on the failure modes that were thoroughly analyzed throughout this project, there
is not a serious chance of the dam breaking. Only extreme worst-case scenarios caused a
failure, meaning that the dam and concrete weir are very unlikely to fail. The main reason
that ADWR is concerned with the dam calling it a “Significant” safety concern, is because
of the downstream risks involved, and the fact that the Emergency Action Plan is not
finalized.
FINAL RECOMMENDATIONS
Page 18
Final Recommendations
RECOMMENDATION 1
This team’s first recommendation is for ADWR or a third party to perform a dynamic dam
break analysis, which would include velocities. The dam break analysis on downstream
conditions done in October of 2013 only considered water depths and not velocities. This
means that the water going into the Williams area may be a higher threat than initially
determined from the static analysis.
RECOMMENDATION 2
Our team’s second recommendation is for the Emergency Action Plan to be finalized.
While the EAP has been created, it has not been finalized or implemented, meaning that it
cannot be used in the unlikely event of a dam break. Finalize and implement the EAP.
This will become even more necessary if the dam does get changed from a significant
safety concern to a high safety concern.
RECOMMENDATION 3
Improve and repair outlet works. Existing outlet works are unable to be opened due to
lack of maintenance. Downstream valves cause high pressures in the pipes, thus
upstream valves should be added in order to reduce pressures in pipes. While there is
currently not enough evidence to warrant an internal erosion analysis, if this problem is
not fixed, then the condition of the dam may change away from its current state.
RECOMMENDATION 4
This team’s final recommendation is to remove deep-rooted vegetation. In the various
inspections of this dam, vegetation was consistently noted as a concern, especially a
growth of cattails downstream of the dam. In order to finally dispel any seepage
concerns, this vegetation should be removed.
SUMMARY OF PROJECT COSTS
Page 19
Summary of Project Costs
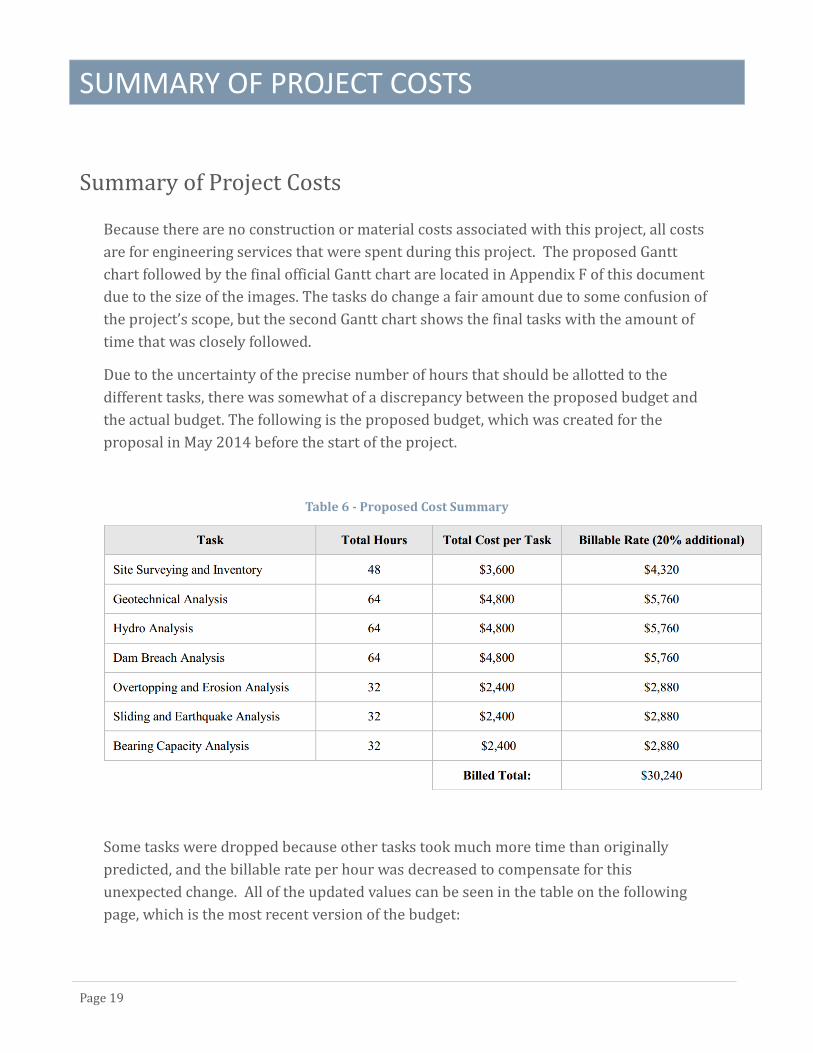
Because there are no construction or material costs associated with this project, all costs
are for engineering services that were spent during this project. The proposed Gantt
chart followed by the final official Gantt chart are located in Appendix F of this document
due to the size of the images. The tasks do change a fair amount due to some confusion of
the project’s scope, but the second Gantt chart shows the final tasks with the amount of
time that was closely followed.
Due to the uncertainty of the precise number of hours that should be allotted to the
different tasks, there was somewhat of a discrepancy between the proposed budget and
the actual budget. The following is the proposed budget, which was created for the
proposal in May 2014 before the start of the project.
Table 6 - Proposed Cost Summary
Some tasks were dropped because other tasks took much more time than originally
predicted, and the billable rate per hour was decreased to compensate for this
unexpected change. All of the updated values can be seen in the table on the following
page, which is the most recent version of the budget:

SUMMARY OF PROJECT COSTS
Page 20
Table 7 - Updated Cost Summary
Task Total Hours Billable Rate Total Cost
Literature Review 199 $40/hr. $7,960
Website 11.5 $75/hr. $863
Site Surveying & Inventory 27 $75/hr. $2,025
Hydro Analysis 65 $75/hr. $4,875
Overtopping Analysis 43.5 $75/hr. $3,263
Erosion Analysis 17 $75/hr. $1,275
Slope Stability Analysis 48.5 $75/hr. $3,638
Spillway Failure Analysis 27 $75/hr. $2,025
Final Report* 76.5 $75/hr. $5,738
Total Hours 515 Total Cost $31,662
This new total cost is the official number that the client will be charged for the team’s
dam safety analysis.
REFERENCES
Page 21
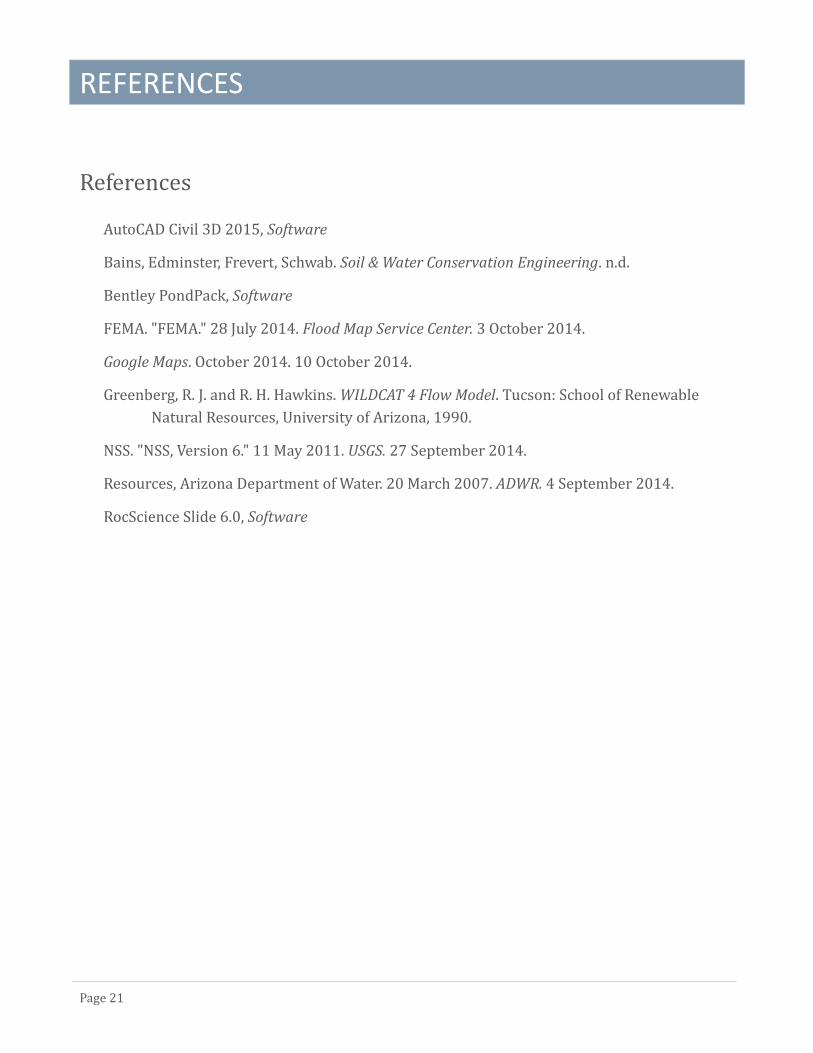
References
AutoCAD Civil 3D 2015, Software
Bains, Edminster, Frevert, Schwab. Soil & Water Conservation Engineering. n.d.
Bentley PondPack, Software
FEMA. "FEMA." 28 July 2014. Flood Map Service Center. 3 October 2014.
Google Maps. October 2014. 10 October 2014.
Greenberg, R. J. and R. H. Hawkins. WILDCAT 4 Flow Model. Tucson: School of Renewable
Natural Resources, University of Arizona, 1990.
NSS. "NSS, Version 6." 11 May 2011. USGS. 27 September 2014.
Resources, Arizona Department of Water. 20 March 2007. ADWR. 4 September 2014.
RocScience Slide 6.0, Software
Appendix A
West Cataract Creek Dam Chronology

1
Timeline for West Cataract Creek Dam
Dam was designed in 1946, with the following factors considered
o Drainage area of 5.5 square miles
Run-off factor of 20-25%
o Discharge of 2,000 cfs
o Maximum 1 hour precipitation of 3.3 inches
o Design 100 year flood was 1.5 inches/hour for 3 hours
o Soil samples were taken, and were run through tests to find various properties
Dam was constructed from May 4, 1947 to November 30, 1947
In 1967, a design analysis was done to determine the effectiveness of the dam
o Peak discharge was re-computed as 3600 cfs
o Drainage area of 6.2 square miles
o 100 year 1 hour rainfall was 2.3 inches
o Time of concentration was calculated as 60 minutes
Revision from March 1, 1968 to May 1, 1968
o 2 foot concrete wall placed across spillway
Inspection in 1978
Gonzalez Estate constructed just before 1982, and was being used to hold overtopping
flow from the West Cataract Creek Dam
8 feet of freeboard confirmed during April 10, 1984 inspection
o 3 feet during 100 year flood
o No freeboard during PMP storm
As of 1986 inspection
o Cited inadequate spillway capacity, causing the dam to be a significant safety
concern
o Licensed in July 18, 1986
o Valves tested in January 1986-no issues
Left in open position
o Spillway enlargement due to happen
Unclear if this was done
o Recommended calculating 100-year flood and ½ PMF flows, and modify spillway
accordingly
EAP plan was adopted by Williams in 1986 that applied to all dams owned by Williams
Inspection on October 1, 1997
o Valve box needs repaired
2
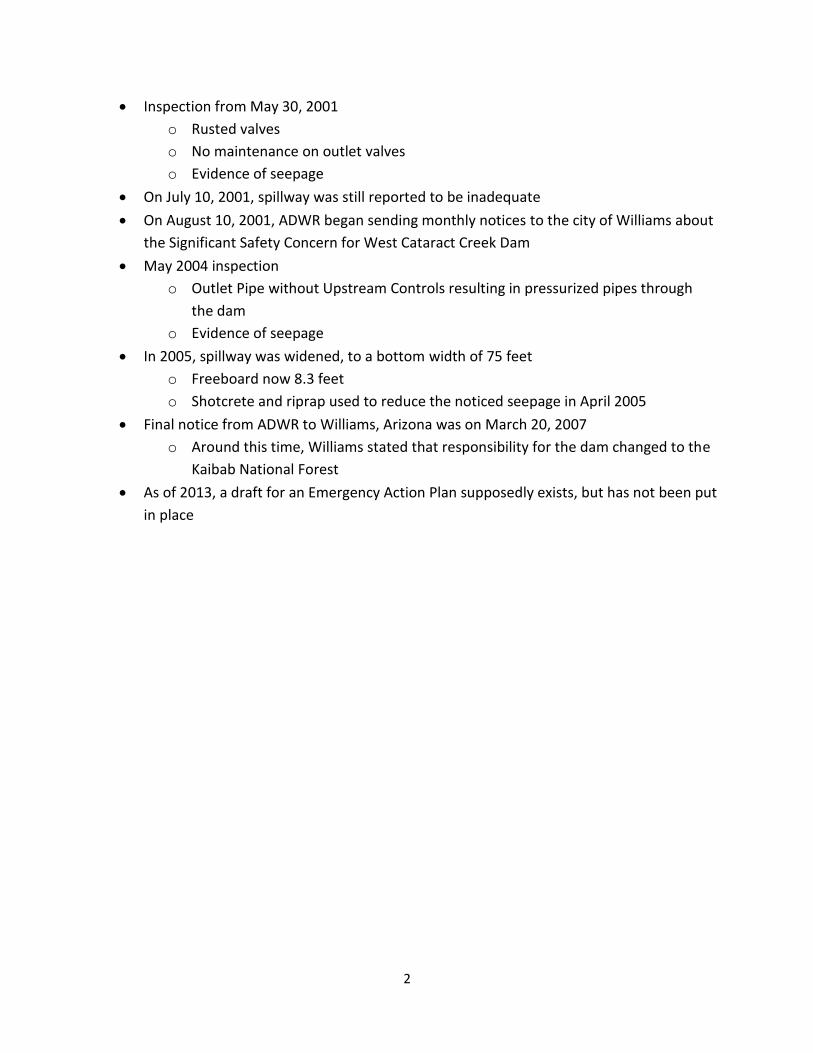
Inspection from May 30, 2001
o Rusted valves
o No maintenance on outlet valves
o Evidence of seepage
On July 10, 2001, spillway was still reported to be inadequate
On August 10, 2001, ADWR began sending monthly notices to the city of Williams about
the Significant Safety Concern for West Cataract Creek Dam
May 2004 inspection
o Outlet Pipe without Upstream Controls resulting in pressurized pipes through
the dam
o Evidence of seepage
In 2005, spillway was widened, to a bottom width of 75 feet
o Freeboard now 8.3 feet
o Shotcrete and riprap used to reduce the noticed seepage in April 2005
Final notice from ADWR to Williams, Arizona was on March 20, 2007
o Around this time, Williams stated that responsibility for the dam changed to the
Kaibab National Forest
As of 2013, a draft for an Emergency Action Plan supposedly exists, but has not been put
in place
Appendix B
Survey Data
1. Survey Data
1
Survey Data
Northing Easting Elevation Notes
104.080 -63.095 -7.770 Spillway Wall (N)
37.580 -18.520 -7.730 Spillway Wall (S)
99.070 -52.460 -10.240 Spillway Edge
93.765 -62.240 -9.890 Spillway Edge
37.920 -25.620 -10.000 Spillway Edge
43.210 -16.610 -9.975 Spillway Edge
26.230 -12.350 -3.065 Top of Concrete
2.500 -24.600 -3.435 Top of Concrete
16.565 -23.465 -3.085 Top of Concrete
8.400 -25.260 -3.225 Top of Concrete
15.395 5.550 -2.730 Backside Slope Edge
9.255 -5.935 -0.290 Top of Dam Point
14.270 17.075 -7.595 Backside Slope Edge
-23.245 -34.950 -9.955 Front Side SE
8.600 26.185 -9.015 BS SE
-67.550 -12.635 -14.480 FS SE
-15.225 47.450 -13.350 BS SE
-92.610 3.120 -17.205 FS SE
-32.300 76.750 -18.060 BS SE
-114.385 18.260 -17.770 FS SE
-46.370 94.600 -20.820 BS SE
-137.940 34.520 -17.675 FS SE
-57.590 114.955 -23.315 BS SE
-160.910 49.855 -17.445 FS SE
-68.510 135.615 -26.950 BS SE
-187.275 67.940 -17.235 FS SE
-78.365 155.625 -29.425 BS SE
-207.930 82.540 -17.460 FS SE
-101.320 166.850 -35.550 BS SE
-229.825 98.770 -16.720 FS SE
-115.950 183.100 -38.050 BS SE
-251.490 111.685 -17.175 FS SE
-139.930 203.295 -40.135 BS SE
-273.025 126.365 -16.720 FS SE
-303.435 144.470 -17.220 FS SE
-338.580 165.605 -17.140 FS SE
-364.795 184.510 -16.575 FS SE
-391.570 205.215 -14.885 FS SE
-420.010 223.875 -13.455 FS SE
-417.030 311.870 -6.890 BS SE
2
-434.300 252.075 -10.055 FS SE
-365.950 303.670 -13.560 BS SE
-455.435 277.560 -6.130 FS SE
-336.160 281.425 -17.225 BS SE
-469.295 290.425 -3.155 FS SE
-320.720 272.890 -20.120 BS SE
-465.130 309.430 0.315 Top Center of Dam - South
-455.805 297.140 -0.175 FS Top Edge
-449.215 306.635 -0.125 BS TE
-409.935 267.415 -0.565 FS TE
-405.680 275.705 -0.345 BS TE
-363.865 236.805 -0.645 FS TE
-358.395 244.320 -0.630 BS TE
-308.355 200.275 -0.995 FS TE
-302.940 207.685 -0.815 BS TE
-209.785 135.400 -0.605 FS TE
-205.120 141.905 -0.575 BS TE
-111.115 69.700 -0.485 FS TE
-106.265 75.730 -0.285 BS TE
-22.845 8.775 -0.125 FS TE
-17.660 16.620 -0.035 BS TE
-146.730 197.345 -39.730 BS SE
-182.195 237.850 -40.885 BS SE
-193.895 246.950 -35.195 BS
-8.610 105.595 -10.140 Second Nail

Appendix C
HYDROLOGY DATA
1. NSS output
2. FEMA dFIRM Map

1
NSS Output
2
FEMA Floodplains

Appendix D
Overtopping Analysis
1. NOAA Atlas 14 Storm Data
2. Watershed Delineation
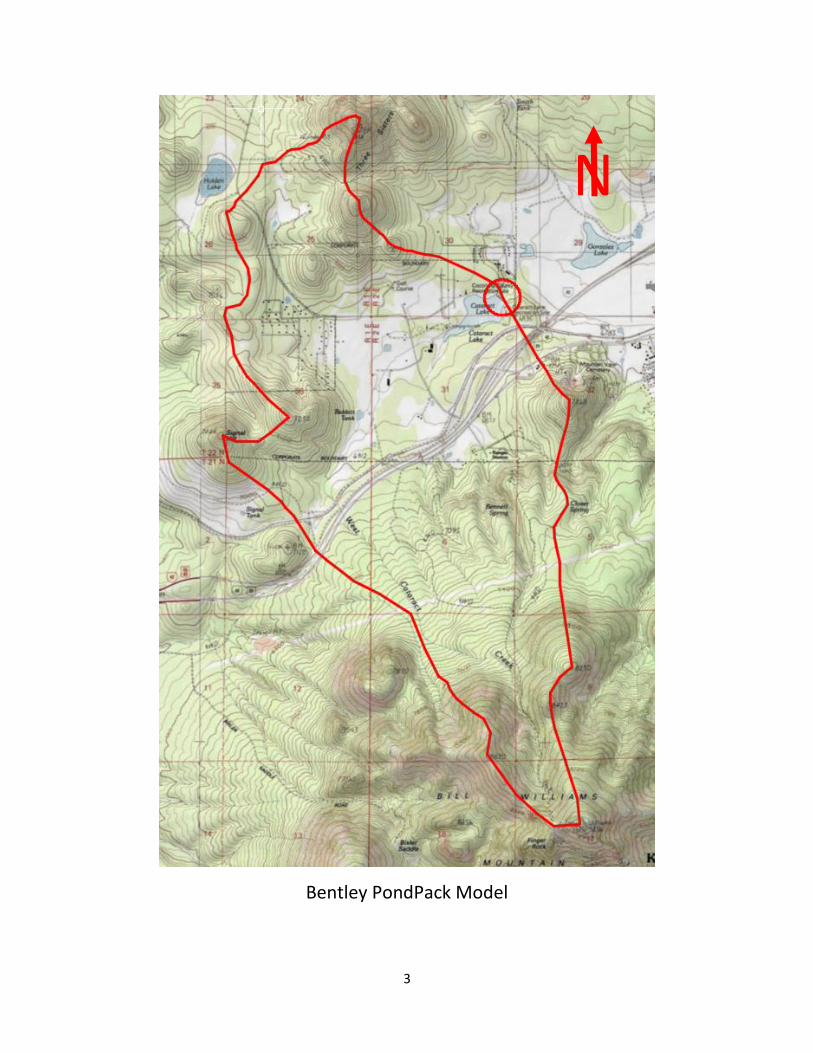
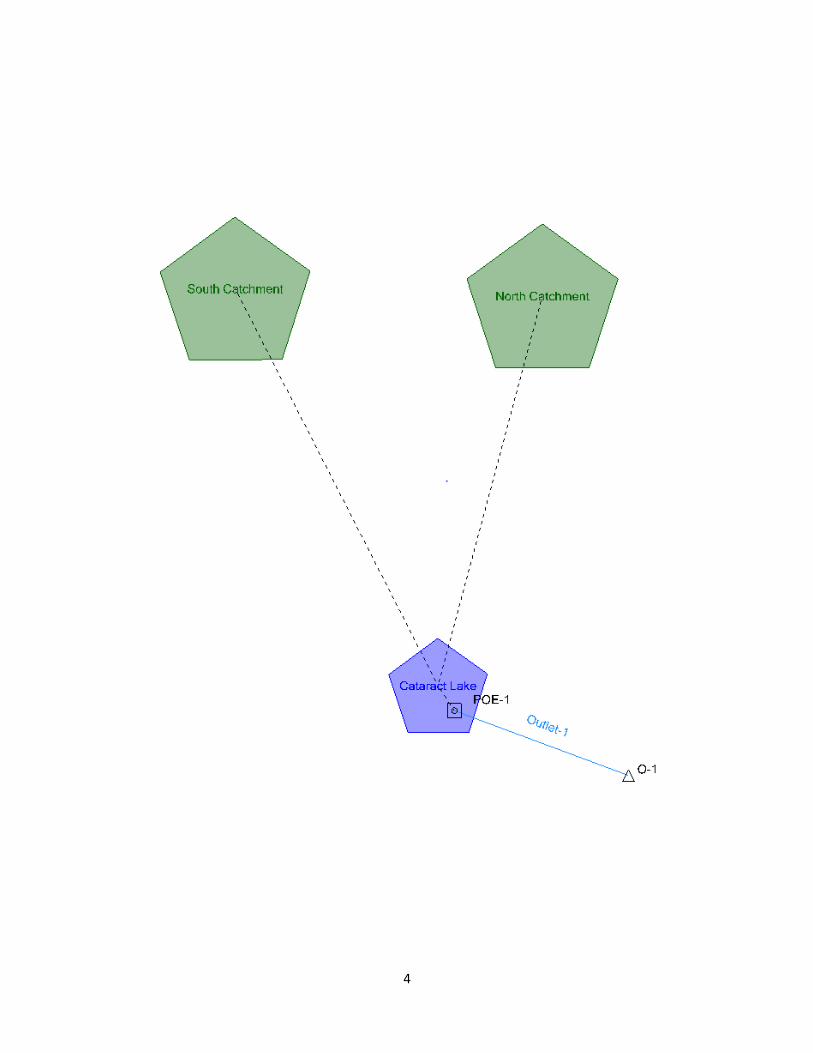
3. Bentley PondPack Model
1
NOAA Atlas 14 Storm Data

2
Watershed Delineation
3
Bentley PondPack Model
N
4

Appendix E
ADWR Dam Safety Analysis

Downstream Effects of a Sunny Day Failure as determined by ADWR
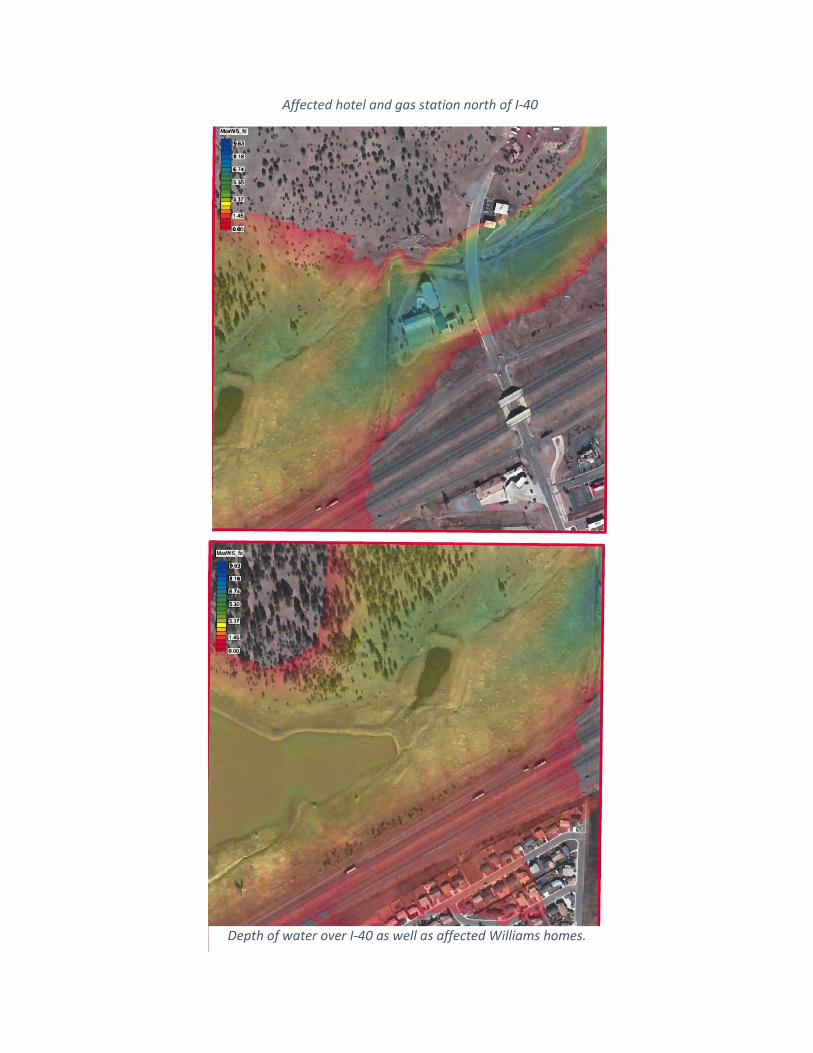
Affected hotel and gas station north of I-40
Depth of water over I-40 as well as affected Williams homes.

Downstream Effects of a Rainy Day Failure as determined by ADWR

Affected hotel and gas station north of I-40
Depth of water over I-40 as well as affected Williams homes.

Appendix F
Gantt Charts

Proposed Gantt Chart

Final Gantt Chart