west alabama real estate summit tuscaloosa, alabamaaugust 24, 2012 ahmad ijaz center for business...
TRANSCRIPT

Tuscaloosa Economic Outlook
Tuscaloosa Economic Outlook
West Alabama Real Estate Summit
Tuscaloosa, Alabama August 24, 2012
Ahmad Ijaz
Center for Business and Economic Research
Culverhouse College of Commerce and Business Administration
The University of Alabama
http://cber.cba.ua.edu (205) 348-6191
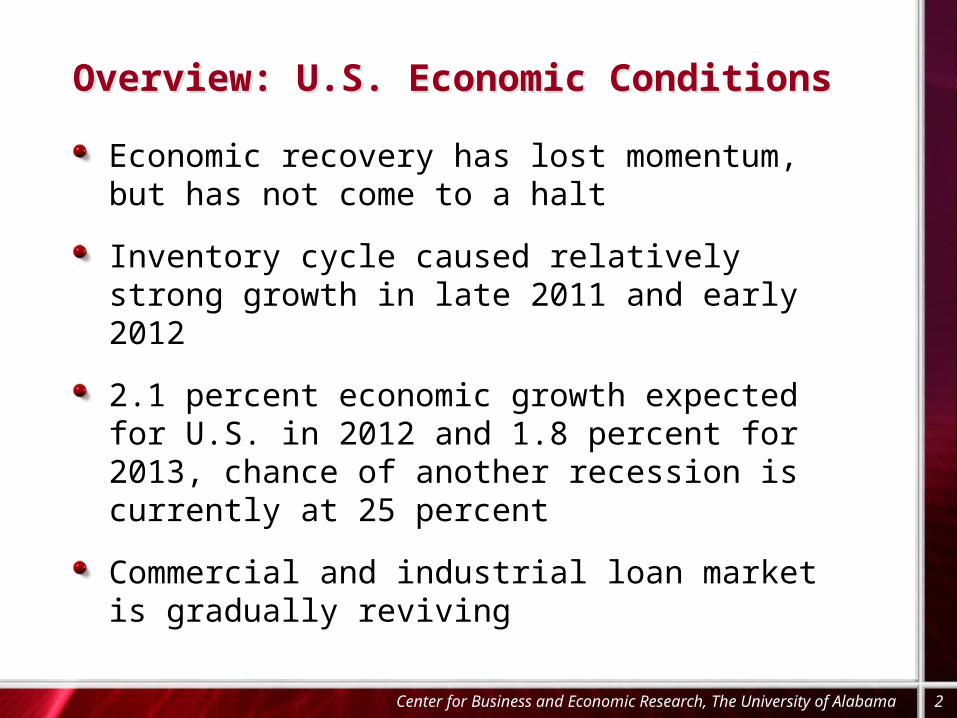
Overview: U.S. Economic Conditions Overview: U.S. Economic Conditions
Economic recovery has lost momentum, but has not come to a halt
Inventory cycle caused relatively strong growth in late 2011 and early 2012
2.1 percent economic growth expected for U.S. in 2012 and 1.8 percent for 2013, chance of another recession is currently at 25 percent
Commercial and industrial loan market is gradually reviving
Center for Business and Economic Research, The University of Alabama 2

Downside RisksDownside Risks
State and local governments continue to lay off workers
Relatively tight credit and loan markets
Housing markets remain weak and distressed
Rising gasoline and food prices
External risks (Eurozone and China)
Lack of income growth
Economy will require much faster job growth for a sustained recovery
Center for Business and Economic Research, The University of Alabama 3
Center for Business and Economic Research, The University of Alabama 4
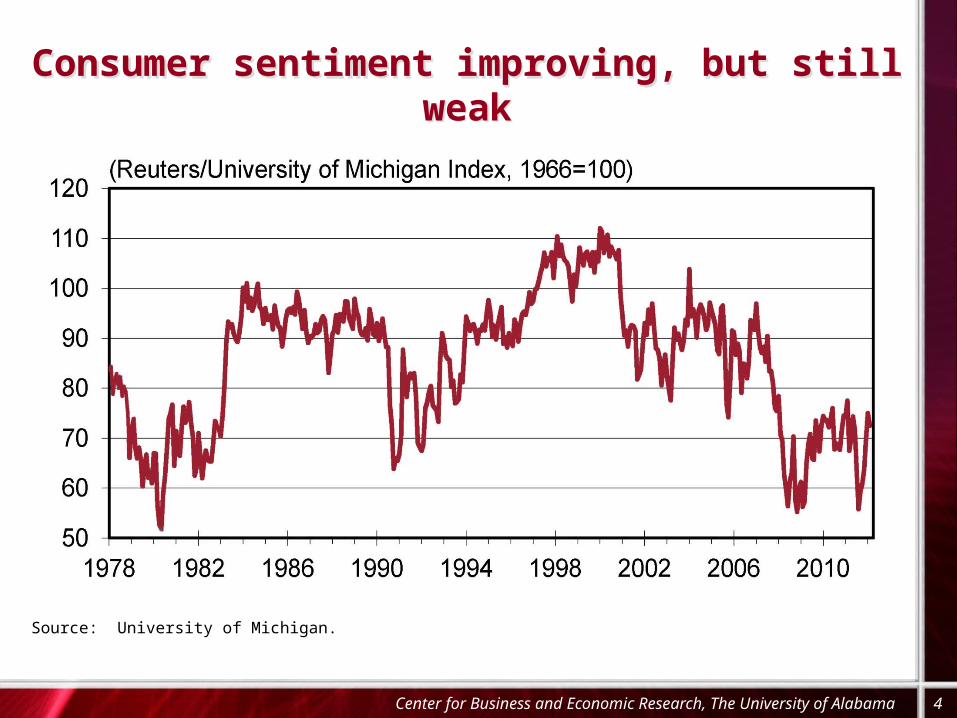
Consumer sentiment improving, but still weakConsumer sentiment improving, but still weak
Source: University of Michigan.

Center for Business and Economic Research, The University of Alabama 5
Productivity growth has run out of steamProductivity growth has run out of steam
Source: Federal Reserve Board.

Commercial and industrial loan market reviving gradually
Commercial and industrial loan market reviving gradually
Center for Business and Economic Research, The University of Alabama 6
Source:

U.S. Economic OutlookU.S. Economic Outlook
Source: IHS Global Insight, August 2012.
(Percent change unless otherwise noted) 2009 2010 2011 2012 2013
Real GDP -3.5 3.0 1.7 2.1 1.8
Consumption -1.9 1.8 2.5 1.9 2.1
Residential Investment -22.2 -3.7 -1.4 11.6 11.2
Commercial, Healthcare Structures -30.7 -25.0 -2.3 6.5 4.9
Nonresidential Fixed Investment -18.1 0.7 8.6 8.6 4.8
Federal Government 6.1 4.5 -2.8 -2.8 -3.1
State & Local Government 2.2 -1.8 -3.4 -1.7 -0.9
Exports -9.1 11.1 6.7 4.0 4.3
Imports -13.5 12.5 4.8 3.7 3.8
Payroll Employment -4.4 -0.7 1.2 1.4 1.4
Unemployment Rate 9.3 9.6 9.0 8.2 8.0
CPI Inflation -0.3 1.6 3.1 2.0 1.6
Light Vehicle Sales (Millions) 10.40 11.55 12.73 14.13 14.81
Center for Business and Economic Research, The University of Alabama 7

Monthly Employment Indicators (July 2012) Monthly Employment Indicators (July 2012)
Center for Business and Economic Research, The University of Alabama 8
Not Seasonally Adjusted
Seasonally Adjusted
Civilian Labor Force 2,175,298 2,157,890 Percent Change from Year Ago Level -1.2% -1.5% Absolute Change from Year Ago Level -25,726 -31,920
Employed 1,980,599 1,978,355 Percent Change from Year Ago Level -0.5% -0.5% Absolute Change from Year Ago Level -9,390 -9,144
Unemployed 194,699 179,535 Percent Change from Year Ago Level -7.7% -11.3% Absolute Change from Year Ago Level -16,336 -22,776
Alabama Unemployment Rate 9.0% 8.3%Alabama Unemployment Rate (July 2011) 9.6% 9.2%U.S. Unemployment Rate 8.6% 8.3%U.S. Unemployment Rate (July 2011) 9.3% 9.1%
Source: Alabama Department of Industrial Relations, Labor Market Information Division.

Alabama Nonagricultural EmploymentChange in Number of Jobs
Alabama Nonagricultural EmploymentChange in Number of Jobs
Center for Business and Economic Research, The University of Alabama 9
Source: Alabama Department of Industrial Relations, Labor Market Information Division.
July 2010 to July 2011
July 2011 to July 2012
Total Nonagricultural -6,700 5,700 Natural Resources and Mining 400 -200 Construction -8,800 -6,300 Manufacturing 1,500 3,400 Durable Goods Manufacturing 2,300 3,900 Nondurable Goods Manufacturing -800 -500 Trade, Transportation and Utilities 6,400 3,400 Wholesale Trade 700 -500 Retail Trade 3,600 5,900 Transportation, Warehousing and Utilities 2,100 -2,000 Information -800 -700 Financial Activities 700 900 Professional and Business Services -1,900 4,100 Educational and Health Services -400 1,500 Leisure and Hospitality 3,300 7,300 Other Services -300 1,300 Government -6,800 -9,000 Federal Government -3,000 -1,300 State Government -3,000 -8,000 Local Government -800 300

Share of Total Nonfarm Employment (2011) andShare of Alabama Gross Domestic Product (2010)
Share of Total Nonfarm Employment (2011) andShare of Alabama Gross Domestic Product (2010)
Source: Alabama Department of Industrial Relations. Source: U.S. Bureau of Economic Analysis.
Center for Business and Economic Research, The University of Alabama 10
1 20%
10%
20%
30%
40%
50%
60%
70%
80%
90%
100%
Rest of Sectors22.72
Rest of Sectors38.71
Education and Health Services11.52
Leisure and Hospitality8.85
Professional and Business Services
11.60
Government20.18
Retail Trade12.44
Manufacturing12.71
Education and Health Services8.12
Leisure and Hospitality 2.77Professional and
Business Services 9.78
Government17.12
Retail Trade 7.20
Manufacturing16.31
Share of Total Nonfarm Employment Share of Alabama Gross Domestic Product

Tax Revenues (Fiscal Year to Date, July) Tax Revenues (Fiscal Year to Date, July)
Center for Business and Economic Research, The University of Alabama 11
Percent Change
From Year Ago
Change in Revenue
from Year Ago LevelTax Total Collection
Total $7,479,875,896 4.0% $290,488,033
Income (Individual) $2,880,218,386 4.9% $134,778,934
Sales $1,670,289,091 4.7% $75,106,878
Source: Alabama Department of Revenue.

Total Monthly Nonfarm Employmentand Unemployment Rate
Total Monthly Nonfarm Employmentand Unemployment Rate
Center for Business and Economic Research, The University of Alabama 12
Source: Alabama Department of Industrial Relations.
Employment (Thousands), Unemployment Rate (Percent)January 1990 – July 2012
Non
farm
Em
ploy
men
t
Une
mpl
oym
ent
Rat
e
JAN APR JUL OCT JAN APR JUL OCT JAN APR JUL OCT JAN APR JUL OCT JAN APR July1,600
1,650
1,700
1,750
1,800
1,850
1,900
1,950
2,000
2,050
2
3
4
5
6
7
8
9
10
11
1990 1993 1995 1997 1999 2001 2003 2005 2007 2009 2011 2012
Employment
Unemployment Rate

1990
1991
1992
1993
1994
1995
1996
1997
1998
1999
2000
2001
2002
2003
2004
2005
2006
2007
2008
2009
2010
2011
2012
1,500
1,600
1,700
1,800
1,900
2,000
2,100
0
2
4
6
8
10
12
Center for Business and Economic Research, The University of Alabama 13
Total Annual Nonfarm Employmentand Unemployment Rate
Total Annual Nonfarm Employmentand Unemployment Rate
Employment (Thousands), Unemployment Rate (Percent)1990-2012
Source: Alabama Department of Industrial Relations.
Non
farm
Em
ploy
men
t
Une
mpl
oym
ent
Rat
e
Employment
Unemployment Rate

84
86
88
90
92
94
96
98
100
102
104
19801981199020012007
Change in Employment From the Beginning of the Recession
Change in Employment From the Beginning of the Recession
Center for Business and Economic Research, The University of Alabama 14
Number of months
(Number of Months)

ABCI™ History ABCI™ History
Center for Business and Economic Research, The University of Alabama 15
Q1 Q3 Q1 Q3 Q1 Q3 Q1 Q3 Q1 Q3 Q1 Q3 Q1 Q3 Q1 Q3 Q1 Q3 Q1 Q3 Q1 Q330
35
40
45
50
55
60
65
70
31.5
50.2Inde
x
2002 2003 2004 2005 2006 2007 2008 2009 2010 2011 2012

Business Environment ExpectationsBusiness Environment Expectations
Much Worse
Somewhat Worse
Remain the Same
Somewhat Better
Much Better
0 5 10 15 20 25 30 35 40 45 50 55
6.6
32.6
40.3
19.4
1.1
1.1
23.8
44.7
29.3
1.1 Alabama National
Q3 2012 compared to Q2 2012
Center for Business and Economic Research, The University of Alabama 16

Industry Performance ExpectationsSales and Profits
Industry Performance ExpectationsSales and Profits
Center for Business and Economic Research, The University of Alabama 17
Q3 2012 compared to Q2 2012
Strong Decrease
Moderate Decrease
No Change
Moderate Increase
Strong Increase
0 5 10 15 20 25 30 35 40 45
1.1
18.7
40.7
39.2
0.4
1.5
27.1
38.5
33.0
0.0 Sales Profits

Industry Performance ExpectationsHiring Plans and Capital Expenditures
Industry Performance ExpectationsHiring Plans and Capital Expenditures
Center for Business and Economic Research, The University of Alabama 18
Q3 2012 compared to Q2 2012
Strong Decrease
Moderate Decrease
No Change
Moderate Increase
Strong Increase
0 10 20 30 40 50 60
2.9
16.5
59.7
20.5
0.4
3.3
16.9
54.5
24.2
1.1 Hiring Plans Capital Expenditures

ABCI™ ABCI™
Center for Business and Economic Research, The University of Alabama 19
Q3 Q4 Q1 Q2 Q3 Q4 Q1 Q2 Q30
10
20
30
40
50
60
70
80
90
100
51.6 47.955.0 55.8
51.445.5
50.856.8
50.2
Inde
x
2010 2011 2012

This Alabama GDP and employment forecast summary is the CBER July 2012 preliminary forecast
Preliminary 2013 forecast included below
Alabama Forecast Summary Alabama Forecast Summary
Probability: Forecast (60 Percent) and Range (90 percent)
CENTER FOR BUSINESS AND ECONOMIC RESEARCH, THE UNIVERSITY OF ALABAMA 20
(Percent change) 2010 2011 2012 2013
Real GDP 2.3 1.5 2.0 2.1
range 0.5 to 2.5 1.5 to 3.0 1.8 to 3.5
Employment -0.8 -0.2 0.5 1.5
range 0.1 to 1.5 0.7 to 2.3
Total Tax Receipts, FY -2.5 5.0 4.0 4.1
range 3.5 to 4.5 3.0 to 7.0

Alabama Gross Domestic Product andEmployment by Metro Areas
Alabama Gross Domestic Product andEmployment by Metro Areas
Center for Business and Economic Research, The University of Alabama 21
Source: Alabama Department of Industrial Relations, U.S. Bureau for Economic Analysis.
0%
10%
20%
30%
40%
50%
60%
70%
80%
90%
100%
2.582.87
26.10
2.853.003.001.88
11.04
9.36
8.72
4.94
23.65
Non-metro areas
Tuscaloosa
Montgomery
Mobile
Huntsville
Gadsden
Florence-Muscle Shoals
Dothan
Decatur
Birmingham-Hoover
Auburn-Opelika
Anniston-Oxford
Alabama Employment by Metro Area0%
10%
20%
30%
40%
50%
60%
70%
80%
90%
100%
2.162.11
31.20
2.832.672.381.53
12.11
9.18
8.65
5.13
20.05
Alabama GDP by Metro Area
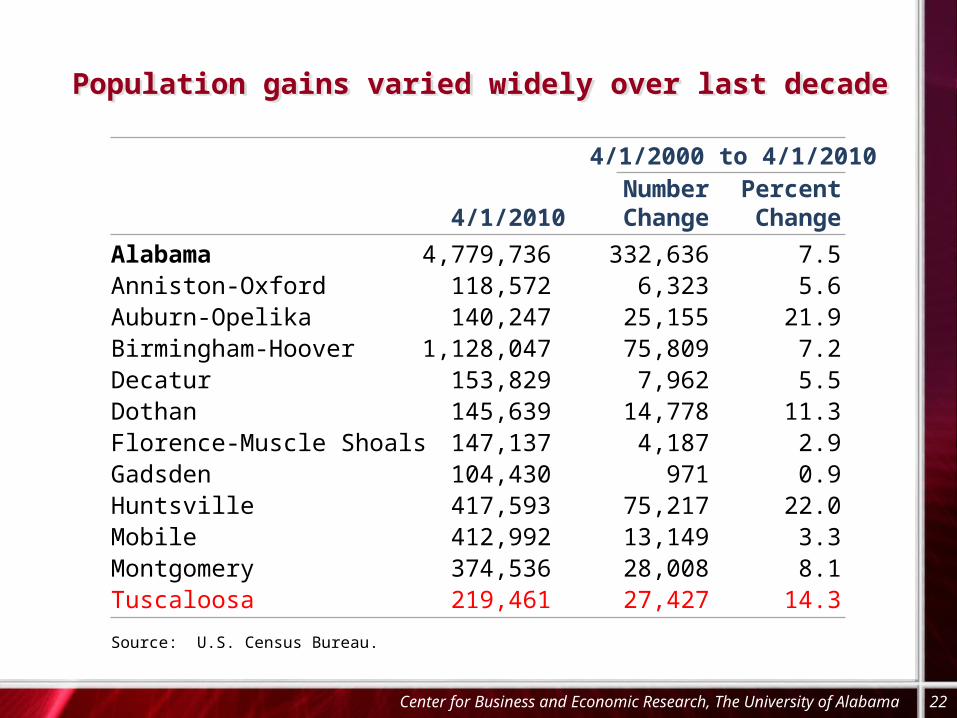
Population gains varied widely over last decadePopulation gains varied widely over last decade
4/1/2000 to 4/1/2010 Number Percent
4/1/2010 Change Change
Alabama 4,779,736 332,636 7.5Anniston-Oxford 118,572 6,323 5.6Auburn-Opelika 140,247 25,155 21.9Birmingham-Hoover 1,128,047 75,809 7.2Decatur 153,829 7,962 5.5Dothan 145,639 14,778 11.3Florence-Muscle Shoals 147,137 4,187 2.9Gadsden 104,430 971 0.9Huntsville 417,593 75,217 22.0Mobile 412,992 13,149 3.3Montgomery 374,536 28,008 8.1Tuscaloosa 219,461 27,427 14.3
Source: U.S. Census Bureau.
Center for Business and Economic Research, The University of Alabama 22

Center for Business and Economic Research, The University of Alabama 23
Median Family Income FY2011
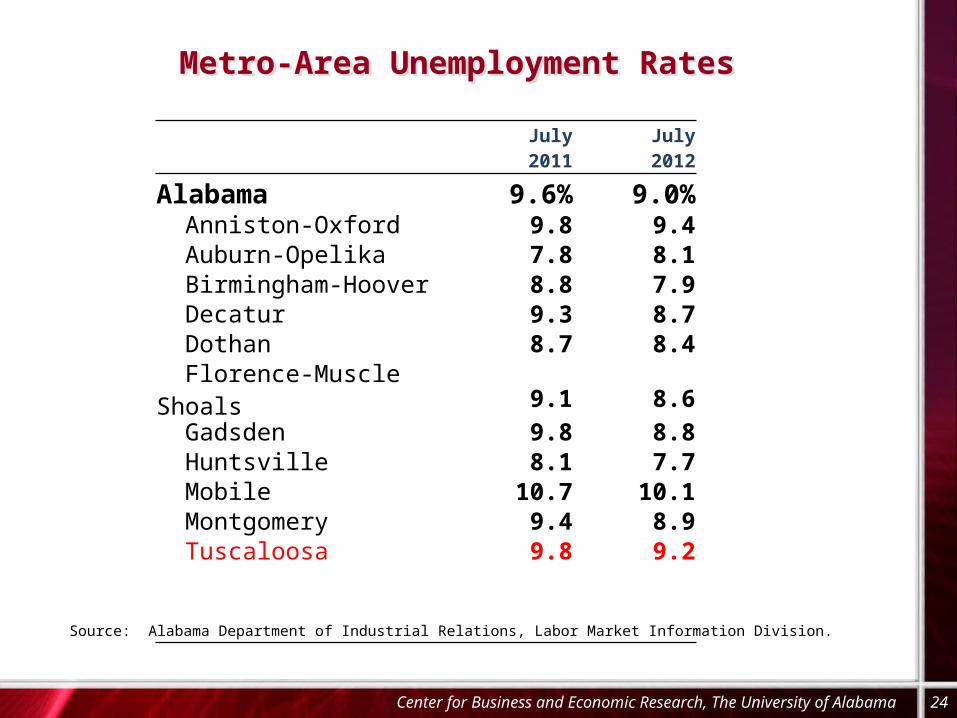
Metro-Area Unemployment RatesMetro-Area Unemployment Rates
Center for Business and Economic Research, The University of Alabama 24
Source: Alabama Department of Industrial Relations, Labor Market Information Division.
July 2011 July 2012
Alabama 9.6% 9.0% Anniston-Oxford 9.8 9.4 Auburn-Opelika 7.8 8.1 Birmingham-Hoover 8.8 7.9 Decatur 9.3 8.7 Dothan 8.7 8.4 Florence-Muscle Shoals 9.1 8.6 Gadsden 9.8 8.8 Huntsville 8.1 7.7 Mobile 10.7 10.1 Montgomery 9.4 8.9 Tuscaloosa 9.8 9.2

No metro back to 2007/2008 annual peak in 2011No metro back to 2007/2008 annual peak in 2011
2007 or 2008 Job Loss to 2011
Nonfarm Employment Peak Year Number PercentAlabama 2,003,800 -134,800-6.7Anniston-Oxford 53,500 -4,800 -9.0Auburn-Opelika 54,800 -2,200 -4.0Birmingham-Hoover 531,300 -43,200 -8.1Decatur 58,500 -5,100 -8.7Dothan 63,100 -7,000 -11.1Florence-Muscle Shoals 57,300 -1,800 -3.1Gadsden* 38,100 -2,900 -7.6Huntsville* 214,300 -6,600 -3.1Mobile* 184,700 -9,800 -5.3Montgomery 179,200 -13,200 -7.4Tuscaloosa* 98,500 -5,800 -5.9Net Jobs in Metropolitan Areas -102,400
Net Jobs in Nonmetro Counties -32,400* Gadsden, Huntsville, Mobile, and Tuscaloosa employment peaked in 2008; all others saw peaks in 2007.
Note: Nonfarm employment (jobs) is by place of work. Data are January to November averages.
Source: Alabama Department of Industrial Relations and U.S. Bureau of Labor Statistics.
Center for Business and Economic Research, The University of Alabama 25

ABCI by Metro Area Q3 2012(Tuscaloosa – 51.0)
ABCI by Metro Area Q3 2012(Tuscaloosa – 51.0)
Center for Business and Economic Research, The University of Alabama 26
Montgomery
Mobile
Huntsville
Birmingham-Hoover
Alabama
0 10 20 30 40 50 60
53.1
48.9
48.3
52.8
50.2

Tuscaloosa Metro Area Nonfarm EmploymentTuscaloosa Metro Area Nonfarm Employment
Center for Business and Economic Research, The University of Alabama 27
IndustryJuly 2012
employmentNet change since
July 2011Total Nonfarm 87,300 -2,400Goods Producing 20,300 -300Natural Resources, Mining, and Construction 7,300 -400Manufacturing 13,000 100Service Providing 67,000 -2,100Trade, Transportation, Warehousing, and Utilities 14,500 200 -Wholesale Trade 2,000 200 -Retail Trade 10,200 0 -Transportation, Warehousing, and Utilities 2,300 0Information 900 0Financial Activity 3,400 -100Professional and Business Services 7,800 100Education and Health Services 7,200 -200Leisure and Hospitality 8,500 100Other Services 3,300 0Government 21,400 -2,200 -Federal 1,600 -100 -State and Local 19,800 -2,100
Source: Alabama Department of Industrial Relations
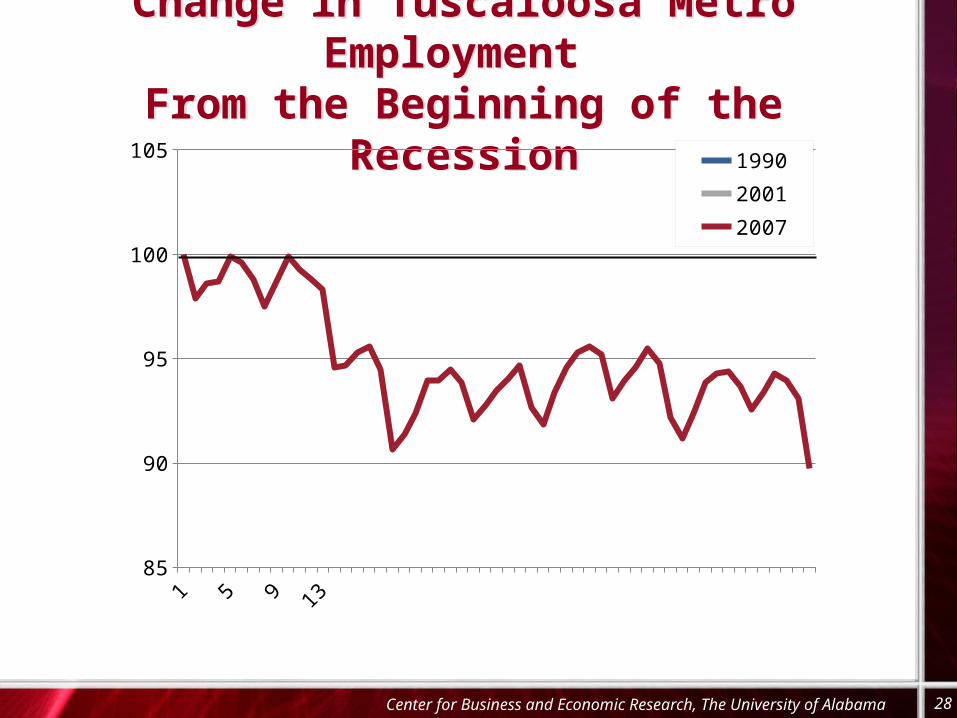
Change in Tuscaloosa Metro Employment From the Beginning of the Recession
Change in Tuscaloosa Metro Employment From the Beginning of the Recession
28Center for Business and Economic Research, The University of Alabama
85
90
95
100
105 1990
2001
2007
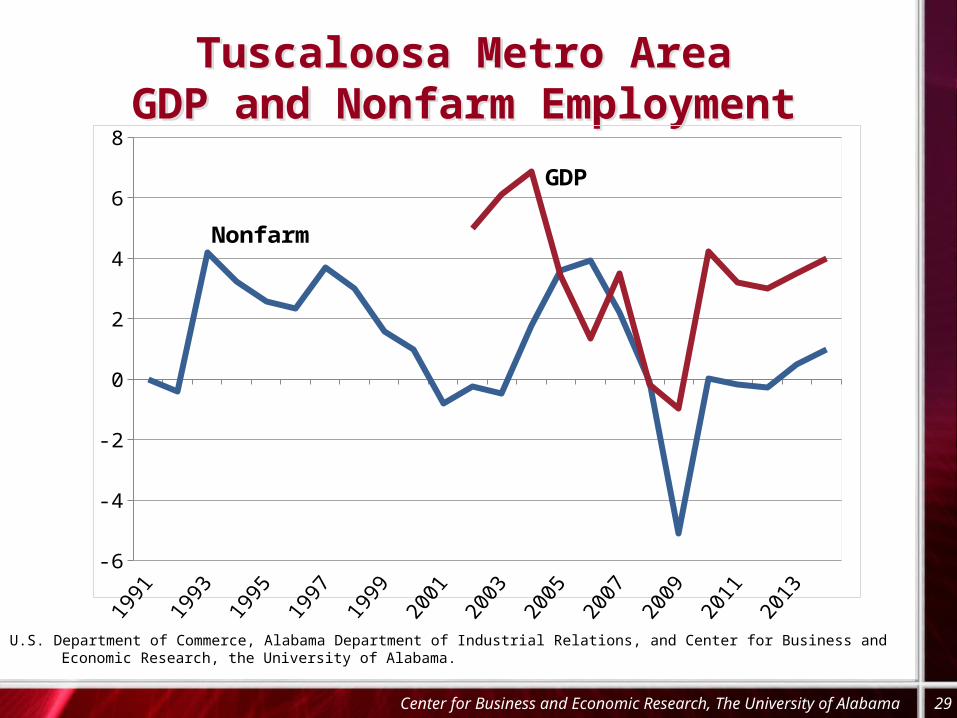
Tuscaloosa Metro AreaGDP and Nonfarm Employment
Tuscaloosa Metro AreaGDP and Nonfarm Employment
Center for Business and Economic Research, The University of Alabama 29
-6
-4
-2
0
2
4
6
8
Nonfarm
GDP
Source: U.S. Department of Commerce, Alabama Department of Industrial Relations, and Center for Business and Economic Research, the University of Alabama.

Ahmad Ijaz
Center for Business and Economic Research
Culverhouse College of Commerce and Business Administration
The University of Alabama
http://cber.cba.ua.edu (205) 348-6191
Questions, comments, suggestions, discussion,…
Thank You
Center for Business and Economic Research, The University of Alabama 30