welfare in canada 2013 - maytree
TRANSCRIPT
Welfare in Canada 2013
by
Anne Tweddle, Ken Battle andSherri Torjman
November 2014
Welfare in Canada 2013
by
Anne Tweddle, Ken Battle andSherri Torjman
November 2014

Copyright © 2014 by The Caledon Institute of Social Policy
ISBN 1-55382-630-2
Published by:
Caledon Institute of Social Policy1354 Wellington Street West, 3rd FloorOttawa, ON K1Y 3C3CANADA
Tel./Fax: (613) 729-3340
E-mail: [email protected]: www.caledoninst.orgTwitter: @CaledonINST
Table of Contents
Introduction 1
What is welfare? 1
Assets 2
Income 5
Earnings exemption provisions 5
Welfare incomes 10
Prince Edward Island 10Nova Scotia 10Saskatchewan 11British Columbia 11
Welfare incomes over time 11
Newfoundland and Labrador 11Prince Edward Island 14Nova Scotia 17New Brunswick 19Quebec 22Ontario 25Manitoba 28Saskatchewan 30Alberta 33British Columbia 37Yukon 39Northwest Territories 42Nunavut 44
Adequacy of welfare incomes 47
Poverty measures 47
Low income cut-offs 48Market Basket Measure 52
Income measures 57
After-tax average incomes 57After-tax median incomes 62
Table 1: Liquid Asset Exemption Levels as of January 2013Provisions for Applicants and Recipients 3
Table 2: Monthly Earnings Exemption Levels as of January 2013Provisions for Applications and Recipients 6
Table 3: Comparison of 2013 Welfare Incomes with After-Tax Low Income Cut-offs (LICOS) 49
Table 4: Comparison of 2013 Welfare Incomes with Market Basket Measure (MBM) 53
Table 5: 2013 Welfare Incomes as a Percentage of After-tax Average Incomes 58
Table 6: 2013 Welfare Incomes as a Percentage of After-tax Median Incomes 63
Appendix A: 2013 Welfare Incomes, by Household Component 67
Appendix B.1: Total Welfare Incomes Over Time, in Constant 2013 Dollars,Newfoundland and Labrador, 1986-2013 75
Appendix B.2: Total Welfare Incomes Over Time, in Constant 2013 Dollars,Prince Edward Island, 1986-2013 76
Appendix B.3: Total Welfare Incomes Over Time, in Constant 2013 Dollars,Nova Scotia, 1986-2013 77
Appendix B.4: Total Welfare Incomes Over Time, in Constant 2013 Dollars,New Brunswick, 1986-2013 78
Appendix B.5: Total Welfare Incomes Over Time, in Constant 2013 Dollars,Quebec, 1986-2013 79
Appendix B.6: Total Welfare Incomes Over Time, in Constant 2013 Dollars,Ontario, 1986-2013 80
Appendix B.7: Total Welfare Incomes Over Time, in Constant 2013 Dollars,Manitoba, 1986-2013 81
Appendix B.8: Total Welfare Incomes Over Time, in Constant 2013 Dollars,Saskatchewan, 1986-2013 82
Appendix B.9: Total Welfare Incomes Over Time, in Constant 2013 Dollars,Alberta, 1986-2013 83
Appendix B.10: Total Welfare Incomes Over Time, in Constant 2013 Dollars,British Columbia, 1986-2013 84
Appendix B.11: Total Welfare Incomes Over Time, in Constant 2013 Dollars,Yukon, 1986-2013 85
Appendix B.12: Total Welfare Incomes Over Time, in Constant 2013 Dollars,Northwest Territories, 1986-2013 86
Appendix B.13: Total Welfare Incomes Over Time, in Constant 2013 Dollars,Nunavut, 1986-2013 87

Welfare in Canada 2013 Caledon Institute of Social Policy 1
Introduction
This report focuses on the incomes of four different households living on socialassistance, commonly known as “welfare.” It is a continuation of the welfare incomes seriespublished regularly by the former National Council of Welfare.
This is the second report on welfare incomes produced by the Caledon Institute of SocialPolicy. The Caledon Institute committed to continue the data series following the demise of theNational Council of Welfare in 2012. The figures presented in this report are based on the samemethodology used by the Council, thereby ensuring the integrity and comparability of the dataseries.
The welfare incomes in this report represent the total amount that four typical familytypes would receive over the course of a year. The households are: a single person consideredemployable, a single person with a disability, a single parent with one child age 2 and a couplewith two children ages 10 and 15.
Total welfare income consists of the following components:
• social assistance• provincial/territorial and federal child benefits• provincial/territorial and federal tax credits.
It is important to note that the amounts shown for welfare represent the maximum paidfor basic needs. Households may receive less if they receive income from other sources. Somehouseholds may receive more than the amounts identified here if they have special health- ordisability-related needs.
The Caledon Institute of Social Policy thanks all jurisdictions for their assistance in theproduction of the welfare incomes data contained in this report. Adequacy measures are basedon the most recent data available. Some figures have been estimated: Please see footnotes. Asmore recent data become available, the series will be modified to reflect this.
What is welfare?
Social assistance is the program of last resort. It is intended for persons who haveexhausted all other means of financial support. Each province and territory has its own socialassistance program, so no two are the same. Each program has different administrative rules,eligibility criteria, benefit levels and provisions concerning special types of assistance.However, the basic structure of social assistance is much the same across the country, eventhough the specifics may differ.
2 Caledon Institute of Social Policy Welfare in Canada 2013
Eligibility for social assistance is determined on the basis of a needs test. This test takesinto account the household’s basic needs and its financial resources, which include both assetsand income.
The needs test assesses whether there is a shortfall between available financial resourcesand the legislated amounts for basic needs – i.e., food, shelter, clothing, household and personalneeds. Additional amounts may be paid on a discretionary basis for special needs based on eachhousehold’s circumstances.
Assets
In order to qualify for welfare, the assets of a household must fall below designatedlevels. Assets include both fixed and liquid assets.
Fixed assets include the family residence, the primary vehicle, personal effects and itemsneeded for employment. These fixed assets are considered exempt (within reason) whendetermining eligibility.
Liquid assets include cash on hand and in a bank account as well as stocks, bonds andsecurities that can be readily converted to cash. All provinces and territories set the maximumallowable amount of liquid assets a household may retain and still be eligible for assistance.The actual levels of exempt liquid assets vary by household category and size. Moreover, somejurisdictions have different provisions for those applying for welfare compared to those alreadyreceiving benefits.
All jurisdictions exempt the full or partial value of Registered Education Savings Plansand Registered Disability Savings Plans. Several also have provisions concerning theexemption of Registered Retirement Savings Plans.
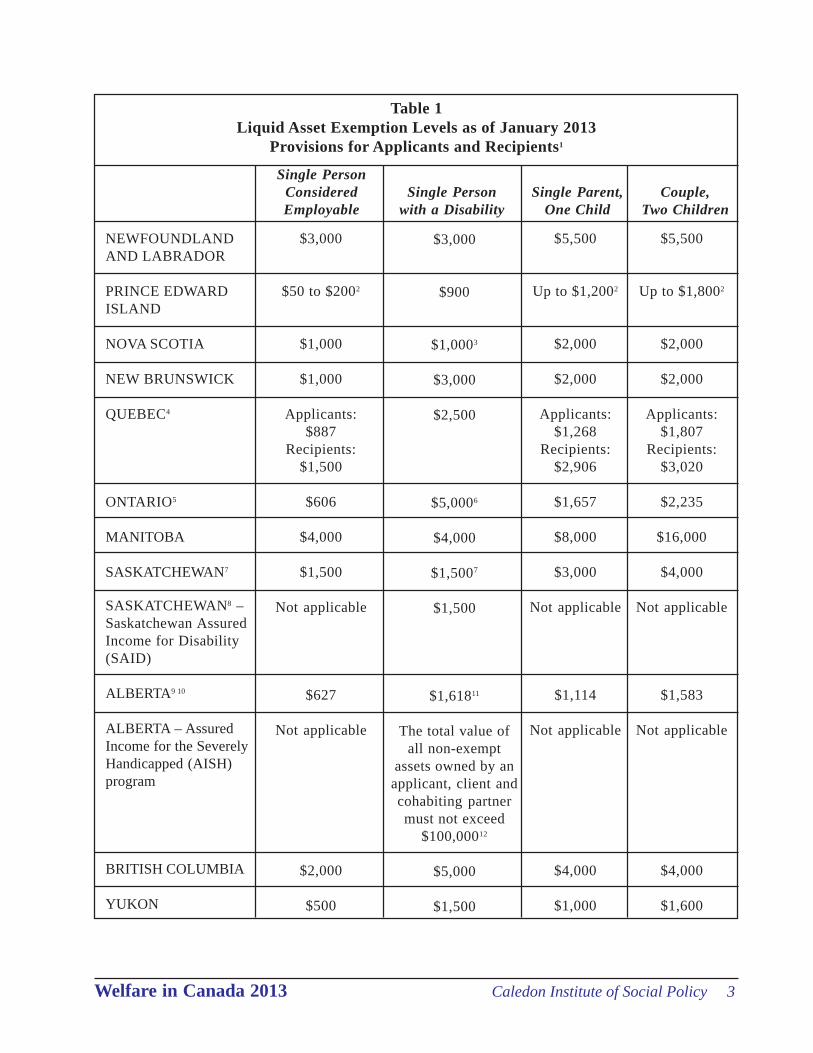
Table 1 shows the liquid asset exemption levels in effect as of January 2013. These varyconsiderably by jurisdiction and by household category and size. Changes that occurred duringthe year are outlined in the footnotes.
Welfare in Canada 2013 Caledon Institute of Social Policy 3
Table 1Liquid Asset Exemption Levels as of January 2013
Provisions for Applicants and Recipients1
NEWFOUNDLANDAND LABRADOR
PRINCE EDWARDISLAND
NOVA SCOTIA
NEW BRUNSWICK
QUEBEC4
ONTARIO5
MANITOBA
SASKATCHEWAN7
SASKATCHEWAN8 –Saskatchewan AssuredIncome for Disability(SAID)
ALBERTA9 10
ALBERTA – AssuredIncome for the SeverelyHandicapped (AISH)program
BRITISH COLUMBIA
YUKON
Single PersonConsideredEmployable
Single Personwith a Disability
Single Parent,One Child
Couple,Two Children
$3,000
$50 to $2002
$1,000
$1,000
Applicants:$887
Recipients:$1,500
$606
$4,000
$1,500
Not applicable
$627
Not applicable
$2,000
$500
$3,000
$900
$1,0003
$3,000
$2,500
$5,0006
$4,000
$1,5007
$1,500
$1,61811
The total value ofall non-exempt
assets owned by anapplicant, client andcohabiting partnermust not exceed
$100,00012
$5,000
$1,500
$5,500
Up to $1,2002
$2,000
$2,000
Applicants:$1,268
Recipients:$2,906
$1,657
$8,000
$3,000
Not applicable
$1,114
Not applicable
$4,000
$1,000
$5,500
Up to $1,8002
$2,000
$2,000
Applicants:$1,807
Recipients:$3,020
$2,235
$16,000
$4,000
Not applicable
$1,583
Not applicable
$4,000
$1,600

4 Caledon Institute of Social Policy Welfare in Canada 2013
1. Unless otherwise noted, the asset exemption provisions apply to both those applying for and receiving socialassistance.
2. Applicants requiring short-term assistance (four months or less) cannot have assets in excess of $50. The higherasset exemption levels apply to those requiring long-term assistance.
3. Individuals who were in receipt of Family Benefits when the ESIA program was enacted were grandparented. Forthese clients, the asset exemption for single individuals with disabilities is $3,000, for married individuals withdisabilities it is $5,500 and for single parents without disabilities it is $2,500.
4. At the time of application, an applicant’s liquid assets may not exceed the allowable limits set according to familysize. The determination of a household’s assets excludes income received during the month of application whichis to cover the cost of rent, heating and public utilities. Higher asset exemption levels apply after the first monthfor clients with no severe limitations to employment (social assistance program).
5. Asset levels were increased for Ontario Works clients in September 2013 to $2,500 for a single person, $3,000 fora single parent with one child and $6,000 for a couple with two children.
6. This amount represents the prescribed asset exemption level for a single person on the Ontario Disability SupportProgram.
7. Exemption levels are for the Transitional Employment Allowance (TEA) program except for the single personwith a disability. The exemption level for this client is for the Saskatchewan Assistance Plan (SAP).
8. In 2009, the Saskatchewan Assured Income for Disability (SAID) program was introduced. Initially, it supportedindividuals with disabilities in residential care. In June 2012, SAID was expanded to include persons withdisabilities living independently. The asset exemption level is the same as for a person with disabilities under theSaskatchewan Assistance Plan (SAP).
9. The maximum allowable liquid assets for those in the “expected to work” category of Income Support areequivalent to one month’s core benefit for the applicable household unit. The maximum applicable National ChildBenefit Supplement is included for families with children. Households receive an additional $33 for each childover the age of 12.
10. In August 2013, asset levels for the single parent with one child and the couple with two children increased to$1,118 and $1,599 respectively when the National Child Benefit Supplement was increased.
11. This represents the amount for an Income Support client in the “barriers to full employment” category. For thosein the “barriers to full employment” category, the maximum allowable liquid assets are equivalent to two months’core benefits. Asset exemption levels for clients in the “barriers to full employment” category include the PersonalNeeds Supplement (effective August 2005) of $78 per month.
12. Exempt assets are not counted in the $100,000 limit. Examples of exempt assets include a principal residence, anon-recreational vehicle, an adapted vehicle, clothing and household items, a locked-in retirement account (LIRA)and a registered disability savings plan (RDSP). AISH clients with non-exempt assets of $3,000 or less may alsoreceive Personal Benefits (e.g., for child care, moving, addiction treatment) and a monthly Child Benefit of $100per dependent child.
13. In Nunavut, there is no exemption on liquid assets other than for persons with disabilities and persons 60 years ofage or older.
Table 1 (continued)Liquid Asset Exemption Levels as of January 2013
Provisions for Applicants and Recipients1
Single PersonConsideredEmployable
Single Personwith a Disability
Single Parent,One Child
Couple,Two Children
NORTHWESTTERRITORIES
NUNAVUT13
$300
$0
$50,000
$5,000
$380
$0
$560
$0

Welfare in Canada 2013 Caledon Institute of Social Policy 5
Income
The next step in determining welfare eligibility is to assess available household income.Income may be exempt, partially exempt or non-exempt.
Exempt income is not taken into account when determining the amount of welfareassistance. The Canada Child Tax Benefit, child welfare payments, and federal and provincial/territorial tax credits, for example, are all considered exempt income.
Non-exempt income reduces the amount of assistance payable dollar for dollar. Pensionincome and Workers’ Compensation payments, for instance, are non-exempt sources of incomeand are therefore deemed available to support the household.
There are also small amounts permitted in respect of paid employment. These areknown as earnings exemptions and are described below.
Earnings exemption provisions
Earnings exemptions permit welfare recipients to earn a certain amount of money beforebenefits are reduced. These exemptions are intended to provide a modest work incentive andenable a household to increase its overall income.
There are several approaches taken in calculating earnings exemptions, which vary byprovince and territory.
A flat-rate amount permits a client to earn up to a stipulated sum before welfare benefitsare reduced dollar for dollar.
A percentage of earnings approach means that welfare benefits are cut back by a setpercentage. If a jurisdiction has a 50 percent earnings exemption policy, for example, then thewelfare entitlement is reduced by 50 percent of the client’s earnings.
A combination of the flat-rate amount and a percentage of earnings means that once theflat rate is exceeded, benefits are reduced by the designated percentage.
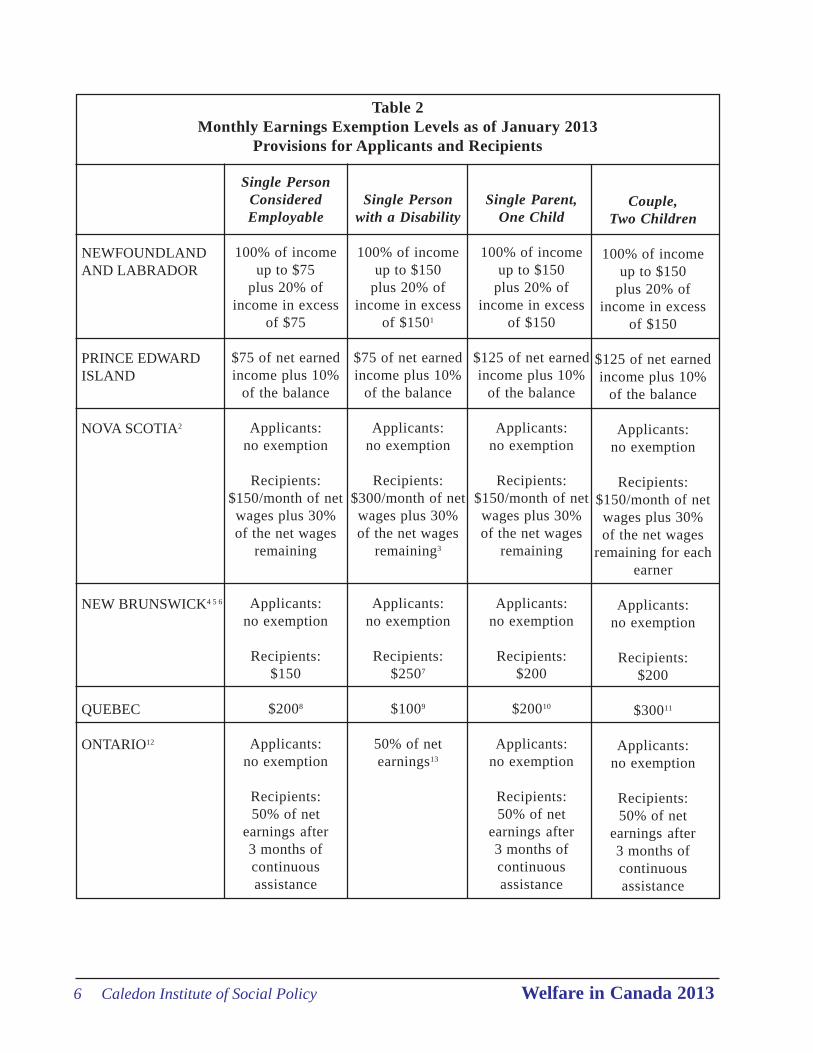
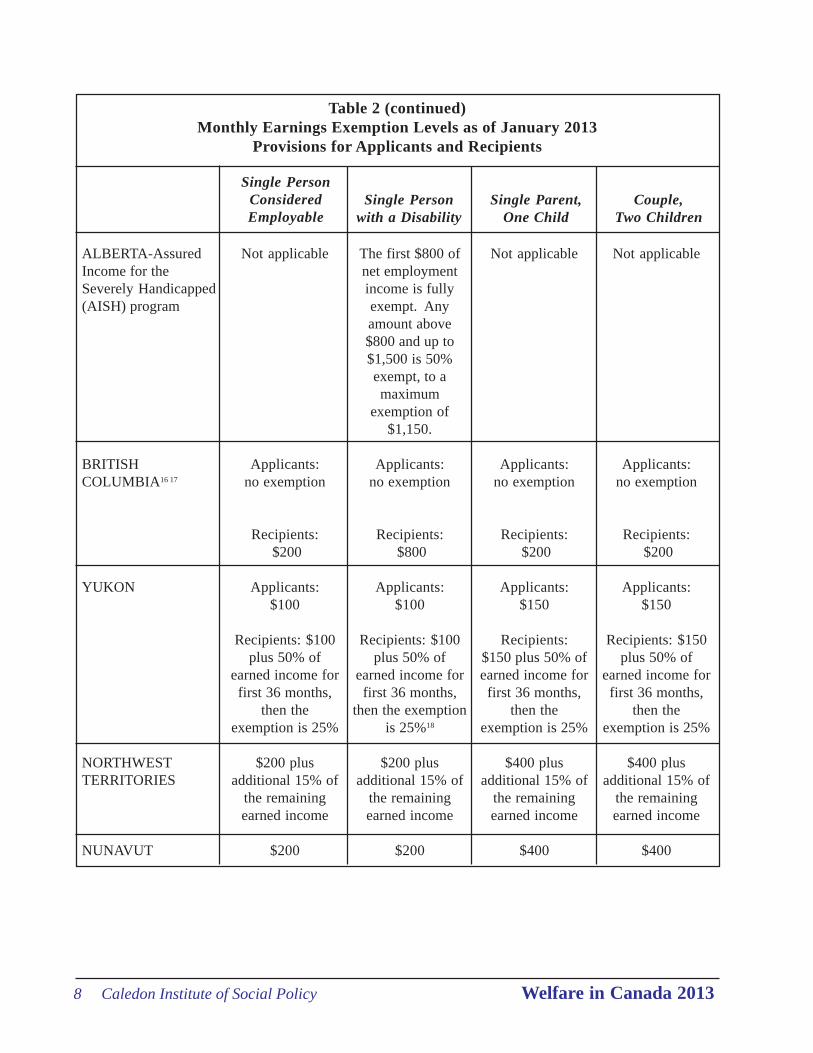
Table 2 shows the earnings exemption levels in effect as of January 1, 2013. Anychanges that occurred during the year are explained in the footnotes to the table. Note thatsome jurisdictions have different provisions for persons or households applying for welfarecompared to those already receiving benefits.
6 Caledon Institute of Social Policy Welfare in Canada 2013
Table 2Monthly Earnings Exemption Levels as of January 2013
Provisions for Applicants and Recipients
NEWFOUNDLANDAND LABRADOR
PRINCE EDWARDISLAND
NOVA SCOTIA2
NEW BRUNSWICK4 5 6
QUEBEC
ONTARIO12
Single PersonConsideredEmployable
100% of incomeup to $75
plus 20% ofincome in excess
of $75
$75 of net earnedincome plus 10%
of the balance
Applicants:no exemption
Recipients:$150/month of netwages plus 30%of the net wages
remaining
Applicants:no exemption
Recipients:$150
$2008
Applicants:no exemption
Recipients:50% of net
earnings after3 months ofcontinuousassistance
Single Personwith a Disability
100% of incomeup to $150
plus 20% ofincome in excess
of $1501
$75 of net earnedincome plus 10%
of the balance
Applicants:no exemption
Recipients:$300/month of netwages plus 30%of the net wages
remaining3
Applicants:no exemption
Recipients:$2507
$1009
50% of netearnings13
Single Parent,One Child
100% of incomeup to $150
plus 20% ofincome in excess
of $150
$125 of net earnedincome plus 10%
of the balance
Applicants:no exemption
Recipients:$150/month of netwages plus 30%of the net wages
remaining
Applicants:no exemption
Recipients:$200
$20010
Applicants:no exemption
Recipients:50% of net
earnings after3 months ofcontinuousassistance
Couple,Two Children
100% of incomeup to $150
plus 20% ofincome in excess
of $150
$125 of net earnedincome plus 10%
of the balance
Applicants:no exemption
Recipients:$150/month of netwages plus 30%of the net wages
remaining for eachearner
Applicants:no exemption
Recipients:$200
$30011
Applicants:no exemption
Recipients:50% of net
earnings after3 months ofcontinuousassistance

Welfare in Canada 2013 Caledon Institute of Social Policy 7
Table 2 (continued)Monthly Earnings Exemption Levels as of January 2013
Provisions for Applicants and Recipients
Single PersonConsideredEmployable
Single Personwith a Disability
Single Parent,One Child
Couple,Two Children
Applicants:$200 of net
earnings
Recipients:after one month,
$200 of netearnings plus
30% of netearnings over
$200
No earningsexemption
(TEA clients)
Not applicable
Applicants:no exemption
Recipients:$230 of net
income plus 25%of the remaining
net income
MANITOBA14
SASKATCHEWAN
SASKATCHEWAN -SaskatchewanAssured Income forDisability (SAID)15
ALBERTA
Applicants:$200 of net
earnings
Recipients:after one month,
$200 of netearnings plus
30% of netearnings over
$200
$200 plus 25% ofthe next $500 for
a maximum of$325
(SAP clients)
$200 plus 25% ofthe next $500 for
a maximum of$325
Applicants:no exemption
Recipients:$230 of net
income plus 25%of the remaining
net income
Applicants:$200 of net
earnings
Recipients:after one month,
$200 of netearnings plus30% of net
earnings over$200
No earningsexemption
(TEA clients)
Clients withearnings over
$125 are eligiblefor the
SaskatchewanEmploymentSupplement
Not applicable
Applicants:no exemption
Recipients:$230 of net
income plus 25%of the remaining
net income
Applicants:$200 of netearnings foreach earner
Recipients: afterone month, $200of net earningsplus 30% of netearnings over$200, for each
earner
No earningsexemption
(TEA clients)
Clients withearnings over
$125 are eligiblefor the
SaskatchewanEmploymentSupplement
Not applicable
Applicants:no exemption
Recipients:$115 of net
income plus 25%of the remaining
net income(for each
working adult)
8 Caledon Institute of Social Policy Welfare in Canada 2013
Table 2 (continued)Monthly Earnings Exemption Levels as of January 2013
Provisions for Applicants and Recipients
Single PersonConsideredEmployable
Single Personwith a Disability
Single Parent,One Child
Couple,Two Children
Not applicable
Applicants:no exemption
Recipients: $200
Applicants:$100
Recipients: $100plus 50% of
earned income forfirst 36 months,
then theexemption is 25%
$200 plusadditional 15% of
the remainingearned income
$200
ALBERTA-AssuredIncome for theSeverely Handicapped(AISH) program
BRITISHCOLUMBIA16 17
YUKON
NORTHWESTTERRITORIES
NUNAVUT
The first $800 ofnet employmentincome is fullyexempt. Anyamount above$800 and up to$1,500 is 50%exempt, to amaximum
exemption of$1,150.
Applicants:no exemption
Recipients: $800
Applicants:$100
Recipients: $100plus 50% of
earned income forfirst 36 months,
then the exemptionis 25%18
$200 plusadditional 15% of
the remainingearned income
$200
Not applicable
Applicants:no exemption
Recipients: $200
Applicants:$150
Recipients:$150 plus 50% ofearned income forfirst 36 months,
then theexemption is 25%
$400 plusadditional 15% of
the remainingearned income
$400
Not applicable
Applicants:no exemption
Recipients: $200
Applicants:$150
Recipients: $150plus 50% of
earned income forfirst 36 months,
then theexemption is 25%
$400 plusadditional 15% of
the remainingearned income
$400
Welfare in Canada 2013 Caledon Institute of Social Policy 9
1. This amount applies to a single person with a disability requiring supportive services.2. In Nova Scotia, families already in receipt of assistance may also earn up to $3,000 annually through the
Harvest Connection program without these earnings affecting their basic income assistance payment.3. This provision applies to persons with disabilities participating in supported employment.4. New Brunswick has two types of wage exemptions. The regular Wage Exemption amounts are shown in the
above table. The Extended Wage Exemption (EWE) provides higher exemptions to clients during theirtransition to self-sufficiency. A client may only receive one type of exemption at any time. The EWE, whichis limited to a maximum of two years, exempts a percentage of net income based on the household type.Singles and families with no children may receive an exemption of up to 30 percent of net earned income forthe first six months, 25 percent of net income for the next six months, then the appropriate flat-rate wageexemption for the remaining 12 months. Families with children may receive an exemption of up to35 percent of income for the first six months, 30 percent of income for the next six months, then the regularflat-rate wage exemption for the remaining 12 months. (See footnote 6.)
5. All amounts shown are for the Transitional Assistance program except for the single person with a disability.6. New Brunswick’s earnings exemption provisions changed effective October 1, 2013. The flat-rate
exemptions were retained and the new provisions exempted an additional 30 percent of total wages in excessof the flat-rate amount. The Extended Wage Exemption was rescinded.
7. This amount is for a single person with a disability under the Extended Benefits program.8. This provision is for a person in the Social Assistance program with no severe limitations to employment.9. This amount is for a person in the Social Solidarity program with severe limitations to employment.10. This exemption is for a person in the Social Assistance program with temporary limitations to employment.11. This amount is for a couple in the Social Assistance program regardless of the type of limitations to
employment.12. In September 2013, earnings exemption provisions were enhanced for both Ontario Works and Ontario
Disability Support Program recipients. A flat-rate exemption of $200 per adult was introduced. Earnings inexcess of this amount, continue to be exempt at the rate of 50 percent.
13. In addition, a monthly $100 Work-Related Benefit is paid to each eligible adult family member in any monthhe/she receives earnings.
14. Manitoba also provides the Rewarding Work Allowance (RWA) to all employed adults without disabilities onincome assistance. The RWA is $100 for people without disabilities working more than 80 hours or 10 daysin a month, or $50 for those working less. Employed persons with disabilities receive similar benefits.
15. In 2009, the Saskatchewan Assured Income for Disability (SAID) program was introduced. Initially, itsupported individuals with disabilities in residential care. In June 2012, SAID was expanded to includepersons with disabilities living independently. Earnings exemptions are the same as those for a person with adisability under the Saskatchewan Assistance Plan (SAP).
16. Recipients under either program had to be on assistance for one month before the exemption applied.17. In January 2013, BC introduced an annualized earnings exemption for persons receiving Disability
Assistance. The new provision gave individuals the option to calculate earnings exemption on an annual,rather than a monthly, basis. This option is beneficial for persons with episodic medical conditions that mayprevent them from working consistently. For 2013, the maximum annual earnings exemption was $9,600 fora single person with a disability.
18. Effective July 2005, persons who qualified for the Yukon Supplementary Allowance (payable to persons withdisabilities and the elderly) were eligible for an additional annual earned income exemption of up to $3,900.
10 Caledon Institute of Social Policy Welfare in Canada 2013
Welfare incomes
Total welfare incomes for the four household types in each of the provinces andterritories are presented in Appendix A. For each province and territory, total welfare incomesare made up of basic social assistance, regularly paid additional social assistance benefits,federal child benefits, provincial/territorial child benefits, the GST/HST credit and provincial/territorial tax credits. The footnotes to Appendix A give details on the components of the table.
The social assistance amounts are calculated using the following basic assumptions:
• the household started to receive assistance on January 1 and remained on assistancefor the entire year.
• any changes to welfare rates or other program rates over the course of the year arefactored in.
• basic rates and regularly recurring additional items – for example, a ChristmasAllowance or a back-to-school allowance – are included. Special needs amounts arenot included.
• the household had no earnings so was eligible to receive the maximum rate ofassistance.
• the heads of all households are deemed to be fully employable, with the exception ofthe single person with a long-term disability.
• the households live in the largest city or town in their province or territory.• the households live in private market housing and utility costs are included in the
rent.
In some cases, we have revised the approach employed in earlier editions of the reportbased on feedback from provincial or territorial officials. In other instances, new programshave been added. These changes are summarized below.
Prince Edward Island
• The new PEI Sales Tax Credit is included for 2013. The maximum credit is $100per year for a single person and $150 per year for a family. First payments weremade in July 2013.
Nova Scotia
• The Nova Scotia Poverty Reduction Credit is no longer included. The credit is paidto childless Income Assistance households that received assistance during the entireprevious year. In this report, we assume households came on assistance on January1 of the current year.
Welfare in Canada 2013 Caledon Institute of Social Policy 11
Saskatchewan
• The Saskatchewan Assured Income for Disability (SAID) program was introduced in2009. Initially, it supported individuals in residential care with significant andenduring disabilities. In June 2012, SAID was expanded to include persons withsignificant and enduring disabilities living independently. Starting in 2013, anadditional row showing SAID benefits for a single person with a disability isincluded in the tables.
British Columbia
• In April 2013, BC returned to the former provincial sales tax system. The lastpayment under the BC Harmonized Sales Tax Credit was made in January 2013.
Welfare incomes over time
The figures in this series track total welfare incomes for the period 1986 to 2013 foreach of the four illustrative family types. All figures are presented in constant 2013 dollars,taking into account the effect of inflation.
All the graphs for the provinces start in 1986, other than for the single person with adisability. Figures for this household type were calculated starting in 1989. There are noentries for any of the households in 1987 and 1988, as welfare incomes were not calculated inthose years. Data for the territories began in 1986 for Yukon, 1993 for the Northwest Territoriesand 1999 for Nunavut.
Appendices B.1 through B.13 contain the data used to compile the graphs.
Newfoundland and Labrador
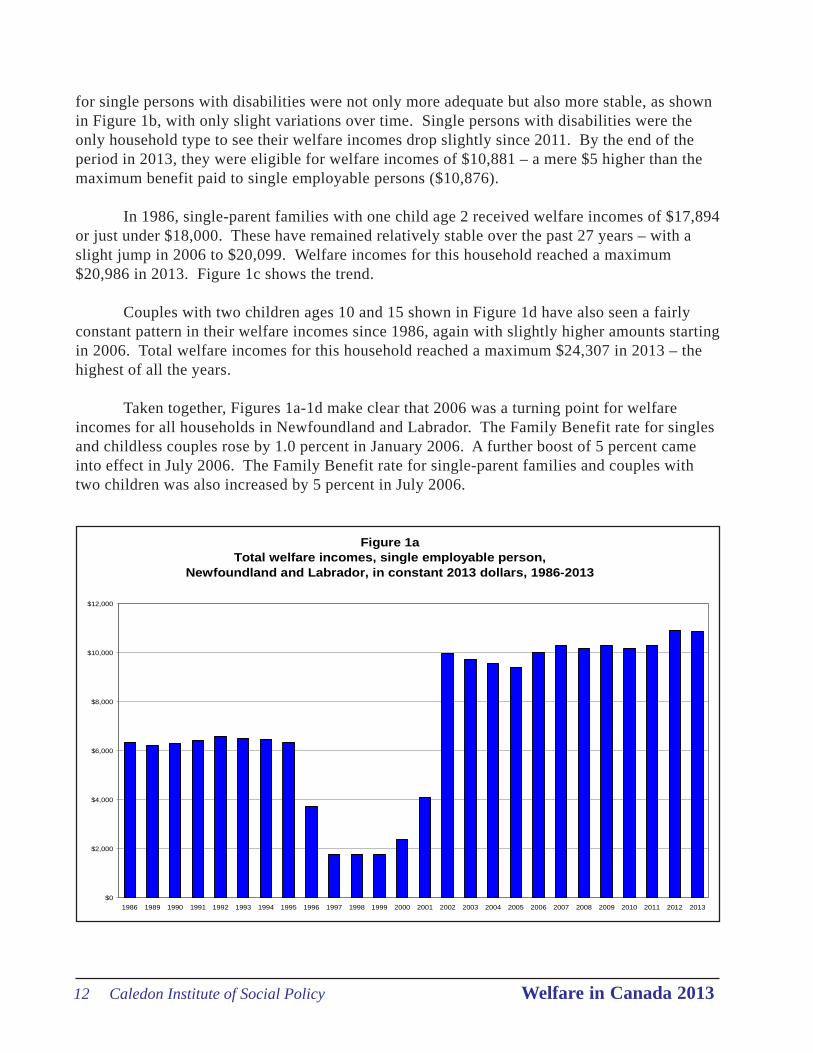
From 1986 through 1995, single employable persons received just over $6,000 inwelfare incomes. After that point, their incomes dropped precipitously to less than $2,000 in1997, 1998 and 1999, then went up in 2000, 2001 and 2002, remaining around $10,000 until2011. The ‘cliff’ seen in Figure 1a was due primarily to changes in the way in which theprovince calculated shelter allowances for this particular household type. It shifted from thepayment of market rent to room-and-board allowances, which are substantially lower than theformer amount. By 2013, welfare incomes for single employable households had reached$10,876 in recognition of the drastically low benefits paid in the late 1990s.
At the beginning of the period, single persons with disabilities received a maximum$12,440 – double that of single employable recipients ($6,233). While still low relative tomajor benchmarks, namely poverty lines and median and average incomes, the income amounts
12 Caledon Institute of Social Policy Welfare in Canada 2013
Figure 1aTotal welfare incomes, single employable person,
Newfoundland and Labrador, in constant 2013 dollars, 1986-2013
$0
$2,000
$4,000
$6,000
$8,000
$10,000
$12,000
1986 1989 1990 1991 1992 1993 1994 1995 1996 1997 1998 1999 2000 2001 2002 2003 2004 2005 2006 2007 2008 2009 2010 2011 2012 2013
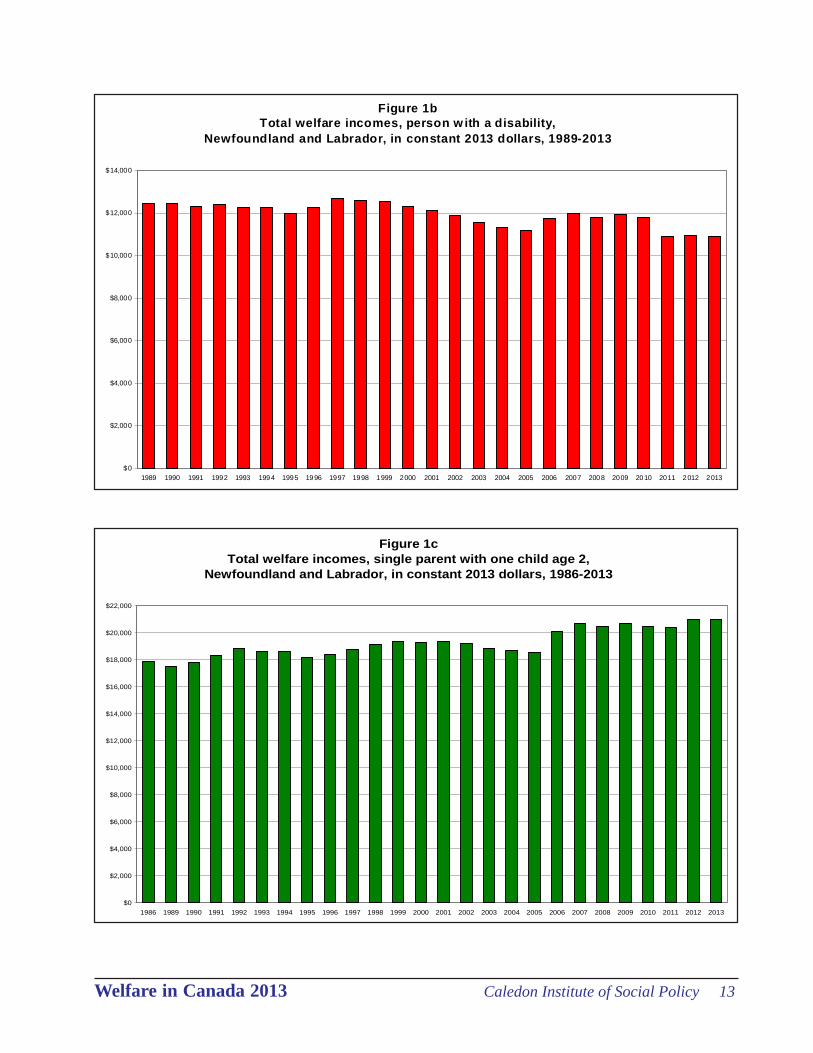
for single persons with disabilities were not only more adequate but also more stable, as shownin Figure 1b, with only slight variations over time. Single persons with disabilities were theonly household type to see their welfare incomes drop slightly since 2011. By the end of theperiod in 2013, they were eligible for welfare incomes of $10,881 – a mere $5 higher than themaximum benefit paid to single employable persons ($10,876).
In 1986, single-parent families with one child age 2 received welfare incomes of $17,894or just under $18,000. These have remained relatively stable over the past 27 years – with aslight jump in 2006 to $20,099. Welfare incomes for this household reached a maximum$20,986 in 2013. Figure 1c shows the trend.
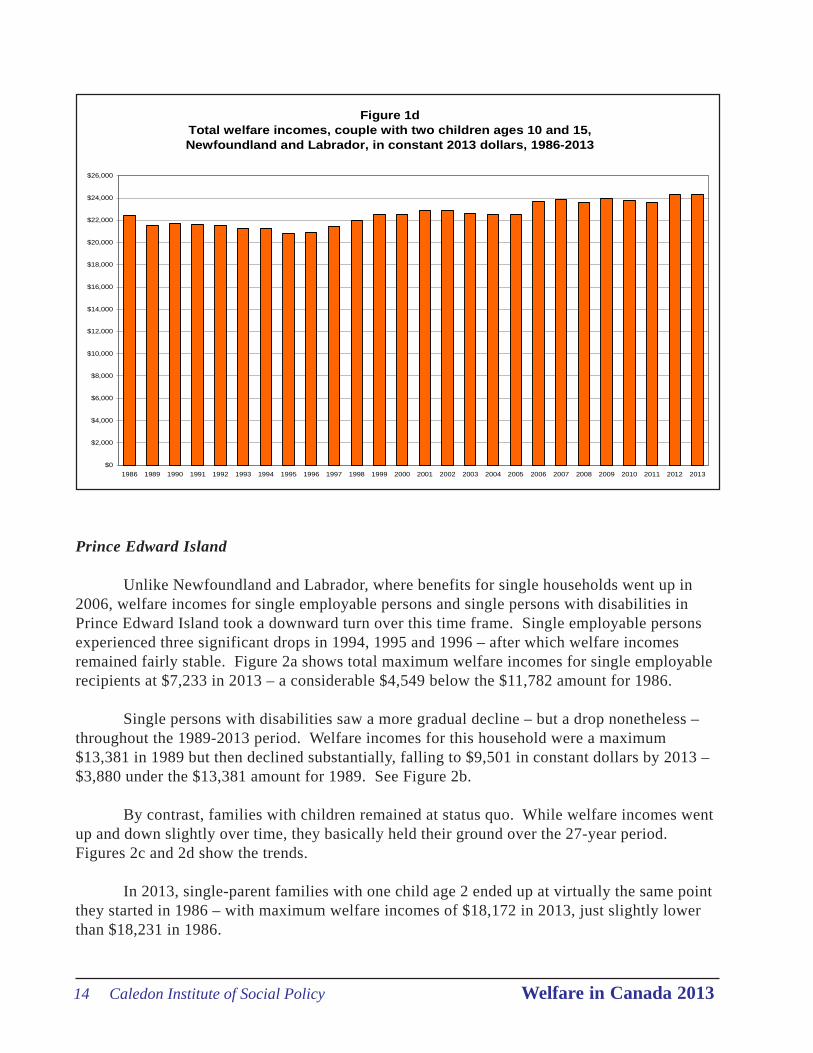
Couples with two children ages 10 and 15 shown in Figure 1d have also seen a fairlyconstant pattern in their welfare incomes since 1986, again with slightly higher amounts startingin 2006. Total welfare incomes for this household reached a maximum $24,307 in 2013 – thehighest of all the years.
Taken together, Figures 1a-1d make clear that 2006 was a turning point for welfareincomes for all households in Newfoundland and Labrador. The Family Benefit rate for singlesand childless couples rose by 1.0 percent in January 2006. A further boost of 5 percent cameinto effect in July 2006. The Family Benefit rate for single-parent families and couples withtwo children was also increased by 5 percent in July 2006.
Welfare in Canada 2013 Caledon Institute of Social Policy 13
Figure 1bTotal welfare incomes, person w ith a disability,
Newfoundland and Labrador, in constant 2013 dollars, 1989-2013
$0
$2,000
$4,000
$6,000
$8,000
$10,000
$12,000
$14,000
1989 1990 1991 1992 1993 1994 1995 1996 1997 1998 1999 2000 2001 2002 2003 2004 2005 2006 2007 2008 2009 2010 2011 2012 2013
Figure 1cTotal welfare incomes, single parent with one child age 2,
Newfoundland and Labrador, in constant 2013 dollars, 1986-2013
$0
$2,000
$4,000
$6,000
$8,000
$10,000
$12,000
$14,000
$16,000
$18,000
$20,000
$22,000
1986 1989 1990 1991 1992 1993 1994 1995 1996 1997 1998 1999 2000 2001 2002 2003 2004 2005 2006 2007 2008 2009 2010 2011 2012 2013
14 Caledon Institute of Social Policy Welfare in Canada 2013
Figure 1dTotal welfare incomes, couple with two children ages 10 and 15,Newfoundland and Labrador, in constant 2013 dollars, 1986-2013
$0
$2,000
$4,000
$6,000
$8,000
$10,000
$12,000
$14,000
$16,000
$18,000
$20,000
$22,000
$24,000
$26,000
1986 1989 1990 1991 1992 1993 1994 1995 1996 1997 1998 1999 2000 2001 2002 2003 2004 2005 2006 2007 2008 2009 2010 2011 2012 2013
Prince Edward Island
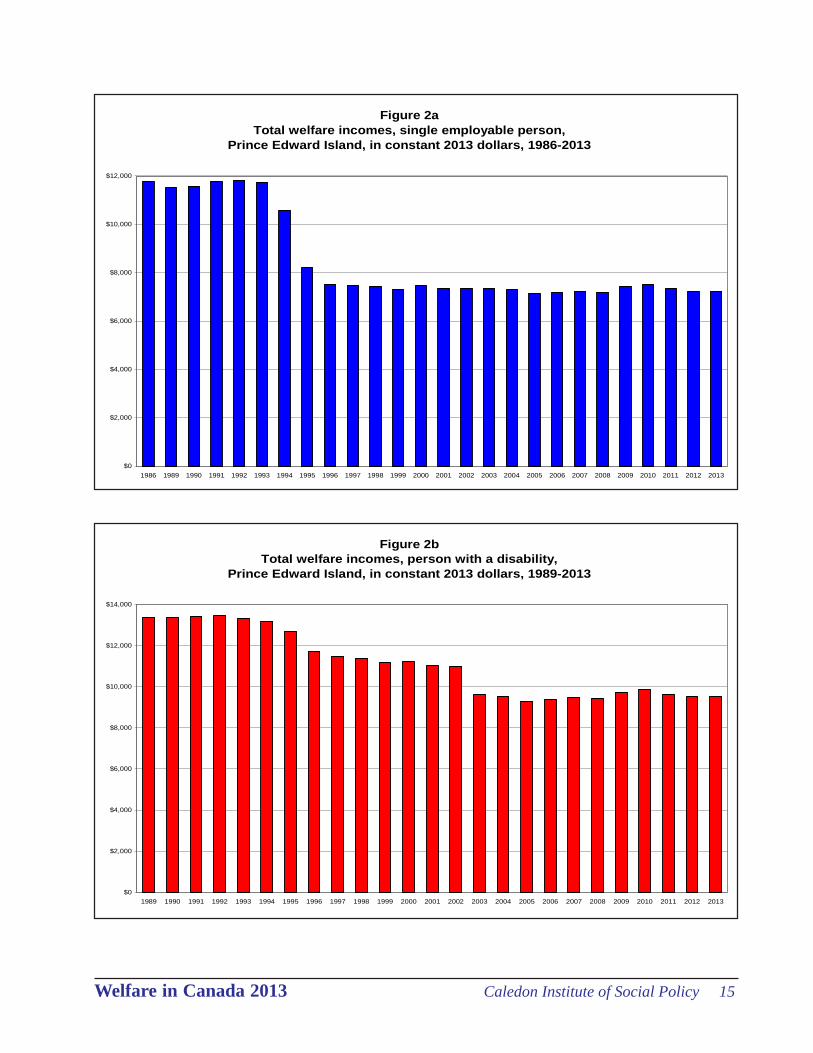
Unlike Newfoundland and Labrador, where benefits for single households went up in2006, welfare incomes for single employable persons and single persons with disabilities inPrince Edward Island took a downward turn over this time frame. Single employable personsexperienced three significant drops in 1994, 1995 and 1996 – after which welfare incomesremained fairly stable. Figure 2a shows total maximum welfare incomes for single employablerecipients at $7,233 in 2013 – a considerable $4,549 below the $11,782 amount for 1986.
Single persons with disabilities saw a more gradual decline – but a drop nonetheless –throughout the 1989-2013 period. Welfare incomes for this household were a maximum$13,381 in 1989 but then declined substantially, falling to $9,501 in constant dollars by 2013 –$3,880 under the $13,381 amount for 1989. See Figure 2b.
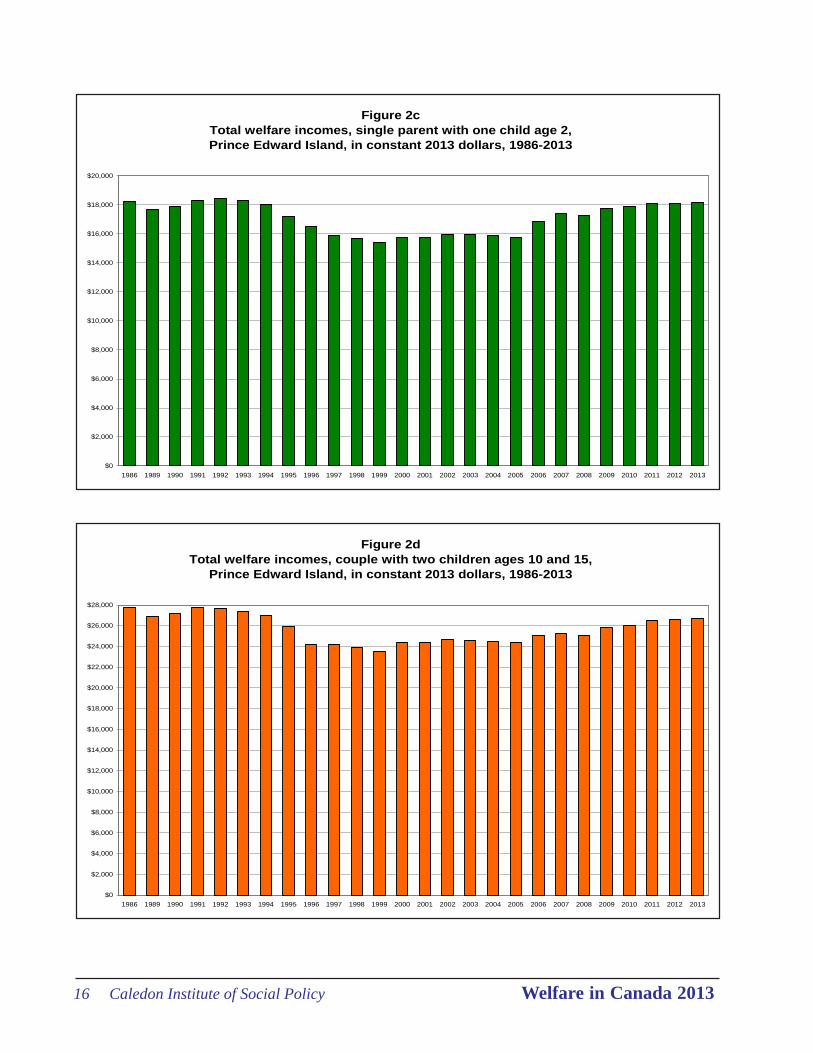
By contrast, families with children remained at status quo. While welfare incomes wentup and down slightly over time, they basically held their ground over the 27-year period.Figures 2c and 2d show the trends.
In 2013, single-parent families with one child age 2 ended up at virtually the same pointthey started in 1986 – with maximum welfare incomes of $18,172 in 2013, just slightly lowerthan $18,231 in 1986.
Welfare in Canada 2013 Caledon Institute of Social Policy 15
Figure 2bTotal welfare incomes, person with a disability,
Prince Edward Island, in constant 2013 dollars, 1989-2013
$0
$2,000
$4,000
$6,000
$8,000
$10,000
$12,000
$14,000
1989 1990 1991 1992 1993 1994 1995 1996 1997 1998 1999 2000 2001 2002 2003 2004 2005 2006 2007 2008 2009 2010 2011 2012 2013
Figure 2aTotal welfare incomes, single employable person,
Prince Edward Island, in constant 2013 dollars, 1986-2013
$0
$2,000
$4,000
$6,000
$8,000
$10,000
$12,000
1986 1989 1990 1991 1992 1993 1994 1995 1996 1997 1998 1999 2000 2001 2002 2003 2004 2005 2006 2007 2008 2009 2010 2011 2012 2013
16 Caledon Institute of Social Policy Welfare in Canada 2013
Figure 2cTotal welfare incomes, single parent with one child age 2, Prince Edward Island, in constant 2013 dollars, 1986-2013
$0
$2,000
$4,000
$6,000
$8,000
$10,000
$12,000
$14,000
$16,000
$18,000
$20,000
1986 1989 1990 1991 1992 1993 1994 1995 1996 1997 1998 1999 2000 2001 2002 2003 2004 2005 2006 2007 2008 2009 2010 2011 2012 2013
Figure 2dTotal welfare incomes, couple with two children ages 10 and 15,
Prince Edward Island, in constant 2013 dollars, 1986-2013
$0
$2,000
$4,000
$6,000
$8,000
$10,000
$12,000
$14,000
$16,000
$18,000
$20,000
$22,000
$24,000
$26,000
$28,000
1986 1989 1990 1991 1992 1993 1994 1995 1996 1997 1998 1999 2000 2001 2002 2003 2004 2005 2006 2007 2008 2009 2010 2011 2012 2013

Welfare in Canada 2013 Caledon Institute of Social Policy 17
Welfare incomes for two-parent families with two children ages 10 and 15 followed asimilar up-down pattern starting at a maximum $27,780 in 1986 and ending at $26,690 in 2013,losing ground slightly over the 1986-2013 period.
Nova Scotia
The early 1990s were better years for single welfare recipients than later decades.Welfare levels dropped substantially from a ‘high’ of $9,770 in 1989 down to $5,889 in 2000.Figure 3a shows that these incomes have remained at relatively low levels and were only $7,076in 2013.
Figure 3aTotal welfare incomes, single employable person,Nova Scotia, in constant 2013 dollars, 1986-2013
$0
$2,000
$4,000
$6,000
$8,000
$10,000
1986 1989 1990 1991 1992 1993 1994 1995 1996 1997 1998 1999 2000 2001 2002 2003 2004 2005 2006 2007 2008 2009 2010 2011 2012 2013
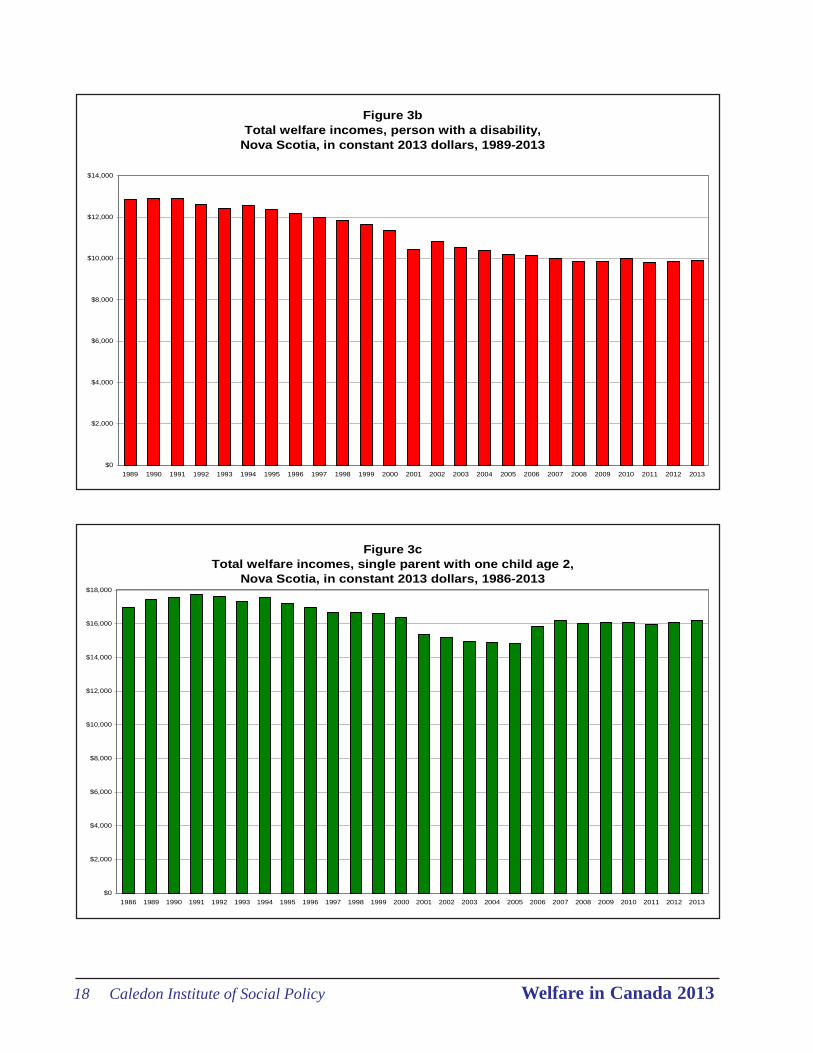
As in PEI, single persons with disabilities in Nova Scotia saw a slow but steady declineover time. Welfare incomes began the period at $12,824 in 1989 but dropped continually in realterms to $9,908 at the end of the period. See Figure 3b.
Figure 3c shows that welfare incomes for single-parent families with one child went upand down only slightly over the years. They started the period at a maximum $16,987 in 1986and ended at $16,219 in 2013.
18 Caledon Institute of Social Policy Welfare in Canada 2013
Figure 3bTotal welfare incomes, person with a disability,
Nova Scotia, in constant 2013 dollars, 1989-2013
$0
$2,000
$4,000
$6,000
$8,000
$10,000
$12,000
$14,000
1989 1990 1991 1992 1993 1994 1995 1996 1997 1998 1999 2000 2001 2002 2003 2004 2005 2006 2007 2008 2009 2010 2011 2012 2013
Figure 3cTotal welfare incomes, single parent with one child age 2,
Nova Scotia, in constant 2013 dollars, 1986-2013
$0
$2,000
$4,000
$6,000
$8,000
$10,000
$12,000
$14,000
$16,000
$18,000
1986 1989 1990 1991 1992 1993 1994 1995 1996 1997 1998 1999 2000 2001 2002 2003 2004 2005 2006 2007 2008 2009 2010 2011 2012 2013

Welfare in Canada 2013 Caledon Institute of Social Policy 19
New Brunswick
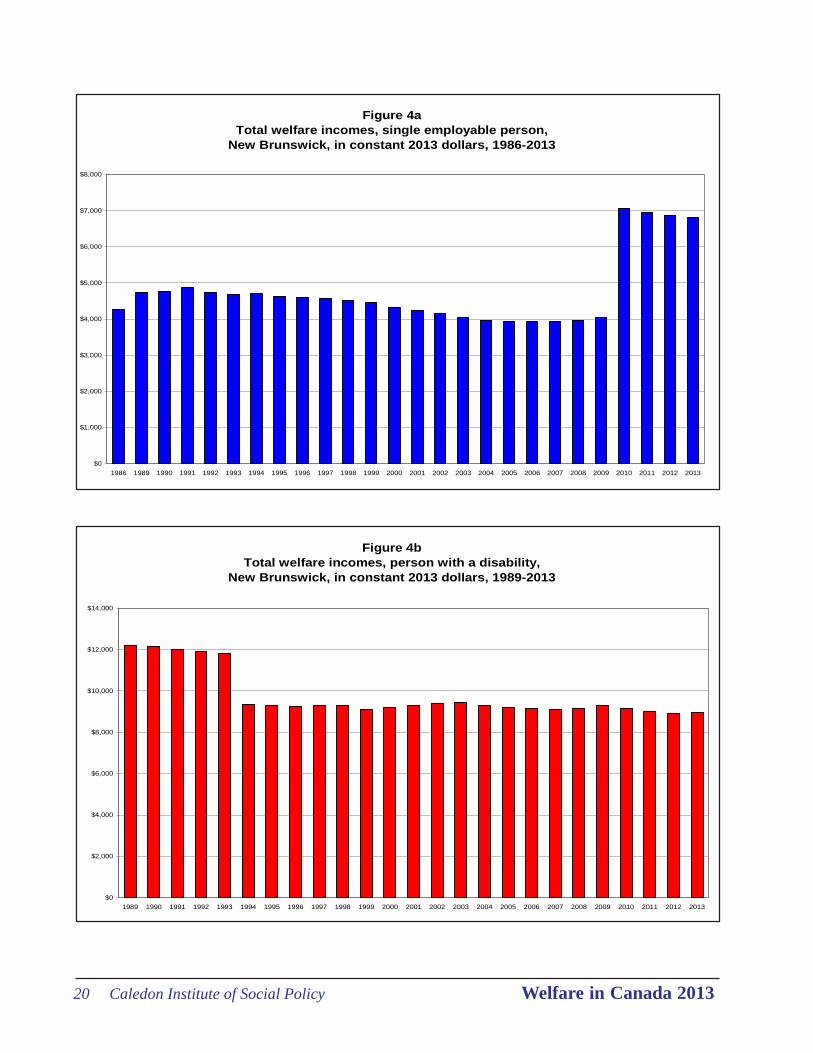
Single employable recipients in New Brunswick had low and virtually flat levels ofwelfare incomes from 1989 through 2009, at less than $5,000. Welfare incomes then jumpedsignificantly in 2010 to $7,054 and fell back to $6,807 in 2013. The substantial increase in2010 resulted from the province’s decision to abolish the Interim Assistance program so that allsingle employable persons became eligible for Transitional Assistance. See Figure 4a.
It can be seen in Figure 4b that the trend for single persons with disabilities wasprecisely opposite to that of employable recipients. Welfare incomes for single persons withdisabilities totalled $12,213 in 1989 and hovered at that level for several years. They then fellto $9,351 in 1994 where they have remained more or less the same for the past 20 years,amounting to $8,967 in 2013.
Figure 3d presents a slight wave-like pattern with only small variations for two-parentfamilies with two children ages 10 and 15. Welfare incomes were $22,032 in 1986 and stood at$23,114 in 2013.
Figure 3dTotal welfare incomes, couple with two children ages 10 and 15,
Nova Scotia, in constant 2013 dollars, 1986-2013
$0
$2,000
$4,000
$6,000
$8,000
$10,000
$12,000
$14,000
$16,000
$18,000
$20,000
$22,000
$24,000
$26,000
1986 1989 1990 1991 1992 1993 1994 1995 1996 1997 1998 1999 2000 2001 2002 2003 2004 2005 2006 2007 2008 2009 2010 2011 2012 2013
20 Caledon Institute of Social Policy Welfare in Canada 2013
Figure 4aTotal welfare incomes, single employable person,
New Brunswick, in constant 2013 dollars, 1986-2013
$0
$1,000
$2,000
$3,000
$4,000
$5,000
$6,000
$7,000
$8,000
1986 1989 1990 1991 1992 1993 1994 1995 1996 1997 1998 1999 2000 2001 2002 2003 2004 2005 2006 2007 2008 2009 2010 2011 2012 2013
Figure 4bTotal welfare incomes, person with a disability,
New Brunswick, in constant 2013 dollars, 1989-2013
$0
$2,000
$4,000
$6,000
$8,000
$10,000
$12,000
$14,000
1989 1990 1991 1992 1993 1994 1995 1996 1997 1998 1999 2000 2001 2002 2003 2004 2005 2006 2007 2008 2009 2010 2011 2012 2013

Welfare in Canada 2013 Caledon Institute of Social Policy 21
In Figure 4c, total welfare incomes for single-parent families with one child werepegged at $14,809 in 1986. These incomes have gone up and down slightly over the past 27years, ending at $16,769 in 2013.
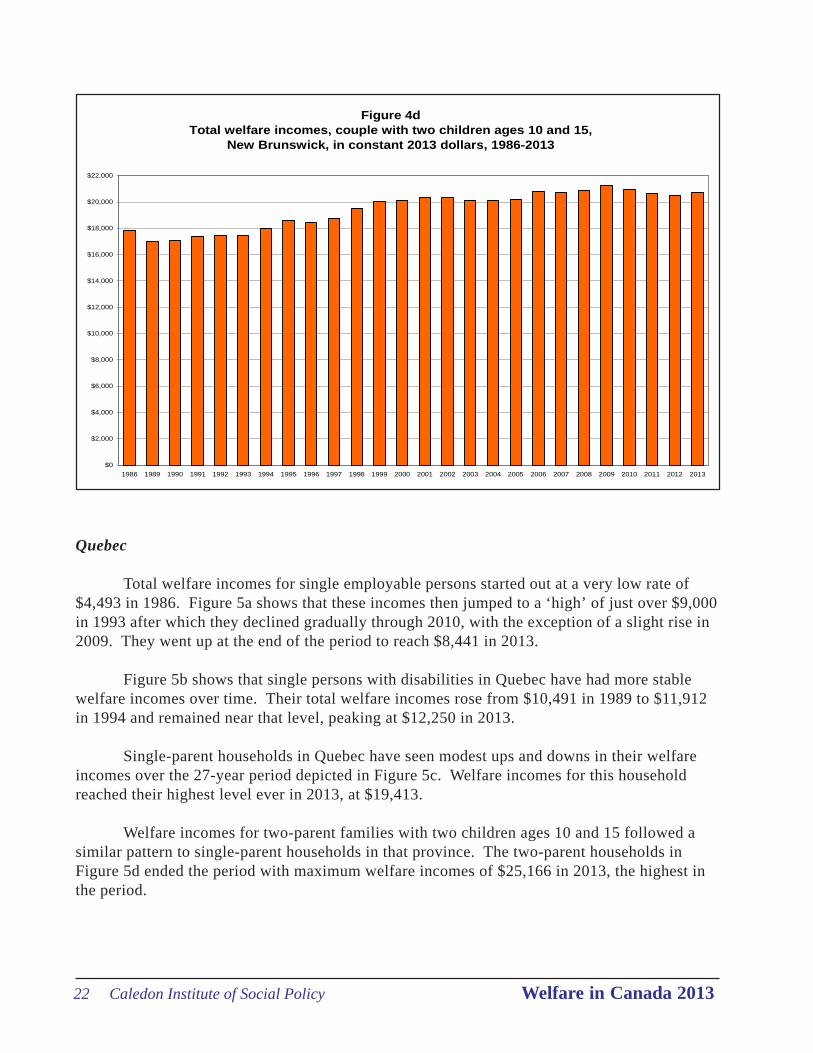
Welfare incomes for two-parent families with two children ages 10 and 15 in NewBrunswick followed a similar pattern as the single-parent households. In 1986, welfareincomes for couples with two children came to $17,848, rising to $20,724 in 2013. See Figure4d.
Figure 4cTotal welfare incomes, single parent with one child age 2,
New Brunswick, in constant 2013 dollars, 1986-2013
$0
$2,000
$4,000
$6,000
$8,000
$10,000
$12,000
$14,000
$16,000
$18,000
1986 1989 1990 1991 1992 1993 1994 1995 1996 1997 1998 1999 2000 2001 2002 2003 2004 2005 2006 2007 2008 2009 2010 2011 2012 2013
22 Caledon Institute of Social Policy Welfare in Canada 2013
Quebec
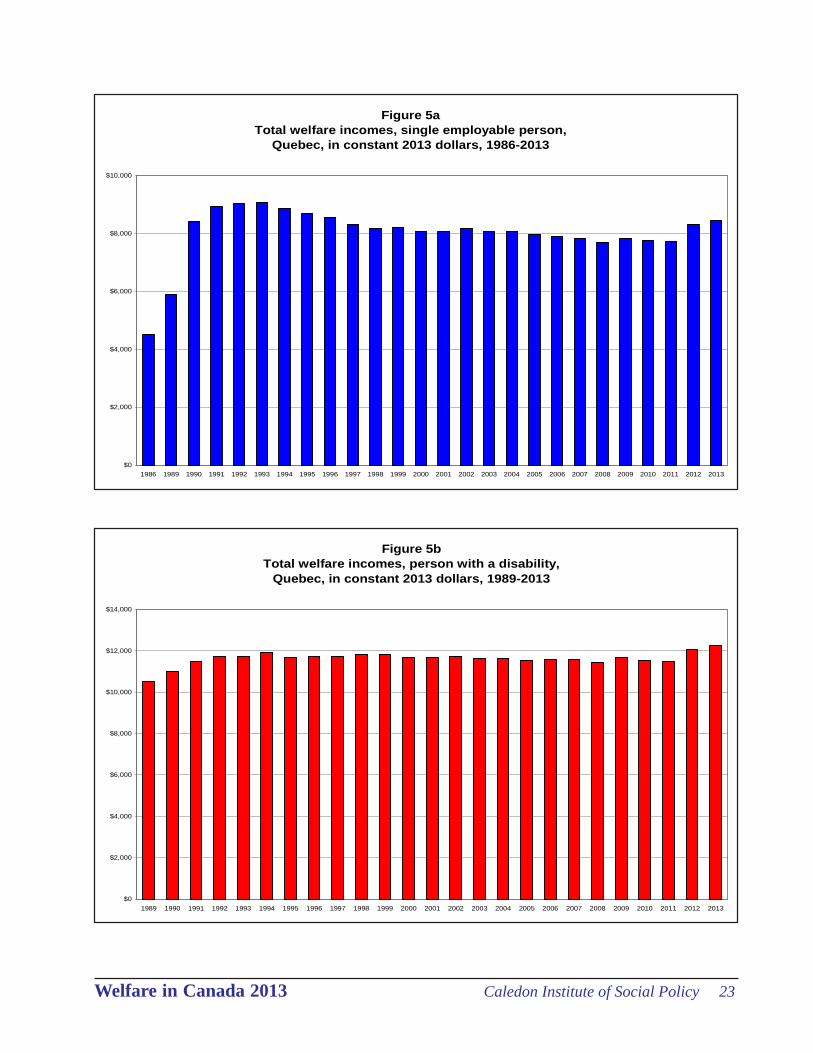
Total welfare incomes for single employable persons started out at a very low rate of$4,493 in 1986. Figure 5a shows that these incomes then jumped to a ‘high’ of just over $9,000in 1993 after which they declined gradually through 2010, with the exception of a slight rise in2009. They went up at the end of the period to reach $8,441 in 2013.
Figure 5b shows that single persons with disabilities in Quebec have had more stablewelfare incomes over time. Their total welfare incomes rose from $10,491 in 1989 to $11,912in 1994 and remained near that level, peaking at $12,250 in 2013.
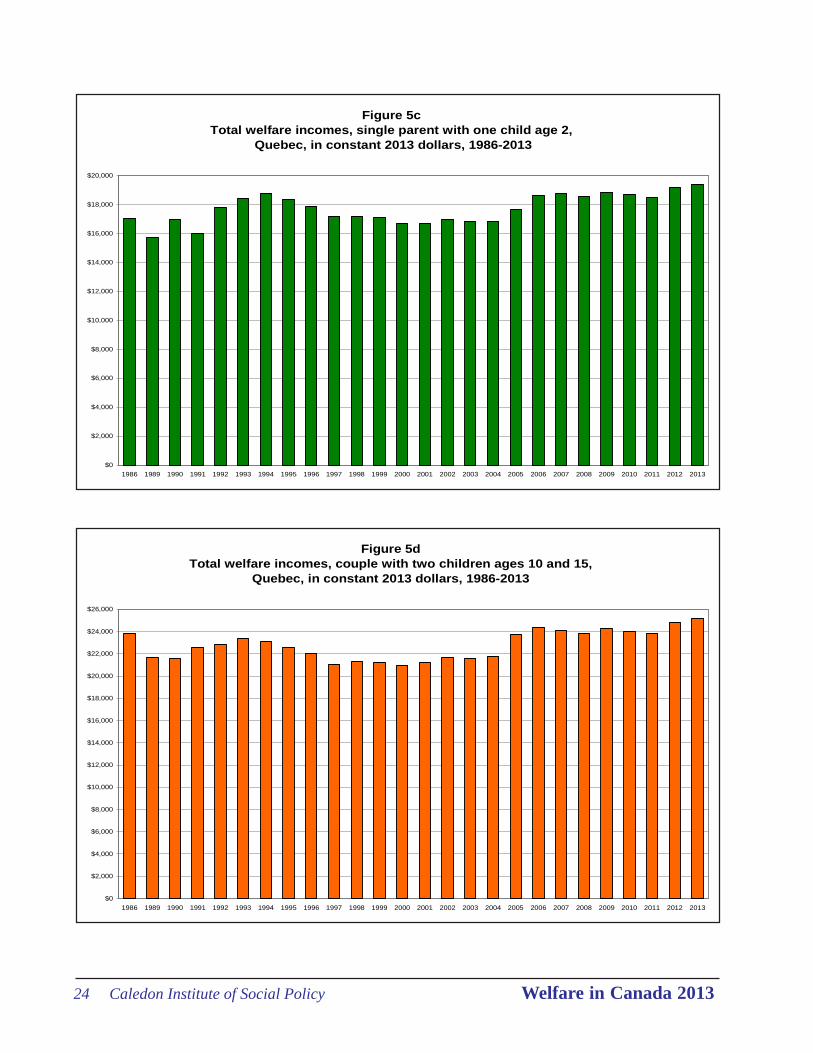
Single-parent households in Quebec have seen modest ups and downs in their welfareincomes over the 27-year period depicted in Figure 5c. Welfare incomes for this householdreached their highest level ever in 2013, at $19,413.
Welfare incomes for two-parent families with two children ages 10 and 15 followed asimilar pattern to single-parent households in that province. The two-parent households inFigure 5d ended the period with maximum welfare incomes of $25,166 in 2013, the highest inthe period.
Figure 4dTotal welfare incomes, couple with two children ages 10 and 15,
New Brunswick, in constant 2013 dollars, 1986-2013
$0
$2,000
$4,000
$6,000
$8,000
$10,000
$12,000
$14,000
$16,000
$18,000
$20,000
$22,000
1986 1989 1990 1991 1992 1993 1994 1995 1996 1997 1998 1999 2000 2001 2002 2003 2004 2005 2006 2007 2008 2009 2010 2011 2012 2013
Welfare in Canada 2013 Caledon Institute of Social Policy 23
Figure 5aTotal welfare incomes, single employable person,
Quebec, in constant 2013 dollars, 1986-2013
$0
$2,000
$4,000
$6,000
$8,000
$10,000
1986 1989 1990 1991 1992 1993 1994 1995 1996 1997 1998 1999 2000 2001 2002 2003 2004 2005 2006 2007 2008 2009 2010 2011 2012 2013
Figure 5b Total welfare incomes, person with a disability,
Quebec, in constant 2013 dollars, 1989-2013
$0
$2,000
$4,000
$6,000
$8,000
$10,000
$12,000
$14,000
1989 1990 1991 1992 1993 1994 1995 1996 1997 1998 1999 2000 2001 2002 2003 2004 2005 2006 2007 2008 2009 2010 2011 2012 2013
24 Caledon Institute of Social Policy Welfare in Canada 2013
Figure 5cTotal welfare incomes, single parent with one child age 2,
Quebec, in constant 2013 dollars, 1986-2013
$0
$2,000
$4,000
$6,000
$8,000
$10,000
$12,000
$14,000
$16,000
$18,000
$20,000
1986 1989 1990 1991 1992 1993 1994 1995 1996 1997 1998 1999 2000 2001 2002 2003 2004 2005 2006 2007 2008 2009 2010 2011 2012 2013
Figure 5dTotal welfare incomes, couple with two children ages 10 and 15,
Quebec, in constant 2013 dollars, 1986-2013
$0
$2,000
$4,000
$6,000
$8,000
$10,000
$12,000
$14,000
$16,000
$18,000
$20,000
$22,000
$24,000
$26,000
1986 1989 1990 1991 1992 1993 1994 1995 1996 1997 1998 1999 2000 2001 2002 2003 2004 2005 2006 2007 2008 2009 2010 2011 2012 2013
Welfare in Canada 2013 Caledon Institute of Social Policy 25
Ontario
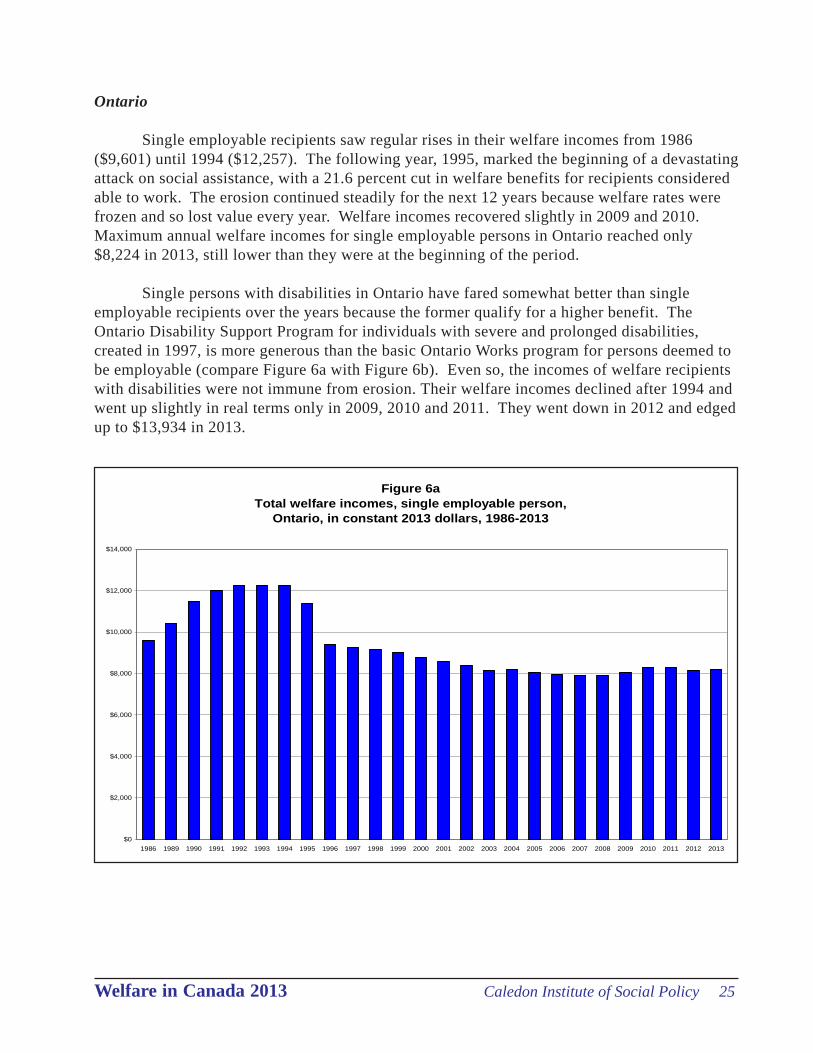
Single employable recipients saw regular rises in their welfare incomes from 1986($9,601) until 1994 ($12,257). The following year, 1995, marked the beginning of a devastatingattack on social assistance, with a 21.6 percent cut in welfare benefits for recipients consideredable to work. The erosion continued steadily for the next 12 years because welfare rates werefrozen and so lost value every year. Welfare incomes recovered slightly in 2009 and 2010.Maximum annual welfare incomes for single employable persons in Ontario reached only$8,224 in 2013, still lower than they were at the beginning of the period.
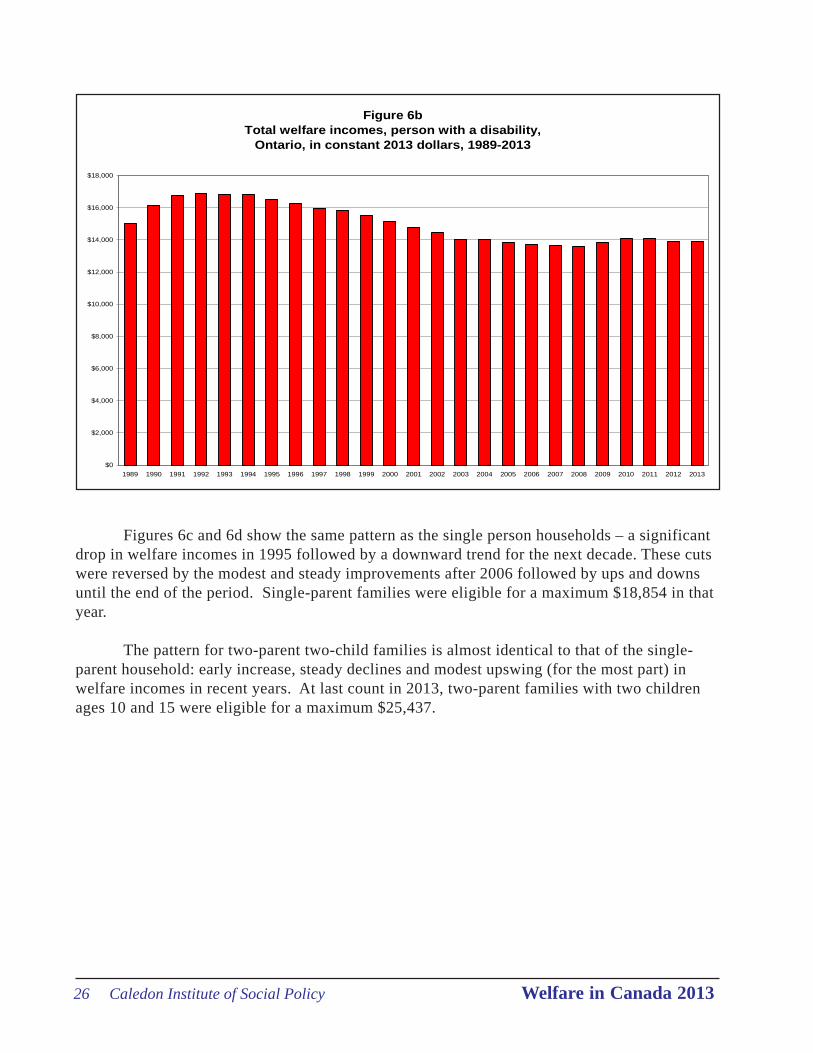
Single persons with disabilities in Ontario have fared somewhat better than singleemployable recipients over the years because the former qualify for a higher benefit. TheOntario Disability Support Program for individuals with severe and prolonged disabilities,created in 1997, is more generous than the basic Ontario Works program for persons deemed tobe employable (compare Figure 6a with Figure 6b). Even so, the incomes of welfare recipientswith disabilities were not immune from erosion. Their welfare incomes declined after 1994 andwent up slightly in real terms only in 2009, 2010 and 2011. They went down in 2012 and edgedup to $13,934 in 2013.
Figure 6aTotal welfare incomes, single employable person,
Ontario, in constant 2013 dollars, 1986-2013
$0
$2,000
$4,000
$6,000
$8,000
$10,000
$12,000
$14,000
1986 1989 1990 1991 1992 1993 1994 1995 1996 1997 1998 1999 2000 2001 2002 2003 2004 2005 2006 2007 2008 2009 2010 2011 2012 2013
26 Caledon Institute of Social Policy Welfare in Canada 2013
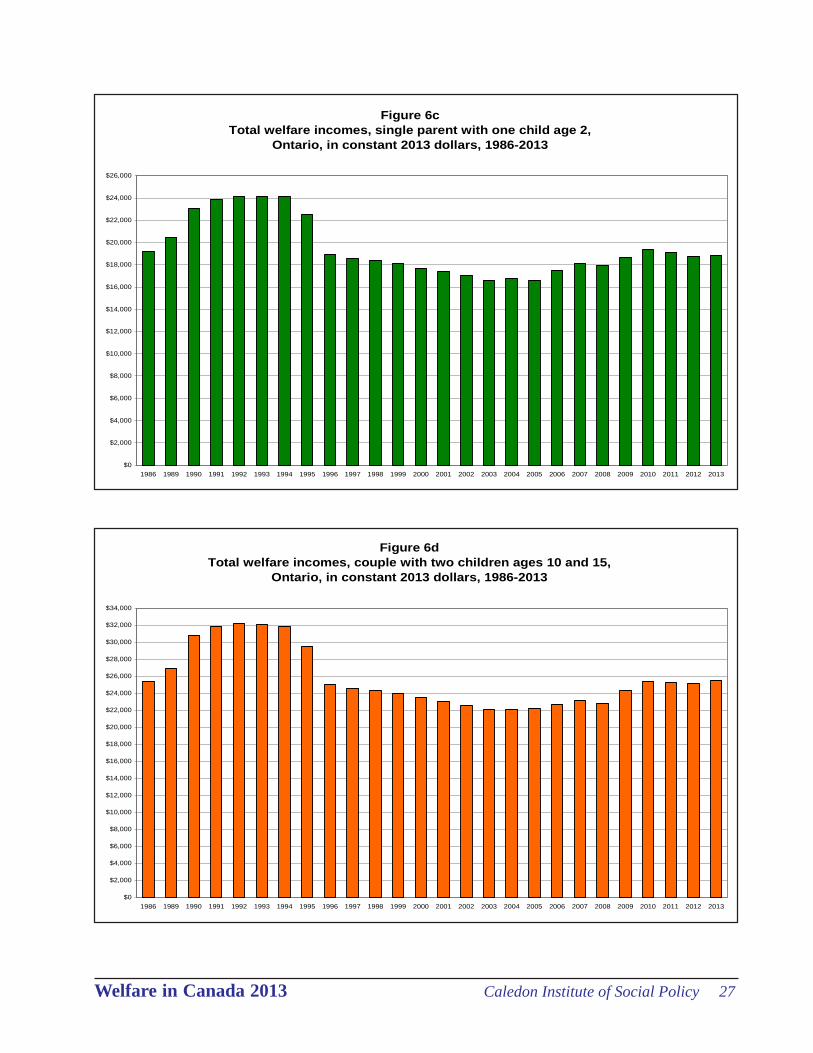
Figures 6c and 6d show the same pattern as the single person households – a significantdrop in welfare incomes in 1995 followed by a downward trend for the next decade. These cutswere reversed by the modest and steady improvements after 2006 followed by ups and downsuntil the end of the period. Single-parent families were eligible for a maximum $18,854 in thatyear.
The pattern for two-parent two-child families is almost identical to that of the single-parent household: early increase, steady declines and modest upswing (for the most part) inwelfare incomes in recent years. At last count in 2013, two-parent families with two childrenages 10 and 15 were eligible for a maximum $25,437.
Figure 6bTotal welfare incomes, person with a disability,
Ontario, in constant 2013 dollars, 1989-2013
$0
$2,000
$4,000
$6,000
$8,000
$10,000
$12,000
$14,000
$16,000
$18,000
1989 1990 1991 1992 1993 1994 1995 1996 1997 1998 1999 2000 2001 2002 2003 2004 2005 2006 2007 2008 2009 2010 2011 2012 2013
Welfare in Canada 2013 Caledon Institute of Social Policy 27
Figure 6c Total welfare incomes, single parent with one child age 2,
Ontario, in constant 2013 dollars, 1986-2013
$0
$2,000
$4,000
$6,000
$8,000
$10,000
$12,000
$14,000
$16,000
$18,000
$20,000
$22,000
$24,000
$26,000
1986 1989 1990 1991 1992 1993 1994 1995 1996 1997 1998 1999 2000 2001 2002 2003 2004 2005 2006 2007 2008 2009 2010 2011 2012 2013
Figure 6dTotal welfare incomes, couple with two children ages 10 and 15,
Ontario, in constant 2013 dollars, 1986-2013
$0
$2,000
$4,000
$6,000
$8,000
$10,000
$12,000
$14,000
$16,000
$18,000
$20,000
$22,000
$24,000
$26,000
$28,000
$30,000
$32,000
$34,000
1986 1989 1990 1991 1992 1993 1994 1995 1996 1997 1998 1999 2000 2001 2002 2003 2004 2005 2006 2007 2008 2009 2010 2011 2012 2013
28 Caledon Institute of Social Policy Welfare in Canada 2013
Manitoba
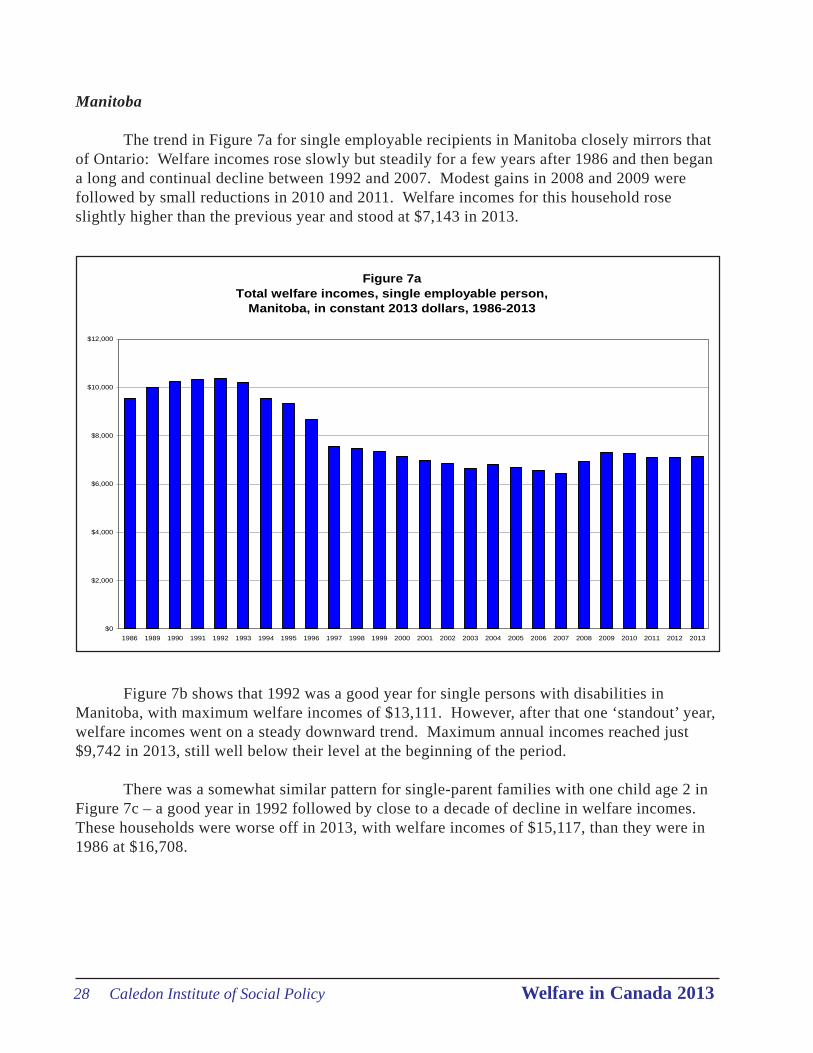
The trend in Figure 7a for single employable recipients in Manitoba closely mirrors thatof Ontario: Welfare incomes rose slowly but steadily for a few years after 1986 and then begana long and continual decline between 1992 and 2007. Modest gains in 2008 and 2009 werefollowed by small reductions in 2010 and 2011. Welfare incomes for this household roseslightly higher than the previous year and stood at $7,143 in 2013.
Figure 7aTotal welfare incomes, single employable person,
Manitoba, in constant 2013 dollars, 1986-2013
$0
$2,000
$4,000
$6,000
$8,000
$10,000
$12,000
1986 1989 1990 1991 1992 1993 1994 1995 1996 1997 1998 1999 2000 2001 2002 2003 2004 2005 2006 2007 2008 2009 2010 2011 2012 2013
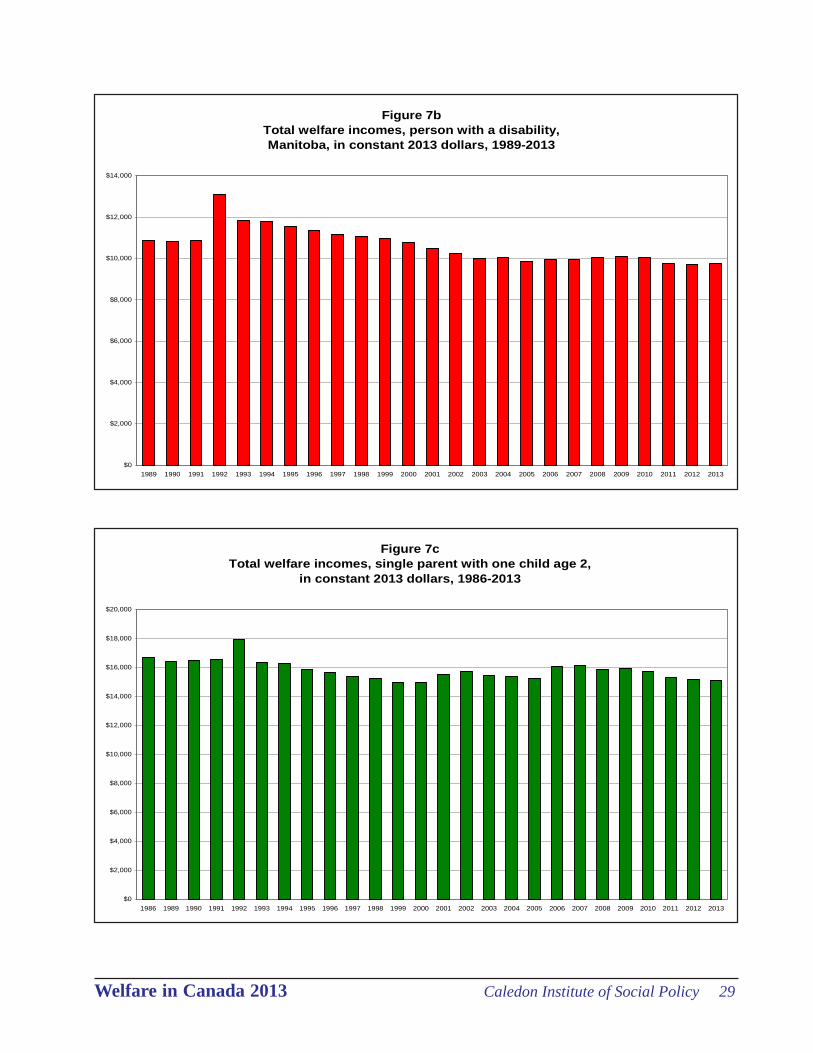
Figure 7b shows that 1992 was a good year for single persons with disabilities inManitoba, with maximum welfare incomes of $13,111. However, after that one ‘standout’ year,welfare incomes went on a steady downward trend. Maximum annual incomes reached just$9,742 in 2013, still well below their level at the beginning of the period.
There was a somewhat similar pattern for single-parent families with one child age 2 inFigure 7c – a good year in 1992 followed by close to a decade of decline in welfare incomes.These households were worse off in 2013, with welfare incomes of $15,117, than they were in1986 at $16,708.
Welfare in Canada 2013 Caledon Institute of Social Policy 29
Figure 7b Total welfare incomes, person with a disability, Manitoba, in constant 2013 dollars, 1989-2013
$0
$2,000
$4,000
$6,000
$8,000
$10,000
$12,000
$14,000
1989 1990 1991 1992 1993 1994 1995 1996 1997 1998 1999 2000 2001 2002 2003 2004 2005 2006 2007 2008 2009 2010 2011 2012 2013
Figure 7cTotal welfare incomes, single parent with one child age 2,
in constant 2013 dollars, 1986-2013
$0
$2,000
$4,000
$6,000
$8,000
$10,000
$12,000
$14,000
$16,000
$18,000
$20,000
1986 1989 1990 1991 1992 1993 1994 1995 1996 1997 1998 1999 2000 2001 2002 2003 2004 2005 2006 2007 2008 2009 2010 2011 2012 2013
30 Caledon Institute of Social Policy Welfare in Canada 2013
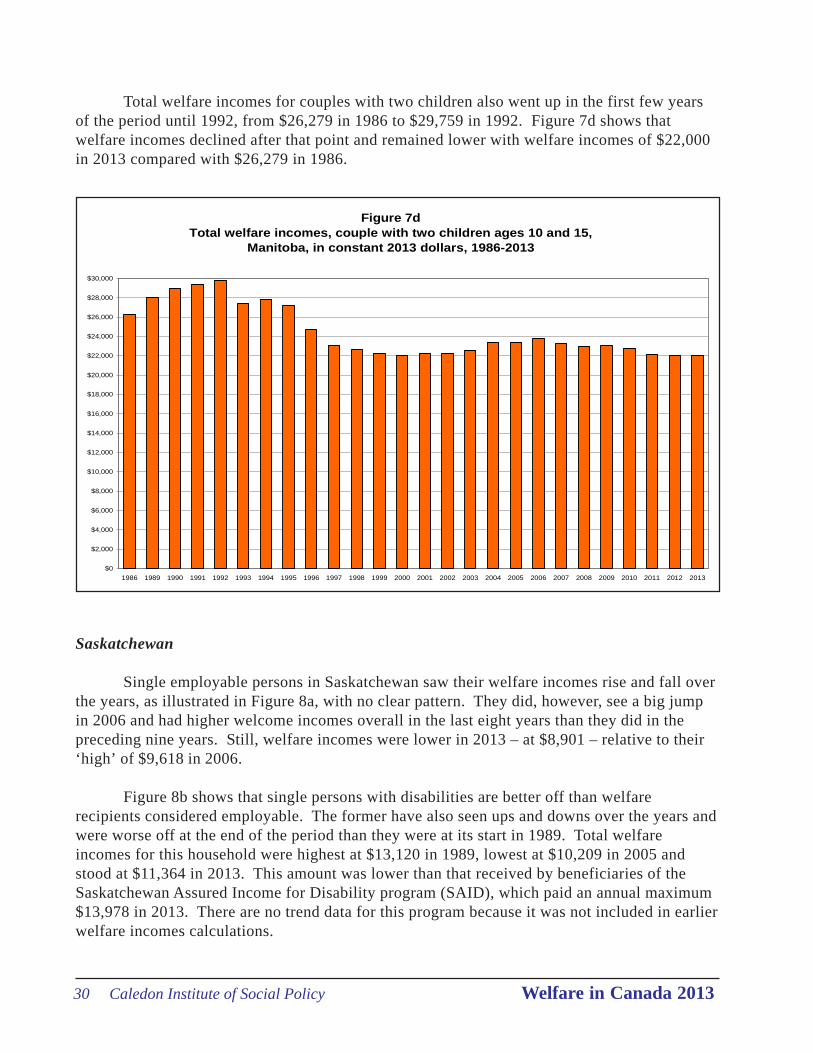
Total welfare incomes for couples with two children also went up in the first few yearsof the period until 1992, from $26,279 in 1986 to $29,759 in 1992. Figure 7d shows thatwelfare incomes declined after that point and remained lower with welfare incomes of $22,000in 2013 compared with $26,279 in 1986.
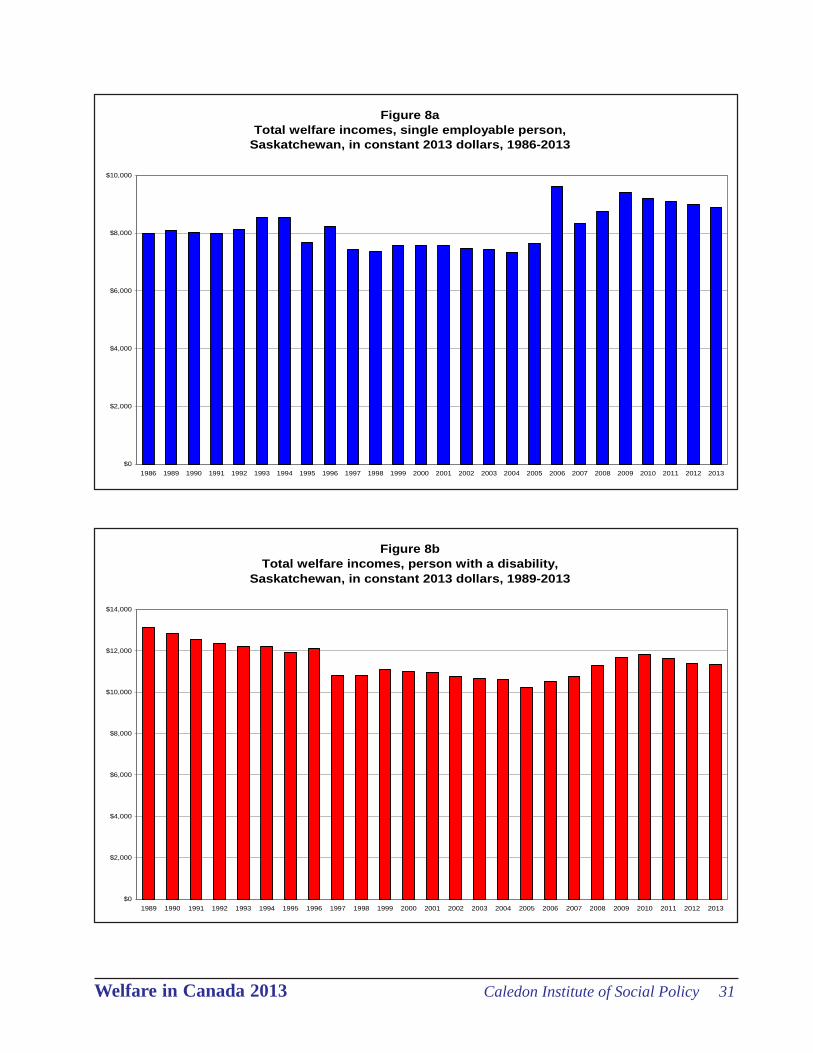
Saskatchewan
Single employable persons in Saskatchewan saw their welfare incomes rise and fall overthe years, as illustrated in Figure 8a, with no clear pattern. They did, however, see a big jumpin 2006 and had higher welcome incomes overall in the last eight years than they did in thepreceding nine years. Still, welfare incomes were lower in 2013 – at $8,901 – relative to their‘high’ of $9,618 in 2006.
Figure 8b shows that single persons with disabilities are better off than welfarerecipients considered employable. The former have also seen ups and downs over the years andwere worse off at the end of the period than they were at its start in 1989. Total welfareincomes for this household were highest at $13,120 in 1989, lowest at $10,209 in 2005 andstood at $11,364 in 2013. This amount was lower than that received by beneficiaries of theSaskatchewan Assured Income for Disability program (SAID), which paid an annual maximum$13,978 in 2013. There are no trend data for this program because it was not included in earlierwelfare incomes calculations.
Figure 7d Total welfare incomes, couple with two children ages 10 and 15,
Manitoba, in constant 2013 dollars, 1986-2013
$0
$2,000
$4,000
$6,000
$8,000
$10,000
$12,000
$14,000
$16,000
$18,000
$20,000
$22,000
$24,000
$26,000
$28,000
$30,000
1986 1989 1990 1991 1992 1993 1994 1995 1996 1997 1998 1999 2000 2001 2002 2003 2004 2005 2006 2007 2008 2009 2010 2011 2012 2013
Welfare in Canada 2013 Caledon Institute of Social Policy 31
Figure 8aTotal welfare incomes, single employable person,
Saskatchewan, in constant 2013 dollars, 1986-2013
$0
$2,000
$4,000
$6,000
$8,000
$10,000
1986 1989 1990 1991 1992 1993 1994 1995 1996 1997 1998 1999 2000 2001 2002 2003 2004 2005 2006 2007 2008 2009 2010 2011 2012 2013
Figure 8bTotal welfare incomes, person with a disability,
Saskatchewan, in constant 2013 dollars, 1989-2013
$0
$2,000
$4,000
$6,000
$8,000
$10,000
$12,000
$14,000
1989 1990 1991 1992 1993 1994 1995 1996 1997 1998 1999 2000 2001 2002 2003 2004 2005 2006 2007 2008 2009 2010 2011 2012 2013
32 Caledon Institute of Social Policy Welfare in Canada 2013
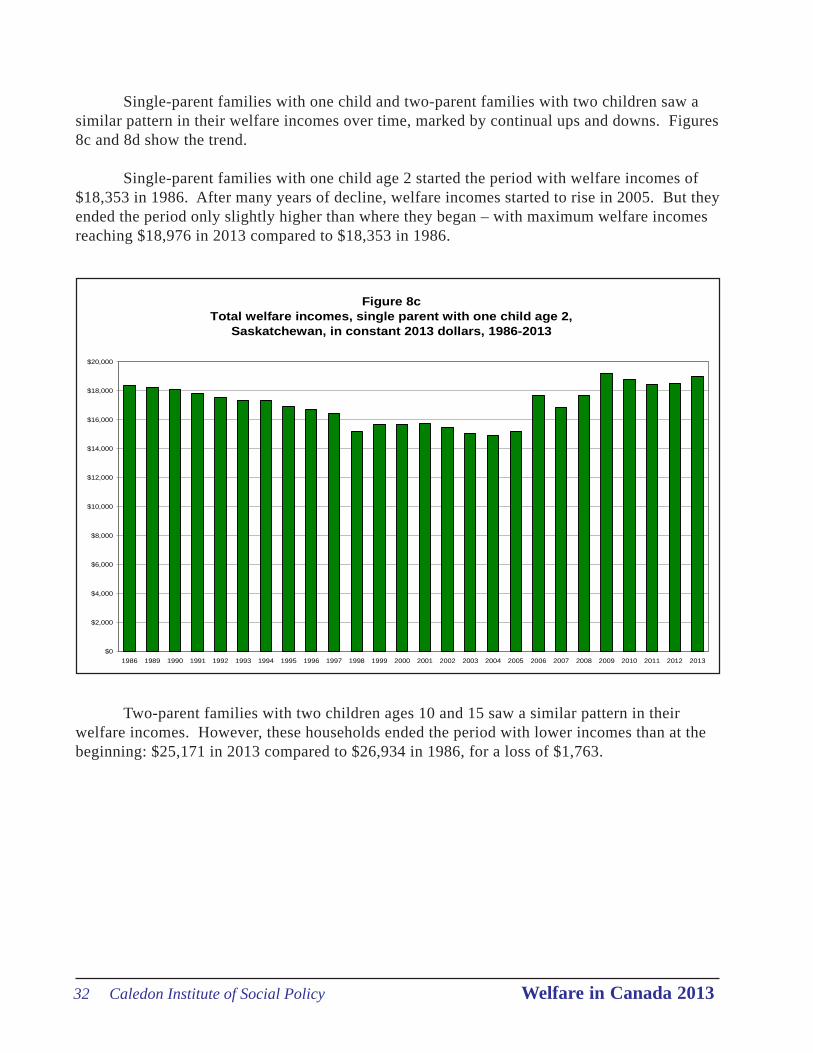
Single-parent families with one child and two-parent families with two children saw asimilar pattern in their welfare incomes over time, marked by continual ups and downs. Figures8c and 8d show the trend.
Single-parent families with one child age 2 started the period with welfare incomes of$18,353 in 1986. After many years of decline, welfare incomes started to rise in 2005. But theyended the period only slightly higher than where they began – with maximum welfare incomesreaching $18,976 in 2013 compared to $18,353 in 1986.
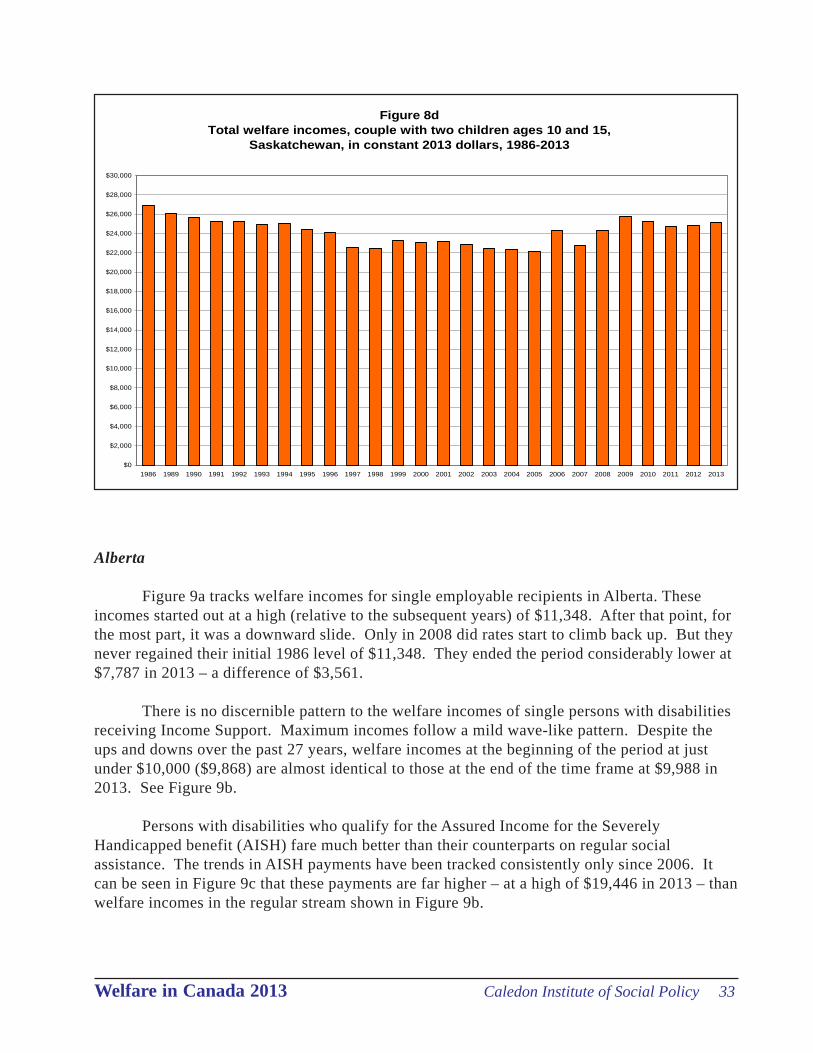
Two-parent families with two children ages 10 and 15 saw a similar pattern in theirwelfare incomes. However, these households ended the period with lower incomes than at thebeginning: $25,171 in 2013 compared to $26,934 in 1986, for a loss of $1,763.
Figure 8cTotal welfare incomes, single parent with one child age 2,
Saskatchewan, in constant 2013 dollars, 1986-2013
$0
$2,000
$4,000
$6,000
$8,000
$10,000
$12,000
$14,000
$16,000
$18,000
$20,000
1986 1989 1990 1991 1992 1993 1994 1995 1996 1997 1998 1999 2000 2001 2002 2003 2004 2005 2006 2007 2008 2009 2010 2011 2012 2013
Welfare in Canada 2013 Caledon Institute of Social Policy 33
Alberta
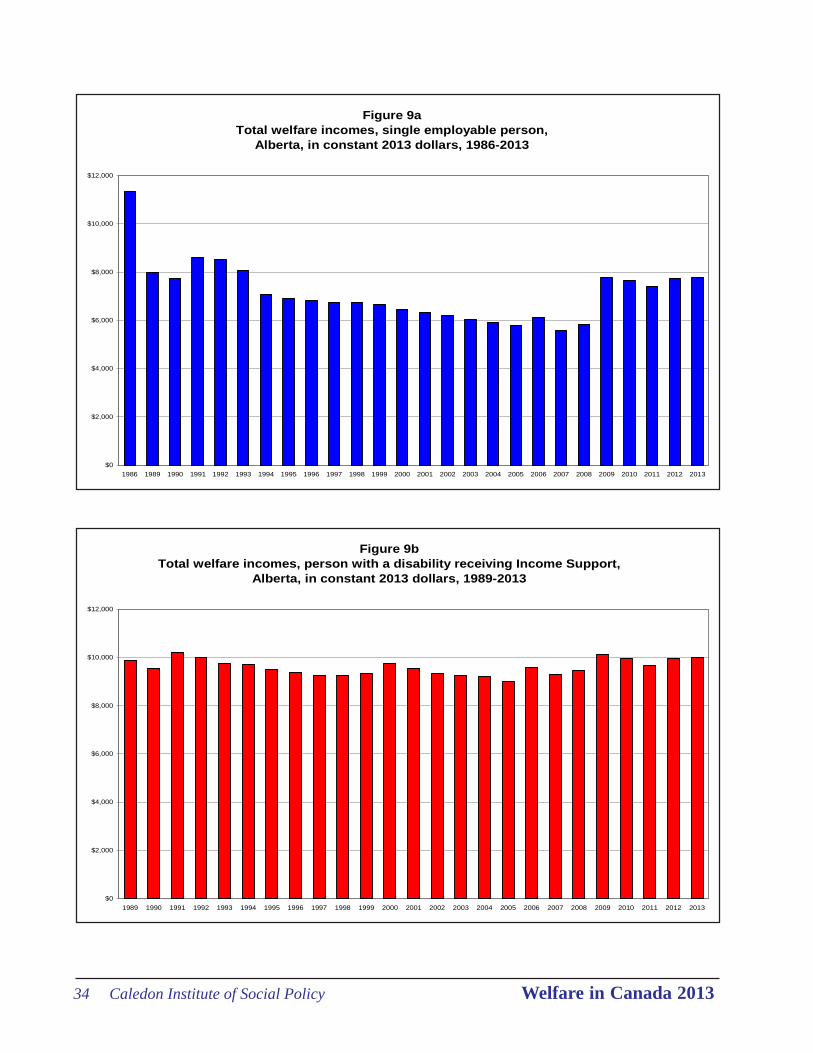
Figure 9a tracks welfare incomes for single employable recipients in Alberta. Theseincomes started out at a high (relative to the subsequent years) of $11,348. After that point, forthe most part, it was a downward slide. Only in 2008 did rates start to climb back up. But theynever regained their initial 1986 level of $11,348. They ended the period considerably lower at$7,787 in 2013 – a difference of $3,561.
There is no discernible pattern to the welfare incomes of single persons with disabilitiesreceiving Income Support. Maximum incomes follow a mild wave-like pattern. Despite theups and downs over the past 27 years, welfare incomes at the beginning of the period at justunder $10,000 ($9,868) are almost identical to those at the end of the time frame at $9,988 in2013. See Figure 9b.
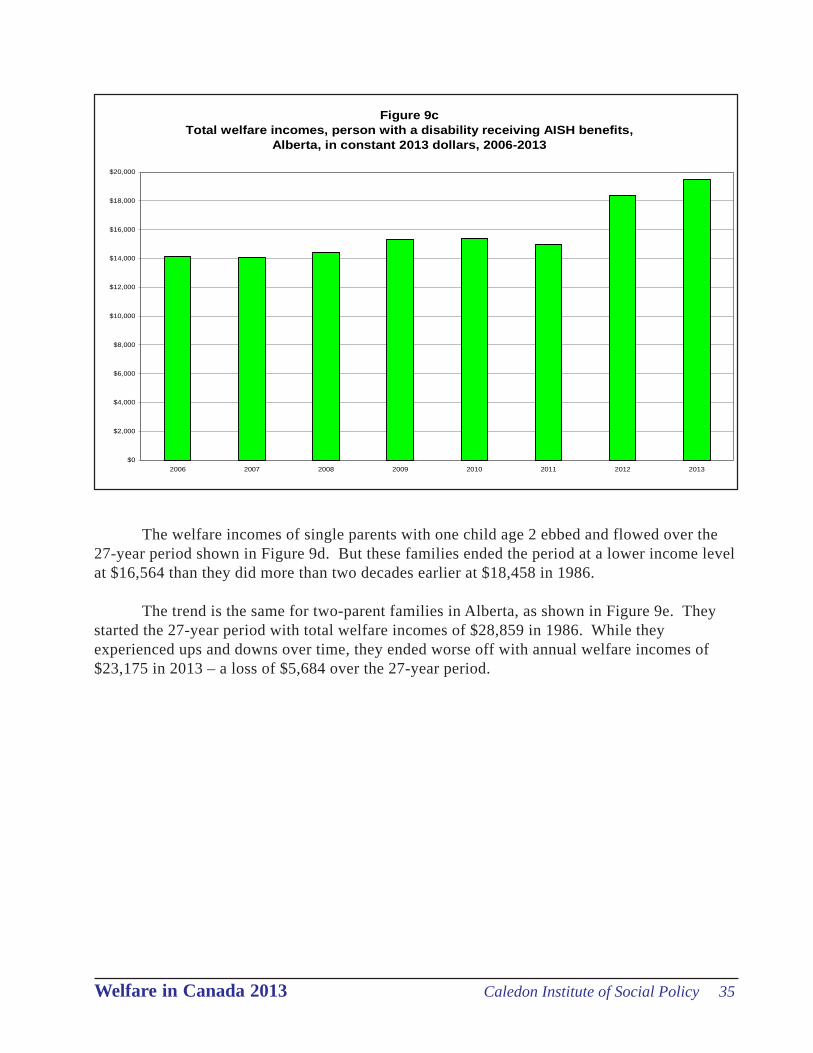
Persons with disabilities who qualify for the Assured Income for the SeverelyHandicapped benefit (AISH) fare much better than their counterparts on regular socialassistance. The trends in AISH payments have been tracked consistently only since 2006. Itcan be seen in Figure 9c that these payments are far higher – at a high of $19,446 in 2013 – thanwelfare incomes in the regular stream shown in Figure 9b.
Figure 8dTotal welfare incomes, couple with two children ages 10 and 15,
Saskatchewan, in constant 2013 dollars, 1986-2013
$0
$2,000
$4,000
$6,000
$8,000
$10,000
$12,000
$14,000
$16,000
$18,000
$20,000
$22,000
$24,000
$26,000
$28,000
$30,000
1986 1989 1990 1991 1992 1993 1994 1995 1996 1997 1998 1999 2000 2001 2002 2003 2004 2005 2006 2007 2008 2009 2010 2011 2012 2013
34 Caledon Institute of Social Policy Welfare in Canada 2013
Figure 9aTotal welfare incomes, single employable person,
Alberta, in constant 2013 dollars, 1986-2013
$0
$2,000
$4,000
$6,000
$8,000
$10,000
$12,000
1986 1989 1990 1991 1992 1993 1994 1995 1996 1997 1998 1999 2000 2001 2002 2003 2004 2005 2006 2007 2008 2009 2010 2011 2012 2013
Figure 9bTotal welfare incomes, person with a disability receiving Income Support,
Alberta, in constant 2013 dollars, 1989-2013
$0
$2,000
$4,000
$6,000
$8,000
$10,000
$12,000
1989 1990 1991 1992 1993 1994 1995 1996 1997 1998 1999 2000 2001 2002 2003 2004 2005 2006 2007 2008 2009 2010 2011 2012 2013
Welfare in Canada 2013 Caledon Institute of Social Policy 35
Figure 9c Total welfare incomes, person with a disability receiving AISH benefits,
Alberta, in constant 2013 dollars, 2006-2013
$0
$2,000
$4,000
$6,000
$8,000
$10,000
$12,000
$14,000
$16,000
$18,000
$20,000
2006 2007 2008 2009 2010 2011 2012 2013
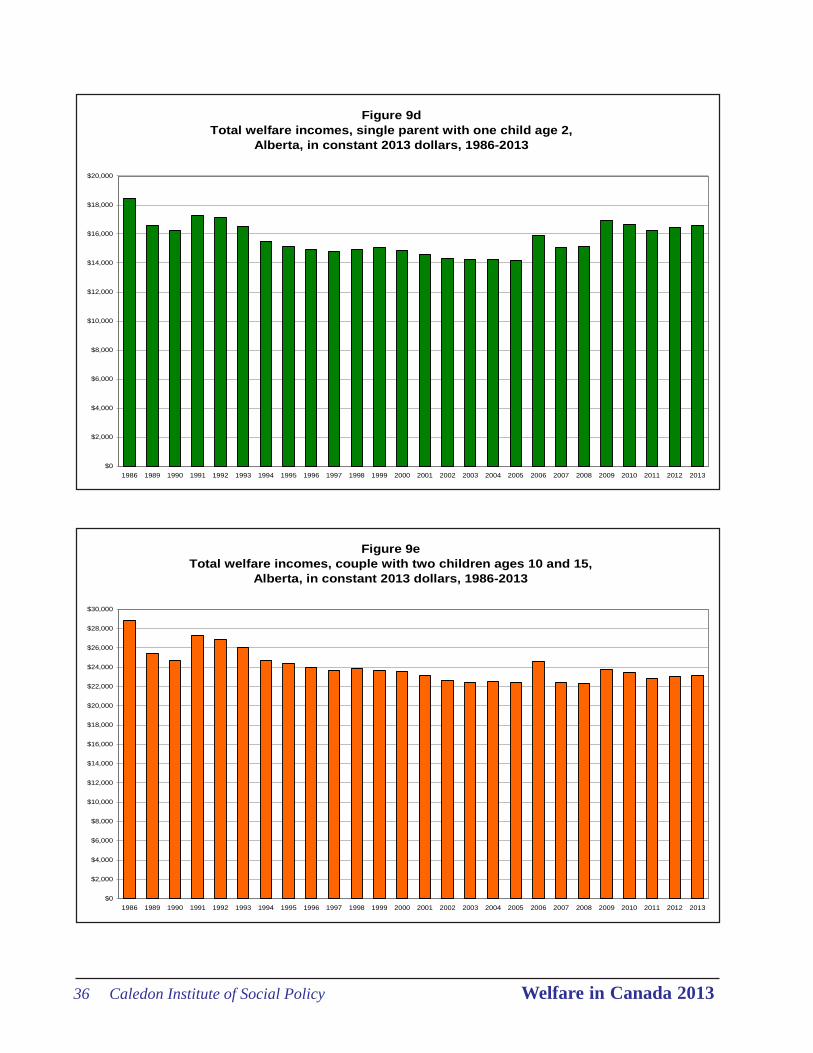
The welfare incomes of single parents with one child age 2 ebbed and flowed over the27-year period shown in Figure 9d. But these families ended the period at a lower income levelat $16,564 than they did more than two decades earlier at $18,458 in 1986.
The trend is the same for two-parent families in Alberta, as shown in Figure 9e. Theystarted the 27-year period with total welfare incomes of $28,859 in 1986. While theyexperienced ups and downs over time, they ended worse off with annual welfare incomes of$23,175 in 2013 – a loss of $5,684 over the 27-year period.
36 Caledon Institute of Social Policy Welfare in Canada 2013
Figure 9dTotal welfare incomes, single parent with one child age 2,
Alberta, in constant 2013 dollars, 1986-2013
$0
$2,000
$4,000
$6,000
$8,000
$10,000
$12,000
$14,000
$16,000
$18,000
$20,000
1986 1989 1990 1991 1992 1993 1994 1995 1996 1997 1998 1999 2000 2001 2002 2003 2004 2005 2006 2007 2008 2009 2010 2011 2012 2013
Figure 9e Total welfare incomes, couple with two children ages 10 and 15,
Alberta, in constant 2013 dollars, 1986-2013
$0
$2,000
$4,000
$6,000
$8,000
$10,000
$12,000
$14,000
$16,000
$18,000
$20,000
$22,000
$24,000
$26,000
$28,000
$30,000
1986 1989 1990 1991 1992 1993 1994 1995 1996 1997 1998 1999 2000 2001 2002 2003 2004 2005 2006 2007 2008 2009 2010 2011 2012 2013
Welfare in Canada 2013 Caledon Institute of Social Policy 37
British Columbia
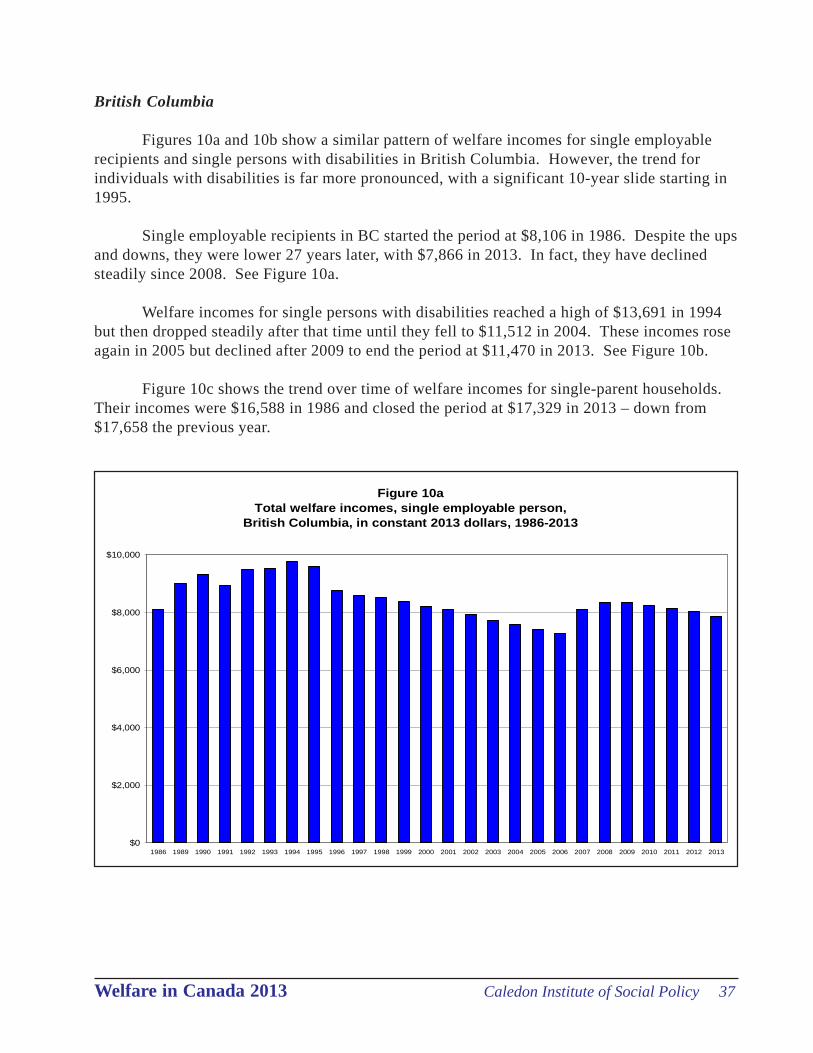
Figures 10a and 10b show a similar pattern of welfare incomes for single employablerecipients and single persons with disabilities in British Columbia. However, the trend forindividuals with disabilities is far more pronounced, with a significant 10-year slide starting in1995.
Single employable recipients in BC started the period at $8,106 in 1986. Despite the upsand downs, they were lower 27 years later, with $7,866 in 2013. In fact, they have declinedsteadily since 2008. See Figure 10a.
Welfare incomes for single persons with disabilities reached a high of $13,691 in 1994but then dropped steadily after that time until they fell to $11,512 in 2004. These incomes roseagain in 2005 but declined after 2009 to end the period at $11,470 in 2013. See Figure 10b.
Figure 10c shows the trend over time of welfare incomes for single-parent households.Their incomes were $16,588 in 1986 and closed the period at $17,329 in 2013 – down from$17,658 the previous year.
Figure 10a Total welfare incomes, single employable person,
British Columbia, in constant 2013 dollars, 1986-2013
$0
$2,000
$4,000
$6,000
$8,000
$10,000
1986 1989 1990 1991 1992 1993 1994 1995 1996 1997 1998 1999 2000 2001 2002 2003 2004 2005 2006 2007 2008 2009 2010 2011 2012 2013

38 Caledon Institute of Social Policy Welfare in Canada 2013
Figure 10bTotal welfare incomes, person with a disability,
British Columbia, in constant 2013 dollars, 1989-2013
$0
$2,000
$4,000
$6,000
$8,000
$10,000
$12,000
$14,000
1989 1990 1991 1992 1993 1994 1995 1996 1997 1998 1999 2000 2001 2002 2003 2004 2005 2006 2007 2008 2009 2010 2011 2012 2013
Figure 10cTotal welfare incomes, single parent with one child age 2,
British Columbia, in constant 2013 dollars, 1986-2013
$0
$2,000
$4,000
$6,000
$8,000
$10,000
$12,000
$14,000
$16,000
$18,000
$20,000
1986 1989 1990 1991 1992 1993 1994 1995 1996 1997 1998 1999 2000 2001 2002 2003 2004 2005 2006 2007 2008 2009 2010 2011 2012 2013
Welfare in Canada 2013 Caledon Institute of Social Policy 39
Figure 10dTotal welfare incomes, couple with two children ages 10 and 15,
British Columbia, in constant 2013 dollars, 1986-2013
$0
$2,000
$4,000
$6,000
$8,000
$10,000
$12,000
$14,000
$16,000
$18,000
$20,000
$22,000
$24,000
$26,000
1986 1989 1990 1991 1992 1993 1994 1995 1996 1997 1998 1999 2000 2001 2002 2003 2004 2005 2006 2007 2008 2009 2010 2011 2012 2013
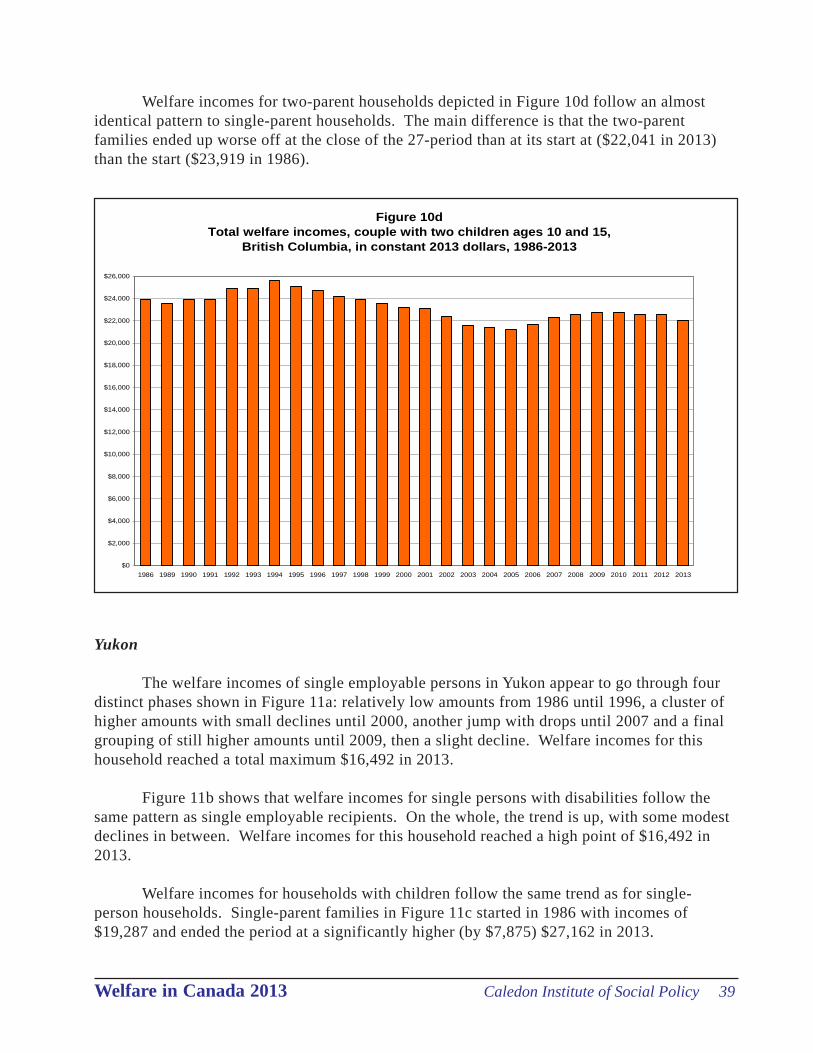
Welfare incomes for two-parent households depicted in Figure 10d follow an almostidentical pattern to single-parent households. The main difference is that the two-parentfamilies ended up worse off at the close of the 27-period than at its start at ($22,041 in 2013)than the start ($23,919 in 1986).
Yukon
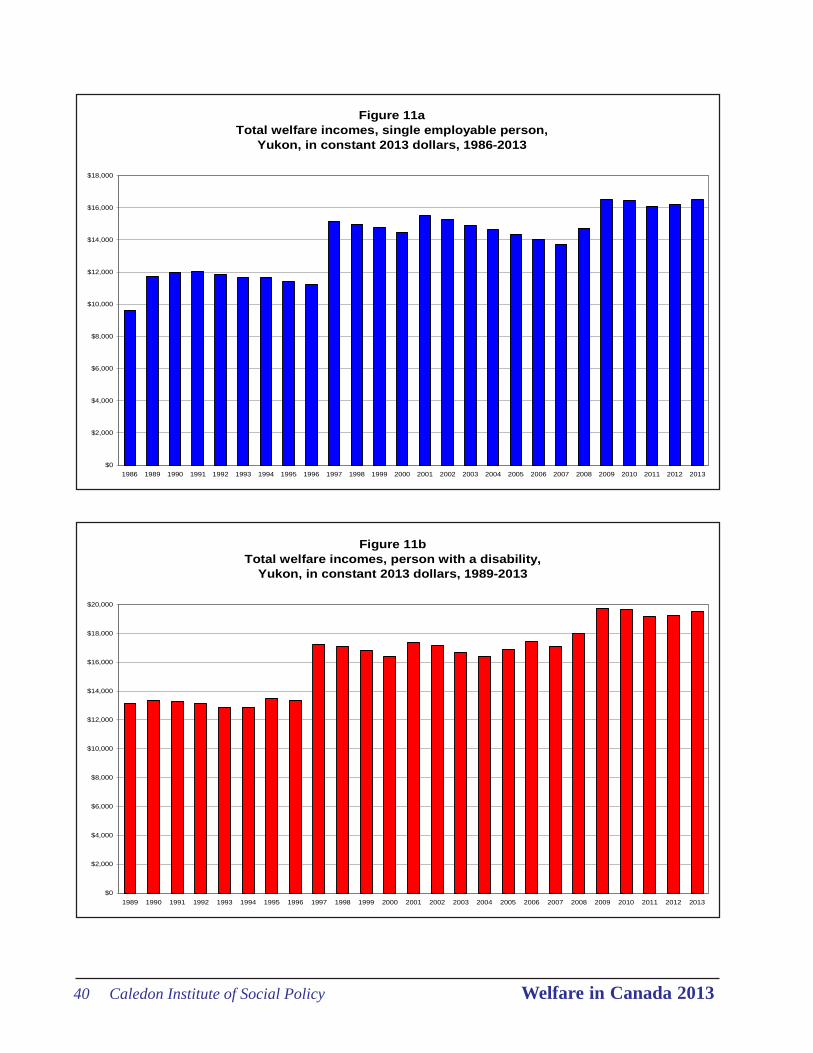
The welfare incomes of single employable persons in Yukon appear to go through fourdistinct phases shown in Figure 11a: relatively low amounts from 1986 until 1996, a cluster ofhigher amounts with small declines until 2000, another jump with drops until 2007 and a finalgrouping of still higher amounts until 2009, then a slight decline. Welfare incomes for thishousehold reached a total maximum $16,492 in 2013.
Figure 11b shows that welfare incomes for single persons with disabilities follow thesame pattern as single employable recipients. On the whole, the trend is up, with some modestdeclines in between. Welfare incomes for this household reached a high point of $16,492 in2013.
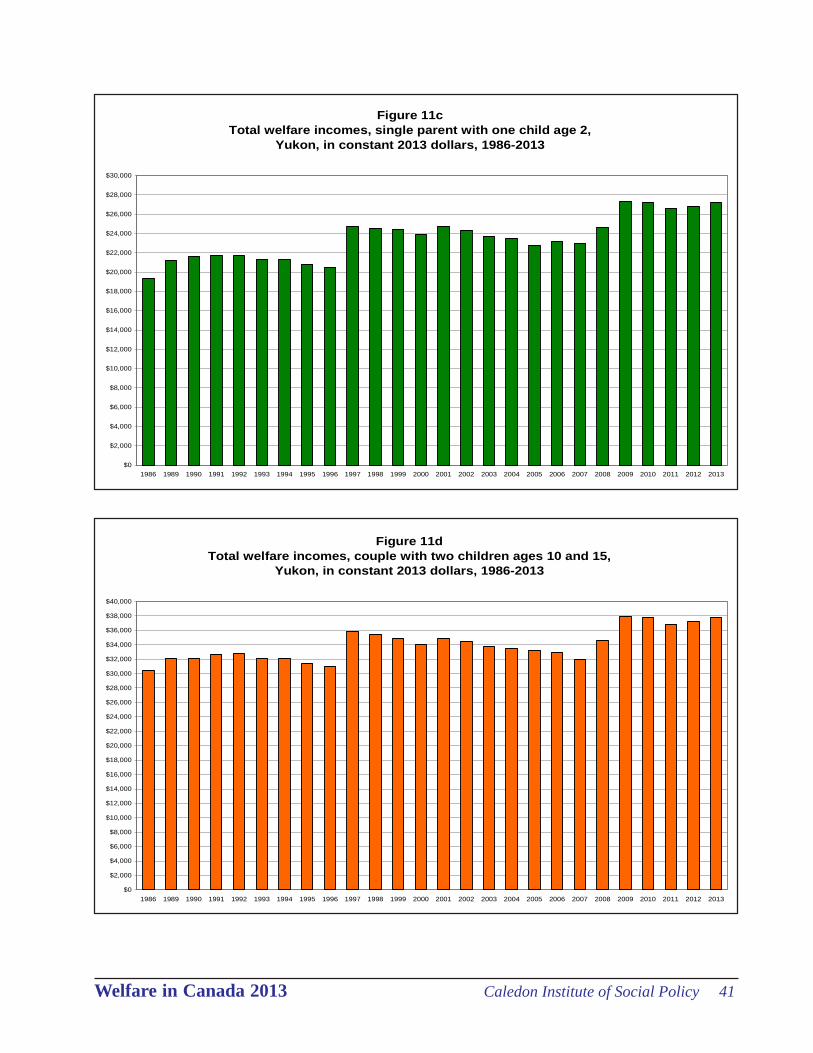
Welfare incomes for households with children follow the same trend as for single-person households. Single-parent families in Figure 11c started in 1986 with incomes of$19,287 and ended the period at a significantly higher (by $7,875) $27,162 in 2013.
40 Caledon Institute of Social Policy Welfare in Canada 2013
Figure 11aTotal welfare incomes, single employable person,
Yukon, in constant 2013 dollars, 1986-2013
$0
$2,000
$4,000
$6,000
$8,000
$10,000
$12,000
$14,000
$16,000
$18,000
1986 1989 1990 1991 1992 1993 1994 1995 1996 1997 1998 1999 2000 2001 2002 2003 2004 2005 2006 2007 2008 2009 2010 2011 2012 2013
Figure 11bTotal welfare incomes, person with a disability,
Yukon, in constant 2013 dollars, 1989-2013
$0
$2,000
$4,000
$6,000
$8,000
$10,000
$12,000
$14,000
$16,000
$18,000
$20,000
1989 1990 1991 1992 1993 1994 1995 1996 1997 1998 1999 2000 2001 2002 2003 2004 2005 2006 2007 2008 2009 2010 2011 2012 2013
Welfare in Canada 2013 Caledon Institute of Social Policy 41
Figure 11cTotal welfare incomes, single parent with one child age 2,
Yukon, in constant 2013 dollars, 1986-2013
$0
$2,000
$4,000
$6,000
$8,000
$10,000
$12,000
$14,000
$16,000
$18,000
$20,000
$22,000
$24,000
$26,000
$28,000
$30,000
1986 1989 1990 1991 1992 1993 1994 1995 1996 1997 1998 1999 2000 2001 2002 2003 2004 2005 2006 2007 2008 2009 2010 2011 2012 2013
Figure 11dTotal welfare incomes, couple with two children ages 10 and 15,
Yukon, in constant 2013 dollars, 1986-2013
$0
$2,000
$4,000
$6,000
$8,000
$10,000
$12,000
$14,000
$16,000
$18,000
$20,000
$22,000
$24,000
$26,000
$28,000
$30,000
$32,000
$34,000
$36,000
$38,000
$40,000
1986 1989 1990 1991 1992 1993 1994 1995 1996 1997 1998 1999 2000 2001 2002 2003 2004 2005 2006 2007 2008 2009 2010 2011 2012 2013
42 Caledon Institute of Social Policy Welfare in Canada 2013
Figure 12a Total welfare incomes, single employable person,
Northwest Territories, in constant 2013 dollars, 1993-2013
$0
$2,000
$4,000
$6,000
$8,000
$10,000
$12,000
$14,000
$16,000
$18,000
$20,000
1993 1994 1995 1996 1997 1998 1999 2000 2001 2002 2003 2004 2005 2006 2007 2008 2009 2010 2011 2012 2013
The welfare incomes of two-parent households with two children in Figure 11d beganthe 27-year period at $30,482 and ended at $37,733 in 2013 – a $7,251 gain.
Northwest Territories
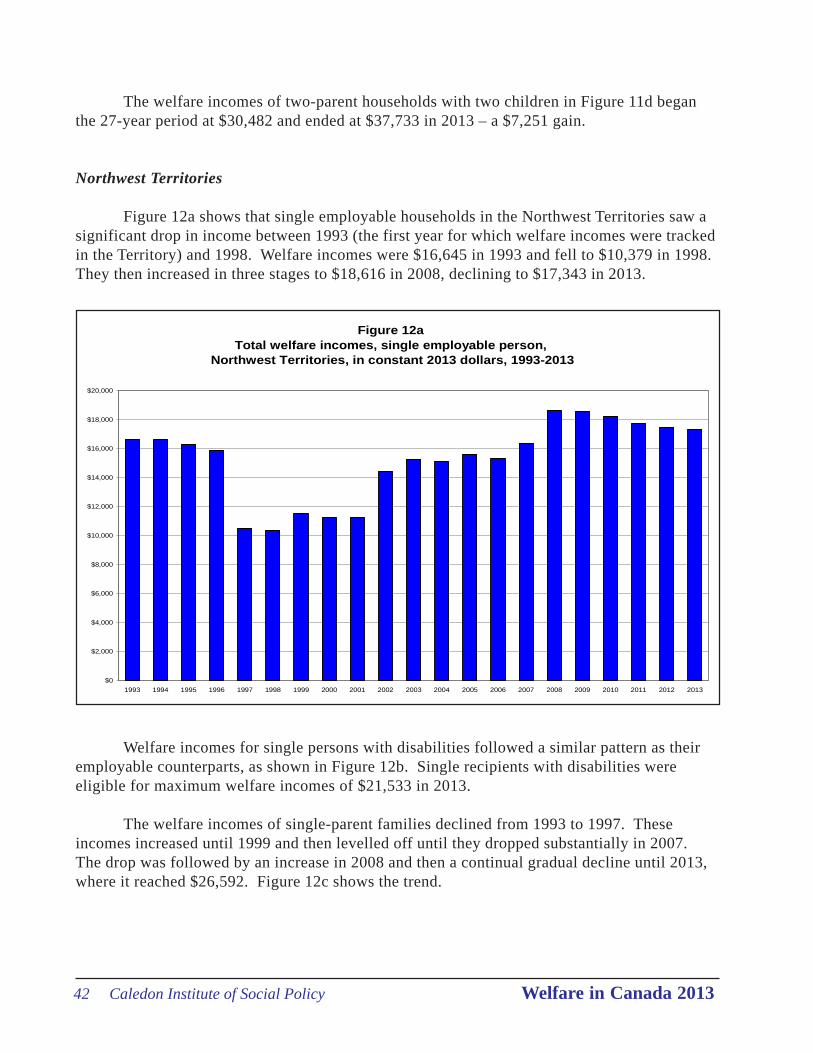
Figure 12a shows that single employable households in the Northwest Territories saw asignificant drop in income between 1993 (the first year for which welfare incomes were trackedin the Territory) and 1998. Welfare incomes were $16,645 in 1993 and fell to $10,379 in 1998.They then increased in three stages to $18,616 in 2008, declining to $17,343 in 2013.
Welfare incomes for single persons with disabilities followed a similar pattern as theiremployable counterparts, as shown in Figure 12b. Single recipients with disabilities wereeligible for maximum welfare incomes of $21,533 in 2013.
The welfare incomes of single-parent families declined from 1993 to 1997. Theseincomes increased until 1999 and then levelled off until they dropped substantially in 2007.The drop was followed by an increase in 2008 and then a continual gradual decline until 2013,where it reached $26,592. Figure 12c shows the trend.

Welfare in Canada 2013 Caledon Institute of Social Policy 43
Figure 12bTotal welfare incomes, person with a disability,
Northwest Territories, in constant 2013 dollars, 1993-2013
$0
$2,000
$4,000
$6,000
$8,000
$10,000
$12,000
$14,000
$16,000
$18,000
$20,000
$22,000
$24,000
1993 1994 1995 1996 1997 1998 1999 2000 2001 2002 2003 2004 2005 2006 2007 2008 2009 2010 2011 2012 2013
Figure 12cTotal welfare incomes, single parent with one child age 2,Northwest Territories, in constant 2013 dollars, 1993-2013
$0
$2,000
$4,000
$6,000
$8,000
$10,000
$12,000
$14,000
$16,000
$18,000
$20,000
$22,000
$24,000
$26,000
$28,000
$30,000
$32,000
1993 1994 1995 1996 1997 1998 1999 2000 2001 2002 2003 2004 2005 2006 2007 2008 2009 2010 2011 2012 2013
44 Caledon Institute of Social Policy Welfare in Canada 2013
Figure 12d Total welfare incomes, couple with two children ages 10 and 15,
Northwest Territories, in constant 2013 dollars, 1993-2013
$0
$2,000
$4,000
$6,000
$8,000
$10,000
$12,000
$14,000
$16,000
$18,000
$20,000
$22,000
$24,000
$26,000
$28,000
$30,000
$32,000
$34,000
$36,000
$38,000
1993 1994 1995 1996 1997 1998 1999 2000 2001 2002 2003 2004 2005 2006 2007 2008 2009 2010 2011 2012 2013
Nunavut
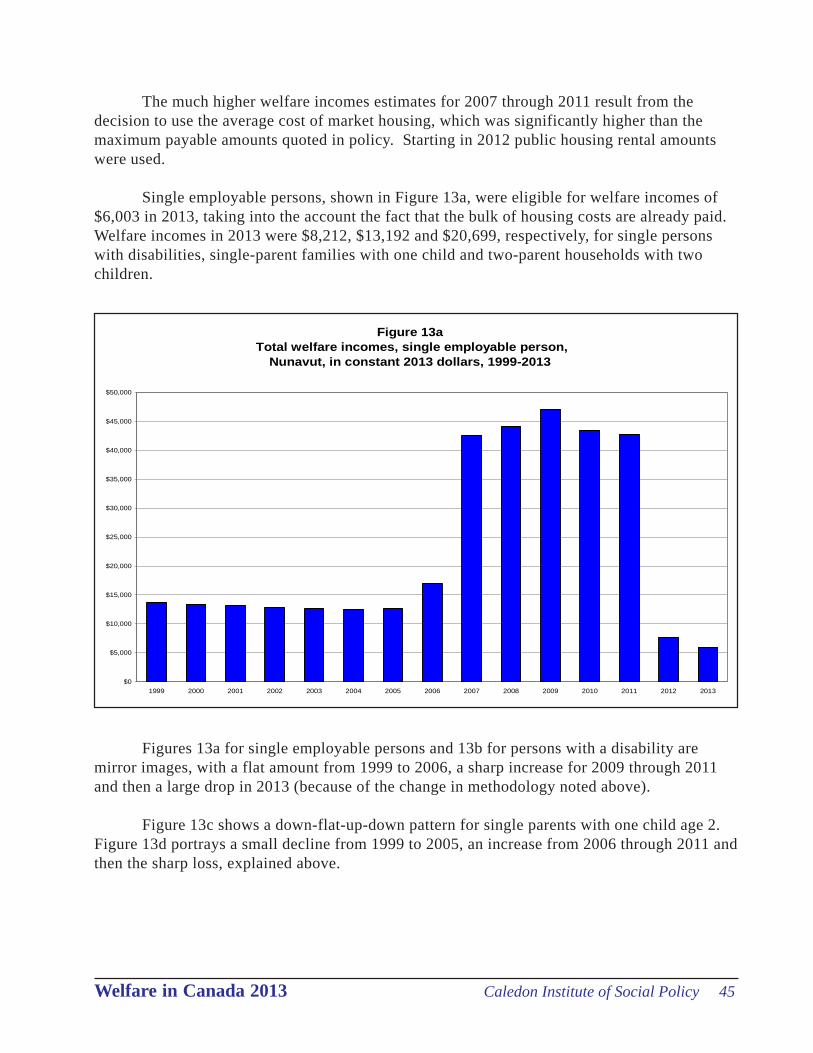
Welfare incomes in Nunavut were fairly flat for the first few years of tracking, whichbegan in 1999 when the Territory was created. They then jumped substantially in 2007 andremained at higher rates until 2012 when they fell back to less than 1999 levels. Figure 13ashows the trend.
Changes to the welfare incomes methodology are the main driver behind the precipitous‘loss’ in 2012. In earlier years, housing allowances had been calculated on the basis of marketrents, as is currently done for the rest of the country.
However, it became clear in discussions with Nunavut officials that this calculation wasnot an accurate representation of reality in the Territory, in which almost all welfare recipientslive in subsidized housing. The latter arrangement has become an essential support to helptackle the high cost of living and compensate for the lack of affordable housing.
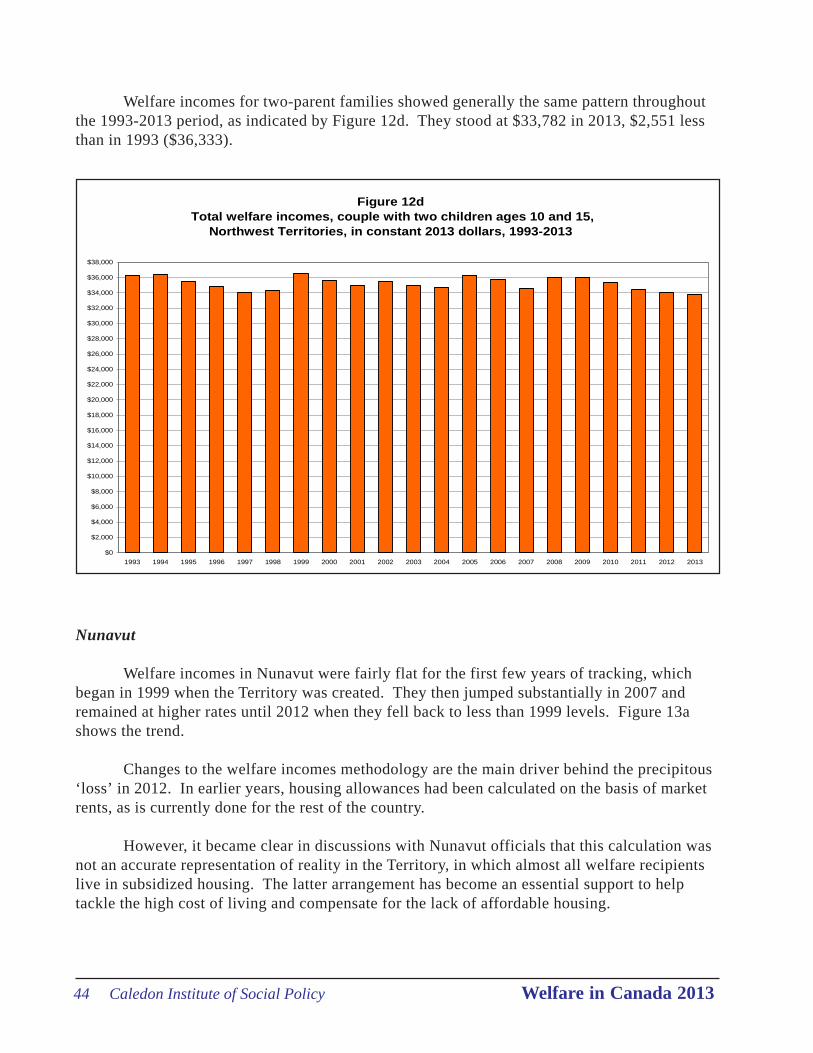
Welfare incomes for two-parent families showed generally the same pattern throughoutthe 1993-2013 period, as indicated by Figure 12d. They stood at $33,782 in 2013, $2,551 lessthan in 1993 ($36,333).
Welfare in Canada 2013 Caledon Institute of Social Policy 45
Figure 13a Total welfare incomes, single employable person,
Nunavut, in constant 2013 dollars, 1999-2013
$0
$5,000
$10,000
$15,000
$20,000
$25,000
$30,000
$35,000
$40,000
$45,000
$50,000
1999 2000 2001 2002 2003 2004 2005 2006 2007 2008 2009 2010 2011 2012 2013
The much higher welfare incomes estimates for 2007 through 2011 result from thedecision to use the average cost of market housing, which was significantly higher than themaximum payable amounts quoted in policy. Starting in 2012 public housing rental amountswere used.
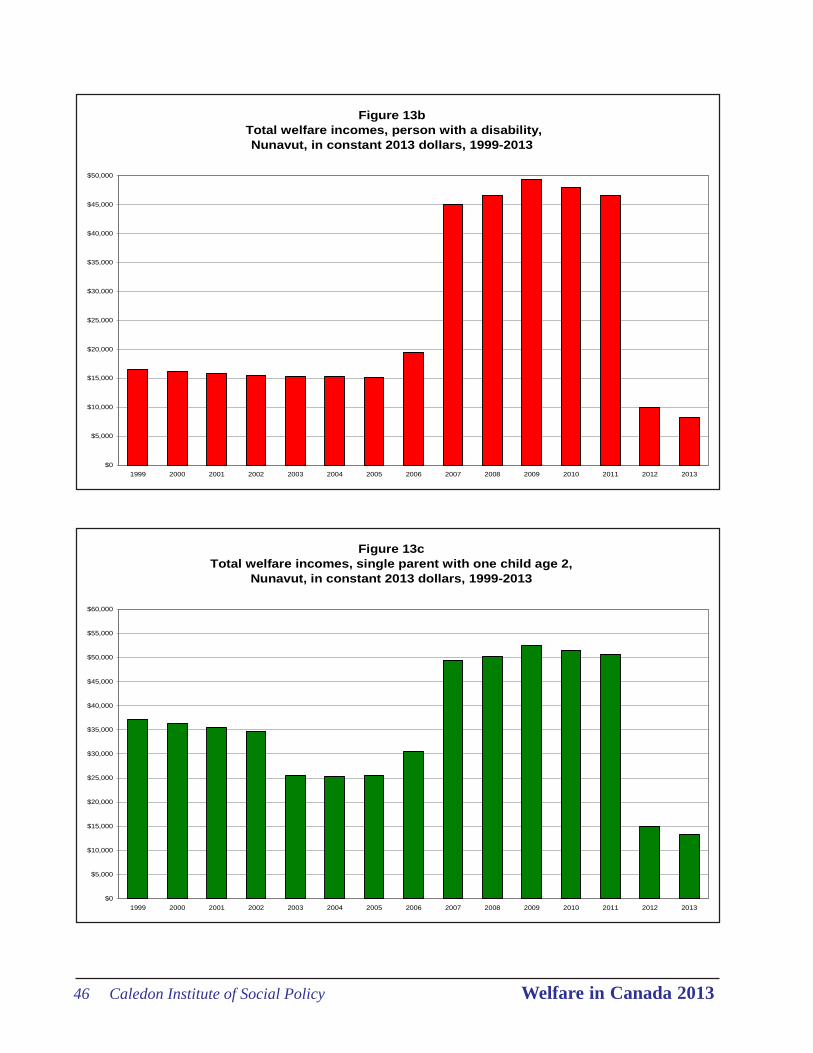
Single employable persons, shown in Figure 13a, were eligible for welfare incomes of$6,003 in 2013, taking into the account the fact that the bulk of housing costs are already paid.Welfare incomes in 2013 were $8,212, $13,192 and $20,699, respectively, for single personswith disabilities, single-parent families with one child and two-parent households with twochildren.
Figures 13a for single employable persons and 13b for persons with a disability aremirror images, with a flat amount from 1999 to 2006, a sharp increase for 2009 through 2011and then a large drop in 2013 (because of the change in methodology noted above).
Figure 13c shows a down-flat-up-down pattern for single parents with one child age 2.Figure 13d portrays a small decline from 1999 to 2005, an increase from 2006 through 2011 andthen the sharp loss, explained above.
46 Caledon Institute of Social Policy Welfare in Canada 2013
Figure 13b Total welfare incomes, person with a disability,
Nunavut, in constant 2013 dollars, 1999-2013
$0
$5,000
$10,000
$15,000
$20,000
$25,000
$30,000
$35,000
$40,000
$45,000
$50,000
1999 2000 2001 2002 2003 2004 2005 2006 2007 2008 2009 2010 2011 2012 2013
Figure 13cTotal welfare incomes, single parent with one child age 2,
Nunavut, in constant 2013 dollars, 1999-2013
$0
$5,000
$10,000
$15,000
$20,000
$25,000
$30,000
$35,000
$40,000
$45,000
$50,000
$55,000
$60,000
1999 2000 2001 2002 2003 2004 2005 2006 2007 2008 2009 2010 2011 2012 2013

Welfare in Canada 2013 Caledon Institute of Social Policy 47
Figure 13dTotal welfare incomes, couple with two children ages 10 and 15,
Nunavut, in constant 2013 dollars, 1999-2013
$0
$5,000
$10,000
$15,000
$20,000
$25,000
$30,000
$35,000
$40,000
$45,000
$50,000
$55,000
$60,000
1999 2000 2001 2002 2003 2004 2005 2006 2007 2008 2009 2010 2011 2012 2013
Adequacy of welfare incomes
The best way to assess the adequacy of an income program is to compare it to arecognized standard and then determine how far it differs from that indicator. There is no singleor commonly accepted baseline in Canada, but several measures are typically used forcomparative purposes. The fall into one of two groups: poverty measures and incomemeasures.
Poverty measures
Poverty measures are considered to be the baseline level below which households aredeemed to live in poverty. Two poverty measures are employed in this report: low income cut-offs (LICOs) and the Market Basket Measure (MBM). The low-income measure (generallyknown as the LIM), which is employed primarily for international comparisons, is not includedhere. The low income cut-offs and Market Basket Measure have been used to ensureconsistency with past reports in this series produced by the National Council of Welfare.
48 Caledon Institute of Social Policy Welfare in Canada 2013
Low income cut-offs
The low income cut-offs (LICOs) were developed by Statistics Canada in the 1960s.While Statistics Canada does not consider the LICOs to be an official poverty line, they are themost commonly used standard in the country. The low income cut-offs are income thresholdsbelow which a household will likely devote a larger share of its income to the necessities offood, clothing and shelter.
Currently, the average family spends 43 percent of its after-tax income on these threenecessities. The low income cut-offs are set where families devote, on average, 63 percent (43percent plus 20 percentage points) of their after-tax income to necessities, leaving fewer dollarsavailable for other expenses such as health, education, transportation and recreation. LICOs arecalculated for seven sizes of families and five sizes of communities. Here, we use the termslow income cut-offs and poverty lines synonymously.
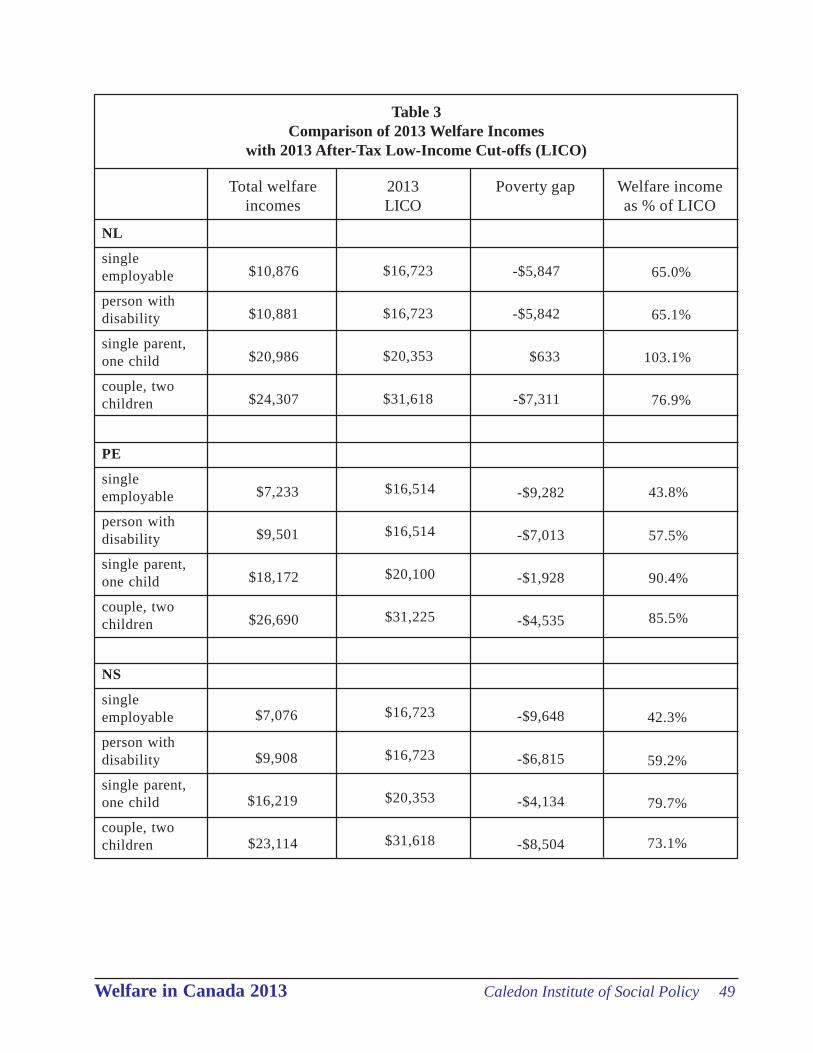
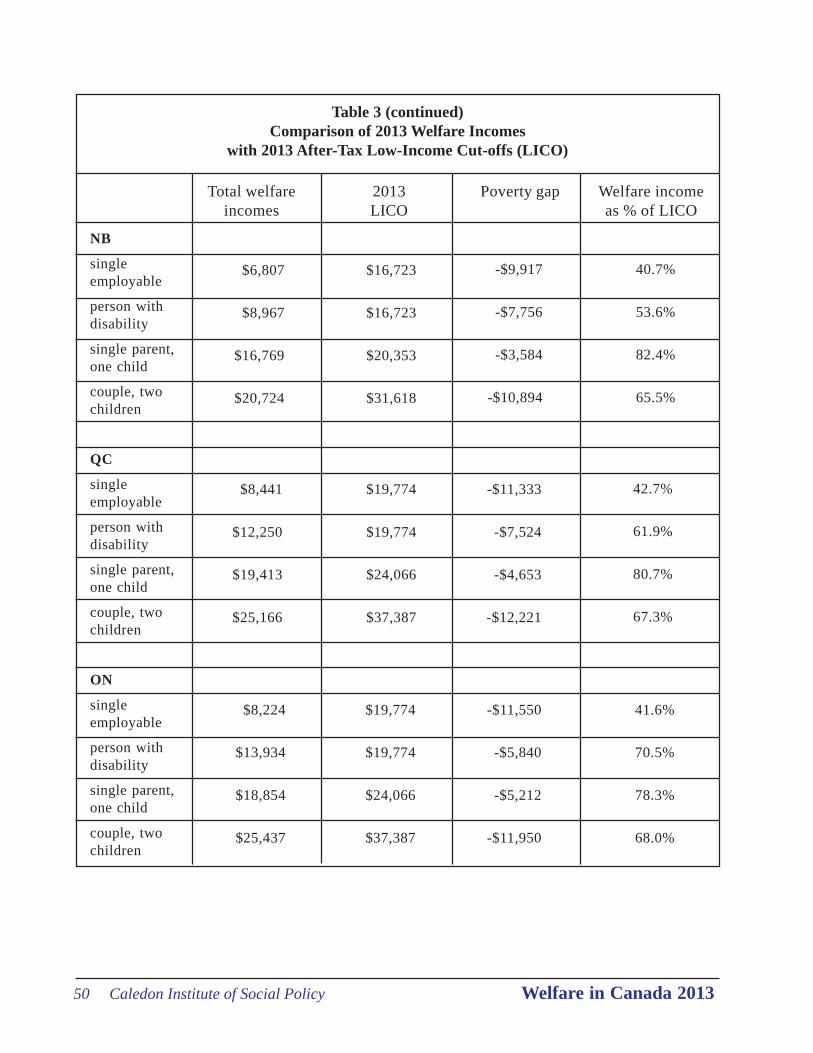
Table 3 compares total welfare incomes in 2013 with the after-tax low income cut-offsfor that year for the ten provinces. Because the survey that generates the low income cut-offsand income estimates does not cover the three territories, they are not included in any of thecomparisons with low-income lines or average and median incomes.
After-tax measures are used because they are deemed to be more comparable to welfare,which is not subject to income taxation. It can be seen that welfare incomes fall well below thedesignated cut-offs for all household types and in all jurisdictions (with the one exception ofsingle-parent families in Newfoundland and Labrador, whose welfare incomes are $633 abovethe LICO).
In 2013, welfare incomes for single employable households ranged from 36.1 percent ofthe after-tax poverty line in Manitoba to a ‘high’ of 65.0 percent in Newfoundland andLabrador. Most of the other jurisdictions cluster around the lower rate. See Table 3 for all theresults.
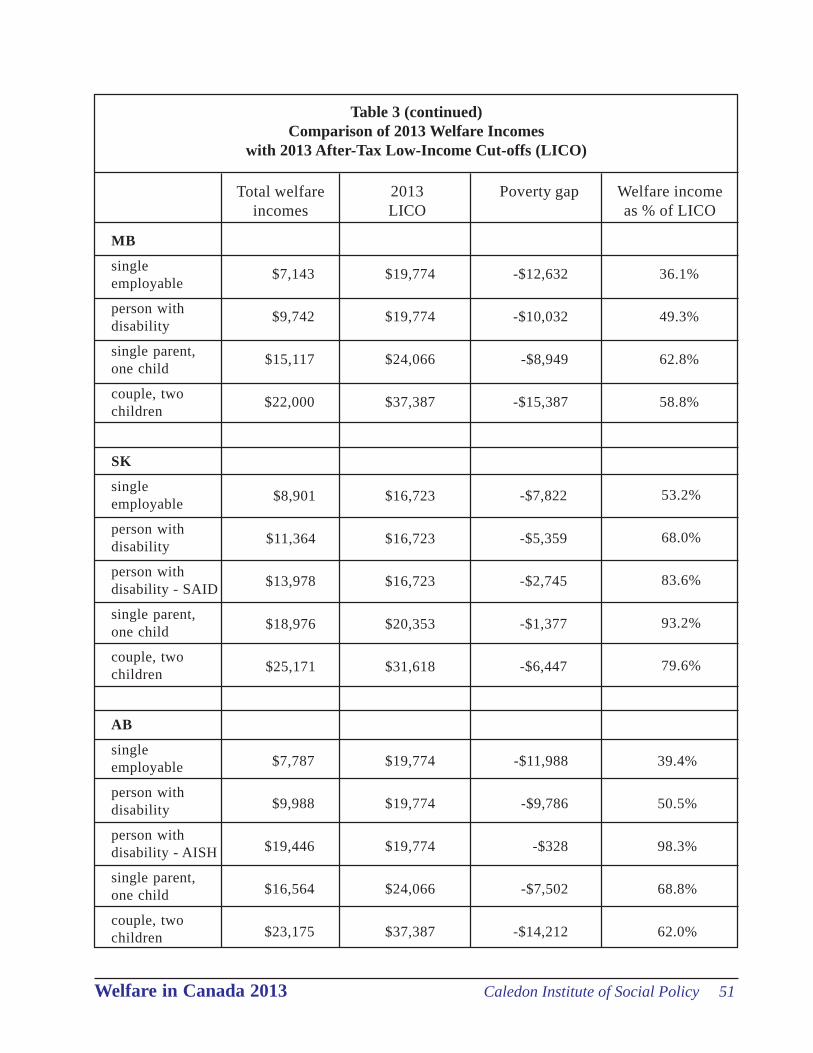
Welfare incomes for single persons with disabilities, while low, were slightly higher,ranging from 49.3 percent of the poverty line in Manitoba to 70.5 percent in Ontario. Albertaprovides a separate program (AISH, or Assured Income for the Severely Handicapped) forpersons with disabilities, which pays higher rates than the standard welfare program. In 2013,incomes of single persons on AISH came to 98.3 percent of the after-tax LICO, far higher thanthe 50.5 percent for persons with disabilities on standard welfare. In Saskatchewan, we includefor the first time incomes of persons with disabilities on the Saskatchewan Assured Income forDisability (SAID) program. This program also pays higher rates than standard welfare. For2013, the income of single persons on SAID was 83.6 percent of the after-tax LICO, comparedto 68.0 percent for those receiving Saskatchewan Assistance Plan benefits. Table 3 gives thedetails.
Welfare in Canada 2013 Caledon Institute of Social Policy 49
NL
singleemployable
person withdisability
single parent,one child
couple, twochildren
PE
singleemployable
person withdisability
single parent,one child
couple, twochildren
NS
singleemployable
person withdisability
single parent,one child
couple, twochildren
Table 3Comparison of 2013 Welfare Incomes
with 2013 After-Tax Low-Income Cut-offs (LICO)
Total welfareincomes
2013LICO
Poverty gap Welfare incomeas % of LICO
$10,876
$10,881
$20,986
$24,307
$7,233
$9,501
$18,172
$26,690
$7,076
$9,908
$16,219
$23,114
$16,723
$16,723
$20,353
$31,618
-$5,847
-$5,842
$633
-$7,311
43.8%
57.5%
90.4%
85.5%
65.0%
65.1%
103.1%
76.9%
42.3%
59.2%
79.7%
73.1%
-$9,282
-$7,013
-$1,928
-$4,535
$16,723
$16,723
$20,353
$31,618
$16,514
$16,514
$20,100
$31,225
-$9,648
-$6,815
-$4,134
-$8,504
50 Caledon Institute of Social Policy Welfare in Canada 2013
Table 3 (continued)Comparison of 2013 Welfare Incomes
with 2013 After-Tax Low-Income Cut-offs (LICO)
NB
singleemployable
person withdisability
single parent,one child
couple, twochildren
QC
singleemployable
person withdisability
single parent,one child
couple, twochildren
ON
singleemployable
person withdisability
single parent,one child
couple, twochildren
Total welfareincomes
2013LICO
Poverty gap Welfare incomeas % of LICO
$6,807
$8,967
$16,769
$20,724
$8,441
$12,250
$19,413
$25,166
$8,224
$13,934
$18,854
$25,437
$16,723
$16,723
$20,353
$31,618
$19,774
$19,774
$24,066
$37,387
$19,774
$19,774
$24,066
$37,387
-$9,917
-$7,756
-$3,584
-$10,894
-$11,333
-$7,524
-$4,653
-$12,221
-$11,550
-$5,840
-$5,212
-$11,950
40.7%
53.6%
82.4%
65.5%
42.7%
61.9%
80.7%
67.3%
41.6%
70.5%
78.3%
68.0%
Welfare in Canada 2013 Caledon Institute of Social Policy 51
MB
singleemployable
person withdisability
single parent,one child
couple, twochildren
SK
singleemployable
person withdisability
person withdisability - SAID
single parent,one child
couple, twochildren
AB
singleemployable
person withdisability
person withdisability - AISH
single parent,one child
couple, twochildren
Total welfareincomes
Table 3 (continued)Comparison of 2013 Welfare Incomes
with 2013 After-Tax Low-Income Cut-offs (LICO)
2013LICO
Poverty gap Welfare incomeas % of LICO
36.1%
49.3%
62.8%
58.8%
53.2%
68.0%
83.6%
93.2%
79.6%
39.4%
50.5%
98.3%
68.8%
62.0%
$7,143
$9,742
$15,117
$22,000
$8,901
$11,364
$13,978
$18,976
$25,171
$7,787
$9,988
$19,446
$16,564
$23,175
$19,774
$19,774
$24,066
$37,387
$16,723
$16,723
$16,723
$20,353
$31,618
$19,774
$19,774
$19,774
$24,066
$37,387
-$12,632
-$10,032
-$8,949
-$15,387
-$7,822
-$5,359
-$2,745
-$1,377
-$6,447
-$11,988
-$9,786
-$328
-$7,502
-$14,212
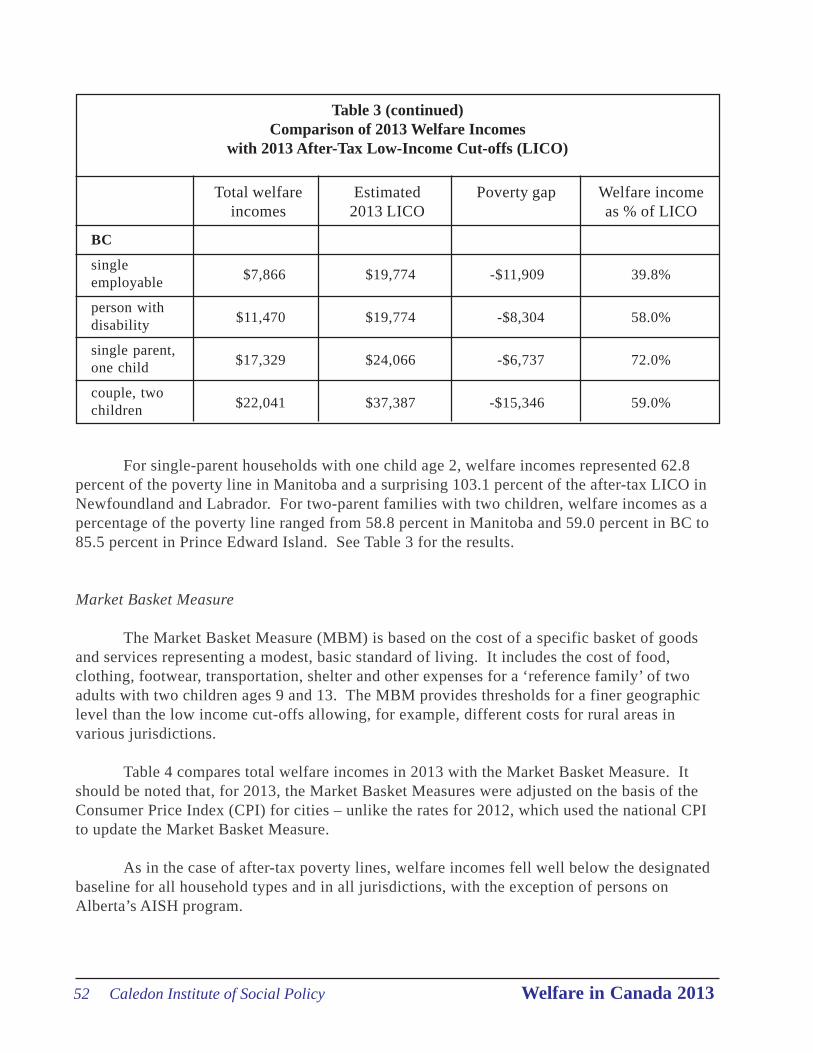
52 Caledon Institute of Social Policy Welfare in Canada 2013
BC
singleemployable
person withdisability
single parent,one child
couple, twochildren
Total welfareincomes
Estimated2013 LICO
Poverty gap Welfare incomeas % of LICO
$7,866
$11,470
$17,329
$22,041
$19,774
$19,774
$24,066
$37,387
-$11,909
-$8,304
-$6,737
-$15,346
39.8%
58.0%
72.0%
59.0%
For single-parent households with one child age 2, welfare incomes represented 62.8percent of the poverty line in Manitoba and a surprising 103.1 percent of the after-tax LICO inNewfoundland and Labrador. For two-parent families with two children, welfare incomes as apercentage of the poverty line ranged from 58.8 percent in Manitoba and 59.0 percent in BC to85.5 percent in Prince Edward Island. See Table 3 for the results.
Market Basket Measure
The Market Basket Measure (MBM) is based on the cost of a specific basket of goodsand services representing a modest, basic standard of living. It includes the cost of food,clothing, footwear, transportation, shelter and other expenses for a ‘reference family’ of twoadults with two children ages 9 and 13. The MBM provides thresholds for a finer geographiclevel than the low income cut-offs allowing, for example, different costs for rural areas invarious jurisdictions.
Table 4 compares total welfare incomes in 2013 with the Market Basket Measure. Itshould be noted that, for 2013, the Market Basket Measures were adjusted on the basis of theConsumer Price Index (CPI) for cities – unlike the rates for 2012, which used the national CPIto update the Market Basket Measure.
As in the case of after-tax poverty lines, welfare incomes fell well below the designatedbaseline for all household types and in all jurisdictions, with the exception of persons onAlberta’s AISH program.
Table 3 (continued)Comparison of 2013 Welfare Incomes
with 2013 After-Tax Low-Income Cut-offs (LICO)
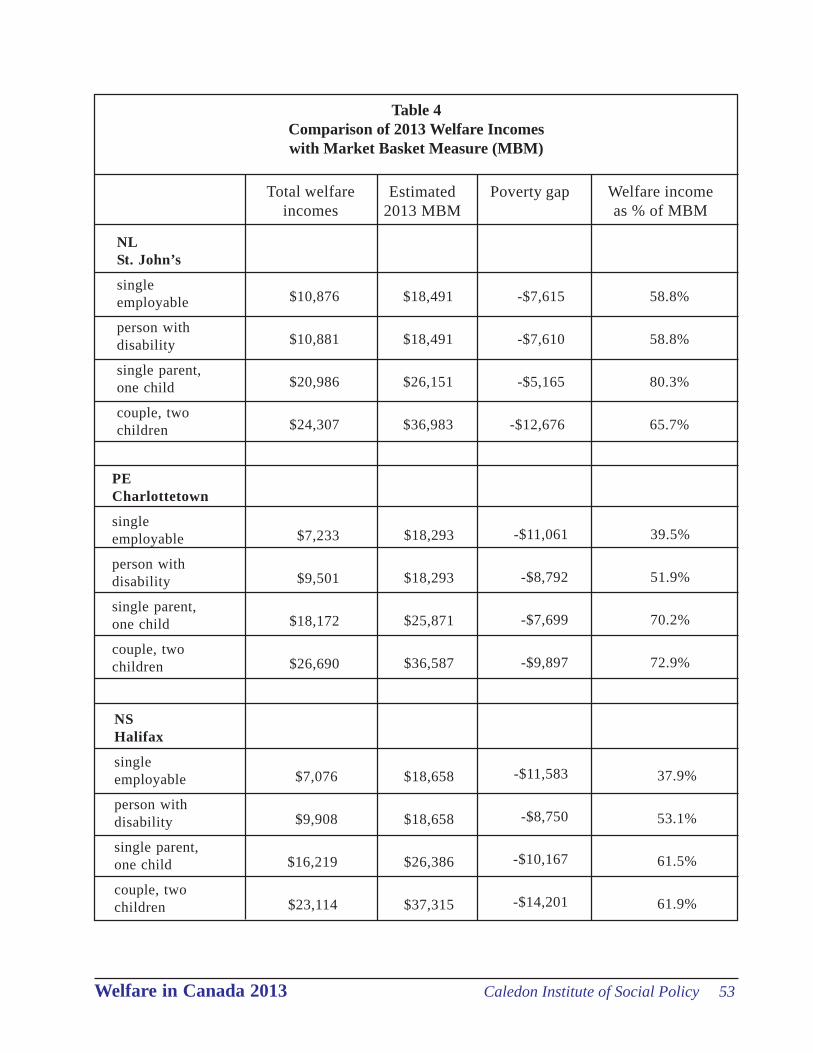
Welfare in Canada 2013 Caledon Institute of Social Policy 53
Table 4Comparison of 2013 Welfare Incomeswith Market Basket Measure (MBM)
Total welfareincomes
Estimated2013 MBM
Poverty gap Welfare incomeas % of MBM
NLSt. John’s
singleemployable
person withdisability
single parent,one child
couple, twochildren
$10,876
$10,881
$20,986
$24,307
$18,491
$18,491
$26,151
$36,983
-$7,615
-$7,610
-$5,165
-$12,676
58.8%
58.8%
80.3%
65.7%
PECharlottetown
singleemployable
person withdisability
single parent,one child
couple, twochildren
$7,233
$9,501
$18,172
$26,690
$18,293
$18,293
$25,871
$36,587
-$11,061
-$8,792
-$7,699
-$9,897
39.5%
51.9%
70.2%
72.9%
NSHalifax
singleemployable
person withdisability
single parent,one child
couple, twochildren
$7,076
$9,908
$16,219
$23,114
$18,658
$18,658
$26,386
$37,315
-$11,583
-$8,750
-$10,167
-$14,201
37.9%
53.1%
61.5%
61.9%
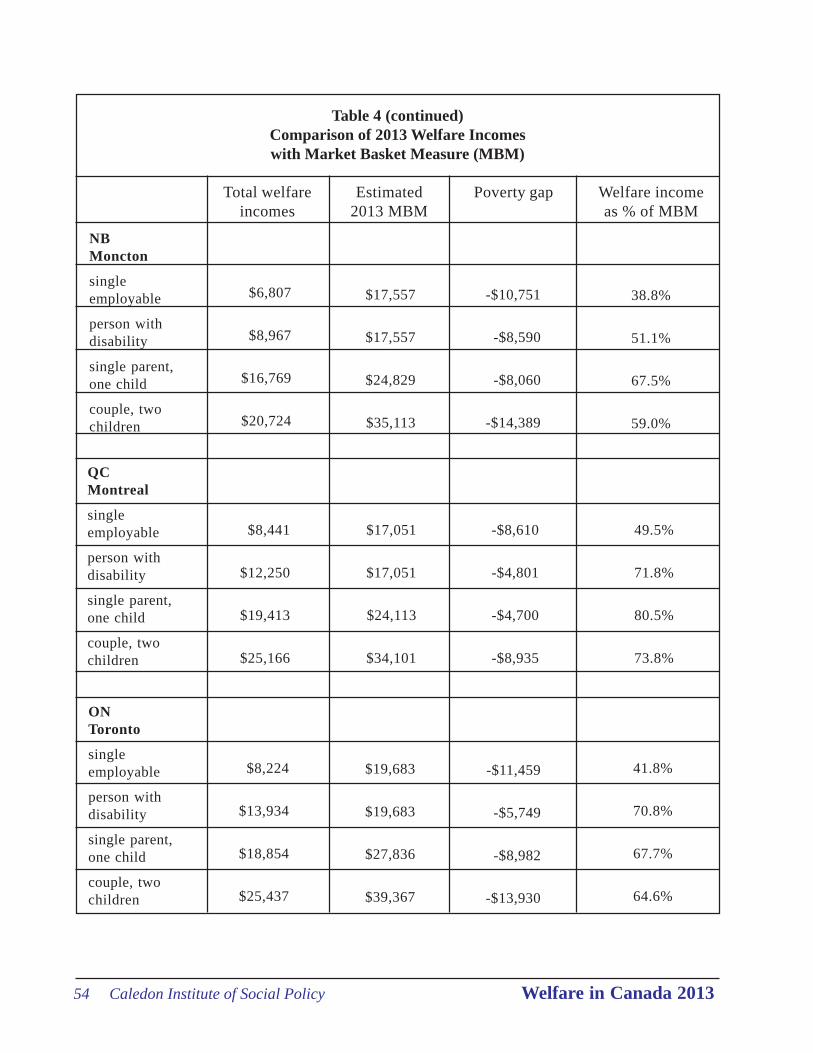
54 Caledon Institute of Social Policy Welfare in Canada 2013
QCMontreal
singleemployable
person withdisability
single parent,one child
couple, twochildren
$8,441
$12,250
$19,413
$25,166
$8,224
$13,934
$18,854
$25,437
$17,051
$17,051
$24,113
$34,101
$19,683
$19,683
$27,836
$39,367
-$8,610
-$4,801
-$4,700
-$8,935
-$11,459
-$5,749
-$8,982
-$13,930
49.5%
71.8%
80.5%
73.8%
41.8%
70.8%
67.7%
64.6%
Total welfareincomes
Estimated2013 MBM
Poverty gap Welfare incomeas % of MBM
$6,807
$8,967
$16,769
$20,724
$17,557
$17,557
$24,829
$35,113
-$10,751
-$8,590
-$8,060
-$14,389
38.8%
51.1%
67.5%
59.0%
ONToronto
singleemployable
person withdisability
single parent,one child
couple, twochildren
NBMoncton
singleemployable
person withdisability
single parent,one child
couple, twochildren
Table 4 (continued)Comparison of 2013 Welfare Incomeswith Market Basket Measure (MBM)
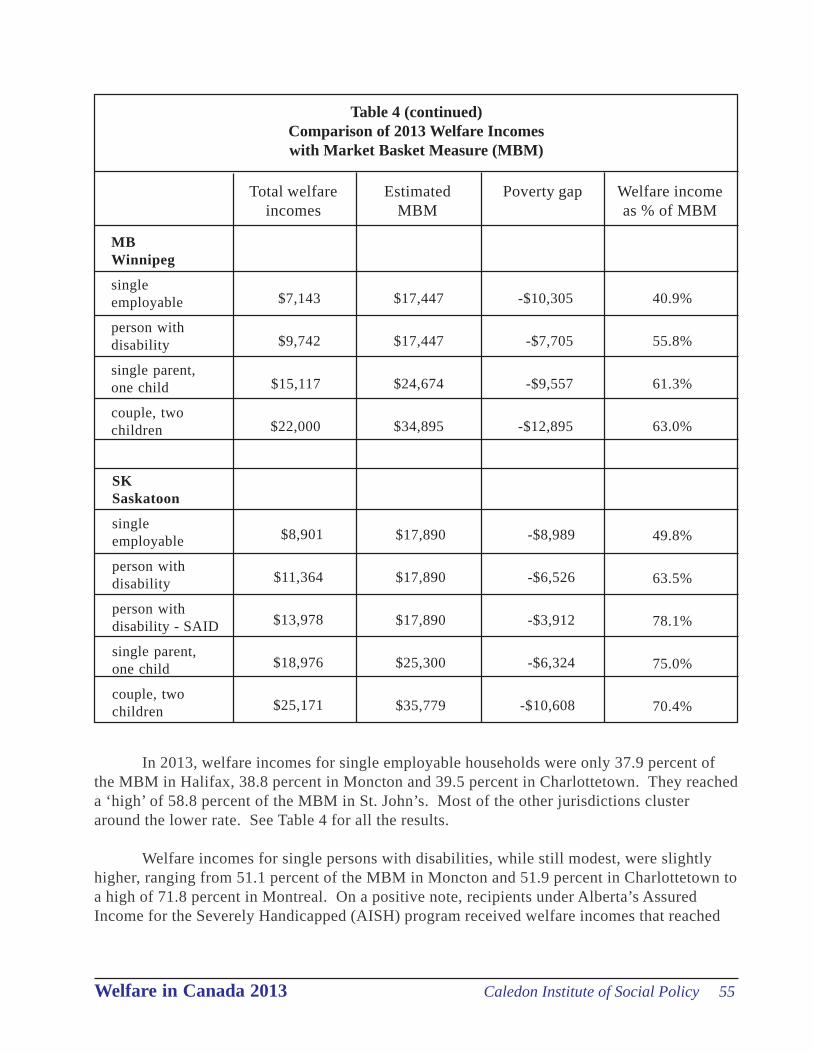
Welfare in Canada 2013 Caledon Institute of Social Policy 55
Total welfareincomes
EstimatedMBM
Poverty gap Welfare incomeas % of MBM
$7,143
$9,742
$15,117
$22,000
$17,447
$17,447
$24,674
$34,895
-$10,305
-$7,705
-$9,557
-$12,895
40.9%
55.8%
61.3%
63.0%
SKSaskatoon
singleemployable
person withdisability
person withdisability - SAID
single parent,one child
couple, twochildren
$8,901
$11,364
$13,978
$18,976
$25,171
$17,890
$17,890
$17,890
$25,300
$35,779
-$8,989
-$6,526
-$3,912
-$6,324
-$10,608
49.8%
63.5%
78.1%
75.0%
70.4%
Table 4 (continued)Comparison of 2013 Welfare Incomeswith Market Basket Measure (MBM)
MBWinnipeg
singleemployable
person withdisability
single parent,one child
couple, twochildren
In 2013, welfare incomes for single employable households were only 37.9 percent ofthe MBM in Halifax, 38.8 percent in Moncton and 39.5 percent in Charlottetown. They reacheda ‘high’ of 58.8 percent of the MBM in St. John’s. Most of the other jurisdictions clusteraround the lower rate. See Table 4 for all the results.
Welfare incomes for single persons with disabilities, while still modest, were slightlyhigher, ranging from 51.1 percent of the MBM in Moncton and 51.9 percent in Charlottetown toa high of 71.8 percent in Montreal. On a positive note, recipients under Alberta’s AssuredIncome for the Severely Handicapped (AISH) program received welfare incomes that reached
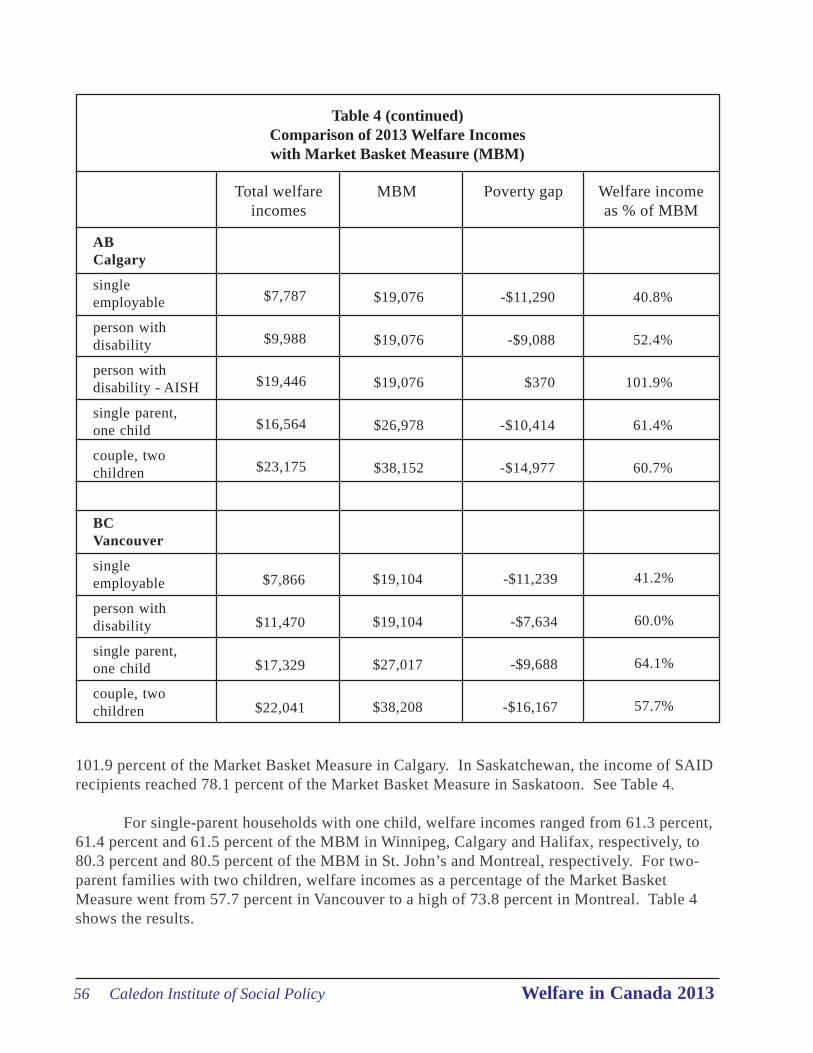
56 Caledon Institute of Social Policy Welfare in Canada 2013
$7,866
$11,470
$17,329
$22,041
$19,104
$19,104
$27,017
$38,208
-$11,239
-$7,634
-$9,688
-$16,167
41.2%
60.0%
64.1%
57.7%
ABCalgary
singleemployable
person withdisability
person withdisability - AISH
single parent,one child
couple, twochildren
BCVancouver
singleemployable
person withdisability
single parent,one child
couple, twochildren
Table 4 (continued)Comparison of 2013 Welfare Incomeswith Market Basket Measure (MBM)
Total welfareincomes
MBM Poverty gap Welfare incomeas % of MBM
$7,787
$9,988
$19,446
$16,564
$23,175
$19,076
$19,076
$19,076
$26,978
$38,152
-$11,290
-$9,088
$370
-$10,414
-$14,977
40.8%
52.4%
101.9%
61.4%
60.7%
101.9 percent of the Market Basket Measure in Calgary. In Saskatchewan, the income of SAIDrecipients reached 78.1 percent of the Market Basket Measure in Saskatoon. See Table 4.
For single-parent households with one child, welfare incomes ranged from 61.3 percent,61.4 percent and 61.5 percent of the MBM in Winnipeg, Calgary and Halifax, respectively, to80.3 percent and 80.5 percent of the MBM in St. John’s and Montreal, respectively. For two-parent families with two children, welfare incomes as a percentage of the Market BasketMeasure went from 57.7 percent in Vancouver to a high of 73.8 percent in Montreal. Table 4shows the results.
Welfare in Canada 2013 Caledon Institute of Social Policy 57
Income measures
Income measures comprise the second group of comparators to determine the adequacyof welfare payments. This set of measures assesses the adequacy of welfare relative to the levelof income of other households in the population.
There are several different indicators that can be used for comparative purposes. Twohave been selected for this analysis: after-tax average incomes and after-tax median incomes.These are the same measures employed in the Welfare Incomes series formerly produced by theNational Council of Welfare.
Caledon has adopted a new approach to reporting average and median after-tax income.Starting with last year’s report, we reverted to using publicly available data from CANSIM. Forthe single-parent household, we use the data for all single parents. For the couple with twochildren, we use the data for two-parent families with children. We had special runs done bythe Income Statistics Division of Statistics Canada to provide data for all non-elderlyunattached individuals. All data from CANSIM relate to economic families.1 The latestavailable data are for 2011. We have indexed these to 2013 based on the national rate ofinflation.
After-tax average incomes
The calculation of average incomes takes into account all sources, including wages andsalaries, investment income and transfers from income security programs. Average incomesprovide a sense of the overall financial circumstances of the population.
There is significant variation in average incomes by province because of differences intheir respective economic foundations. Calculations are not provided for the three territoriesbecause they are not included the Survey of Labour and Income Dynamics from which incomedata are derived.
The figures presented in Table 5 employ after-tax average incomes. These represent theamounts that households actually can use in their daily lives – their so-called ‘disposableincome’ after they have paid federal and provincial/territorial income taxes. After-tax amountsrepresent a good basis for comparison to welfare, which is not subject to income taxation and istherefore effectively a de facto disposable income.
Compared to after-tax average incomes for single people, welfare incomes for singleemployable recipients ranged from 18.9 percent in Alberta to 36.1 percent in Newfoundland andLabrador, as shown in Table 5.
1. Starting in 2006, the National Council of Welfare had customized tables generated by Statistics Canada thatcorresponded to the family structure used in the Welfare Incomes report. Average income data were derivedfrom the Survey of Labour and Income Dynamics (SLID) and related to economic families. Median incomedata were generated by the Small Area and Administrative Data Division and related to Census families.
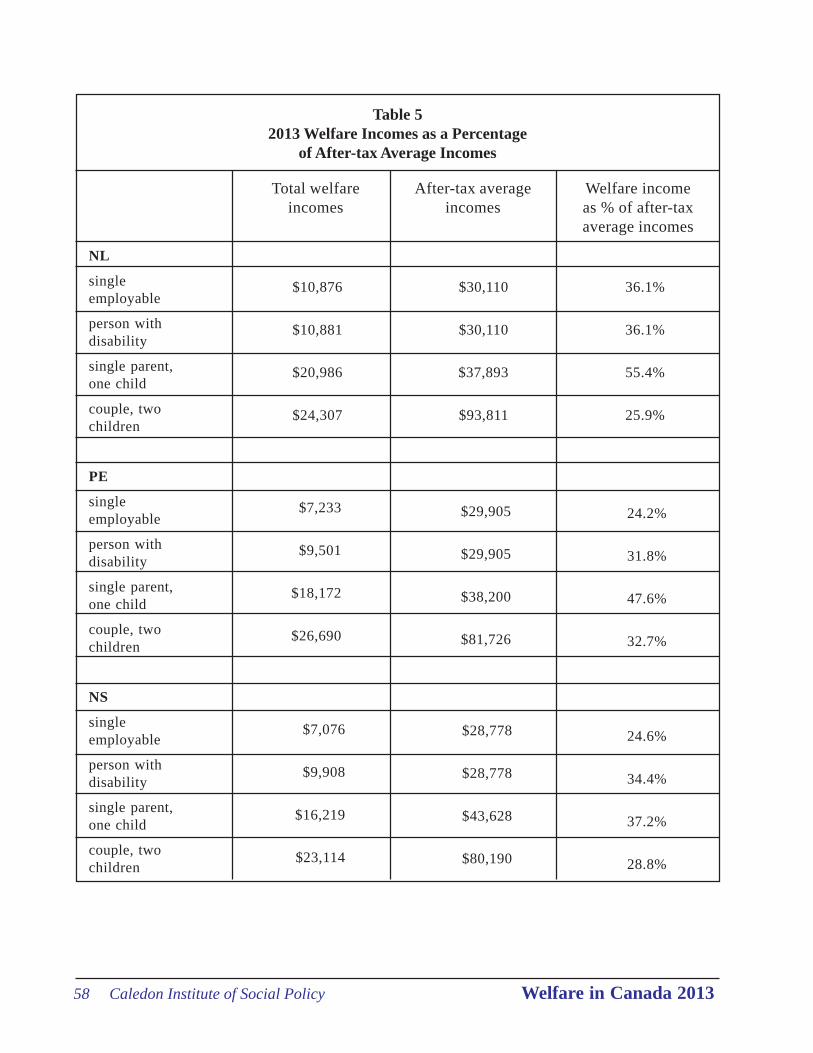
58 Caledon Institute of Social Policy Welfare in Canada 2013
Table 52013 Welfare Incomes as a Percentage
of After-tax Average Incomes
NL
singleemployable
person withdisability
single parent,one child
couple, twochildren
PE
singleemployable
person withdisability
single parent,one child
couple, twochildren
NS
singleemployable
person withdisability
single parent,one child
couple, twochildren
Total welfareincomes
Welfare incomeas % of after-taxaverage incomes
After-tax averageincomes
$10,876
$10,881
$20,986
$24,307
$7,233
$9,501
$18,172
$26,690
$7,076
$9,908
$16,219
$23,114
$30,110
$30,110
$37,893
$93,811
$29,905
$29,905
$38,200
$81,726
$28,778
$28,778
$43,628
$80,190
36.1%
36.1%
55.4%
25.9%
24.2%
31.8%
47.6%
32.7%
24.6%
34.4%
37.2%
28.8%
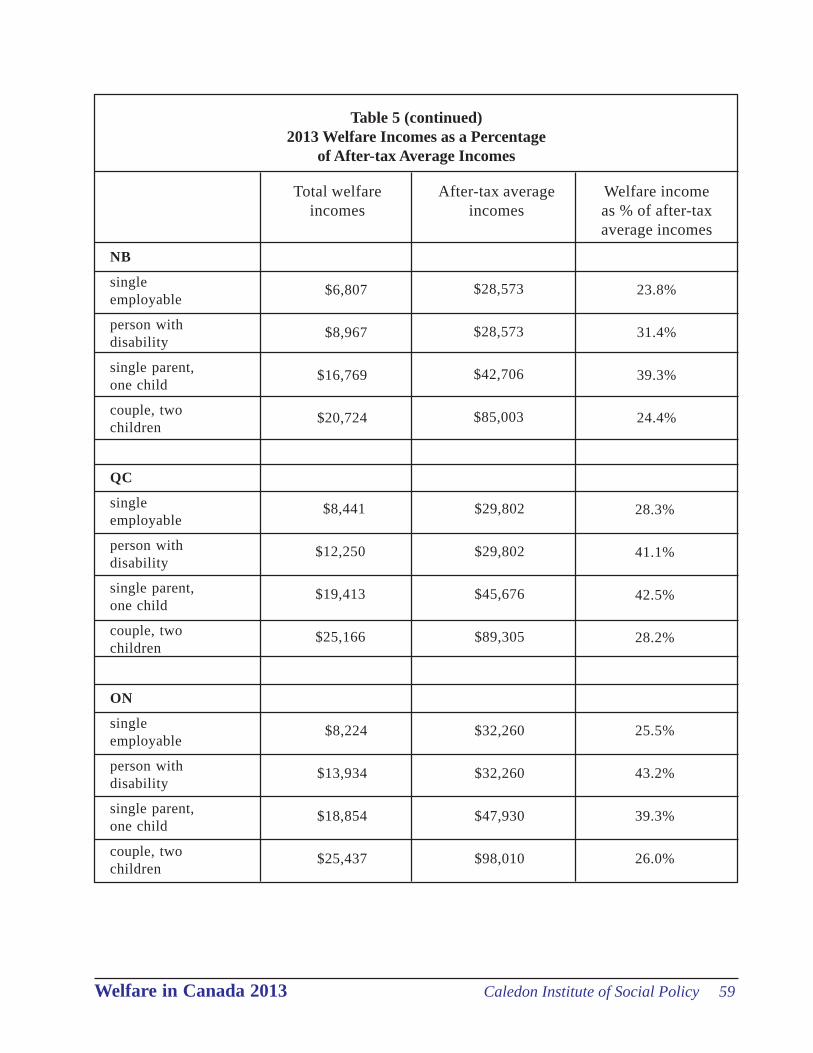
Welfare in Canada 2013 Caledon Institute of Social Policy 59
NB
singleemployable
person withdisability
single parent,one child
couple, twochildren
QC
singleemployable
person withdisability
single parent,one child
couple, twochildren
ON
singleemployable
person withdisability
single parent,one child
couple, twochildren
Table 5 (continued)2013 Welfare Incomes as a Percentage
of After-tax Average Incomes
Total welfareincomes
After-tax averageincomes
Welfare incomeas % of after-taxaverage incomes
$6,807
$8,967
$16,769
$20,724
$8,441
$12,250
$19,413
$25,166
$8,224
$13,934
$18,854
$25,437
$28,573
$28,573
$42,706
$85,003
$29,802
$29,802
$45,676
$89,305
$32,260
$32,260
$47,930
$98,010
23.8%
31.4%
39.3%
24.4%
28.3%
41.1%
42.5%
28.2%
25.5%
43.2%
39.3%
26.0%
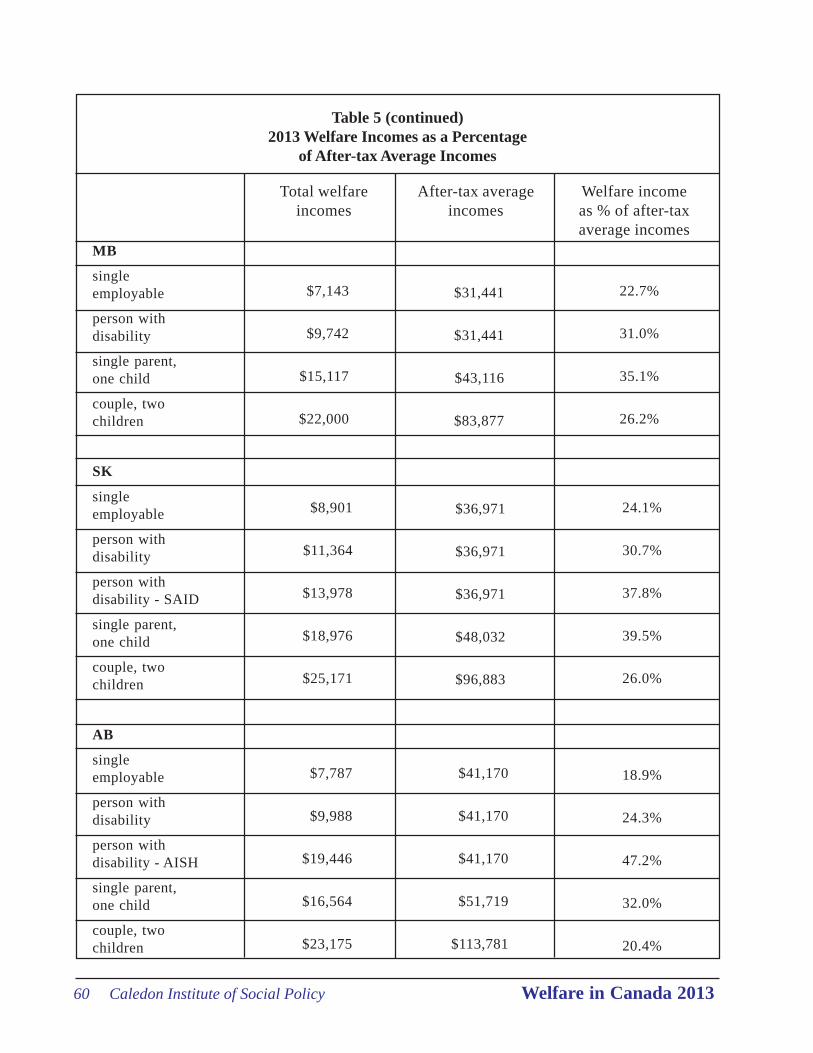
60 Caledon Institute of Social Policy Welfare in Canada 2013
Table 5 (continued)2013 Welfare Incomes as a Percentage
of After-tax Average Incomes
MB
singleemployable
person withdisability
single parent,one child
couple, twochildren
SK
singleemployable
person withdisability
person withdisability - SAID
single parent,one child
couple, twochildren
AB
singleemployable
person withdisability
person withdisability - AISH
single parent,one child
couple, twochildren
Total welfareincomes
After-tax averageincomes
Welfare incomeas % of after-taxaverage incomes
$7,143
$9,742
$15,117
$22,000
$8,901
$11,364
$13,978
$18,976
$25,171
$7,787
$9,988
$19,446
$16,564
$23,175
$31,441
$31,441
$43,116
$83,877
$36,971
$36,971
$36,971
$48,032
$96,883
$41,170
$41,170
$41,170
$51,719
$113,781
22.7%
31.0%
35.1%
26.2%
24.1%
30.7%
37.8%
39.5%
26.0%
18.9%
24.3%
47.2%
32.0%
20.4%
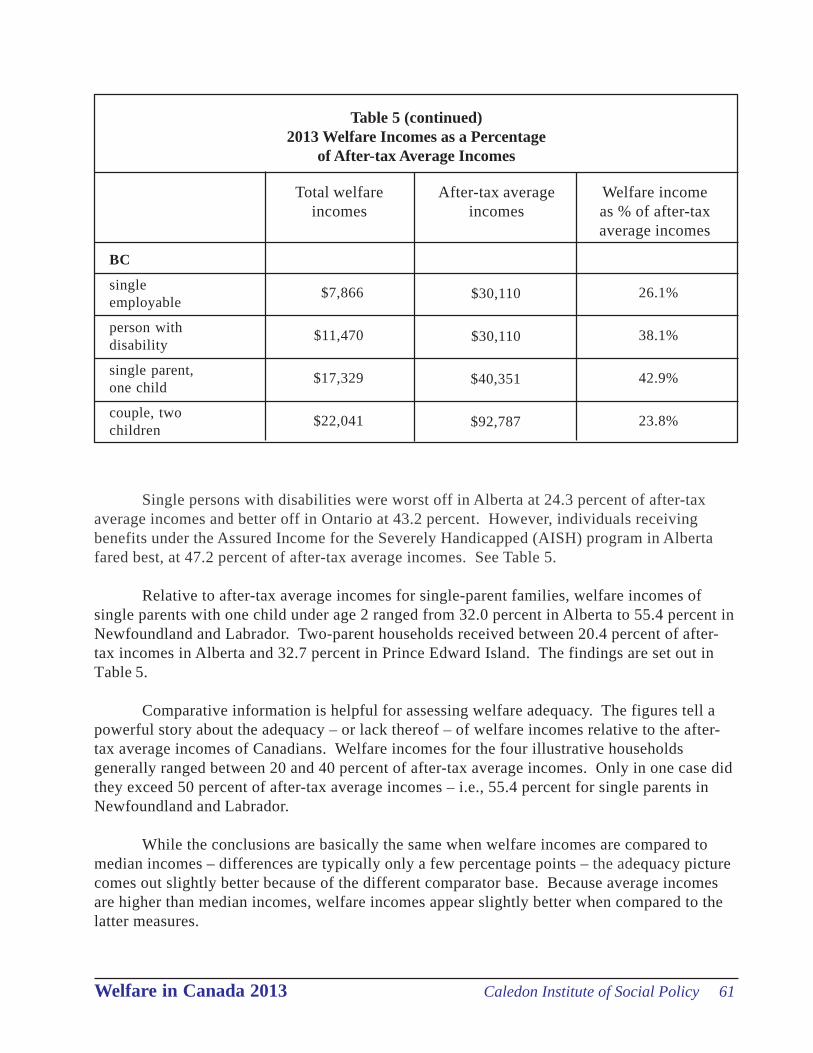
Welfare in Canada 2013 Caledon Institute of Social Policy 61
26.1%
38.1%
42.9%
23.8%
Table 5 (continued)2013 Welfare Incomes as a Percentage
of After-tax Average Incomes
Welfare incomeas % of after-taxaverage incomes
After-tax averageincomes
Total welfareincomes
BC
singleemployable
person withdisability
single parent,one child
couple, twochildren
$30,110
$30,110
$40,351
$92,787
$7,866
$11,470
$17,329
$22,041
Single persons with disabilities were worst off in Alberta at 24.3 percent of after-taxaverage incomes and better off in Ontario at 43.2 percent. However, individuals receivingbenefits under the Assured Income for the Severely Handicapped (AISH) program in Albertafared best, at 47.2 percent of after-tax average incomes. See Table 5.
Relative to after-tax average incomes for single-parent families, welfare incomes ofsingle parents with one child under age 2 ranged from 32.0 percent in Alberta to 55.4 percent inNewfoundland and Labrador. Two-parent households received between 20.4 percent of after-tax incomes in Alberta and 32.7 percent in Prince Edward Island. The findings are set out inTable 5.
Comparative information is helpful for assessing welfare adequacy. The figures tell apowerful story about the adequacy – or lack thereof – of welfare incomes relative to the after-tax average incomes of Canadians. Welfare incomes for the four illustrative householdsgenerally ranged between 20 and 40 percent of after-tax average incomes. Only in one case didthey exceed 50 percent of after-tax average incomes – i.e., 55.4 percent for single parents inNewfoundland and Labrador.
While the conclusions are basically the same when welfare incomes are compared tomedian incomes – differences are typically only a few percentage points – the adequacy picturecomes out slightly better because of the different comparator base. Because average incomesare higher than median incomes, welfare incomes appear slightly better when compared to thelatter measures.
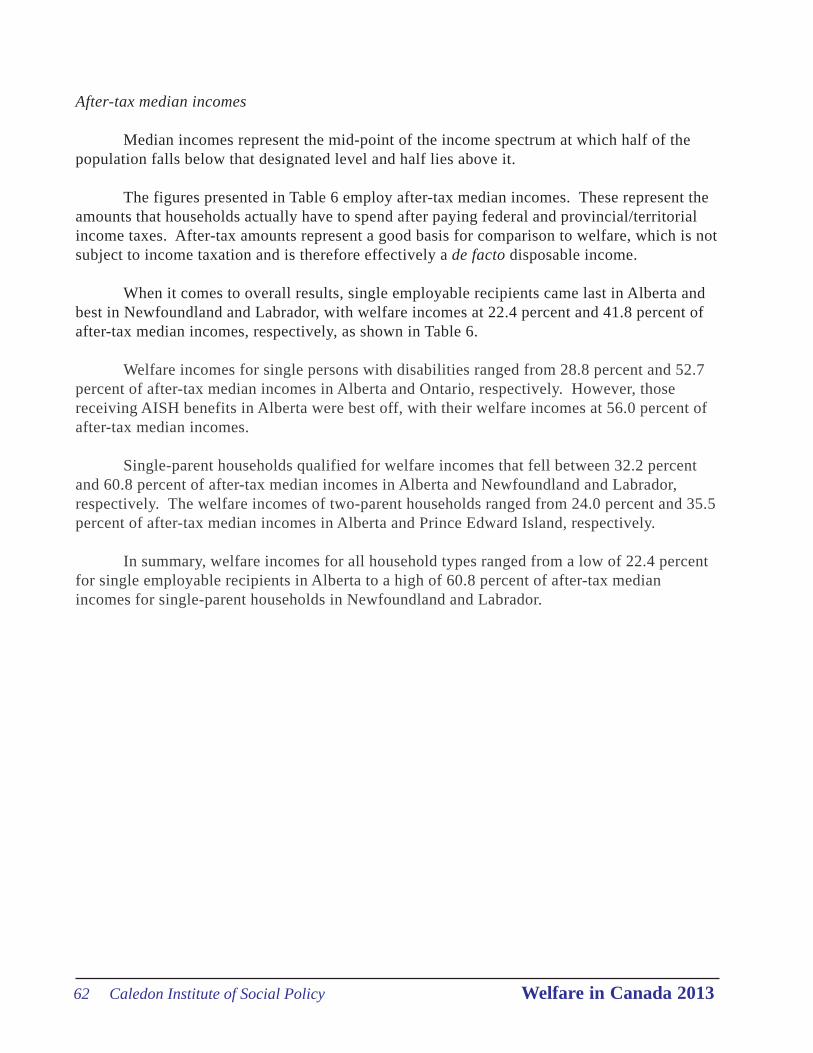
62 Caledon Institute of Social Policy Welfare in Canada 2013
After-tax median incomes
Median incomes represent the mid-point of the income spectrum at which half of thepopulation falls below that designated level and half lies above it.
The figures presented in Table 6 employ after-tax median incomes. These represent theamounts that households actually have to spend after paying federal and provincial/territorialincome taxes. After-tax amounts represent a good basis for comparison to welfare, which is notsubject to income taxation and is therefore effectively a de facto disposable income.
When it comes to overall results, single employable recipients came last in Alberta andbest in Newfoundland and Labrador, with welfare incomes at 22.4 percent and 41.8 percent ofafter-tax median incomes, respectively, as shown in Table 6.
Welfare incomes for single persons with disabilities ranged from 28.8 percent and 52.7percent of after-tax median incomes in Alberta and Ontario, respectively. However, thosereceiving AISH benefits in Alberta were best off, with their welfare incomes at 56.0 percent ofafter-tax median incomes.
Single-parent households qualified for welfare incomes that fell between 32.2 percentand 60.8 percent of after-tax median incomes in Alberta and Newfoundland and Labrador,respectively. The welfare incomes of two-parent households ranged from 24.0 percent and 35.5percent of after-tax median incomes in Alberta and Prince Edward Island, respectively.
In summary, welfare incomes for all household types ranged from a low of 22.4 percentfor single employable recipients in Alberta to a high of 60.8 percent of after-tax medianincomes for single-parent households in Newfoundland and Labrador.
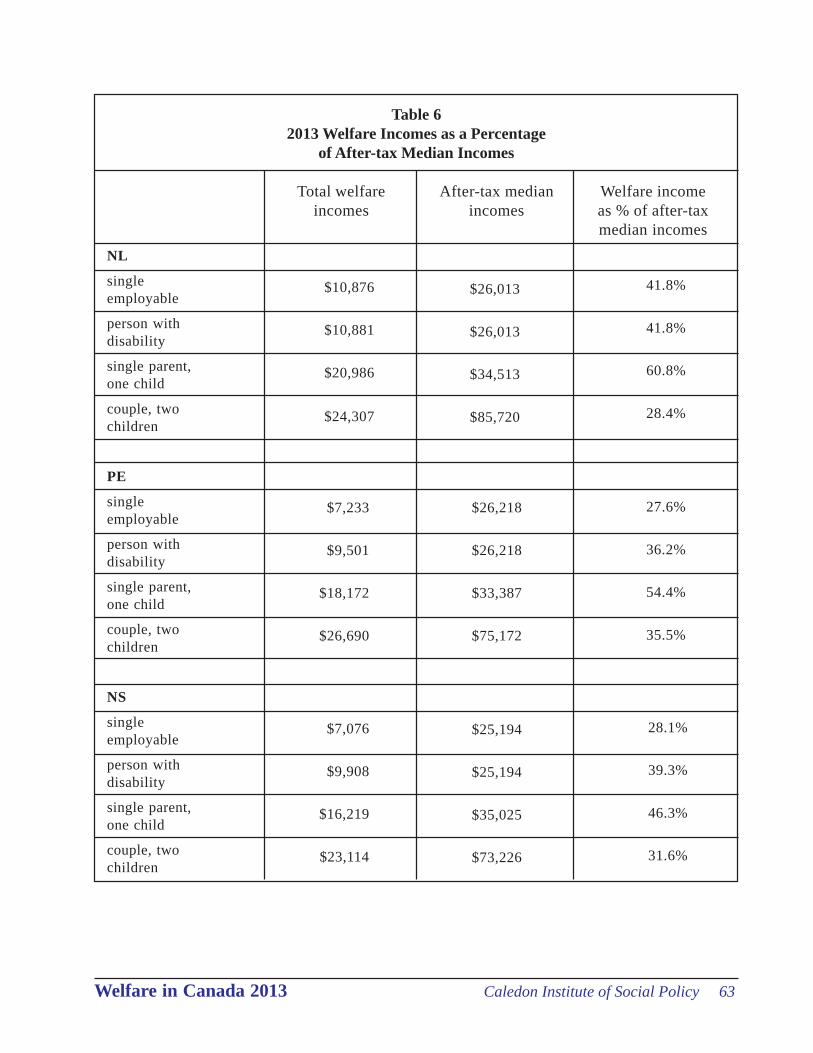
Welfare in Canada 2013 Caledon Institute of Social Policy 63
Table 62013 Welfare Incomes as a Percentage
of After-tax Median Incomes
Total welfareincomes
After-tax medianincomes
Welfare incomeas % of after-taxmedian incomes
NL
singleemployable
person withdisability
single parent,one child
couple, twochildren
PE
singleemployable
person withdisability
single parent,one child
couple, twochildren
NS
singleemployable
person withdisability
single parent,one child
couple, twochildren
$10,876
$10,881
$20,986
$24,307
$7,233
$9,501
$18,172
$26,690
$7,076
$9,908
$16,219
$23,114
$26,013
$26,013
$34,513
$85,720
$26,218
$26,218
$33,387
$75,172
$25,194
$25,194
$35,025
$73,226
41.8%
41.8%
60.8%
28.4%
27.6%
36.2%
54.4%
35.5%
28.1%
39.3%
46.3%
31.6%
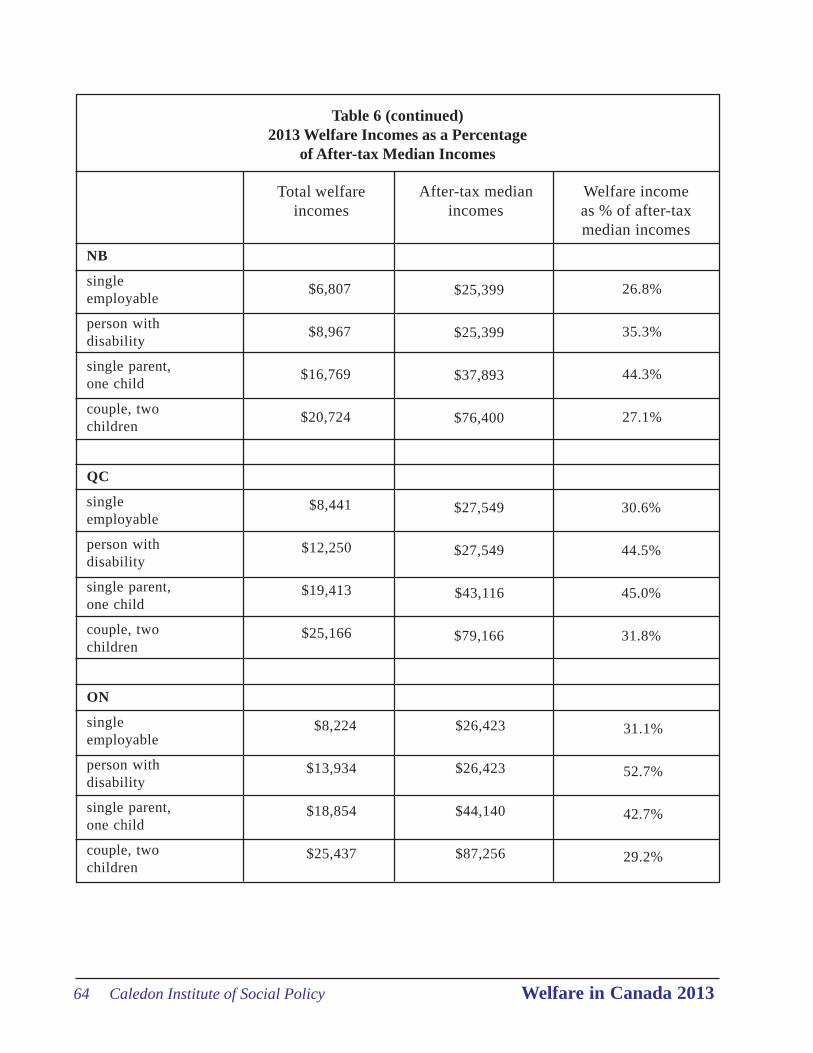
64 Caledon Institute of Social Policy Welfare in Canada 2013
Table 6 (continued)2013 Welfare Incomes as a Percentage
of After-tax Median Incomes
Total welfareincomes
After-tax medianincomes
Welfare incomeas % of after-taxmedian incomes
NB
singleemployable
person withdisability
single parent,one child
couple, twochildren
QC
singleemployable
person withdisability
single parent,one child
couple, twochildren
ON
singleemployable
person withdisability
single parent,one child
couple, twochildren
$6,807
$8,967
$16,769
$20,724
$8,441
$12,250
$19,413
$25,166
$8,224
$13,934
$18,854
$25,437
$25,399
$25,399
$37,893
$76,400
$27,549
$27,549
$43,116
$79,166
$26,423
$26,423
$44,140
$87,256
26.8%
35.3%
44.3%
27.1%
30.6%
44.5%
45.0%
31.8%
31.1%
52.7%
42.7%
29.2%
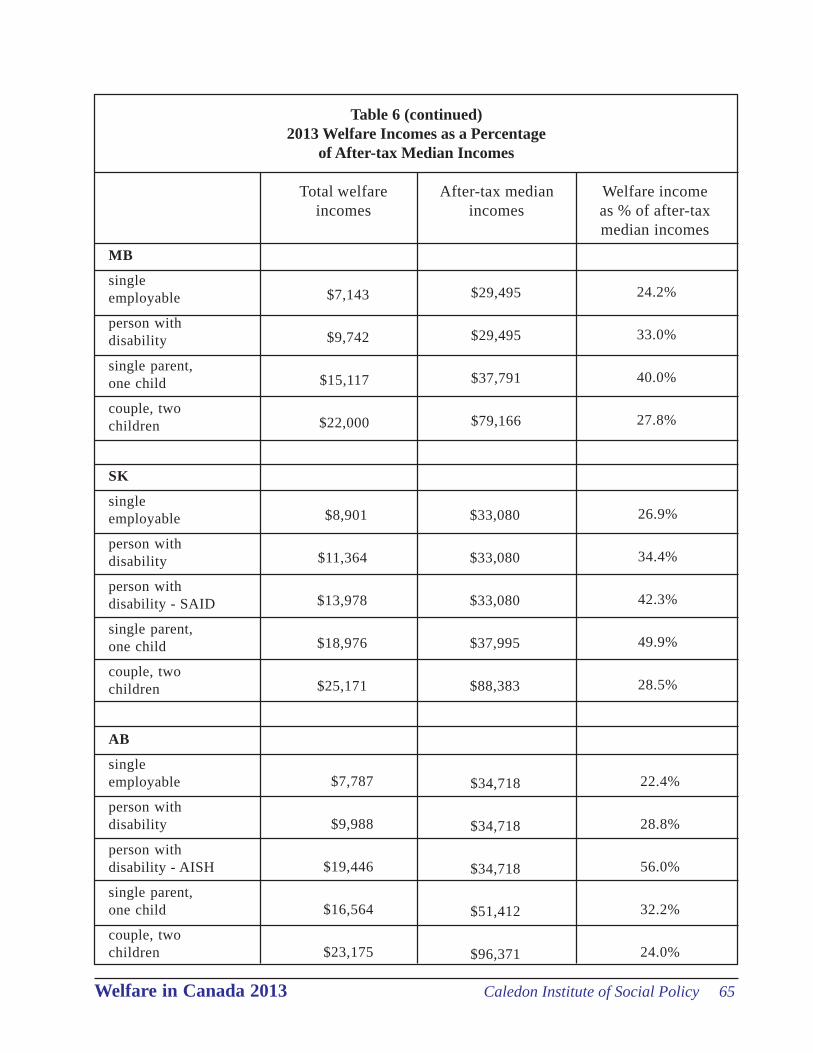
Welfare in Canada 2013 Caledon Institute of Social Policy 65
Table 6 (continued)2013 Welfare Incomes as a Percentage
of After-tax Median Incomes
Welfare incomeas % of after-taxmedian incomes
After-tax medianincomes
Total welfareincomes
MB
singleemployable
person withdisability
single parent,one child
couple, twochildren
SK
singleemployable
person withdisability
person withdisability - SAID
single parent,one child
couple, twochildren
AB
singleemployable
person withdisability
person withdisability - AISH
single parent,one child
couple, twochildren
$7,143
$9,742
$15,117
$22,000
$8,901
$11,364
$13,978
$18,976
$25,171
$7,787
$9,988
$19,446
$16,564
$23,175
$29,495
$29,495
$37,791
$79,166
$33,080
$33,080
$33,080
$37,995
$88,383
$34,718
$34,718
$34,718
$51,412
$96,371
24.2%
33.0%
40.0%
27.8%
26.9%
34.4%
42.3%
49.9%
28.5%
22.4%
28.8%
56.0%
32.2%
24.0%
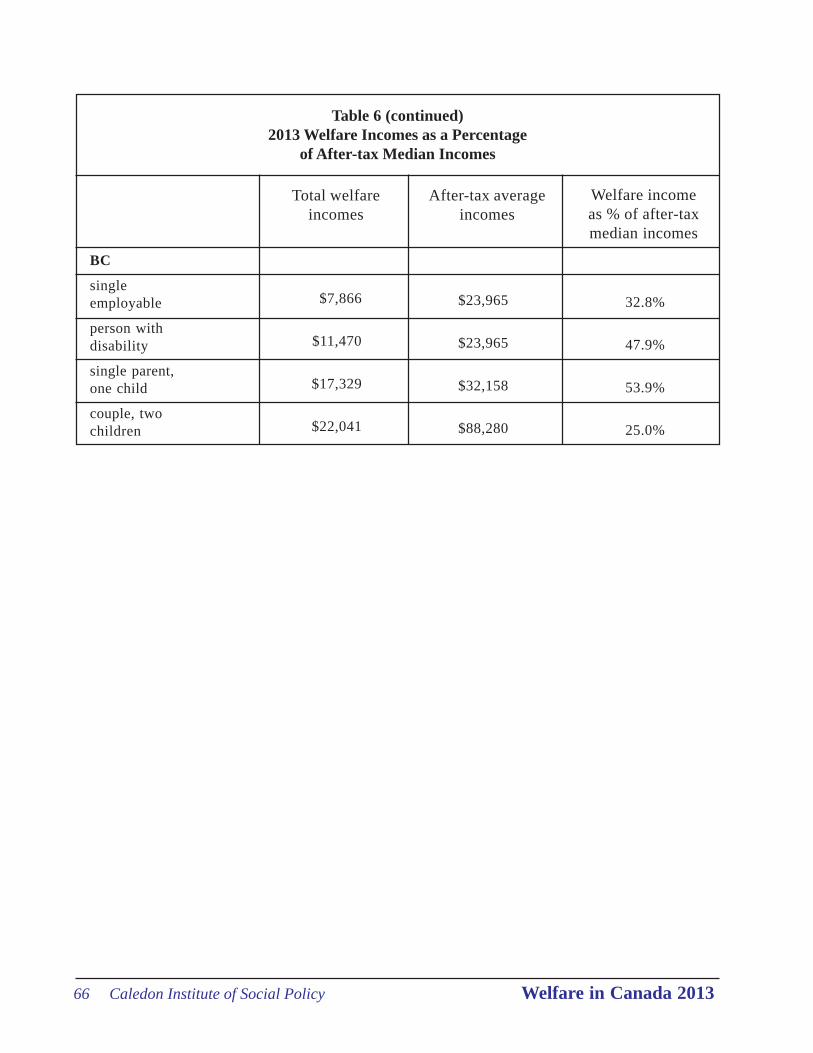
66 Caledon Institute of Social Policy Welfare in Canada 2013
Table 6 (continued)2013 Welfare Incomes as a Percentage
of After-tax Median Incomes
Total welfareincomes
After-tax averageincomes
Welfare incomeas % of after-taxmedian incomes
BC
singleemployable
person withdisability
single parent,one child
couple, twochildren
$7,866
$11,470
$17,329
$22,041
$23,965
$23,965
$32,158
$88,280
32.8%
47.9%
53.9%
25.0%
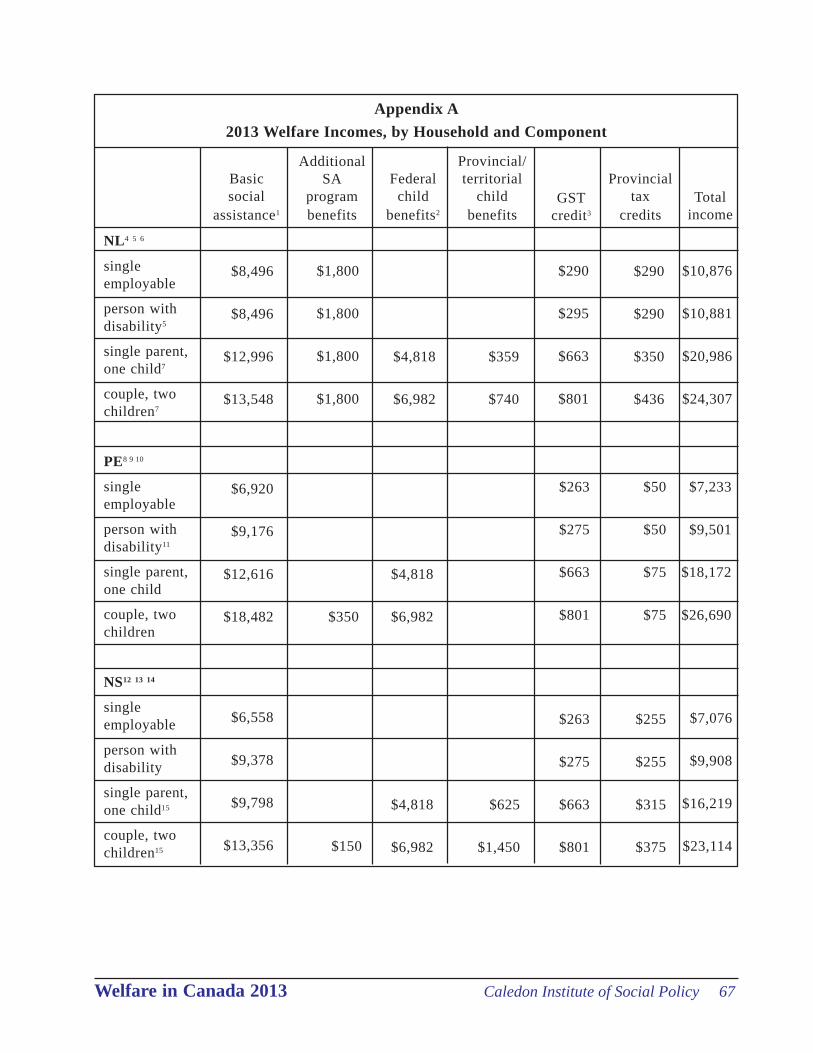
Welfare in Canada 2013 Caledon Institute of Social Policy 67
Appendix A2013 Welfare Incomes, by Household and Component
Basicsocial
assistance1
Federalchild
benefits2
Provincial/territorial
childbenefits
GSTcredit3
Provincialtax
creditsTotal
income
NL4 5 6
singleemployable
person withdisability5
single parent,one child7
couple, twochildren7
PE8 9 10
singleemployable
person withdisability11
single parent,one child
couple, twochildren
NS12 13 14
singleemployable
person withdisability
single parent,one child15
couple, twochildren15
AdditionalSA
programbenefits
$8,496
$8,496
$12,996
$13,548
$6,920
$9,176
$12,616
$18,482
$6,558
$9,378
$9,798
$13,356
$1,800
$1,800
$1,800
$1,800
$350
$150
$4,818
$6,982
$4,818
$6,982
$4,818
$6,982
$359
$740
$625
$1,450
$290
$295
$663
$801
$263
$275
$663
$801
$263
$275
$663
$801
$290
$290
$350
$436
$50
$50
$75
$75
$255
$255
$315
$375
$10,876
$10,881
$20,986
$24,307
$7,233
$9,501
$18,172
$26,690
$7,076
$9,908
$16,219
$23,114
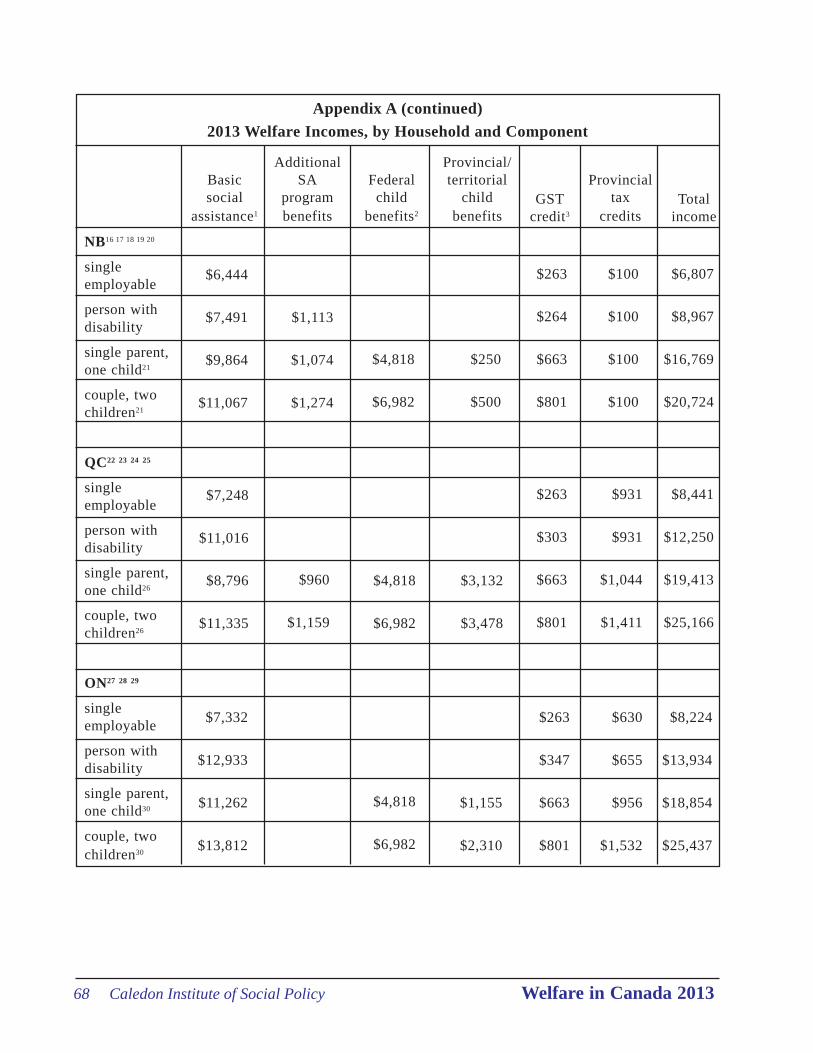
68 Caledon Institute of Social Policy Welfare in Canada 2013
NB16 17 18 19 20
singleemployable
person withdisability
single parent,one child21
couple, twochildren21
QC22 23 24 25
singleemployable
person withdisability
single parent,one child26
couple, twochildren26
ON27 28 29
singleemployable
person withdisability
single parent,one child30
couple, twochildren30
$6,444
$7,491
$9,864
$11,067
$1,113
$1,074
$1,274
$4,818
$6,982
$250
$500
$263
$264
$663
$801
$100
$100
$100
$100
$6,807
$8,967
$16,769
$20,724
Appendix A (continued)2013 Welfare Incomes, by Household and Component
Basicsocial
assistance1
AdditionalSA
programbenefits
Federalchild
benefits2
Provincial/territorial
childbenefits
GSTcredit3
Provincialtax
creditsTotal
income
$7,248
$11,016
$8,796
$11,335
$960
$1,159
$4,818
$6,982
$3,132
$3,478
$263
$303
$663
$801
$931
$931
$1,044
$1,411
$8,441
$12,250
$19,413
$25,166
$7,332
$12,933
$11,262
$13,812
$4,818
$6,982
$1,155
$2,310
$263
$347
$663
$801
$630
$655
$956
$1,532
$8,224
$13,934
$18,854
$25,437
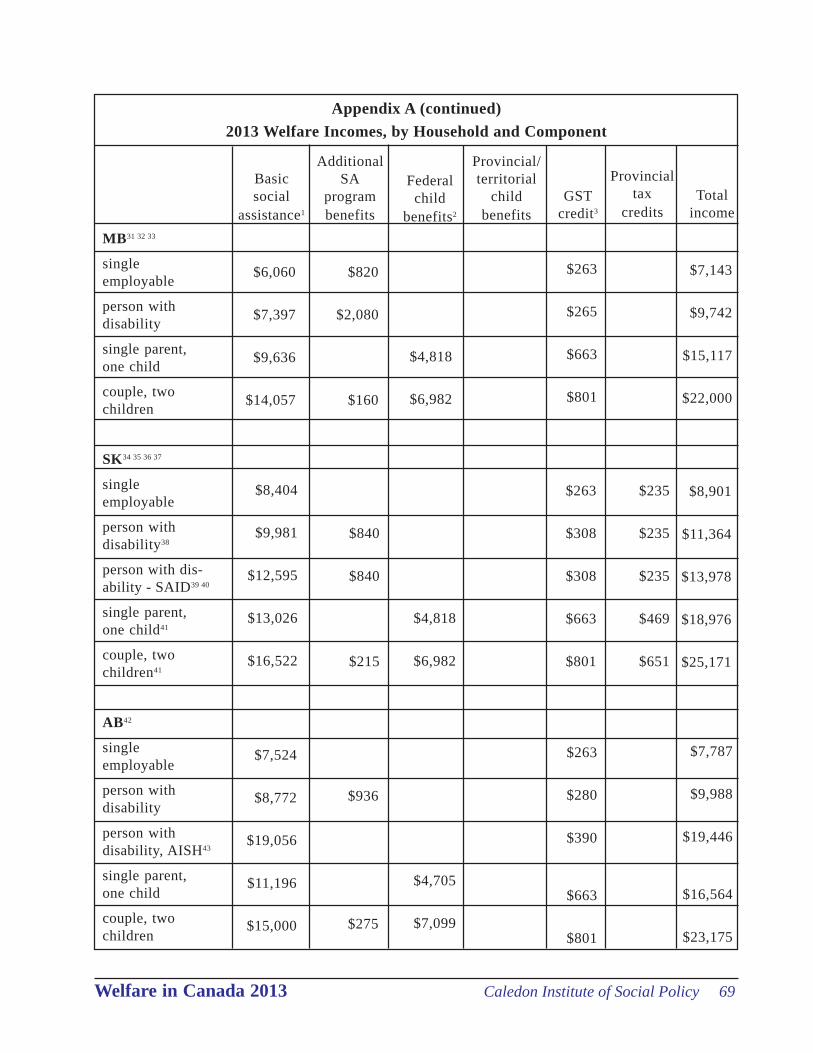
Welfare in Canada 2013 Caledon Institute of Social Policy 69
Basicsocial
assistance1
AdditionalSA
programbenefits
Federalchild
benefits2
Provincial/territorial
childbenefits
GSTcredit3
Provincialtax
creditsTotal
income
Appendix A (continued)2013 Welfare Incomes, by Household and Component
MB31 32 33
singleemployable
person withdisability
single parent,one child
couple, twochildren
SK34 35 36 37
singleemployable
person withdisability38
person with dis-ability - SAID39 40
single parent,one child41
couple, twochildren41
AB42
singleemployable
person withdisability
person withdisability, AISH43
single parent,one child
couple, twochildren
$6,060
$7,397
$9,636
$14,057
$8,404
$9,981
$12,595
$13,026
$16,522
$7,524
$8,772
$19,056
$11,196
$15,000
$936
$275
$4,705
$7,099
$263
$280
$390
$663
$801
$7,787
$9,988
$19,446
$16,564
$23,175
$820
$2,080
$160
$840
$840
$215
$4,818
$6,982
$263
$265
$663
$801
$263
$308
$308
$663
$801
$235
$235
$235
$469
$651
$8,901
$11,364
$13,978
$18,976
$25,171
$7,143
$9,742
$15,117
$22,000
$4,818
$6,982
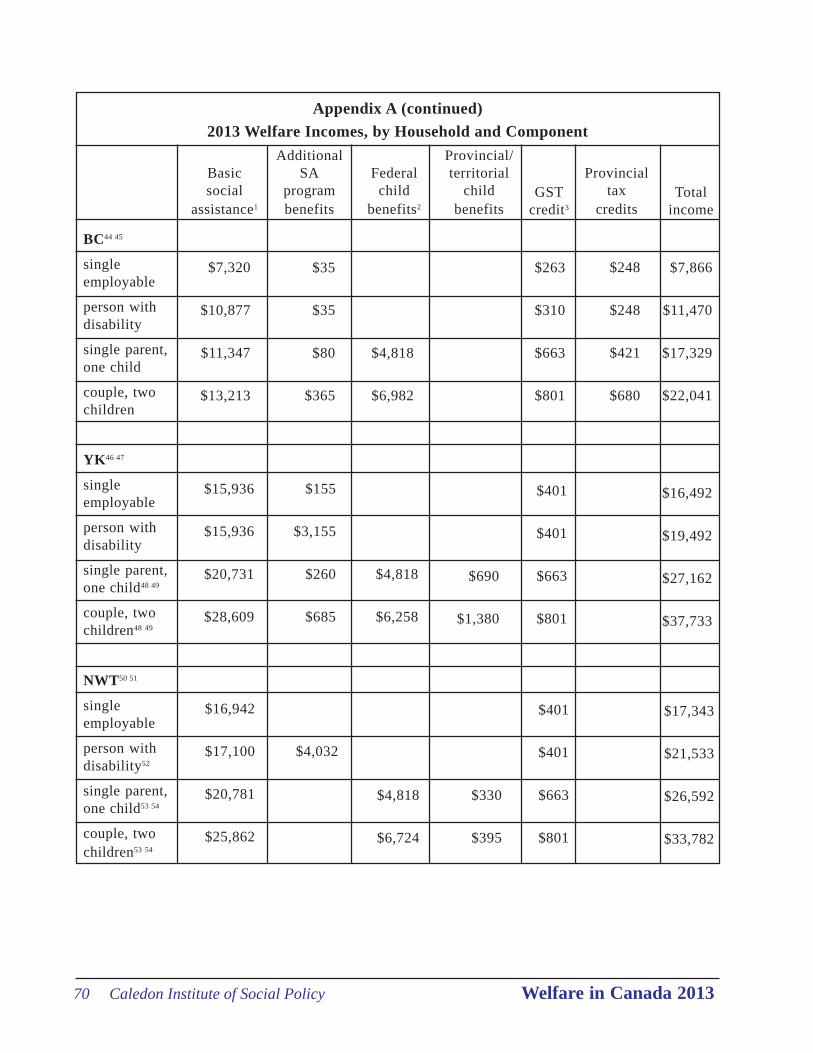
70 Caledon Institute of Social Policy Welfare in Canada 2013
Appendix A (continued)2013 Welfare Incomes, by Household and Component
Basicsocial
assistance1
AdditionalSA
programbenefits
Federalchild
benefits2
Provincial/territorial
childbenefits
GSTcredit3
Provincialtax
creditsTotal
income
BC44 45
singleemployable
person withdisability
single parent,one child
couple, twochildren
YK46 47
singleemployable
person withdisability
single parent,one child48 49
couple, twochildren48 49
NWT50 51
singleemployable
person withdisability52
single parent,one child53 54
couple, twochildren53 54
$7,320
$10,877
$11,347
$13,213
$15,936
$15,936
$20,731
$28,609
$16,942
$17,100
$20,781
$25,862
$35
$35
$80
$365
$155
$3,155
$260
$685
$4,032
$4,818
$6,982
$4,818
$6,258
$4,818
$6,724
$690
$1,380
$330
$395
$263
$310
$663
$801
$401
$401
$663
$801
$401
$401
$663
$801
$7,866
$11,470
$17,329
$22,041
$16,492
$19,492
$27,162
$37,733
$17,343
$21,533
$26,592
$33,782
$248
$248
$421
$680
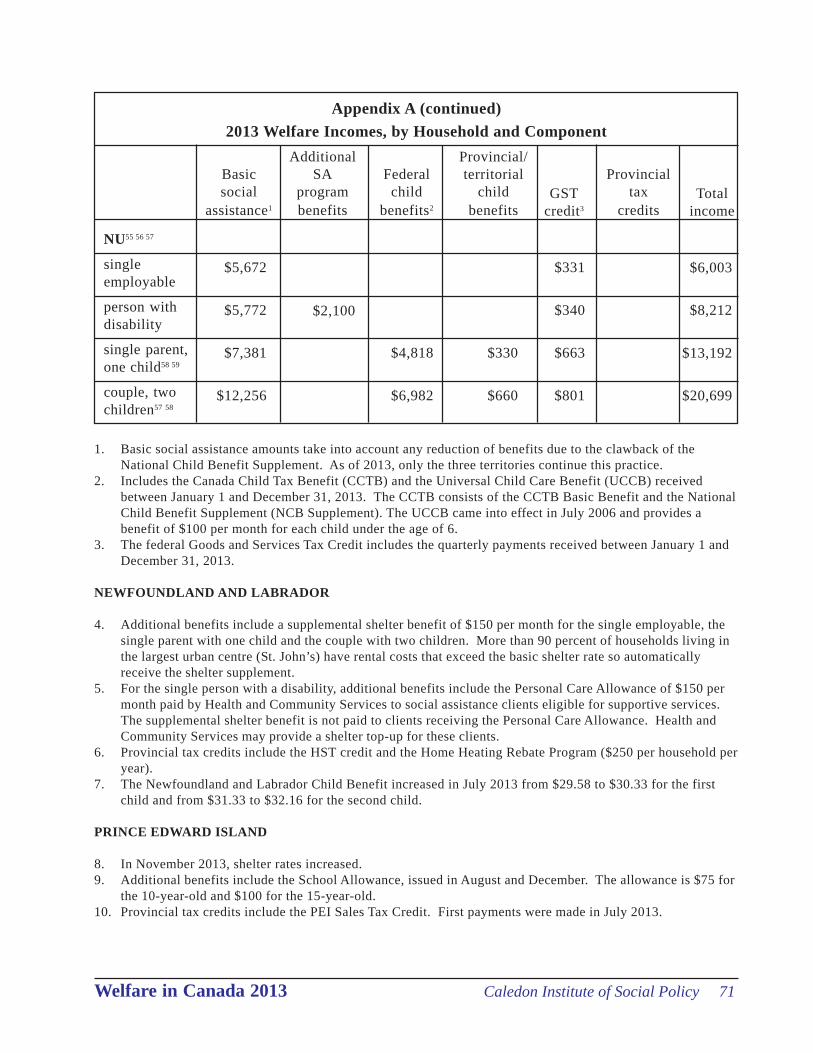
Welfare in Canada 2013 Caledon Institute of Social Policy 71
Appendix A (continued)2013 Welfare Incomes, by Household and Component
Basicsocial
assistance1
AdditionalSA
programbenefits
Federalchild
benefits2
Provincial/territorial
childbenefits
GSTcredit3
Provincialtax
creditsTotal
income
NU55 56 57
singleemployable
person withdisability
single parent,one child58 59
couple, twochildren57 58
$5,672
$5,772
$7,381
$12,256
$2,100
$4,818
$6,982
$330
$660
$331
$340
$663
$801
$6,003
$8,212
$13,192
$20,699
1. Basic social assistance amounts take into account any reduction of benefits due to the clawback of theNational Child Benefit Supplement. As of 2013, only the three territories continue this practice.
2. Includes the Canada Child Tax Benefit (CCTB) and the Universal Child Care Benefit (UCCB) receivedbetween January 1 and December 31, 2013. The CCTB consists of the CCTB Basic Benefit and the NationalChild Benefit Supplement (NCB Supplement). The UCCB came into effect in July 2006 and provides abenefit of $100 per month for each child under the age of 6.
3. The federal Goods and Services Tax Credit includes the quarterly payments received between January 1 andDecember 31, 2013.
NEWFOUNDLAND AND LABRADOR
4. Additional benefits include a supplemental shelter benefit of $150 per month for the single employable, thesingle parent with one child and the couple with two children. More than 90 percent of households living inthe largest urban centre (St. John’s) have rental costs that exceed the basic shelter rate so automaticallyreceive the shelter supplement.
5. For the single person with a disability, additional benefits include the Personal Care Allowance of $150 permonth paid by Health and Community Services to social assistance clients eligible for supportive services.The supplemental shelter benefit is not paid to clients receiving the Personal Care Allowance. Health andCommunity Services may provide a shelter top-up for these clients.
6. Provincial tax credits include the HST credit and the Home Heating Rebate Program ($250 per household peryear).
7. The Newfoundland and Labrador Child Benefit increased in July 2013 from $29.58 to $30.33 for the firstchild and from $31.33 to $32.16 for the second child.
PRINCE EDWARD ISLAND
8. In November 2013, shelter rates increased.9. Additional benefits include the School Allowance, issued in August and December. The allowance is $75 for
the 10-year-old and $100 for the 15-year-old.10. Provincial tax credits include the PEI Sales Tax Credit. First payments were made in July 2013.
72 Caledon Institute of Social Policy Welfare in Canada 2013
11. Most social assistance clients with disabilities receive additional financial support through the DisabilitySupport Program (DSP). Clients who are not eligible for the DSP may receive the Personal Care Allowance($53 per month), the Special Care Allowance ($40 per month) or the Disability Allowance (up to $150 permonth) through the Social Assistance Program. These amounts are not included in the above table.
NOVA SCOTIA
12. In July 2013, personal allowances increased from $238 to $255 per month per adult.13. Additional benefits include the annual School Supplies Supplement of $50 for the 10-year-old and $100 for
the 15-year-old, which is issued in September.14. Provincial tax credits include the Affordable Living Tax Credit.15. The Nova Scotia Child Benefit increase is $52.08 per month for the first child and $68.75 per month for the
second child.
NEW BRUNSWICK
16. All household types receive Transitional Assistance except the single person with a disability, who receivesExtended Benefits.
17. In October 2013, Extended Benefits Program rates increased as well as Transitional Assistance rates for allclients except single employables.
18. Additional benefits include the Income Supplement Benefit for families with children to offset high sheltercosts ($1,074 in 2013), the School Supplement of $100 per child per year and the Disability Supplement. InOctober 2013, the Income Supplement Benefit increased from $70 to $84 monthly for May to October andfrom $100 to $120 monthly for November to April. The Disability Supplement also increased in October2013 from $91.67 to $95.83 per month.
19. New Brunswick’s monthly Fuel Supplement for households heating with electricity is $150 per month.Eligibility is determined on a case-by-case basis. It is paid in addition to basic assistance and is designed tohelp offset high heating costs for clients who pay for heat separately. It may be paid either monthly, fromNovember to April, or as a one-time payment. This is not included in the above table.
20. Provincial tax credits include the Home Energy Assistance Program ($100 per household per year).21. The New Brunswick Child Benefit is $20.83 per child per month.
QUEBEC
22. Rates increased in January 2013 for the Social Assistance Program and the Social Solidarity Program.23. The single person with a disability receives Social Solidarity benefits. The three other household types
receive Social Assistance benefits. The single parent with one child also receives the Temporarily LimitedCapacity for Employment Allowance.
24. Additional benefits include the monthly Shelter Allowance Program benefit of $80 for families with children(administered by the Societé d’habitation du Québec) and an annual school allowance of $76 for the 10-year-old and $123 for the 15-year-old.
25. Provincial tax credits include the Solidarity Tax Credit, implemented in July 2011. It replaced the formerQuebec Sales Tax Credit, the Property Tax Refund and the Credit for Individuals Living in Northern Villages.
26. The Child Assistance rates increased in January 2013. The maximum monthly benefit as of January 1, 2013,for a one-child family is $193.25 and for a two-child family it is $289.83. Single-parent families receive anadditional supplement of $67.75 per month.
ONTARIO
27. Ontario Works Basic Needs Allowance increased in October 2013. OW is paid to the single employableperson, the single parent with one child and the couple with two children.
28. Ontario Disability Support Program Basic Needs Allowance increased in October 2013.
Welfare in Canada 2013 Caledon Institute of Social Policy 73
29. Provincial tax credits include the Trillium Benefit. In July 2012, the Trillium Benefit combined the OntarioSales Tax Credit, the Ontario Energy and Property Tax Credit, and the Northern Energy Tax Credit into asingle benefit that is paid monthly.
30. Maximum Ontario Child Benefit rates increased from $91.66 to $100.83 per month per child in July 2013.
MANITOBA
31. Additional benefits include the Income Assistance for Persons with Disabilities (IAPD) benefit of $105 permonth, the annual school supplies allowance of $60 for the 10-year-old and $100 for the 15-year-old, andRent-Aid.
32. In April 2011, the Manitoba Shelter Benefit was renamed Rent-Aid. It provides a flat-rate, monthly benefitto single persons with disabilities and childless adults on income assistance. In August 2013, Rent-Aidbenefits increased from $60 to $80 per month.
33. The Manitoba Child Benefit Program began in January 2008. It replaced and enhanced the former ChildRelated Income Support Program (CRISP). Maximum monthly benefits are $35 per child. The ManitobaChild Benefit is not paid to Income Assistance families with children.
SASKATCHEWAN
34. Transitional Employment Assistance rates are used for the single employable, the single parent with one childand the couple with two children. Saskatchewan Assistance Plan rates are used for the single employableperson with a disability. Rates paid in Tier A communities are used.
35. In October 2013, the General Living Allowance component of TEA was increased for the single parent withone child and the couple with two children.
36. Saskatchewan pays actual utility costs for SAP clients, flat-rate utility amounts for TEA clients, and eitheractual or flat rates for SAID clients. Province-wide average utility amounts by household type are used forall welfare income tables.
37. Additional benefits include the Disabled Persons Allowance of $50 per month, the Special TransportationAllowance for the Disabled of $20 per month, the annual Education Expenses Allowance of $85 for the 10-year-old and $130 for the 15-year-old and the Disability Income Benefit for SAID clients.
38. Clients with disabilities may also be eligible for the Disability Rental Housing Supplement. The amount paiddepends on family size, family income and the local rental market. If eligible, the supplement has no impacton the client’s shelter benefit.
39. The Saskatchewan Assured Income for Disability (SAID) program, introduced in 2009, is an income supportprogram for people with significant and enduring disabilities. Initially, SAID supported individuals inresidential care with significant and enduring disabilities. In June 2012, it was expanded to include personswith signficant and enduring disabilities living independently. It is a needs-tested program that pays higherbenefits than those under the Saskatchewan Assistance Plan (SAP). Starting this year, SAID benefits arereported in addition to those paid under SAP.
40. SAID clients living in private housing, room and board, or a rooming arrangement also receive a $70Disability Income Benefit. This amount is equivalent to amounts received by individuals with disabilities onSAP through the Disabled Persons Allowance and the Special Transportation Allowance.
41. Families with children may also be eligible for the Family Rental Housing Supplement. The amount paiddepends on family size, family income and the local rental market. If eligible, the supplement has no impacton the client’s shelter benefit.
ALBERTA
42. Additional benefits include $78 per month for Personal Needs for the person with a disability (Alberta Worksonly) and the annual school expense allowance of $100 for the 10-year-old and $175 for the 15-year-old.
43. Alberta has a distinct program for persons with severe and permanent disabilities – the Assured Income forthe Severely Handicapped (AISH) program. The AISH program differs from the other social assistanceprograms referenced in this report in that clients are provided with a flat-rate living allowance benefit which
74 Caledon Institute of Social Policy Welfare in Canada 2013
is not contingent on family size. In addition to the living allowance, AISH may provide a $100 Child Benefitfor each dependent child and Personal Benefits for the client and his or her dependent children to meet one-time or ongoing needs, such as a special diet and child care. (Personal benefits are provided to clients whohave $3,000 or less in non-exempt assets.)
BRITISH COLUMBIA
44. Additional benefits include the annual Christmas Supplement ($35 for singles, $70 for a family with childrenand $10 for each child) and the annual School Start-up Supplement of $100 for the 10-year-old and $175 forthe 15-year-old.
45. Provincial tax credits include the BC HST Credit (final payment made for January to March), the BC SalesTax Credit (for the period April to December) and the Low Income Climate Action Tax Credit.
YUKON
46. All basic rates were increased in November 2013.47. Additional benefits include the annual Christmas Allowance of $30 per person, the Winter Clothing
Allowance ($75 for persons under 14 years and $125 for persons 14 years or over), the annual School SupplyAllowance of $50 for children in grades 1-5 and $65 for those in grades 6-12, and the monthly YukonSupplementary Allowance for persons with disabilities ($250 per month).
48. Yukon reduces social assistance entitlement by the amount of the NCB Supplement received.49. The maximum Yukon Child Benefit is $57.50 per child per month.
NORTHWEST TERRITORIES
50. The Northwest Territories Income Assistance Program generally pays actual costs of shelter, fuel andutilities. Public housing unsubsidized rents have been used for the single parent with one child and the couplewith two children.
51. Additional benefits include the Disability Allowance of $300 per month and the Incidental Allowance forPersons with Disabilities of $36 per month.
52. The rate for a person with a disability may vary, with some receiving room and board rates.53. NWT reduces social assistance entitlement by the amount of the NCB Supplement received.54. The NWT Child Benefit is $27.50 per child per month. It was reduced if 2012 net income was above
$20,921.
NUNAVUT
55. The majority of Income Assistance households in Nunavut reside in public housing. In Iqaluit, 95 percent ofSA clients live in public housing. Earlier editions of this series used the private market rent and utility coststo calculate total welfare incomes. Starting in 2012, the public housing rent is used. This change inapproach better reflects the actual costs paid to Income Assistance households. In the 2012 report, $195 permonth was used for all four households. In 2013, this has been revised to $60 per month based on theassumption the client’s income fell below the estimated $22,000 allowable threshold for 2012. Clients inpublic housing do not pay fuel, water, sewage, garbage and/or municipal needs. Electricity costs are heavilysubsidized. A monthly estimate of $27 for electrical costs is used in the Nunavut data.
56. Additional benefits include the Incidental Allowance of $175 a month.57. All clients other than those eligible for the Incidental Allowance must be in receipt of assistance for two
months before the regular clothing allowance is paid.58. Nunavut reduces social assistance entitlement by the amount of the NCB Supplement received.59. The Nunavut Child Benefit is $27.50 per child per month. It was reduced if 2012 net income was above
$20,921.
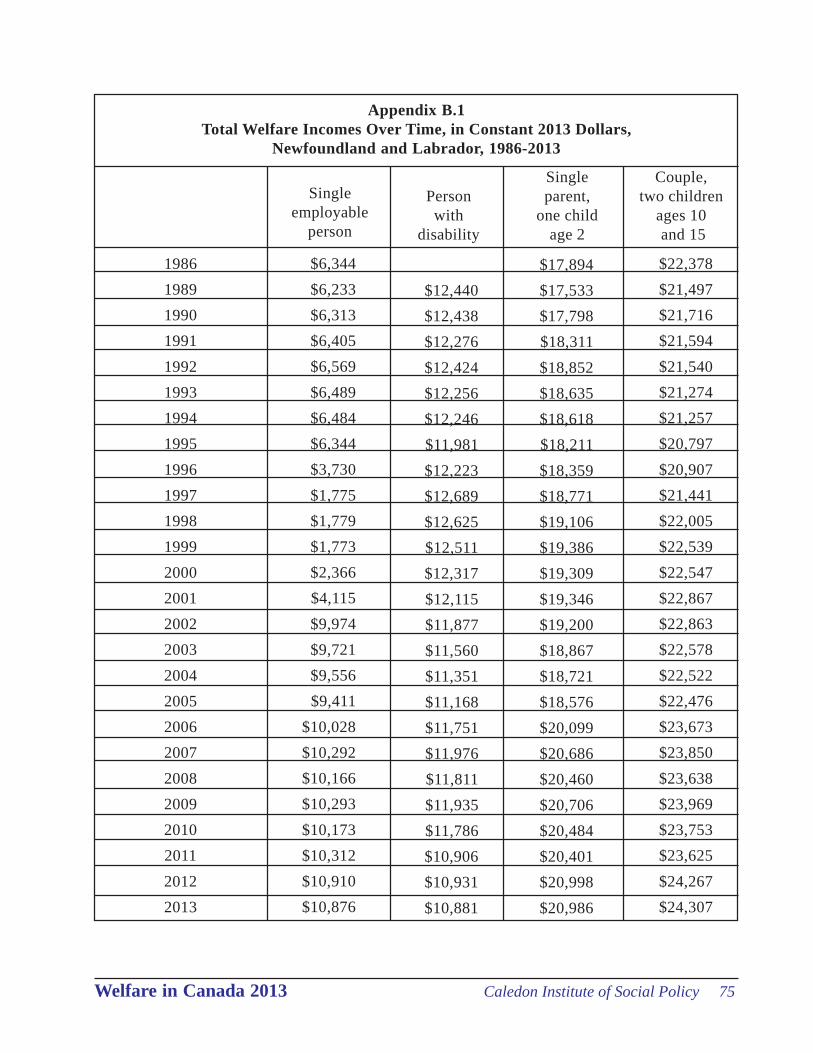
Welfare in Canada 2013 Caledon Institute of Social Policy 75
Appendix B.1Total Welfare Incomes Over Time, in Constant 2013 Dollars,
Newfoundland and Labrador, 1986-2013
Singleemployable
person
19861989199019911992199319941995199619971998199920002001200220032004200520062007200820092010201120122013
$6,344$6,233$6,313$6,405$6,569$6,489$6,484$6,344$3,730$1,775$1,779$1,773$2,366$4,115$9,974$9,721$9,556$9,411
$10,028$10,292$10,166$10,293$10,173$10,312$10,910$10,876
$12,440$12,438$12,276$12,424$12,256$12,246$11,981$12,223$12,689$12,625$12,511$12,317$12,115$11,877$11,560$11,351$11,168$11,751$11,976$11,811$11,935$11,786$10,906$10,931$10,881
$17,894$17,533$17,798$18,311$18,852$18,635$18,618$18,211$18,359$18,771$19,106$19,386$19,309$19,346$19,200$18,867$18,721$18,576$20,099$20,686$20,460$20,706$20,484$20,401$20,998$20,986
$22,378$21,497$21,716$21,594$21,540$21,274$21,257$20,797$20,907$21,441$22,005$22,539$22,547$22,867$22,863$22,578$22,522$22,476$23,673$23,850$23,638$23,969$23,753$23,625$24,267$24,307
Personwith
disability
Singleparent,
one childage 2
Couple,two children
ages 10 and 15
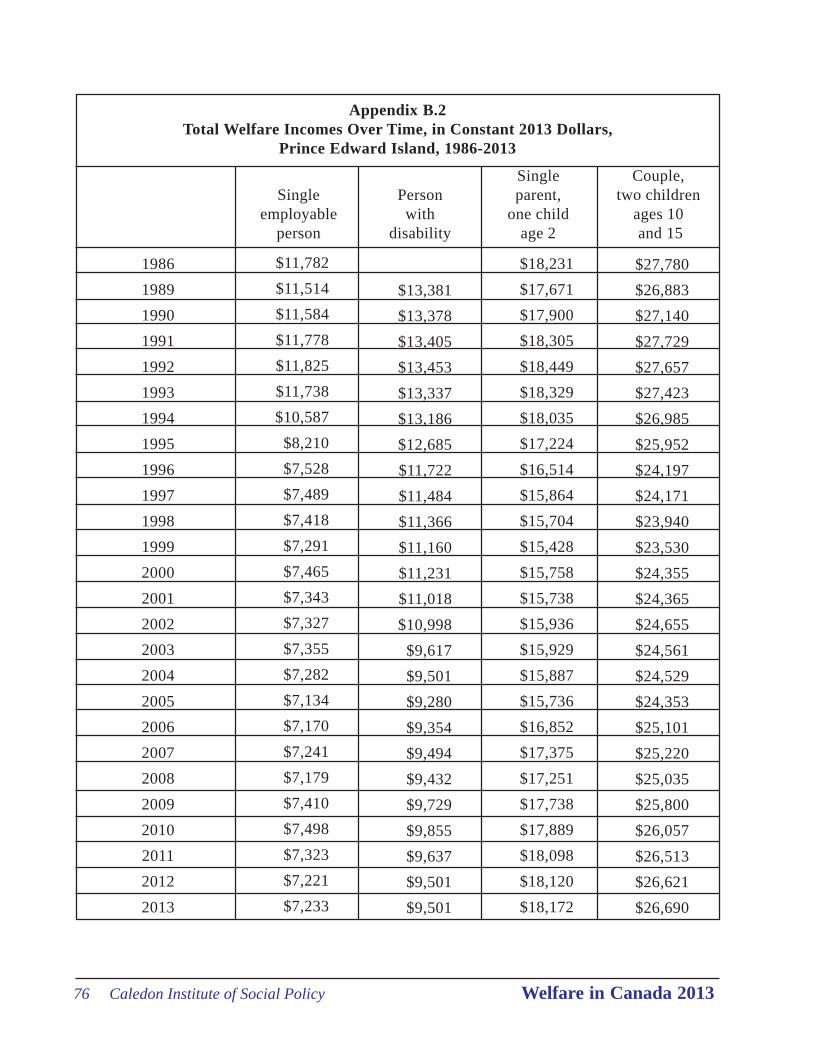
76 Caledon Institute of Social Policy Welfare in Canada 2013
Appendix B.2Total Welfare Incomes Over Time, in Constant 2013 Dollars,
Prince Edward Island, 1986-2013
Singleemployable
person
Personwith
disability
Singleparent,
one childage 2
Couple,two children
ages 10 and 15
19861989199019911992199319941995199619971998199920002001200220032004200520062007200820092010201120122013
$11,782$11,514$11,584$11,778$11,825$11,738$10,587
$8,210$7,528$7,489$7,418$7,291$7,465$7,343$7,327$7,355$7,282$7,134$7,170$7,241$7,179$7,410$7,498$7,323$7,221$7,233
$18,231$17,671$17,900$18,305$18,449$18,329$18,035$17,224$16,514$15,864$15,704$15,428$15,758$15,738$15,936$15,929$15,887$15,736$16,852$17,375$17,251$17,738$17,889$18,098$18,120$18,172
$27,780$26,883$27,140$27,729$27,657$27,423$26,985$25,952$24,197$24,171$23,940$23,530$24,355$24,365$24,655$24,561$24,529$24,353$25,101$25,220$25,035$25,800$26,057$26,513$26,621$26,690
$13,381$13,378$13,405$13,453$13,337$13,186$12,685$11,722$11,484$11,366$11,160$11,231$11,018$10,998
$9,617$9,501$9,280$9,354$9,494$9,432$9,729$9,855$9,637$9,501$9,501
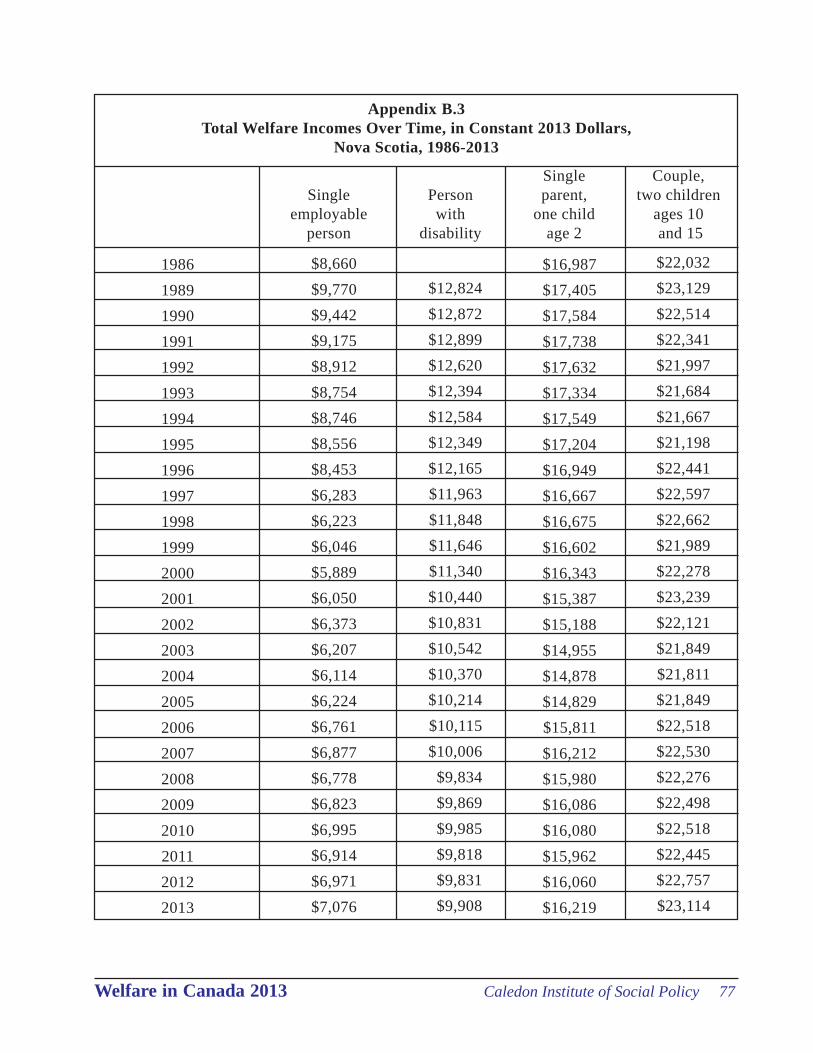
Welfare in Canada 2013 Caledon Institute of Social Policy 77
Appendix B.3Total Welfare Incomes Over Time, in Constant 2013 Dollars,
Nova Scotia, 1986-2013
Singleemployable
person
Personwith
disability
Singleparent,
one childage 2
Couple,two children
ages 10 and 15
19861989199019911992199319941995199619971998199920002001200220032004200520062007200820092010201120122013
$8,660$9,770$9,442$9,175$8,912$8,754$8,746$8,556$8,453$6,283$6,223$6,046$5,889$6,050$6,373$6,207$6,114$6,224$6,761$6,877$6,778$6,823$6,995$6,914$6,971$7,076
$12,824$12,872$12,899$12,620$12,394$12,584$12,349$12,165$11,963$11,848$11,646$11,340$10,440$10,831$10,542$10,370$10,214$10,115$10,006
$9,834$9,869$9,985$9,818$9,831$9,908
$16,987$17,405$17,584$17,738$17,632$17,334$17,549$17,204$16,949$16,667$16,675$16,602$16,343$15,387$15,188$14,955$14,878$14,829$15,811$16,212$15,980$16,086$16,080$15,962$16,060$16,219
$22,032$23,129$22,514$22,341$21,997$21,684$21,667$21,198$22,441$22,597$22,662$21,989$22,278$23,239$22,121$21,849$21,811$21,849$22,518$22,530$22,276$22,498$22,518$22,445$22,757$23,114

78 Caledon Institute of Social Policy Welfare in Canada 2013
Appendix B.4Total Welfare Incomes Over Time, in Constant 2013 Dollars,
New Brunswick, 1986-2013
19861989199019911992199319941995199619971998199920002001200220032004200520062007200820092010201120122013
Singleemployable
person
Personwith
disability
Singleparent,
one childage 2
Couple,two children
ages 10 and 15
$4,268$4,732$4,779$4,869$4,737$4,672$4,705$4,620$4,600$4,572$4,529$4,451$4,337$4,238$4,148$4,042$3,974$3,934$3,927$3,934$3,967$4,048$7,054$6,959$6,862$6,807
$12,213$12,149$12,006$11,902$11,822$9,351$9,308$9,250$9,319$9,277$9,121$9,204$9,302$9,408$9,462$9,296$9,178$9,133$9,111$9,142$9,297$9,138$8,996$8,918$8,967
$14,809$14,476$14,557$14,594$14,556$14,565$15,072$15,634$15,547$15,661$16,036$16,285$16,182$16,188$16,068$15,812$15,705$15,677$16,648$17,011$17,074$17,351$17,109$16,766$16,608$16,769
$17,848$17,021$17,049$17,382$17,445$17,437$17,947$18,585$18,449$18,757$19,482$20,055$20,112$20,355$20,363$20,138$20,103$20,167$20,801$20,752$20,848$21,219$20,961$20,645$20,501$20,724

Welfare in Canada 2013 Caledon Institute of Social Policy 79
Appendix B.5Total Welfare Incomes Over Time, in Constant 2013 Dollars,
Quebec, 1986-2013
Singleemployable
person
Personwith
disability
Singleparent,
one childage 2
Couple,two children
ages 10 and 15
19861989199019911992199319941995199619971998199920002001200220032004200520062007200820092010201120122013
$4,493$5,887$8,420$8,920$9,044$9,063$8,883$8,691$8,561$8,296$8,176$8,227$8,085$8,057$8,171$8,076$8,081$7,975$7,915$7,817$7,686$7,846$7,751$7,741$8,307$8,441
$10,491$10,995$11,495$11,719$11,715$11,912$11,660$11,743$11,708$11,810$11,833$11,697$11,700$11,739$11,608$11,618$11,546$11,595$11,560$11,438$11,675$11,527$11,459$12,065$12,250
$17,037$15,747$16,957$16,009$17,774$18,397$18,767$18,373$17,896$17,206$17,187$17,129$16,667$16,727$16,946$16,815$16,864$17,673$18,616$18,792$18,541$18,867$18,666$18,473$19,167$19,413
$23,836$21,686$21,553$22,539$22,801$23,320$23,077$22,578$22,074$21,064$21,264$21,178$20,959$21,250$21,664$21,586$21,757$23,768$24,371$24,100$23,817$24,265$24,022$23,830$24,810$25,166
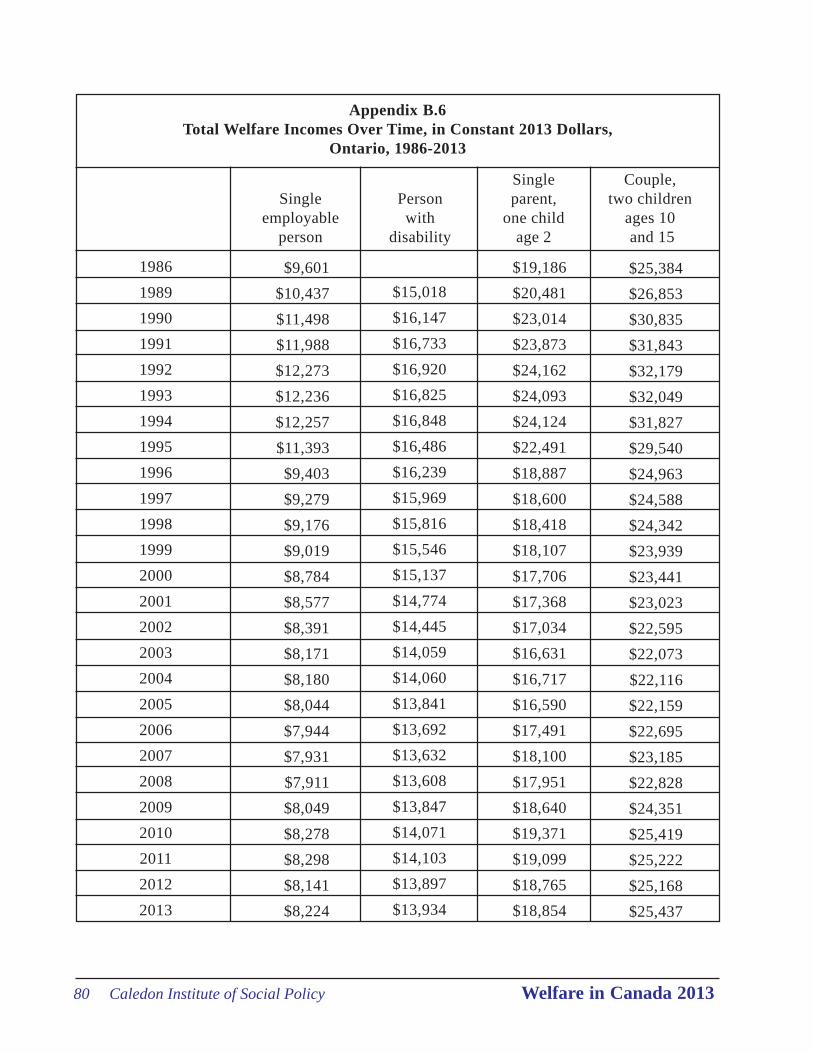
80 Caledon Institute of Social Policy Welfare in Canada 2013
Appendix B.6Total Welfare Incomes Over Time, in Constant 2013 Dollars,
Ontario, 1986-2013
19861989199019911992199319941995199619971998199920002001200220032004200520062007200820092010201120122013
Singleemployable
person
Personwith
disability
Singleparent,
one childage 2
Couple,two children
ages 10 and 15
$9,601$10,437$11,498$11,988$12,273$12,236$12,257$11,393$9,403$9,279$9,176$9,019$8,784$8,577$8,391$8,171$8,180$8,044$7,944$7,931$7,911$8,049$8,278$8,298$8,141$8,224
$15,018$16,147$16,733$16,920$16,825$16,848$16,486$16,239$15,969$15,816$15,546$15,137$14,774$14,445$14,059$14,060$13,841$13,692$13,632$13,608$13,847$14,071$14,103$13,897$13,934
$25,384$26,853$30,835$31,843$32,179$32,049$31,827$29,540$24,963$24,588$24,342$23,939$23,441$23,023$22,595$22,073$22,116$22,159$22,695$23,185$22,828$24,351$25,419$25,222$25,168$25,437
$19,186$20,481$23,014$23,873$24,162$24,093$24,124$22,491$18,887$18,600$18,418$18,107$17,706$17,368$17,034$16,631$16,717$16,590$17,491$18,100$17,951$18,640$19,371$19,099$18,765$18,854
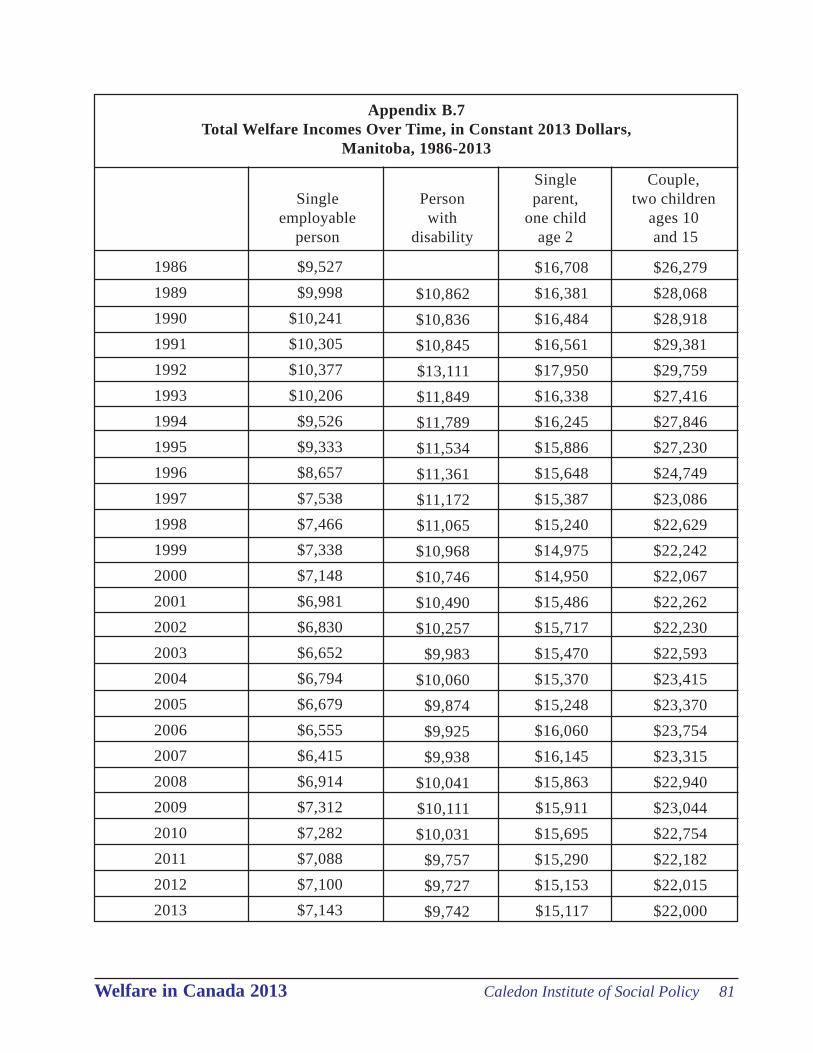
Welfare in Canada 2013 Caledon Institute of Social Policy 81
Appendix B.7Total Welfare Incomes Over Time, in Constant 2013 Dollars,
Manitoba, 1986-2013
Singleemployable
person
Personwith
disability
Singleparent,
one childage 2
Couple,two children
ages 10 and 15
19861989199019911992199319941995199619971998199920002001200220032004200520062007200820092010201120122013
$9,527$9,998
$10,241$10,305$10,377$10,206
$9,526$9,333$8,657$7,538$7,466$7,338$7,148$6,981$6,830$6,652$6,794$6,679$6,555$6,415$6,914$7,312$7,282$7,088$7,100$7,143
$10,862$10,836$10,845$13,111$11,849$11,789$11,534$11,361$11,172$11,065$10,968$10,746$10,490$10,257
$9,983$10,060
$9,874$9,925$9,938
$10,041$10,111$10,031
$9,757$9,727$9,742
$16,708$16,381$16,484$16,561$17,950$16,338$16,245$15,886$15,648$15,387$15,240$14,975$14,950$15,486$15,717$15,470$15,370$15,248$16,060$16,145$15,863$15,911$15,695$15,290$15,153$15,117
$26,279$28,068$28,918$29,381$29,759$27,416$27,846$27,230$24,749$23,086$22,629$22,242$22,067$22,262$22,230$22,593$23,415$23,370$23,754$23,315$22,940$23,044$22,754$22,182$22,015$22,000
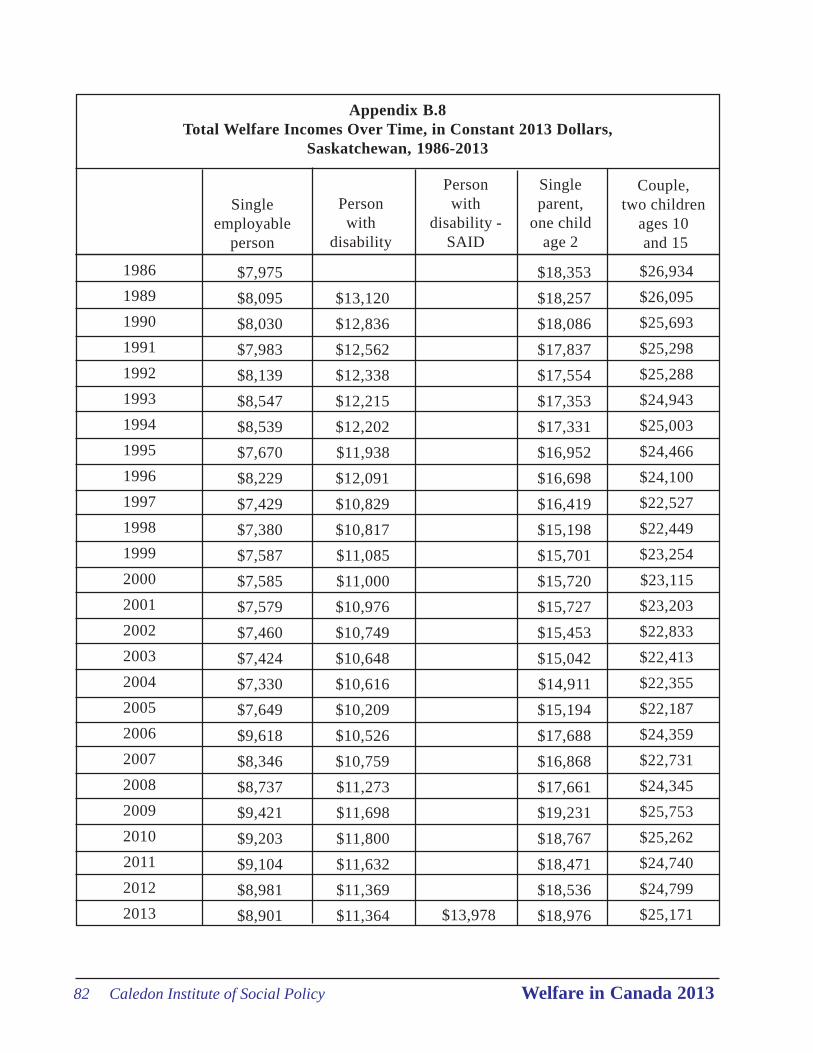
82 Caledon Institute of Social Policy Welfare in Canada 2013
Appendix B.8Total Welfare Incomes Over Time, in Constant 2013 Dollars,
Saskatchewan, 1986-2013
19861989199019911992199319941995199619971998199920002001200220032004200520062007200820092010201120122013
Singleemployable
person
Personwith
disability
Singleparent,
one childage 2
Couple,two children
ages 10 and 15
$7,975$8,095$8,030$7,983$8,139$8,547$8,539$7,670$8,229$7,429$7,380$7,587$7,585$7,579$7,460$7,424$7,330$7,649$9,618$8,346$8,737$9,421$9,203$9,104$8,981$8,901
$13,120$12,836$12,562$12,338$12,215$12,202$11,938$12,091$10,829$10,817$11,085$11,000$10,976$10,749$10,648$10,616$10,209$10,526$10,759$11,273$11,698$11,800$11,632$11,369$11,364
$18,353$18,257$18,086$17,837$17,554$17,353$17,331$16,952$16,698$16,419$15,198$15,701$15,720$15,727$15,453$15,042$14,911$15,194$17,688$16,868$17,661$19,231$18,767$18,471$18,536$18,976
$26,934$26,095$25,693$25,298$25,288$24,943$25,003$24,466$24,100$22,527$22,449$23,254$23,115$23,203$22,833$22,413$22,355$22,187$24,359$22,731$24,345$25,753$25,262$24,740$24,799$25,171
Personwith
disability -SAID
$13,978
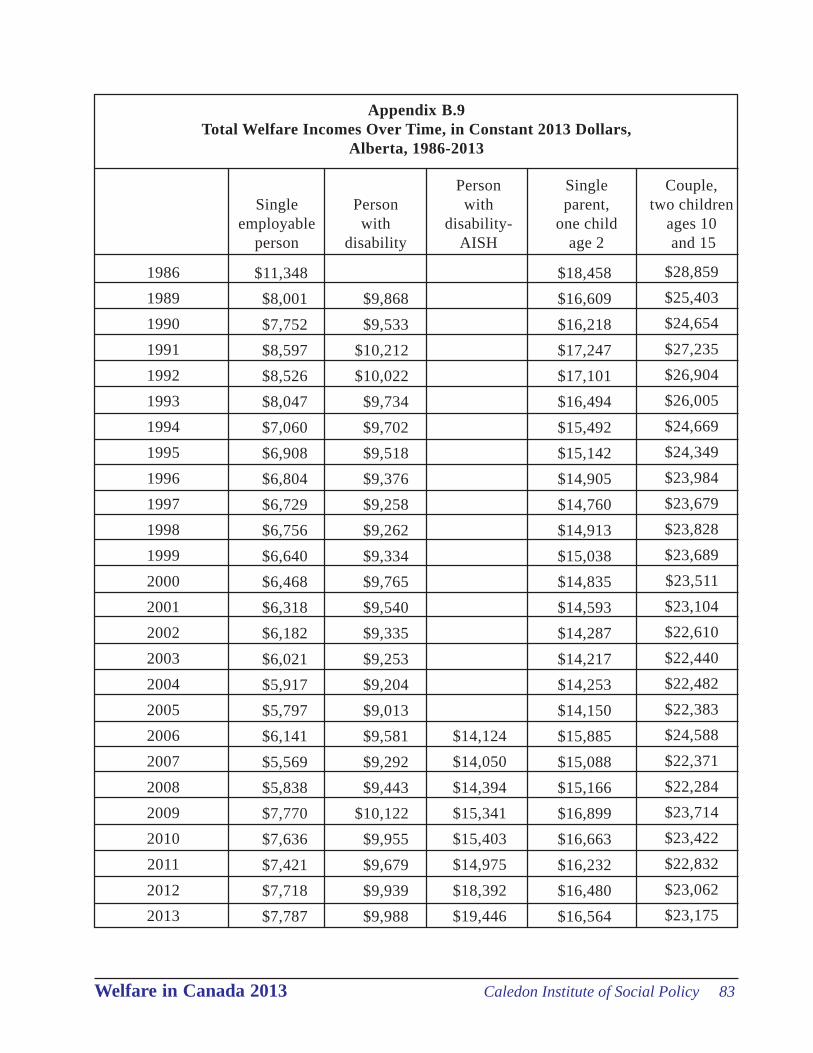
Welfare in Canada 2013 Caledon Institute of Social Policy 83
Appendix B.9Total Welfare Incomes Over Time, in Constant 2013 Dollars,
Alberta, 1986-2013
19861989199019911992199319941995199619971998199920002001200220032004200520062007200820092010201120122013
Singleemployable
person
Personwith
disability
Singleparent,
one childage 2
Couple,two children
ages 10 and 15
$11,348$8,001$7,752$8,597$8,526$8,047$7,060$6,908$6,804$6,729$6,756$6,640$6,468$6,318$6,182$6,021$5,917$5,797$6,141$5,569$5,838$7,770$7,636$7,421$7,718$7,787
$9,868$9,533
$10,212$10,022
$9,734$9,702$9,518$9,376$9,258$9,262$9,334$9,765$9,540$9,335$9,253$9,204$9,013$9,581$9,292$9,443
$10,122$9,955$9,679$9,939$9,988
$18,458$16,609$16,218$17,247$17,101$16,494$15,492$15,142$14,905$14,760$14,913$15,038$14,835$14,593$14,287$14,217$14,253$14,150$15,885$15,088$15,166$16,899$16,663$16,232$16,480$16,564
$28,859$25,403$24,654$27,235$26,904$26,005$24,669$24,349$23,984$23,679$23,828$23,689$23,511$23,104$22,610$22,440$22,482$22,383$24,588$22,371$22,284$23,714$23,422$22,832$23,062$23,175
Personwith
disability-AISH
$14,124$14,050$14,394$15,341$15,403$14,975$18,392$19,446
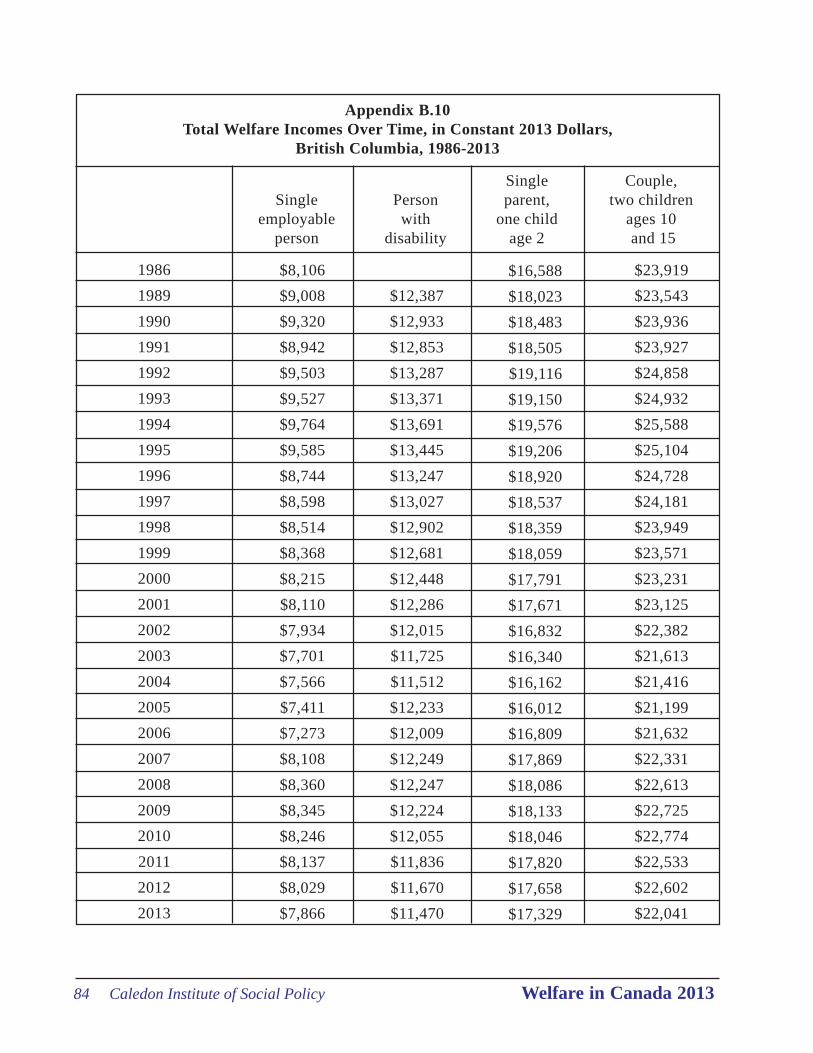
84 Caledon Institute of Social Policy Welfare in Canada 2013
Appendix B.10Total Welfare Incomes Over Time, in Constant 2013 Dollars,
British Columbia, 1986-2013
19861989199019911992199319941995199619971998199920002001200220032004200520062007200820092010201120122013
Singleemployable
person
Personwith
disability
Singleparent,
one childage 2
Couple,two children
ages 10 and 15
$8,106$9,008$9,320$8,942$9,503$9,527$9,764$9,585$8,744$8,598$8,514$8,368$8,215$8,110$7,934$7,701$7,566$7,411$7,273$8,108$8,360$8,345$8,246$8,137$8,029$7,866
$12,387$12,933$12,853$13,287$13,371$13,691$13,445$13,247$13,027$12,902$12,681$12,448$12,286$12,015$11,725$11,512$12,233$12,009$12,249$12,247$12,224$12,055$11,836$11,670$11,470
$23,919$23,543$23,936$23,927$24,858$24,932$25,588$25,104$24,728$24,181$23,949$23,571$23,231$23,125$22,382$21,613$21,416$21,199$21,632$22,331$22,613$22,725$22,774$22,533$22,602$22,041
$16,588$18,023$18,483$18,505$19,116$19,150$19,576$19,206$18,920$18,537$18,359$18,059$17,791$17,671$16,832$16,340$16,162$16,012$16,809$17,869$18,086$18,133$18,046$17,820$17,658$17,329
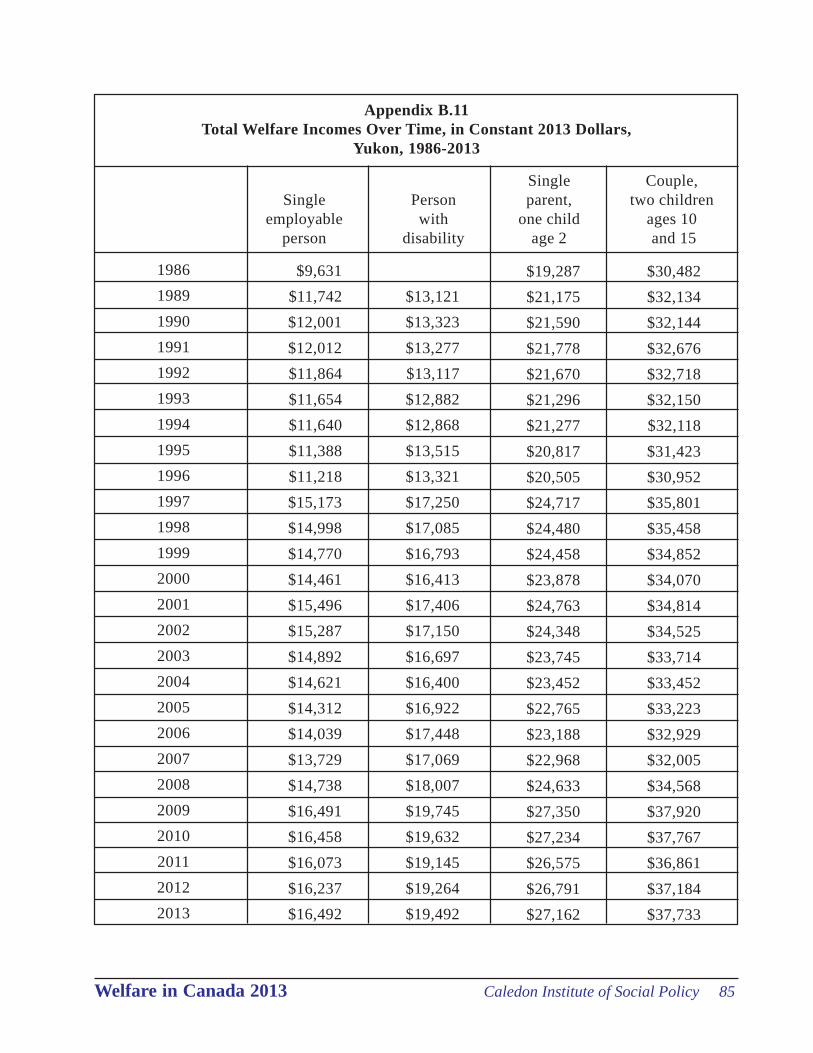
Welfare in Canada 2013 Caledon Institute of Social Policy 85
Appendix B.11Total Welfare Incomes Over Time, in Constant 2013 Dollars,
Yukon, 1986-2013
19861989199019911992199319941995199619971998199920002001200220032004200520062007200820092010201120122013
Singleemployable
person
Personwith
disability
Singleparent,
one childage 2
Couple,two children
ages 10 and 15
$9,631$11,742$12,001$12,012$11,864$11,654$11,640$11,388$11,218$15,173$14,998$14,770$14,461$15,496$15,287$14,892$14,621$14,312$14,039$13,729$14,738$16,491$16,458$16,073$16,237$16,492
$13,121$13,323$13,277$13,117$12,882$12,868$13,515$13,321$17,250$17,085$16,793$16,413$17,406$17,150$16,697$16,400$16,922$17,448$17,069$18,007$19,745$19,632$19,145$19,264$19,492
$19,287$21,175$21,590$21,778$21,670$21,296$21,277$20,817$20,505$24,717$24,480$24,458$23,878$24,763$24,348$23,745$23,452$22,765$23,188$22,968$24,633$27,350$27,234$26,575$26,791$27,162
$30,482$32,134$32,144$32,676$32,718$32,150$32,118$31,423$30,952$35,801$35,458$34,852$34,070$34,814$34,525$33,714$33,452$33,223$32,929$32,005$34,568$37,920$37,767$36,861$37,184$37,733
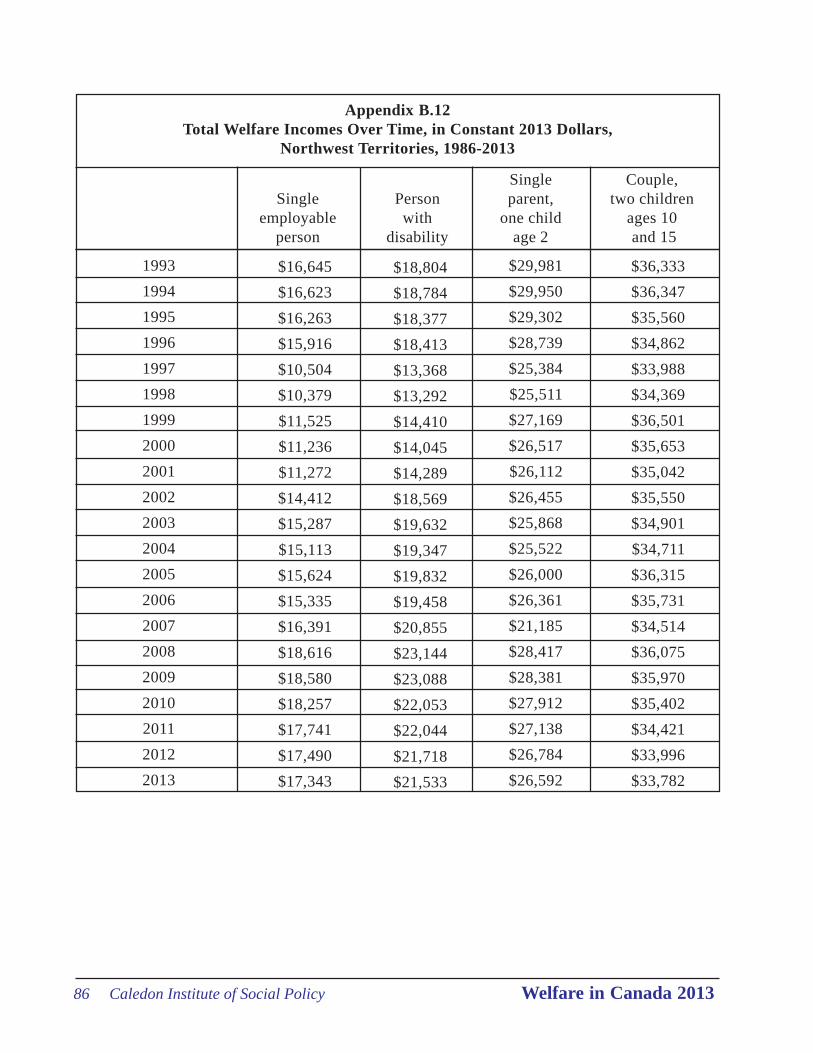
86 Caledon Institute of Social Policy Welfare in Canada 2013
Appendix B.12Total Welfare Incomes Over Time, in Constant 2013 Dollars,
Northwest Territories, 1986-2013
199319941995199619971998199920002001200220032004200520062007200820092010201120122013
Singleemployable
person
Personwith
disability
Singleparent,
one childage 2
Couple,two children
ages 10 and 15
$16,645$16,623$16,263$15,916$10,504$10,379$11,525$11,236$11,272$14,412$15,287$15,113$15,624$15,335$16,391$18,616$18,580$18,257$17,741$17,490$17,343
$18,804$18,784$18,377$18,413$13,368$13,292$14,410$14,045$14,289$18,569$19,632$19,347$19,832$19,458$20,855$23,144$23,088$22,053$22,044$21,718$21,533
$29,981$29,950$29,302$28,739$25,384$25,511$27,169$26,517$26,112$26,455$25,868$25,522$26,000$26,361$21,185$28,417$28,381$27,912$27,138$26,784$26,592
$36,333$36,347$35,560$34,862$33,988$34,369$36,501$35,653$35,042$35,550$34,901$34,711$36,315$35,731$34,514$36,075$35,970$35,402$34,421$33,996$33,782
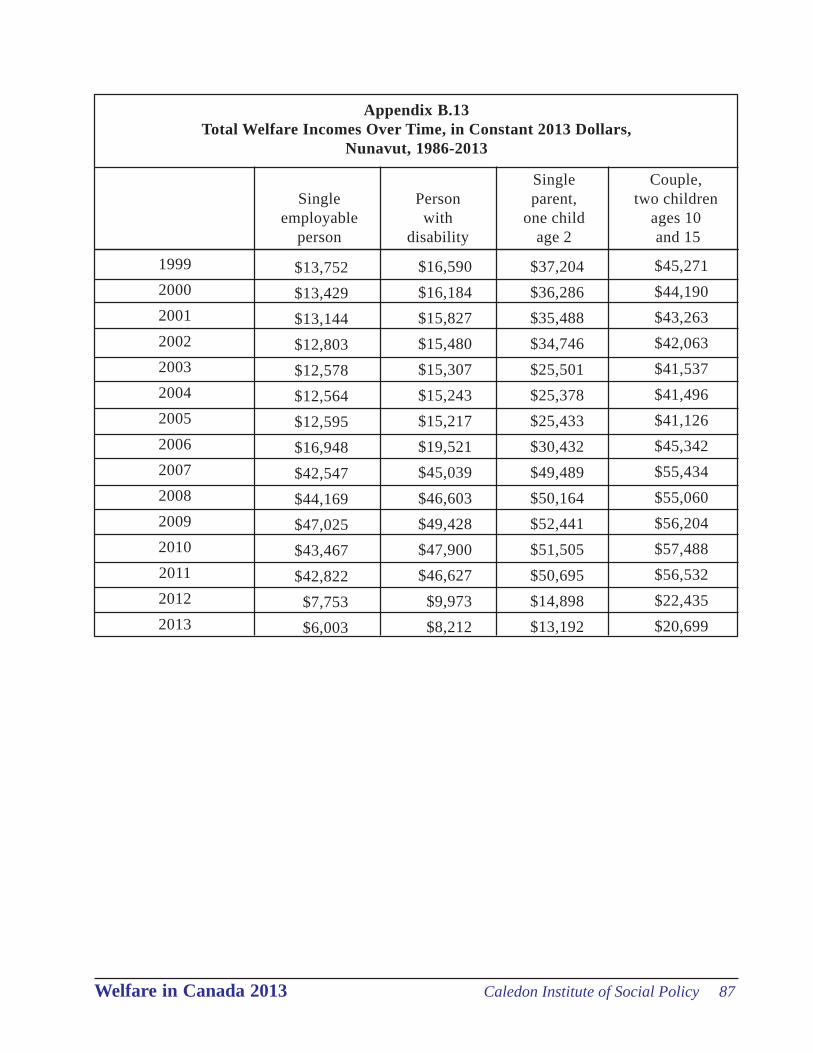
Welfare in Canada 2013 Caledon Institute of Social Policy 87
Appendix B.13Total Welfare Incomes Over Time, in Constant 2013 Dollars,
Nunavut, 1986-2013
199920002001200220032004200520062007200820092010201120122013
Singleemployable
person
Personwith
disability
Singleparent,
one childage 2
Couple,two children
ages 10 and 15
$13,752$13,429$13,144$12,803$12,578$12,564$12,595$16,948$42,547$44,169$47,025$43,467$42,822
$7,753$6,003
$16,590$16,184$15,827$15,480$15,307$15,243$15,217$19,521$45,039$46,603$49,428$47,900$46,627
$9,973$8,212
$37,204$36,286$35,488$34,746$25,501$25,378$25,433$30,432$49,489$50,164$52,441$51,505$50,695$14,898$13,192
$45,271$44,190$43,263$42,063$41,537$41,496$41,126$45,342$55,434$55,060$56,204$57,488$56,532$22,435$20,699