welcome to today’s offee reak presented by the applied ... · 17. i mentioned the key...
TRANSCRIPT
MODERATOR:
Welcome to today’s Coffee Break presented by the Applied Research and Evaluation Branch in the Division for Heart Disease and Stroke Prevention at the Centers for Disease Control and Prevention.
We are fortunate to have Lauren Taylor and Jack Chapel as today’s presenters. They are both ORISE Fellows on the Applied Research and Translation team and the Evaluation and Program Effectiveness Team .
My name is [ADD] and I am today’s moderator. I am a [Title] on the [Team/Branch] .
1
MODERATOR:
Before we begin we have a few housekeeping items.
All participants have been muted. However, to improve audio quality please mute your phones and microphones.
If you are having issues with audio or seeing the presentation, please message us using the chat box or send us an email at [email protected]
If you have questions during the presentation, please enter it on the chat box on your screen. We will address your questions at the end of the session.
Since this is a training series on applied research and evaluation, we do hope you will complete the poll and provide us with your feedback.
2
MODERATOR:
The information presented here is for training purposes and reflects the views of the presenters. It does not necessarily represent the official position of the Centers for Disease Control and Prevention (CDC).
Additionally, throughout the course of this presentation the presenters offer examples and resources that are in no way affiliated with the CDC. Please note that this presentation does not constitute as an endorsement of any organization, program, or product by CDC or the federal government, and none should be inferred.
So, without further delay. Let’s get started. Jack the floor is yours.
3
Thanks Aunima, and thank you everyone for joining today’s webinar. It is often a challenge to distill complex public health content into easily digestible portions that are concise, retain quality, and yet are still appealing to the intended audience.
In today’s presentation, we will explore how products could be designed in a visually engaging way through use of various tools such as colors and iconography. We’ll walk through some real world examples of these tools put into action, and add our personal insight for some key considerations for utilizing such tools. The goal of this session is to provide attendees with the resources and understanding they need to get started creating products that will capture audiences’ eyes and relay complex content in a more simplistic and engaging way.
4
Before we get started, I just want to quickly outline the structure of the presentation going forward. We’ll be discussing 5 tools, and for each, we’ll walk through some examples, discuss some key considerations for use, and provide some helpful resources that you can use in your own work.
We’ll wrap up with the key take-aways for the presentation, and then leave some time for questions at the end.
5
So with that lets get started. First, we’ll talk about photos.
6

Photos are a useful and easy tool to incorporate into your products to help break updense bodies of text and add visual interest to the page. Adding a photo to a text-heavy page can give the reader’s eye a quick break and make the text more manageable to digest.
Further, photos can help add emotion and convey the meaning and feel of the content that is being presented.
7

Here we have an example of the set of photos that we used in DHDSP’s recently published Best Practices Guide for Cardiovascular Disease Prevention Programs.
You can see that although the subjects of the photos differ, they all have a similar style and feel. We chose photos that all had warm lighting, with a more natural feel. The photos of people appear candid with relaxed smiles, as opposed to appearing posed.
8
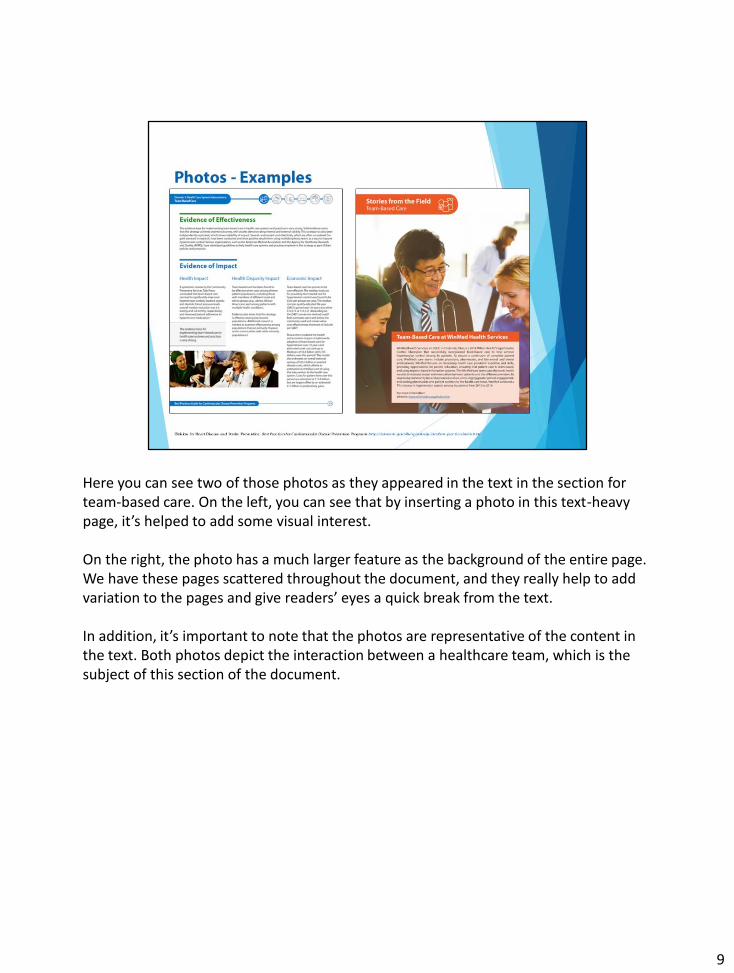
Here you can see two of those photos as they appeared in the text in the section for team-based care. On the left, you can see that by inserting a photo in this text-heavy page, it’s helped to add some visual interest.
On the right, the photo has a much larger feature as the background of the entire page. We have these pages scattered throughout the document, and they really help to add variation to the pages and give readers’ eyes a quick break from the text.
In addition, it’s important to note that the photos are representative of the content in the text. Both photos depict the interaction between a healthcare team, which is the subject of this section of the document.
9

Here we have another example of a set of photos which shows how photos can be used in a collage format as a cover page for a product.
Again, you can see that the photos all have a similar feel and work very well together as a set.
10
There are a number of important considerations to keep in mind when using photos. First, as I’ve mentioned, they need to have a similar feel and style throughout the document to keep a cohesive look.
Second, photos should depict something that aligns with the information that is being presented in the text. If a photo depicts something unrelated to the subject matter, it’s likely to distract the reader and add confusion.
Similarly, it’s important to consider whether the people in the photos are appropriately diverse and inclusive to be representative of the broader population being addressed in the product or it’s target audience.
11

There are a number of stock photo websites that can be used to search for photos, such as Getty images or think stock. However, these stock photos are not always free to use and may need to be purchased, though many can be found at reasonable prices.
But there are many free to use photos that you can find as well. One resource is the Wikimedia Commons, which is an online repository of free to use media files, including images. Note that you should check the licensing information for the image found here, which can be found when you click on an image in the website. Although the images are free to use, there could be restrictions on modifying the image and some require you give attribution when using the image.
Another way to find free photos is through google image search. In google image search under tools, click on Usage rights and select one of the filters. “Labeled for reuse” means you can use the image as it is, without any modifications. “Labeled for reuse with modification” means you can use the image and modify it as you wish. It’s still a good idea to look for the licensing information for photos found here to check if you need to give attribution.
12

Our next tool to discuss is the use of color.
13
Colors can of course make products appear much more visually appealing than a black and white document. They can also help convey meaning, for example through the use of highlighting text or by using a different color to distinguish different sections of a document. Further, they can tie products together by using a similar color theme throughout the product, or across a line of products.
14

Here are a few examples of the color schemes that have been used in our products. Color schemes can include a number of different colors, but they should all work well together. For example, the two color schemes on the left both have essentially the same color groups of blue green red and yellow, but the one on the top has more vibrant bright versions of those colors, whereas the one on the bottom is a little bit darker and more muted. That’s not to say that one is better than the other; they both work well together in their groups, but might clash if the two groups were mixed together.
It also can be helpful to distinguish which colors should be used as the primary colors and which ones are secondary. The primary colors would be the main colors that are used most often throughout the document, whereas secondary colors can be used as highlights or to break out an unrelated side text box, or otherwise used when additional colors are needed.
15
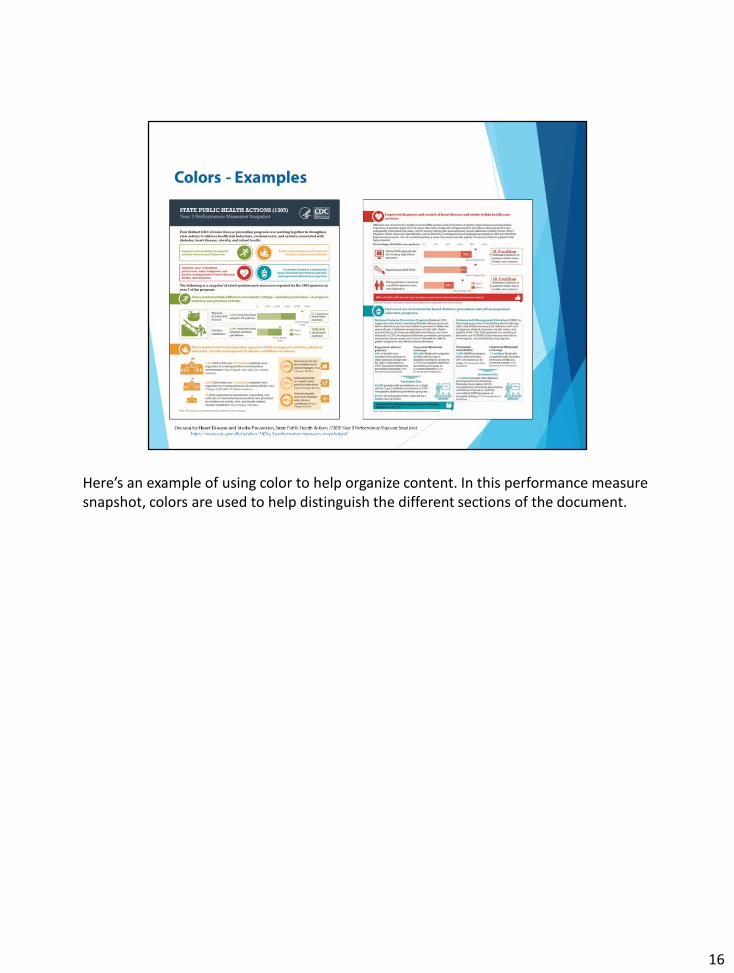
Here’s an example of using color to help organize content. In this performance measure snapshot, colors are used to help distinguish the different sections of the document.
16

Colors can also be combined with photos. Overlaying a color on a photo like this can help make it match the theme and feel of your product, and it can provide a nice background for text to still be legible over.
17
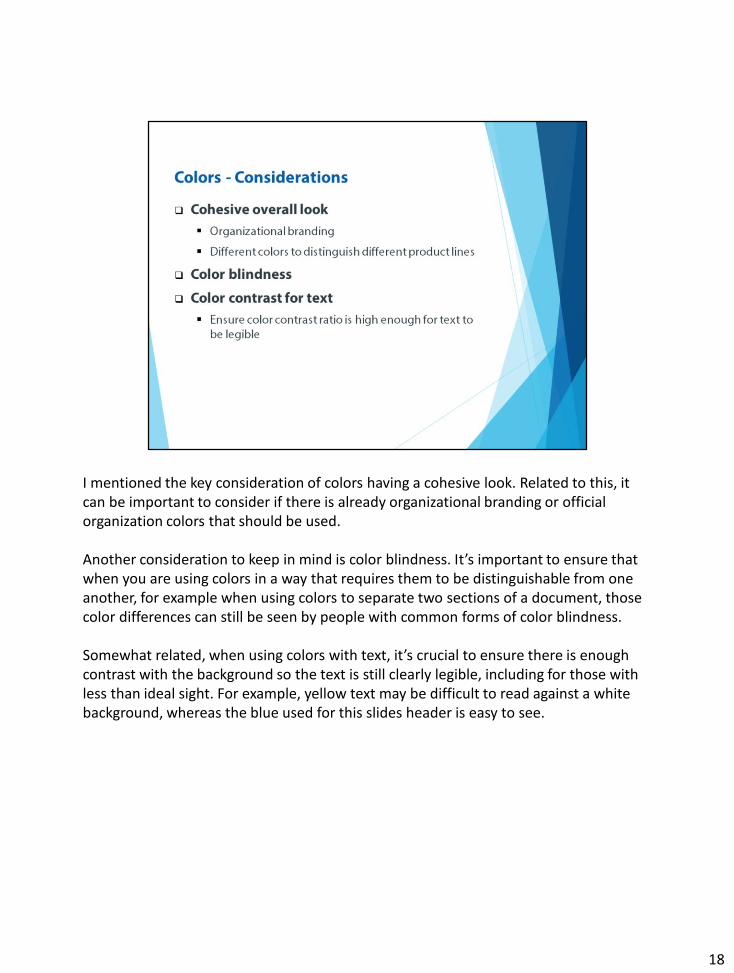
I mentioned the key consideration of colors having a cohesive look. Related to this, it can be important to consider if there is already organizational branding or official organization colors that should be used.
Another consideration to keep in mind is color blindness. It’s important to ensure that when you are using colors in a way that requires them to be distinguishable from one another, for example when using colors to separate two sections of a document, those color differences can still be seen by people with common forms of color blindness.
Somewhat related, when using colors with text, it’s crucial to ensure there is enough contrast with the background so the text is still clearly legible, including for those with less than ideal sight. For example, yellow text may be difficult to read against a white background, whereas the blue used for this slides header is easy to see.
18

One great resource for picking colors are color scheme generators. Color scheme generators help you play around with different colors and can generate sets of colors that are guaranteed to look good together, rather than trying to rely just on your naked eye. In this example shown, I’ve selected a blue color that I know I like and want to use as one of my primary colors. Then, the color scheme generator identified some others to add to the theme. In this case, I selected that I want the color theme to include a triad of colors across the color wheel, and the generator has provided greens and orange that look good along with the blue I initially chose.
With this I will pass it off to Lauren to cover the remaining tools.
19

There are a number of different color scheme generator websites you can use. I’d recommend Coolors.co if this is new to you.
And color contrast checker websites will allow you to enter the colors you want to use for text and background, and will tell you what the color contrast ratio is and what levels of 508 compliance those ratios would meet.
20
Thanks Jack! Moving on, our next tool to discuss is the use of varied text orientation.
21
This tool provides a nice way to break up text through using columns and call-out boxes. Overall, designers can use this tool to give content a different look and feel for the reader at various points throughout the product.
22
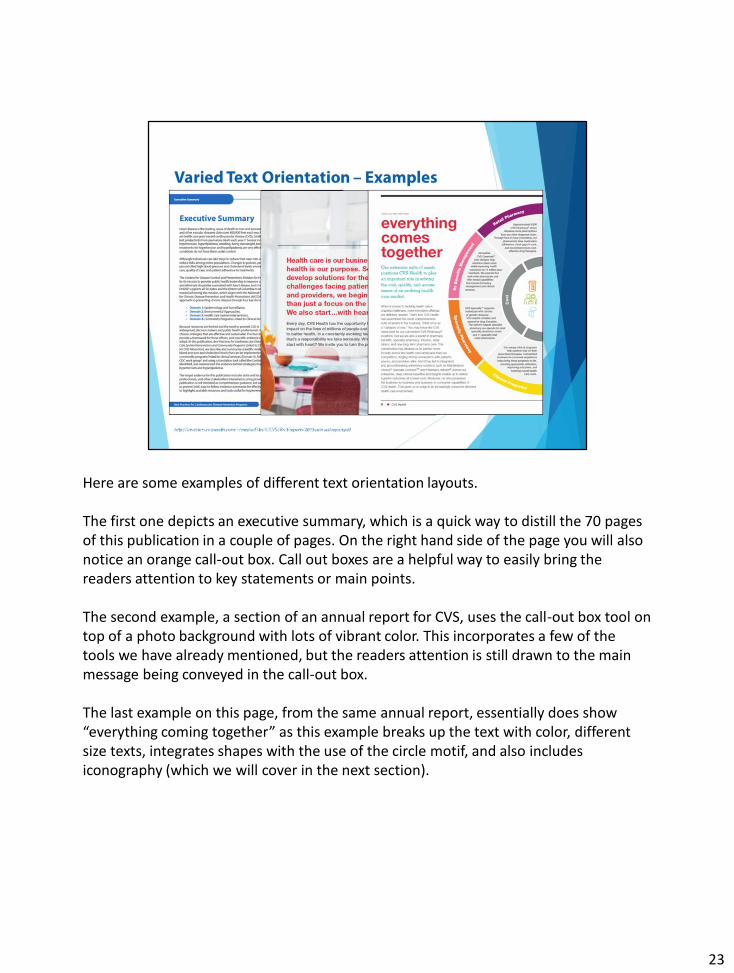
Here are some examples of different text orientation layouts.
The first one depicts an executive summary, which is a quick way to distill the 70 pages of this publication in a couple of pages. On the right hand side of the page you will also notice an orange call-out box. Call out boxes are a helpful way to easily bring the readers attention to key statements or main points.
The second example, a section of an annual report for CVS, uses the call-out box tool on top of a photo background with lots of vibrant color. This incorporates a few of the tools we have already mentioned, but the readers attention is still drawn to the main message being conveyed in the call-out box.
The last example on this page, from the same annual report, essentially does show “everything coming together” as this example breaks up the text with color, different size texts, integrates shapes with the use of the circle motif, and also includes iconography (which we will cover in the next section).
23
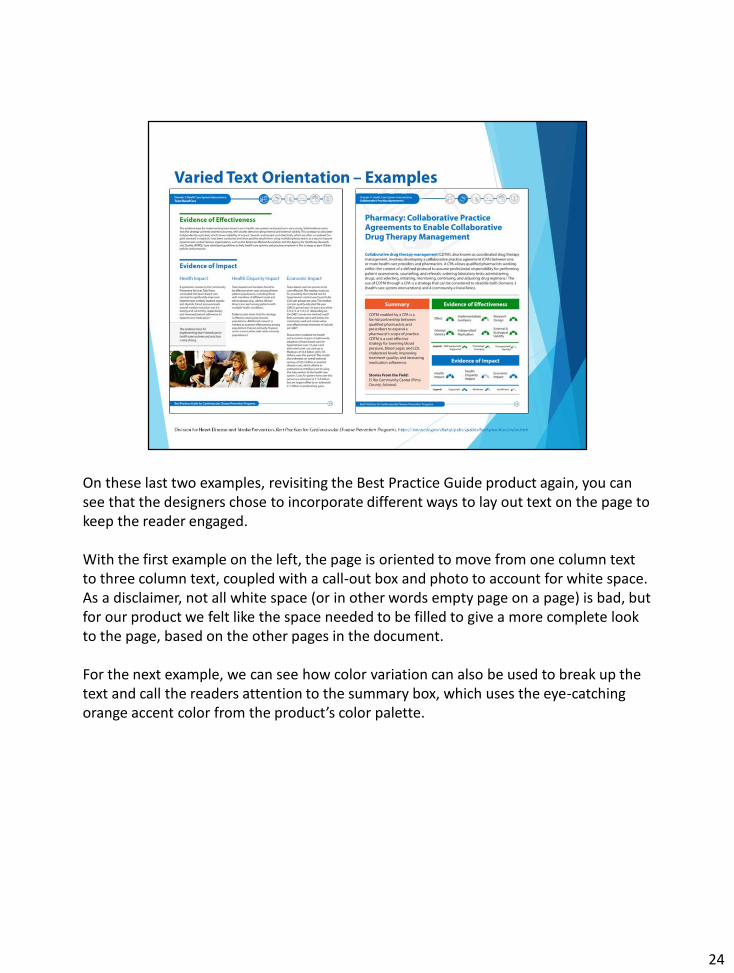
On these last two examples, revisiting the Best Practice Guide product again, you can see that the designers chose to incorporate different ways to lay out text on the page to keep the reader engaged.
With the first example on the left, the page is oriented to move from one column text to three column text, coupled with a call-out box and photo to account for white space. As a disclaimer, not all white space (or in other words empty page on a page) is bad, but for our product we felt like the space needed to be filled to give a more complete look to the page, based on the other pages in the document.
For the next example, we can see how color variation can also be used to break up the text and call the readers attention to the summary box, which uses the eye-catching orange accent color from the product’s color palette.
24
Some considerations for varied text orientation include:
Sometimes less is more; sometimes it’s not. In some instances using color, photos, call-out boxes, and iconography all one page can work together seamlessly, and sometimes it doesn’t. Consider the look and feel of the entire product being sure to not overwhelm the reader with too much activity. It might be better to space out your tool usage throughout the product if needed.
How do you feel when you view the text? Chances are if you use some varied text orientation, take some time away, come back, and YOU feel overwhelmed looking at it, you’re reader might as well. So take small breaks and come back to work as needed.
Field testing is important. Often times when we were still drafting the rough concept drafts for the BPG we would field test it with other members of our team. You can also do field testing with the partners and stakeholders the product was created with or for, so that you can integrate direct user insight during your concept planning stage. Ultimately, getting perspectives from people outside of yourself and your immediate design team gives you helpful insight you might not have gotten otherwise.
25

The next tool we are covering is Iconography.
26

This tool can provide a quick way to visually communicate a lot of complex information while also orienting the reader to the content. Or it can provide guidance through a content heavy product in a more simplistic fashion. Additionally, icons add visual interest and can appeal to various audiences.
27
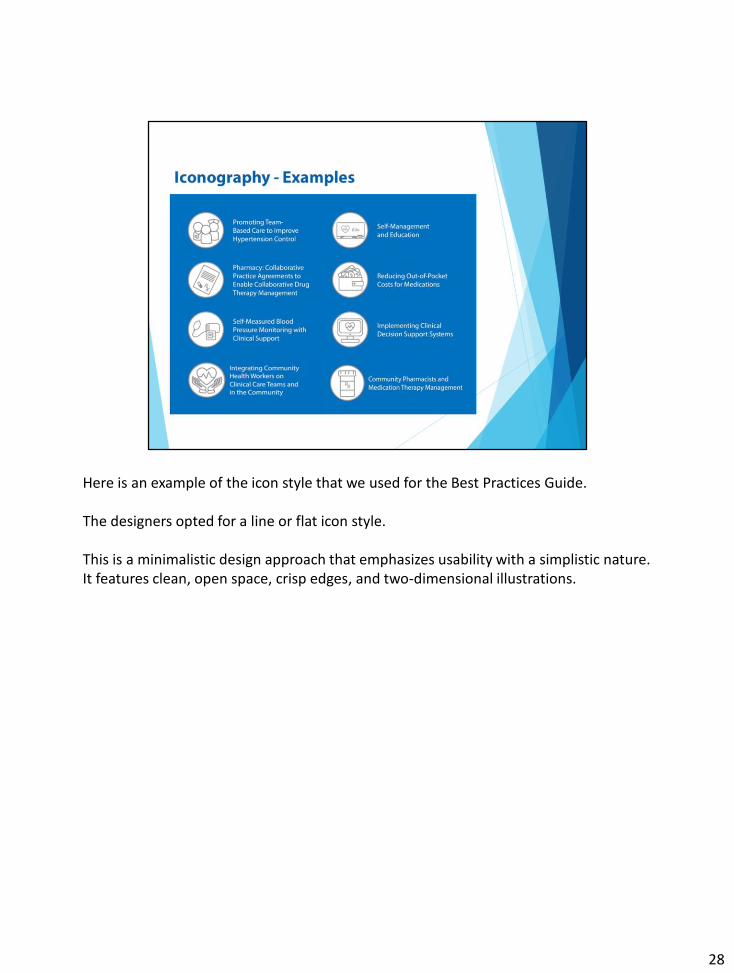
Here is an example of the icon style that we used for the Best Practices Guide.
The designers opted for a line or flat icon style.
This is a minimalistic design approach that emphasizes usability with a simplistic nature. It features clean, open space, crisp edges, and two-dimensional illustrations.
28
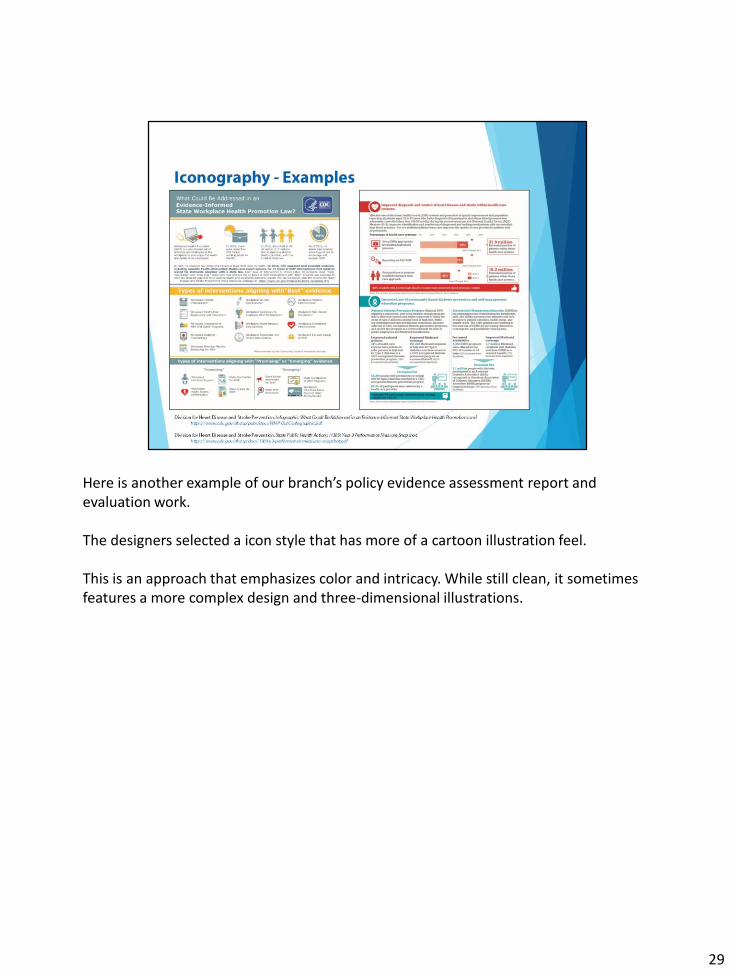
Here is another example of our branch’s policy evidence assessment report and evaluation work.
The designers selected a icon style that has more of a cartoon illustration feel.
This is an approach that emphasizes color and intricacy. While still clean, it sometimes features a more complex design and three-dimensional illustrations.
29
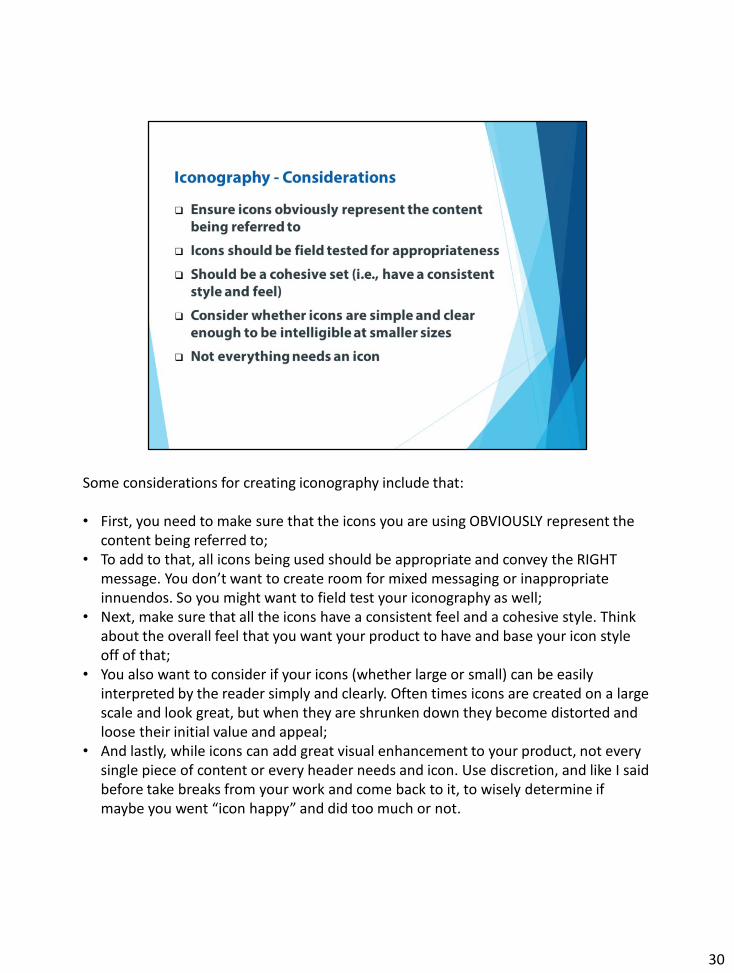
Some considerations for creating iconography include that:
• First, you need to make sure that the icons you are using OBVIOUSLY represent the content being referred to;
• To add to that, all icons being used should be appropriate and convey the RIGHT message. You don’t want to create room for mixed messaging or inappropriate innuendos. So you might want to field test your iconography as well;
• Next, make sure that all the icons have a consistent feel and a cohesive style. Think about the overall feel that you want your product to have and base your icon style off of that;
• You also want to consider if your icons (whether large or small) can be easily interpreted by the reader simply and clearly. Often times icons are created on a large scale and look great, but when they are shrunken down they become distorted and loose their initial value and appeal;
• And lastly, while icons can add great visual enhancement to your product, not every single piece of content or every header needs and icon. Use discretion, and like I said before take breaks from your work and come back to it, to wisely determine if maybe you went “icon happy” and did too much or not.
30
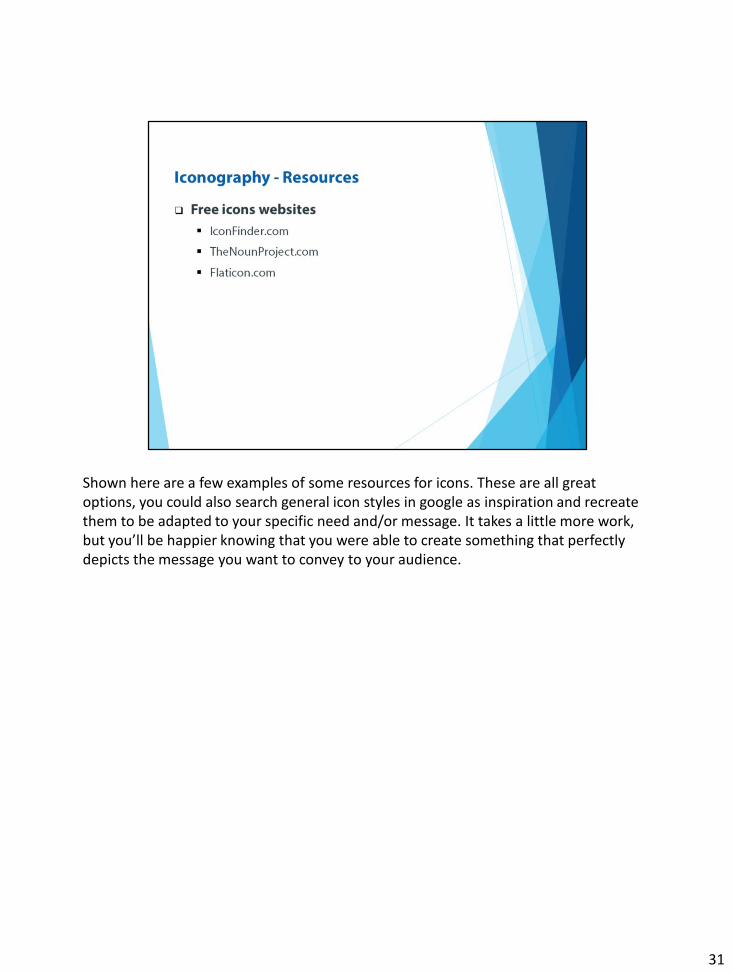
Shown here are a few examples of some resources for icons. These are all great options, you could also search general icon styles in google as inspiration and recreate them to be adapted to your specific need and/or message. It takes a little more work, but you’ll be happier knowing that you were able to create something that perfectly depicts the message you want to convey to your audience.
31

The last tool we will be covering is infographics.
32
While similar to iconography and often used interchangeably, infographics incorporateiconography and color into their layout, typically to tell more of a story (inclusive of the key messages and the purpose of the product) to the audience viewing it.
33
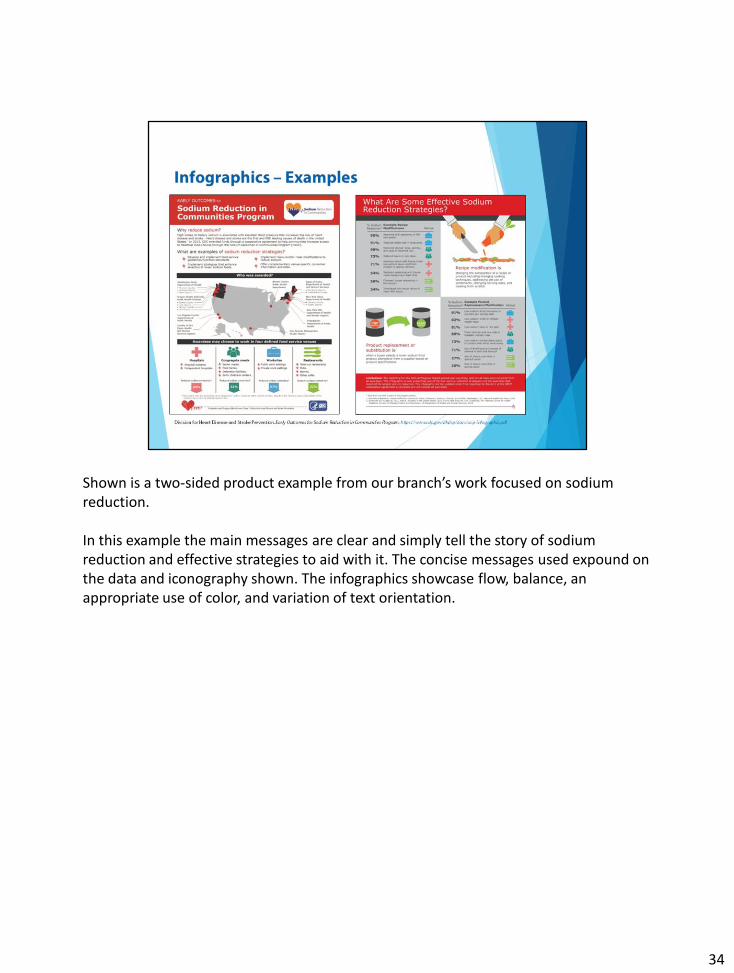
Shown is a two-sided product example from our branch’s work focused on sodium reduction.
In this example the main messages are clear and simply tell the story of sodium reduction and effective strategies to aid with it. The concise messages used expound on the data and iconography shown. The infographics showcase flow, balance, an appropriate use of color, and variation of text orientation.
34
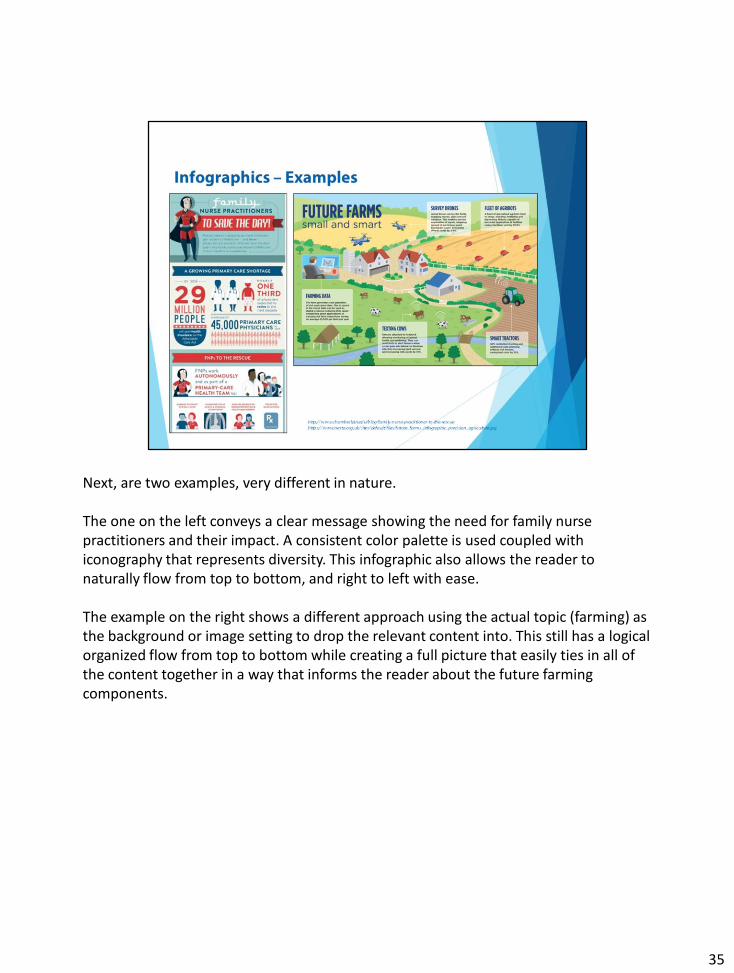
Next, are two examples, very different in nature.
The one on the left conveys a clear message showing the need for family nurse practitioners and their impact. A consistent color palette is used coupled with iconography that represents diversity. This infographic also allows the reader to naturally flow from top to bottom, and right to left with ease.
The example on the right shows a different approach using the actual topic (farming) as the background or image setting to drop the relevant content into. This still has a logical organized flow from top to bottom while creating a full picture that easily ties in all of the content together in a way that informs the reader about the future farming components.
35
Some considerations for using infographics include that:
Whatever title you use should draw the reader in. The Family Nurse Practitioner infographic did a good job of doing that. If possible (since we know that workplace constraints do exist) use titles that are engaging but still relevant to the content. Also make sure that header and subheaders are easily distinguishable from the other text. This can be easily done through using color.
Next, make sure that there is a logical organizational flow and balance within your infographic. The reader shouldn’t be struggling to figure where is the next place for their eyes to go or have too many dominating aspects competing for their attention.
Lastly, next steps for the audience should be apparent within the infographic. What is it that you want the reader to do with the information? Is it to inform, improve, guide, or catalyze action?
36
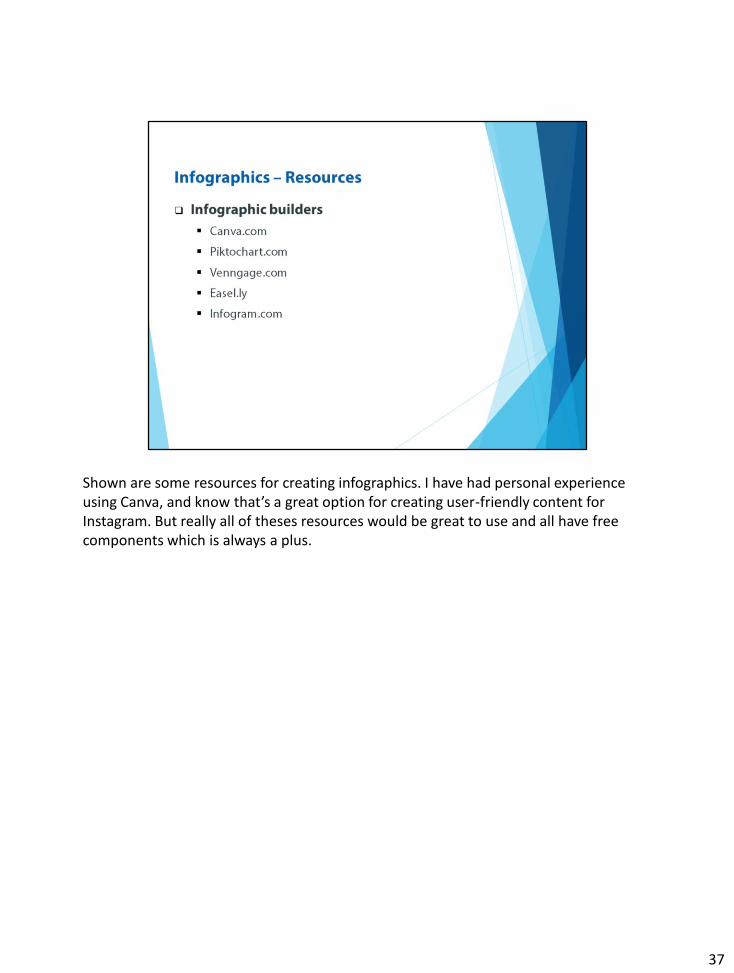
Shown are some resources for creating infographics. I have had personal experience using Canva, and know that’s a great option for creating user-friendly content for Instagram. But really all of theses resources would be great to use and all have free components which is always a plus.
37

As we wrap up, we just want to provide you with some key take aways to keep in mind as you set out to make your content more visually engaging.
First, relevance. Are the visuals you using connecting to the content and are they useful in conveying your main message? Everything you use should be purposeful, not extraneous.
Secondly, are you keeping the audience in mind? Who is your target audience? Are you reflecting the information needs and interests of the audiences you are seeking to get your message to? Tactics might be different if you’re seeking to connect to the teenage population who has a shorter attention span versus a policy analyst who may not.
Next, are your visuals easy to interpret? Are they clear and simple? Make sure there is logical flow and sense of unity from point to point. There should be subtle visual cues such as headers, dividers, and color changes which help the reader navigate through whatever information or story you are presenting to them with a clear call to action.
And lastly as a caveat, we want to remind that you that while using all of these tools is an excellent way to create more visual appeal and spruce up your products, content is
38

ALWAYS important. It’s the meat of your product. These tools cannot add meaning or strength to content that lacks it. So make sure you stay balanced and don’t use the tools as a substitute but rather a compliment to your work.
38
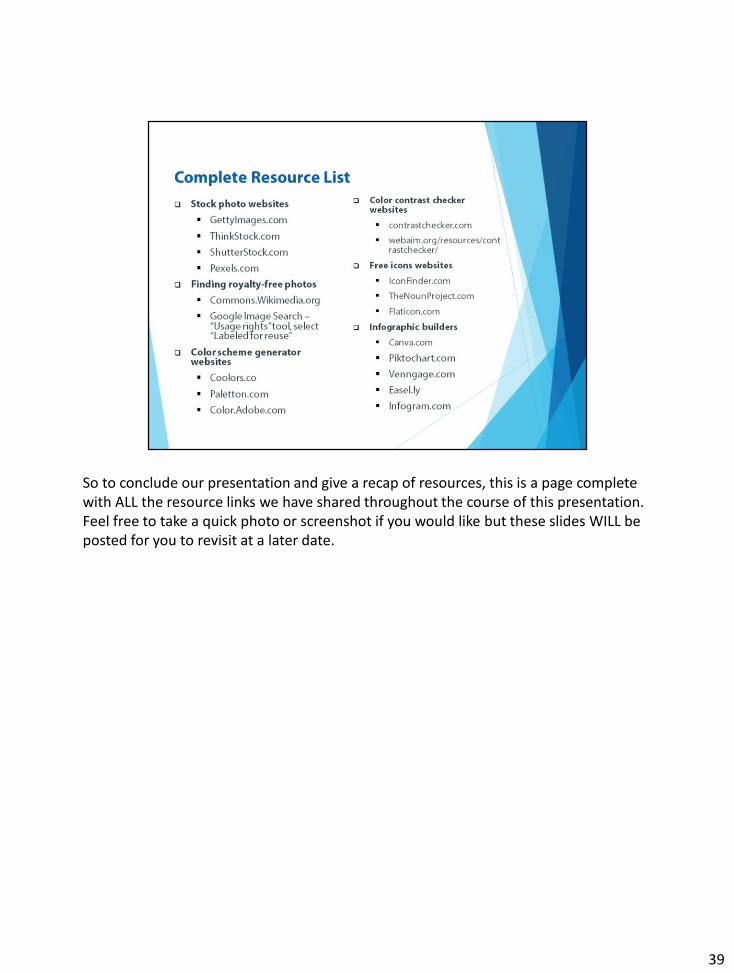
So to conclude our presentation and give a recap of resources, this is a page complete with ALL the resource links we have shared throughout the course of this presentation. Feel free to take a quick photo or screenshot if you would like but these slides WILL be posted for you to revisit at a later date.
39
MODERATOR:
At this time, we’ll take an questions but first we’ll check to see if any questions have come in through the Q&A box.
*If we have questions ask the questions posed by the attendees to the presenter*
*If we do not have questions, proceed with the script below*
Since it appears that we have no questions at this time from the audience, we have some questions that we wanted to ask that might be insightful to our participants.
ADD 3 MOCK QUESTIONS1. You mentioned 508 compliance when referring to text contrast. What is that and do I need to meet this compliance?Section 508 of the Rehabilitation Act governs accessibility of information technology in the federal government, and it includes specific levels of color contrast ratios for text to meet to be compliant. You may or may not be required to comply with these standards or similar standards in your state in different contexts, and I’d recommend you check
40
with your communications or law experts to be sure, since I can not speak to your specific context. However, the standards outlined in section 508 are commonly included on the color contrast checker websites and can still helpful benchmarks to check against if you want to ensure your text is easily legible, even if you are not required to comply with these standards.
2. Do you have any thoughts or guidance regarding data visualization from an evaluation perspective?Great question. Our presentation was very brief, limiting our time to really delve into Data Visualization. However, fret not! For your convenience we have another Coffee Break, done by a colleague in our branch in November 2016 entitled “Strategies For Effective Reporting and Data Communication for Evaluators”. This coffee break covers data visualization in great detail, complete with effective tips, tools, and also provides additional resources for some data viz experts such as Stephanie Evergreen. You can easily find this presentation by accessing the DHDSP’s Webcast & Webinars link (shown on the slide after our poll questions today). After navigating to that link you would click the Evaluation tab, and it’s the 8th presentation from the top.
3. Regarding photos, two questions: how do you find photos that are the appropriate size based on your product and how do you make sure that they all the photos have a similar look and feel?The most important consideration for finding a photo of appropriate size is to check that the resolution is high enough that it will not appear blurry or pixelated when blown up to whatever size you need. Google images and most stock photo websites include filters that you can use to filter out images that are too small for your purposes. And when resizing the photo, make sure the aspect ratio stays the same to ensure the photo does not get distorted; in other words, you want to resize a photo by dragging the corner of the image instead of stretching it vertically or horizontally. If you need to make the photo a different shape, such as changing a rectangle to a square, you should crop the photo instead of stretching or squeezing it. For the question about finding photos with a similar feel, some websites have some filters you can use to help find similar photos, such as filtering just photos in black and white or just images with people in them. However, beyond these simple filters, choosing photos with a similar feel will be up to your eyes. If you have any experience with photo editing software, images can also be edited to change things like the lighting to help give them a similar feel, as long as you purchased the image or it has the appropriate licensing to allow this.
40

MODERATOR:
Next, please stay with us for three short poll questions.
Please allow a few seconds for the poll to pop up on your screen. We will pause for a few moments after the question is presented to give you time to answer. One moment everyone.
*Moderator present poll question. Make sure to read the following after presenting each.*
The [first, second, or third] question should be showing, it read [read question and potential answers]
Please respond with the appropriate answer at this time.
Please stay with us to answer a couple poll questions.
The level of information was
41

• Too basic• About right• Beyond my needs
The information presented was helpful to me• Yes• Somewhat• Not at all
Considering that this was a brief presentation, overall the quality was• Excellent • Good • Fair • Poor
41
Thank you for your participation!
As a reminder, all sessions are archived and the slides and script can be accessed at our Division website. Today’s slides will be available in 2-3 weeks.
If you have any ideas for future topics or questions, please contact us at the listed email address on this slide.
42
MODERATOR:
Our next Coffee Break is scheduled for Tuesday, May 8th and is entitled
Thank you for joining us. Have a terrific day everyone. This concludes today’s call.
43