welcome to the training on scenario development for the integration framework of sap ... · system...
TRANSCRIPT

Welcome to the training on scenario development for the integration frameworkof SAP Business One. This course introduces the scenario monitoring anddebugging tools provided by the integration framework.
1
When a scenario runs in production, you need to know how to troubleshoot ifsomething goes wrong. After completing this course, you will know how to:
• Monitor events from SAP Business One• Perform general monitoring of a running scenario step using the message
log• Display error messages and exceptions• Debug and retry a scenario step from the message log• Use the monitoring tools to monitor internal queues and processing calls• Monitor and debug the internal process steps and processing flow of the
integration framework
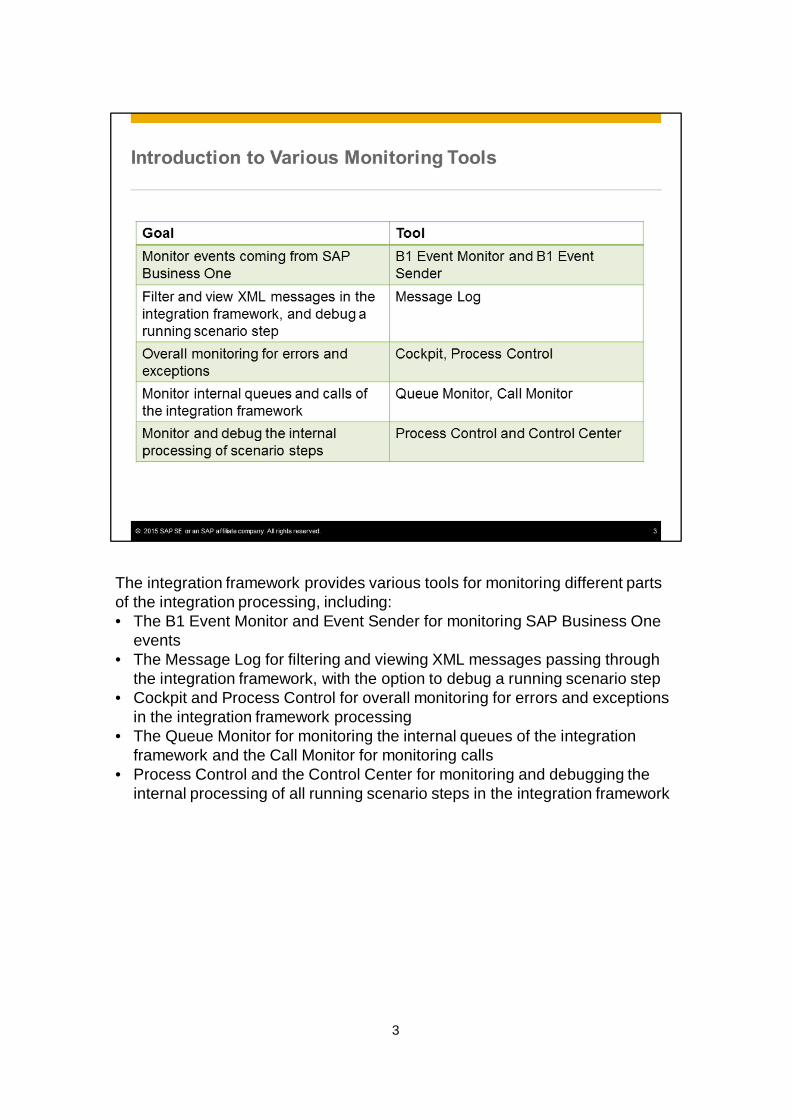
The integration framework provides various tools for monitoring different partsof the integration processing, including:• The B1 Event Monitor and Event Sender for monitoring SAP Business One
events• The Message Log for filtering and viewing XML messages passing through
the integration framework, with the option to debug a running scenario step• Cockpit and Process Control for overall monitoring for errors and exceptions
in the integration framework processing• The Queue Monitor for monitoring the internal queues of the integration
framework and the Call Monitor for monitoring calls• Process Control and the Control Center for monitoring and debugging the
internal processing of all running scenario steps in the integration framework
3

The cockpit tab was introduced in SAP Business One release 9.1 PL08 andprovides a quick overview of any potential errors.
You can see instantly how many scenario packages are active and the overallnumber of messages processed today.Error information is shown including errors in receiver systems, blocker internalqueues, and activation conflicts.System resource information includes BizStore database size and resourceusage.
If you see an error in any of the widgets, you should locate and correct theerror. You can click in the widget to see debugging information including theerror message.
Note that there is also a cockpit available in the Control Center tool of theintegration framework. This cockpit is part of the B1iP Control Center andshows status information on the internal processing of the integrationframework.
4

The first topic covers specific monitoring tools for SAP Business One events.
5

Imagine that you have a scenario that uploads sales orders daily from SAPBusiness One to a SAP ERP system. The scenario has been running forseveral months. You get a call that no sales orders have been received fromSAP Business One. Yet you know that sales orders have been created. Wherecan you look first?Events from SAP Business One are held in the SEVT table of the commondatabase. The SAP Business One event sender, the DI Proxy and the SLD areall involved in the event exchange of events originating in SAP Business One tothe integration framework.
On the SAP Business One server make sure that the event sender and DIProxy services are started and running. If the event sender is not running,events will be queued in the SEVT table and will not reach the integrationframework.
6

To see events from the event sender, you can use the B1 Event Monitor in theintegration framework. The B1 Event Monitor is selected from the Monitoringtab and shows events coming from SAP Business One systems.For a production system this log is normally turned off, so you need to enable itfirst by selecting from the Log dropdown list. For a development system thislog is already enabled in the system profile (from SAP Business One release9.1 PL09 and up).
You can display events by status: success, failure, or filtered. Choose theRefresh icon to refresh the display.
A successful event is shown here, and you can see the company database,object ID 17 (a sales order), the document number in the Key Value column, atimestamp, the target host name and the name of the internal processing stepin the integration framework. Internal processing steps will be covered later inthis course.
7

Most likely you will be looking for events that fail, but if you see an event withthe filtered status, this can be caused if:• The SAP Business One system is not defined in any active scenario sender
list. Sender lists are defined during step setup and activation• The sender SAP Business One system is defined in a sender list, but does
not meet any filtering conditions for the event. Event filters are establishedusing the B1 Event Filter Generator tool.
• There are no active scenario packages defined for the event, or a scenariopackage has been deactivated.
8

If the event is displayed with the failure status, you will see an error messageas the final field in the log entry.For both successful and failed events the log entry includes two action icons:• The left-hand edit icon enables the Target B1i Application field for editing.
You should only edit this field to change the sender system ID if there is amismatch between SAP Business One company databases and integrationframework information.
• The right-hand icon allows you to retry or resend the event through theintegration framework processing.
9

If there are no events shown in the B1 Event Monitor, it could be that there areerrors or inconsistencies in the event sender configuration or the SAP BusinessOne notification settings. The event sender uses the SAP Business Onenotification mechanism.
The Event Sender troubleshooting tool can check this for you.To locate the Event Sender troubleshooting tool, navigate to the Tools menuand choose the Troubleshooting option, then select the B1 Event Sender fromthe dropdown list of functional groups. Choose the Submit button to open theB1 Event Sender troubleshooting tool.
The tool provides five checks that you can run individually. Choose Start to runthe check for each of the listed categories. After the check completes, theDisplay button will be enabled to show the result of the check.
10

The event sender checks display:• General system and version information• Configuration information for the event sender• Status of the inbuilt notification mechanism for each SAP Business One
company database. Since notification problems can prevent events frombeing sent, this is something to check.
• A report of events stored in the SEVT table for each company database. Anexample of this report is shown in the slide. If there are events for adatabase, select the Events button on the row to see the event details. Ifevents remain in the SEVT table, you should investigate why they are notbeing processed.
• A summary of all information, with an overview for each company database.A sample of this report is shown in the slide.
11

If events from SAP Business One are reaching the integration framework, theevent sender is working properly.
You should next check the XML messages in the integration framework usingthe Message Log.
12

The Message Log shows all messages being processed through the integrationframework and allows you to view and debug the message through the variousprocessing steps.
System profiles were introduced in SAP Business One release 9.1 PL09, andmessage logging is by default switched on in both productive and developmentsystem profiles. If the message log is turned off in your environment you canenable it using the path shown in the slide and selecting the Message Logcheckbox. The Indexed Access checkbox is enabled by default and should notbe disabled.
In a productive system profile the log level should always be set to “Infoset” tokeep the log database to a minimum. However if you are debugging in aproductive system, set the Log Level parameter to “Full message” so that thefull XML message is captured in the message log. Remember to set the loglevel back to Infoset after you finish the debugging in the productive system.
Important: SAP recommends you enable Daily Deletion. When you do this themessage log entries are automatically removed each day, and you will only seeentries in the message log for a maximum 24 hour period.
13

The message log displays information for each message entering theintegration framework. The information recorded in the log includes scenariopackage and step, sender and receiver system, trigger, date and time.
In this screenshot you can see a successful message highlighted in the log.You can filter the displayed messages using various filters, such as status,date, sender or receiver system, scenario package, or object.
The status filters are Success, Failure, Processing or Filtered. Filteredmessages are messages that no scenario step has subscribed to, or messagesthat the processing logic has filtered.
Note: If you have enabled daily deletion of message logs, which isrecommended, you will only see messages for the current 24 hour period.
For each scenario step, you have the option to define two search keys. Searchkeys are defined in the scenario package. Choose Scenarios → PackageDesign, and select the Definitions button. You can define search keys to easilysearch for a specific item code or document number. The search key values areentered as XPath expressions.
14

If the message has the failure status, the status icon and result message areboth highlighted in red.The four message log icons apply to all messages and allow you to:• Delete one or more selected messages from the log• Delete imported messages that were previously imported• Export messages• Show or hide columns in the log. This opens up a list of column names,
allowing you to select just the columns you want to display instead ofscrolling sideways.
15

The Last Exception button in the message log display shows a list of all internalprocess steps that have ended with an exception. The integration frameworkprocessing for a scenario consists of internal process (IPO) steps, and thisreport allows you to quickly scan for step processing errors.
The Last Exception button shows a report called the IPO-Step Status Panel.This report is also available to run from the B1iP Control Center.
In the slide you can see highlighted:• The application name of the processing step. This link also contains the
system ID and the step name.• The value for the activated field below the application name. This will be
false if the step has been deactivated, and you have the option to reactivateit to run again. If the step is active, you can deactivate it to prevent recursiveerrors.
• The TID link that opens up a panel allowing further debugging. This will becovered later in this course.
16

Sometimes connectivity problems or incorrect data mappings can prevent themessage reaching a receiver system. If an error occurs when the integrationframework tries to hand over a message to a receiver system, the integrationframework puts the message into the error inbox of the receiver system. Typicalerrors displayed include connectivity problems to the receiver system, systemavailability or incorrect data mappings.
To see the error inbox for each receiver system defined in the SLD, select theError Inbox button in the Message Log display.
In the error inbox list, select the receiver system marked with a red cross toopen the error information. From this window you can see the error message.You have the option to retry the message or delete it.
17
This topic shows you how to drill down from a message to debug the internalprocessing of the integration framework.
18

For each message shown in the message log, he Status column for a messageshows two icons:1. The message status (green for success or red for failure). If an exclamation
mark is displayed for the status, the message has INCOMMIT status andthe icon will be selectable and will show more information
2. An icon that indicates the message is from the local integration frameworksystem, or is imported.
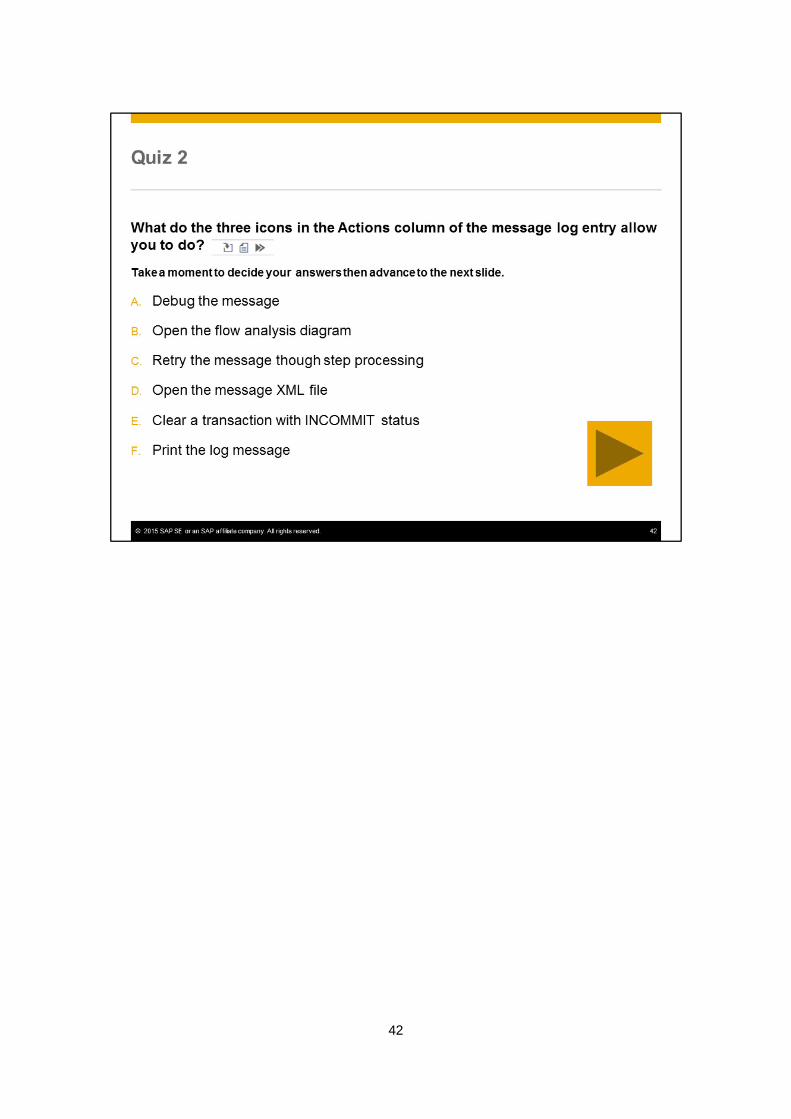
The Actions column icons allow you to start debugging the internal XMLmessage. From left to right, the actions are
§ Debug the message. This opens the transaction ID panel for debugging
§ Open (view) the XML message
§ Retry the messageLet’s look at these actions in more detail.
19
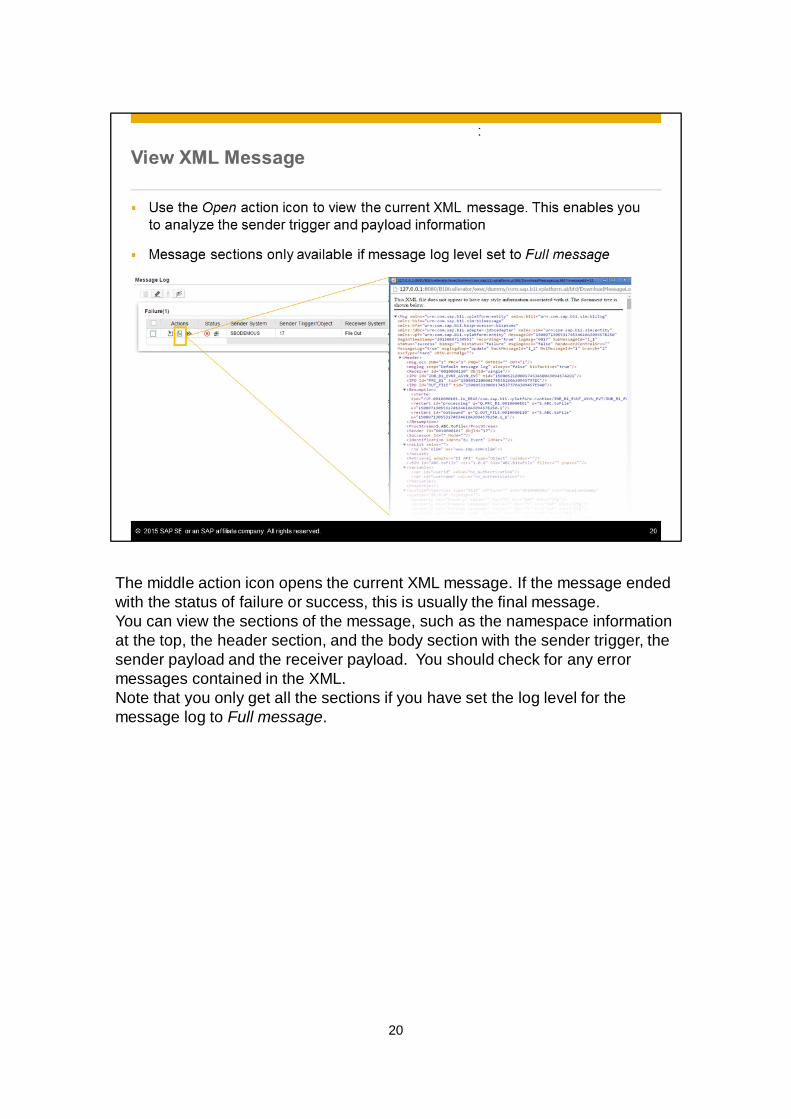
The middle action icon opens the current XML message. If the message endedwith the status of failure or success, this is usually the final message.You can view the sections of the message, such as the namespace informationat the top, the header section, and the body section with the sender trigger, thesender payload and the receiver payload. You should check for any errormessages contained in the XML.Note that you only get all the sections if you have set the log level for themessage log to Full message.
20

After you have fixed an error, the Retry icon allows you to resend the messagethrough the integration framework.The icon opens a dropdown list that allows you to retry or resend the messagefrom different points of execution (new from start, step processing andoutbound, or only outbound). You should only do this in a development systemand for obvious reasons you should not retry a message in a productionenvironment.
Note: The Retry icon is enabled only if if you have set the log level for themessage log to Full message.
21
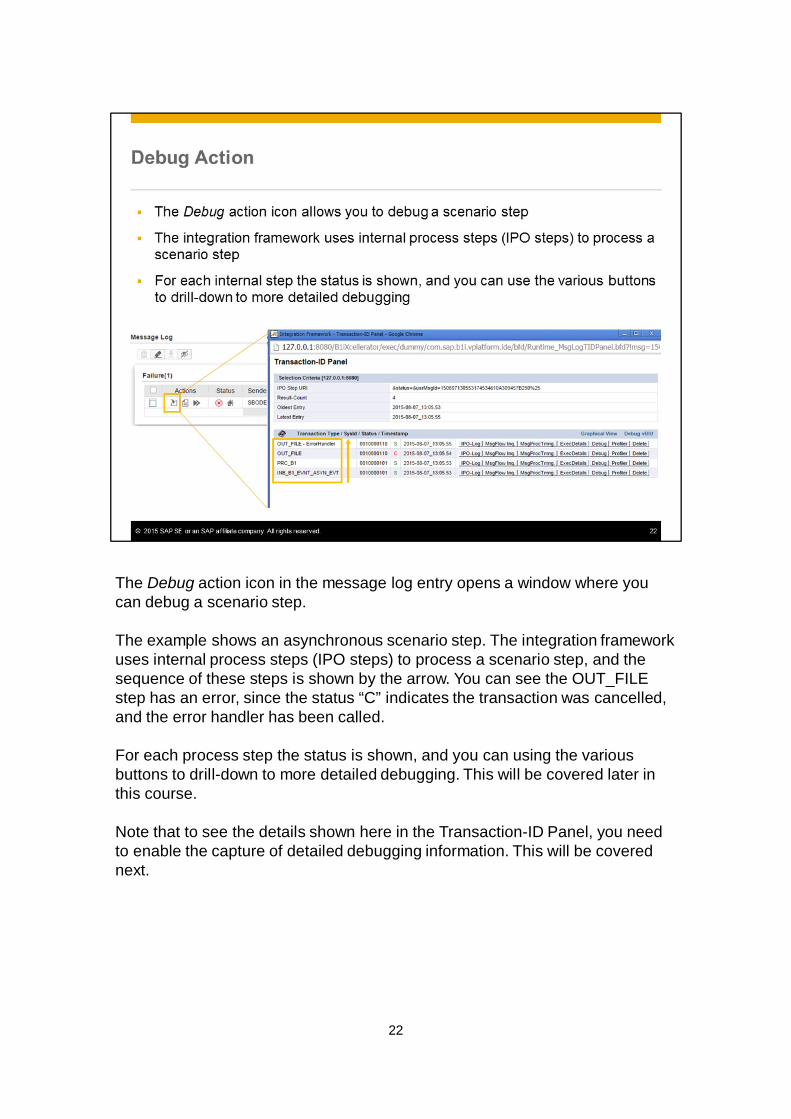
The Debug action icon in the message log entry opens a window where youcan debug a scenario step.
The example shows an asynchronous scenario step. The integration frameworkuses internal process steps (IPO steps) to process a scenario step, and thesequence of these steps is shown by the arrow. You can see the OUT_FILEstep has an error, since the status “C” indicates the transaction was cancelled,and the error handler has been called.
For each process step the status is shown, and you can using the variousbuttons to drill-down to more detailed debugging. This will be covered later inthis course.
Note that to see the details shown here in the Transaction-ID Panel, you needto enable the capture of detailed debugging information. This will be coverednext.
22
This topic shows you how to drill down to debug the internal processing of theintegration framework.
23
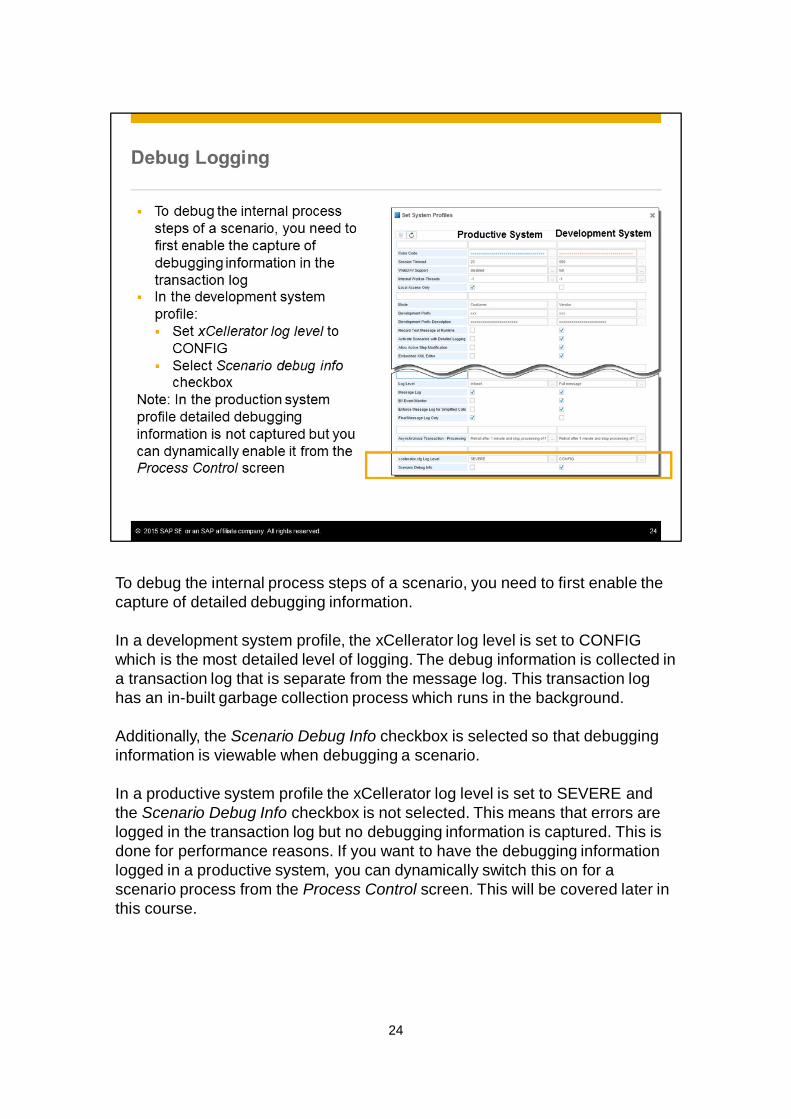
To debug the internal process steps of a scenario, you need to first enable thecapture of detailed debugging information.
In a development system profile, the xCellerator log level is set to CONFIGwhich is the most detailed level of logging. The debug information is collected ina transaction log that is separate from the message log. This transaction loghas an in-built garbage collection process which runs in the background.
Additionally, the Scenario Debug Info checkbox is selected so that debugginginformation is viewable when debugging a scenario.
In a productive system profile the xCellerator log level is set to SEVERE andthe Scenario Debug Info checkbox is not selected. This means that errors arelogged in the transaction log but no debugging information is captured. This isdone for performance reasons. If you want to have the debugging informationlogged in a productive system, you can dynamically switch this on for ascenario process from the Process Control screen. This will be covered later inthis course.
24
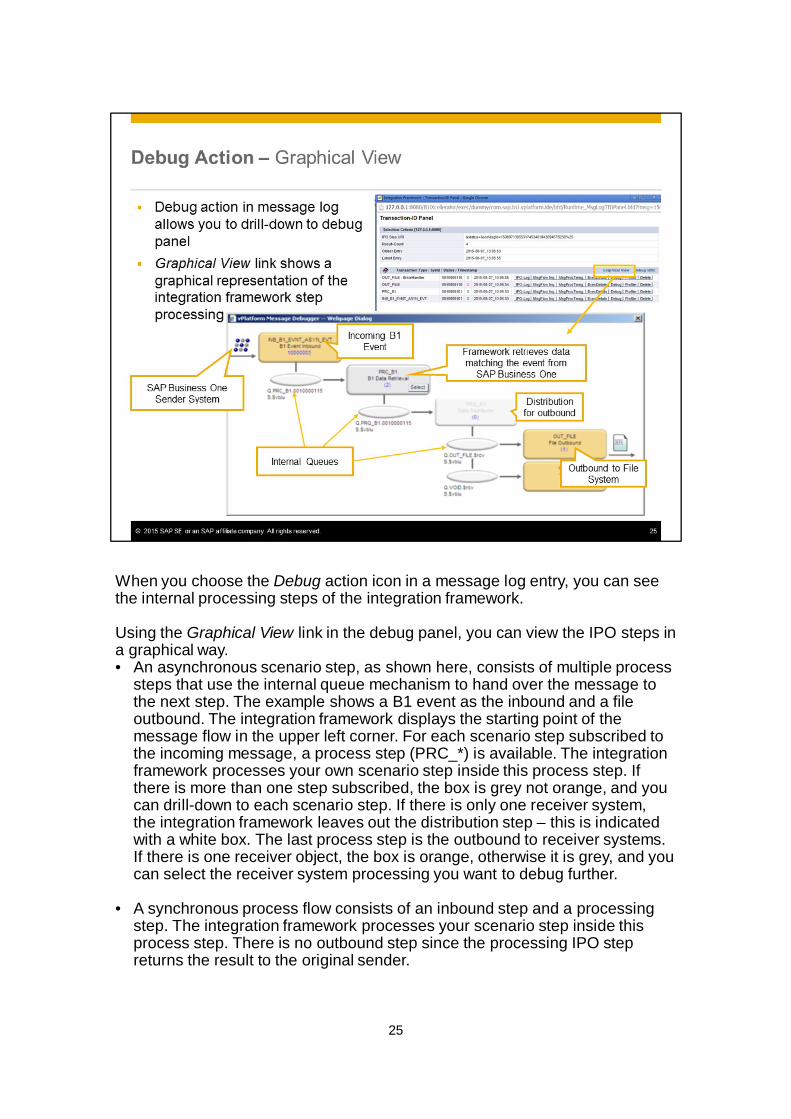
When you choose the Debug action icon in a message log entry, you can seethe internal processing steps of the integration framework.
Using the Graphical View link in the debug panel, you can view the IPO steps ina graphical way.• An asynchronous scenario step, as shown here, consists of multiple process
steps that use the internal queue mechanism to hand over the message tothe next step. The example shows a B1 event as the inbound and a fileoutbound. The integration framework displays the starting point of themessage flow in the upper left corner. For each scenario step subscribed tothe incoming message, a process step (PRC_*) is available. The integrationframework processes your own scenario step inside this process step. Ifthere is more than one step subscribed, the box is grey not orange, and youcan drill-down to each scenario step. If there is only one receiver system,the integration framework leaves out the distribution step – this is indicatedwith a white box. The last process step is the outbound to receiver systems.If there is one receiver object, the box is orange, otherwise it is grey, and youcan select the receiver system processing you want to debug further.
• A synchronous process flow consists of an inbound step and a processingstep. The integration framework processes your scenario step inside thisprocess step. There is no outbound step since the processing IPO stepreturns the result to the original sender.
25

The BizFlow processing flow window allows you to track the internal atoms fora scenario step. The presence of a red arrow in an atom indicates that the atomwas executed. You can follow the red arrows to check where processingstopped and drill down to sub flows. Each atom displays the duration time andthe size of the inbound message.
You can open the processing flow window from the message log. Select theDebug action icon in the message entry to open the Transaction-ID Panel.Then select either the Debug button for an internal process step, or in thegraphical view, click the orange box for any internal process step.
By selecting either the red chevrons or the red arrows throughout the processflow, you can:• Check the inbound parameters to an atom• Open the incoming XML message for an atom• Check configuration details for an atom
Note: To see the flow debugging arrows, you must enable scenario debuggingfor the step processing. If you are using the development system profile, thescenario debug checkbox will be enabled for you. You can also enable scenariodebug from the Process Control section of the Monitoring tab. Process Controlwill be covered later in this course.
26

Further debugging information is available for the scenario step using thebuttons in the Transaction-ID Panel:• The IPO-Log button shows a log with detailed information. In case of an
error/exception in the integration framework you will find the error informationand call stack at the end of this log.
• The MsgFlow Inq. button is useful for complex processing flows where amessage is subscribed by different scenario steps, and the processing insidethe integration framework ends up as a tree. With the message flow inquiryoption you can follow the integration processing tree structure from the rootlevel through to successor transactions. For each step, you can display theflow analysis.
• The MsgProcTmng button shows the timing information for each IPO step
Note: This detailed log information is available only if you have set thexCellerator log level to CONFIG in the system profile.
27

Continuing the buttons available for each IPO step:• The ExecDetails button traces all single steps of the processing flow for the
IPO step. It allows you to check the inbound parameters and the inboundmessage for all single steps. This analysis is very detailed and is typicallyused by experts.
• The Debug button opens the processing flow debugging window, asdescribed earlier in this topic.
• The Profiler button allows you to check potential performance issues. Theanalysis list has three sections:
1. All process steps with processing details sorted by duration.2. Internal database interactions sorted by duration3. The size of the inbound message sorted by size for all process steps.
• The [Delete] button will delete the log entry. If the transaction is still running(identified by status INCOMMIT or INROLLBACK), it will cancel thetransaction.
Note: This detailed log information is available only if you have set thexCellerator log level to CONFIG in the system profile.
28

The next topic covers additional monitoring tools.
29

The integration framework uses internal queues when processingasynchronous scenario steps.
If messages do not appear in the message log, it could be that they are stuck inan internal queue. The Queue Monitor displays all internal queues that containa message. Typically this log will be empty, since messages are processedimmediately therefore you will only see a message in this log if something hasgone wrong. If a message gets stuck in the queue this will block subsequentmessages that use the same queue.
Each queue has one or more sub-queues called streams. The above exampleshows a processing of an incoming B1 event. When you click and expand thequeue in the Queue column, the stream will be displayed in the Streamscolumn next to it. By clicking and expanding a particular stream, all availablemessages are displayed in the third column.
For each message you can use the buttons to:• View the message• Show the process that has created this particular queue• View the message flow details• Delete a message. To remove all messages from a stream, use the Clear
button.
30

The Call Monitor report shows a report of all calls made by scenario steptransactions, regardless of scenario.You can select the types of calls for the report, for example, email, HTTP,queue, SQL, Void, etc.
Calls happen in the inbound, processing, and outbound phase, duringauthentication and in the framework itself and this report can help withtroubleshooting issues with calls.
The report shows the time of the call, the type, duration, and the inbound andoutbound from the call. For debugging SAP Business One scenarios, chooseSQL as the type to view SQL statements and database results.
Note: to see the call monitor information, you must have set the xCellerator loglevel to CONFIG in the system profile.
31

Process control provides a very powerful tool for overall monitoring of theprocess steps for multiple systems. To open process control, choose theMonitoring tab then the Process Control option.
The first three sections of the process control screen show a list of all systemsand scenario steps categorized by processing phase (inbound, processing, andoutbound). You may notice that some steps are shown multiple times, withdifferent systems.For each section you see a count of transactions executed for each scenariostep that are:• Started or running• Have INCOMMIT status. The transaction has finished in the integration
framework but is waiting for the commitment of other components, forexample, the DI API.
• In rollback status. The transaction failed and is in the rollback process• Cancelled• Completed successfullyIf you see transactions stuck in INCOMMIT status, you can force thetransaction to complete using the Clear INCOMMMIT Transactions button.
In other sections of Process Control you can see the internal processes of theintegration framework and inter-company processes (if the IntercompanyIntegration Solution for SAP Business is installed).
32

A very powerful feature of Process Control is the ability to dynamically activateor deactivate a specific process step using the Active checkbox on the row, orto activate or deactivate all process steps for a phase using the Activate andDeactivate buttons at the top. When deactivating a process step, use withcaution as a single process step could be shared by multiple systems.
Similarly, you can dynamically switch on or off the capture of scenariodebugging information at run time. Use the Debug checkbox on the processrow to switch on or off the capture of detailed information for a single step andsystem, or use the Debug On or Debug Off buttons for all process steps. Whenyou rerun the scenario, you can view the scenario debugging information in theTransaction-ID panel and drill down to the processing flow.
Note: If you are running with the development system profile, where scenariodebugging is already enabled, you will see that the Debug checkbox is alreadyselected for all step processes.
33

As well as providing an overview of all running step transactions, ProcessControl allows you to debug a process step.
If the Exception checkbox is marked for a process step, this indicates anexception occurred in the processing. An example is highlighted in the slide.You can select the Debug button to open the Transaction-ID panel. This issimilar to the panel that you open from the Message Log; except that it shows alist of all the internal steps executed for the selected processing phase(Inbound, Processing or Outbound) for the selected row (scenario step andsystem).
You can drill-down to the IPO Log and the processing flow atoms using thebuttons. These buttons were described earlier. To see this information you needto have switched on the capture of scenario debugging information.
34

In SAP Business One release 9.1 PL08 and higher, you can configure whichsections will be shown in the Process Control report.The default display shows several sections including Scenario Processes,Framework Processes, and Individual Scenario Package Processes. You canchange the sections displayed by choosing the Configuration icon, highlightedin the slide.
35

This topic covers the Control Center tools for inspecting the internal processingof the integration framework.
36

The B1iP Control Center is a tool for low-level configuration andtroubleshooting of the internal process steps of the integration framework.
When you select this tool from the Tools menu, the Control Center opens in aseparate browser window.
The Control Center has a cockpit that shows the overall status of IPO processsteps and transaction execution status. Also shown are database queue status,BizStore status, initialization status and server status.
You can click in the widgets to view more details. For example, you can openthe IPO-Step Status panel as shown in the slide. This report is similar to theLast Exception report you can run from the Message Log.
37

The Control Center also provides a Monitoring tab with a set of monitoring toolsas well as various statistics such as the results of the garbage collection runs.Some of the tools can be useful for scenario debugging.The example shown here is the IPO-Step status. This is similar to the LastException report you can run from the message log; however this is a full reportof all steps with their current status and you can enter search criteria to focuson a specific step, or steps that have been deactivated or that have thrown anexception.
38

The Transaction-ID panel can also be viewed from the Control CenterMonitoring tab. This is another way of viewing the scenario debugginginformation that you can see from the Debug action icon in the message log.
Since this is a report, selection criteria can be entered, such as timestamps,step, and execution status. Here we have selected steps that have beencancelled.
39

40

41
42

43

44

45