welcome to the sixth - · pdf file · 2016-12-21if it is close to a source of heat,...
TRANSCRIPT


page iScience.gc.ca Activity Book 6
Welcome to the SIXTH Science.gc.ca Activity Book!
Science is all around us and can be discovered, explored and used in so many ways!
This new Activity Book showcases the diversity of the world of science through activities in health, biology, environment, agriculture, meteorology, astronomy, the living world and much more!
Science.gc.ca is the official Government of Canada website for Science and Technology (S&T) information and resources. We have put together this Activity Book to stir your inner scientist. Whether you are in elementary, intermediate or secondary school there are activities for all ages and skill levels. These activities can be done individually or with friends in class, at camp, at home or with your Girl Guides of Canada or Scout Canada clubs.
If you would like to make your own barometer, learn about the formation of our solar system or even test your knowledge of tsunamis, you’ll find it all inside this Activity Book!
For more activities, you can visit Science.gc.ca and download our previous Activity Books. While you are there, don’t forget to check out our Videos, Games and Educational Resources for more science and technology experiments, activities and facts. You can even submit a question to “Ask a Scientist!”
Science.gc.ca challenges you to go out, explore and look for science everywhere you go.
We would like to thank our funding partners for their ongoing participation and support:
Go ahead, get started; discover and explore the fascinating world of science!
Sincerely, The Science.gc.ca Team
• Aboriginal Affairs and Northern Development
Canada
• Agriculture and Agri-Food Canada
• Canadian Food Inspection Agency
• Canadian Space Agency
• Defence Research and Development Canada
• Environment Canada
• Fisheries and Oceans Canada
• Health Canada
• National Research Council Canada
• Natural Resources Canada
• Natural Sciences and Engineering Research
Council
• Public Health Agency of Canada
page 28Science.gc.ca Activity Book 6
Intermediate Level ActivitiesBest suited for ages 11 to 15

page 29Science.gc.ca Activity Book 6
Environment Canada
1 Build your own Barometer
This project explains how to make a barometer to show changes in air pressure.
Materials• Empty glass container or soup can
• Elastic band
• Glue
• Adhesive tape
• Balloon
• Drinking straw
• Index card about 8 cm by 13 cm (3 inches by 5 inches)
Method1. Cut a piece out of the balloon large enough to cover the top of the glass jar or soup can.
2. Stretch that piece of the balloon tightly over the top of the jar or can and secure it in place with the elastic band.
3. Cut the straw so that it is about 10 centimetres long and trim one end to a point.
4. With the sharpened end pointing out, lay the straw on the balloon with the flat end at about the centre of the balloon.
5. Glue the straw in place.
6. Draw reference marks on one of the long edges of the card at roughly half-centimetre intervals. Tape the

page 30Science.gc.ca Activity Book 6
opposite (unmarked) side of the card to the jar, with the narrow end of the rectangular card extending above the jar top and the marked edge just behind the straw. The marked edge should stick out so that the sharpened end of the straw points to the reference marks.
Points of discussion• The piece of the balloon that is stretched across the jar will act as a membrane. When the air pressure
outside the jar rises, it will push down on the balloon, forcing it slightly into the jar. This, in turn, will cause the end of the straw to rise. Similarly, when the air pressure outside falls, the air pressure in the jar will be greater than the air pressure around it forcing the balloon to bulge slightly. This will cause the end of the straw to drop.
• You can chart the position of the straw against the reference marks on the card each day. This will not give you a numeric reading but it will tell you whether the air pressure is rising or falling. The pressure trend is an important tool in forecasting.
• Please remember to keep your barometer away from sources of heat such as radiators and sunny window ledges. If it is close to a source of heat, then your barometer will act more as a thermometer, with the air inside expanding and contracting to reflect changes in temperature, not pressure.
page 31Science.gc.ca Activity Book 6
Health Canada
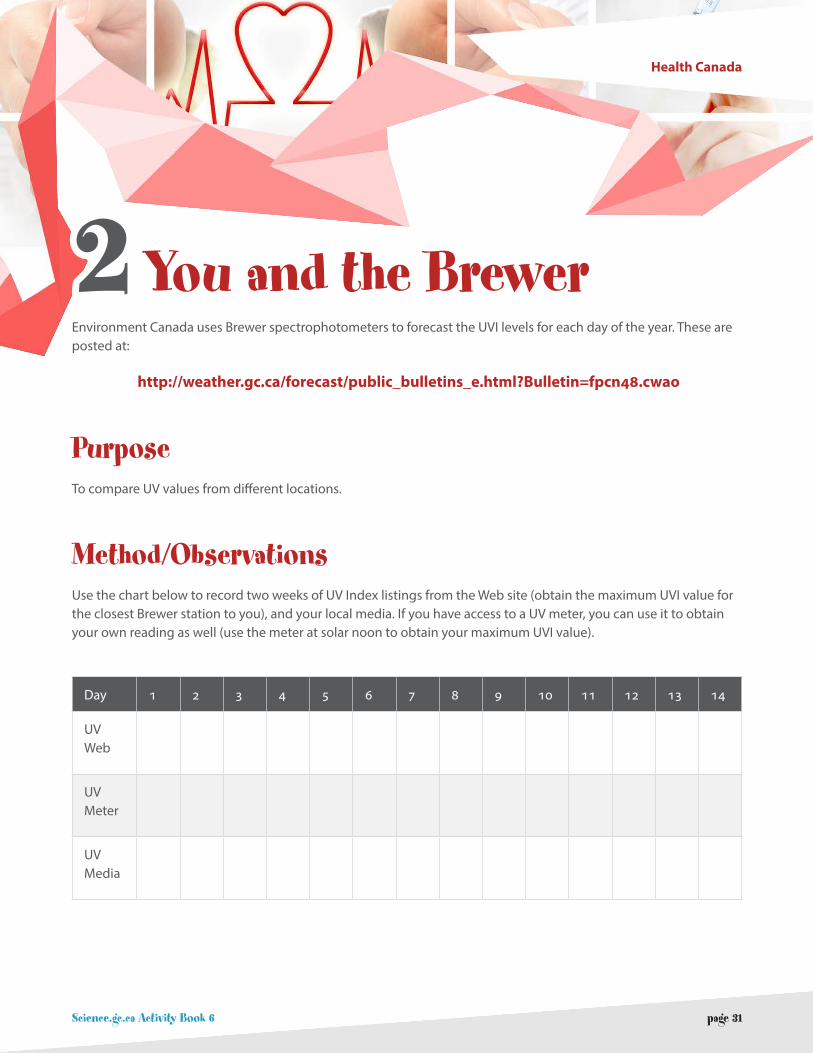
2 You and the BrewerEnvironment Canada uses Brewer spectrophotometers to forecast the UVI levels for each day of the year. These are posted at:
http://weather.gc.ca/forecast/public_bulletins_e.html?Bulletin=fpcn48.cwao
PurposeTo compare UV values from different locations.
Method/ObservationsUse the chart below to record two weeks of UV Index listings from the Web site (obtain the maximum UVI value for the closest Brewer station to you), and your local media. If you have access to a UV meter, you can use it to obtain your own reading as well (use the meter at solar noon to obtain your maximum UVI value).
Day 1 2 3 4 5 6 7 8 9 10 11 12 13 14
UV Web
UV Meter
UV Media
page 32Science.gc.ca Activity Book 6
Discussion1. Using your data, plot a graph of the daily UV radiation levels.
2. Continue to record and post a two-week period so that the class can produce cumulative graphs of UV readings over several months.
ConclusionWhat have you learned from your comparison?
• Which month(s) of the school year have the highest UV readings?
• How does this relate to the reported seasonal ozone layer thickness?

page 33Science.gc.ca Activity Book 6
National Research Council Canada
3 Using Your Centre of Gravity
Gravity is one of the forces that control how the physical world works. It keeps trying to pull things towards the centre of the Earth. Without realizing it, we’ve learn to outsmart gravity. Otherwise, we would fall over every time we took a step. We “outsmart” gravity by positioning our centre of gravity - an imaginary spot in the middle of the stomach about 8 cm below the belly button. It’s the point around which all our weight seems to be centred. As long as we keep the centre of gravity over our feet, we can stand and walk.
Purpose To experience how gravity works on Earth
Materials and Equipment• Wall
• Chair
• Partner
MethodActivity #1
Work with a partner. Tell your partner that you are going to glue his or her foot to the floor with a special glue. Have your partner stand so that one foot and the side of their head are against the wall. Tell your partner that the foot farthest from the wall is “glued” to the floor.
Ask your partner to raise the “glued” foot out to the side. Record the results.

page 34Science.gc.ca Activity Book 6
Where is your centre of gravity when you are leaning against the wall? How does this affect your ability to move sideways?
Activity #2
Next, ask your partner to sit in a chair with his or her head tilted backwards. Put one finger on his forehead and press lightly. Challenge him to get up. Record the results.
What happens to your partner’s centre of gravity when he is sitting in the chair? How would he have to change it in order to move?
Activity #3
Have your partner rest his head against the wall while his feet are at least 45 cm away from the wall. Pretend to “glue” his head to the wall. Challenge your partner to move his head away from the wall while keeping his feet flat on the floor. No hands are allowed. Record the results.
Switch roles and try the activities again.
Where is your partner’s centre of gravity in this experiment? In what direction does gravity want to pull your partner? What is keeping your partner from falling over?
How will changes in gravity affect astronauts aboard the Space Station?
Observations/Results Record your conclusions. Conduct the activities several times and record the changes in the results.
page 35Science.gc.ca Activity Book 6
Natural Resources Canada
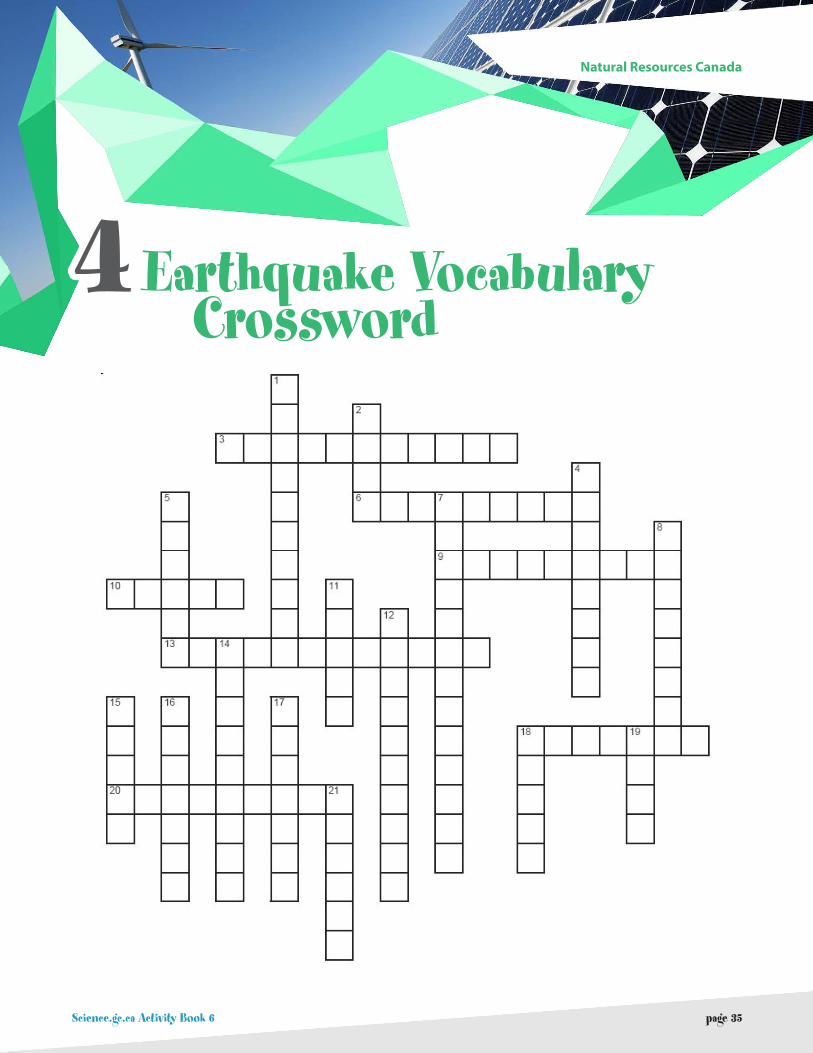
4 Earthquake Vocabulary Crossword

page 36Science.gc.ca Activity Book 6
Across3. Sensitive instrument used to record and measure earthquakes
6. The point on the earth’s surface directly above the subsurface location of the earthquake
9. The unique measure of the amount of energy released during an earthquake
10. The S wave is also called the _____ wave
13. How earthquake energy is transmitted (2 words, ignore the space)
18. The ‘Ring of Fire’ encircles this ocean
20. An abrupt downhill movement of rock and soil, possibly triggered by an earthquake
Down1. Recording of ground motions
2. A region in which earthquakes are common is a seismic ____________________
4. Large segments of the earth’s crust and upper mantle are known as ______________ plates
5. Force which can lead to sudden movement along a fault
7. The P wave is also called the _______________ wave
8. A numeric scale from I to XII that describes earthquake effects
11. The subsurface location at which the energy of an earthquake is released
12. Sudden shaking of the ground
14. How the earthquake was felt locally
15. Zone of fractures or breaks in rocks where movements occur
16. A series of huge ocean waves that might be caused by an earthquake
17. The time at which a particular wave phase arrives at a seismograph station is known as the _________________ time
18. Many earthquakes in western North America are associated with the Juan de Fuca _____________.
19. The Mercalli Scale is based on people’s reports of what was ______________ locally
21. An earthquake is the result of a sudden release of ____________________

page 37Science.gc.ca Activity Book 6
Canadian Space Agency
5 Take a Deep BreathIn this activity, students learn that air quality on board the International Space Station (ISS) is a major concern. In the open environment of the classroom, the CO2 from the students’ respiration poses no threat to air quality because it is removed by the ventilation system. In a closed environment such as the ISS, however, CO2 can be harmful because it reduces the amount of available oxygen. The suggested experiment is qualitative in nature. The reaction of lime water to CO2 becomes more pronounced as the gas’s concentration in the air increases.
Hypothesis Formulate a hypothesis about the relative levels of carbon dioxide in the atmosphere and in the air you exhale.
Materials • 3 100 ml beakers
• 1 syringe
• 1 straw
• 150 ml of lime water
Experiment Procedure and Observations • Label the three beakers.
• Pour 50 ml of lime water into each beaker.
• Use the syringe to make air bubbles in the water of the first beaker and record your observations.
• Use the straw to gently blow bubbles into the water of the second beaker and record your observations.
• Let the third beaker sit in the open air until the next day and record your observations.

page 38Science.gc.ca Activity Book 6
AnalysisCompare the appearance of the lime water in each beaker.
Conclusion What do you conclude about the relative amounts of carbon dioxide in the atmosphere and in the air we exhale?
Why did the water in the first beaker become cloudy more quickly than the water in the third beaker?

page 39Science.gc.ca Activity Book 6
Health Canada
6 How Dirty is the Air?Try this
experimentto �nd out
about...
Particulate Matter
what’s that word?
It’s a fancy word for all the little
things like dust, dirt, soot, smoke that
are too small to see.
• coloured markers • labels
• white cardboard • �ve jar lids
• magnifying glasses
What you’ll need:
Write the numbers 1 through 5on the labels, then attach
a label to the top of eachjar lid.
Place the jar lids on a piece of cardboard.Carefully trace around the jar
lids, then number these circles to match the
numbers on the lids.

page 40Science.gc.ca Activity Book 6
At the end of the �fth day, take away the last lid and look at the circles. Ifthe air is dirty, the circles covered by the low-numbered lids will
have more specks of dirt than the others. Use a magnifyingglass to count the dirt specks.
Is our air clean or dirty?
At the end of the �rst day, remove one lid, starting with number one. For the next
�ve days take away one lid eachday. Are the circles different?
Take the cardboard and lids outside. Place them �at in an open area. (Rain or high winds will spoil
the experiment, so keep an eye on the weather reports!)
page 41Science.gc.ca Activity Book 6
Natural Resources Canada
7 Make a Debris FlowDescription: This lab demonstration is an easy and fun way to effectively produce a model debris flow landslide in the classroom. It can be used once as a simple demonstration or can become an experiment comparing the results of different slope angles and different sediment textures.
PurposeTo demonstrate the effect of saturated groundwater conditions and heavy rainfall on unstable slopes and to observe the process of landslide movement and resulting landforms.
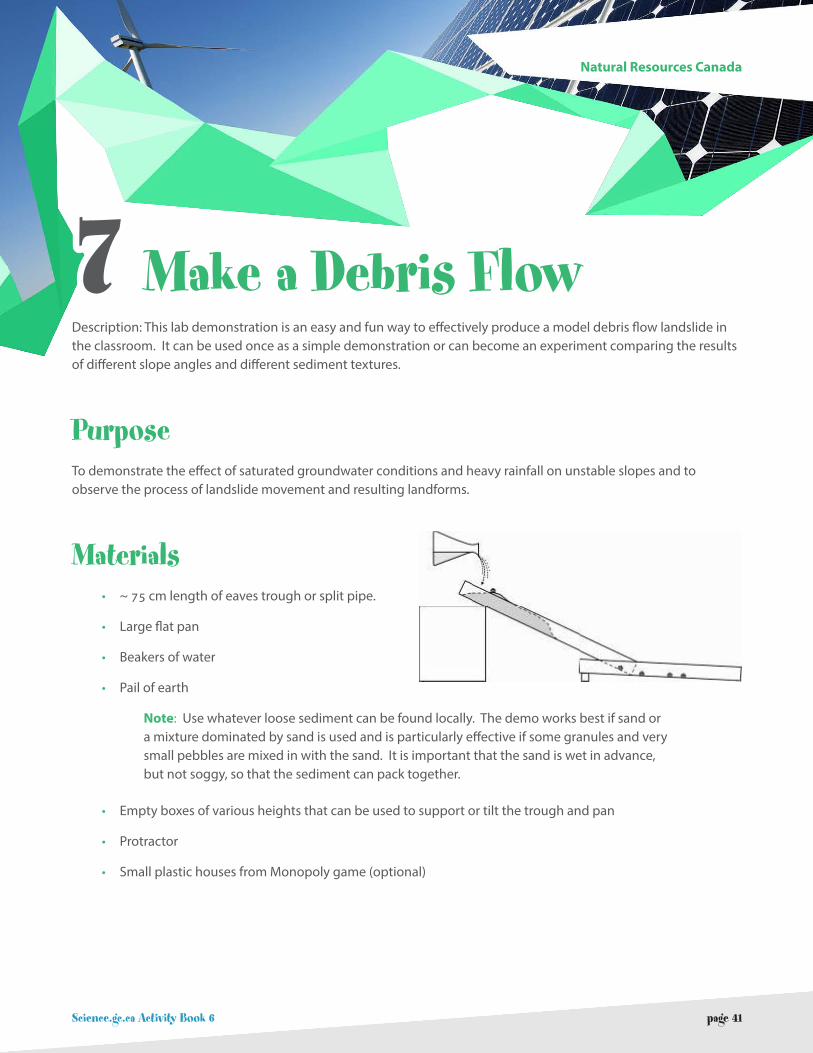
Materials• ~ 75 cm length of eaves trough or split pipe.
• Large flat pan
• Beakers of water
• Pail of earth
Note: Use whatever loose sediment can be found locally. The demo works best if sand or a mixture dominated by sand is used and is particularly effective if some granules and very small pebbles are mixed in with the sand. It is important that the sand is wet in advance, but not soggy, so that the sediment can pack together.
• Empty boxes of various heights that can be used to support or tilt the trough and pan
• Protractor
• Small plastic houses from Monopoly game (optional)

page 42Science.gc.ca Activity Book 6
Teacher instructionsIntroduction:
1. Inform class that one type of landslide is known as a debris flow. In a debris flow, loose material, in a saturated state, loses cohesion and flows downslope in a fluid-like manner, carrying with it any trees, buildings etc. that were on the slope. The flow loses momentum when the slope becomes gentle and the debris spreads out in a fan shaped deposit and the water drains out of the debris. This type of failure is very common in western Canada and can be associated with heavy losses if it occurs in a populated area or along a transportation route. These landslides are generally triggered by heavy or prolonged rainfall or heavy snow melt.
2. Set up as in diagram.
o Slightly elevate one side of the large pan to help drain water. The pan represents a break in slope and the flat land at the bottom of the slope.
o Tilt the eaves trough at ~ 25° angle, supporting the high end with a tall box and placing the other end in the pan. Trough represents a steep bedrock slope.
o Pack dampened sand mixture tightly in the upper end of the trough, as shown. Sand represents loose sediment on the slope.
o Monopoly houses can be placed on the sediment and out on the ‘flat land’ of the pan to represent a community.
3. Slowly and gently pour water (representing rainfall) onto the sand at the top of the trough. Pause regularly to observe results.
4. Clean out the pan and refill the trough with more damp sand and repeat. Try different slope angles and observe the results.
Observations: See photos
• Sand does not move until additional water is added (saturation).
• Much of the water sinks into the sand, moves through it and emerges at the lower end.
• The lower end of the sand becomes totally saturated and begins to move.
• Concave tension cracks may develop on the surface near the lower end, followed by a complete collapse of a saturated ‘block’ of sediment which then flows downslope in a slurry of wet mud. This action is repeated sequentially as the failure scarp moves back upslope. The flow may assume a lobate shape.
• Once it starts, the debris flow moves quickly.
• If addition of water stops, the landslide slows or stops. This is a laboratory case. In reality, the landslide is not so closely controlled by the rainfall of the moment.
• The debris flow stops at the break of slope, forming a fan-shaped landform. Some size sorting of the sediment may be visible. Concentric ridges may form on the fan.

page 43Science.gc.ca Activity Book 6
Note: Results may vary depending on the angle of slope and the texture of sediment. If the sediment is very cohesive, like clay, water may flow downslope on the surface or between the packed sediment and the trough wall. If the sand is too dry at the start, water may only wet the surface layer and flow on the surface. If the slope angle is too low, water may flow on the surface. All the above would create a model of a fluvial system with little or no landsliding. On the other hand, if the slope angle is very high, a different type of landslide will occur. This type, known as a ‘translational slide’, moves as a more-or-less intact body, sliding on the underlying hard substrate.
Demonstration of a debris flow

page 44Science.gc.ca Activity Book 6
Movement of a model debris flow:
1. Failure does not start at the top of the slope.
2. The top of the debris flow retrogresses upslope. Debris forms a fan at the bottom.
3. Most sediment has flowed downslope.
4. Close-up of a failure scarp (arrow) as a block begins to move as a mud slurry.
5. Separation and movement of a large mass.
page 45Science.gc.ca Activity Book 6
Canadian Space Agency
8 The Formation of our Solar System
This hands-on activity examines the Solar Nebular Theory as the solar wind begins to blow. Using materials to represent elements in the interstellar dust cloud, students will develop a model of how the solar system formed and will begin to compare characteristics of the planets.
Hypothesis Phase• Introduce the activity by presenting the Solar Nebula Theory to students.
• Divide class into groups of 4-5 students.
• Give the groups time to discuss the information presented and develop a hypothesis statement about interaction of the solar wind and the interstellar dust cloud. Students should propose an explanation to support their prediction.
The Solar Nebula Theory is the most widely accepted hypothesis of the formation of our solar system. According to the theory, the Sun and planets were formed from a giant rotating cloud of interstellar dust and gas. Scientists believe that billions of years ago the centre of the spinning cloud collapsed in on itself, forming the Sun, with the remaining orbiting matter taking the shape of a spinning disk.
When the Sun burst on the scene at the centre of our solar system so did the solar wind. It was so strong that some of the matter was pushed out beyond the snow line of our solar system. The snow line, roughly in the middle of the asteroid belt, is the point where temperatures are cold enough for gases to become liquid and icy water. It can be compared to the snow line on a mountain on Earth where liquids are permanently in the form of snow and ice due to the extreme cold.
Questions to consider:
What type of matter blew away? What elements stayed closer to the Sun? What was the overall effect on the characteristics of the planets?

page 46Science.gc.ca Activity Book 6
Experiment Phase• Students will conduct a simple experiment to test their hypothesis.
• If space is limited, create a solar wind simulation area in the class room and have groups take turns running their simulation.
• It is recommended to test the position of the fan and elements as well as the duration of the “solar wind” prior to conducting the activity in-class.
Materials• Solar Wind Simulator
• Fan (8-10 inch diameter)
• Interstellar Cloud
• Materials to represent the heavier elements in the cloud (4) – pebbles, marbles, beads
• Materials to represent the lighter elements in the cloud (4) – fluffy cotton balls, pompoms
• Roll of paper (white or brown Kraft paper at least 60cm wide)
• Colour markers (at least 4)
Procedure1. Roll out a swatch of paper (approximately 3 meters) along the floor and place heavy objects on the corners
to hold it in place.
2. Position the solar wind simulator at one end of the paper and draw a circle around it. This represents the Sun.
3. Mix the elements of the interstellar cloud and position the materials in front of the fan.
4. Turn on the solar wind simulator for 10 seconds.
5. Use different colour markers to circle the resting place of the elements and create a legend to identify heavy versus light elements in your diagram.
6. Record observations.
page 47Science.gc.ca Activity Book 6
Analysis PhaseTo complete the analysis phase, students should:
• Describe the distribution of the interstellar cloud elements as a result of the solar wind simulation
• Determine if their ‘solar system’ is in line with the actual solar system
Conclusion PhaseBased on the analysis of the experiment, students should conclude that the heavier elements remained closer to the Sun while the lighter elements were blown away.
The presence of the solar wind during the formation of the solar system is one of the most plausible theories to explain why the gas giants, made from lighter gases such as hydrogen and helium, are further away from the sun and the smaller terrestrial planets, made of heavier elements, are positioned closer to the Sun.
Here is how scientists explain this phenomenon:
When the solar wind began to blow, the lighter elements orbiting the newly formed star were pushed into the far reaches of the solar system while the remaining heavier elements stayed closer to the Sun and went on to form the rocky planets of the inner solar system – Mercury, Venus, Earth, and Mars. When the lighter dust and gas molecules reached the outer solar system, beyond the snow line, the solar winds became too weak to keep pushing the light elements away from the Sun. At this point the dust and gases condensed into liquid and ice crystals to form the planets known as the gas giants – Jupiter, Saturn, Uranus, and Neptune.

page 48Science.gc.ca Activity Book 6
Health Canada
9 UV Radiation and CloudsCloud cover can greatly affect the amount of UV radiation received at the earth’s surface.
Scattered clouds reflect UV, increasing the amount of UV radiation reaching the Earth’s surface.
Mainly cloudy conditions partly reduce UV transmission.
Heavy overcast conditions greatly reduce UV transmission.
UV Index Adjustment for Cloud and PrecipitationType Factor % UV
Scattered Clouds 1.1 +10% (transmitted)
Hazy 0.9
Mainly cloudy with/without precipitation 0.7 -30% (absorbed)
Cloudy 0.6 -40% (absorbed)
Cloudy with/without precipitation 0.4
Overcast 0.3
Heavily overcast with/without rain/drizzle 0.2 -80% (absorbed)
Note: The factor shown is determined by statistical analysis of weather effects.

page 49Science.gc.ca Activity Book 6
Questions:1. Complete the chart. What relationship do you see between cloud type and UV filtration?
2. From your knowledge of science, in what ways could water vapour or droplets affect the amount of UV radiation reaching the earth’s surface?

page 50Science.gc.ca Activity Book 6
Environment Canada
10 Make a Rain GaugeMaterials
• A plastic 2-litre pop bottle with straight sides
• Ruler at least 15 centimetres in length
• Scissors
• Stones or large gravel
• Clear tape
• Water
Method1. Cut the bottle about 10 centimetres from its top. Save the top part.
2. Place stones or gravel in the bottom of the bottle until they fill the little bumps in the bottom and come up to the part of the bottle where the sides are straight. This will add weight to the gauge to make it more stable.
3. Tape the ruler to the side of the bottle so that the zero mark on the ruler is a centimetre or two above the stones.
4. Pour enough water into the bottle so that the water level is at the zero mark on the ruler.
5. Take the top of the bottle (the part you cut off earlier), turn it upside down, and put it into the bottom portion so that it looks like a funnel.
6. Set your gauge in an open area away from trees or buildings, which may affect the amount of rain that falls into the bottle.
page 51Science.gc.ca Activity Book 6
7. When it has rained, take a reading using the ruler taped to the side of the bottle. Then pour out the excess water until the water level is once again at zero. (If you pour out too much water, simply add more until the water level again reaches zero on the ruler.)
Points to discussIf you leave your rain gauge out in the sun for a day, be sure to check the gauge as some of the water may evaporate. If that happens, just add water until the level is at zero again.
As a further exercise, you may want to tape a coffee filter into the funnel part of the gauge to collect any particles that fall into the gauge. The rainwater will drip through the filter and into the bottle eventually. You can then look at the filter through a microscope and see what it captured.

page 52Science.gc.ca Activity Book 6
Natural Resources Canada
11 The Rock CycleThe illustration in this activity depicts the rock cycle. Insert the terms, in the correct box to better understand how geological processes generate materials that eventually become the three main rock types.
1. High-grade metamorphic rock and igneous rock
2. Magma
3. Low-grade metamorphic rock
4. Sedimentary rock
5. Sediments
6. Granite
7. Dyke
8. Sill
9. Intrusions
10. Lava
11. Ash
12. Volcanism
13. Subsidence
14. Transportation
15. Uplift
16. Weathering and erosion
17. Deposition

page 53Science.gc.ca Activity Book 6
Credit: illustration - S. Colman-Sadd

page 54Science.gc.ca Activity Book 6
Agriculture and Agri-Food Canada
12 A Tasty Experiment!This experiment has two parts… And even if you don’t get the first one, the second one is delicious!
The experiment consists in growing sweet potatoes, Jerusalem artichokes or potatoes.
Materials• A sweet potato bought at the grocery store (or Jerusalem artichoke or potato) in the spring and on which
there is at least one small bud;
• A five-gallon bucket;
• A 35-L bag of earth (or a 40-L bag, if that’s all there is);
• The spring and summer sun (hardly optional!).
InstructionsIt’s so easy! First, weigh all of the materials on a scale. With a pencil, record the weight on a sheet of paper you will leave close to the bucket, but out of the rain.
Pour one third to one half of the earth in the bucket, plant the sweet potato (or Jerusalem artichoke or potato), and water sufficiently.
As the plant grows, add more earth to the bucket. Remember to water the plant if, to the touch, the top two centimetres of earth is dry.
At the end of the summer, weigh all the materials on the scale again, and record the weight.

page 55Science.gc.ca Activity Book 6
What do you observe?To what is the difference in weight due? Is it perhaps simply the water you added? It can’t be the earth you added, since you weighed everything before starting…
So, what caused the difference? Might there be something in the air that combined with the plant like Lego, to make it so heavy?
Now begins the second part. Make sure the earth isn’t soaked. Pull the stalk with all of its leaves and put it on the compost pile. Bring the bucket indoors, preferably to the basement. You now have your own supply of sweet potatoes (or Jerusalem artichokes or potatoes) to last you till winter… maybe!

page 56Science.gc.ca Activity Book 6
Natural Resources Canada
13 Tsunami DemonstrationDescription A short lab demonstration of tsunami waves.
Materials• large basin of water
• wax crayon
• several corks
• rock to represent a meteorite
• bag of marbles
Teacher instructions and notes:1. Fill a large basin with water to half its depth. Draw a line around the inside of the container at water level to
represent ‘sea level’. Float several corks in the water. Corks help to show the wave motion.
2. To simulate a tsunami caused by a meteorite landing in the ocean, drop a rock into the basin and watch the ripples (tsunami waves) move outward from the impact site.

page 57Science.gc.ca Activity Book 6
3. To simulate a tsunami caused by a landslide, hold the mouth of a bag full of marbles at water level. Quickly release the marbles into the water, simulating the submarine movement of a landslide.
4. It is harder to simulate an earthquake, but sharply hitting the basin can create a wave that will slosh up on one side of the basin.
5. Have the students observe the simulation or simulations.
6. Divide the students into small groups and allow them to produce their own tsunamis.
7. Have the students draw the waves that are generated in their experiment and summarize their observations in a brief written or oral report.
page 58Science.gc.ca Activity Book 6
Canadian Space Agency
14 “Make Before Break”Try this activity to discover some of the challenges astronauts face while working in space!
This activity illustrates the “make before break” strategy used in all Extravehicular Activity (space-walk)/Payload operations in space. “Make before break” means that whenever a tethered person or payload is moved from one location to another, one must always make a secure connection at the new location before one can break the connection at the original location. This insures that any item that has the potential to drift free is always tethered.
Concept1. Students’ desks are arranged in groups or “clusters”.
2. The students will have various tasks to perform, requiring them to move from group to group.
3. A student cannot move to another group unless the student is tethered at all times.
4. A tether must only be long enough to reach an adjacent group, but not long enough to reach other groups.
Equipment needed1. Tethers made from lengths of light nylon cord (each about 2m long).
2. 2 buckles for each tether, one at each end (with spring clips).
3. 1 sturdy (immovable) anchor point for each student group. (TIP: Used 4L paint cans, filled with dry sand or gravel and with their lids hammered on make good objects to use as anchor points)

page 59Science.gc.ca Activity Book 6
ProcedurePrepare the following materials.
1. Make up sheets of paper (enough for each group) with the words “Solar Panels” written on them.
2. Repeat step one with pages for
a. Food Supply.
b. Life Support Equipment.
c. Scientific Equipment.
d. Rocket Fuel.
e. Habitation Modules.
f. Communications Equipment.
g. Emergency Equipment.
3. Give one set of each of the pages to each group. In other words, one group gets all the “Solar Panel” pages, another group gets all the “Food Supply” pages and so on, so that each group has a monopoly on a specific resource.
4. Give each group two tethers.
ChallengeTo assemble a space station.
1. Decide, as a class, the basic items required to build the space station.
2. Each group must collect (from the other groups) the items needed to complete their space station.
3. VERY IMPORTANT Review the strategy and tether protocol outlined below. It is essential that everyone understand the rules.
4. Strategy:
a. No more than three persons can be standing (call this “in EVA mode”) at any one time.
b. Resources must be collected directly from their source. i.e. They cannnot be passed from group to group.
c. Tethers between groups can never cross.
d. The “Make Before Break” rule must be adhered to at all times. No exceptions.

page 60Science.gc.ca Activity Book 6
ConclusionWhen all space stations have been completed discuss;
1. any problems that may have arisen.
2. possible solutions to such problems.
3. how you might design a safety protocol that you could apply to make this construction simulation safer and more efficient.
TIP: The number of resources can be modified to suit the number of groups in the activity.
Also, this activity can be modified in many ways. For example, it might be combined with an art class whereby each group builds models of the resource package and they are “delivered” to a single group for assembly.