welcome to asu team training
DESCRIPTION
Welcome to ASU Team Training. Session Objectives As a result of this session, participants will be able to:. describe the history & philosophy of continuous improvement. Session Objectives As a result of this session, participants will be able to:. - PowerPoint PPT PresentationTRANSCRIPT

Welcome to ASU Team Training
describe the history & philosophy of continuous improvement
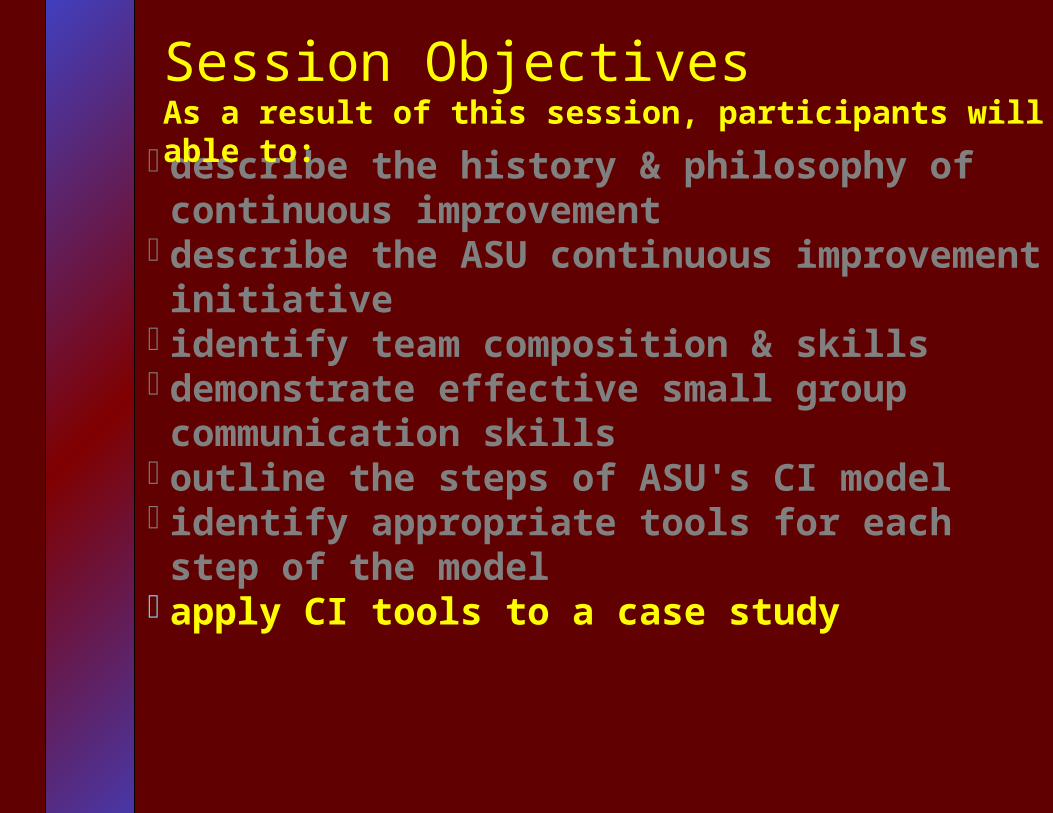
Session ObjectivesAs a result of this session, participants will be able to:
describe the history & philosophy of continuous improvement
describe the ASU continuous improvement initiative
Session ObjectivesAs a result of this session, participants will be able to:

describe the history & philosophy of continuous improvement
describe the ASU continuous improvement initiativeidentify team composition & skills
Session ObjectivesAs a result of this session, participants will be able to:
describe the history & philosophy of continuous improvement
describe the ASU continuous improvement initiativeidentify team composition & skillsdemonstrate effective small group communication
skills
Session ObjectivesAs a result of this session, participants will be able to:

describe the history & philosophy of continuous improvement
describe the ASU continuous improvement initiativeidentify team composition & skillsdemonstrate effective small group communication
skillsoutline the steps of ASU's CI model
Session ObjectivesAs a result of this session, participants will be able to:
describe the history & philosophy of continuous improvement
describe the ASU continuous improvement initiativeidentify team composition & skillsdemonstrate effective small group communication
skillsoutline the steps of ASU's CI modelidentify appropriate tools for each step of the model
Session ObjectivesAs a result of this session, participants will be able to:
describe the history & philosophy of continuous improvement
describe the ASU continuous improvement initiativeidentify team composition & skillsdemonstrate effective small group communication
skillsoutline the steps of ASU's CI modelidentify appropriate tools for each step of the modelapply CI tools to a case study
Session ObjectivesAs a result of this session, participants will be able to:

describe the history & philosophy of continuous improvement
describe the ASU continuous improvement initiativeidentify team composition & skillsdemonstrate effective small group communication
skillsoutline the steps of ASU's CI modelidentify appropriate tools for each step of the modelapply CI tools to a case studyimprove training and materials through feedback
Session ObjectivesAs a result of this session, participants will be able to:

contribute actively
encourage creativity
improve how group works as team
be on time
support CI process
keep records of work
all decisions by consensus
maintain confidentiality on sensitive issues
listen to others
be prepared for meetings
have fun
Code of Cooperation (sample)
Team
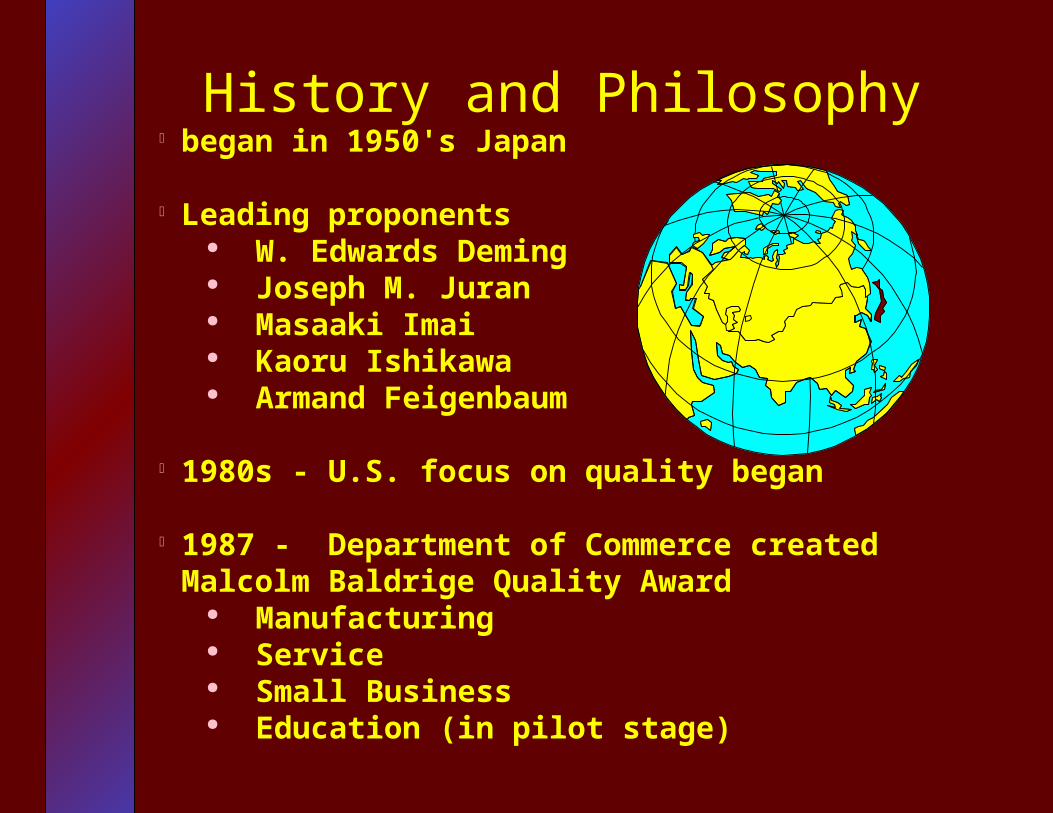
History and Philosophy began in 1950's Japan
Leading proponents W. Edwards Deming Joseph M. Juran Masaaki Imai Kaoru Ishikawa Armand Feigenbaum
1980s - U.S. focus on quality began
1987 - Department of Commerce created Malcolm Baldrige Quality Award
Manufacturing Service Small Business Education (in pilot stage)
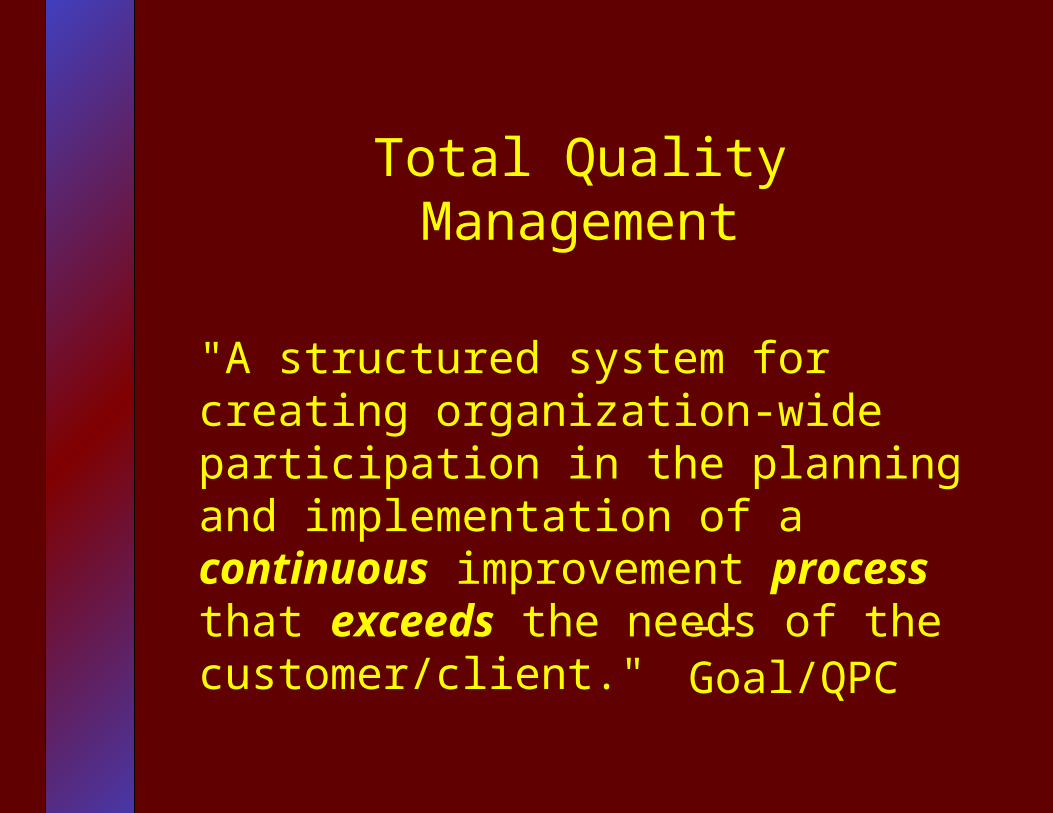
Total Quality Management
"A structured system for creating organization-wide participation in the planning and implementation of a continuous improvement process that exceeds the needs of the customer/client."
-- Goal/QPC

Key Elements
dedication tocustomer satisfaction
organizational philosophy & set of values
teamwork
continuous incremental improvement
commitment to employee development
management commitment and involvement at all levels
integrated with strategic planning
focus on processes & systems
decisions based on fact
recognition

CI is..... CI is not......
management philosophy/operating methodology
breakthrough thinking
structured, disciplined approach; identifying & solving problems; institutionalizing improvements gained
conveyed by actions of management
long term
supported by statistical tools
permanent solution/way of life
a new program
same old way
fire fighting
conveyed by slogans
short term
driven by statistical tools
a quick fix
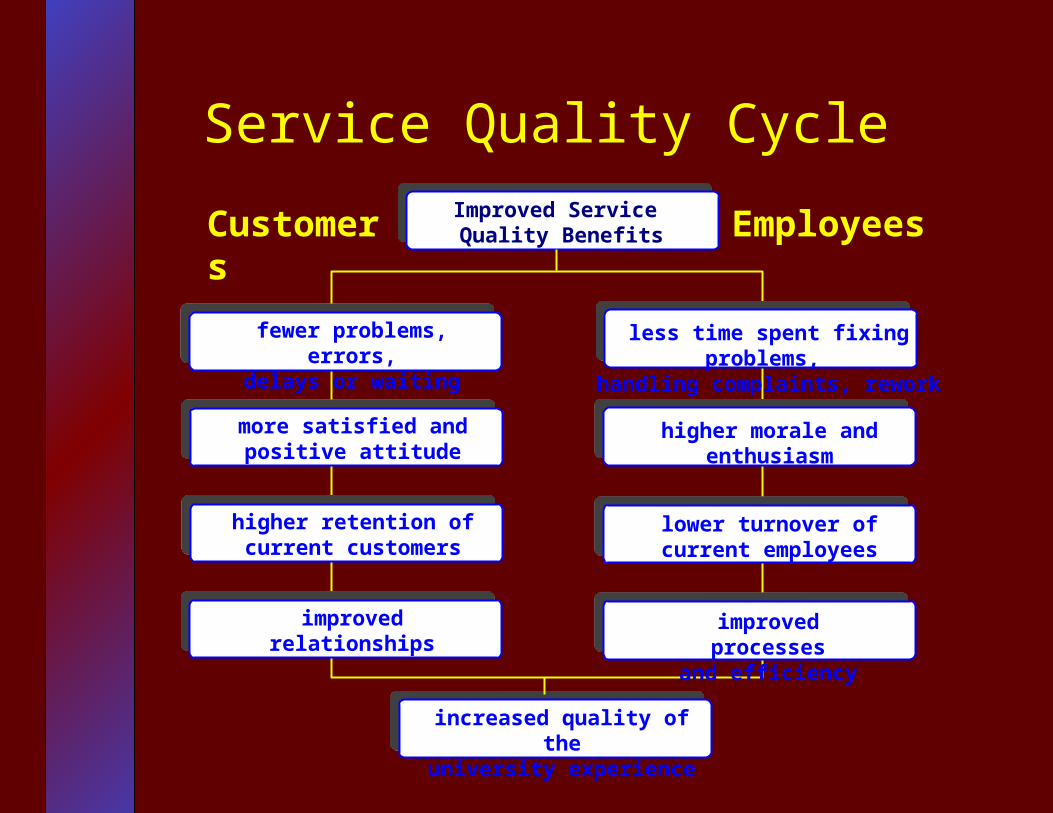
Service Quality Cycle
fewer problems, errors,delays or waiting
more satisfied andpositive attitude
higher retention ofcurrent customers
improvedrelationships
less time spent fixing problems, handling complaints, rework
higher morale andenthusiasm
lower turnover ofcurrent employees
improved processesand efficiency
increased quality of theuniversity experience
Improved Service Quality BenefitsCustomers Employees
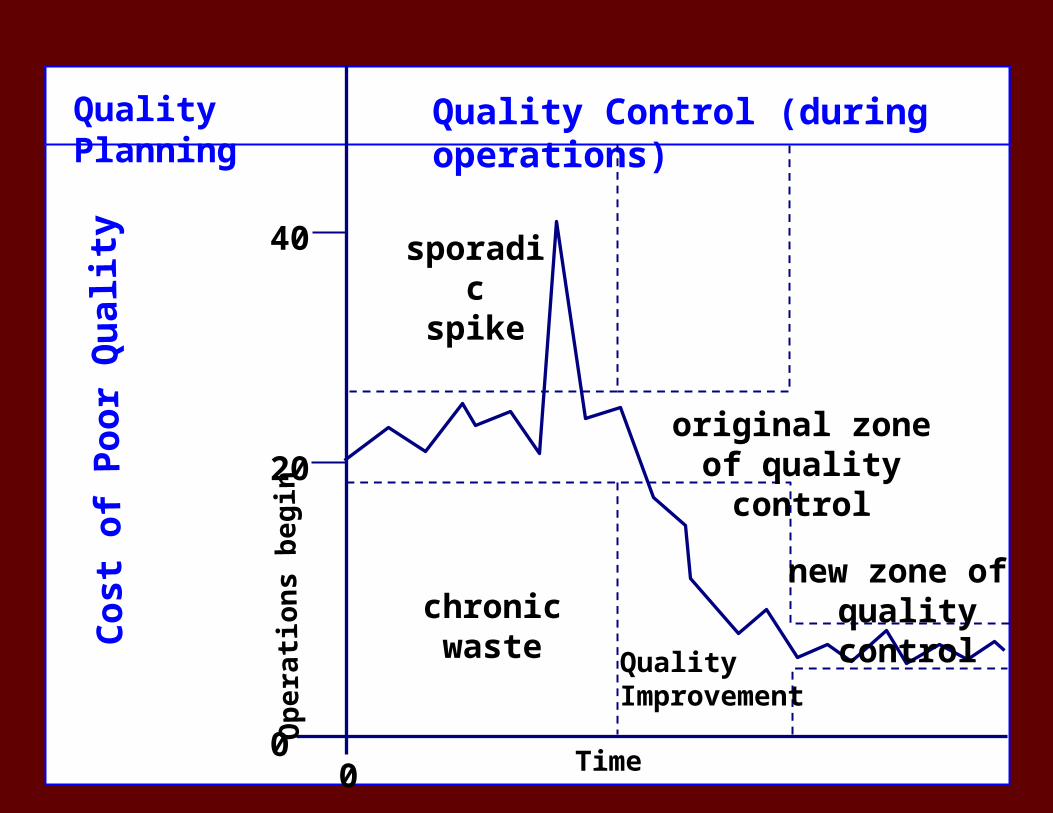
Quality Planning Quality Control (during operations)
40
20
sporadicspike
original zone of quality control
new zone of quality controlchronic waste
Cos
t of
Poo
r Q
ual
ity
Quality Improvement
Time
Ope
rati
ons
begi
n
00
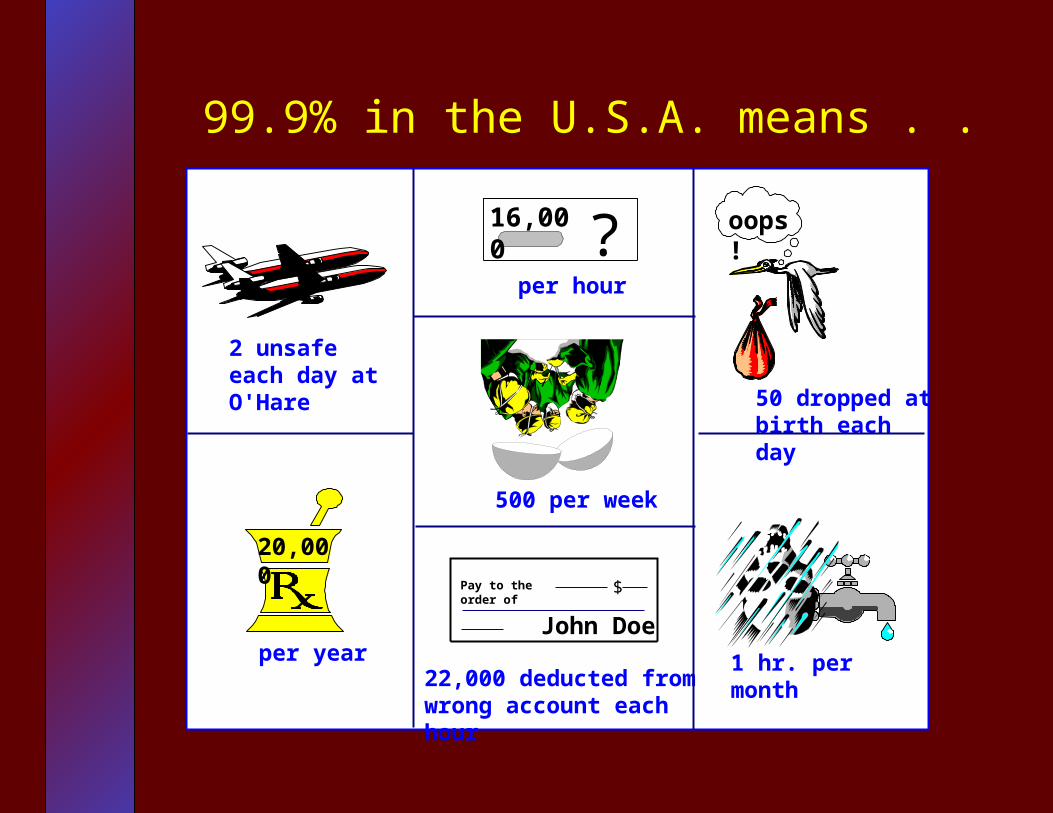
99.9% in the U.S.A. means . .
1 hr. per month
2 unsafe each day at O'Hare
16,000 ?per hour
20,000
per year
500 per week
oops!
50 dropped at birth each day
22,000 deducted fromwrong account each hour
Pay to the order of
John Doe
$

Cost of Quality
Prevention
Appraisal
Internal problems
External problems
efforts to prevent service problems; includes training cost of quality planning, forms to minimize error rates, etc.
evaluation of service; cost of designing/ using measuring instruments, doing audits, time spent evaluating/inspecting
costs associated with errors, omissions, excessive delays incurred in process of delivering the service; rework, redesign, scrap, repair, added handling
costs associated with problems after delivery of service; returns, recalls, and handling complaints.

FINISHED FILES ARE THE RESULT
OF YEARS OF SCIENTIFIC STUDY
COMBINED WITH THE EXPERIENCE
OF MANY YEARS

Continuous Improvement Continuum
Quick Success
StartOver
MajorOverhaul
plan, do, check, act
standardize,just do it!

Continuous Improvement Initiative at ASU
People Involvement

Continuous Improvement Initiative at ASU
People InvolvementBetter Educational Experience for Students

Continuous Improvement Initiative at ASU
People InvolvementBetter Educational Experience for StudentsBetter University Environment for Faculty and
Staff

Continuous Improvement Initiative at ASU
People InvolvementBetter Educational Experience for StudentsBetter University Environment for Faculty and
StaffBest Ideas and Suggestions
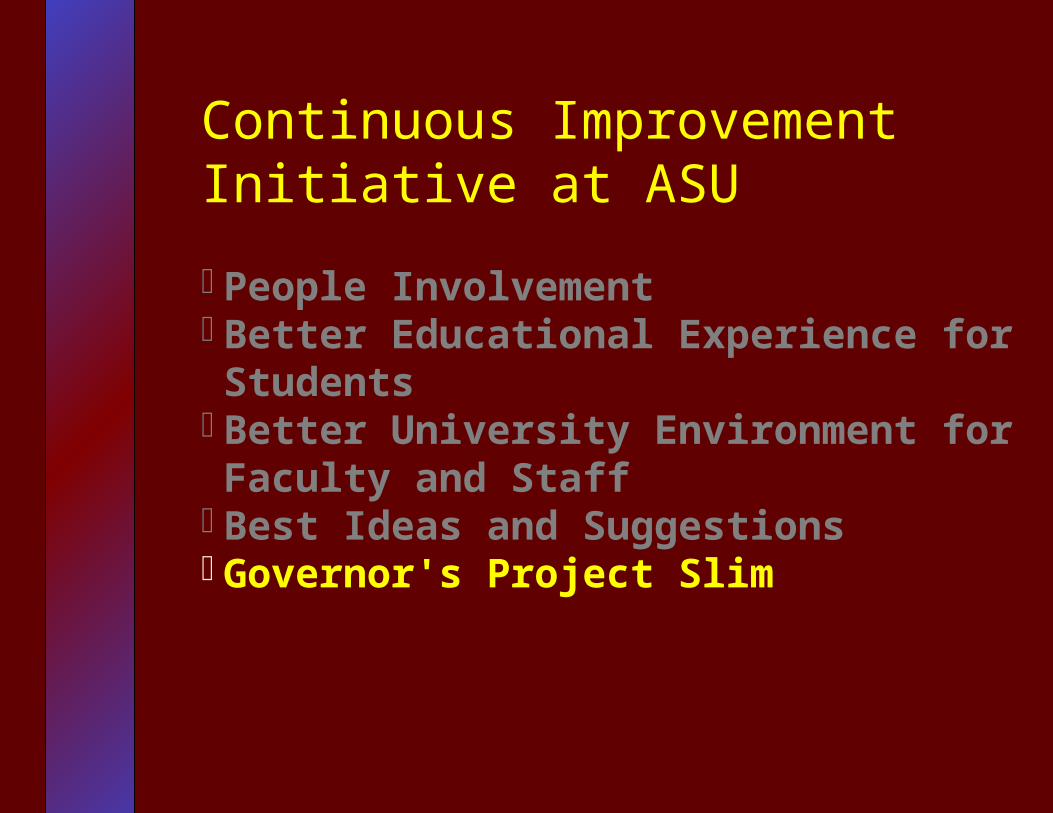
Continuous Improvement Initiative at ASU
People InvolvementBetter Educational Experience for StudentsBetter University Environment for Faculty and
StaffBest Ideas and SuggestionsGovernor's Project Slim
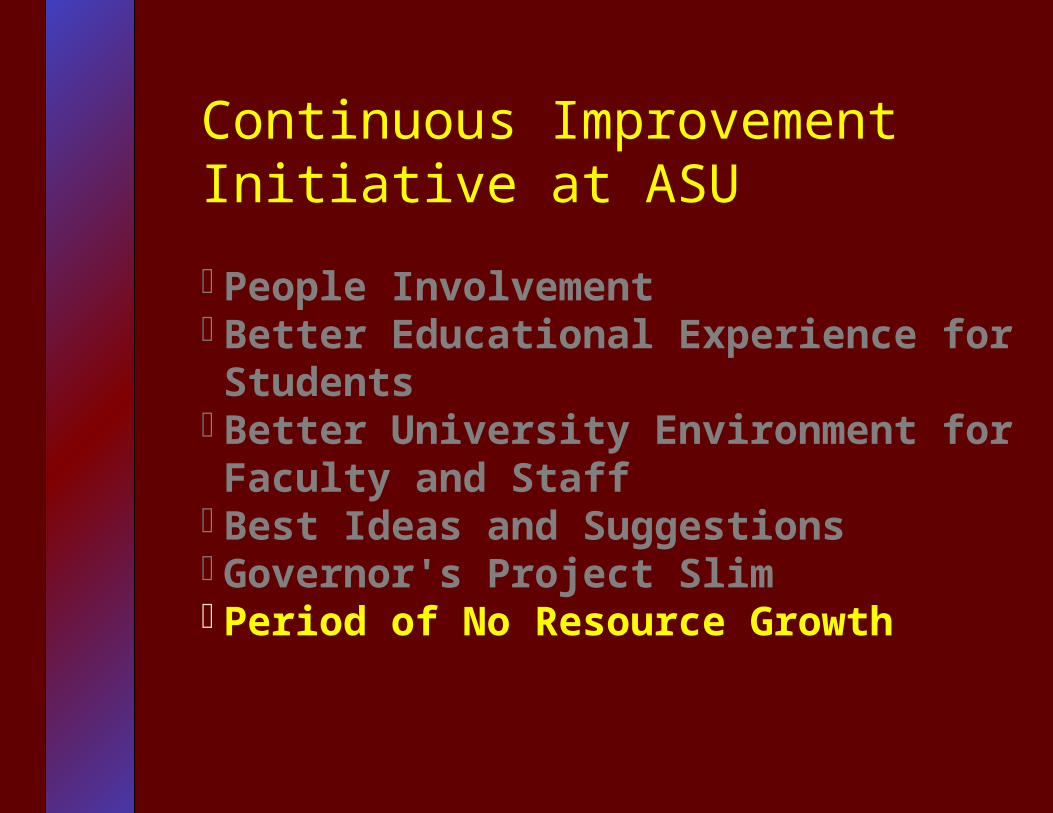
Continuous Improvement Initiative at ASU
People InvolvementBetter Educational Experience for StudentsBetter University Environment for Faculty and
StaffBest Ideas and SuggestionsGovernor's Project SlimPeriod of No Resource Growth

Continuous Improvement Initiative at ASU
People InvolvementBetter Educational Experience for StudentsBetter University Environment for Faculty and
StaffBest Ideas and SuggestionsGovernor's Project SlimPeriod of No Resource GrowthDesire for Change

ASU's CIOrganization Structure
ASU Council for Continuous
Improvement Initiatives
Campus Improvement Committees
CI StaffTechnical
Advisory Group
Teamsmembersleader
facilitatorsponsor

CITeams
defined roles, clear expectations
fix the process, not the people
analyzed problems, planned solutions
major owners, regardless of rank
improving process/addressing needs of customers is only reason for team

Team Definitions
Perpetual Work Teams: Natural work teams, organized around processes, that continually solve problems and improve processes.
Process Improvement Teams: Teams that are comprised of members that stretch across process boundaries that work to improve the whole process.

Team Definitions (cont'd)
Project Teams: Teams with a specific and finite mission to develop something new or accomplish a large and complex task.
Virtual Teams: Teams that come together as an issue or problem arises, such as a new opportunity team.

ci
teamteam leader facilitatorowners of processregardless of job titlemembers selected, not volunteers
can be selectedby teamcan be supervisorresponsible forthe processcommunicates with sponsor
helps use toolsoutside work unithelps communicationskillsworks closely withteam leader
sponsorauthority to make changesensures resource availability
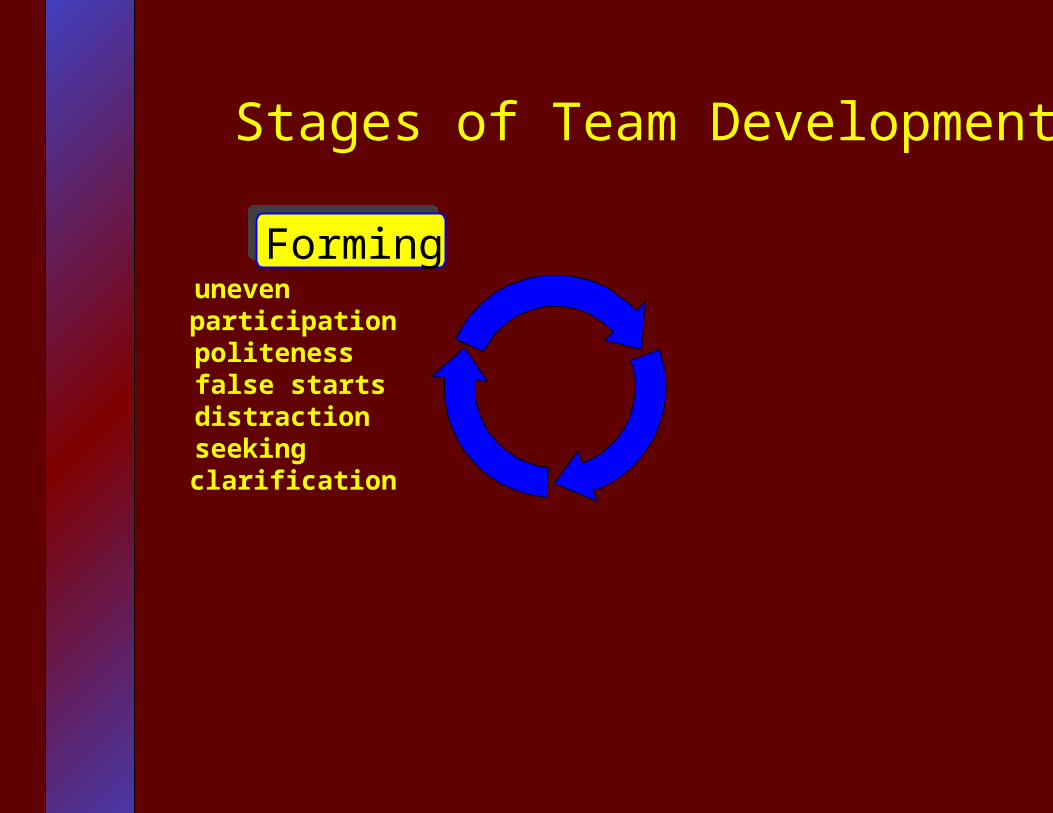
Stages of Team Development
Forminguneven participationpolitenessfalse startsdistractionseeking clarification
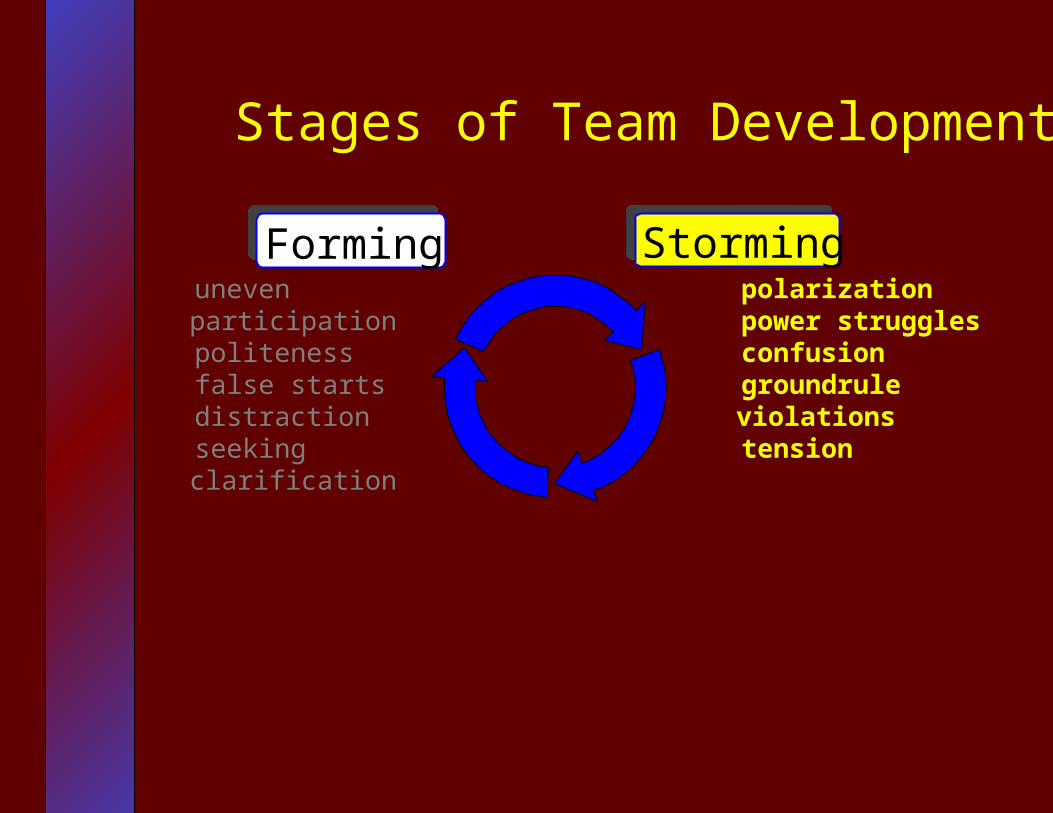
Stages of Team Development
Forming Stormingpolarizationpower strugglesconfusiongroundrule violationstension
uneven participationpolitenessfalse startsdistractionseeking clarification

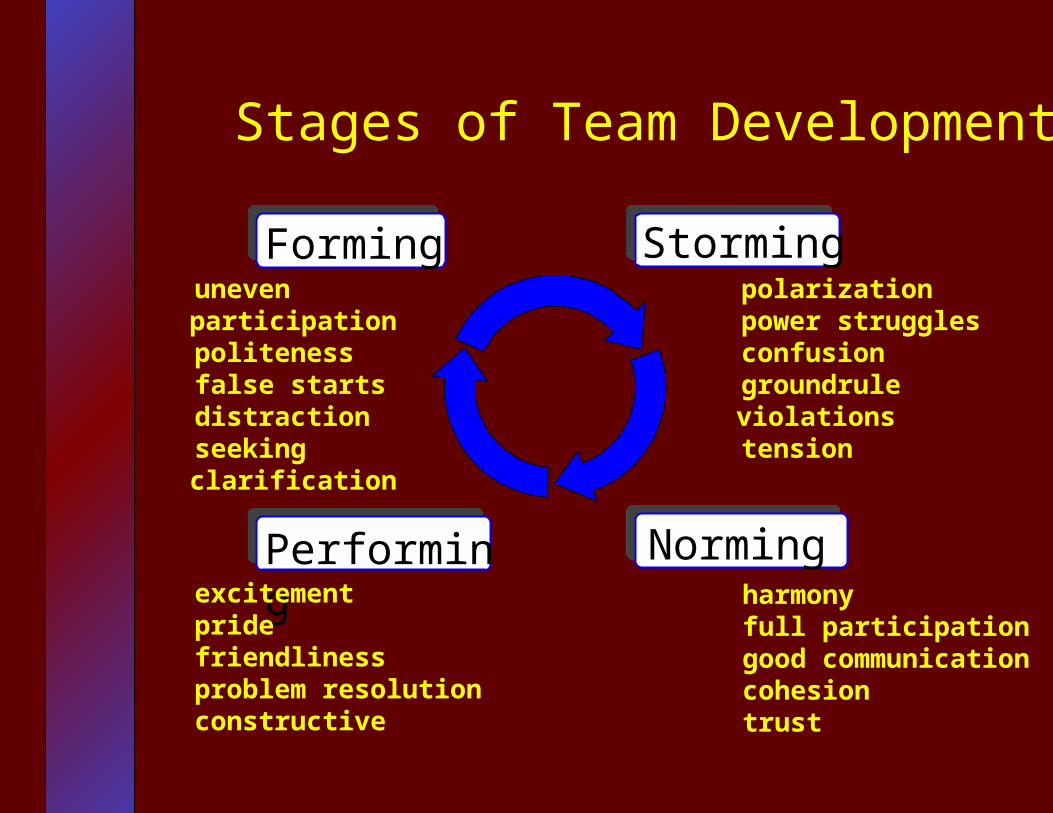
Stages of Team Development
Forming Storming
Norming
polarizationpower strugglesconfusiongroundrule violationstension
harmonyfull participationgood communicationcohesiontrust
uneven participationpolitenessfalse startsdistractionseeking clarification
Stages of Team Development
Forming Storming
NormingPerforming
polarizationpower strugglesconfusiongroundrule violationstension
harmonyfull participationgood communicationcohesiontrust
uneven participationpolitenessfalse startsdistractionseeking clarification
excitementpridefriendlinessproblem resolutionconstructive

use "I" statements
Communication Skills
Team

use "I" statements
avoid jargon
Communication Skills
Team
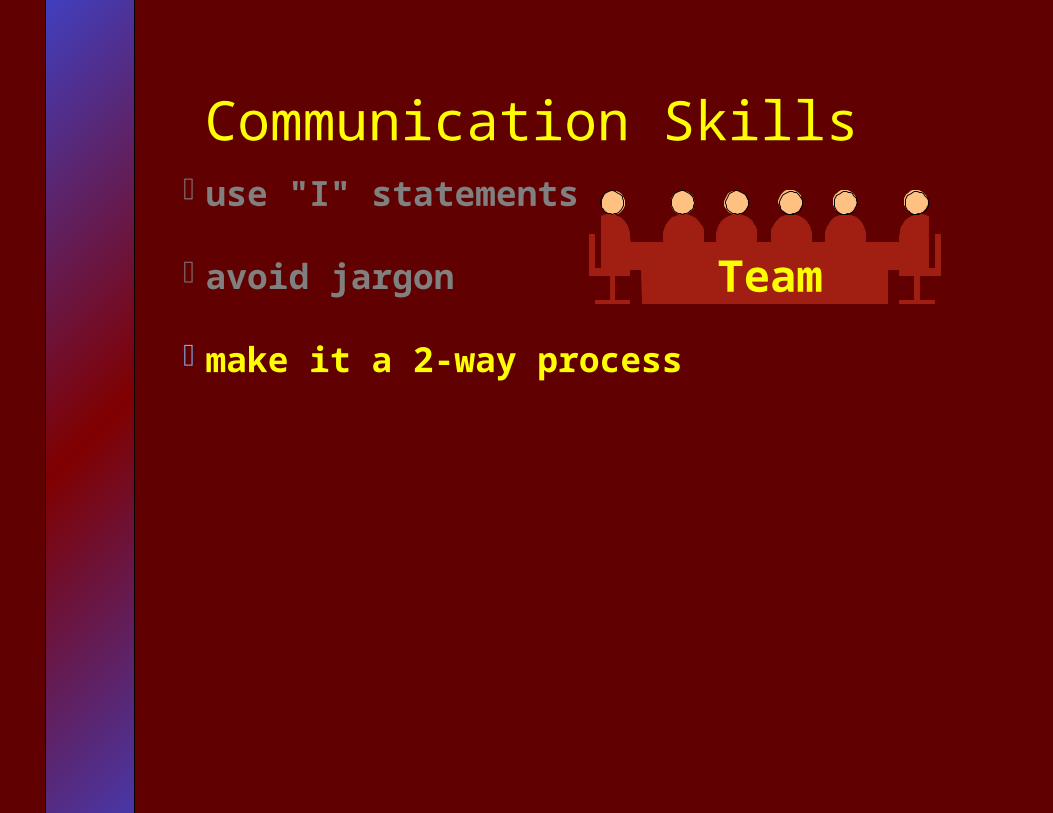
use "I" statements
avoid jargon
make it a 2-way process
Communication Skills
Team
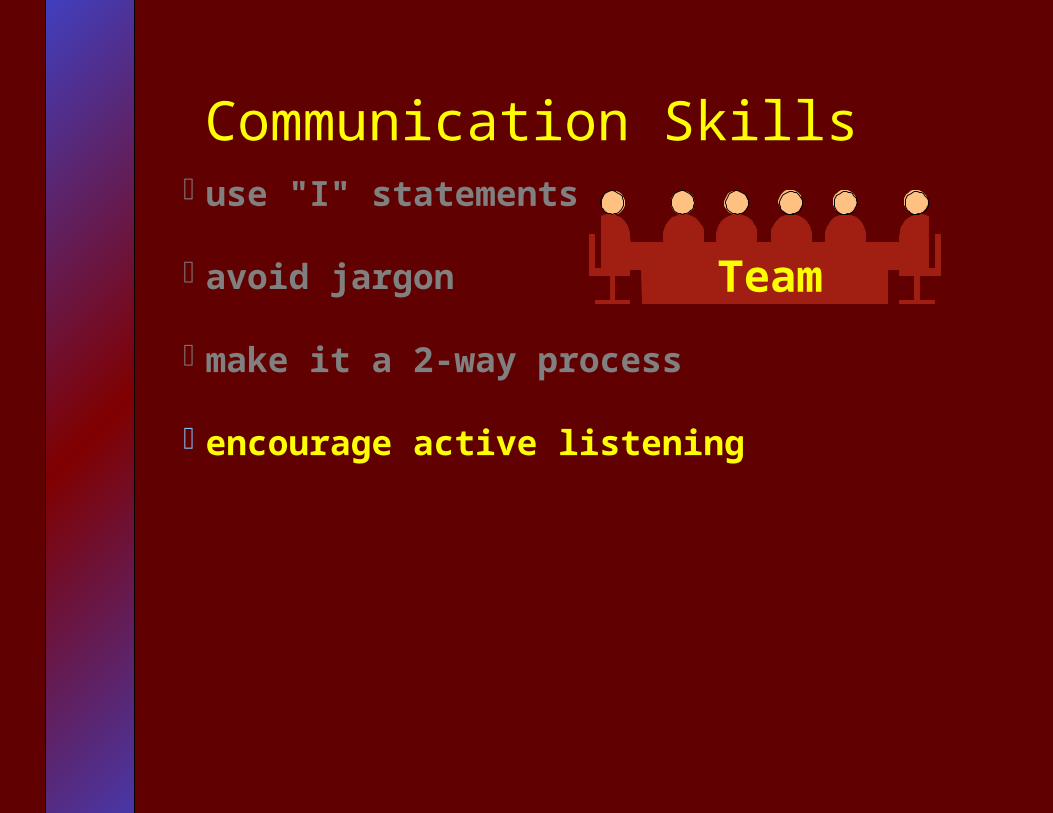
use "I" statements
avoid jargon
make it a 2-way process
encourage active listening
Communication Skills
Team

use "I" statements
avoid jargon
make it a 2-way process
encourage active listening
have a clear idea of what you wish to accomplish in communicating
Communication Skills
Team
use "I" statements
avoid jargon
make it a 2-way process
encourage active listening
have a clear idea of what you wish to accomplish in communicating
recognize we all filter information through our own history, experiences and beliefs
Communication Skills
Team
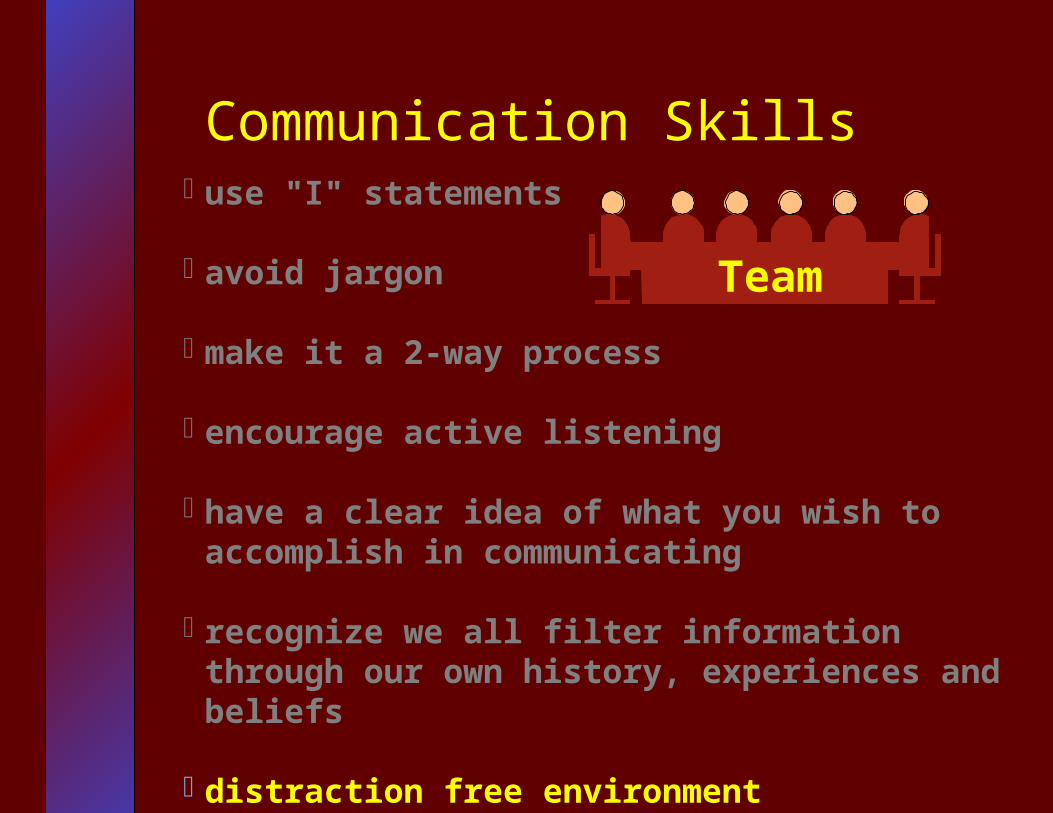
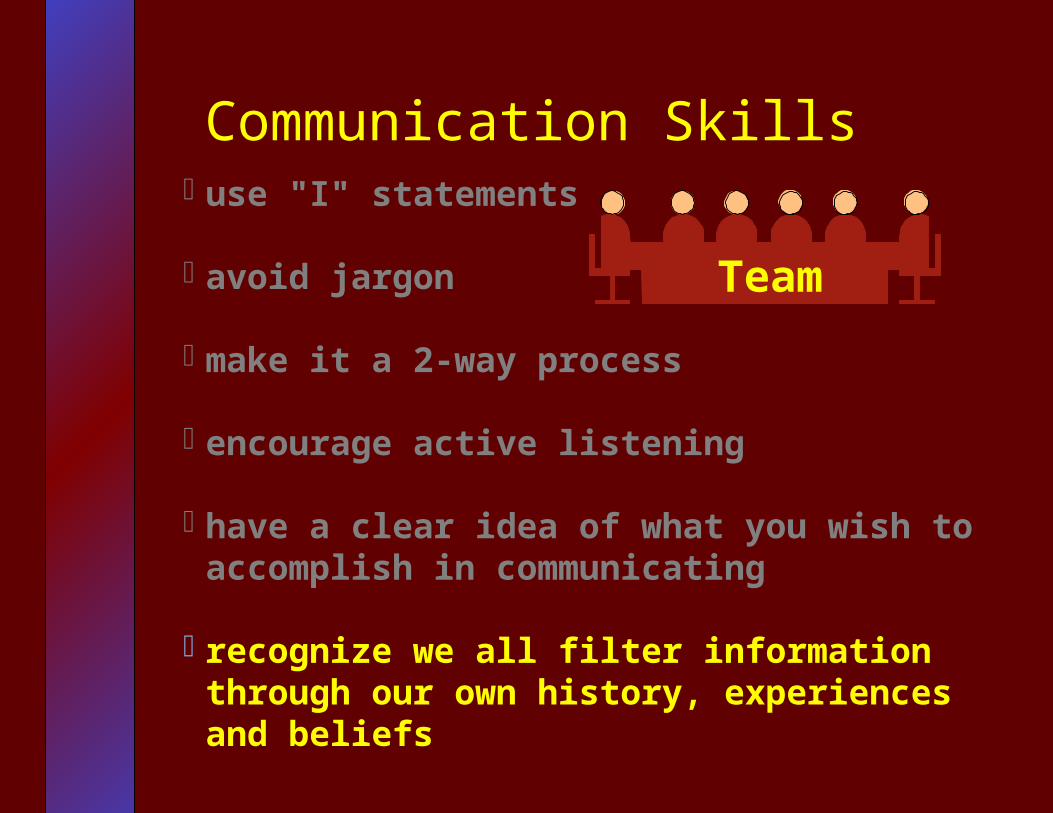
use "I" statements
avoid jargon
make it a 2-way process
encourage active listening
have a clear idea of what you wish to accomplish in communicating
recognize we all filter information through our own history, experiences and beliefs
distraction free environment
Communication Skills
Team

Decision Making Continuum
unilateral unanimity consensus


Welcome to ASU Team Training
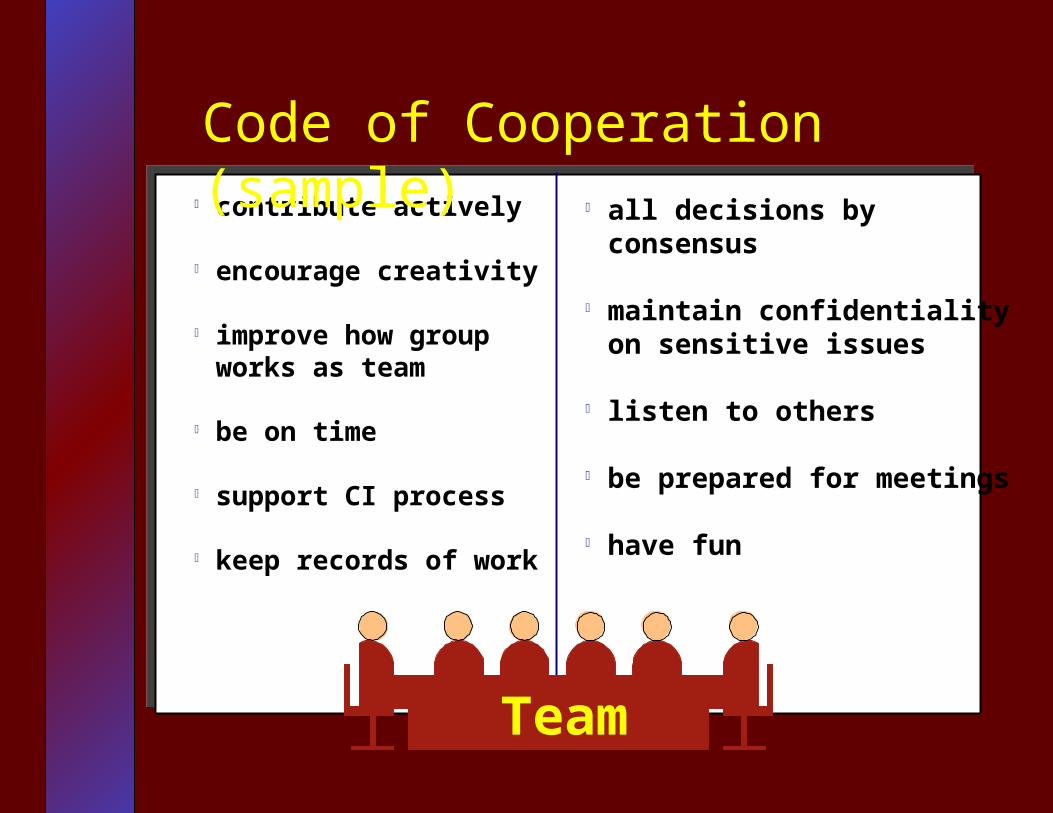
contribute actively
encourage creativity
improve how group works as team
be on time
support CI process
keep records of work
all decisions by consensus
maintain confidentiality on sensitive issues
listen to others
be prepared for meetings
have fun
Code of Cooperation (sample)
Team

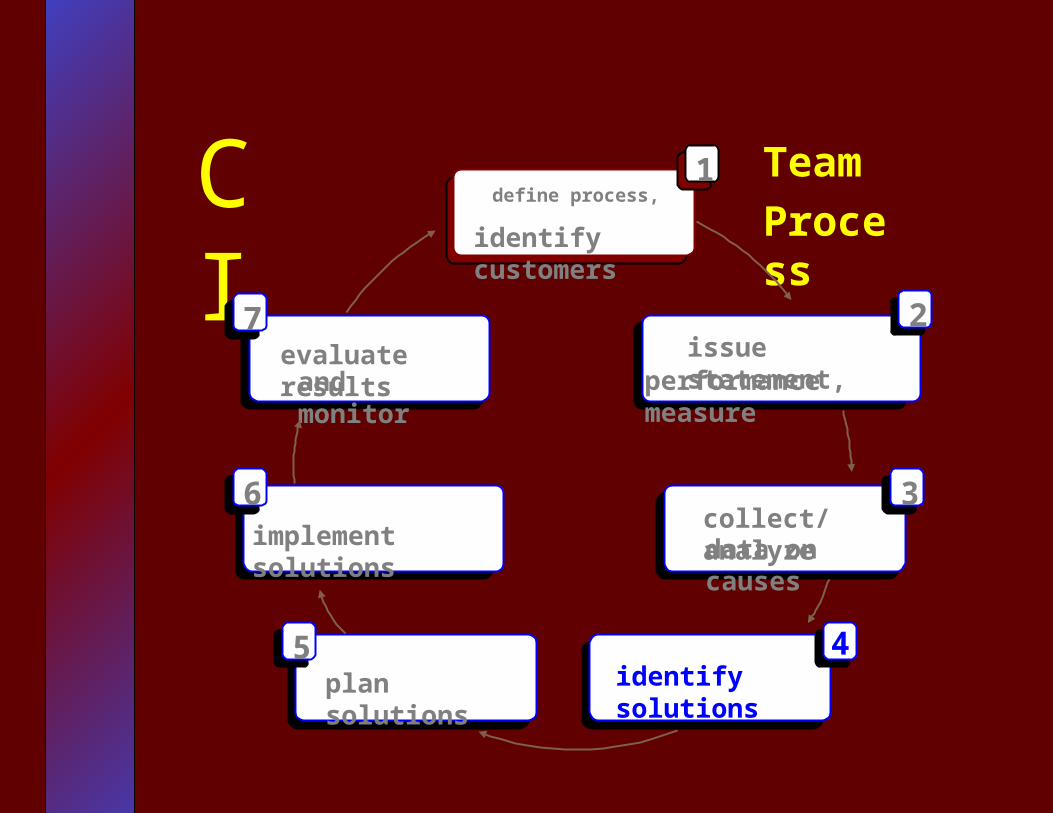
define process,
identify customers
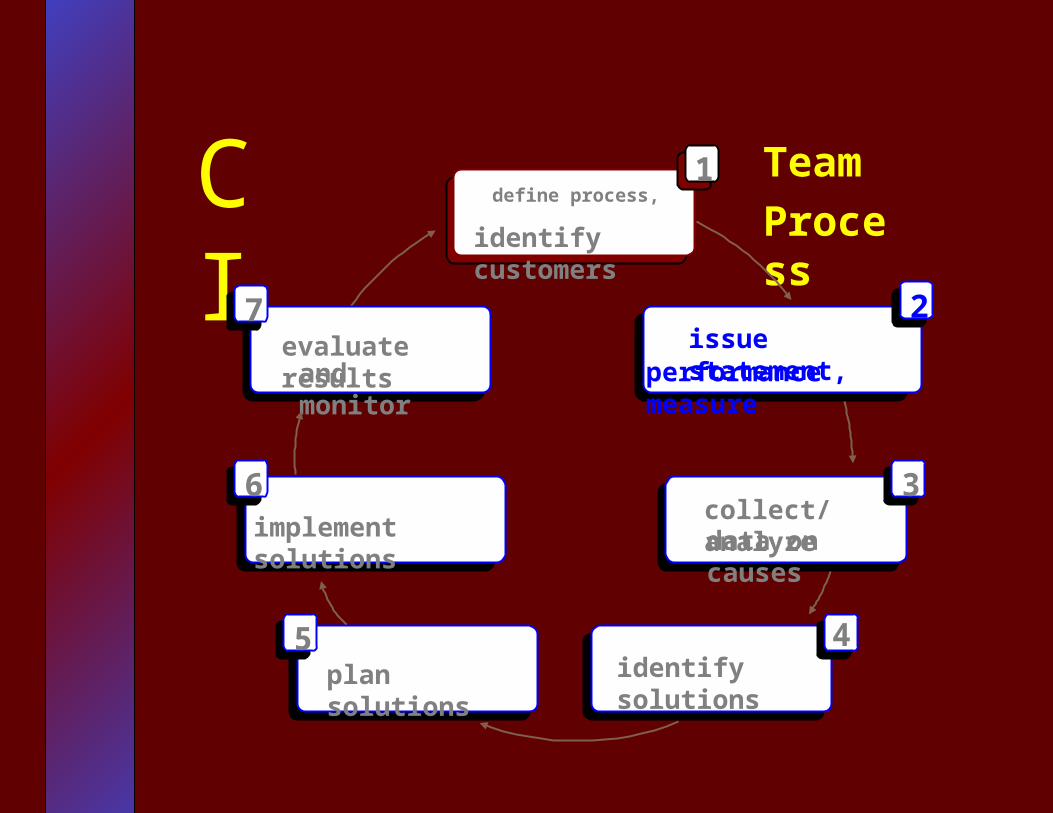
CI Team
Process1
issue statement,performance measure
collect/analyzedata on causes
identify solutionsplan solutions
implement solutions
evaluate results and monitor
5 4
3
2
6
7

define process,
identify customers
CI Team
Process1
issue statement,performance measure
collect/analyzedata on causes
identify solutionsplan solutions
implement solutions
evaluate results and monitor
5 4
3
2
6
7

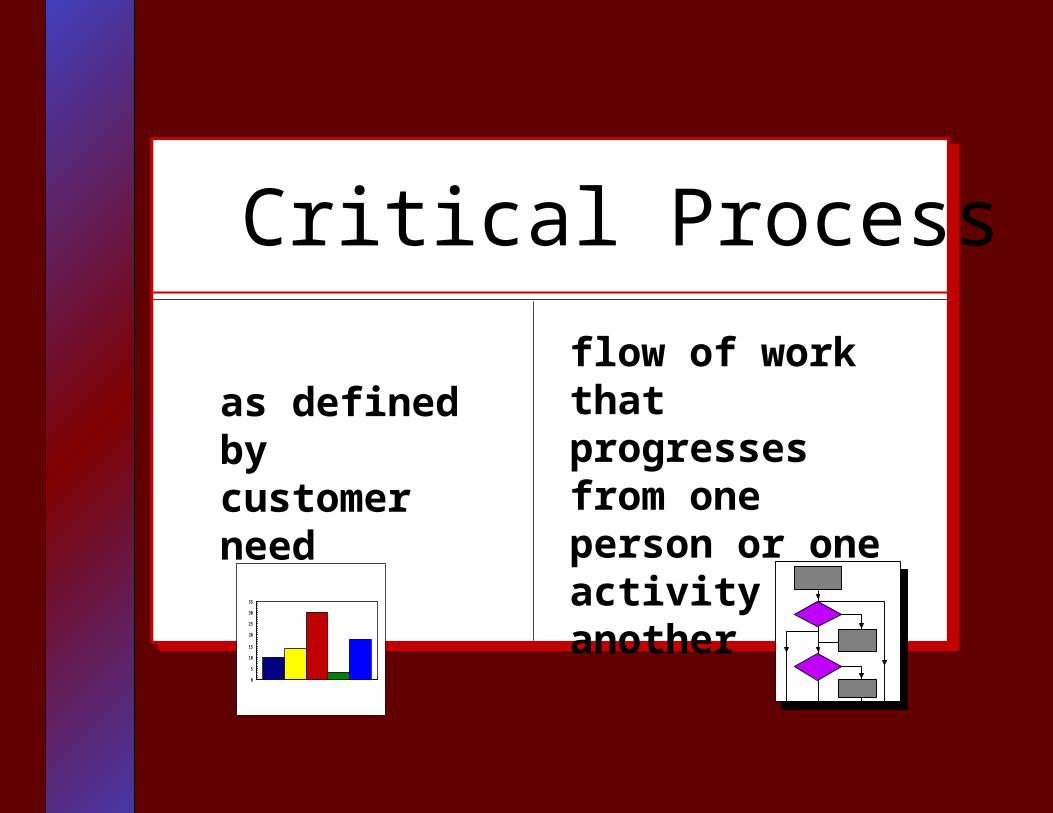
Critical Processflow of work that progresses from one person or one activity to another
as defined bycustomer need
0
5
10
15
20
25
30
35

Who are your customers?Internal and external
Internal customersStaffFacultyYour BossCo-WorkersAssociates
External customers
Students
Community
Parents
Alumni
Department of Education
Arizona Board of Regents
Employers
Legislature
Taxpayers
Guests & visitors
define process,
identify customers
CI Team
Process1
issue statement,performance measure
collect/analyzedata on causes
identify solutionsplan solutions
implement solutions
evaluate results and monitor
5 4
3
2
6
7

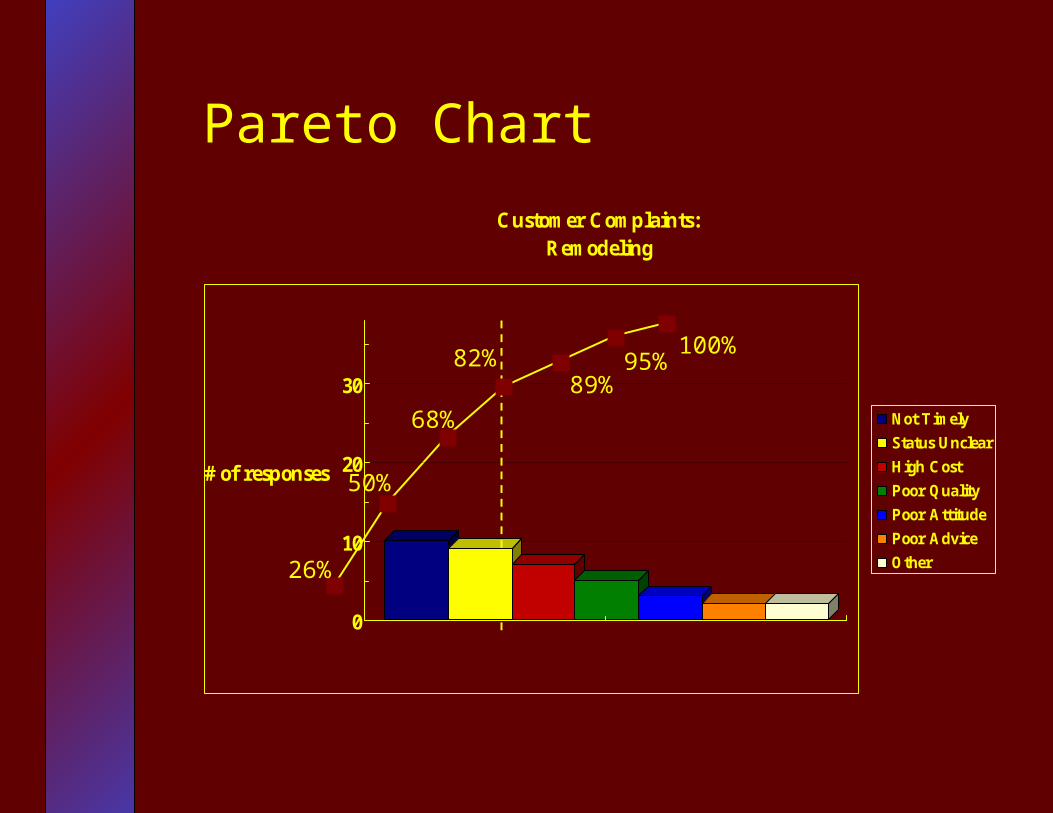
Pareto Chart
10 97
53 2 2
0
10
20
30
# of responses
Customer Complaints:Remodeling
Not Timely
Status Unclear
High Cost
Poor Quality
Poor Attitude
Poor Advice
Other
Pareto Chart
0
10
20
30
# of responses
Customer Complaints:Remodeling
Not Timely
Status Unclear
High Cost
Poor Quality
Poor Attitude
Poor Advice
Other
50%
68%
82%89%
95%100%
26%
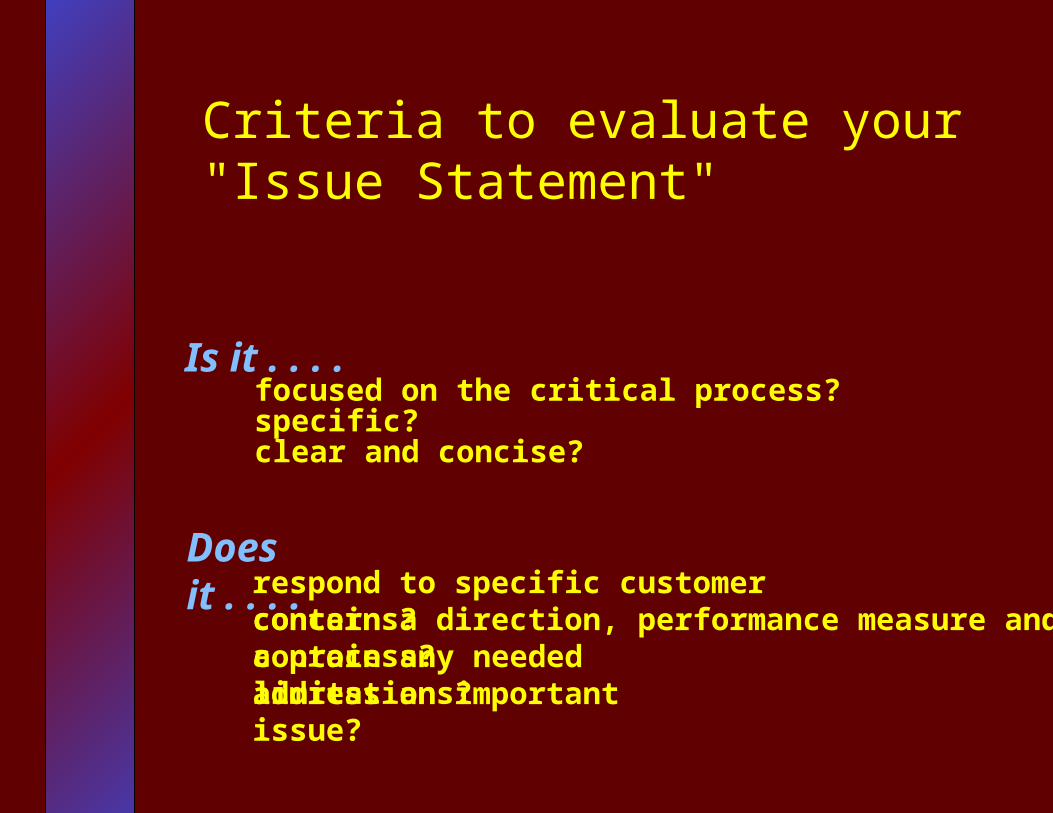
Criteria to evaluate your "Issue Statement"
respond to specific customer concerns?
Is it . . . .focused on the critical process?specific?clear and concise?
Does it . . . .
contain a direction, performance measure and a process?contain any needed limitations?address an important issue?


define process,
identify customers
CI Team
Process1
issue statement,performance measure
collect/analyzedata on causes
identify solutionsplan solutions
implement solutions
evaluate results and monitor
5 4
3
2
6
7

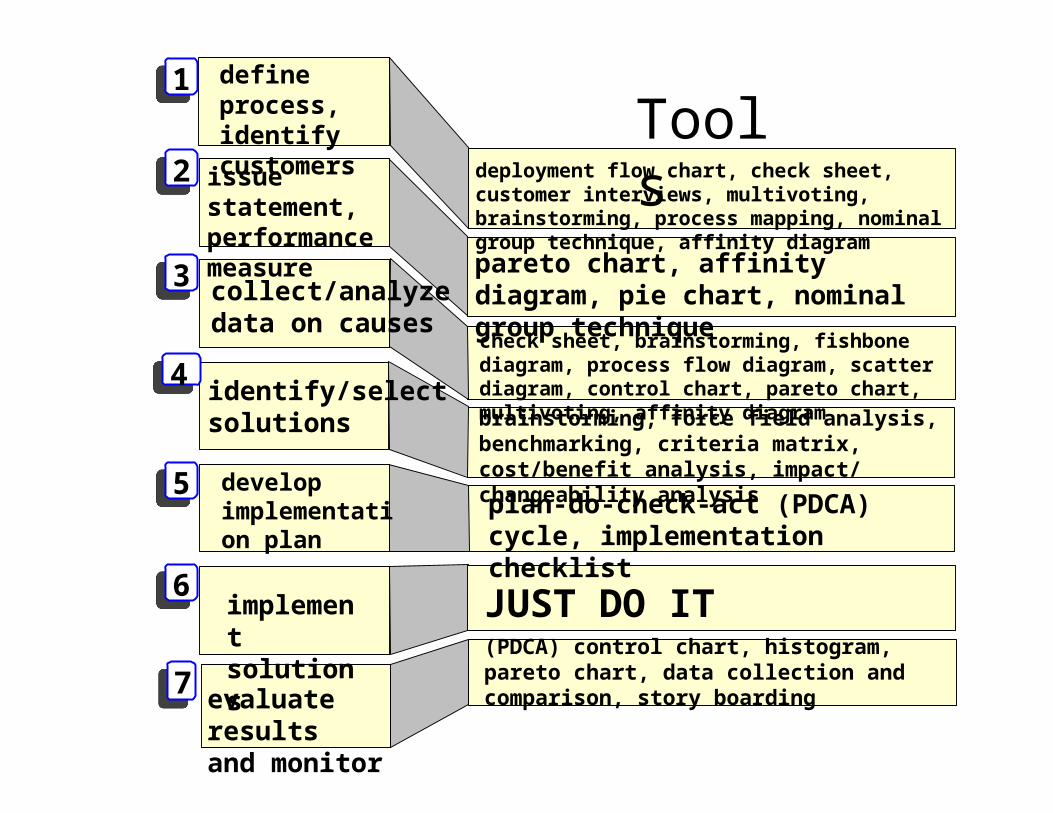
check sheet, brainstorming, fishbone diagram, process flow diagram, scatter diagram, control chart, pareto chart, multivoting, affinity diagram
brainstorming, force field analysis, benchmarking, criteria matrix, cost/benefit analysis, impact/ changeability analysis
pareto chart, affinity diagram, pie chart, nominal group technique
JUST DO IT
deployment flow chart, check sheet, customer interviews, multivoting, brainstorming, process mapping, nominal group technique, affinity diagram
(PDCA) control chart, histogram, pareto chart, data collection and comparison, story boarding
define process,identify customers
issue statement, performance measure
collect/analyzedata on causes
identify/selectsolutions
develop implementation plan
implementsolutions
evaluate resultsand monitor
Tools1
5
4
3
2
6
7
plan-do-check-act (PDCA) cycle, implementation checklist


Process Flow Diagram
input/output
activity/process step
decisionpoint
output
activity/process step
beginning or end of a process
an operation performed
yes/no or pass/fail determination must be made
loop: separate path that takes process ahead or back to other steps
arrows: show direction of the process flow
no
yes
wait state
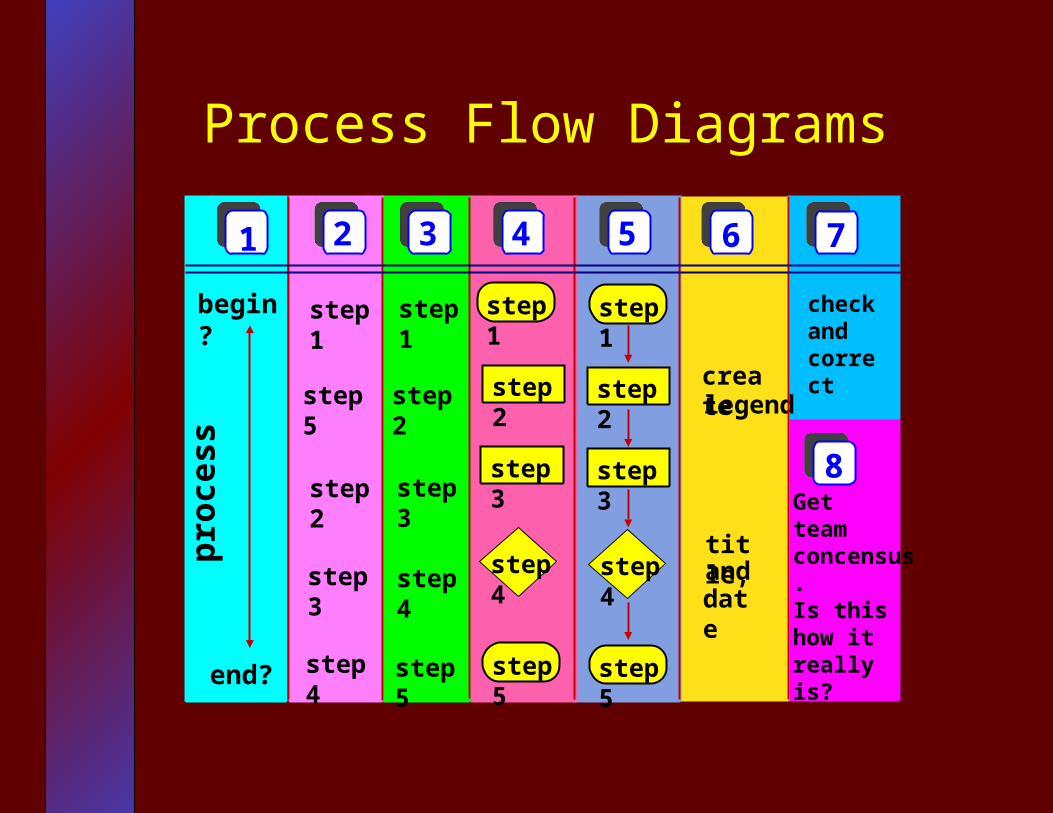
Process Flow Diagrams
1p
roce
ss
begin?
end?
2
step1
step5
step2
step3
step4
3
step1
step2
step3
step4
step5
4
step1
step2
step3
step4
step5
step1
step2
step3
step4
step5
5
8
76
createlegend
title,anddate
checkandcorrect
Getteamconcensus.Is thishow itreally is?


Poorgas
mileage
MaterialsManpower
Methods Machinery
poordesign
use wrong gears
under inflated tires
difficultair stems
no recordtire pressure
carburetor adjustment
fuel mixtoo rich
mechanic doesn't have specs
drive too fast
impatience
alwayslate
can't hearengine
radio too loud
poor hearing
improper lubrication
no oilchange
no $
wrong octane gas
no owner's manual
don't knowrecommended octane rating
wrong oil
don't knowright oil
no owner'smanual
poor driving habits
"when inRome"
poortraining
poor maintenance
noawareness
$


Welcome to ASU Team Training
define process,
identify customers
CI Team
Process1
issue statement,performance measure
collect/analyzedata on causes
identify solutionsplan solutions
implement solutions
evaluate results and monitor
5 4
3
2
6
7

Criteria Matrix
1 2 3 4 5 6 7 8A B C D e f g
Musts
Wants by fall
no addl.FTE
< $500
meets criteriadoes not
meet criterianeed more
informationdoes not
apply

Impact
L5L6L9
L2L4L8
L1L3L7
Priority
1
2
3
Moderate
Difficult
Little or no
Little
Moderate
Considerable
1 2 3
Changeability
effort


Benchmarking Categories
Peer
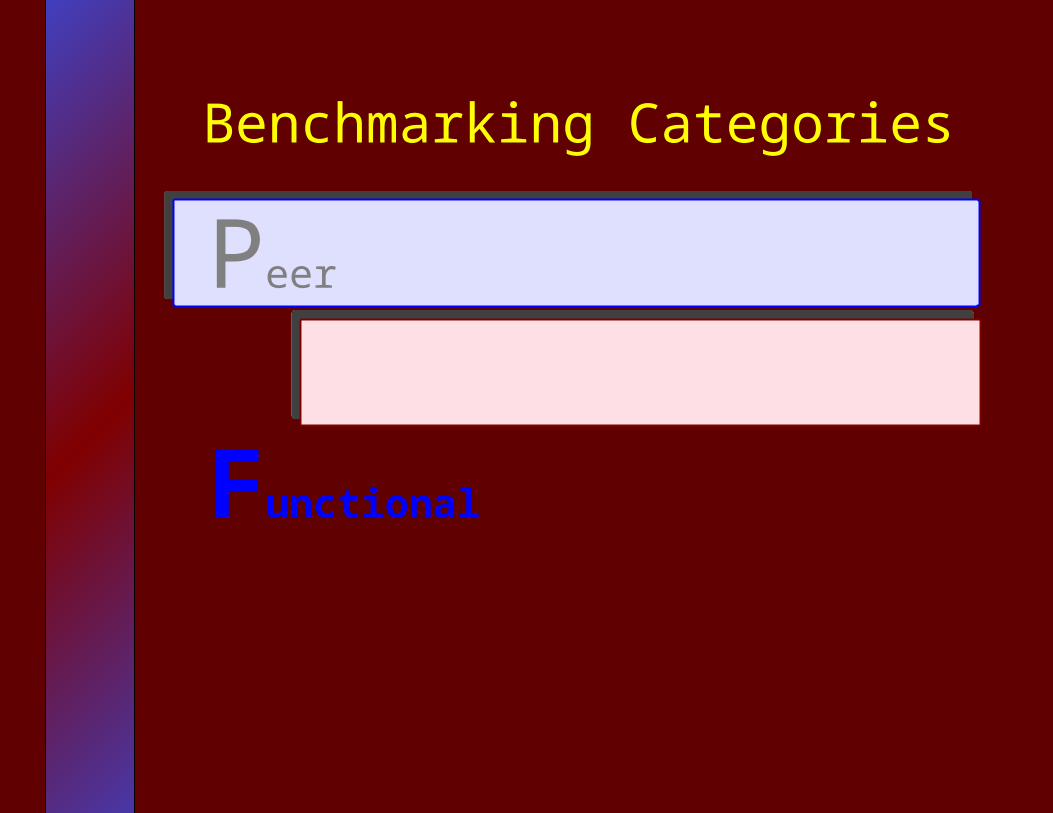
Benchmarking Categories
Peer
Functional

Benchmarking Categories
Peer
Functional
Internal

Benchmarking Categories
Peer
Functional
Internal
Generic


define process,
identify customers
CI Team
Process1
issue statement,performance measure
collect/analyzedata on causes
identify solutionsplan solutions
implement solutions
evaluate results and monitor
5 4
3
2
6
7

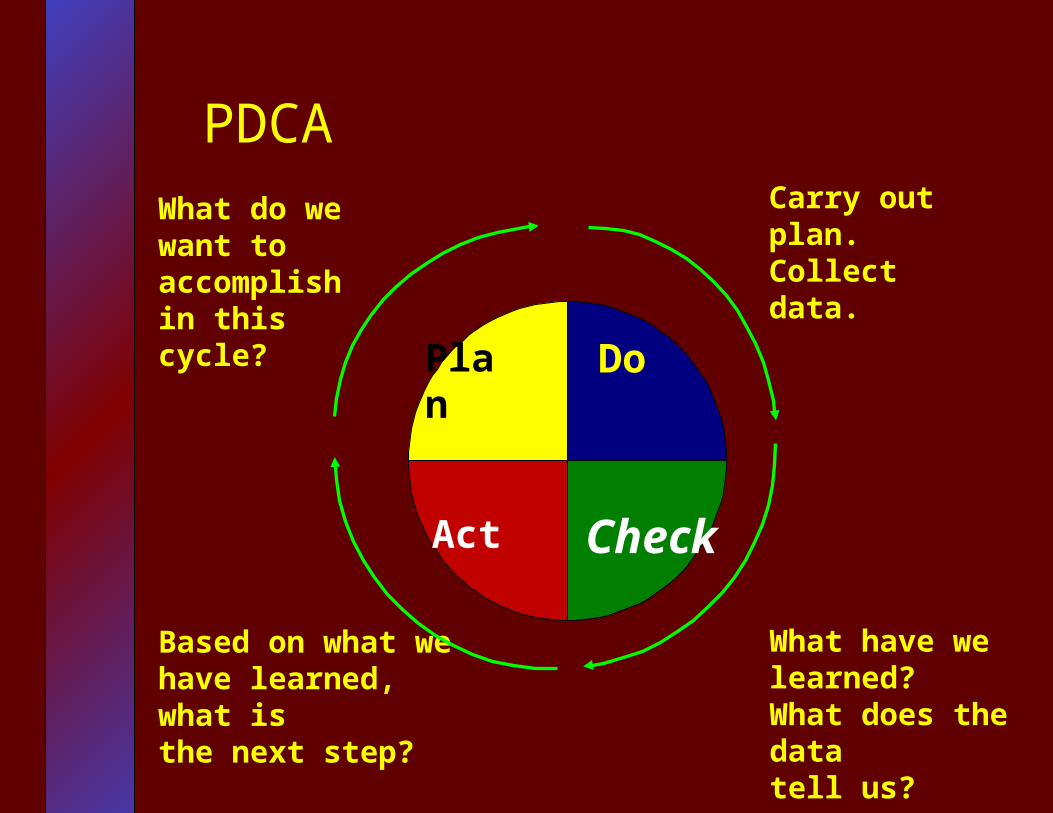
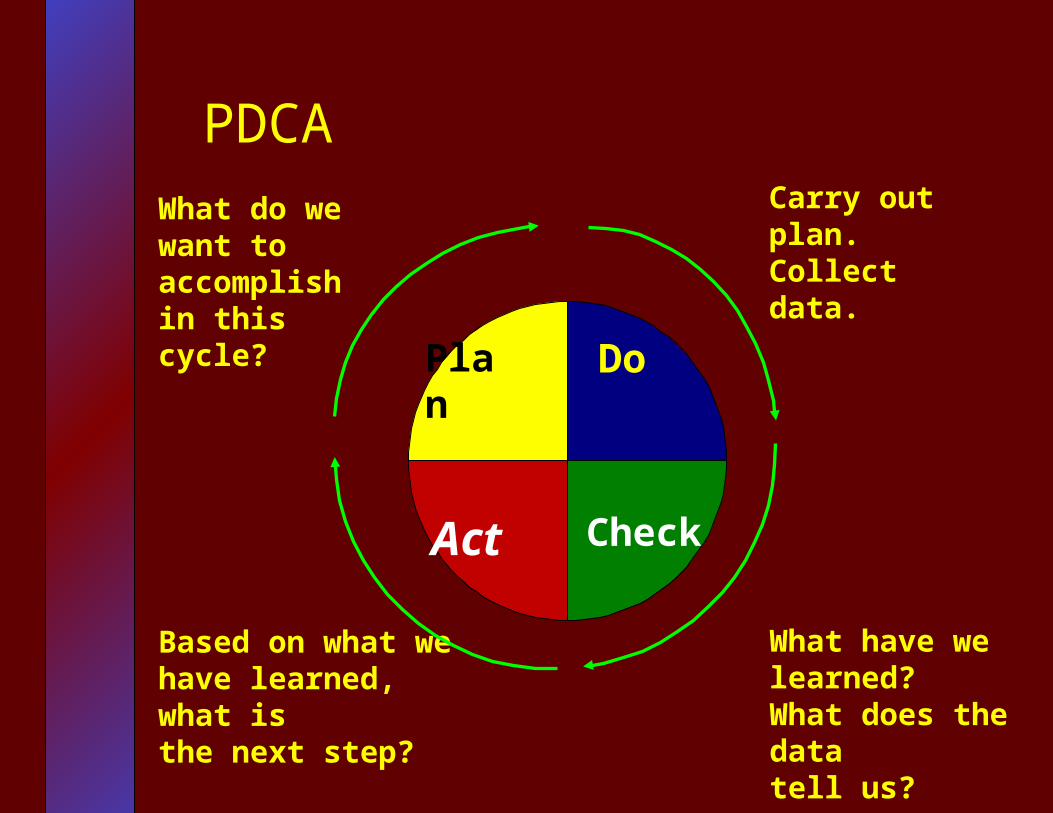
PDCACarry out plan.Collect data.
What have we learned?What does the datatell us?
What do wewant toaccomplishin this cycle?
Based on what wehave learned, what isthe next step?
Plan Do
CheckAct

Case Study Solution:
Reverse entry & exit and direction of cafeterialine. Move salad bar/dessert shelves away fromwall for dual access.

define process,
identify customers
CI Team
Process1
issue statement,performance measure
collect/analyzedata on causes
identify solutionsplan solutions
implement solutions
evaluate results and monitor
5 4
3
2
6
7

PDCACarry out plan.Collect data.
What have we learned?What does the datatell us?
What do wewant toaccomplishin this cycle?
Based on what wehave learned, what isthe next step?
Plan Do
CheckAct

define process,
identify customers
CI Team
Process1
issue statement,performance measure
collect/analyzedata on causes
identify solutionsplan solutions
implement solutions
evaluate results and monitor
5 4
3
2
6
7
PDCACarry out plan.Collect data.
What have we learned?What does the datatell us?
What do wewant toaccomplishin this cycle?
Based on what wehave learned, what isthe next step?
Plan Do
CheckAct
Standardize
Plan, do
Plan, do, check, act
7 step process


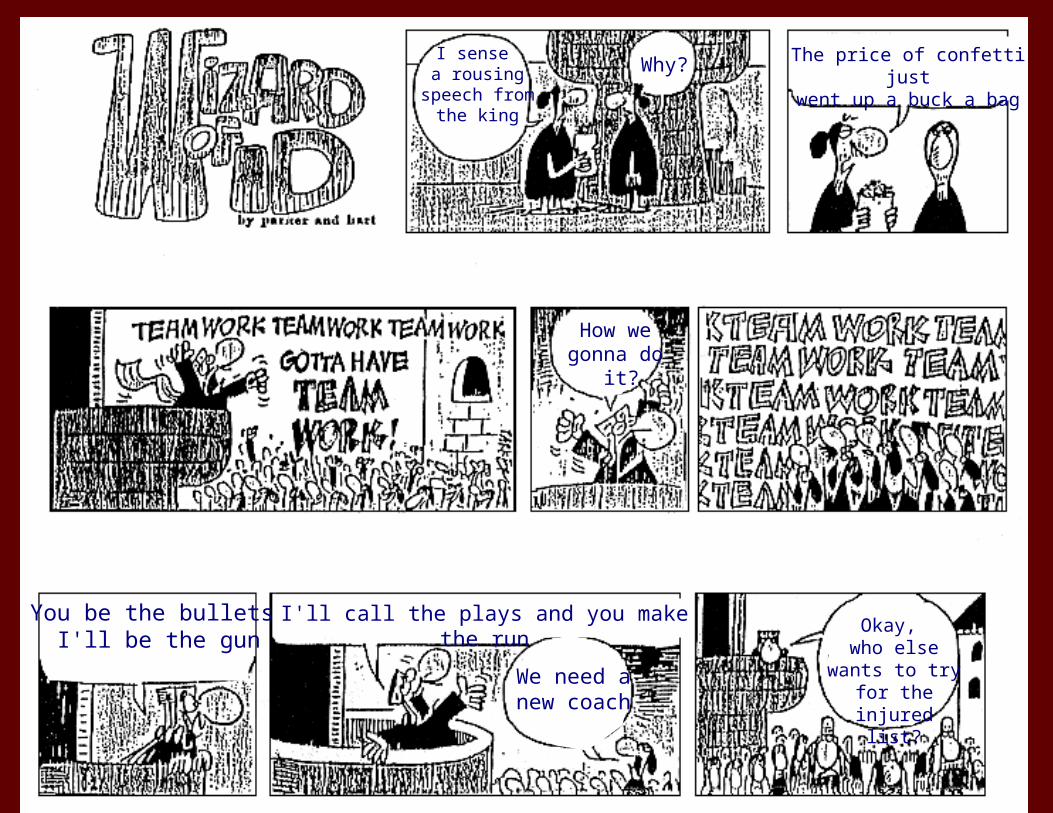
I sense a rousing
speech fromthe king
The price of confetti justwent up a buck a bag
How wegonna do
it?
You be the bullets,I'll be the gun
I'll call the plays and you make the run
Why?
Okay, who else
wants to try for the injured
list?
We need anew coach
check sheet, brainstorming, fishbone diagram, process flow diagram, scatter diagram, control chart, pareto chart, multivoting, affinity diagram
brainstorming, force field analysis, benchmarking, criteria matrix, cost/benefit analysis, impact/ changeability analysis
pareto chart, affinity diagram, pie chart, nominal group technique
JUST DO IT
deployment flow chart, check sheet, customer interviews, multivoting, brainstorming, process mapping, nominal group technique, affinity diagram
(PDCA) control chart, histogram, pareto chart, data collection and comparison, story boarding
define process,identify customers
issue statement, performance measure
collect/analyzedata on causes
identify/selectsolutions
develop implementation plan
implementsolutions
evaluate resultsand monitor
Tools1
5
4
3
2
6
7
plan-do-check-act (PDCA) cycle, implementation checklist