weisberg cc 2012
DESCRIPTION
psihologieTRANSCRIPT
Social Perception in Autism Spectrum Disorders: Impaired Category Selectivityfor Dynamic but not Static Images in Ventral Temporal Cortex
Jill Weisberg1, Shawn C. Milleville1, Lauren Kenworthy1,2, Gregory L. Wallace1, Stephen J. Gotts1,Michael S. Beauchamp3 and Alex Martin1
1NIMH, Laboratory of Brain and Cognition, Bethesda, MD 20850, 2Children’s National Medical Center, Center for AutismSpectrum Disorders, Rockville, MD 20850 and 3Department of Neurobiology and Anatomy, University of Texas Medical Schoolat Houston, Houston, TX 77030, USA
Address correspondence to Jill Weisberg, San Diego State University Research Foundation, Laboratory for Language and Cognitive Neuroscience,6495 Alvarado Rd, Suite 200, San Diego, CA 92120, USA. Email: [email protected]
Studies of autism spectrum disorders (ASDs) reveal dysfunction inthe neural systems mediating object processing (particularly faces)and social cognition, but few investigations have systematically as-sessed the specificity of the dysfunction. We compared corticalresponses in typically developing adolescents and those with ASDto stimuli from distinct conceptual domains known to elicit cat-egory-related activity in separate neural systems. In Experiment 1,subjects made category decisions to photographs, videos, andpoint-light displays of people and tools. In Experiment 2, subjectsinterpreted displays of simple, geometric shapes in motion depictingsocial or mechanical interactions. In both experiments, we found aselective deficit in the ASD subjects for dynamic social stimuli(videos and point-light displays of people, moving geometricshapes), but not static images, in the functionally localized lateralregion of the right fusiform gyrus, including the fusiform face area.In contrast, no group differences were found in response to eitherstatic images or dynamic stimuli in other brain regions associatedwith face and social processing (e.g. posterior superior temporalsulcus, amygdala), suggesting disordered connectivity betweenthese regions and the fusiform gyrus in ASD. This possibility wasconfirmed by functional connectivity analysis.
Keywords: Asperger’s syndrome, autism, fusiform gyrus, MRI/fMRI, socialcognition
Introduction
A core feature of autism spectrum disorders (ASDs) is im-paired social interaction, but the precise nature and the neuralbasis of this impairment remain unclear. It is well establishedthat a rich assortment of social information is gleaned simplyby observing human motion (Blake and Shiffrar 2007).However, while typically developing (TD) individuals do soeffortlessly, several lines of evidence indicate that from a veryyoung age, individuals with ASD may lack this ability. Forexample, when viewing whole-body point-light animations,TD individuals implicitly infer physical characteristics such asgender, age, and identity (Cutting and Kozlowski 1977; Ko-zlowski and Cutting 1977; Mather and Murdoch 1994; Sumi2000; Troje 2002), as well as higher order characteristics con-cerning affect, motivation, and intention (Walk and Homan1984; Dittrich et al. 1996; Pollick et al. 2001; Clarke et al.2005). These inferences about physical and higher ordercharacteristics occur quickly and spontaneously, even thoughpoint-light displays lack information about color, form, andtexture. Children and adolescents with ASD are sometimes im-paired at point-light human action recognition (Blake et al.
2003; Koldewyn et al. 2010). They may fail to distinguishbetween animate and inanimate objects as readily as TD chil-dren (Rutherford et al. 2006; Congiu et al. 2010) and preferviewing moving geometric patterns to videos of other chil-dren (Pierce et al. 2011). In addition, when describing the ani-mations in which simple geometric shapes in motion depictsocial interaction, children and adolescents with autism andAsperger’s syndrome produce less appropriate descriptionsthan their TD counterparts (Abell et al. 2000; Klin 2000;Campbell et al. 2006; Klin and Jones 2006; Salter et al. 2008)and include fewer words referring to mental states (Klin 2000;Castelli et al. 2002). These atypical behavioral patterns appearto emerge early, as demonstrated by infants with ASD spend-ing more time focused on non-social than social physical con-tingencies (Klin et al. 2009).
In TD adults, a predominantly right hemisphere network,including the lateral part of the fusiform gyrus (which includesthe fusiform face area, FFA; Kanwisher et al. 1997; and fusi-form body area; Peelen and Downing 2005; Schwarzlose et al.2005), the posterior superior temporal sulcus (pSTS), theventromedial prefrontal cortex, and the amygdala, is spon-taneously engaged by depictions of animate entities, relativeto inanimate objects (see Blakemore 2008; Adolphs 2009;Martin 2009; Frith and Frith 2010 for recent reviews). Evidenceindicates that performing tasks that require higher order socialinferences, for example, when interpreting moving geometricshapes as social interactions (modeled after Heider andSimmel 1944), much of this same neural circuit becomesactive (Castelli et al. 2000, 2002; Martin and Weisberg 2003;Schultz et al. 2003; Wheatley et al. 2007).
We exploited these findings to conduct a detailed investi-gation of the integrity of the neural system mediating socialcognition in high-functioning adolescents with ASD by com-paring brain activity associated with viewing stimuli fromtwo contrasting conceptual domains: animate entities(people) and inanimate, mechanical objects. In Experiment1, subjects viewed human forms and man-made, manipul-able objects (i.e. tools) presented as static pictures, as fullcolor videos, and as moving point-light displays, allowing as-sessment of the integrity of the neural system mediatinghuman form and motion perception across varying stimulusformats (Beauchamp et al. 2002, 2003). To investigateresponses to higher order concepts, subjects in Experiment2 viewed animated vignettes of moving geometric shapesdepicting social or mechanical action (Martin and Weisberg2003). Thus, we were able to assess neural responses duringinferences based solely on the motion of identical geometricforms.
Published by Oxford University Press 2012.
Cerebral Cortexdoi:10.1093/cercor/bhs276
Cerebral Cortex Advance Access published September 26, 2012 at N
ational Institutes of Health L
ibrary on October 1, 2012
http://cercor.oxfordjournals.org/D
ownloaded from
Materials and Methods
SubjectsTwenty-four high-functioning adolescents with ASD (3 females)and 19 TD adolescents (1 female) participated in Experiment1. Twenty-five ASD adolescents (3 female) and 24 TD adolescents (2females) participated in Experiment 2. Of these, thirteen ASD and 11TD subjects participated in both experiments. Data from 1 ASDsubject common to both experiments was excluded because his stan-dardized IQ measure did not meet the criterion of IQ≥ 85, and datafrom 1 ASD subject in Experiment 1, 7 in Experiment 2, and 6 TDsubjects in Experiment 2 were excluded from analysis due to exces-sive movement during scanning (see the Data analysis section).Demographic and clinical characteristics of the remaining 22 ASDsubjects in Experiment 1, 17 in Experiment 2, and the age- and IQ-matched TD subjects for each experiment (TD n = 19 in Experiment 1and n = 18 in Experiment 2) are described in Table 1. All subjectswere recruited from the Washington DC metropolitan area. An experi-enced clinician verified that each subject in the ASD group met theDSM-IV (American Psychiatric Association 2000) clinical criteria forASD (i.e. autistic disorder, Asperger’s disorder, or pervasive develop-mental disorder–not otherwise specified). In addition, scores from theAutism Diagnostic Interview (ADI or ADI-R; LeCouteur et al. 1989;Lord et al. 1994) and/or Autism Diagnostic Observation Schedule(ADOS; Lord et al. 2000), as administered by a trained andresearch-reliable clinician, indicated that all participating ASD subjectsmet research criteria for “broad ASD” according to guidelines estab-lished by the NICHD/NIDCD Collaborative Programs for Excellencein Autism (Lainhart et al. 2006). Because the ADI and ADOS do notprovide an algorithm for Asperger’s syndrome, Lainhart et al. devel-oped research criteria that include an individual on the broad autismspectrum if s/he meets the ADI cut-off for “autism” in the socialdomain and at least one other domain, or meets the ADOS cut-off forthe combined social and communication score. All subjects (and theirparents, if minors) gave informed consent under a protocol approvedby the NIMH IRB and were paid for participation.
Stimuli and Experimental Design
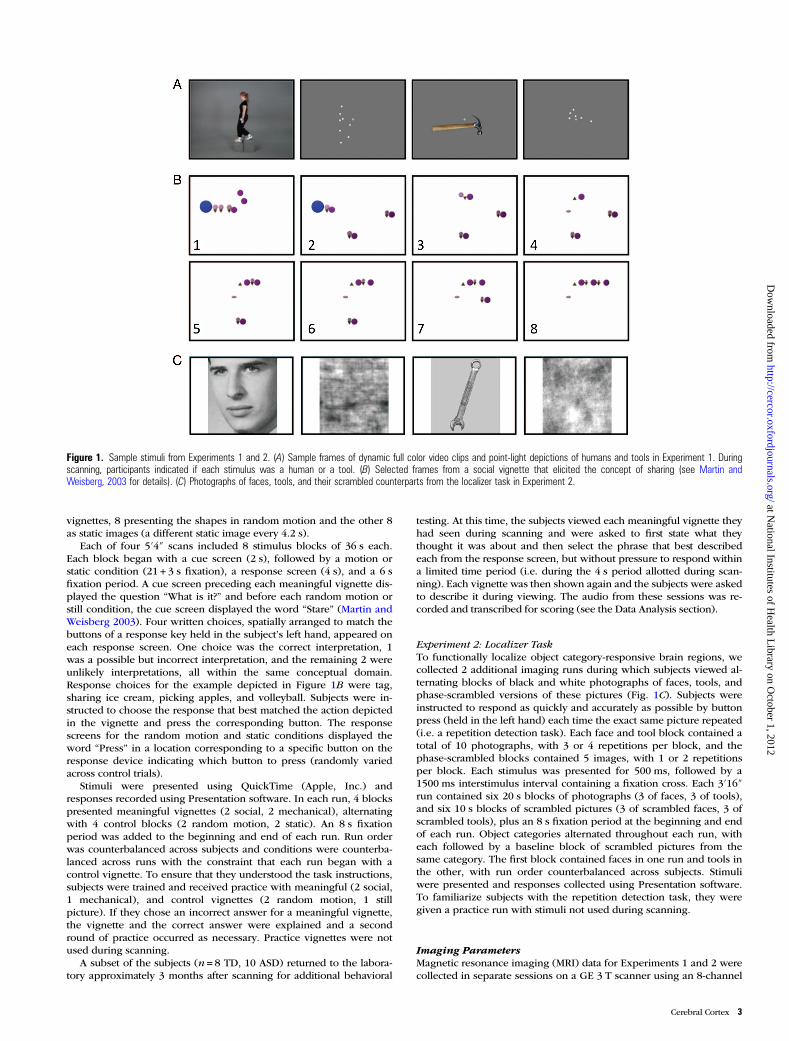
Experiment 1Subjects viewed depictions of people and tools in 3 formats: staticimages, full color video clips of moving images, and moving point-light displays (see Beauchamp et al. 2002, 2003 for details). Thus, wepresented a total of 6 types of visual stimuli. Examples of humanactions include jumping jacks, climbing up or down stairs, and soccerkicks; examples of tool stimuli moving in their characteristic mannersinclude a chef’s knife, hammer, paintbrush, and scissors. The video
clips were recorded against a gray background using human actors,and the tools moved realistically but without a visible means ofmanipulation (Beauchamp et al. 2002). Static images consisted offrames selected from the video stimuli that best suggested the type ofmovement performed and showed the human or tool in mid-action.The point-light stimuli were created using a motion capture systemrecording small reflective targets placed on the human actor or tool,illuminated by camera-mounted light-emitting diodes (Beauchampet al. 2003). Each stimulus was overlaid with a white central fixationcross and presented on a gray background (Fig. 1A).
We used a rapid event-related experimental design and recordedresponses with Presentation software (Neurobehavioral Systems, Inc.)running on a Dell Inspiron 8500 notebook computer. Across theexperiment, half of the experimental trials depicted people and halfdepicted tools, equally represented across the 3 image formats (still,video, point-light). For each stimulus type, 50 trials were presentedacross 4 separate imaging runs (an average of 12.5 trials per stimulustype per run), with each run lasting 5 min. Stimuli were presented for2500 ms (video clips and point-light trials were displayed at 30frames/s) followed by a white fixation cross on a gray background for500 ms. The sequence optimizer program OptSeq2 was used to ran-domize stimulus presentation order and calculate jitter for null trials(fixation baseline). Each imaging run began and ended with a fixationperiod (16 and 22 s, respectively) and included 37 s of null trials(average duration per null trial = 1059 ms, range = 1000–8000 ms) ran-domly interspersed among experimental trials. The order of runs wascounterbalanced across subjects. Stimuli were rear-projected onto ascreen positioned at the foot of the scanning bed and visible via amirror attached to the head coil.
To ensure that subjects attended to each image during scanning,they were instructed to press one button for depictions of people andanother button for tools as quickly and accurately as possible, using aresponse device held in the left hand. Subjects had one practice trialwith each stimulus type prior to scanning to ensure that they under-stood the task instructions.
Experiment 2: Vignette TaskSixteen animated vignettes used simple geometric shapes in motionto depict either social (8 vignettes) or mechanical (8 vignettes) action(see Martin and Weisberg 2003 for details). The social vignettes eli-cited interpretations of the moving shapes as social interactions suchas playing baseball, dancing, sharing, scaring, and swimming(Fig. 1B); the mechanical vignettes elicited interpretations of mechan-ical interaction or objects such as billiards, a cannon, and a conveyerbelt. The numbers and types of shapes were similar in the social andmechanical vignettes. In addition, subjects viewed 16 control vign-ettes which used the same geometric stimuli as the meaningful
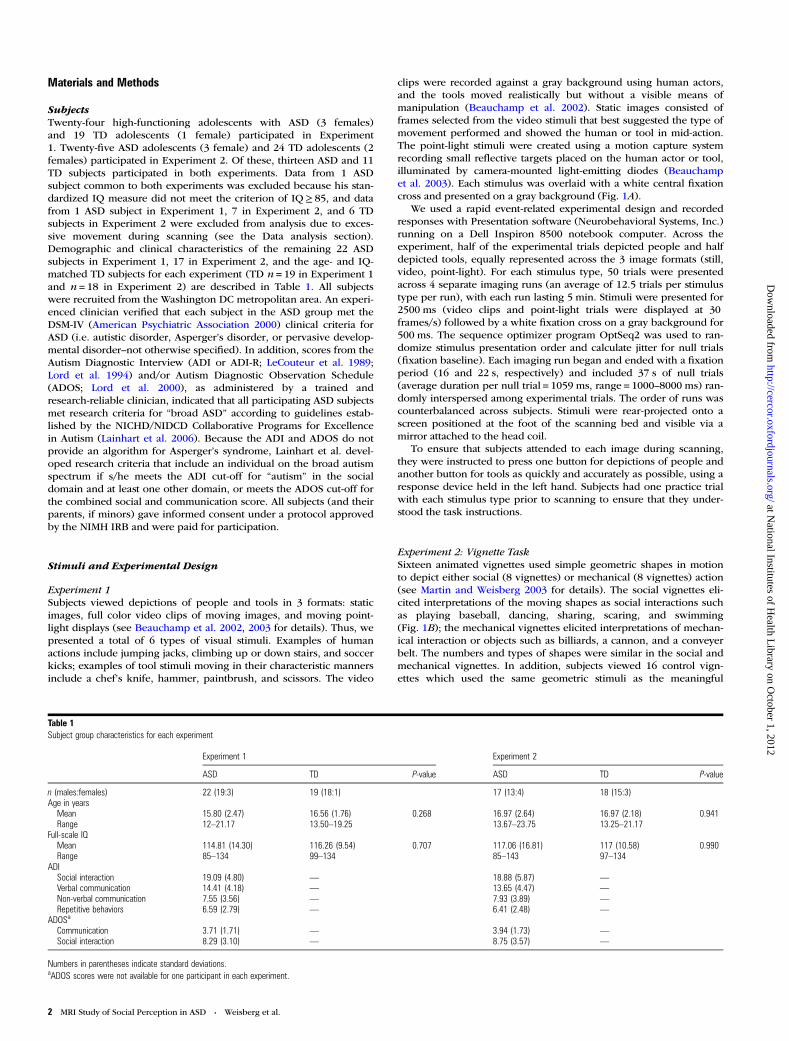
Table 1Subject group characteristics for each experiment
Experiment 1 Experiment 2
ASD TD P-value ASD TD P-value
n (males:females) 22 (19:3) 19 (18:1) 17 (13:4) 18 (15:3)Age in yearsMean 15.80 (2.47) 16.56 (1.76) 0.268 16.97 (2.64) 16.97 (2.18) 0.941Range 12–21.17 13.50–19.25 13.67–23.75 13.25–21.17
Full-scale IQMean 114.81 (14.30) 116.26 (9.54) 0.707 117.06 (16.81) 117 (10.58) 0.990Range 85–134 99–134 85–143 97–134
ADISocial interaction 19.09 (4.80) — 18.88 (5.87) —
Verbal communication 14.41 (4.18) — 13.65 (4.47) —
Non-verbal communication 7.55 (3.56) — 7.93 (3.89) —
Repetitive behaviors 6.59 (2.79) — 6.41 (2.48) —
ADOSa
Communication 3.71 (1.71) — 3.94 (1.73) —
Social interaction 8.29 (3.10) — 8.75 (3.57) —
Numbers in parentheses indicate standard deviations.aADOS scores were not available for one participant in each experiment.
2 MRI Study of Social Perception in ASD • Weisberg et al.
at National Institutes of H
ealth Library on O
ctober 1, 2012http://cercor.oxfordjournals.org/
Dow
nloaded from
vignettes, 8 presenting the shapes in random motion and the other 8as static images (a different static image every 4.2 s).
Each of four 5′4″ scans included 8 stimulus blocks of 36 s each.Each block began with a cue screen (2 s), followed by a motion orstatic condition (21 + 3 s fixation), a response screen (4 s), and a 6 sfixation period. A cue screen preceding each meaningful vignette dis-played the question “What is it?” and before each random motion orstill condition, the cue screen displayed the word “Stare” (Martin andWeisberg 2003). Four written choices, spatially arranged to match thebuttons of a response key held in the subject’s left hand, appeared oneach response screen. One choice was the correct interpretation, 1was a possible but incorrect interpretation, and the remaining 2 wereunlikely interpretations, all within the same conceptual domain.Response choices for the example depicted in Figure 1B were tag,sharing ice cream, picking apples, and volleyball. Subjects were in-structed to choose the response that best matched the action depictedin the vignette and press the corresponding button. The responsescreens for the random motion and static conditions displayed theword “Press” in a location corresponding to a specific button on theresponse device indicating which button to press (randomly variedacross control trials).
Stimuli were presented using QuickTime (Apple, Inc.) andresponses recorded using Presentation software. In each run, 4 blockspresented meaningful vignettes (2 social, 2 mechanical), alternatingwith 4 control blocks (2 random motion, 2 static). An 8 s fixationperiod was added to the beginning and end of each run. Run orderwas counterbalanced across subjects and conditions were counterba-lanced across runs with the constraint that each run began with acontrol vignette. To ensure that they understood the task instructions,subjects were trained and received practice with meaningful (2 social,1 mechanical), and control vignettes (2 random motion, 1 stillpicture). If they chose an incorrect answer for a meaningful vignette,the vignette and the correct answer were explained and a secondround of practice occurred as necessary. Practice vignettes were notused during scanning.
A subset of the subjects (n = 8 TD, 10 ASD) returned to the labora-tory approximately 3 months after scanning for additional behavioral
testing. At this time, the subjects viewed each meaningful vignette theyhad seen during scanning and were asked to first state what theythought it was about and then select the phrase that best describedeach from the response screen, but without pressure to respond withina limited time period (i.e. during the 4 s period allotted during scan-ning). Each vignette was then shown again and the subjects were askedto describe it during viewing. The audio from these sessions was re-corded and transcribed for scoring (see the Data Analysis section).
Experiment 2: Localizer TaskTo functionally localize object category-responsive brain regions, wecollected 2 additional imaging runs during which subjects viewed al-ternating blocks of black and white photographs of faces, tools, andphase-scrambled versions of these pictures (Fig. 1C). Subjects wereinstructed to respond as quickly and accurately as possible by buttonpress (held in the left hand) each time the exact same picture repeated(i.e. a repetition detection task). Each face and tool block contained atotal of 10 photographs, with 3 or 4 repetitions per block, and thephase-scrambled blocks contained 5 images, with 1 or 2 repetitionsper block. Each stimulus was presented for 500 ms, followed by a1500 ms interstimulus interval containing a fixation cross. Each 3′16″run contained six 20 s blocks of photographs (3 of faces, 3 of tools),and six 10 s blocks of scrambled pictures (3 of scrambled faces, 3 ofscrambled tools), plus an 8 s fixation period at the beginning and endof each run. Object categories alternated throughout each run, witheach followed by a baseline block of scrambled pictures from thesame category. The first block contained faces in one run and tools inthe other, with run order counterbalanced across subjects. Stimuliwere presented and responses collected using Presentation software.To familiarize subjects with the repetition detection task, they weregiven a practice run with stimuli not used during scanning.
Imaging ParametersMagnetic resonance imaging (MRI) data for Experiments 1 and 2 werecollected in separate sessions on a GE 3 T scanner using an 8-channel
Figure 1. Sample stimuli from Experiments 1 and 2. (A) Sample frames of dynamic full color video clips and point-light depictions of humans and tools in Experiment 1. Duringscanning, participants indicated if each stimulus was a human or a tool. (B) Selected frames from a social vignette that elicited the concept of sharing (see Martin andWeisberg, 2003 for details). (C) Photographs of faces, tools, and their scrambled counterparts from the localizer task in Experiment 2.
Cerebral Cortex 3
at National Institutes of H
ealth Library on O
ctober 1, 2012http://cercor.oxfordjournals.org/
Dow
nloaded from
phased-array head coil. The average time between sessions was 101days. In each session, acquisition of a high-resolution anatomical scan(MPRAGE 128 axial slices, 1.2 mm thick, field of view (FOV) = 24 cm,acquisition matrix = 256 × 256) was followed by gradient-echo echo-planar scans (repetition time = 2 s, echo time = 30 ms, flip angle = 90°,FOV = 22 cm for Experiment 1 and 24 cm for Experiment 2, acqui-sition matrix = 64 × 64, 31 contiguous slices, 3.8 mm thick, number ofbrain volumes = 150 for Experiment 1, 152 for the vignette task inExperiment 2, and 98 for the localizer task in Experiment 2).
Data Analysis
Behavioral DataCategory decision accuracy rates (percentage correct trials) collectedduring Experiment 1 scanning sessions were submitted to aGroup (ASD, TD) × Category (human, tool) × Format (static, video,point-light) repeated-measures analysis of variance (ANOVA).Accuracy rates collected during the Localizer task in Experiment 2were analyzed with a Group (ASD, TD) × Category (Face, Tool)repeated-measures ANOVA. Data for 2 ASD subjects were lost due totechnical difficulties. One additional ASD subject’s data were excludedfrom this analysis due to near-chance task performance (<61%accuracy).
Vignette task response data collected during scanning for eachsubject were scored as correct or incorrect, and incorrect responseswere further classified according to the type of incorrect response se-lected (possible but wrong, or unlikely and wrong). The mean scores(as a percent of total trials for each condition) for each response typewere submitted to separate Group (ASD, TD) × Vignette Type (social,mechanical) ANOVAs. Data for 2 ASD subjects were lost due to techni-cal difficulties. Vignette descriptions collected during the post-scanbehavioral testing session were scored for 1) phrases denoting inten-tionality, 2) number of pronouns used, and 3) length of description(number of clauses). The intentionality score reflected the type of de-liberate actions described, with zero points scored if no deliberateaction was described: 1 = solo action; 2 = action with others; 3 = actionin response to another’s action; 4 = action with reference to mentalstates; and 5 = action with the explicit goal of affecting another’smetal state (Abell et al. 2000; Castelli et al. 2000). Subject’s meanscores for each vignette type were submitted to a separate Group(ASD, TD) × Vignette Type (social, mechanical) ANOVA for eachmeasure.
Imaging DataAll MRI data were processed and analyzed using the AFNI SoftwarePackage (Cox 1996). After pre-processing and prior to group analyses,each individual’s data were transformed into the stereotactic spaceof Talairach and Tournoux (1988). We registered each individual’sanatomical scan to the TT_N27 template in AFNI using12-parameter-affine registration, and report coordinates converted viathe Lancaster transformation (Lancaster et al. 2007; Laird et al. 2010)in the Montreal Neurological Institute (MNI) space (Evans et al. 1992).During pre-processing, the first 4 volumes of each time series werediscarded to allow for equilibrium magnetization and all remainingvolumes were slice-time corrected and registered to one volume ofthe time series collected nearest in time to the acquisition of the high-resolution anatomical scan. The motion parameters output by thevolume registration algorithm were examined to determine any timepoints for which the square root of the sum of squares of the deriva-tives exceeded 1 (equal to a translation of 1 mm in any one transla-tional direction, or a combination of translations of 0.577 mm in all 3translational directions; Jones et al. 2010). When this occurred, wecensored that time point plus the immediately preceding and follow-ing time points from further statistical analysis.
After spatial smoothing (4.5 mm full-width at half-maximum Gaus-sian filter), we implemented multiple regression analysis, with regres-sors of no interest including the 6 parameter motion estimates fromthe volume registration algorithm and polynomial regressors toaccount for baseline shifts and linear drifts in each scan.
For Experiment 1, we calculated the response to each stimulustype compared with the fixation baseline. For each of the 6 regressorsof interest (one for each stimulus type), we fit tent basis functions (re-presenting the response to each stimulus) to the MRI signal at eachhalf volume of echo-planar acquisition (1 s resolution) over a 12 swindow, with no assumptions about the shape of the hemodynamicresponse, resulting in an estimate of the response to a single stimulustype for each second. The resulting deconvolution provided voxel-wise 12 s time series with a 1 s resolution for each stimulus type. Theresponse magnitude to each stimulus type was calculated by summingthe beta weights of the regressors from seconds 2 to 8 of the responseat each voxel, resulting in one estimate per subject per stimulus type(see Beauchamp et al. 2002 for details).
We performed a mixed-effects ANOVA on the summed betaweights with Group (TD, ASD), Category (human, tool), and StimulusFormat (static, video, point-light) as fixed factors and with subjects asa random factor. Unless otherwise stated, all regions in this reportwere significant at a voxel-wise false discovery rate (FDR) correctedthreshold, designated as q.
In addition, to provide an unbiased assessment of the response tothe dynamic stimuli (videos and point-light displays), we identifiedregions of interest (ROIs) that showed a category effect based solelyon the static stimuli. To accomplish this, we created a mask consistingof voxels exceeding a threshold of q < 0.05 for the contrast of staticpeople vs. static tools, to serve as a within-experiment, category loca-lizer. For each subject, we calculated the average beta weight withineach independently identified ROI in this mask for each of the 4dynamic conditions (human video, human point-light, tool video, toolpoint-light) and submitted those values to mixed-effects ANOVAs.
For the face–tool localizer scans in Experiment 2, we estimated theresponse to each condition vs. its corresponding baseline with oneregressor of interest for each category (faces, tools), and the baselinefor the regression model comprised of scrambled pictures. Voxel-wiseresponse estimates for each stimulus type (i.e. beta weights) for eachsubject were submitted to a mixed-effects Group (TD, ASD) ×Category (faces, tools) ANOVA. In the resulting statistical map, weidentified voxels that surpassed a statistical threshold of q < 0.05 forthe effect of Group, Category, or an interaction between them. Clus-ters of contiguous voxels (unrestricted by cluster size because weapplied FDR correction) identified by this analysis served as masks toextract time series from the functional data of each subject in regionswhere the condition of interest (i.e. faces, tools, social, mechanical)elicited a response significantly greater than the baseline. Thus, clus-ters identified by the localizer task served as ROIs to extract timeseries from the vignette data. This allowed us to examine responses tothe social vignettes in regions that were independently identified asshowing a preference for faces. To calculate voxel-wise estimates ofresponses to the social and mechanical vignettes, we included one re-gressor of interest for each vignette type (12 time points for each vign-ette), leaving all remaining time points (including static shapes) as thebaseline for the model. For each subject, we calculated the averageresponse to each vignette type within each face–tool localizer clusterand entered the results into a mixed effects Group (ASD, TD) ×Vignette Type (social, mechanical) ANOVA.
To assess group differences in functional connectivity, we prepro-cessed the functional data from the vignette task by removing signalrelated to motion artifact, ventricles, and white matter (see Jo et al.2010 for details) along with their respective temporal derivatives (Foxet al. 2005). It has become increasingly clear that analyses of groupdifferences in functional connectivity are particularly sensitive todifferences in head motion (e.g. Power et al. 2012). Following timepoint censoring as described above, we evaluated group differencesin motion using root mean square (RMS) head position change(Power et al. 2012) and a sharp motion index similar to mean motionas implemented by Van Dijk et al. 2012 (implemented in AFNI as@1dDiffMag). In order to calculate head motion estimates after TRcensoring, we applied a special procedure to eliminate step-like dis-continuities in the absolute head position (for details, see Gotts et al.2012). At each censoring, the echo-planar imaging (EPI) volume atthe TR just subsequent to any cut TR was volume-registered to theEPI image at the last pre-cut TR, the transformation matrix was saved,
4 MRI Study of Social Perception in ASD • Weisberg et al.
at National Institutes of H
ealth Library on O
ctober 1, 2012http://cercor.oxfordjournals.org/
Dow
nloaded from
and then this matrix was reapplied to all subsequent TRs in the scan.This is equivalent to starting the head position where it left off justbefore the cut TRs, allowing subsequent motion events to occur rela-tive to the realigned position. Results of these analyses confirmed thatthe groups did not differ on either measure of motion prior to, orfollowing, data scrubbing (Mann–Whitney U-test, RMS measure;P = 0.575 before and P = 0.729 after time point censoring for the loca-lizer data; P = 0.344 before and P = 0.380 after for the vignette taskdata. Mann–Whitney U-test, sharp motion measure; P = 0.77 beforeand P = 0.77 after for the localizer data; P = 0.95 before and P = 0.113after censoring for the vignette task data). We then applied a smooth-ing filter, scaled the data to a mean of 100, and performed multipleregression as previously described to calculate residual fluctuations(remove task effects) for each individual in Experiment 2 (see Joneset al. 2010, Method 3, for details). We created 2 residual time series:one contained only time points from the social animation task blocksand the other contained only time points from the mechanical anima-tion task blocks. We created seed regions by averaging each residualtime series across the voxels within a 5 mm sphere located within theright lateral fusiform gyrus, centered on the local maxima for themain effect of Category from the localizer task (faces > tools), and ob-tained Pearson’s correlation coefficients between these seed ROIs andall other brain voxels (using 3dTcorr1D in AFNI). For each individual,we then averaged the correlation coefficients for the 2 residual timeseries (social, mechanical), applied a Fisher-Z transform, and ident-ified differences between groups using 3dttest in AFNI. Significantdifferences (P < 0.05) identified in the right pSTS and amygdala werefurther examined by extracting the average correlation across a 5 mmspherical ROI centered on the peak t-values and submitting theseROI-averaged correlation coefficients for each individual to indepen-dent sample between-group t-tests.
Results
Experiment 1: Behavioral DataThe TD and ASD groups were highly accurate (>90% correct)with no effect of group (F < 1) or interactions with group (allFs < 2) for the category decision task in Experiment 1. Per-formance was comparable for both human and tool stimuli(main effect of Category, F < 1). Thus, the task was no moredifficult for individuals with ASD than for TD individuals, re-gardless of whether the stimuli depicted people or tools, orwere static or dynamic.
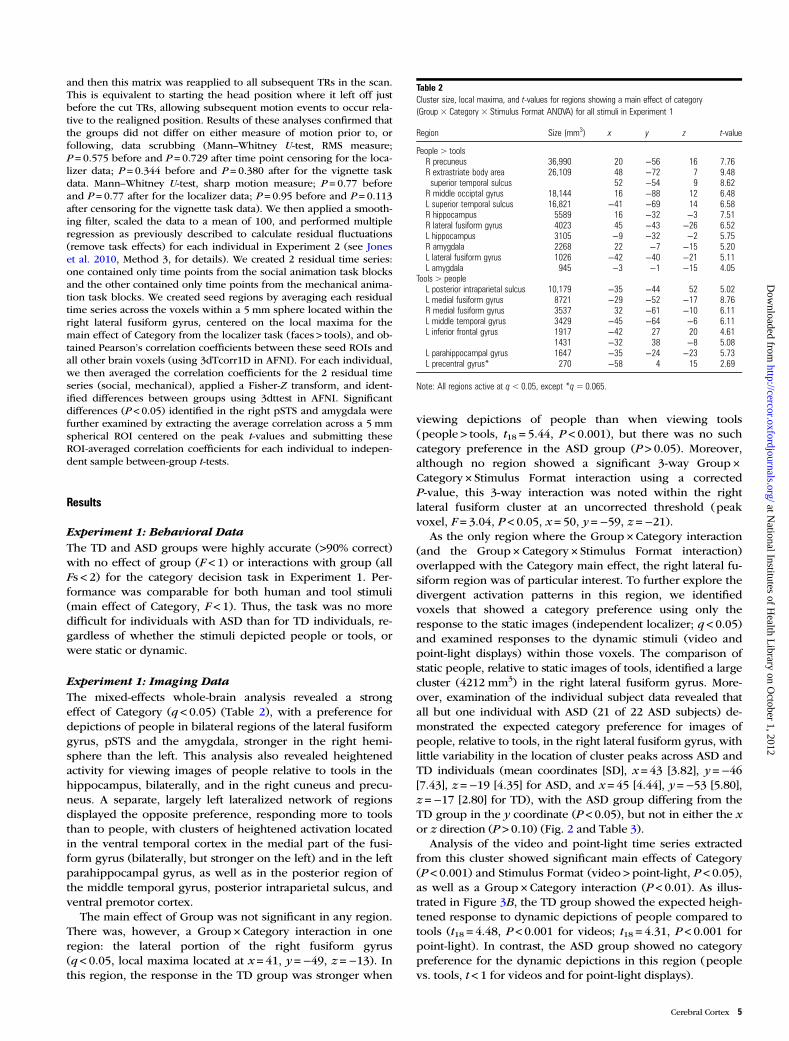
Experiment 1: Imaging DataThe mixed-effects whole-brain analysis revealed a strongeffect of Category (q < 0.05) (Table 2), with a preference fordepictions of people in bilateral regions of the lateral fusiformgyrus, pSTS and the amygdala, stronger in the right hemi-sphere than the left. This analysis also revealed heightenedactivity for viewing images of people relative to tools in thehippocampus, bilaterally, and in the right cuneus and precu-neus. A separate, largely left lateralized network of regionsdisplayed the opposite preference, responding more to toolsthan to people, with clusters of heightened activation locatedin the ventral temporal cortex in the medial part of the fusi-form gyrus (bilaterally, but stronger on the left) and in the leftparahippocampal gyrus, as well as in the posterior region ofthe middle temporal gyrus, posterior intraparietal sulcus, andventral premotor cortex.
The main effect of Group was not significant in any region.There was, however, a Group × Category interaction in oneregion: the lateral portion of the right fusiform gyrus(q < 0.05, local maxima located at x = 41, y =−49, z =−13). Inthis region, the response in the TD group was stronger when
viewing depictions of people than when viewing tools(people > tools, t18 = 5.44, P < 0.001), but there was no suchcategory preference in the ASD group (P > 0.05). Moreover,although no region showed a significant 3-way Group ×Category × Stimulus Format interaction using a correctedP-value, this 3-way interaction was noted within the rightlateral fusiform cluster at an uncorrected threshold (peakvoxel, F = 3.04, P < 0.05, x = 50, y =−59, z =−21).
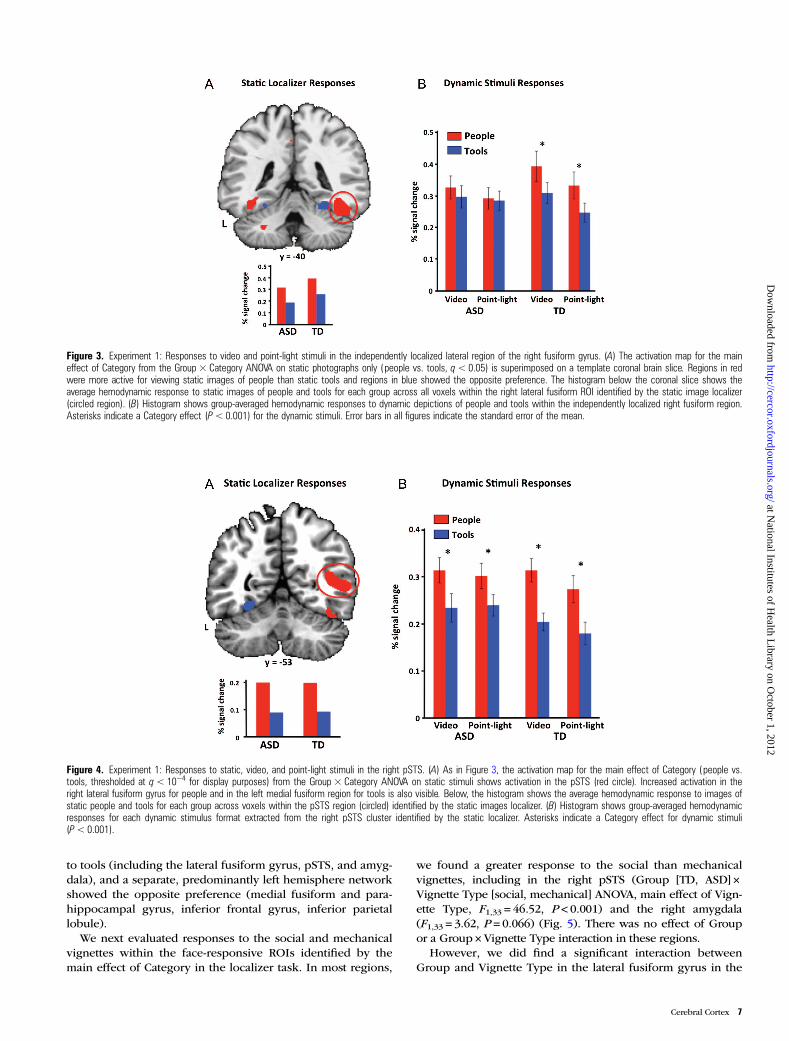
As the only region where the Group × Category interaction(and the Group × Category × Stimulus Format interaction)overlapped with the Category main effect, the right lateral fu-siform region was of particular interest. To further explore thedivergent activation patterns in this region, we identifiedvoxels that showed a category preference using only theresponse to the static images (independent localizer; q < 0.05)and examined responses to the dynamic stimuli (video andpoint-light displays) within those voxels. The comparison ofstatic people, relative to static images of tools, identified a largecluster (4212 mm3) in the right lateral fusiform gyrus. More-over, examination of the individual subject data revealed thatall but one individual with ASD (21 of 22 ASD subjects) de-monstrated the expected category preference for images ofpeople, relative to tools, in the right lateral fusiform gyrus, withlittle variability in the location of cluster peaks across ASD andTD individuals (mean coordinates [SD], x = 43 [3.82], y =−46[7.43], z =−19 [4.35] for ASD, and x = 45 [4.44], y =−53 [5.80],z =−17 [2.80] for TD), with the ASD group differing from theTD group in the y coordinate (P < 0.05), but not in either the xor z direction (P > 0.10) (Fig. 2 and Table 3).
Analysis of the video and point-light time series extractedfrom this cluster showed significant main effects of Category(P < 0.001) and Stimulus Format (video > point-light, P < 0.05),as well as a Group × Category interaction (P < 0.01). As illus-trated in Figure 3B, the TD group showed the expected heigh-tened response to dynamic depictions of people compared totools (t18 = 4.48, P < 0.001 for videos; t18 = 4.31, P < 0.001 forpoint-light). In contrast, the ASD group showed no categorypreference for the dynamic depictions in this region (peoplevs. tools, t < 1 for videos and for point-light displays).
Table 2Cluster size, local maxima, and t-values for regions showing a main effect of category(Group × Category × Stimulus Format ANOVA) for all stimuli in Experiment 1
Region Size (mm3) x y z t-value
People > toolsR precuneus 36,990 20 −56 16 7.76R extrastriate body area 26,109 48 −72 7 9.48superior temporal sulcus 52 −54 9 8.62
R middle occiptal gyrus 18,144 16 −88 12 6.48L superior temporal sulcus 16,821 −41 −69 14 6.58R hippocampus 5589 16 −32 −3 7.51R lateral fusiform gyrus 4023 45 −43 −26 6.52L hippocampus 3105 −9 −32 −2 5.75R amygdala 2268 22 −7 −15 5.20L lateral fusiform gyrus 1026 −42 −40 −21 5.11L amygdala 945 −3 −1 −15 4.05
Tools > peopleL posterior intraparietal sulcus 10,179 −35 −44 52 5.02L medial fusiform gyrus 8721 −29 −52 −17 8.76R medial fusiform gyrus 3537 32 −61 −10 6.11L middle temporal gyrus 3429 −45 −64 −6 6.11L inferior frontal gyrus 1917 −42 27 20 4.61
1431 −32 38 −8 5.08L parahippocampal gyrus 1647 −35 −24 −23 5.73L precentral gyrus* 270 −58 4 15 2.69
Note: All regions active at q< 0.05, except *q= 0.065.
Cerebral Cortex 5
at National Institutes of H
ealth Library on O
ctober 1, 2012http://cercor.oxfordjournals.org/
Dow
nloaded from
Consistent with the whole-brain analysis, other regions thatshowed a category effect using only the static images failed toshow Group × Category interactions. For example, staticimages of people vs. tools identified a large expanse of theright posterior lateral occipitotemporal cortex that extendedfrom the extrastriate body area (local maxima, x = 46, y =−73,z = 1) to pSTS (local maxima within pSTS, x = 51, y =−55,z =−10), where, in contrast to the lateral fusiform gyrus, bothgroups showed a preference for dynamic social stimuli(people > tools, P < 0.001 for videos in the TD group and inthe ASD group, P < 0.001 for point-light displays in eachgroup) (Fig. 4).
Experiment 2: Behavioral DataAnalysis of the behavioral data from the face–tool localizertask indicated that responses were highly accurate and ator near ceiling for both subject groups (percent accuracy,TD = 99.6%, ASD = 97.2%).
Subjects interpreted the mechanical vignettes more accu-rately than the social vignettes (mechanical vignettes = 82.6%,social vignettes = 75.5%; P < 0.05). In addition, TD subjectswere more accurate than ASD subjects (TD = 86.8%,ASD = 71.3%; P < 0.001). There was also a significant Group ×Vignette Type interaction (F1,31 = 6.30; P < 0.05) reflecting thefact that whereas the TDs interpreted the social and mechan-ical vignettes equally accurately (86.8% for both vignettetypes), ASDs were more accurate with the mechanical(78.3%) than social vignettes (64.2%; P < 0.05). Interpretationof these results is complicated by the fact that the ASD groupfailed to choose an answer much more frequently than theTD group (ASD = 23.8%, TD = 6.6%; P < 0.001). Moreover,whereas failures to respond were equally divided amongvignette types for TD subjects (social vignettes = 6.3%; mech-anical vignettes = 6.9%), the ASD group failed to respond dis-proportionately more often for social (30%) than formechanical vignettes (17.5%; P < 0.05). Analysis of the datacollected outside the scanner approximately 3 months afterthe scanning session suggested that this group difference inaccuracy was largely due to the time constraint imposedduring scanning. Specifically, when the ASD subjects returnedfor testing (n = 10), their accuracy rate was near ceiling(>95%) and equivalent to that of TD individuals who alsoreturned for testing (n = 8) (Fs < 1). Verbal descriptions ofthe vignettes were scored based on measures of intentional-ity, number of pronouns used, and number of phrasesuttered. Separate Group × Vignette Type ANOVAs for eachmeasure indicated that the social vignettes were consistentlydescribed with higher levels of intentionality, more pro-nouns, and longer utterances than mechanical vignettes(P < 0.001 for each measure). Importantly, neither the groupeffects nor interactions were significant for any measure,indicating that the ASD and TD groups produced qualitat-ively similar verbal descriptions for the meaningful vign-ettes (all Fs < 2).
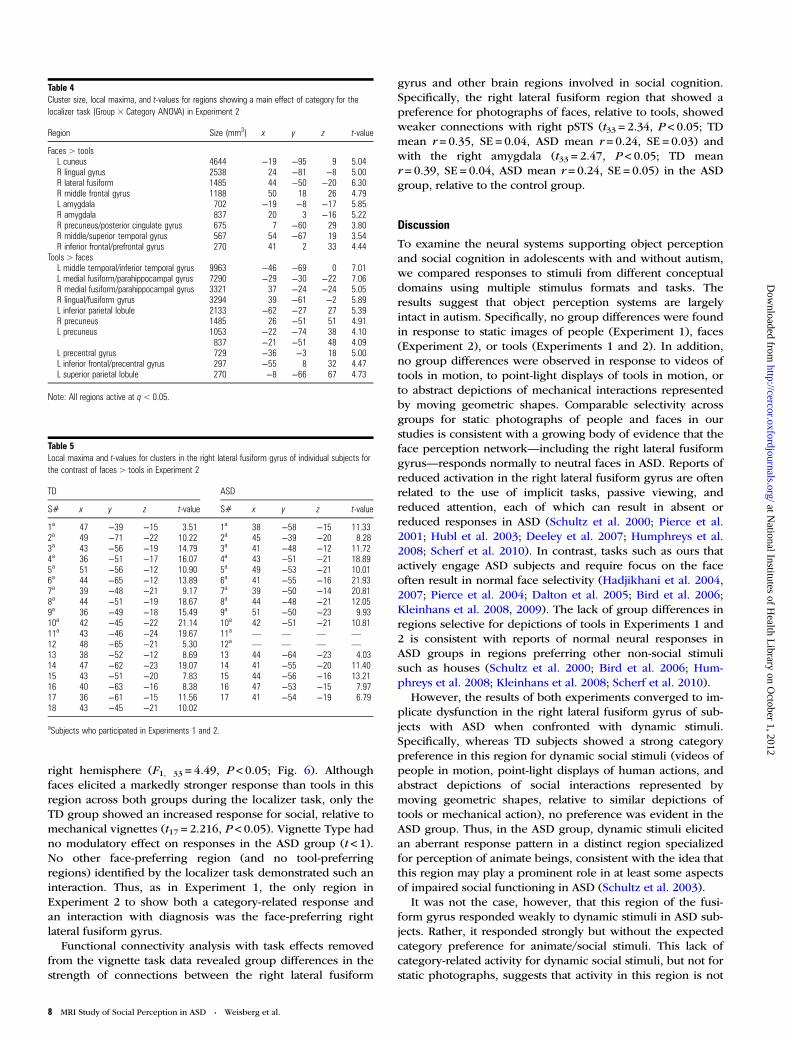
Experiment 2: Imaging DataThe whole brain mixed-effects ANOVA of the functional loca-lizer scans (Group [ASD, TD] × Category [faces, tools]) re-vealed no main effect of group or interaction with group,indicating that when attentively viewing photographs of facesand tools, brain activity in the ASD group was comparable tothat of the TD group. As expected, several regions showed amain effect of Category (F1,33 = 13.17, q < 0.05) (Table 4). Con-sistent with the results of Experiment 1, nearly every ASDsubject (15 of 17) demonstrated enhanced activity for faces,relative to tools, in the lateral part of the right fusiform gyrus(mean peak coordinates [SD], x = 43 [3.81], y =−52 [5.47],z =−18 [3.63]; Fig. 2 and Table 5), and again, peak coordi-nates were highly similar to those of the TD subjects (x = 43[4.62], y =−54 [8.81], z =−18 [3.81]), with no significant differ-ences in the location of the FFA (Group × Coordinate ANOVA,F < 1 for main effect of Group and interaction). Also consistentwith Experiment 1, a network of predominantly right hemi-sphere regions showed heightened responses to faces relative
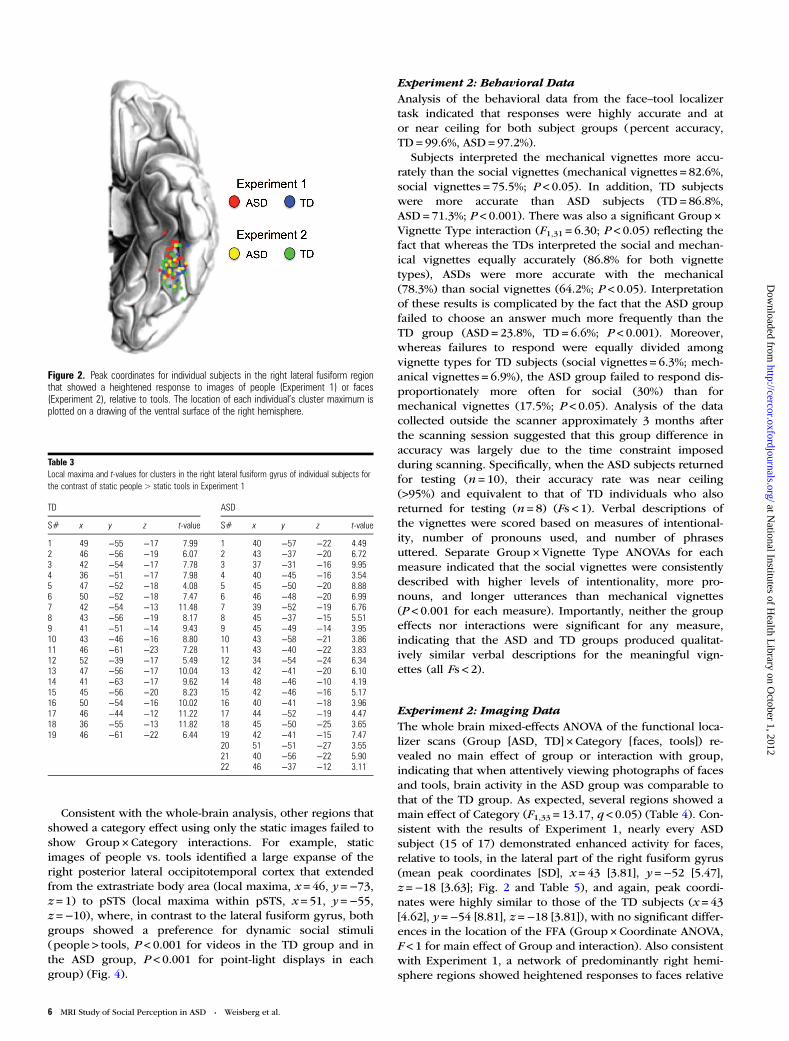
Table 3Local maxima and t-values for clusters in the right lateral fusiform gyrus of individual subjects forthe contrast of static people > static tools in Experiment 1
TD ASD
S# x y z t-value S# x y z t-value
1 49 −55 −17 7.99 1 40 −57 −22 4.492 46 −56 −19 6.07 2 43 −37 −20 6.723 42 −54 −17 7.78 3 37 −31 −16 9.954 36 −51 −17 7.98 4 40 −45 −16 3.545 47 −52 −18 4.08 5 45 −50 −20 8.886 50 −52 −18 7.47 6 46 −48 −20 6.997 42 −54 −13 11.48 7 39 −52 −19 6.768 43 −56 −19 8.17 8 45 −37 −15 5.519 41 −51 −14 9.43 9 45 −49 −14 3.9510 43 −46 −16 8.80 10 43 −58 −21 3.8611 46 −61 −23 7.28 11 43 −40 −22 3.8312 52 −39 −17 5.49 12 34 −54 −24 6.3413 47 −56 −17 10.04 13 42 −41 −20 6.1014 41 −63 −17 9.62 14 48 −46 −10 4.1915 45 −56 −20 8.23 15 42 −46 −16 5.1716 50 −54 −16 10.02 16 40 −41 −18 3.9617 46 −44 −12 11.22 17 44 −52 −19 4.4718 36 −55 −13 11.82 18 45 −50 −25 3.6519 46 −61 −22 6.44 19 42 −41 −15 7.47
20 51 −51 −27 3.5521 40 −56 −22 5.9022 46 −37 −12 3.11
Figure 2. Peak coordinates for individual subjects in the right lateral fusiform regionthat showed a heightened response to images of people (Experiment 1) or faces(Experiment 2), relative to tools. The location of each individual’s cluster maximum isplotted on a drawing of the ventral surface of the right hemisphere.
6 MRI Study of Social Perception in ASD • Weisberg et al.
at National Institutes of H
ealth Library on O
ctober 1, 2012http://cercor.oxfordjournals.org/
Dow
nloaded from
to tools (including the lateral fusiform gyrus, pSTS, and amyg-dala), and a separate, predominantly left hemisphere networkshowed the opposite preference (medial fusiform and para-hippocampal gyrus, inferior frontal gyrus, inferior parietallobule).
We next evaluated responses to the social and mechanicalvignettes within the face-responsive ROIs identified by themain effect of Category in the localizer task. In most regions,
we found a greater response to the social than mechanicalvignettes, including in the right pSTS (Group [TD, ASD] ×Vignette Type [social, mechanical] ANOVA, main effect of Vign-ette Type, F1,33 = 46.52, P < 0.001) and the right amygdala(F1,33 = 3.62, P = 0.066) (Fig. 5). There was no effect of Groupor a Group × Vignette Type interaction in these regions.
However, we did find a significant interaction betweenGroup and Vignette Type in the lateral fusiform gyrus in the
Figure 3. Experiment 1: Responses to video and point-light stimuli in the independently localized lateral region of the right fusiform gyrus. (A) The activation map for the maineffect of Category from the Group × Category ANOVA on static photographs only (people vs. tools, q< 0.05) is superimposed on a template coronal brain slice. Regions in redwere more active for viewing static images of people than static tools and regions in blue showed the opposite preference. The histogram below the coronal slice shows theaverage hemodynamic response to static images of people and tools for each group across all voxels within the right lateral fusiform ROI identified by the static image localizer(circled region). (B) Histogram shows group-averaged hemodynamic responses to dynamic depictions of people and tools within the independently localized right fusiform region.Asterisks indicate a Category effect (P< 0.001) for the dynamic stimuli. Error bars in all figures indicate the standard error of the mean.
Figure 4. Experiment 1: Responses to static, video, and point-light stimuli in the right pSTS. (A) As in Figure 3, the activation map for the main effect of Category (people vs.tools, thresholded at q< 10−4 for display purposes) from the Group × Category ANOVA on static stimuli shows activation in the pSTS (red circle). Increased activation in theright lateral fusiform gyrus for people and in the left medial fusiform region for tools is also visible. Below, the histogram shows the average hemodynamic response to images ofstatic people and tools for each group across voxels within the pSTS region (circled) identified by the static images localizer. (B) Histogram shows group-averaged hemodynamicresponses for each dynamic stimulus format extracted from the right pSTS cluster identified by the static localizer. Asterisks indicate a Category effect for dynamic stimuli(P<0.001).
Cerebral Cortex 7
at National Institutes of H
ealth Library on O
ctober 1, 2012http://cercor.oxfordjournals.org/
Dow
nloaded from
right hemisphere (F1, 33 = 4.49, P < 0.05; Fig. 6). Althoughfaces elicited a markedly stronger response than tools in thisregion across both groups during the localizer task, only theTD group showed an increased response for social, relative tomechanical vignettes (t17 = 2.216, P < 0.05). Vignette Type hadno modulatory effect on responses in the ASD group (t < 1).No other face-preferring region (and no tool-preferringregions) identified by the localizer task demonstrated such aninteraction. Thus, as in Experiment 1, the only region inExperiment 2 to show both a category-related response andan interaction with diagnosis was the face-preferring rightlateral fusiform gyrus.
Functional connectivity analysis with task effects removedfrom the vignette task data revealed group differences in thestrength of connections between the right lateral fusiform
gyrus and other brain regions involved in social cognition.Specifically, the right lateral fusiform region that showed apreference for photographs of faces, relative to tools, showedweaker connections with right pSTS (t33 = 2.34, P < 0.05; TDmean r = 0.35, SE = 0.04, ASD mean r = 0.24, SE = 0.03) andwith the right amygdala (t33 = 2.47, P < 0.05; TD meanr = 0.39, SE = 0.04, ASD mean r = 0.24, SE = 0.05) in the ASDgroup, relative to the control group.
Discussion
To examine the neural systems supporting object perceptionand social cognition in adolescents with and without autism,we compared responses to stimuli from different conceptualdomains using multiple stimulus formats and tasks. Theresults suggest that object perception systems are largelyintact in autism. Specifically, no group differences were foundin response to static images of people (Experiment 1), faces(Experiment 2), or tools (Experiments 1 and 2). In addition,no group differences were observed in response to videos oftools in motion, to point-light displays of tools in motion, orto abstract depictions of mechanical interactions representedby moving geometric shapes. Comparable selectivity acrossgroups for static photographs of people and faces in ourstudies is consistent with a growing body of evidence that theface perception network—including the right lateral fusiformgyrus—responds normally to neutral faces in ASD. Reports ofreduced activation in the right lateral fusiform gyrus are oftenrelated to the use of implicit tasks, passive viewing, andreduced attention, each of which can result in absent orreduced responses in ASD (Schultz et al. 2000; Pierce et al.2001; Hubl et al. 2003; Deeley et al. 2007; Humphreys et al.2008; Scherf et al. 2010). In contrast, tasks such as ours thatactively engage ASD subjects and require focus on the faceoften result in normal face selectivity (Hadjikhani et al. 2004,2007; Pierce et al. 2004; Dalton et al. 2005; Bird et al. 2006;Kleinhans et al. 2008, 2009). The lack of group differences inregions selective for depictions of tools in Experiments 1 and2 is consistent with reports of normal neural responses inASD groups in regions preferring other non-social stimulisuch as houses (Schultz et al. 2000; Bird et al. 2006; Hum-phreys et al. 2008; Kleinhans et al. 2008; Scherf et al. 2010).
However, the results of both experiments converged to im-plicate dysfunction in the right lateral fusiform gyrus of sub-jects with ASD when confronted with dynamic stimuli.Specifically, whereas TD subjects showed a strong categorypreference in this region for dynamic social stimuli (videos ofpeople in motion, point-light displays of human actions, andabstract depictions of social interactions represented bymoving geometric shapes, relative to similar depictions oftools or mechanical action), no preference was evident in theASD group. Thus, in the ASD group, dynamic stimuli elicitedan aberrant response pattern in a distinct region specializedfor perception of animate beings, consistent with the idea thatthis region may play a prominent role in at least some aspectsof impaired social functioning in ASD (Schultz et al. 2003).
It was not the case, however, that this region of the fusi-form gyrus responded weakly to dynamic stimuli in ASD sub-jects. Rather, it responded strongly but without the expectedcategory preference for animate/social stimuli. This lack ofcategory-related activity for dynamic social stimuli, but not forstatic photographs, suggests that activity in this region is not
Table 4Cluster size, local maxima, and t-values for regions showing a main effect of category for thelocalizer task (Group × Category ANOVA) in Experiment 2
Region Size (mm3) x y z t-value
Faces > toolsL cuneus 4644 −19 −95 9 5.04R lingual gyrus 2538 24 −81 −8 5.00R lateral fusiform 1485 44 −50 −20 6.30R middle frontal gyrus 1188 50 18 26 4.79L amygdala 702 −19 −8 −17 5.85R amygdala 837 20 3 −16 5.22R precuneus/posterior cingulate gyrus 675 7 −60 29 3.80R middle/superior temporal gyrus 567 54 −67 19 3.54R inferior frontal/prefrontal gyrus 270 41 2 33 4.44
Tools > facesL middle temporal/inferior temporal gyrus 9963 −46 −69 0 7.01L medial fusiform/parahippocampal gyrus 7290 −29 −30 −22 7.06R medial fusiform/parahippocampal gyrus 3321 37 −24 −24 5.05R lingual/fusiform gyrus 3294 39 −61 −2 5.89L inferior parietal lobule 2133 −62 −27 27 5.39R precuneus 1485 26 −51 51 4.91L precuneus 1053 −22 −74 38 4.10
837 −21 −51 48 4.09L precentral gyrus 729 −36 −3 18 5.00L inferior frontal/precentral gyrus 297 −55 8 32 4.47L superior parietal lobule 270 −8 −66 67 4.73
Note: All regions active at q< 0.05.
Table 5Local maxima and t-values for clusters in the right lateral fusiform gyrus of individual subjects forthe contrast of faces > tools in Experiment 2
TD ASD
S# x y z t-value S# x y z t-value
1a 47 −39 −15 3.51 1a 38 −58 −15 11.332a 49 −71 −22 10.22 2a 45 −39 −20 8.283a 43 −56 −19 14.79 3a 41 −48 −12 11.724a 36 −51 −17 16.07 4a 43 −51 −21 18.895a 51 −56 −12 10.90 5a 49 −53 −21 10.016a 44 −65 −12 13.89 6a 41 −55 −16 21.937a 39 −48 −21 9.17 7a 39 −50 −14 20.818a 44 −51 −19 18.67 8a 44 −48 −21 12.059a 36 −49 −18 15.49 9a 51 −50 −23 9.9310a 42 −45 −22 21.14 10a 42 −51 −21 10.8111a 43 −46 −24 19.67 11a — — — —
12 48 −65 −21 5.30 12a — — — —
13 38 −52 −12 8.69 13 44 −64 −23 4.0314 47 −62 −23 19.07 14 41 −55 −20 11.4015 43 −51 −20 7.83 15 44 −56 −16 13.2116 40 −63 −16 8.38 16 47 −53 −15 7.9717 36 −61 −15 11.56 17 41 −54 −19 6.7918 43 −45 −21 10.02
aSubjects who participated in Experiments 1 and 2.
8 MRI Study of Social Perception in ASD • Weisberg et al.
at National Institutes of H
ealth Library on O
ctober 1, 2012http://cercor.oxfordjournals.org/
Dow
nloaded from
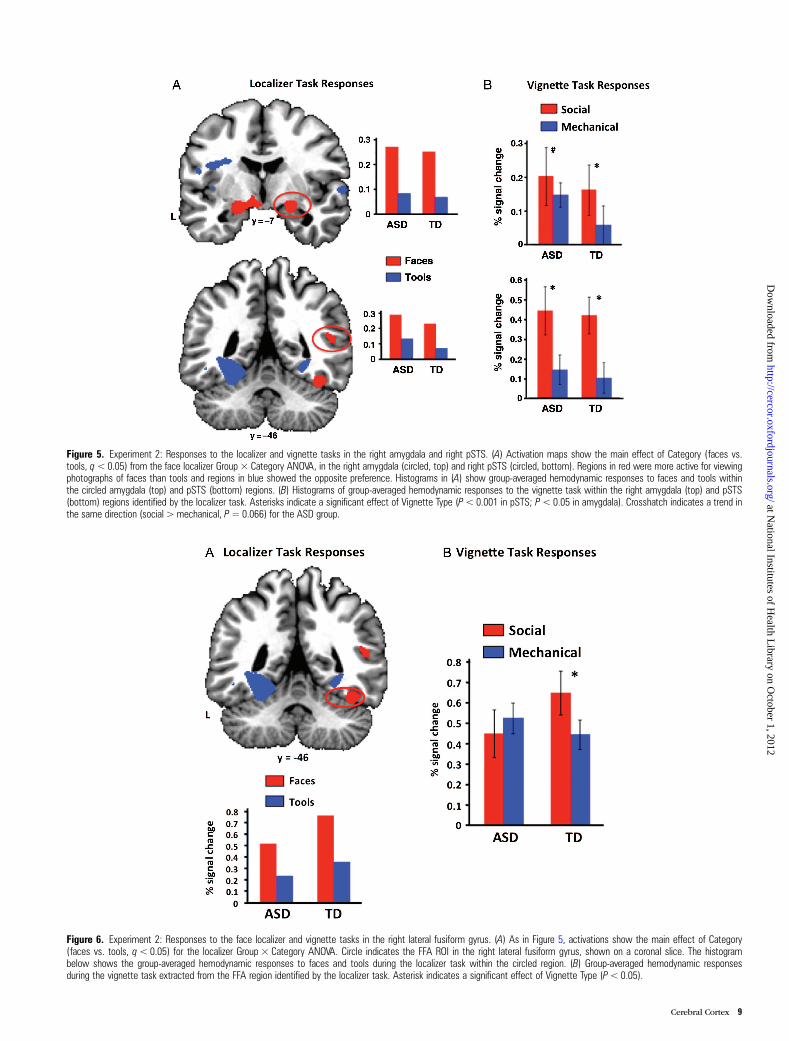
Figure 6. Experiment 2: Responses to the face localizer and vignette tasks in the right lateral fusiform gyrus. (A) As in Figure 5, activations show the main effect of Category(faces vs. tools, q<0.05) for the localizer Group × Category ANOVA. Circle indicates the FFA ROI in the right lateral fusiform gyrus, shown on a coronal slice. The histogrambelow shows the group-averaged hemodynamic responses to faces and tools during the localizer task within the circled region. (B) Group-averaged hemodynamic responsesduring the vignette task extracted from the FFA region identified by the localizer task. Asterisk indicates a significant effect of Vignette Type (P< 0.05).
Figure 5. Experiment 2: Responses to the localizer and vignette tasks in the right amygdala and right pSTS. (A) Activation maps show the main effect of Category (faces vs.tools, q<0.05) from the face localizer Group × Category ANOVA, in the right amygdala (circled, top) and right pSTS (circled, bottom). Regions in red were more active for viewingphotographs of faces than tools and regions in blue showed the opposite preference. Histograms in (A) show group-averaged hemodynamic responses to faces and tools withinthe circled amygdala (top) and pSTS (bottom) regions. (B) Histograms of group-averaged hemodynamic responses to the vignette task within the right amygdala (top) and pSTS(bottom) regions identified by the localizer task. Asterisks indicate a significant effect of Vignette Type (P< 0.001 in pSTS; P< 0.05 in amygdala). Crosshatch indicates a trend inthe same direction (social > mechanical, P= 0.066) for the ASD group.
Cerebral Cortex 9
at National Institutes of H
ealth Library on O
ctober 1, 2012http://cercor.oxfordjournals.org/
Dow
nloaded from
modulated appropriately by one or more other nodes in thesocial network specialized for processing dynamic depictionsof animacy (e.g. pSTS and/or the amygdala; Bonda et al.1996; Grossman et al. 2000; Beauchamp et al. 2002, 2003;Martin and Weisberg 2003; Pelphrey et al. 2003; Schultz 2005;Wheatley et al. 2007; see Blake and Shiffrar 2007; Adolphs2009 for reviews). Consistent with this idea, abnormal selec-tivity for moving animate and social stimuli in the lateralregion of the right fusiform gyrus occurred within the contextof typical response patterns for dynamic stimuli in the rightpSTS and amygdala. This finding, in turn, supports the notionof disrupted connectivity in ASD (see Müller et al. 2011 forrecent review).
Our finding is similar to that reported by Kana et al.(2009), who found no dysfunction in pSTS or amygdala whensubjects with autism made social inferences to moving geo-metric shapes (though they did find a difference, relative toTDs, in a more anterior part of STS). Also consistent with ourfindings is a recent report of abnormal responses in the lateralregion of the fusiform gyrus to video clips of naturalisticscenes containing dynamic faces, coupled with no groupdifferences in pSTS when ASDs and TDs were compared(Scherf et al. 2010).
Several studies have reported aberrant eye movement pat-terns in ASD to social/animate stimuli, although others havenot (see Boraston and Blakemore 2007 for review). Is this apossible explanation for the lack of a category preference fordynamic social stimuli within the fusiform gyrus? The speci-ficity of our findings within the FFA (normal selectivity forstatic, but not for dynamic, social stimuli, coupled withnormal selectivity for both static and dynamic stimuli in allother parts of the social cognition network) strongly mitigatesthis possibility. Even if gaze patterns differed between groupsonly for dynamic, but not for static stimuli, one would expectthose gaze patterns to affect responses in other social brainregions, such as the amygdala and pSTS, as well as in ocularmotor control regions, such as the frontal and supplementaryeye fields. However, our groups did not differentially activateany of these areas, including the area most strongly associatedwith viewing biological motion (i.e. the posterior region ofthe STS). In addition, although aberrant eye gaze patternshave been reported in ASD when stimuli depict complexsocial situations involving multiple characters (Klin et al.2002; Speer et al. 2007; Norbury et al. 2009; Riby andHancock 2009; von Hofsten et al. 2009), no group differencesin gaze patterns were found when dynamic, but isolated,characters were depicted (as in our Experiment 1; Speer et al.2007), or for moving shapes (as in our Experiment 2; vonHofsten et al. 2009). Thus, the available evidence suggeststhat differences in eye gaze patterns are unlikely to accountfor our findings.
Taken together, the patterns of category-related activity de-tected in our ASD subjects suggest that there are abnormalconnections between the region of the ventral temporalcortex associated with identifying social stimuli and areas intemporal cortex associated with biological motion processing(and possibly other regions integral to social cognition). Ourconnectivity analysis supported this possibility, revealing that,after regressing out the effects of task, activity in the rightlateral fusiform region was more weakly correlated withactivity in the right pSTS and the right amygdala in the ASDgroup, compared with the TD group. This is consistent with
reports of a significantly reduced correlation between thepSTS and the extrastriate cortex in individuals with ASDduring rest, suggesting reduced synchronization of neuralactivity between these regions (Lai et al. 2010; Paakki et al.2010). Our findings are also consistent with studies reportingreduced correlations of slow fluctuating neural activitybetween the fusiform gyrus and the amygdala (Kleinhanset al. 2008; Dziobek et al. 2010; Lai et al. 2010), and thefinding that fractional anisotropy in the right fusiform gyrusand pSTS was correlated with social and communication diag-nostic scores in autism (Cheung et al. 2009).
Our results contribute to a growing body of evidence thatface perception per se is intact in high-functioning individualswith autism and suggest that other regions common to faceand body perception and social cognition systems fail to influ-ence responses in the fusiform gyrus, resulting in reduced cat-egory selectivity for complex, dynamic, and more abstractstimuli. In two experiments that used multiple static anddynamic stimulus formats, viewing static photographs ofpeople, faces, and tools led to category-related responses inthe lateral region of the fusiform gyrus and FFA of subjectswith autism that were largely indistinguishable from those ofTD individuals with regard to location, overall response mag-nitude, and category effect. However, in the group withautism, activity in this region failed to distinguish social fromnon-social stimuli depicted in videos, point-light displays, andvignettes of moving geometric shapes as it did in the TDgroup. Category preferences for these stimuli did persist inother regions of the social cognition network, such as pSTSand the amygdala, where dynamic stimuli elicited heightenedresponses to social, compared with non-social objects in ASD.Dysfunctional connections such as those identified here mayprevent these structures from modulating responses in thelateral region of the fusiform gyrus and FFA, perhaps result-ing in impaired spontaneous social inferences (Senju et al.2009). Disrupted connectivity can account for many facets ofautism, not the least of which is the heterogeneity of the dis-order itself. Poor communication between the pSTS, amygda-la, and fusiform gyrus would likely cause the dysfunctionalresponse pattern we observed, though irregular contact withprefrontal regions may conspire as well (Castelli et al. 2002;Bookheimer et al. 2008; Koshino et al. 2008; Jones et al.2010). Further studies in carefully characterized subjectgroups are required to elucidate the precise nature of dis-rupted connectivity and how connections within and betweendifferent regions vary throughout development (see Gottset al. 2012 for an unbiased, whole-brain analysis of functionalconnectivity in ASD).
Funding
This research was supported by the National Institute ofMental Health, Division of Intramural Research.
NotesWe thank Rachel Caravella, Jennifer Silvers, Laura Case, Laura Dolan,and Madeline Harms for their help with data collection and analysis,and most importantly, all of the participants and their families. Con-flict of Interest: None declared.
10 MRI Study of Social Perception in ASD • Weisberg et al.
at National Institutes of H
ealth Library on O
ctober 1, 2012http://cercor.oxfordjournals.org/
Dow
nloaded from
ReferencesAbell F, Happe F, Frith U. 2000. Do triangles play tricks? Attribution
of mental states to animated shapes in normal and abnormal de-velopment. Cogn Dev. 15:1–16.
Adolphs R. 2009. The social brain: Neural basis of social knowledge.Annu Rev Psychol. 60:693–716.
American Psychiatric Association. Task Force on DSM-IV. 2000. Diag-nostic and statistical manual of mental disorders DSM-IV-TR. 4thed. Washington (DC): American Psychiatric Association. p. 1 elec-tronic resource (xxxvii, 943 p.).
Beauchamp MS, Lee KE, Haxby JV, Martin A. 2003. fMRI responses tovideo and point-light displays of moving humans and manipulableobjects. J Cogn Neurosci. 15:991–1001.
Beauchamp MS, Lee KE, Haxby JV, Martin A. 2002. Parallel visualmotion processing streams for manipulable objects and humanmovements. Neuron. 34:149–159.
Bird G, Catmur C, Silani G, Frith C, Frith U. 2006. Attention does notmodulate neural responses to social stimuli in autism spectrumdisorders. Neuroimage. 31:1614–1624.
Blake R, Shiffrar M. 2007. Perception of human motion. Annu RevPsychol. 58:47–73.
Blake R, Turner LM, Smoski MJ, Pozdol SL, Stone WL. 2003. Visualrecognition of biological motion is impaired in children withautism. Psychol Sci. 14:151–157.
Blakemore SJ. 2008. The social brain in adolescence. Nat Rev Neuro-sci. 9:267–277.
Bonda E, Petrides M, Ostry D, Evans A. 1996. Specific involvement ofhuman parietal systems and the amygdala in the perception of bio-logical motion. J Neurosci. 16:3737–3744.
Bookheimer SY, Wang AT, Scott A, Sigman M, Dapretto M. 2008.Frontal contributions to face processing differences in autism: Evi-dence from fMRI of inverted face processing. J Int NeuropsycholSoc. 14:922–932.
Boraston Z, Blakemore SJ. 2007. The application of eye-tracking tech-nology in the study of autism. J Physiol. 581(3):893–898.
Campbell R, Lawrence K, Mandy W, Mitra C, Jeyakuma L, Skuse D.2006. Meanings in motion and faces: Developmental associationsbetween the processing of intention from geometrical animationsand gaze detection accuracy. Dev Psychopathol. 18:99–118.
Castelli F, Frith C, Happe F, Frith U. 2002. Autism, Asperger syndromeand brain mechanisms for the attribution of mental states to ani-mated shapes. Brain. 125:1839–1849.
Castelli F, Happe F, Frith U, Frith C. 2000. Movement and mind:A functional imaging study of perception and interpretationof complex intentional movement patterns. Neuroimage. 12:314–325.
Cheung C, Chua SE, Cheung V, Khong PL, Tai KS, Wong TKW, Ho TP,McAlonan GM. 2009. White matter fractional anisotropy differ-ences and correlates of diagnostic symptoms in autism. J ChildPsychol Psychiatry. 50:1102–1112.
Clarke TJ, Bradshaw MF, Field DT, Hampson SE, Rose D. 2005. Theperception of emotion from body movement in point-light dis-plays of interpersonal dialogue. Perception. 34:1171–1180.
Congiu S, Schlottmann A, Ray E. 2010. Unimpaired perception ofsocial and physical causality, but impaired perception of animacyin high functioning children with autism. J Autism Dev Disord.40:39–53.
Cox RW. 1996. AFNI: Software for analysis and visualization of func-tional magnetic resonance neuroimages. Comput Biomed Res.29:162–173.
Cutting JE, Kozlowski LT. 1977. Recognizing friends by their walk—gait perception without familiarity cues. Bull Psychon Soc.9:353–356.
Dalton KM, Nacewicz BM, Johnstone T, Schaefer HS, GernsbacherMA, Goldsmith HH, Alexander AL, Davidson RJ. 2005. Gaze fix-ation and the neural circuitry of face processing in autism. NatNeurosci. 8:519–526.
Deeley Q, Daly EM, Surguladze S, Page L, Toal F, Robertson D et al.2007. An event related functional magnetic resonance imagingstudy of facial emotion processing in Asperger syndrome. BiolPsychiatry. 62:207–217.
Dittrich WH, Troscianko T, Lea SEG, Morgan D. 1996. Perception ofemotion from dynamic point-light displays represented in dance.Perception. 25:727–738.
Dziobek I, Bahnemann M, Convit A, Heekeren HR. 2010. The role ofthe fusiform-amygdala system in the pathophysiology of autism.Arch Gen Psychiatry. 67:397–405.
Evans AC, Marrett S, Neelin P, Collins I, Worsley K, Dai W, Milot S,Meyer E, Bub D. 1992. Anatomical mapping of functional acti-vation in stereotactic space. Neuroimage. 1:43–53.
Fox MD, Snyder AZ, Vincent JL, Corbetta M, Van Essen DC, RaichleME. 2005. The human brain is intrinsically organized intodynamic, anticorrelated functional networks. Proc Natl Acad SciUSA. 102:9673–9678.
Frith U, Frith C. 2010. The social brain: Allowing humans to boldly gowhere no other species has been. Philos Trans R Soc B Biol Sci.365:165–175.
Gotts SJ, Simmons WK, Milbury LA, Wallace GL, Cox R, Martin A.2012. Fractionation of social brain circuits in autism spectrum dis-orders. Brain. doi:10.1093/brain/AWS160.
Grossman E, Donnelly M, Price R, Pickens D, Morgan V, Neighbor G,Blake R. 2000. Brain areas involved in perception of biologicalmotion. J Cogn Neurosci. 12:711–720.
Hadjikhani N, Chabris CF, Joseph RM, Clark J, McGrath L, Aharon I,Feczko E, Tager-Flusberg H, Harris GJ. 2004. Early visual cortexorganization in autism: An fMRI study. Neuroreport. 15:267–270.
Hadjikhani N, Joseph RM, Snyder J, Tager-Flusberg H. 2007. Abnor-mal activation of the social brain during face perception in autism.Hum Brain Mapp. 28:441–449.
Heider F, Simmel M. 1944. An experimental study of apparent behav-ior. Am J Psychol. 57:243–259.
Hubl D, Bolte S, Feineis-Matthews S, Lanfermann H, Federspiel A,Strik W, Poustka F, Dierks T. 2003. Functional imbalance of visualpathways indicates alternative face processing strategies in autism.Neurology. 61:1232–1237.
Humphreys K, Hasson U, Avidan G, Minshew N, Behrmann M. 2008.Cortical patterns of category-selective activation for faces, placesand objects in adults with autism. Autism Res. 1:52–63.
Jo HJ, Saad ZS, Simmons WK, Milbury LA, Cox RW. 2010. Mappingsources of correlation in resting state FMRI, with artifact detectionand removal. Neuroimage. 52:571–582.
Jones TB, Bandettini PA, Kenworthy L, Case LK, Milleville SC, MartinA, Birn RM. 2010. Sources of group differences in functional con-nectivity: An investigation applied to autism spectrum disorder.Neuroimage. 49:401–414.
Kana RK, Keller TA, Cherkassky VL, Minshew NJ, Just MA. 2009. Aty-pical frontal-posterior synchronization of Theory of Mind regionsin autism during mental state attribution. Soc Neurosci. 4:135–152.
Kanwisher N, McDermott J, Chun MM. 1997. The fusiform face area:A module in human extrastriate cortex specialized for face percep-tion. J Neurosci. 17:4302–4311.
Kleinhans NM, Johnson LC, Richards T, Mahurin R, Greenson J,Dawson G, Aylward E. 2009. Reduced neural habituation in theamygdala and social impairments in autism spectrum disorders.Am J Psychiatry. 166:467–475.
Kleinhans NM, Richards T, Sterling L, Stegbauer KC, Mahurin R,Johnson LC, Greenson J, Dawson G, Aylward E. 2008. Abnormalfunctional connectivity in autism spectrum disorders during faceprocessing. Brain. 131:1000–1012.
Klin A. 2000. Attributing social meaning to ambiguous visual stimuliin higher-functioning autism and Asperger syndrome: The socialattribution task. J Child Psychol Psychiatry. 41:831–846.
Klin A, Jones W. 2006. Attributing social and physical meaning to am-biguous visual displays in individuals with higher-functioningautism spectrum disorders. Brain Cogn. 61:40–53.
Klin A, Jones W, Schutz R, Volkmar F, Cohen D. 2002. Visual fixationpatterns during viewing of naturalistic social situations as predic-tors of social competence in individuals with autism. Arch GenPsychiatry. 59:809–816.
Klin A, Lin DJ, Gorrindo P, Ramsay G, Jones W. 2009. Two-year-oldswith autism orient to non-social contingencies rather than biologi-cal motion. Nature. 459:257–261.
Cerebral Cortex 11
at National Institutes of H
ealth Library on O
ctober 1, 2012http://cercor.oxfordjournals.org/
Dow
nloaded from
Koldewyn K, Whitney D, Rivera SM. 2010. The psychophysics ofvisual motion and global form processing in autism. Brain.133:599–610.
Koshino H, Kana RK, Keller TA, Cherkassky VL, Minshew NJ, JustMA. 2008. FMRI investigation of working memory for faces inautism: Visual coding and underconnectivity with frontal areas.Cereb Cortex. 18:289–300.
Kozlowski LT, Cutting JE. 1977. Recognizing sex of a walker from adynamic point-light display. Percept Psychophys. 21:575–580.
Lai MC, Lombardo MV, Chakrabarti B, Sadek SA, Pasco G, Wheel-wright SJ, Bullmore ET, Baron-Cohen S, MRC AIMS Consortium,Suckling J. 2010. A shift to randomness of brain oscillations inpeople with autism. Biol Psychiatry. 68:1092–1099.
Lainhart JE, Bigler ED, Bocian M, Coon H, Dinh E, Dawson G et al.2006. Head circumference and height in autism: A study by theCollaborative Program of Excellence in Autism. Am J Med GenetA. 140A:2257–2274.
Laird AR, Robinson JL, McMillan KM, Tordesillas-Gutierrez D, MoranST, Gonzales SM, Ray KL, Franklin C, Glahn DC, Fox PT et al.2010. Comparison of the disparity between Talairach and MNI co-ordinates in functional neuroimaging data: Validation of the Lan-caster transform. Neuroimage. 51:677–683.
Lancaster JL, Tordesillas-Gutierrez D, Martinez M, Salinas F, Evans A,Zilles K, Mazziotta JC, Fox PT. 2007. Bias between MNI and Talair-ach coordinates analyzed using the ICBM-152 brain template.Hum Brain Mapp. 28:1194–1205.
Lecouteur A, Rutter M, Lord C, Rios P, Robertson S, Holdgrafer M,McLennan J. 1989. Autism diagnostic interview—A standardizedinvestigator-based instrument. J Autism Dev Disord. 19:363–387.
Lord C, Risi S, Lambrecht L, Cook EH, Leventhal BL, DiLavore PC,Pickles A, Rutter M. 2000. The autism diagnostic observationschedule-generic: A standard measure of social and communi-cation deficits associated with the spectrum of autism. J AutismDev Disord. 30:205–223.
Lord C, Rutter M, Lecouteur A. 1994. Autism diagnosticinterview-revised—A revised version of a diagnostic interview forcaregivers of individuals with possible pervasive developmentaldisorders. J Autism Dev Disord. 24:659–685.
Martin A. 2009. Circuits in mind: the neural foundations for objectconcepts. In: Gazzaniga M, ed. The cognitive neurosciences. 4thed. Boston: MIT Press. p. 1031–1045.
Martin A, Weisberg J. 2003. Neural foundations for understandingsocial and mechanical concepts. Cogn Neuropsychol. 20:575–587.
Mather G, Murdoch L. 1994. Gender discrimination in biologicalmotion displays based on dynamic cues. Proc R Soc Lond B.258:273–279.
Müller R, Shih P, Keehn B, Deyoe J, Leyden K, Shukla D. 2011.Underconnected, but how? A survey of functional connectivityMRI studies in autism spectrum disorders. Cereb Cortex.21:2233–2243.
Norbury CF, Brock J, Cragg L, Einav S, Griffiths H, Nation K. 2009.Eye-movement patterns are associated with communicative com-petence in autistic spectrum disorders. J Child Psychol Psychiatry.50(7):834–842.
Paakki JJ, Rahko J, Long XY, Moilanen I, Tervonen O, Nikkinen J,Starck T, Remes J, Hurtig T, Haapsamo H et al. 2010. Alterationsin regional homogeneity of resting-state brain activity in autismspectrum disorders. Brain Res. 1321:169–179.
Peelen MV, Downing PE. 2005. Selectivity for the human body in thefusiform gyrus. J Neurophysiol. 93:603–608.
Pelphrey KA, Mitchell TV, McKeown MJ, Goldstein J, Allison T,McCarthy G. 2003. Brain activity evoked by the perception ofhuman walking: Controlling for meaningful coherent motion. JNeurosci. 23:6819–6825.
Pierce K, Conant D, Hazin R, Stoner R, Desmond J. 2011. Preferencefor geometric patterns early in life as a risk factor for autism. ArchGen Psychiatry. 68:101–109.
Pierce K, Haist F, Sedaghat F, Courchesne E. 2004. The brain responseto personally familiar faces in autism: Findings of fusiform activityand beyond. Brain. 127:2703–2716.
Pierce K, Muller RA, Ambrose J, Allen G, Courchesne E. 2001. Faceprocessing occurs outside the fusiform “face area” in autism: Evi-dence from functional MRI. Brain. 124:2059–2073.
Pollick FE, Paterson HM, Bruderlin A, Sanford AJ. 2001. Perceivingaffect from arm movement. Cognition. 82:B51–B61.
Power JD, Barnes KA, Snyder AB, Schlaggar BL, Petersen SE. 2012.Spurious but systematic correlations in functional connectivityMRI networks arise from subject motion. Neuroimage. 59:2142–2154.
Riby D, Hancock PJB. 2009. Looking at movies and cartoons: Eye-tracking evidence from Williams syndrome and autism. J IntellectDisabil Res. 53(2):169–181.
Rutherford MD, Pennington BF, Rogers SJ. 2006. The perception ofanimacy in young children with autism. J Autism Dev Disord. 36:983–992.
Salter G, Seigal A, Claxton M, Lawrence K, Skuse D. 2008. Can autisticchildren read the mind of an animated triangle? Autism. 12:349–371.
Scherf KS, Luna B, Minshew N, Behrmann M. 2010. Location,location, location: Alterations in the functional topography of face-but not object- or place-related cortex in adolescents with autism.Front Hum Neurosci. 4:1–16.
Schultz RT. 2005. Developmental deficits in social perception inautism: The role of the amygdala and fusiform face area. Int J DevNeurosci. 23:125–141.
Schultz RT, Gauthier I, Klin A, Fulbright RK, Anderson AW, VolkmarF, Skudlarski P, Lacadie C, Cohen DJ, Gore JC. 2000. Abnormalventral temporal cortical activity during face discrimination amongindividuals with autism and Asperger syndrome. Arch Gen Psy-chiatry. 57:331–340.
Schultz RT, Grelotti DJ, Klin A, Kleinman J, Van der Gaag C, Marois R,Skudlarski P. 2003. The role of the fusiform face area in socialcognition: Implications for the pathobiology of autism. PhilosTrans R Soc Lond B Biol Sci. 358:415–427.
Schwarzlose RF, Baker CI, Kanwisher N. 2005. Separate face and bodyselectivity on the fusiform gyrus. J Neurosci. 25:11055–11059.
Senju A, Southgate V, White S, Frith U. 2009. Mindblind eyes: Anabsence of spontaneous theory of mind in Asperger syndrome.Science. 325:883–885.
Speer LL, Cook AE, McMahon WM, Clark E. 2007. Face processing inchildren with autism: Effects of stimulus contents and type.Autism. 11:265–277.
Sumi S. 2000. Perception of point-light walker produced by eight lightsattached to the back of the walker. Swiss J Psychol. 59:126–132.
Talairach J, Tournoux P. 1988. Co-planar stereotaxic atlas of thehuman brain. New York: Thieme Medical Publishers.
Troje NF. 2002. Decomposing biological motion: A framework foranalysis and synthesis of human gait patterns. J Vis. 2:371–387.
Van Dijk KRA, Sabuncu MR, Buckner RL. 2012. The influence of headmotion on intrinsic functional connectivity MRI. Neuroimage.59:431–438.
von Hofsten C, Uhlig H, Adell M, Kochukhova O. 2009. How childrenwith autism look at events. Res Autism Spectr Disord. 2:556–569.
Walk RD, Homan CP. 1984. Emotion and dance in dynamic light dis-plays. Bull Psychon Soc. 22:437–440.
Wheatley T, Milleville SC, Martin A. 2007. Understanding animateagents—distinct roles for the social network and mirror system.Psychol Sci. 18:469–474.
12 MRI Study of Social Perception in ASD • Weisberg et al.
at National Institutes of H
ealth Library on O
ctober 1, 2012http://cercor.oxfordjournals.org/
Dow
nloaded from